oil and natural gas sector hydraulically fractured … · oil and natural gas sector hydraulically...
TRANSCRIPT

Oil and Natural Gas Sector Hydraulically Fractured Oil Well
Completions and Associated Gas during Ongoing Production
Report for Oil and Natural Gas Sector Oil Well Completions and Associated Gas during Ongoing Production
Review Panel
April 2014
Prepared by
U.S. EPA Office of Air Quality Planning and Standards (OAQPS)
This information is distributed solely for the purpose of pre-dissemination peer review under applicable information quality guidelines. It has not been formally disseminated by the EPA . I t does not represent
and should not be construed to represent any Agency determination or policy.

ii

iii
Table of Contents
PREFACE ........................................................................................................................................................ 1
1.0 INTRODUCTION ............................................................................................................................ 2
2.0 DEFINITION OF THE SOURCE .................................................................................................... 3
2.1 Oil Well Completions ................................................................................................................... 3
2.2 Associated Gas .............................................................................................................................. 5
3.0 EMISSIONS DATA AND EMISSIONS ESTIMATES HYDRAULICALLY FRACTURED OIL WELL COMPLETIONS ....................................................................................................................... 5
3.1 Summary of Major Studies and Sources of Emissions Data ......................................................... 7
3.2 Fort Berthold Federal Implementation Plan (FIP) Analysis by EC/R (U.S. EPA) 2012a) ........ 8
3.3 ERG Inc. and EC/R Analyses of HPDI Data .............................................................................. 12
3.4 Environmental Defense Fund and Stratus Consulting Analysis of Oil Well Completions (EDF, 2014) 15
3.5 Measurements of Methane Emissions at Natural Gas Production Sites in the United States (UT Study) (Allen et al., 2013) ....................................................................................................................... 17
3.6 Methane Leaks from North American Natural Gas Systems (Brandt et. al, 2014a and 2014b) . 18
4.0 EMISSIONS DATA AND EMISSIONS ESTIMATES ASSOCIATED GAS FROM HYDRAULICALLY FRACTURED OIL WELLS .................................................................................... 20
4.1 Greenhouse Gas Reporting Program (U.S. EPA, 2013) ............................................................. 21
4.2 FLARING UP: North Dakota Natural Gas Flaring More Than Doubles in Two Years (Flaring Up) (CERES, 2013) ................................................................................................................................ 22
5.0 AVAILABLE EMISSION MITIGATION TECHNIQUES ........................................................... 23
5.1 Reduced Emission Completions (REC) ...................................................................................... 23
5.1.1 Description .............................................................................................................................. 23
5.1.2 Effectiveness ........................................................................................................................... 25
5.2 Completion Combustion Devices ............................................................................................... 27
5.2.1 Description .............................................................................................................................. 27
5.2.2 Effectiveness ........................................................................................................................... 27
5.3 Emerging Control Technologies for Control of Associated Gas ................................................ 30
5.3.1 Natural Gas Liquids (NGL) Recovery .................................................................................... 30
5.3.2 Natural Gas Reinjection .......................................................................................................... 35
6.0 SUMMARY .................................................................................................................................... 43

iv
7.0 CHARGE QUESTIONS FOR REVIEWERS ................................................................................ 45
8.0 REFERENCES ............................................................................................................................... 48
Appendix A .................................................................................................................................................... 1

1
PREFACE
On March 28, 2014 the Obama Administration released a key element called for in the
summarizes the sources of methane emissions, commits to new steps to cut emissions of this
these emissions. The strategy builds on progress to date and takes steps to further cut methane
emissions from several sectors, including the oil and natural gas sector.
This technical white paper is one of those steps. The paper, along with four others,
focuses on potentially significant sources of methane and volatile organic compounds (VOCs) in
the oil and gas sector, covering emissions and mitigation techniques for both pollutants. The
Agency is seeking input from independent experts, along with data and technical information
from the public. The EPA will use these technical documents to solidify our understanding of
these potentially significant sources, which will allow us to fully evaluate the range of options
for cost-effectively cutting VOC and methane waste and emissions.
The white papers are available at:
www.epa.gov/airquality/oilandgas/whitepapers.html
2
1.0 IN T R O DU C T I O N
The oil and natural gas exploration and production industry in the U.S. is highly dynamic
and growing rapidly. Consequently, the number of wells in service and the potential for greater
air emissions from oil and natural gas sources is also growing. There were an estimated 504,000
producing gas wells in the U.S. in 2011 (U.S. EIA, 2012a), and an estimated 536,000 producing
oil wells in the U.S. in 2011 (U.S. EIA, 2012b). It is anticipated that the number of gas and oil
wells will continue to increase substantially in the future because of the continued and expanding
use of horizontal drilling combined with hydraulic fracturing (referred to here as simply
hydraulic fracturing) which allows for drilling in formerly inaccessible formations.
Due to the growth of this sector and the potential for increased air emissions, it is
important that the U.S. Environmental Protection Agency (EPA) obtain a clear and accurate
understanding of emerging data on air emissions and available mitigation options. This paper
air emissions and available control technologies from a
potentially significant source of emissions in the oil and natural gas sector.
Oil and gas production from unconventional formations such as shale deposits or plays
has grown rapidly over the last decade. Oil and natural gas production is projected to steadily
increase over the next two decades. Specifically, natural gas development is expected to increase
by 44% from 2011 through 2040 (U.S. EIA, 2013b) and crude oil and natural gas liquids (NGL)
are projected to increase by approximately 25% through 2019 (U.S. EIA, 2013b). The projected
growth of natural gas production is primarily led by the increased development of shale gas, tight
gas, and coalbed methane resources utilizing new production technology and techniques such as
horizontal drilling and hydraulic fracturing. According to the U.S. Energy Information
Administration (EIA), over half of new oil wells drilled co-produce natural gas (U.S. EIA,
2013a). Based on this increased oil and gas development, and the fact that half of new oil wells
co-produce natural gas, the potential exists for increased air emissions from these operations.
One of the activities identified as a potential source of emissions to the atmosphere
during oil development is hydraulically fractured oil well completions. Completion operations

3
are conducted to either bring a new oil well into the production phase, or to maintain or increase
production capability.
completions associated with refracturing of existing wells, this paper will use the term
ctured wells and refractured wells. In addition, hydraulically
fractured coproducing oil wells can generate emissions of associated gas during the production
phase. These processes and emissions are described in detail in Section 2.
The purpose of this paper
emissions from hydraulically fractured oil well completions and associated gas during ongoing
production techniques (practices and
equipment) available to reduce these emissions, including the efficacy and cost of the
technologies and the prevalence of use in the industry.
2.0 D E F INI T I O N O F T H E SO UR C E
2.1 O il W ell Completions
For the purposes of this paper, a well completion is defined to mean:
The process that allows for the flowback of petroleum or natural gas from newly drilled
wells to expel drilling and reservoir fluids and tests the reservoir flow characteristics,
which may vent produced hydrocarbons to the atmosphere via an open pit or tank.
Completion operations with hydraulic fracturing are conducted to either bring a new oil
well into the production phase or to maintain or increase production capability
(sometimes referred to as a recompletion). Well completions with hydraulic fracturing include
multiple steps after the well bore hole has reached the target depth. These steps include inserting
and cementing-in well casing, perforating the casing at one or more producing horizons, and
often hydraulically fracturing one or more zones in the reservoir to stimulate production. Surface
components, including wellheads, pumps, dehydrators, separators, tanks, and are installed as
necessary for production to begin.
4
For the purposes of this paper, hydraulic fracturing is defined to mean:
The process of directing pressurized fluids containing any combination of water,
proppant, and any added chemicals to penetrate tight formations, such as shale or coal
formations, that subsequently require high rate, extended flowback to expel fracture
fluids and solids during completions.
Hydraulic fracturing is one technique for improving oil and gas production where the
reservoir rock is fractured with very high pressure fluid, typically a water emulsion with a
proppant (generally sand) that props open the fractures after fluid pressure is reduced.
Oil well completions with hydraulic fracturing can result in VOC and methane emissions,
which occur when gas is vented to the atmosphere during flowback. The emissions are a result of
the backflow1 of the fracture fluids and reservoir gas at high volume and velocity necessary to
lift excess proppant and fluids to the surface. This comingled fluid stream (containing produced
oil, natural gas and water) flows from each drilled well to a respective vertical separator and
heater/treater processing unit. Fluid may be heated to aid in separation of the oil and natural gas
and produced water. Phase separation is the process of removing impurities from the
hydrocarbon liquids and gas to meet sales delivery specifications for the oil and natural gas. Oil
may go directly to a pipeline or be stored onsite for future transfer to a refinery. If infrastructure
is present, produced gas can be metered to a sales pipeline. If infrastructure is not available, the
produced gas is frequently sent to combustion devices for destruction (e.g., flares) or is vented to
the atmosphere.
Recompletions are conducted to minimize the decline in production, to maintain
production, or in some cases to increase production. When oil well recompletions using
hydraulic fracturing are performed, the practice and sources of emissions are essentially the same
as for new well completions involving hydraulic fracturing, except that surface gas collection 1 Backflow is the phenomena created by pressure differences between zones in the borehole. If the wellbore pressure rises above the average pressure in any zone, backflow will occur (i.e., fluids will move back towards the borehole). In contrast in the industry to refer to the process of allowing fluids to flow from the well following a treatment, either in preparation for a subsequent phase of treatment or in preparation for cleanup and returning the well to production.( http://www.glossary.oilfield.slb.com/)

5
equipment may already be present at the wellhead after the initial fracture. However, the
backflow velocity during refracturing will typically be too high for the normal wellhead
equipment (separator, dehydrator, lease meter), while the production separator is not typically
designed for separating sand.
2.2 Associated Gas
Associated gas is the term typically used for natural gas produced as a by-product of the
production of crude oil. Industry publications typically refer to associated gas as gas that is co-
produced with crude oil while the well is in the production phase and is vented directly to the
atmosphere or is flared. One published aseous hydrocarbons
occurring as a free-gas phase under original oil-reservoir conditions of temperature and pressure
(also known as gas-cap gas). 2 Therefore, associated gas can include gas that is produced during
flowback associated with completion activities and gas that is emitted from equipment as part of
normal operations, such as natural gas driven pneumatic controllers and storage vessels.
However, in this paper, the term emissions :
Associated gas emissions from the production phase (i.e., excluding completion events
and emissions from normal equipment operations) that could be captured and sold rather
than being flared or vented to the atmosphere if the necessary pipeline and other
infrastructure were available to take the gas to market.
3.0 E M ISSI O NS D A T A A ND E M ISSI O NS EST I M A T ES
H Y DR A U L I C A L L Y F R A C T UR E D O I L W E L L C O MPL E T I O NS
For consistency in the review of the various data sources and studies and to better understand
the data discussions presented below, this section presents an overview of the types of the
emissions estimation processes and the data that have been used in a number of studies to
estimate VOC and methane emissions from hydraulically fractured oil well completions and
recompletions.
2 McGraw-Hill Dictionary of Scientific & Technical Terms, 6E, Copyright © 2003 by the McGraw-Hill Companies, Inc.

6
1) For estimating source emissions:
Gas produced during completions of oil wells. Estimated. This type of data would
provide natural gas or methane production volumes for a completion. The data may be
estimated using well characteristics (e.g., flow rate, casing diameter, and casing pressure)
and established emission factors.
Gas produced by the oil well annually/daily/monthly. Direct measure or estimated. This
type of data would be similar to the gas produced during completions but would be
related to ongoing production of associated gas from the well.
Gas composition. This data is typically composition results from laboratory analysis of
the raw gas stream to determine methane and other hydrocarbon volume or weight
percent for use in converting natural gas or methane emissions estimates to VOC.
Duration of completion cycle. Length of the completion process in days.
Use of control technology. Flares, reduced emissions completions (RECs), other control
technology or none. This information indicates whether a control device or practice is
used and, if possible, the amount of produced gas captured and controlled.
2) For estimating nationwide emissions:
Number of oil well completions conducted annually. This information requires
identification of the number of oil wells conducting completions/recompletions annually.
Number of oil wells co-producing natural gas. This involves identifying the population of
oil wells using a definition of oil well based on some production criteria.
Number of oil wells completions with emissions controls such as RECs or flaring.
There are several available data sources for the data elements described above. Because
most of the available data were not collected specifically for the purpose of estimating emissions,
each source has to be qualified to ensure that the data are being used appropriately. In
characterizing the nationwide emissions, we analyzed several sources of data and qualify each
source with respect to the different aspects of the emission estimation process. Therefore, in
addition to describing the data source and any relevant results of analysis, this paper discusses
the implications of the data and/or results of analysis of the data with respect to the quantity of
data, quantity of emissions, scope of emissions estimates, geographic dispersion, and variability
in data.

7
Lastly, methodologies used in the emission estimation process are described, such as a
discussion of the methodology for deriving emission factors or for identifying national
populations.
There is variation in the industry as to how oil wells and gas wells are defined. Some
publications do not differentiate at all between them, while others use the amount of oil produced
or a gas-to-oil ratio (GOR) threshold as a dividing line between a gas well and an oil well. This
definitions used in each study or data source. The intent of this section of the paper is to present
understanding of the available data and its usefulness in estimating VOC and methane
emissions from this source.
3.1 Summary of Major Studies and Sources of Emissions Data
Given the potential for emissions from hydraulically fractured oil well completions, there
have been several information collection efforts and studies conducted to estimate emissions and
available emission control options. Studies have focused on completion emission estimates.
Some of these studies are listed in Table 3-1, along with an indication of the type of information
contained in the study (i.e., activity level, emissions data, and control options).
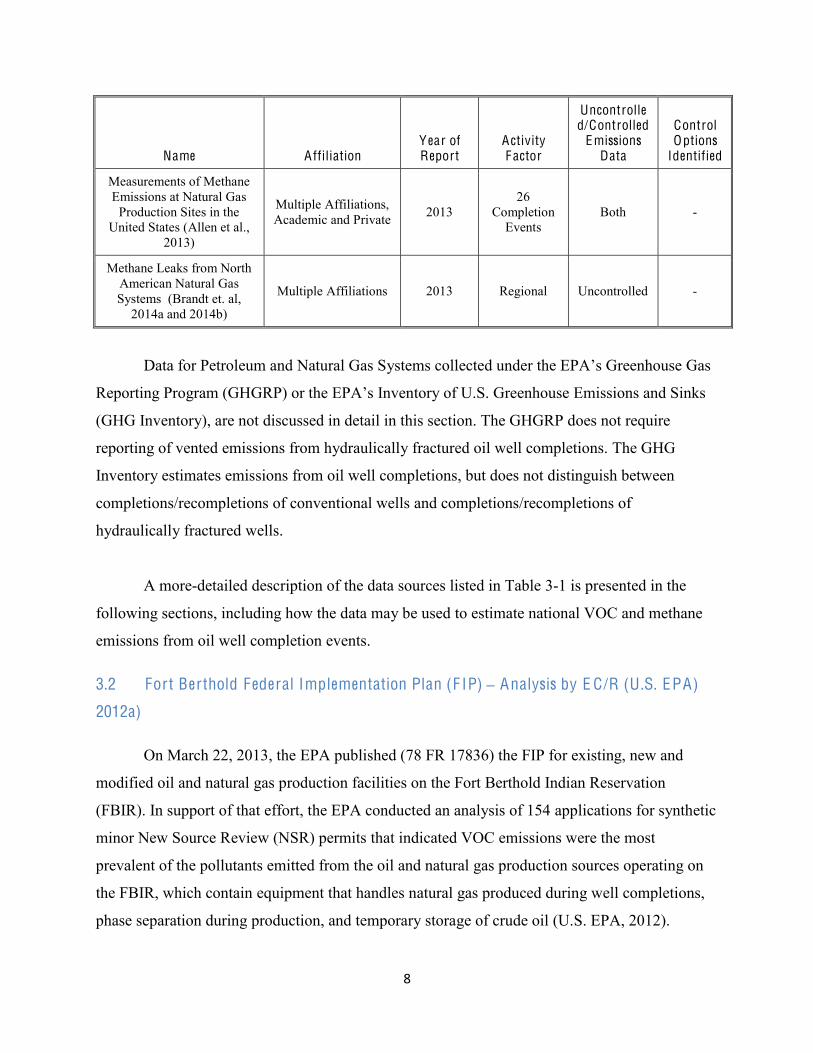
Table 3-1. Summary of Major Sources of Information and Data on O il W ell Completions
Name A ffiliation Year of Report
Activity Factor
Uncontrolled/Controlled
Emissions Data
Control Options
Identified
Fort Berthold Federal Implementation Plan (U.S.
EPA, 2012a)
U.S. Environmental Protection Agency 2012 Regional Uncontrolled X
ERG/ECR Contractor Analysis of HPDI® Data
U.S. Environmental Protection Agency 2013 Nationwide Uncontrolled X
Environmental Defense Fund Analysis of HPDI®
Data (EDF, 2014)
Environmental Defense Fund 2014 Nationwide Uncontrolled -
8
Name A ffiliation Year of Report
Activity Factor
Uncontrolled/Controlled
Emissions Data
Control Options
Identified
Measurements of Methane Emissions at Natural Gas
Production Sites in the United States (Allen et al.,
2013)
Multiple Affiliations, Academic and Private 2013
26 Completion
Events Both -
Methane Leaks from North American Natural Gas Systems (Brandt et. al,
2014a and 2014b)
Multiple Affiliations 2013 Regional Uncontrolled -
D
(GHG Inventory), are not discussed in detail in this section. The GHGRP does not require
reporting of vented emissions from hydraulically fractured oil well completions. The GHG
Inventory estimates emissions from oil well completions, but does not distinguish between
completions/recompletions of conventional wells and completions/recompletions of
hydraulically fractured wells.
A more-detailed description of the data sources listed in Table 3-1 is presented in the
following sections, including how the data may be used to estimate national VOC and methane
emissions from oil well completion events.
3.2 Fort Berthold Federal Implementation Plan (F IP) Analysis by E C/R (U .S. EPA)
2012a)
On March 22, 2013, the EPA published (78 FR 17836) the FIP for existing, new and
modified oil and natural gas production facilities on the Fort Berthold Indian Reservation
(FBIR). In support of that effort, the EPA conducted an analysis of 154 applications for synthetic
minor New Source Review (NSR) permits that indicated VOC emissions were the most
prevalent of the pollutants emitted from the oil and natural gas production sources operating on
the FBIR, which contain equipment that handles natural gas produced during well completions,
phase separation during production, and temporary storage of crude oil (U.S. EPA, 2012).

9
The EPA FIP established federally enforceable requirements to control VOC emissions
from oil and natural gas production activities that were previously unregulated or regulated less
strictly. The FIP requires a 90%-98% reduction of VOC emissions from gas not sent to a sales
line using pit flares, utility flares and enclosed combustors, all technologies which were found to
be standard industry practice on the FBIR. The analysis included a large dataset of combustion
control equipment cost information based on three well/control configuration scenarios.
The FBIR dataset includes:
533 production wells from five major operators
Average controlled and uncontrolled VOC emissions from oil wells for wellhead gas,
heater/treaters, and storage tanks
Oil production data
Number of sources; storage tanks, combustors, flares, and if a pipeline is present
Current capital and annualized cost estimates for combustion and REC control options
Gas composition data (for each permit application)
Projected 2,000 new wells or 1,000 well pads per year between 2010 and 2029.
The data provided for the FBIR, although useful, has certain qualifying limitations. For
instance, the FBIR data is primarily for wells producing from the Bakken and Three Forks
formations, which limits it to a regional dataset. Also, the FBIR data showed high variability in
oil well production rates and in product composition. This variability may not be representative
of other formations. Also, according to the North Dakota Department of Health, the Bakken
formation typically contains a high amount of lighter end VOC components which have the
potential to produce increased volumes of flash emissions compared to typical oil production
wells (U.S. EPA, 2012a). This may be somewhat unique to the Bakken formation and not be
representative nationally.
Table 3-2 summarizes an analysis performed by EC/R of the FBIR data with respect to
oil well completion emissions. The analysis estimated completion emissions by multiplying the
average gas volume per day for each well by a 7 day flowback period. The analysis indicated that

10
the average uncontrolled emissions from a well completion event are 37 tons of VOC per
completion event.

11
Table 3-2. Summary of F B IR F IP O il W ell Completion Uncontrolled3 Casing Gas and V O C Emissions
Data from F B IR F IP
Data E lement Enerplus E O G Q EPc WPX b WPX-2b WPX-3b X T O d Marathon PetroHunt Average M in Max
VOC Molecular weight 27.0 27.7 NA 28.1 29.6 31.7 24.5 28.5 25.8 27.8 24.5 31.7
Natural Gas Molecular weight 37.8 40.5 NA 43.7 45.9 51.0 32.9 41.4 34.3 41.0 32.9 51.0
Gas Constant (ft3/lbmol)a 379 379 NA 379 379 379 379 379 379 379 379.0 379
Average Oil Production (bpd) - per well 1,181 255 NA 347 420 303 305 2,094 214 639.7 214 2,094
Average Gas Volume (Mcf/day) - per well 885 182 NA 250 292 210 305 491 197 351.5 182 885
Average Gas Volume (Mcf/completion) 6,197 1,272 NA 1,748 2,042 1,473 2,133 3,439 1,378 2,460 1,272 6,197
Average Uncontrolled VOC Emissions (ton/completion)
83 19 NA 28 37 31 23 53 16 37 16 83
NA = Not Reported, FBIR FIP = Fort Berthold Indian Reservation Federal Implementation Plan, EOG = EOG Resources, QEP = QEP Energy Co., WPX = WPX Energy, XTO = XTO Energy Inc. a-Value used by North Dakota facilities represents 60°F and 1 atm. For subpart OOOO, this value is based on 68°F and 1 atm. b-NOTE for WPX:
i. They used three different molecular weights and percent. Therefore, each of these are represented in this table. ii. They only reported 10% of the VOC emissions because they flare 90% of their casinghead gas emissions. This table represents 100%.
c-The QEP molecular weight and VOC content data for casinghead gas were claimed as copyrighted and were not in the online docket. d-XTO reported oil production and associated gas production as the same value. Therefore, did not include this gas to oil production ratio in the average.
3 Uncontrolled emissions are the emissions that would occur if no emissions mitigation practices or technologies were used (e.g., completion combustion devices or RECs).

12
3.3 E R G Inc. and E C/R Analyses of HPDI Data
ERG Inc. and EC/R (ERG/ECR) conducted an analysis of Calendar Year (CY) 2011
HPDI4 data to estimate uncontrolled emissions from hydraulically fractured oil well completions
for the EPA. For this analysis the following methodology was used:
ERG extracted HDPI oil well data for hydraulically fractured, unconventional oil wells
completed in CY 2011. Because the HPDI database does not differentiate between gas and oil
wells, the following criteria were used to identify the population of hydraulically fractured oil
well completions:
Identified wells completed in 2011 using HPDI data covering U.S. oil and natural gas wells.
Summary of the data and the logic for dates used Hydraulically
Fractured Oil Well Completions
Identified wells completed in 2011 that were hydraulically fractured using the Department
of Energy EIA formation type crosswalk supplemented with state data for horizontal wells
(ERG, 2013)
Determined which wells were oil wells based on their average gas-to-liquids ratio (less than
12,500 scf/barrel were considered to be oil wells)
Estimated the average daily gas flow from the cumulative natural gas production for each
well during its first 12 months of production
The resulting dataset provided 192 data points representing county level average daily
natural gas production at a total of 5,754 oil well completions for CY 2011.
Emissions in the ERG/ECR analysis were calculated using both a 3-day and a 7-day
flowback period. The volume of natural gas emissions (in Mcf) per completion event was
calculated using the average daily flow multiplied by both a 7-day flowback period and a 3-day
flowback period. The gas volume was converted to mass of VOC using the same VOC
4 HPDI, LLC is a private organization specializing in oil and gas data and statistical analysis. The HPDI database is focused on historical oil and gas production data and drilling permit data. For certain states and regions, this data was supplemented by state drilling information. The 2011 data was the most current data available when the analysis was performed.
13
composition and conversion methodology used for gas wells in the subpart OOOO well
completion evaluation. The composition values used were 46.732% by volume of methane in
natural gas and 0.8374 pound VOC per pound of methane for oil wells (EC/R, 2011a).
The analysis of the 2011 HPDI data for oil well completions provided an average gas
production of 262 Mcf per well per day. Based on this gas production, the average uncontrolled
VOC emissions were 20 tons per completion event based on a 7-day flowback period and 6.4
tons of VOC per completion event based on a 3-day flowback period. The average uncontrolled
methane emissions were 24 tons per completion event based on a 7-day flowback period and 7.7
tons of methane per completion event based on a 3-day flowback period. It was assumed that the
emissions for an oil well recompletion event are the same as an oil well completion event.
To estimate nationwide uncontrolled emissions for hydraulically fractured oil well
completions, the average methane and VOC emissions per event were multiplied by the total
number of estimated oil well completions. For 2011, which was the most recent data available in
HPDI, the estimated nationwide uncontrolled hydraulically fractured oil well completion VOC
emissions are 116,230 tons per year (i.e., VOC emissions/completion of 20.2 tons/event times
the total oil well completion events per year of 5,274) based on a 7-day flowback period and
36,825 tons per year (i.e., VOC emissions/completion of 6.4 tons/event times the total oil well
completion events per year of 5,274) based on a 3-day flowback period. The estimated
nationwide uncontrolled hydraulically fractured oil well completion methane emissions are
138,096 tons per year (i.e., methane emissions/completion of 24 tons/event times the total oil
well completion events per year of 5,274) based on a 7-day flowback period and 44,306 tons per
year (i.e., VOC emissions/completion of 7.7 tons/event times the total oil well completion events
per year of 5,274) based on a 3-day flowback period. Table 3-3 presents the results of the
emission estimate analysis for both the 7-day and 3-day completion duration periods.
14
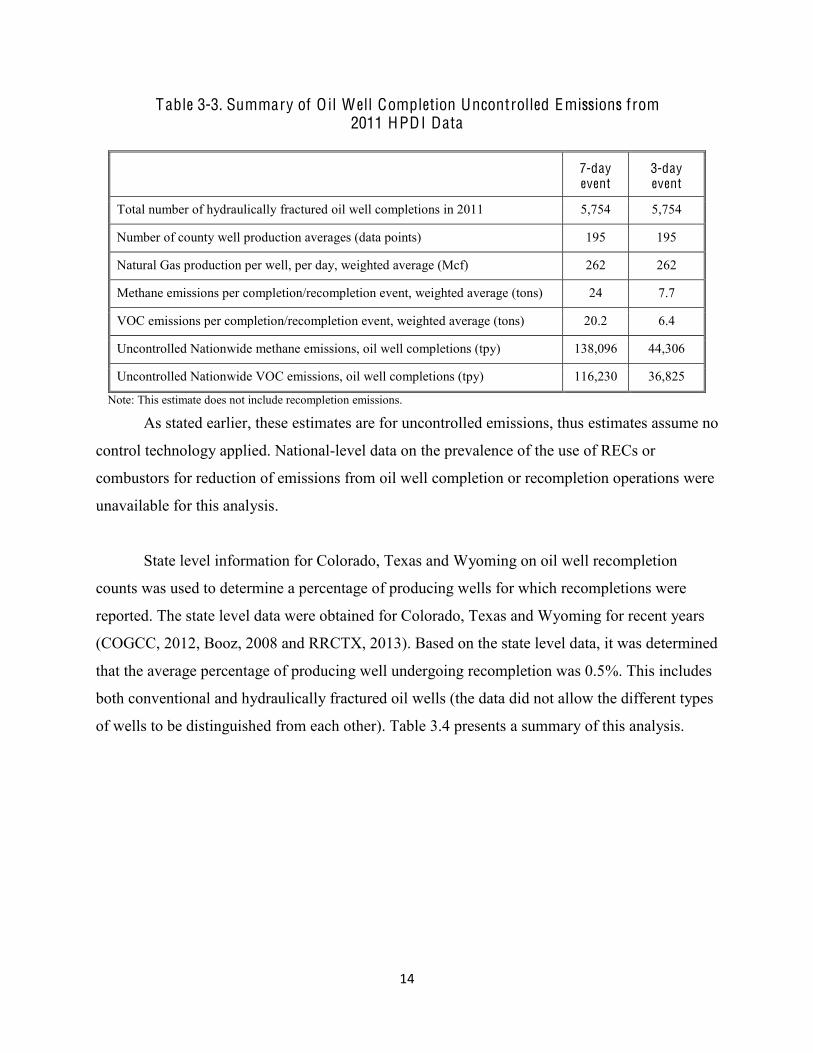
Table 3-3. Summary of O il W ell Completion Uncontrolled Emissions from 2011 HPDI Data
7-day event
3-day event
Total number of hydraulically fractured oil well completions in 2011 5,754 5,754
Number of county well production averages (data points) 195 195
Natural Gas production per well, per day, weighted average (Mcf) 262 262
Methane emissions per completion/recompletion event, weighted average (tons) 24 7.7
VOC emissions per completion/recompletion event, weighted average (tons) 20.2 6.4
Uncontrolled Nationwide methane emissions, oil well completions (tpy) 138,096 44,306
Uncontrolled Nationwide VOC emissions, oil well completions (tpy) 116,230 36,825
Note: This estimate does not include recompletion emissions.
As stated earlier, these estimates are for uncontrolled emissions, thus estimates assume no
control technology applied. National-level data on the prevalence of the use of RECs or
combustors for reduction of emissions from oil well completion or recompletion operations were
unavailable for this analysis.
State level information for Colorado, Texas and Wyoming on oil well recompletion
counts was used to determine a percentage of producing wells for which recompletions were
reported. The state level data were obtained for Colorado, Texas and Wyoming for recent years
(COGCC, 2012, Booz, 2008 and RRCTX, 2013). Based on the state level data, it was determined
that the average percentage of producing well undergoing recompletion was 0.5%. This includes
both conventional and hydraulically fractured oil wells (the data did not allow the different types
of wells to be distinguished from each other). Table 3.4 presents a summary of this analysis.

15
Table 3-4. Analysis of Texas, Wyoming and Colorado Recompletions Counts
State Data Source Year
Total Number of Producing
W ells
Total Number of
Recompletions
Percent Recompletions to Total Producing
W ells
Railroad Commission of Texas 2012 168,864 685 0.4
Wyoming Heritage Foundation 2007 37,350 304 0.8
State of Colorado Oil & Gas Conservation Commission 2012 50,500 152 0.3
Average Percent 0.5
While the state level recompletion data are recent, the percentage of producing oil wells
that undergo recompletion in future years may increase due to more prevalent use of hydraulic
fracturing on oil wells. However, no data have been obtained to quantify any potential increase
in the oil well recompletion rate. This percentage was not used to estimate the number of
recompletions of hydraulically fractured oil wells, because the data did not distinguish between
conventional wells and hydraulically fractured wells.
3.4 Environmental Defense Fund and Stratus Consulting Analysis of O il W ell
Completions5 (E D F , 2014)
The Environmental Defense Fund (EDF) and Stratus Consulting (EDF/Stratus) conducted
an analysis of HPDI data for oil wells to determine the cost effectiveness of the use of RECs and
flares for control of oil well completion emissions within three major unconventional oil play
formations, Bakken, Eagle Ford and Wattenberg. The oil well completion population was
extracted using the DI Desktop for all oil wells with initial production in 2011 and 2012.
Different filters were applied in each formation in order to identify the hydraulically fractured oil
wells:
5 -Producing Wells as a Major Source of Methane Emissions:
http://blogs.edf.org/energyexchange/files/2014/03/EDF-Co-producing-Wells-Whitepaper.pdfthe data that was used in the analysis are available at https://www.dropbox.com/s/osrom4w6ewow4ua/EDF-Initial-Production-Cost-Effectiveness-Analysis.xlsx.

16
Eagle Ford
o Well Production Type: Oil
Bakken
o Well Production Type: Oil and Oil & Gas
Wattenberg
o Well Production Type: Oil
The resulting dataset included 3,694 oil wells for the Bakken formation, 1,797 oil wells
for the Eagle Ford formation, and 3,967 oil wells for the Wattenberg formation. The assumptions
EDF/Stratus made while conducting this analysis were:
Well completions lasted an average of 7 to 10 days and the total gas production
s reported in DI
Desktop
natural gas emissions from the oil well completion).
The natural gas content was 78.8% methane.
Table 3-5 summarizes the results of this analysis.
Table 3-5. E D F Estimated Uncontrolled Methane Emissions from O il W ell Completions Based on Analysis of HPDI® O il W ell Production Data
Formation W ells (#)
Uncontrolled Completion E missions
(gas M cf/event)
Uncontrolled Completion E missions
(M T C H4/event)
Uncontrolled Completion E missions
(tons C H4/event) Wattenberga 3,967 624 9.5 10.5
Bakkenb 3,694 1,183 18.0 19.8 Eagle Fordc 1,797 1,628 24.7 27.2
All results represent mean values. a - Production data was downloaded for all oil wells in the Colorado Wattenberg formation with a first production date between 1/1/2010 and 3/1/2013. b - Production data was downloaded for wells in the North Dakota Bakken formation with a completion date from 1/1/2010-12/31/2012. North Dakota does not distinguish between oil and gas wells. All wells with the type O&G were assumed to be oil wells. c - Production data was downloaded for all oil wells in the Texas Eagle Ford formation with a completion date between 1/1/2010 and 2/23/2013.
17
The EDF/Stratus Analysis also provided an estimate of uncontrolled methane emissions
from oil well completions of 247,000 MT (272,000 tons), however, the materials describing the
analysis do not explain how this estimate was calculated.
3.5 Measurements of Methane Emissions at Natural Gas Production Sites in the United
States (U T Study) (A llen et al., 2013)
The UT Study was primarily authored by University of Texas at Austin and was
sponsored by the EDF and several companies in the oil and gas production industry. The study
was conducted to gather methane emissions data at onshore natural gas well sites in the U.S. and
compare the data to the EPA Inventory of U.S. Greenhouse Gas Emissions and Sinks (GHG
Inventory). The sources and operations that were tested included well completion flowbacks,
well liquids unloading, pneumatic pumps and controllers and equipment leaks. The full study
analysis included 190 onshore natural gas sites, which included 150 production sites, 26 well
completion events, 9 well unloading and 4 well recompletions or workovers.
Six of the completion events in the UT Study were at co-producing wells (at least some
oil was produced). The study reported the total oil produced, the total associated gas produced,
the potential and actual methane emission, the completion duration, the type of emission control
used, and the percent reduction from the control that was observed (Note: for two of the
completion events, data was not gathered for the initial flow to the open tank). The data for these
wells are summarized in Table 3-6.

18
Table 3-6. Summary of Completion Emissions from Co-Producing W ells
Site ID
O il Produced
(bbl)
Gas Produced
(M cf) G O R
(scf/bbl)
Potential M ethane
Emissionsa
(M cf)
Actual M ethane
Emissionsb (M cf)
% Reductio
n Data
Analyzed Duration
(hrs)
R E C or
F lare
GC-1 1,594 6,449.9 4,046.36 5,005 106 97.9 Yes 75 Flare
GC-2 1,323 5,645 4,266.82 4,205 91 97.8 Yes 76 Flare
GC-3 2,395 26,363 11,007.52 21,500 264 98.8 Yes 28 REC
GC-4 1,682 24,353 14,478.60 13,000 180 98.6 Yes 28 REC
GC-6 448 13,755 30,703.13 12,150 247 98 Nod 164 Flare
GC-7 1,543 5,413 3,508.10 4,320 90 97.9 Nod 108 Flare
a Measured emissions before flare or REC. b - Measured emissions after flare or REC. c - Calculated from measured before and after control. d -Data not used in developing average emissions factor in the UT Study because, in these flowbacks, the study team was unable to collect completion emissions data for the initial flow to the open tank.
Using the threshold of a GOR of 12,500 scf/barrel to distinguish oil wells from gas wells,
wells GC-1, GC-2, GC-3, and GC-7 would be considered oil wells. The average uncontrolled
methane emissions from those wells were 213 tons (10,237 Mcf) and the average controlled
(actual) emissions were 3.2 tons (154 Mcf).6 The average duration of the completion for these
wells was 72 hours (3 days). It is also worth noting that well GC-3 was controlled using a REC
and 98.8% of the potential methane emissions were mitigated, demonstrating that RECs can be
used effectively to control emissions from hydraulically fractured oil wells.
3.6 Methane L eaks f rom North American Natural Gas Systems (B randt et. al, 2014a
and 2014b)
Novim, a non-profit group at the University of California, sponsored a meta-analysis of
the existing studies on emissions from the production and distribution of natural gas. As part of
this analysis, Novim estimated emissions from hydraulically fractured oil well completions based
on data from HPDI®. Novim included wells that were drilled in 2010 or 2011 in the Eagle Ford,
6 These averages do not include well GC-7, because, as noted above, data from this well was not used in the UT Study due to the inability to collect all the emissions data.

19
Bakken, and Permian formations (Brandt et. al., 2014a). Different filters were applied in each
formation in order to identify the hydraulically fractured oil wells:
Eagle Ford
o Well Production Type: Oil
o Drill Type: Horizontal
Bakken
o Well Production Type: Oil and Oil & Gas
o Drill Type: Horizontal
Permian
o Well Production Type: Oil
o Drill Type: All
Using this method of qualifying the well population, Novim concluded 2,969
hydraulically fractured oil wells were completed in 2011 in the three formations (Brandt et. al.,
2014a). In order to estimate completion emissions, 7 in which
peak gas production (normally the production during the first month) is converted to a daily rate
of production. The method assumes that during flowback emissions increase linearly
over the first nine days until the peak rate is reached. Table 3-7 summarizes the estimated
uncontrolled methane emissions per completion calculated by the Novim study.
Table 3-7. Summary of Uncontrolled Completion Emissions f rom Co-Producing W ells
Formation
Uncontrolled Methane Emissions
(tonnes/event)a
Uncontrolled Methane Emissions
(ton/event)b
Eagle Ford 90.9 93
Bakken 31.1 31.9
Permian 31.2 31.9 a 1 Mg = 1 metric tonne of methane b Converted to U.S. short tons. 1 tonne = 1.02311 tons (short/U.S.) of methane
7 Environmental Research Letters, United Kingdom. November 26, 2012.

20
The Novim Study assumes methane emissions from these formations are representative
of total national methane emissions from hydraulically fractured oil well completions and
estimates those emissions to be 0.12 Tg (120,000 tonnes or 122,773 tons) per year for 2011.
It should be noted that the methodology in this study, like the ERG/ECR Analysis and the
EDF/Stratus Analysis, uses gas production from HPDI® to estimate completion emissions.
hod in which the emissions increase linearly through
the flowback period until a peak is reached, while the ERG/ECR Analysis and the EDF/Stratus
Analysis assume emissions are constant through the flowback period.
4.0 E M ISSI O NS D A T A A ND E M ISSI O NS EST I M A T ES ASSO C I A T E D
G AS F R O M H Y DR A U L I C A L L Y F R A C T UR E D O I L W E L LS
Given the potential for emissions of associated gas from oil production, available
information sources have been reviewed as to their potential use for characterizing the VOC and
methane emission from associated gas production at oil well sites. As was stated previously, the
gas that is vented during
the production phase that could otherwise be captured and sold if the necessary pipeline
infrastructure was available to take the gas to market.
One methodology for estimating emissions would be to use the GOR of the well, which is
a common piece of well data in the industry. An emission factor based on average GOR could be
developed, and then the emission factor could be used to estimate uncontrolled associated gas
emissions by applying it to known oil production (assuming all gas produced at an oil well is
included in uncontrolled associated gas emissions). However, research indicates that associated
gas production from oil wells declines over the life of the well, similar to oil production, but the
decline is typically at a different rate than the oil production (EERC, 2013). This phenomenon
introduces another variable into the analysis.
A second approach would be to use gas production reported for the well for economic
and regulatory reasons. Conceivably, gas production could be used to estimate uncontrolled

21
associated gas emissions. However, the EPA is not aware of a methodology that would allow the
Agency to calculate the percentage of produced gas that could be captured if pipeline
infrastructure were available. Some gas is emitted from equipment as part of normal operations,
such as bleeding from pneumatic controllers. These emissions would not qualify as associated
gas emissions as they have been defined in this paper.
venting and flaring emissions.
Additionally, the Ceres report contains data potentially useful for basic evaluation of VOC and
methane associated gas emissions, but does not provide national estimates or per well estimates
of emissions (Ceres, 2013). Both these sources are discussed in detail in the sections below.
The GHG Inventory does not include a category that specifically covers all associated gas
emissions. Instead, these emissions are estimated in several categories in Petroleum Systems, and
in Natural Gas Systems (emissions downstream of the gas-oil separator, and flaring).
4.1 G reenhouse Gas Reporting Program (U .S. EPA , 2013)
In October 2013, the EPA released 2012 greenhouse gas (GHG) data for Petroleum and
Natural Gas Systems8 collected under the GHGRP. The GHGRP, which was required by
Congress in the FY2008 Consolidated Appropriations Act, requires facilities to report data from
large emission sources across a range of industry sectors, as well as suppliers of certain GHGs
and products that would emit GHGs if released or combusted.
When reviewing this data and comparing it to other datasets or published literature, it is
important to understand the GHGRP reporting requirements and the impacts of these
requirements on the reported data. The GHGRP covers a subset of national emissions from
Petroleum and Natural Gas Systems; a facility9 in the Petroleum and Natural Gas Systems source
8 The implementing regulations of the Petroleum and Natural Gas Systems source category of the GHGRP are located at 40 CFR Part 98 Subpart W. 9 -located emission sources that are commonly owned or operated. However, the GHGRP has developed a specialized facility definition for onshore production.
company in a specific hydrocarbon producing basin (as defined by the geologic provinces published by the American Association of Petroleum Geologists).

22
category is required to submit annual reports if total emissions are 25,000 metric tons carbon
dioxide equivalent (CO2e) or more. Facilities use uniform methods prescribed by the EPA to
calculate GHG emissions, such as direct measurement, engineering calculations, or emission
factors derived from direct measurement. In some cases, facilities have a choice of calculation
methods for an emission source.
Under the GHGRP, facilities report associated gas vented and flared emissions. Vented
emissions are calculated based on GOR and the volume of oil produced and flared emissions
using a continuous flow measurement device or engineering calculation. For 2012, 171 facilities
reported associated gas vented and flared emissions to the GHGRP. Total reported methane
emissions were 89,535 MT.
4.2 F L A RIN G UP: North Dakota Natural Gas F laring More Than Doubles in Two
Years (F laring Up) (C E R ES, 2013)
The Flaring Up report discusses the increase in and gas production
from the Bakken formation between 2007 and mid-2013, the increased flaring of associated gas,
and the potential value of NGL lost as a result of flaring. The report presents some associated gas
production and flaring data that the authors derive from the gas production and flaring data
reported by the North Dakota Industrial Commission (NDIC), Department of Mineral Resources.
The Commission defines associated gas to be all natural gas and all other fluid hydrocarbons not
defined as oil. Oil is defined by the Commission to be all crude petroleum oil and other
hydrocarbons, regardless of gravity which are produced at the wellhead in liquid form and the
liquid hydrocarbons known as distillate or condensate recovered or extracted from gas, other
than gas produced in association with oil and commonly known as casinghead gas10.
This Flaring Up report indicates that of the wells that are flaring the associated gas,
approximately 55% are wells are not connected to a gas gathering system, while 45% are wells
that are already connected. In addition, the report states that in May of 2013, 266,000 Mcf per
day was flared, which represents nearly 30% of the gas produced (CERES, 2013). Percent flaring
is currently reported by the NDIC while the connection data is tracked by the North Dakota
10 North Dakota Century Code, Section I, Chapter 38-08 Control of Gas & Oil Resources, Section 38-08-02.
23
Pipeline Authority. The report concludes that the reason for the flaring of the associated gas is
lack of pipeline infrastructure, lack of capacity and lack of compression infrastructure.
The data and information in this report is useful for discussion on the relative percentages
of gas emissions being flared. The data, however, are specific to the Bakken, a formation that
possesses unique characteristics both with regard to reservoir and formation characteristics, gas
composition and the lack of infrastructure due to rapid development of the industry in the area.
5.0 A V A I L A B L E E M ISSI O N M I T I G A T I O N T E C H NI Q U ES
Two mitigation techniques were considered that have been proven in practice and in
studies to reduce emissions from well completions and recompletions: REC and completion
combustion. One of these techniques, REC, is an approach that not only reduces emissions but
delivers natural gas product to the sales meter that would otherwise be vented. The second
technique, completion combustion, destroys the organic compounds. Both of these techniques
are discussed in the following sections, along with estimates of the efficacy at reducing
emissions and costs for their application for a representative well. Combustion control for control
of associated gas emissions (e.g., flaring) has been demonstrated as effective in the industry.
However, flaring results in the destruction of a valuable resource and, as such, alternate uses for
uncaptured/sold associated gas have been the subject of several studies with respect to new
emerging technologies.
5.1 Reduced Emission Completions (R E C)
5.1.1 Description
Reduced emissions completions are defined for the purposes of this paper as:
A well completion following fracturing or refracturing where gas flowback that is
otherwise vented is captured, cleaned, and routed to the flow line or collection system, re-
injected into the well or another well, used as an onsite fuel source, or used for other
24
useful purpose that a purchased fuel or raw material would serve, with no direct release to
the atmosphere.
designed equipment at the well site to capture and treat gas so it can be directed to the sales line.
This process prevents some natural gas from venting and results in additional economic benefit
from the sale of captured gas and, if present, gas condensate. It is the
the additional equipment required to conduct a REC may include additional tankage, special gas-
liquid-sand separator traps and a gas dehydrator. In many cases, portable equipment used for
RECs operates in tandem with the permanent equipment that will remain after well drilling is
completed (EC/R, 2010b). In other instances, permanent equipment is designed (e.g., oversized)
to specifically accommodate initial flowback. Some limitations exist for performing RECs
because technical barriers vary from well to well. Three main limitations include the following:
Proximity of pipelines. For certain wells, no nearby sales line may exist. The lack of a nearby
sales line incurs higher capital outlay risk for exploration and production companies and/or
pipeline companies constructing lines in exploratory fields.
Pressure of produced gas. Based on experience using RECs at gas wells, the EPA
understands that during each stage of the completion process, the pressure of flowback fluids
may not be sufficient to overcome the sales line backpressure. In this case, combustion of
flowback gas is one option, either for the duration of the flowback or until a point during
flowback when the pressure increases to flow to the sales line.
Inert gas concentration. Based on experience using RECs at gas wells, if the concentration of
inert gas, such as nitrogen or carbon dioxide, in the flowback gas exceeds sales line
concentration limits, venting or combustion of the flowback may be necessary for the
duration of flowback or until the gas energy content increases to allow flow to the sales line.
Further, since the energy content of the flowback gas may not be high enough to sustain a
flame due to the presence of the inert gases, combustion of the flowback stream would
require a continuous ignition source with its own separate fuel supply.
25
5.1.2 Effectiveness
Based on data available on RECs use at gas wells, the emission reductions from RECs
can vary according to reservoir characteristics and other parameters including length of
completion, number of fractured zones, pressure, gas composition, and fracturing
technology/technique. Based on the results reported by four different Natural Gas STAR Partners
who performed RECs primarily at natural gas wells, a representative control efficiency of 90%
for RECs was estimated. The companies provided both recovered and total produced gas,
allowing for the calculation of the percentage of the total gas which was recovered. This estimate
was based on data for more than 12,000 well completions (ICF, 2011). Any amount of gas that
cannot be recovered can be directed to a completion combustion device in order to achieve a
minimum 95% reduction in emissions. Additionally, both wells that co-produced oil and gas and
were controlled with a REC in the UT Austin study achieved greater than 98% reduction in
methane emissions.
5.1.3 Cost
The discussion of cost in this section is based on the EPA
wells. It is the EPA at gas wells and
co-producing oil wells. All completions incur some costs to a company. Performing a REC will
add to these costs. Equipment costs associated with RECs vary from well to well. High
production rates may require larger equipment to perform the REC and will increase costs. If
permanent equipment, such as a glycol dehydrator, is already installed or is planned to be in
place at the well site as normal operations, costs may be reduced as this equipment can be used
or resized rather than installing a portable dehydrator for temporary use during the completion.
Some operators normally install equipment used in RECs, such as sand traps and three-phase
separators, further reducing incremental REC costs.
The average cost of RECs was obtained from data shown in the Natural Gas STAR
ydraulically Fractured
(U.S. EPA, 2011a). The impacts calculations use the cost per day for gas
26
capture and the duration of gas capture along with a setup/takedown/transport cost and a flare
cost to represent the total cost. The cost is then annualized across the time horizon under study.
Costs of performing a REC are projected to be between $700 and $6,500 per day (U.S.
EPA, 2011a). This cost range is the incremental cost of performing a REC over a completion
without a REC, where typically the gas is vented or combusted because there is an absence of
REC equipment. These cost estimates are based on the state of the industry in 2006 (adjusted to
2008 U.S. dollars). 11 Cost data used in this analysis are qualified below:
$700 per day (equivalent to $806 per day in 2008 dollars) represents completion and
recompletion costs where key pieces of equipment, such as a dehydrator or three-phase
separator, are already found onsite and are of suitable design and capacity for use during
flowback.
$6,500 per day (equivalent to $7,486 in 2008 dollars) represents situations where key
pieces of equipment, such as a dehydrator or three-phase separator, are temporarily
brought onsite and then relocated after the completion.
The average of the above data results in an average incremental cost for a REC of $4,146
per day (2008 dollars).12 The total cost of the REC depends on the length of the flowback period,
and thus the length of the completion process. For example, if the completion takes 7 days then
the total cost would be $29,022, and if the completion takes 3 days then the total cost would be
$12,438 versus an uncontrolled completion. These costs would be mitigated by the value of the
captured gas. The extent of this cost mitigation would depend on the price of the gas and the
quantity that was captured during the REC.
11 The Chemical Engineering Cost Index was used to convert dollar years. For REC, the 2008 value equals 575.4 and the 2006 value equals 499.6. 12 The average incremental cost for a REC was calculated by averaging $806 per day and $7,486 per day (2008 dollars). While the average estimated cost per day is presented here, it is likely that the cost that is paid by a well operator will be the low incremental cost if key pieces of equipment are already present onsite or the high incremental cost if this equipment is not present onsite, and not the average of these two estimates.
27
5.1.4 Prevalence of Use at Oil Wells
The UT Austin study found that some co-producing oil wells are conducting RECs. It is
the sed on co-producing oil wells if
pipeline infrastructure is available.
5.2 Completion Combustion Devices
5.2.1 Description
Completion combustion is a high-temperature oxidation process used to burn combustible
components, mostly hydrocarbons, found in gas streams (U.S. EPA, 1991). Completion
combustion devices are used to control VOC in many industrial settings, since the completion
combustion devices can normally handle fluctuations in concentration, flow rate, heating value,
and inert species content (U.S. EPA, Flares). These devices can be as simple as a pipe with a
basic ignition mechanism and discharge over a pit near the wellhead. However, the flow directed
to a completion combustion device may or may not be combustible depending on the inert gas
composition of flowback gas, which would require a continuous ignition source. Completion
combustion devices provide a means of minimizing vented gas during a well completion and are
generally preferable to venting, due to reduced air emissions.
5.2.2 Effectiveness
Completion combustion devices can be expected to achieve 95% emission reduction
efficiency, on average, over the duration of the completion or recompletion. If the energy content
of natural gas is low, then the combustion mechanism can be extinguished by the flowback gas.
Therefore, it may be more reliable to install an igniter fueled by a consistent and continuous
ignition source. This scenario would be especially true for energized fractures where the initial
flowback concentration will be extremely high in inert gases. If a completion combustion device
has a continuous ignition source with an independent external fuel supply, then it is assumed to
achieve an average of 95% control over the entire flowback period (U.S. EPA, 2012b).

28
5.2.3 Cost
An analysis of costs provided by industry for enclosed combustors was conducted by the
EPA for the FBIR FIP. In addition, the State of Colorado recently completed an analysis of
industry provided combustor cost data and updated their cost estimates for enclosed combustors
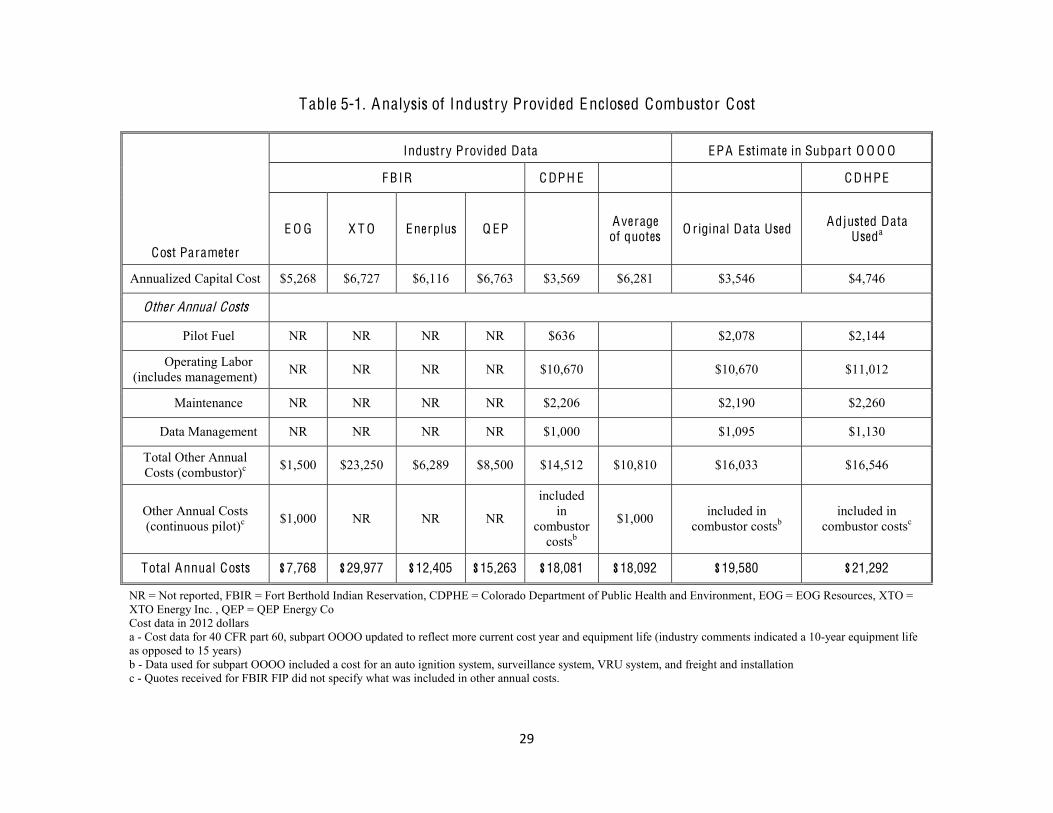
(CDPE, 2013). Table 5-1 summarizes the data provided from each of the sources with the
average cost for an enclosed combustor across these sources being $18,092. It is assumed that
the cost of a continuous ignition source is included in the combustion completion device cost
estimations. Also noted in the table is the most recent combustor cost used for reconsideration of
control options for storage vessels under subpart OOOO.
As with RECs, because completion combustion devices are purchased for these one-time
events, annual costs were assumed to be equal to the capital costs. However, multiple
completions can be controlled with the same completion combustion device, not only for the
lifetime of the combustion device but within the same yearly time period. Costs were estimated
as the total cost of the completion combustion device itself, which corresponds to the assumption
that only one device will control one completion per year. This approach may overestimate the
true cost of combustion devices per well completion or recompletion.
5.2.4 Prevalence of Use at Oil Wells
The UT Austin study found that some co-producing oil wells are using completion
combustion devices to reduce emissions. It is the
approach to reducing emissions from hydraulically fractured oil well completions is the use of a
completion combustion device.
29
Table 5-1. Analysis of Industry Provided Enclosed Combustor Cost
Cost Parameter
Industry Provided Data EPA Estimate in Subpart O O O O
F B IR C DPH E C D HPE
E O G X T O Enerplus Q EP Average of quotes O riginal Data Used Adjusted Data
Useda
Annualized Capital Cost $5,268 $6,727 $6,116 $6,763 $3,569 $6,281 $3,546 $4,746
O ther Annual Costs Pilot Fuel NR NR NR NR $636 $2,078 $2,144
Operating Labor (includes management) NR NR NR NR $10,670 $10,670 $11,012
Maintenance NR NR NR NR $2,206 $2,190 $2,260
Data Management NR NR NR NR $1,000 $1,095 $1,130
Total Other Annual Costs (combustor)c $1,500 $23,250 $6,289 $8,500 $14,512 $10,810 $16,033 $16,546
Other Annual Costs (continuous pilot)c $1,000 NR NR NR
included in
combustor costsb
$1,000 included in combustor costsb
included in combustor costsc
Total Annual Costs $7,768 $29,977 $12,405 $15,263 $18,081 $18,092 $19,580 $21,292
NR = Not reported, FBIR = Fort Berthold Indian Reservation, CDPHE = Colorado Department of Public Health and Environment, EOG = EOG Resources, XTO = XTO Energy Inc. , QEP = QEP Energy Co Cost data in 2012 dollars a - Cost data for 40 CFR part 60, subpart OOOO updated to reflect more current cost year and equipment life (industry comments indicated a 10-year equipment life as opposed to 15 years) b - Data used for subpart OOOO included a cost for an auto ignition system, surveillance system, VRU system, and freight and installation c - Quotes received for FBIR FIP did not specify what was included in other annual costs.
30
5.3 Emerging Control T echnologies for Control of Associated Gas
Several types of alternative use technologies are being investigated both by industry and
regulators for use of associated gas.
The most prominent alternative technologies being investigated to address associated gas
are liquefaction of natural gas, NGL recovery, gas reinjection, and electricity generation.
According to the Schlumberger Oilfield Glossary, refers to natural
gas, mainly methane and ethane, which has been liquefied at cryogenic temperatures. This
process occurs at an extremely low temperature and a pressure near the atmospheric pressure.
When a gas pipeline is not available to transport gas to a marketplace, such as in a jungle or
certain remote regions offshore, the gas may be chilled and converted to liquefied natural gas (a
liquid) to transport and sell it. The term is commonly abbreviated as LNG esearch is being
conducted on the economic and technical feasibility of liquefaction of natural gas as a means to
realize the full potential of the U.S. natural gas resources, particularly with respect to the
potential of U.S. exports of LNG. However, available information indicates that this technology
is typically implemented on a macro scale, requiring installation of large facilities and
transportation infrastructure. Because the EPA is unaware of existing studies or further
information on liquefaction of gas at the wellhead, liquefaction of natural gas is not discussed
further in this paper.
Cost information is summarized to the extent that this information is readily available. In
many cases, available literature does not provide cost information as the economics of the
technology are still being researched.
5.3.1 Natural Gas Liquids (NGL) Recovery
omponents of natural gas that are liquid at surface in
field facilities or in gas-processing plants. Natural gas liquids can be classified according to their
vapor pressures as low (condensate), intermediate (natural gasoline) and high (liquefied
petroleum gas) vapor pressure. Natural gas liquids include propane, butane, pentane, hexane and

31
heptane, but not methane and ethane, since these hydrocarbons need refrigeration to be liquefied.
The term is commonly abbreviated as NGL. 13
Associ , which is defined
as naturally containing heavier hydrocarbons than a lean gas. Its liquid content adds important
economic value to developments containing this type of fluid. Therefore, the value of the NGLs
in the associated gas from the Bakken formation has been the subject of several studies,
particularly with the concerns raised based by the rapid development of Bakken and increased
flaring of associated gas. As would be expected, most of the recent studies related to NGL
recovery are based on the Bakken formation.
One of these studies -Use Technology Study An Assessment of Alternative
conducted by the Energy & Environmental Research Center (EERC)
of the University of North Dakota (EERC, 2013). The study was conducted based on associated
gas production in December 2011 and was published in 2012. This study provides an evaluation
of alternative technologies and their associated costs and benefits. In particular, the study looks
at NGL recovery, as a standalone operation for both recovery of salable NGLs and as a
pretreatment of the associated gas for use in other local operations such as power generation.
To understand NGL recovery, the typical natural gas processing that occurs at or near the
wellhead will be reviewed. Liquid
gas. The condensates are transported via truck or pipeline for further processing at a refinery or
gas processing plant. The minimally processed wellhead natural gas is then transported to a gas-
processing plant via pipeline. There, the gas is processed to remove more water, separate out
NGL, and remove sulfur and carbon dioxide in preparation for release to the sales distribution
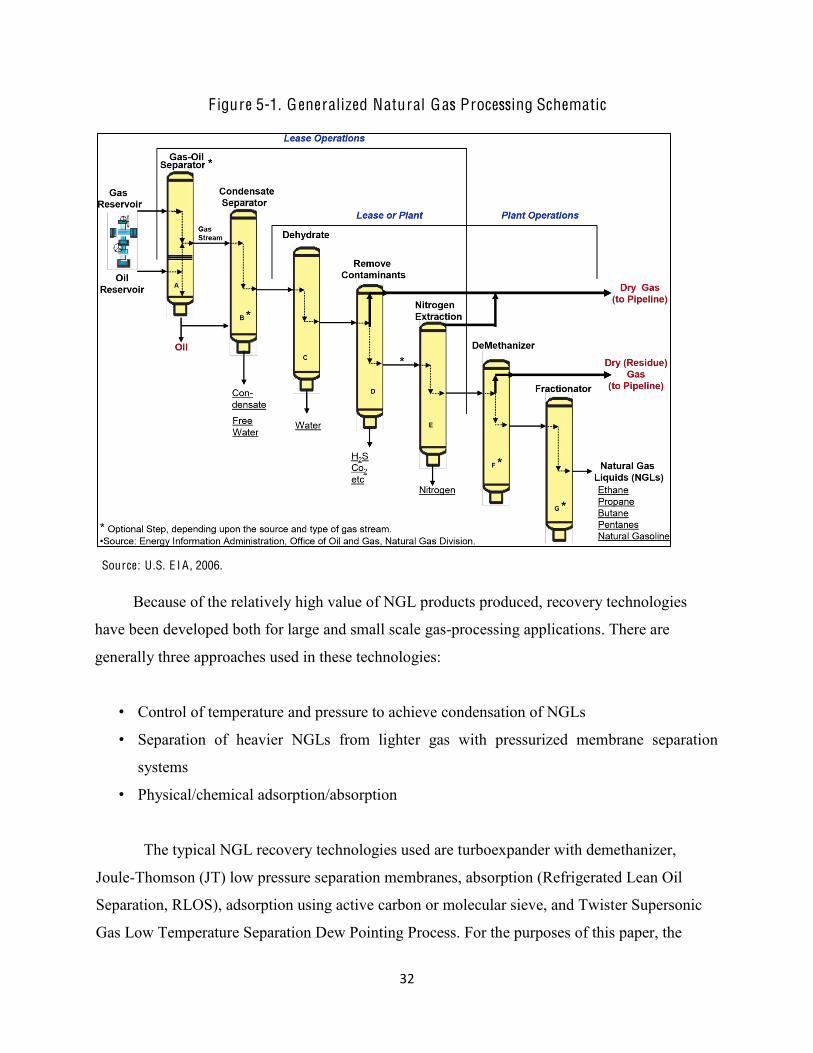
system. Figure 5-1 summarizes generalized natural gas processing.
13 From Schlumberger Oilfield Glossary available at http://www.glossary.oilfield.slb.com/en/Terms.aspx?LookIn=term%20name&filter=natural+gas++liquids
32
F igure 5-1. G eneralized Natural Gas Processing Schematic
Source: U .S. E I A , 2006.
Because of the relatively high value of NGL products produced, recovery technologies
have been developed both for large and small scale gas-processing applications. There are
generally three approaches used in these technologies:
Control of temperature and pressure to achieve condensation of NGLs
Separation of heavier NGLs from lighter gas with pressurized membrane separation
systems
Physical/chemical adsorption/absorption
The typical NGL recovery technologies used are turboexpander with demethanizer,
Joule-Thomson (JT) low pressure separation membranes, absorption (Refrigerated Lean Oil
Separation, RLOS), adsorption using active carbon or molecular sieve, and Twister Supersonic
Gas Low Temperature Separation Dew Pointing Process. For the purposes of this paper, the

33
specifics of these technologies are not discussed; rather, the focus will be on the overall outcome
and potential costs for small scale implementation at the well head for addressing associated gas.
The EERC study included a case study for a small scale NGL Recovery process at a well
head. The case study evaluated the potential for deploying small scale NGL recovery systems as
an interim practice to flaring associated gas while gathering lines and infrastructure were being
installed or upgraded. These systems would allow the most valuable hydrocarbon portion of the
gas to be captured and marketed. The leaner gas resulting could be used onsite for power
generation or transported as a compressed gas. Alternatively, the leaner gas could continue to be
flared. Figure 5-2 depicts the NGL Removal system flow diagram.
F igure 5-2. Natural Gas L iquids (N G L) Removal System Flow Diagram
Source: F igure 22, EERC, 2013
According to the EERC study, 10 to 12 gallons of NGL/Mcf of associated gas is present in
many producing Bakken wells. At an estimated NGL removal rate of 4 gallons/Mcf (from 1000
Mcf/day of rich gas), the daily production of NGLs would be approximately 4,000 gallons of
NGLs per day (EERC, 2013). The study also states that at least at the current natural gas price,
the NGLs make up a majority of the economic value of the rich gas. An evaluation of a
simplified model on small-scale NGL recovery was developed based on a JT-based technology.
The NGL removal system evaluation assumes the parameters shown in Table 5-2.

34
Table 5-2. Assumptions for N G L Recovery Case (Table 9, E E R C , 2013)
Parameter Assumed Value
Rich Gas Flow Rate from the Wellhead, average 300 Mcf/day
Rich Gas Flow Rate Processed, economic cutoff 600 Mcf/day
Rich Gas Flow Rate, design flow 1000 Mcf/day
Rich Gas Heat Content 1400 Btu/ft3
Rich Gas Price (cost) at the Wellhead $0.00/Mcf
Volume of NGLs Existing in Rich Gas 10 12 gallons/Mcf
NGL Price, value $1.00/gallon
Lean Gas Flow Rate from NGL Removal System 85% of rich gas flow rate
Lean Gas Heat Content 1210 1250 Btu/ft3
Lean Gas Price, value $2.00/Mcf
The EERC study estimated capital and annual costs for the NGL removal system.
Operating and maintenance (O&M) costs were assumed to be 10% of the total capital cost.
Revenue calculations were based on NGL sales only at $1/gallon and a recovery rate of 4
gallons/Mcf. In this scenario, it has been assumed that residue gas is flared (EERC, 2013). Table
5-3, derived from Table 10 of the study, summaries the cost for the small sale NGL recovery
system.
Table 5-3. Summary of N G L Removal System Costs (Table 10, E E R C)
Description
Capital Cost Annual O & M
Cost
NGL Removal System, 300 Mcfd rich gas $2,500,000 $250,000
NGL Removal System, 600 Mcfd rich gas $2,500,000 $250,000
NGL Removal System, 1000 Mcfd rich gas $2,500,000 $250,000
Mcfd = One thousand standard cubic feet per day.
35
The EERC study concluded that the technical aspects of NGL recovery are fairly straight
forward; however, the business aspects are much more complicated, particularly with respect to
NGL product supply chain and contractual considerations. Further, the study concluded that
NGL recovery would be most economical at wells flaring larger quantities of gas immediately
after production begins. Other attributes that would be important for the economic feasibility of
the NGL recovery system would be that the systems are mobile and easily mobilized, and that
infrastructure with respect to truing of NGL production is available.
5.3.2 Natural Gas Reinjection
a reservoir maintenance or
secondary recovery method that uses injected gas to supplement the pressure in an oil reservoir
or field. In most cases, a field will incorporate a planned distribution of gas-injection wells to
maintain reservoir pressure 14
The industry has employed production methods to increase production, which are termed
enhanced oil recovery (EOR) or improved oil recovery (IOR) (Rigzone, 2014). These methods
are generally considered to be tertiary methods employed after waterflooding or pressure
maintenance. The practice involves injecting gas into the gas cap of the formation and boosting
the depleted pressure in the formation with systematically placed injection wells throughout the
field. The pressure maintenance methods maybe employed at the start of production or
introduced after the production has started to lessen. The reinjection of natural gas is the use of
associated gas at the same oilfield to accomplish the goals of gas injection as defined above. The
increase in the pressure within the reservoir helps to induce the flow of crude oil. After the crude
has been pumped out, the natural gas is once again recovered.
Natural gas injection is also referred to as cycling. Cycling is used to prevent condensate
from separating from the dry gas in the reservoir due to a drop in reservoir pressure. The
condensate liquids block the pores within the reservoir, making extraction practically impossible.
The NGL are stripped from the gas on the surface after it has been produced, and the dry gas is
14 Schlumberger Oilfield Glossary, available at http://www.glossary.oilfield.slb.com/en/Terms.aspx?LookIn=term%20name&filter=gas+injection

36
then re-injected into the reservoirs through injection wells. Again, this helps to maintain pressure
in the reservoir while also preventing the separation within the hydrocarbon (Rigzone, 2014).
Figure 5-3 illustrates the relationship between the gas injection well and the production well.
F igure 5-3. Gas Injection and Production W ell
Source: Rigzone, 2014
In the scenarios that were found in available literature, the dry gas is also used as fuel
onsite for the generators that power the reinjection pumps. Therefore, the costs associated with
the process are mainly initial capital costs. No published information was obtained on the capital
and annual costs for these operations.
Figure 5-4 presents a fully implemented gas injection project scheme. In this scheme,
associated gas from an oil well (or natural gas from a gas well) is processed through a gas
cycling facility (GCF) where recoverable NGLs are separated from methane and the resulting
methane is either used for onsite power generation or re-injected in to the formation.

37
F igure 5-4. Gas Cycling Facility Project F low
The literature that was reviewed evaluated gas reinjection projects only from the
perspective of an enhanced oil recovery opportunity and did not specifically discuss the quantity
or percentage of associated gas emissions that were eliminated through the process. The EPA is
not aware of literature that discusses the efficacy of mitigating associated gas emissions using the
natural gas reinjection process. The efficacy would be highly dependent on many factors, which
include the composition value of the gas and the availability of transmission infrastructure.
Further, because the use of this process to reduce associated gas emissions in conjunction with
oil recovery is an emerging technology, the prevalence of use in the industry and estimated cost
to implement the process is unknown to the EPA.
38
5.5.3 Electricity Generation for Use Onsite
As discussed above, associated gas can be used for generation of electrical power to be
used onsite. The EERC study stated that power generation technologies would need to be
designed to match the variable wellhead gas flow rates and gas quality, and would need to be
constructed for mobility. The EERC study discussed previously also looked at options for use of
associated gas for power generation. The EERC study included an evaluation of several
technologies fired by natural gas both for grid support (i.e., power generation for direct delivery
onto the electric grid) and local power (i.e., power generation for local use with excess
generation, if any, sent to the electrical grid). This study provides one of the most comprehensive
and recent evaluations of the economics of use of associated gas for electric generation.
Therefore, the case study results of this study are used to discuss the cost of this technology for
this paper.
Although grid support is potentially a viable use for this gas, it is not considered to be an
emissions reduction technology for the purposes of this paper. Grid support requires an
infrastructure similar in scope as that needed to bring gas to market. The focus of this section of
the paper is on the venting or flaring of associated gas due to the lack of infrastructure to bring it
to market. It is unlikely that a well site that is lacking pipeline infrastructure would have access
to the necessary infrastructure to provide grid support. Therefore, the focus here is on the use of
the gas at the local level, either directly at the wellpad or in an immediate oilfield region to
support local activities. The benefits of using associated gas to provide electricity for these
activities are both reducing the quantity of gas vented and reducing the quantity of other types of
fuel used (e.g., diesel).
The EERC study considered a local power project to be wellhead gas (with limited
cleanup) being piped to an electrical generator that produces electricity which is first used to
power local consumption (e.g., well pad, group of wells, or an oilfield) with any excess
electricity put on the electrical grid for distribution by the local utility to its customers. These
projects can range widely in scale, depending on the goal of the project (i.e., satisfy only local
load, satisfy local load with minimal excess generation, or satisfy local load with significant

39
excess generation). The study evaluated two power generation scenarios: reciprocating engine
and a microturbine.
The first step in using associated gas for electric generation is removal of NGLs from the
rich gas. Removal of the NGLs significantly increases the performance of the genset and reduces
the loss of resource (when flaring is necessary). According to the EERC study, removal of NGLs
such as butane and some propane could be accomplished using a low temperature separation
process. The study found that small, modular configurations of these types of systems are not
widely available. The estimated capital cost for the NGL removal and storage system is
$2,500,000. This capital cost includes the necessary compression to take the rich gas from the
heater/treater at 35 psi up to 200 - 1000 psi delivered to the NGL removal system as well as the
cost for four 400-bbl NGL storage tanks (EERC, 2013). The study authors considered NGL
recovery a valuable first step; however, they also stated that it was not necessary in all
circumstances.
The study made certain assumptions about the flow of associated gas from the wellhead
and fuel consumption of the respective electrical generator for the case study. Table 5-4
summarizes the assumed wellhead gas flow for the case study. Figure 5-5 shows a block flow
diagram of an example NGL removal system.
Table 5-4. Summary of W ellhead Gas F low and Product Volume Assumptions
Scenario Rich Gas
F low, Mcf/day N G Ls Produced,
gallons/day L ean Gas
Produced, M cf/day
Reciprocating Engine 600 2,400 510
Microturbine 600 2,400 510 Source Table 33, E E R C 2013
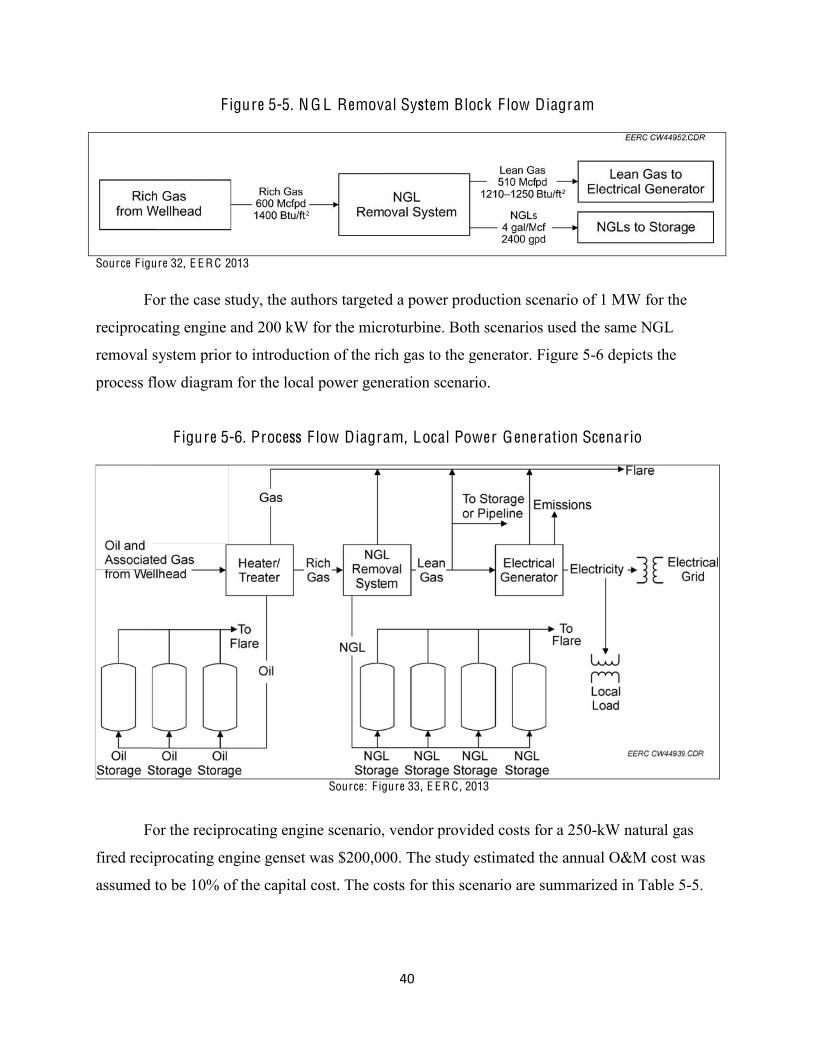
40
F igure 5-5. N G L Removal System Block F low Diagram
Source F igure 32, E E R C 2013
For the case study, the authors targeted a power production scenario of 1 MW for the
reciprocating engine and 200 kW for the microturbine. Both scenarios used the same NGL
removal system prior to introduction of the rich gas to the generator. Figure 5-6 depicts the
process flow diagram for the local power generation scenario.
F igure 5-6. Process F low Diagram, Local Power G eneration Scenario
Source: F igure 33, E E R C , 2013
For the reciprocating engine scenario, vendor provided costs for a 250-kW natural gas
fired reciprocating engine genset was $200,000. The study estimated the annual O&M cost was
assumed to be 10% of the capital cost. The costs for this scenario are summarized in Table 5-5.

41
Table 5-5. Total Cost Summary - Reciprocating Engine Scenario
Capital Cost Annual Cost
NGL Removal and Storage System $2,500,000 $250,000
Electrical Generator System $200,000 $20,000
All Other Infrastructure $500,000
Total Capital Cost $3,200,000 $270,000
Source Table 38, E E R C 2013
For the microturbine scenario, the authors chose to analyze a four, 65 kW microturbine
package rated to provide approximately 195 kW of power. This scenario also involved the
removal of NGLs prior to delivery of gas to the microturbine and the use of generated electricity
to satisfy local electrical demand, with the excess electricity delivered to the grid. The authors
noted that the volume of gas generated from the wellhead(s) will determine the size of the system
needed and that a range of generation scales should be considered for optimum performance. The
process flow for this scenario is the same as shown above in Figure 5-6.
The NGL removal system is likely to be much larger in processing capacity than the
electrical generation system. Generally, the NGL removal system will be most economical only
at the higher-gas-producing wells. The microturbine package evaluated consumed less than 100
Mcf/day, which meant that excess gas would either need to be flared or the project must be
designed to store the excess gas for sale to the pipeline. In the scenarios described here, the
authors assumed that the excess lean gas is sold.
For the microturbine system analyzed, the vendors offered a factory protection plan
(FPP) that covers all scheduled and unscheduled maintenance of the system as well as parts,
the annual O&M cost of the system and, in both scenarios presented below, it is assumed that the
FPP is purchased (EERC, 2013). Table 5-6 summarizes the capital and annual O&M costs for
the microturbine system, as well as the NGL recovery system discussed above.
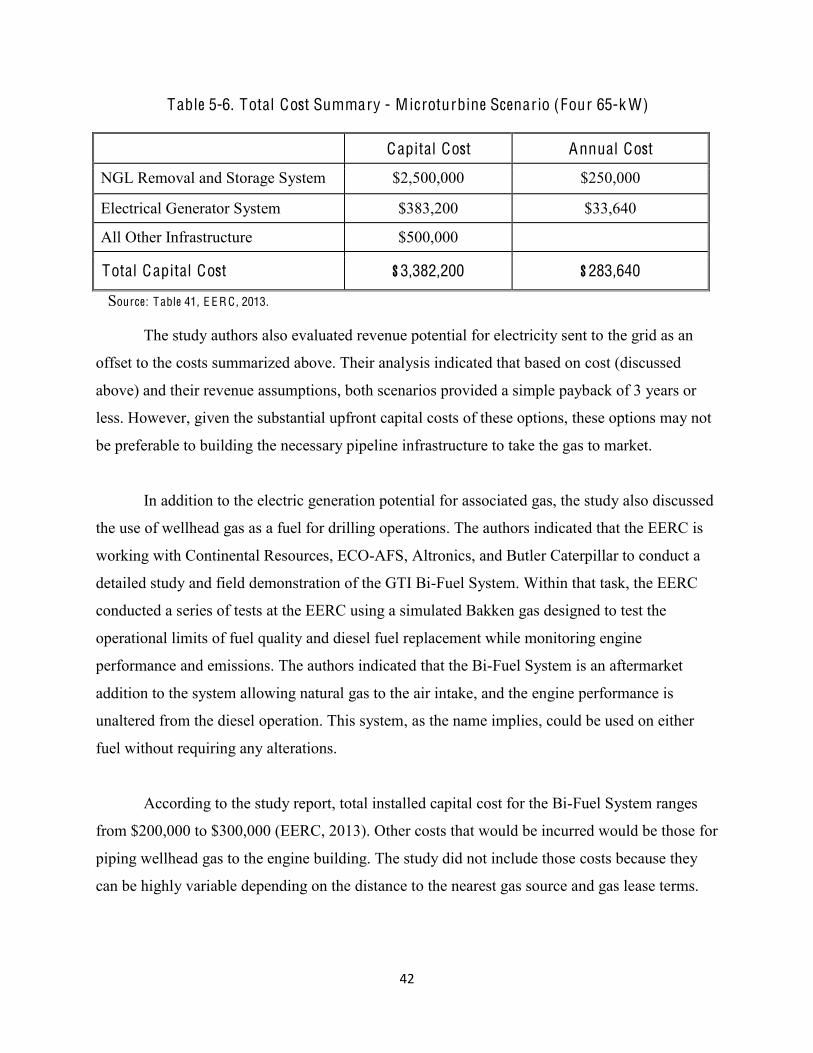
42
Table 5-6. Total Cost Summary - Microturbine Scenario (Four 65-k W)
Capital Cost Annual Cost
NGL Removal and Storage System $2,500,000 $250,000
Electrical Generator System $383,200 $33,640
All Other Infrastructure $500,000
Total Capital Cost $3,382,200 $283,640
Source: Table 41, E E R C , 2013.
The study authors also evaluated revenue potential for electricity sent to the grid as an
offset to the costs summarized above. Their analysis indicated that based on cost (discussed
above) and their revenue assumptions, both scenarios provided a simple payback of 3 years or
less. However, given the substantial upfront capital costs of these options, these options may not
be preferable to building the necessary pipeline infrastructure to take the gas to market.
In addition to the electric generation potential for associated gas, the study also discussed
the use of wellhead gas as a fuel for drilling operations. The authors indicated that the EERC is
working with Continental Resources, ECO-AFS, Altronics, and Butler Caterpillar to conduct a
detailed study and field demonstration of the GTI Bi-Fuel System. Within that task, the EERC
conducted a series of tests at the EERC using a simulated Bakken gas designed to test the
operational limits of fuel quality and diesel fuel replacement while monitoring engine
performance and emissions. The authors indicated that the Bi-Fuel System is an aftermarket
addition to the system allowing natural gas to the air intake, and the engine performance is
unaltered from the diesel operation. This system, as the name implies, could be used on either
fuel without requiring any alterations.
According to the study report, total installed capital cost for the Bi-Fuel System ranges
from $200,000 to $300,000 (EERC, 2013). Other costs that would be incurred would be those for
piping wellhead gas to the engine building. The study did not include those costs because they
can be highly variable depending on the distance to the nearest gas source and gas lease terms.
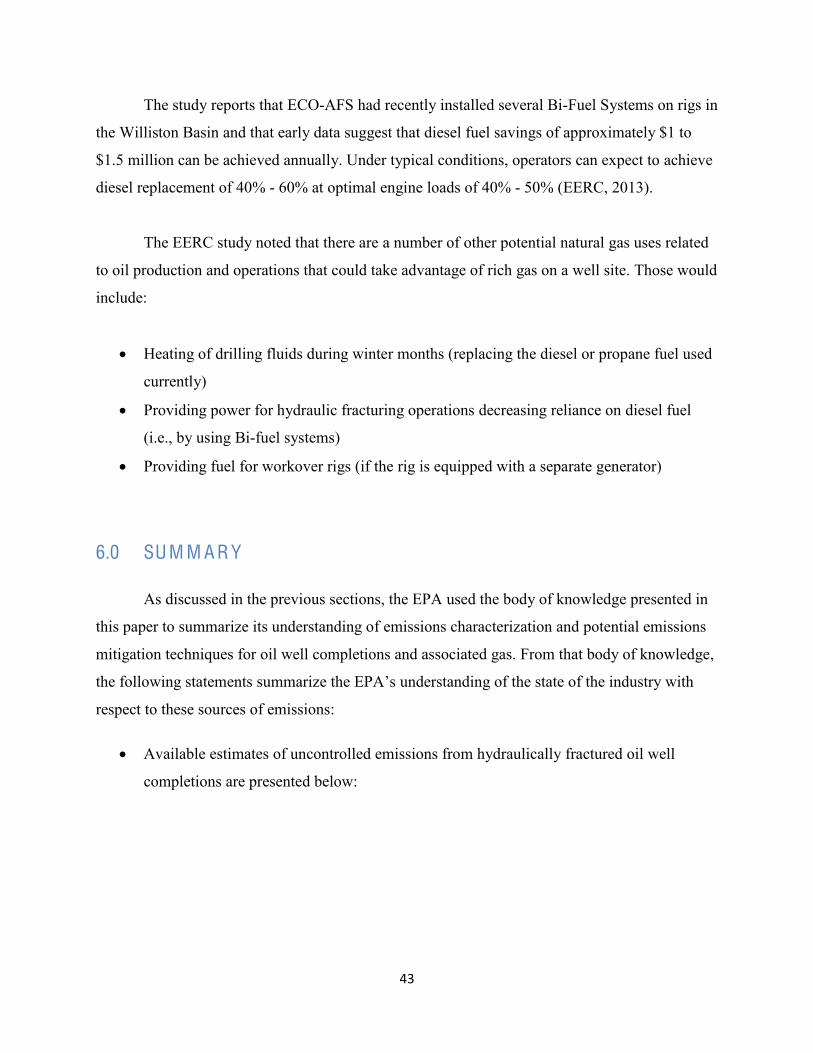
43
The study reports that ECO-AFS had recently installed several Bi-Fuel Systems on rigs in
the Williston Basin and that early data suggest that diesel fuel savings of approximately $1 to
$1.5 million can be achieved annually. Under typical conditions, operators can expect to achieve
diesel replacement of 40% - 60% at optimal engine loads of 40% - 50% (EERC, 2013).
The EERC study noted that there are a number of other potential natural gas uses related
to oil production and operations that could take advantage of rich gas on a well site. Those would
include:
Heating of drilling fluids during winter months (replacing the diesel or propane fuel used
currently)
Providing power for hydraulic fracturing operations decreasing reliance on diesel fuel
(i.e., by using Bi-fuel systems)
Providing fuel for workover rigs (if the rig is equipped with a separate generator)
6.0 SU M M A R Y
As discussed in the previous sections, the EPA used the body of knowledge presented in
this paper to summarize its understanding of emissions characterization and potential emissions
mitigation techniques for oil well completions and associated gas. From that body of knowledge,
the following understanding of the state of the industry with
respect to these sources of emissions:
Available estimates of uncontrolled emissions from hydraulically fractured oil well
completions are presented below:
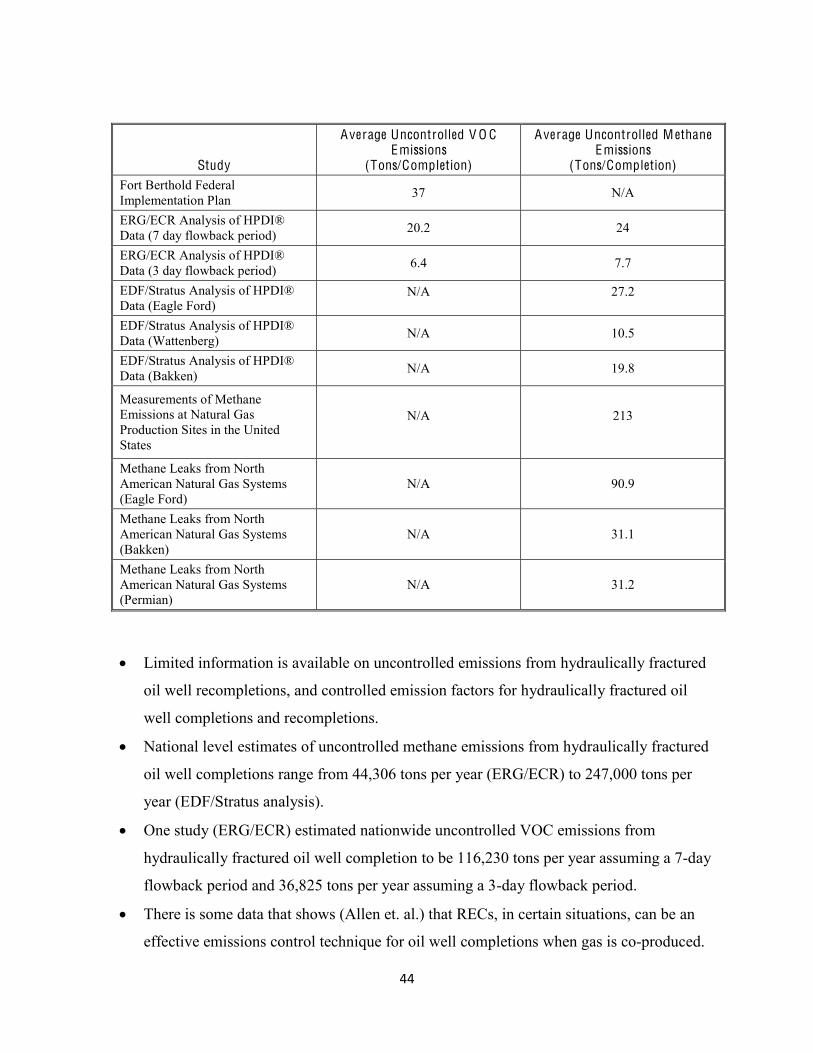
44
Study
Average Uncontrolled V O C Emissions
(Tons/Completion)
Average Uncontrolled M ethane Emissions
(Tons/Completion) Fort Berthold Federal Implementation Plan 37 N/A
ERG/ECR Analysis of HPDI® Data (7 day flowback period) 20.2 24
ERG/ECR Analysis of HPDI® Data (3 day flowback period) 6.4 7.7
EDF/Stratus Analysis of HPDI® Data (Eagle Ford)
N/A 27.2
EDF/Stratus Analysis of HPDI® Data (Wattenberg) N/A 10.5
EDF/Stratus Analysis of HPDI® Data (Bakken) N/A 19.8
Measurements of Methane Emissions at Natural Gas Production Sites in the United States
N/A 213
Methane Leaks from North American Natural Gas Systems (Eagle Ford)
N/A 90.9
Methane Leaks from North American Natural Gas Systems (Bakken)
N/A 31.1
Methane Leaks from North American Natural Gas Systems (Permian)
N/A 31.2
Limited information is available on uncontrolled emissions from hydraulically fractured
oil well recompletions, and controlled emission factors for hydraulically fractured oil
well completions and recompletions.
National level estimates of uncontrolled methane emissions from hydraulically fractured
oil well completions range from 44,306 tons per year (ERG/ECR) to 247,000 tons per
year (EDF/Stratus analysis).
One study (ERG/ECR) estimated nationwide uncontrolled VOC emissions from
hydraulically fractured oil well completion to be 116,230 tons per year assuming a 7-day
flowback period and 36,825 tons per year assuming a 3-day flowback period.
There is some data that shows (Allen et. al.) that RECs, in certain situations, can be an
effective emissions control technique for oil well completions when gas is co-produced.

45
However, there may be a combination of well pressure and gas content below which
RECs are not technically feasible at co-producing oil wells.
Some oil well completions are controlled using RECs; however, national data on the
number of completions that are controlled using a REC are not available.
understanding that most oil well completion emissions are controlled with combustion;
however, data on an average percentage are not available. Likewise, data are not
available on the percentage of oil wells nation-wide that vent completion emissions to the
atmosphere.
Other gas conserving technologies are being investigated for use in completions and for
control of associated gas emissions. These include gas reinjection, NGL recovery and use
of the gas for power generation for local use. Some studies have evaluated the economics
of some of these technologies and determined, in some cases, they can result in net
savings to the operator depending on the value of the recovered gas or liquids or the value
of the power generated. However, some barriers exist with respect to technology
availability and application of the technology to varying scales of oil well gas production.
In addition, costs vary for implementing some of these technologies.
7.0 C H A R G E Q U EST I O NS F O R R E V I E W E RS
1. Please comment on the national estimates and per well estimates of methane and VOC
emissions from hydraulically fractured oil well completions presented in this paper. Are there
factors that influence emissions from hydraulically fractured oil well completions that were
not discussed in this paper?
2. Most available information on national and per well estimates of emissions is on
uncontrolled emissions. What information is available for emissions, or what methods can be
used to estimate net emissions from uncontrolled emissions data, at a national and/or at a per
well level?
3. Are further sources of information available on VOC or methane emissions from
hydraulically fractured oil well completions beyond those described in this paper?

46
4. Please comment on the various approaches to estimating completion emissions from
hydraulically fractured oil wells in this paper.
Is it appropriate to estimate average uncontrolled oil well completion emissions by using
the annual average daily gas production during the first year and multiplying that value
by the duration of the average flowback period?
Is it appropriate to estimate average uncontrolled oil well completion emissions using
and multiplying by the flowback
period?
Is it appropriate to estimate average uncontrolled oil well completion emissions by
increasing emissions linearly over the first nine days until the peak rate is reached
(normally estimated using the production during the first month converted to a daily rate
of production)?
Is the use of a 3-day or 7-day flowback period for hydraulically fractured oil wells
appropriate?
5. Please discuss other methodologies or data sources that you believe would be appropriate for
estimating hydraulically fractured oil well completion emissions.
6. Please comment on the methodologies and data sources that you believe would be
appropriate to estimate the rate of recompletions of hydraulically fractured oil wells. Can
data on recompletions be used that does not differentiate between conventional oil wells and
hydraulically fractured oil wells be reasonably used to estimate this rate? For example, in the
GHG Inventory, a workover rate of 6.5% is applied to all oil wells to estimate the number of
workovers in a given year, and in the ERG/ECR analysis above a rate of 0.5% is developed
based on both wells with and without hydraulic fracturing. Would these rates apply to
hydraulically fractured oil wells? For hydraulically fractured gas wells, the GHG Inventory
uses a refracture rate of 1%. Would this rate be appropriate for hydraulically fractured oil
wells?
7. Please comment on the feasibility of the use of RECs or completion combustion devices
during hydraulically fractured oil well completion operations. Please be specific to the types
of wells where these technologies or processes are feasible. Some characteristics that should
be considered in your comments are well pressure, gas content of flowback, gas to oil ratio

47
(GOR) of the well, and access to infrastructure. If there are additional factors, please discuss
those. For example, the Colorado Oil and Gas Conservation Commission requires RECs only
oil and gas wells where reservoir pressure, formation productivity and wellbore
conditions are likely to enable the well to be capable of naturally flowing hydrocarbon gas in
flammable or greater concentrations at a stabilized rate in excess of five hundred (500)
MCFD to the surface against an induced surface backpressure of five hundred (500) psig or
sales line pressure, whichever is greater. 15
8. Please comment on the costs for the use of RECs or completion combustion devices to
control emissions from hydraulically fractured oil well completions.
9. Please comment on the emission reductions that RECs and completion combustion devices
achieve when used to control emissions from hydraulically fractured oil well completions.
10. Please comment on the prevalence of the use of RECs or completion combustion devices
during hydraulically fractured oil well completion and recompletion operations. Are you
aware of any data sources that would enable estimating the prevalence of these technologies
nationally?
11. Did the EPA correctly identify all the available technologies for reducing gas emissions from
hydraulically fractured oil well completions or are there others?
12. Please comment on estimates of associated gas emissions in this paper, and on other
available information that would enable estimation of associated gas emissions from
hydraulically fractured oil wells at the national- and the well-level.
13. Please comment on availability of pipeline infrastructure in hydraulically fractured oil
formations. Do all tight oil plays (e.g., the Permian Basin and the Denver-Julesberg Basin)
have a similar lack of infrastructure that results in the flaring or venting of associated gas?
14. Did the EPA correctly identify all the available technologies for reducing associated gas
emissions from hydraulically fractured oil wells or are there others? Please comment on the
15 Colorado Department of Natural Resources: Oil and Gas Conservation Commission Rule 805.b(3)A. (http://cogcc.state.co.us/)

48
costs of these technologies when used for controlling associated gas emissions from
hydraulically fractured oil wells. Please comment on the emissions reductions achieved when
these technologies are used for controlling associated gas emissions from hydraulically
fractured oil wells.
15. Are there ongoing or planned studies that will substantially improve the current
understanding of VOC and methane emissions from hydraulically fractured oil well
completions and associated gas and available options for increased product recovery and
emission reductions?
8.0 R E F E R E N C ES
Booz Allen Hamilton, Wyoming Heritage Foundation. 2008. Oil and Gas Economic Contribution Study. August 2008. Available at http://www.westernenergyalliance.org/wp-content/uploads/2009/05/WYHF_O_G_Economic_Study_FINAL.pdf.
Brandt, A.R., et al. 2014a. Methane Leaks from North American Natural Gas Systems. Science 343, 733 (2014). February 14, 2014. Available at http://www.novim.org/images/pdf/ScienceMethane.02.14.14.pdf.
Brandt, A.R., et al. 2014b. Supplementary Materials for Methane Leaks from North American Natural Gas Systems. Science 343, 733 (2014). February 14, 2014. Available at http://www.novim.org/images/pdf/ScienceSupplement.02.14.14.pdf
Canadian Association of Petroleum Producers (CAAP). 2004. A National Inventory of Greenhouse Gas (GHSP Criteria Air Contaminant (CAC) and Hydrogen Sulfide H2S) Emission by the Upstream Oil and Gas Industry. CAPP Pub. No. 2005-0013.
Ceres, 2013. F laring Up: North Dakota Natural Gas F laring More Than Doubles in Two Years. Salman, Ryan and Logan, Andrew. July 2013.
Colorado Department of Public Health and Environment (CDPE). 2013. APCD 2013 Rulemaking April Stakeholder Meeting, Presentation. April 25, 2013.
EC/R, Incorporated. 2010a. Memorandum to Bruce Moore from Denise Grubert. American Petroleum Institute Meeting Minutes. EC/R, Incorporated. July 2010.
EC/R, Incorporated. 2010b. Memorandum to Bruce Moore from Denise Grubert. SHWEP Site Visit Report. EC/R Incorporated. November 2010.
49
EC/R, Incorporated. 2011a. Memorandum to Bruce Moore from Heather Brown. Composition of Natural Gas for Use in the Oil and Natural Gas Sector Rulemaking. EC/R, Incorporated. June 29, 2011.
EC/R, Incorporated. 2011b. Memorandum to Bruce Moore from Denise Grubert. American Petroleum Institute Meeting Minutes Attachment 1: Review of F ederal Air Regulations for the Oil and Natural Gas Sector 40 C FR Part 60, Subparts KKK and LLL; 40 C FR Part 63 Subparts HH and HHH. EC/R, Incorporated. February 2011.
Energy & Environmental Research Center (EERC). 2013. End-Use Technology Study An Assessment of Alternative Uses for Associated Gas. EERC Center for Oil and Gas, University of North Dakota, Grand Forks, ND.
Environmental Defense Fund (EDF). 2014. Co-Producing Wells as a Major Source of Methane Emissions: A Review of Recent Analyses, March, 2014. Available at http://blogs.edf.org/energyexchange/files/2014/03/EDF-Co-producing-Wells-Whitepaper.pdf. Supplemental materials available at https://www.dropbox.com/s/osrom4w6ewow4ua/EDF-Initial-Production-Cost-Effectiveness-Analysis.xlsx.
Environmental Research Group, Inc. (ERG). 2013. Hydraulically F ractured Oil Well Completions. October 24, 2013 (available as Appendix A).
ICF, International (ICF). 2011. Memorandum to Bruce Moore from ICF Consulting. Percent of Emissions Recovered by Reduced Emission Completions. ICF Consulting. May 2011.
North Dakota Pipeline Authority (NDPA). 2013. North Dakota Natural Gas, A Detailed Look At Natural Gas Gathering. October 21, 2013.
Oil and Gas Journal (OGJ). 2012. Restricting North Dakota gas-flaring would delay oil output, impose costs. November 5, 2012. Available at http://www.ogj.com/articles/print/vol-110/issue-11/drilling-production/restricting-north-dakota-gas-flaring-would.html.
Proceeding of the National Academy of Sciences of the United States of America (PNAS). 2013. Measurement of Methane Emissions at Natural Gas Production Sites in the United States. August 19, 2013. Available at http://www.pnas.org/content/early/2013/09/10/1304880110.abstract.
Railroad Commission of Texas (RRCTX). 2013. Oil Production and Well Counts (1935-2012), History of Texas Initial Crude Oil, Annual Production and Producing Wells. Available at http://www.rrc.state.tx.us/data/production/oilwellcounts.php; and Summary of Drilling, Completion and Plugging Reports Processed for 2012. January 7, 2013. Available at http://www.rrc.state.tx.us/data/drilling/drillingsummary/2012/annual2012.pdf
Rigzone. 2014. How Does Gas Injection Work? Available from http://www.rigzone.com/training/insight.asp?insight_id=345&c_id=4. Accessed March 2014.
State of Colorado Oil & Gas Conservation Commission. (COGCC) 2012, Staff Report. November 15, 2012 available at www.colorado.gov/cogcc.
50
Swindell. 2012. Eagle Ford Shale An Early Look at Ultimate Recovery. SPE 158207. SPE annual Technical Conference and Exhibition held in San Antonio, Texas, USA. Available at http://gswindell.com/sp158207.pdf.
U.S. Energy Information Administration (U.S. EIA). 2010. Annual U.S. Natural Gas Wellhead Price. Energy Information Administration. Natural Gas Navigator. Retrieved December 12, 2010. Available at http://www.eia.doe.gov/dnav/ng/hist/n9190us3a.htm.
U.S. Energy Information Administration (U.S. EIA). 2011. Annual Energy Outlook 2011 and an update on EIA activities. Available at http://www.eia.gov/pressroom/presentations/newell_02082011.pdf.
U.S. Energy Information Administration (U.S. EIA). 2012a. Total Energy Annual Energy Review. Table 6.4 Natural Gas Gross Withdrawals and Natural Gas Well Productivity, Selected Years, 1960 - 2011. (http://www.eia.gov/total energy/data/annual/pdf/sec6_11.pdf).
U.S. Energy Information Administration (U.S. EIA). 2012b. Total Energy Annual Energy Review. Table 5.2 Crude Oil Production and Crude Oil Well Productivity, Selected Years, 1954 - 2011. (http://www.eia.gov/total energy/data/annual/pdf/sec5_9.pdf).
U.S. Energy Information Administration (U.S. EIA). 2013a. Drilling often results in both oil and natural gas production. October, 2013. Available at http://www.eia.gov/todayinenergy/detail.cfm?id=13571.
U.S. Energy Information Administration (U.S. EIA). 2013b. Annual Energy Outlook 2013. Available at http://www.eia.gov/forecasts/aeo/pdf/0383%282013%29.pdf.
U.S. Environmental Protection Agency (U.S. EPA). Air Pollution Control Technology Fact Sheet: FLARES. Clean Air Technology Center.
U.S. Environmental Protection Agency (U.S. EPA). 1991. AP 42, F ifth Edition, Volume I, Chapter 13.5 Industrial F lares. EPA/Office of Air Quality Planning & Standards. 1991.
U.S. Environmental Protection Agency (U.S. EPA). 1996. Methane Emissions from the Natural Gas Industry Volume 2: Technical Report, F inal Report. Gas Research Institute and U.S. Environmental Protection Agency. Washington, DC. June, 1996.
U.S. Environmental Protection Agency (U.S. EPA). 1999. U . S. Methane Emissions 1990-2020: Inventories, Projections, and Opportunities for Reductions. Washington, DC, 1999.
U.S. Environmental Protection Agency (U.S. EPA). 2004. Fact Sheet No. 703: Green Completions. Office of Air and Radiation: Natural Gas Star Program. Washington, DC. September 2004.
U.S. Environmental Protection Agency (U.S. EPA). 2011a. Lessons Learned: Reduced Emissions Completions for Hydraulically F ractured Gas Wells. O ffice of Air and Radiation: Natural Gas Star Program. Washington, DC. 2011. Available at http://epa.gov/gasstar/documents/reduced_emissions_completions.pdf.

51
U.S. Environmental Protection Agency (U.S. EPA). 2011b. Oil and Natural Gas Sector: Standards of Performance for Crude Oil and Natural Gas Production, Transmission, and Distribution. Background Technical Support Document for Proposed Standards. July 2011. EPA-453/R-11002.
U.S. Environmental Protection Agency (U.S. EPA). 2012a. Technical Support Document, F ederal Implementation Plan for Oil and Natural Gas Well Production Facilities; Fort Berthold Indian Reservation (Mandan, Hidatsa, and Arikara Nations), North Dakota. Docket Number: EPA-R08-OAR-2012-0479.
U.S. Environmental Protection Agency (U.S. EPA). 2012b. Oil and Natural Gas Sector: Standards of Performance for Crude Oil and Natural Gas Production, Transmission, and Distribution. Background Supplemental Technical Support Document for Proposed Standards. April 2012.
U.S. Environmental Protection Agency. (U.S. EPA) 2013. Petroleum and Natural Gas Systems: 2012 Data Summary. Greenhouse Gas Reporting Program. October 2013. (http://www.epa.gov/ghgreporting/documents/pdf/2013/documents/SubpartW-2012-Data-Summary.pdf).
U.S. Environmental Protection Agency (U.S. EPA). 2014. Inventory of Greenhouse Gas Emissions and Sinks: 1990-2012. Washington, DC. April 2014. (http://www.epa.gov/climatechange/Downloads/ghgemissions/US-GHG-Inventory-2014-Chapter-3-Energy.pdf).

A -‐ 1
Appendix A
(E R G , 2013)
Memorandum (Draft):
Environmental Research Group, Inc.
Hydraulically Fractured Oil Well Completions.
October 24, 2013

A -‐ 2
T O : David Hendricks, EC/R Incorporated
F R O M : Mike Pring, Eastern Research Group, Inc. (ERG)
Regi Oommen, ERG
D A T E: October 24, 2013
SUBJECT: Hydraulically Fractured Oil Well Completions Eastern Research Group, Inc. (ERG) is currently under contract with EC/R Incorporated to provide technical support under EC/R Work Assignment #1-‐findings relative to Task 2 of the support effort. Specifically, under this task ERG:
Identified wells which were hydraulically fractured in 2011;
Determined which of the hydraulically fractured wells completed in 2011 were oil wells;
Estimated daily associated gas production from the hydraulically fractured oil wells; and
Provided a summary of this information at the national and county level (in Excel spreadsheet
format). Wells Hydraulically Fractured in 2011 Starting with the most recent analysis and files delivered by ERG to the U.S. EPA Office of Compliance, ERG queried DI Desktop, a production database maintained by DrillingInfo, Inc.
covering U.S. oil and natural gas wells, to identify hydraulically fractured oil and gas well completions performed in 2011. This was accomplished using a two-‐step process:
Identification of wells completed in 2011; Identification of wells completed using hydraulic fracturing.
Wells completed in 2011 were identified as those wells meeting one of the following criteria:
DR A F T M E M O R A NDU M

A -‐ 3
The DI Desktop data for the well indicated it was completed in 2011; or The DI Desktop data for the well indicated the well 1st produced in 2011.
While the DI Desktop database is fairly comprehensive in its geographic and temporal coverage of production data, completion date information can lag behind by a year or more afterwards and is not universally available for all areas of the country. Therefore, the list of wells with explicit well completion dates of 2011 was supplemented with those wells having a date (month) of 1st production of either gas or oil in 2011. This methodology is consistent with the methodology used to estimate well completions
Using this approach, 39,262 conventional and unconventional well completions were identified for 2011.
Once the population of wells completed in 2011 was identified, hydraulically fractured wells were identified as those wells meeting either of the following:
Wells completed in a coalbed methane, tight, or shale formation as determined using the DOE
EIA formation type crosswalk; or Wells identified in the DI Desktop database as horizontal wells.
The DOE EIA formation type crosswalk used in this analysis may be found in Attachment A. This methodology is consistent with the methodology used to identify the number of hydraulically fractured
2011 (April 12,
Using this approach, 15,979 hydraulically fractured (or unconventional) well completions were identified for 2011.
Oil Wells Hydraulically Fractured in 2011 Once the population of hydraulically fractured wells completed in 2011 was identified, each well was then classified as either an oil well or a gas well. Gas wells were defined as those wells with an average gas to liquids ratio greater than or equal to 12,500 standard cubic feet per barrel over the lifetime of the well, and oil wells were defined as those wells with an average gas to liquids ratio less than 12,500 standard cubic feet per banalysis does not include produced water. This methodology is consistent with the gas oil ratio methodology used in the 2012 Oil and Natural Gas Sector NSPS development.
Using this approach, 6,169 hydraulically fractured (or unconventional) oil well completions were identified for 2011.

A -‐ 4
Daily Gas Production of Oil Wells Hydraulically Fractured in 2011 Once the population of hydraulically fractured oil wells completed in 2011 was identified, the average daily gas production for each well was calculated based on the cumulative gas production from each well during its first year of production. This information was then averaged at the county-‐level, as well as at the national level. Nationally, the average daily gas production at an oil well that was hydraulically fractured in 2011 was 152 MCF.
Summary Information Table 1 below presents a state-‐level summary of the derived information on hydraulically fractured oil wells completed in 2011. Attachment B contains the same information at the county and national level.
Table 1. Summary of Gas Production at Hydraulically Fractured (or unconventional) Oil Wells
State Number of Counties
Number of Unconventional O il W ell
Completions
Average Associated Gas Production over the 1st year
(M C F /Day) a AR 2 19 110.03 CO 12 1057 95.46 FL 1 1 5.81 KS 3 5 0.80 LA 17 24 111.87 MI 4 7 5.58 MS 1 1 0 MT 13 95 31.21 ND 14 1299 138.14 NM 6 337 114.89 NY 1 19 0 OH 32 214 4.43 OK 14 89 143.62 PA 5 7 78.38 SD 1 2 42.79 TX 88 2855 284.09 WV 5 11 173.15 WY 14 127 48.62 a Determined by taking the total production from the first 12 months of production and dividing by 365 days.
Observations The analysis conducted under this task was performed in accordance with the procedures described above. With respect to qualitative observations made while implementing these procedures, ERG notes the following:

A -‐ 5
In some instances, the date (month) of 1st production only included oil production, with no
corresponding gas production recorded for that month; In some instances, there were months within the 1st year of production where there was no
production (of oil, gas, or both) recorded for the well; For 415 oil wells hydraulically fractured and completed in 2011, there was no gas production
reported for the well during the 1st year of production. The net effect of these situations is that the average daily gas production values may be skewed low, for example, due to a well being shut in for some period of time after initially being brought into production. In the case of the 415 wells where there was no gas production reported for the well during the 1st year of production, summary data is presented in Attachment B excluding these records. This data is
t, which shows an average daily gas production of 152 (MCF/day) for all records, and an average daily gas production of 189 (MCF/day) when including only those records with some gas production.

A -‐ 6
Attachment A: DOE EIA Formation Type Crosswalk
(Formation C rosswalk-Memo Counts 2012 08 28_F rom E C R .xlsx)

A -‐ 7
Attachment B: National and County-‐level Summary of Average Daily Gas Production from
Hydraulically Fractured Oil Well Completions in 2011
(Task 2 Summary.xlsx)
UNCONVENTIONAL OIL COUNTY WITH ZERO FIPS_ CODE
STATE_ ABBR
COUNTY_NAME
NUMBER_UNCONVENTIONAL_OIL_WELL_COMPLETIONS
AVG_ASSOCIATED_GAS_MCF_PER_DAY
05027 AR Columbia 17 220.06
05139 AR Union 2 -‐
08001 CO Adams 8 75.81
08005 CO Arapahoe 1 100.28
08013 CO Boulder 4 173.39
08014 CO Broomfield 12 194.15
08043 CO Fremont 4 15.34
08057 CO Jackson 1 281.19
08069 CO Larimer 14 24.35
08077 CO Mesa 1 0.43
08081 CO Moffat 2 73.42
08087 CO Morgan 1 14.65
08103 CO Rio Blanco 3 62.57
08123 CO Weld 1006 129.94
12087 FL Monroe 1 5.81
20073 KS Greenwood 1 -‐
20097 KS Kiowa 1 -‐
20125 KS Montgomery 3 2.40
22009 LA Avoyelles 2 1.12

A -‐ 8
FIPS_ CODE
STATE_ ABBR
COUNTY_NAME
NUMBER_UNCONVENTIONAL_OIL_WELL_COMPLETIONS
AVG_ASSOCIATED_GAS_MCF_PER_DAY
22011 LA Beauregard 1 141.90
22015 LA Bossier 1 -‐
22017 LA Caddo 2 5.65
22019 LA Calcasieu 1 -‐
22023 LA Cameron 1 77.58
22027 LA Claiborne 3 1.56
22037 LA East Feliciana 1
23.45
22047 LA Iberville 1 68.21
22075 LA Plaquemines 1 44.28
22079 LA Rapides 1 6.08
22091 LA St. Helena 1 77.15
22097 LA St. Landry 3 44.34
22101 LA St. Mary 1 10.77
22111 LA Union 1 5.58
22119 LA Webster 1 1,382.30
22127 LA Winn 2 11.78
26075 MI Jackson 3 22.32
26091 MI Lenawee 2 -‐
26141 MI Presque Isle 1 -‐
26147 MI St. Clair 1 -‐
28063 MS Jefferson 1 -‐
30005 MT Blaine 4 -‐
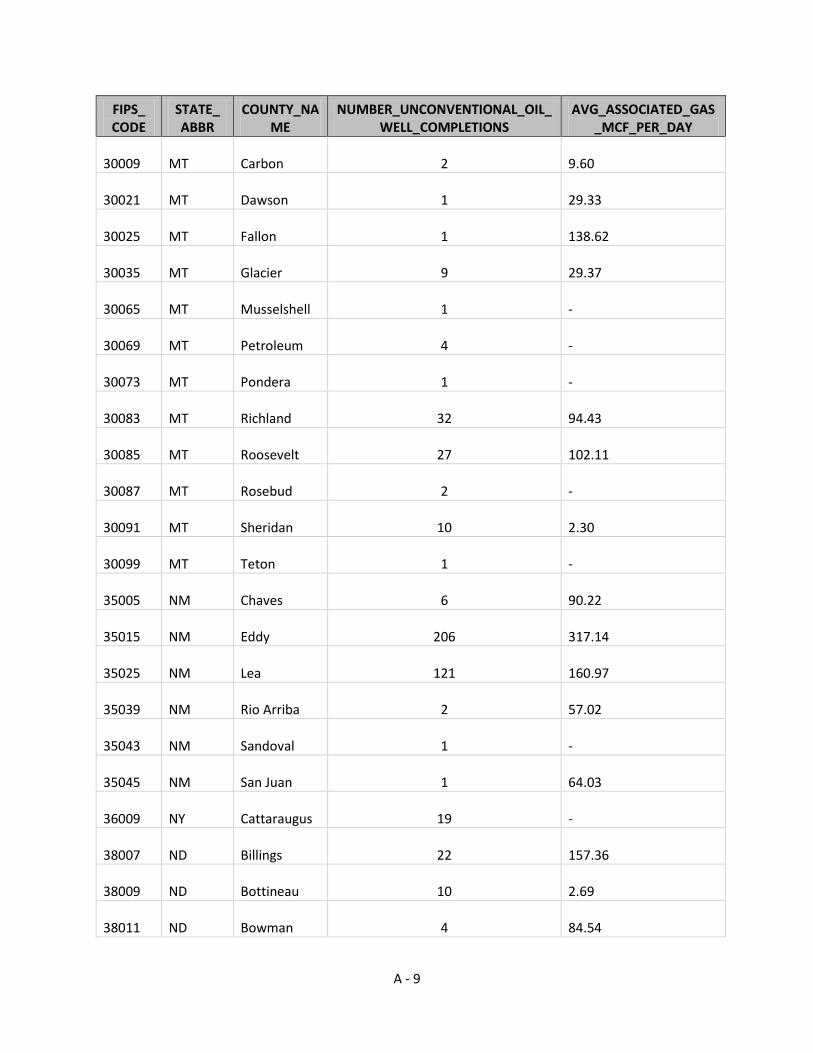
A -‐ 9
FIPS_ CODE
STATE_ ABBR
COUNTY_NAME
NUMBER_UNCONVENTIONAL_OIL_WELL_COMPLETIONS
AVG_ASSOCIATED_GAS_MCF_PER_DAY
30009 MT Carbon 2 9.60
30021 MT Dawson 1 29.33
30025 MT Fallon 1 138.62
30035 MT Glacier 9 29.37
30065 MT Musselshell 1 -‐
30069 MT Petroleum 4 -‐
30073 MT Pondera 1 -‐
30083 MT Richland 32 94.43
30085 MT Roosevelt 27 102.11
30087 MT Rosebud 2 -‐
30091 MT Sheridan 10 2.30
30099 MT Teton 1 -‐
35005 NM Chaves 6 90.22
35015 NM Eddy 206 317.14
35025 NM Lea 121 160.97
35039 NM Rio Arriba 2 57.02
35043 NM Sandoval 1 -‐
35045 NM San Juan 1 64.03
36009 NY Cattaraugus 19 -‐
38007 ND Billings 22 157.36
38009 ND Bottineau 10 2.69
38011 ND Bowman 4 84.54

A -‐ 10
FIPS_ CODE
STATE_ ABBR
COUNTY_NAME
NUMBER_UNCONVENTIONAL_OIL_WELL_COMPLETIONS
AVG_ASSOCIATED_GAS_MCF_PER_DAY
38013 ND Burke 42 83.17
38023 ND Divide 74 144.13
38025 ND Dunn 208 156.73
38033 ND Golden Valley 3
131.73
38053 ND McKenzie 297 355.17
38055 ND McLean 11 102.95
38061 ND Mountrail 329 176.74
38075 ND Renville 2 -‐
38087 ND Slope 1 140.16
38089 ND Stark 28 184.08
38105 ND Williams 268 214.53
39005 OH Ashland 23 -‐
39007 OH Ashtabula 1 20.94
39009 OH Athens 3 2.47
39019 OH Carroll 6 4.31
39029 OH Columbiana 1 6.35
39031 OH Coshocton 8 0.75
39035 OH Cuyahoga 7 12.35
39055 OH Geauga 7 4.13
39067 OH Harrison 3 1.57
39073 OH Hocking 2 -‐
39075 OH Holmes 14 0.23
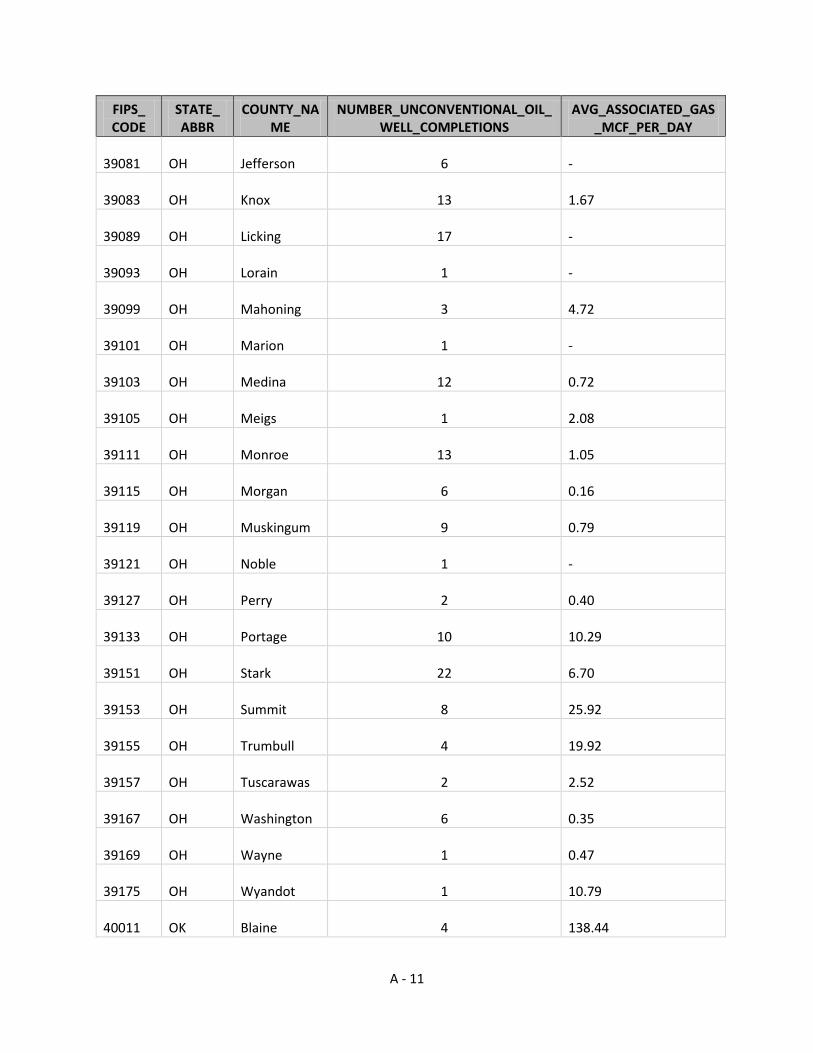
A -‐ 11
FIPS_ CODE
STATE_ ABBR
COUNTY_NAME
NUMBER_UNCONVENTIONAL_OIL_WELL_COMPLETIONS
AVG_ASSOCIATED_GAS_MCF_PER_DAY
39081 OH Jefferson 6 -‐
39083 OH Knox 13 1.67
39089 OH Licking 17 -‐
39093 OH Lorain 1 -‐
39099 OH Mahoning 3 4.72
39101 OH Marion 1 -‐
39103 OH Medina 12 0.72
39105 OH Meigs 1 2.08
39111 OH Monroe 13 1.05
39115 OH Morgan 6 0.16
39119 OH Muskingum 9 0.79
39121 OH Noble 1 -‐
39127 OH Perry 2 0.40
39133 OH Portage 10 10.29
39151 OH Stark 22 6.70
39153 OH Summit 8 25.92
39155 OH Trumbull 4 19.92
39157 OH Tuscarawas 2 2.52
39167 OH Washington 6 0.35
39169 OH Wayne 1 0.47
39175 OH Wyandot 1 10.79
40011 OK Blaine 4 138.44
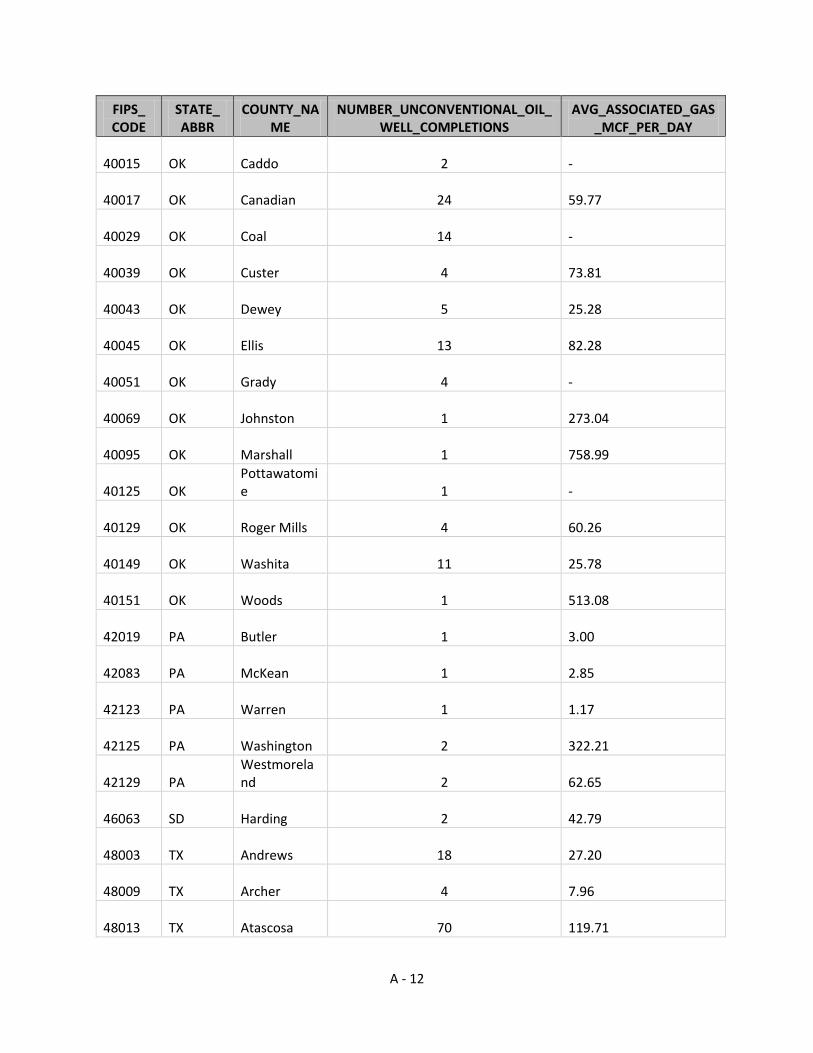
A -‐ 12
FIPS_ CODE
STATE_ ABBR
COUNTY_NAME
NUMBER_UNCONVENTIONAL_OIL_WELL_COMPLETIONS
AVG_ASSOCIATED_GAS_MCF_PER_DAY
40015 OK Caddo 2 -‐
40017 OK Canadian 24 59.77
40029 OK Coal 14 -‐
40039 OK Custer 4 73.81
40043 OK Dewey 5 25.28
40045 OK Ellis 13 82.28
40051 OK Grady 4 -‐
40069 OK Johnston 1 273.04
40095 OK Marshall 1 758.99
40125 OK Pottawatomie 1
-‐
40129 OK Roger Mills 4 60.26
40149 OK Washita 11 25.78
40151 OK Woods 1 513.08
42019 PA Butler 1 3.00
42083 PA McKean 1 2.85
42123 PA Warren 1 1.17
42125 PA Washington 2 322.21
42129 PA Westmoreland 2
62.65
46063 SD Harding 2 42.79
48003 TX Andrews 18 27.20
48009 TX Archer 4 7.96
48013 TX Atascosa 70 119.71

A -‐ 13
FIPS_ CODE
STATE_ ABBR
COUNTY_NAME
NUMBER_UNCONVENTIONAL_OIL_WELL_COMPLETIONS
AVG_ASSOCIATED_GAS_MCF_PER_DAY
48033 TX Borden 1 -‐
48041 TX Brazos 17 88.27
48051 TX Burleson 15 25.89
48055 TX Caldwell 29 -‐
48077 TX Clay 3 75.75
48079 TX Cochran 3 0.73
48097 TX Cooke 99 297.95
48103 TX Crane 19 110.50
48105 TX Crockett 20 151.12
48109 TX Culberson 1 2,500.75
48123 TX DeWitt 145 1,332.05
48127 TX Dimmit 322 379.76
48135 TX Ector 15 12.91
48149 TX Fayette 13 79.71
48151 TX Fisher 2 1.68
48163 TX Frio 72 105.01
48165 TX Gaines 1 3.92
48169 TX Garza 1 -‐
48173 TX Glasscock 19 272.15
48177 TX Gonzales 207 98.80
48181 TX Grayson 4 367.12
48183 TX Gregg 3 23.02
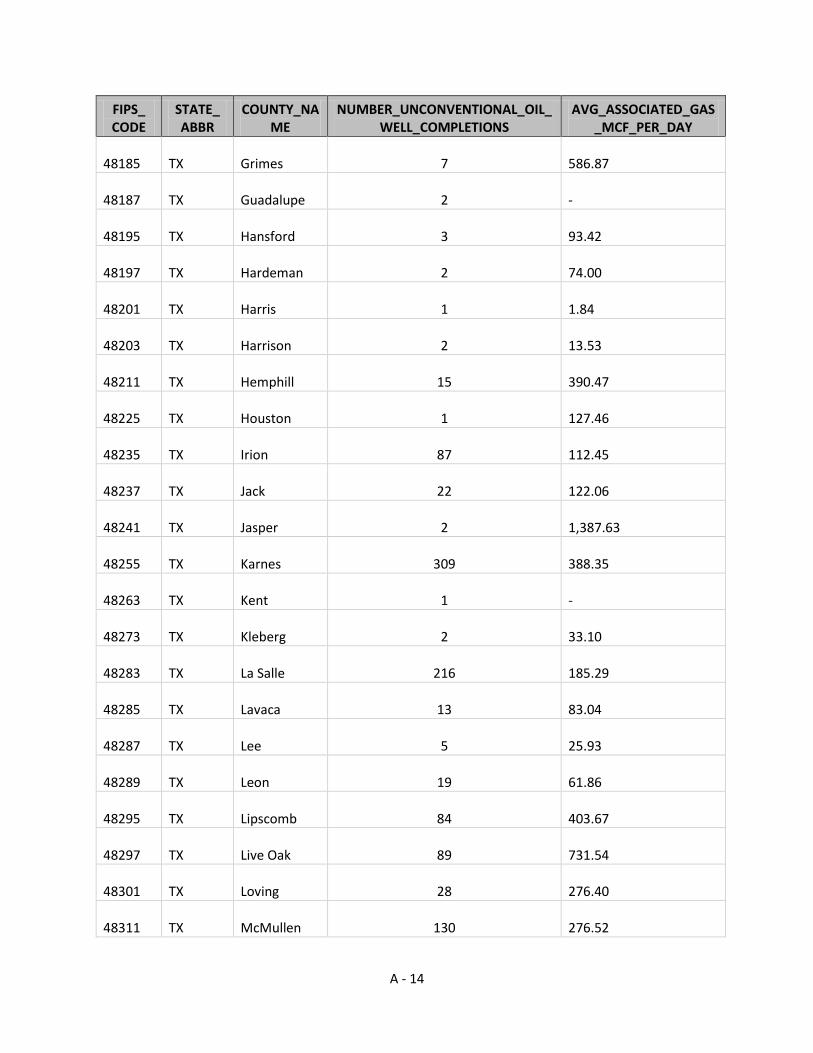
A -‐ 14
FIPS_ CODE
STATE_ ABBR
COUNTY_NAME
NUMBER_UNCONVENTIONAL_OIL_WELL_COMPLETIONS
AVG_ASSOCIATED_GAS_MCF_PER_DAY
48185 TX Grimes 7 586.87
48187 TX Guadalupe 2 -‐
48195 TX Hansford 3 93.42
48197 TX Hardeman 2 74.00
48201 TX Harris 1 1.84
48203 TX Harrison 2 13.53
48211 TX Hemphill 15 390.47
48225 TX Houston 1 127.46
48235 TX Irion 87 112.45
48237 TX Jack 22 122.06
48241 TX Jasper 2 1,387.63
48255 TX Karnes 309 388.35
48263 TX Kent 1 -‐
48273 TX Kleberg 2 33.10
48283 TX La Salle 216 185.29
48285 TX Lavaca 13 83.04
48287 TX Lee 5 25.93
48289 TX Leon 19 61.86
48295 TX Lipscomb 84 403.67
48297 TX Live Oak 89 731.54
48301 TX Loving 28 276.40
48311 TX McMullen 130 276.52

A -‐ 15
FIPS_ CODE
STATE_ ABBR
COUNTY_NAME
NUMBER_UNCONVENTIONAL_OIL_WELL_COMPLETIONS
AVG_ASSOCIATED_GAS_MCF_PER_DAY
48313 TX Madison 21 173.35
48317 TX Martin 1 50.01
48323 TX Maverick 23 110.15
48329 TX Midland 1 12.33
48331 TX Milam 3 34.19
48337 TX Montague 119 362.22
48351 TX Newton 2 2,539.85
48353 TX Nolan 24 20.97
48355 TX Nueces 3 1,746.66
48357 TX Ochiltree 82 261.41
48363 TX Palo Pinto 3 244.63
48365 TX Panola 2 220.47
48367 TX Parker 1 20.61
48371 TX Pecos 8 42.56
48373 TX Polk 4 1,394.01
48383 TX Reagan 15 66.05
48389 TX Reeves 39 184.15
48393 TX Roberts 21 445.09
48395 TX Robertson 15 22.76
48401 TX Rusk 3 5.40
48405 TX San Augustine 1
1,052.92
48413 TX Schleicher 1 171.38

A -‐ 16
FIPS_ CODE
STATE_ ABBR
COUNTY_NAME
NUMBER_UNCONVENTIONAL_OIL_WELL_COMPLETIONS
AVG_ASSOCIATED_GAS_MCF_PER_DAY
48415 TX Scurry 5 84.33
48417 TX Shackelford 1 -‐
48425 TX Somervell 2 1.29
48429 TX Stephens 2 27.98
48433 TX Stonewall 18 0.61
48439 TX Tarrant 1 60.16
48449 TX Titus 1 -‐
48457 TX Tyler 2 1,099.59
48459 TX Upshur 1 49.13
48461 TX Upton 12 3.26
48475 TX Ward 73 375.79
48477 TX Washington 1 276.18
48479 TX Webb 44 874.17
48483 TX Wheeler 60 965.66
48493 TX Wilson 33 36.46
48495 TX Winkler 7 137.90
48497 TX Wise 3 342.57
48503 TX Young 2 -‐
48507 TX Zavala 52 26.70
54001 WV Barbour 1 1.05
54051 WV Marshall 1 782.02
54053 WV Mason 1 1.40
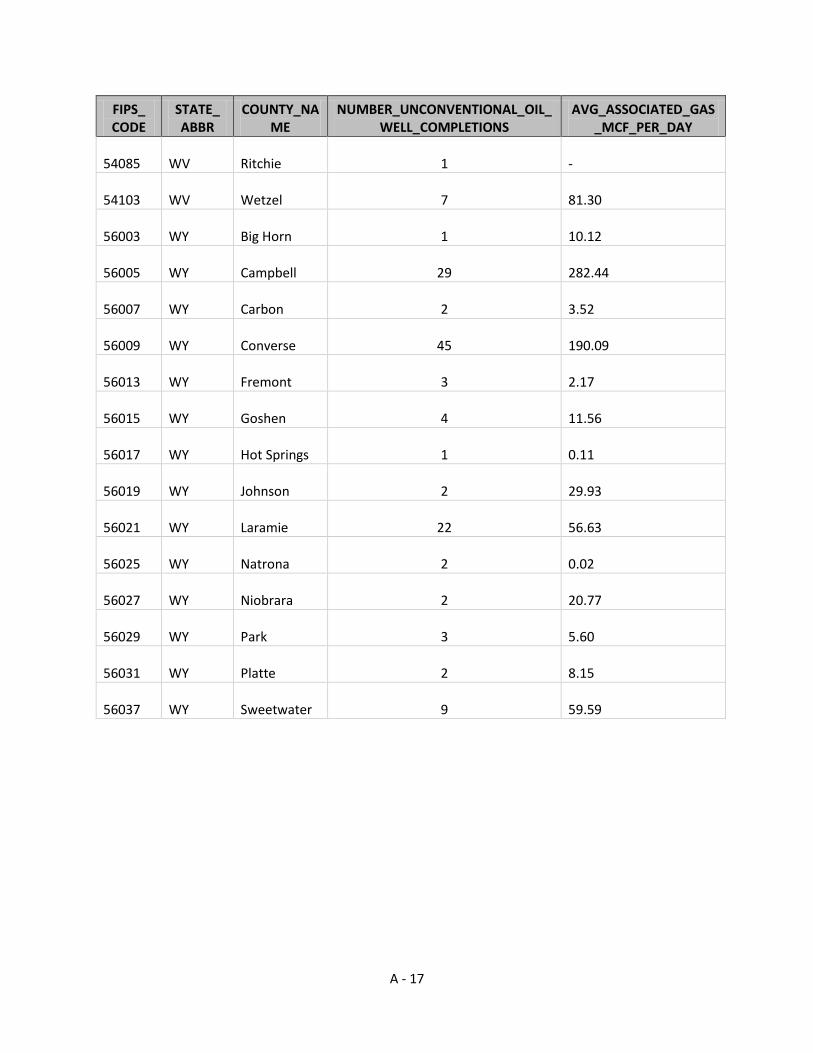
A -‐ 17
FIPS_ CODE
STATE_ ABBR
COUNTY_NAME
NUMBER_UNCONVENTIONAL_OIL_WELL_COMPLETIONS
AVG_ASSOCIATED_GAS_MCF_PER_DAY
54085 WV Ritchie 1 -‐
54103 WV Wetzel 7 81.30
56003 WY Big Horn 1 10.12
56005 WY Campbell 29 282.44
56007 WY Carbon 2 3.52
56009 WY Converse 45 190.09
56013 WY Fremont 3 2.17
56015 WY Goshen 4 11.56
56017 WY Hot Springs 1 0.11
56019 WY Johnson 2 29.93
56021 WY Laramie 22 56.63
56025 WY Natrona 2 0.02
56027 WY Niobrara 2 20.77
56029 WY Park 3 5.60
56031 WY Platte 2 8.15
56037 WY Sweetwater 9 59.59

A -‐ 18
UNCONVENTONAL OIL COUTTY WITHOUT ZERO FIPS_CO
DE STATE_ABBR
COUNTY_ NAME
NUMBER_UNCONVENTIONAL_OIL_WELL_COMPLETIONS
AVG_ASSOCIATED_GAS_MCF_PER_DAY
05027 AR Columbia 17
220.06
08001 CO Adams 8
75.81
08005 CO Arapahoe 1
100.28
08013 CO Boulder 4
173.39
08014 CO Broomfield 12
194.15
08043 CO Fremont 4
15.34
08057 CO Jackson 1
281.19
08069 CO Larimer 14
24.35
08077 CO Mesa 1
0.43
08081 CO Moffat 2
73.42
08087 CO Morgan 1
14.65
08103 CO Rio Blanco 1
187.70
08123 CO Weld 1000
130.72
12087 FL Monroe 1
5.81
20125 KS Montgomery 3
2.40
22009 LA Avoyelles 1
2.24
22011 LA Beauregard 1
141.90
22017 LA Caddo 1
11.31
22023 LA Cameron 1
77.58
22027 LA Claiborne 1
4.67
22037 LA East Feliciana 1
23.45
22047 LA Iberville 1
68.21
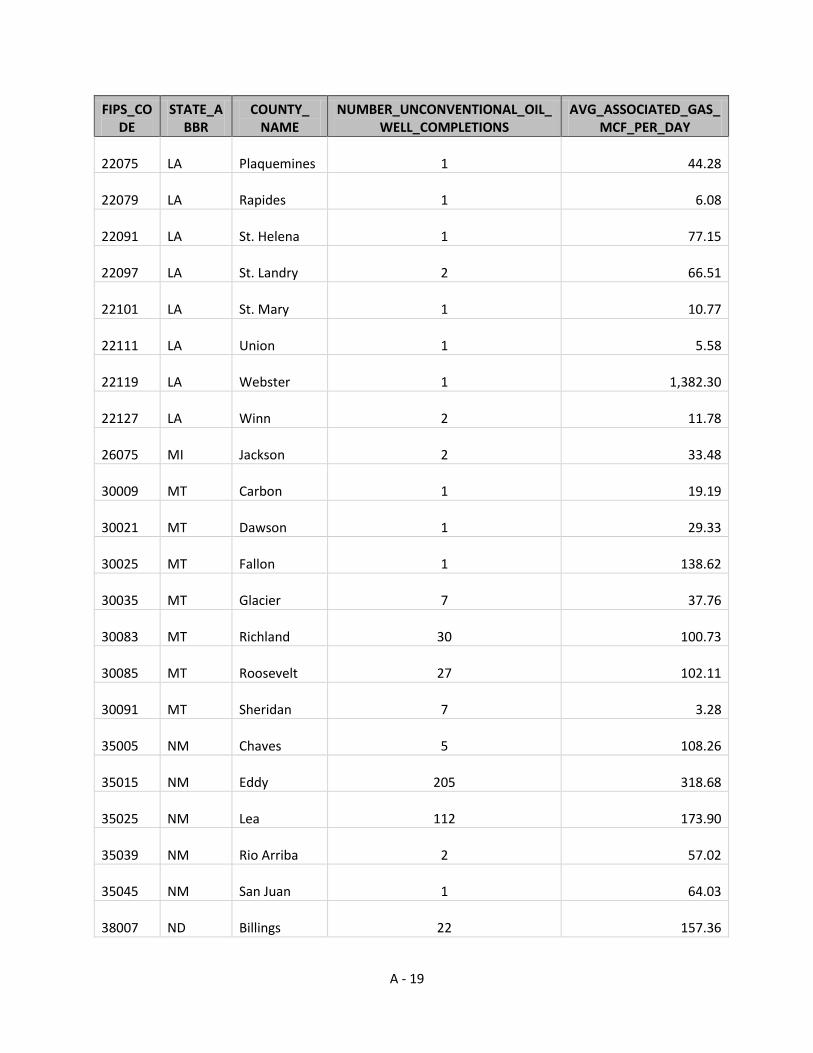
A -‐ 19
FIPS_CODE
STATE_ABBR
COUNTY_ NAME
NUMBER_UNCONVENTIONAL_OIL_WELL_COMPLETIONS
AVG_ASSOCIATED_GAS_MCF_PER_DAY
22075 LA Plaquemines 1
44.28
22079 LA Rapides 1
6.08
22091 LA St. Helena 1
77.15
22097 LA St. Landry 2
66.51
22101 LA St. Mary 1
10.77
22111 LA Union 1
5.58
22119 LA Webster 1
1,382.30
22127 LA Winn 2
11.78
26075 MI Jackson 2
33.48
30009 MT Carbon 1
19.19
30021 MT Dawson 1
29.33
30025 MT Fallon 1
138.62
30035 MT Glacier 7
37.76
30083 MT Richland 30
100.73
30085 MT Roosevelt 27
102.11
30091 MT Sheridan 7
3.28
35005 NM Chaves 5
108.26
35015 NM Eddy 205
318.68
35025 NM Lea 112
173.90
35039 NM Rio Arriba 2
57.02
35045 NM San Juan 1
64.03
38007 ND Billings 22
157.36
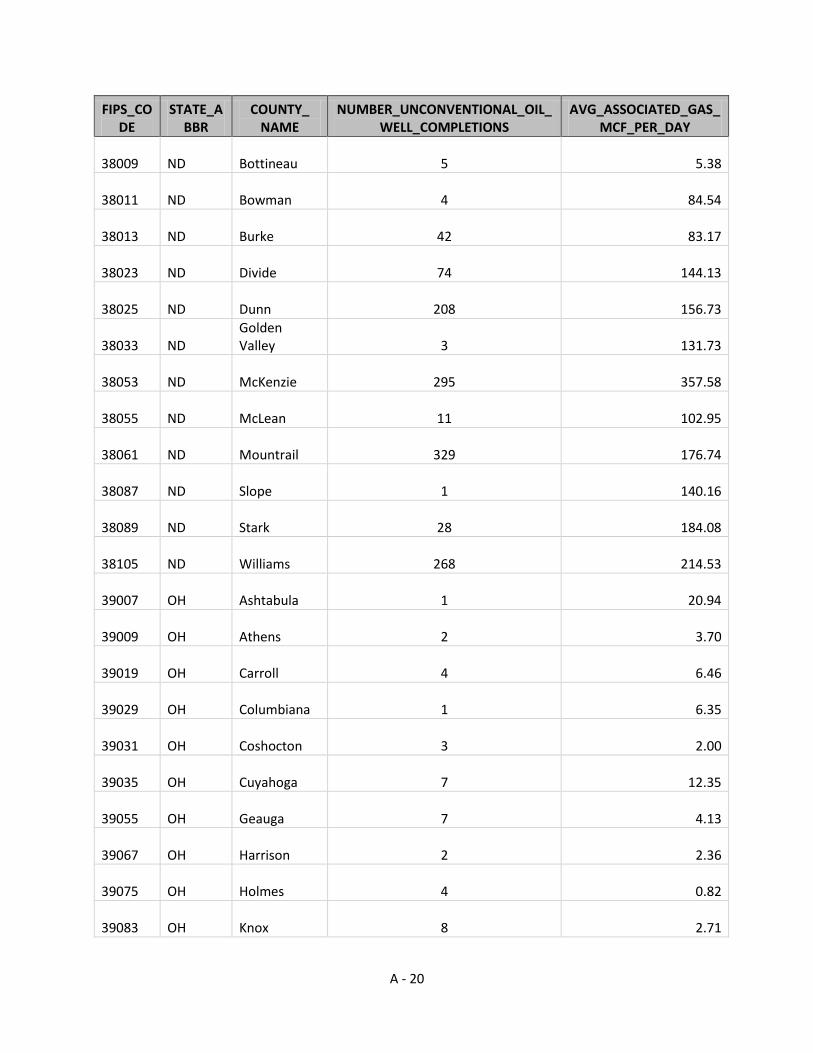
A -‐ 20
FIPS_CODE
STATE_ABBR
COUNTY_ NAME
NUMBER_UNCONVENTIONAL_OIL_WELL_COMPLETIONS
AVG_ASSOCIATED_GAS_MCF_PER_DAY
38009 ND Bottineau 5
5.38
38011 ND Bowman 4
84.54
38013 ND Burke 42
83.17
38023 ND Divide 74
144.13
38025 ND Dunn 208
156.73
38033 ND Golden Valley 3
131.73
38053 ND McKenzie 295
357.58
38055 ND McLean 11
102.95
38061 ND Mountrail 329
176.74
38087 ND Slope 1
140.16
38089 ND Stark 28
184.08
38105 ND Williams 268
214.53
39007 OH Ashtabula 1
20.94
39009 OH Athens 2
3.70
39019 OH Carroll 4
6.46
39029 OH Columbiana 1
6.35
39031 OH Coshocton 3
2.00
39035 OH Cuyahoga 7
12.35
39055 OH Geauga 7
4.13
39067 OH Harrison 2
2.36
39075 OH Holmes 4
0.82
39083 OH Knox 8
2.71
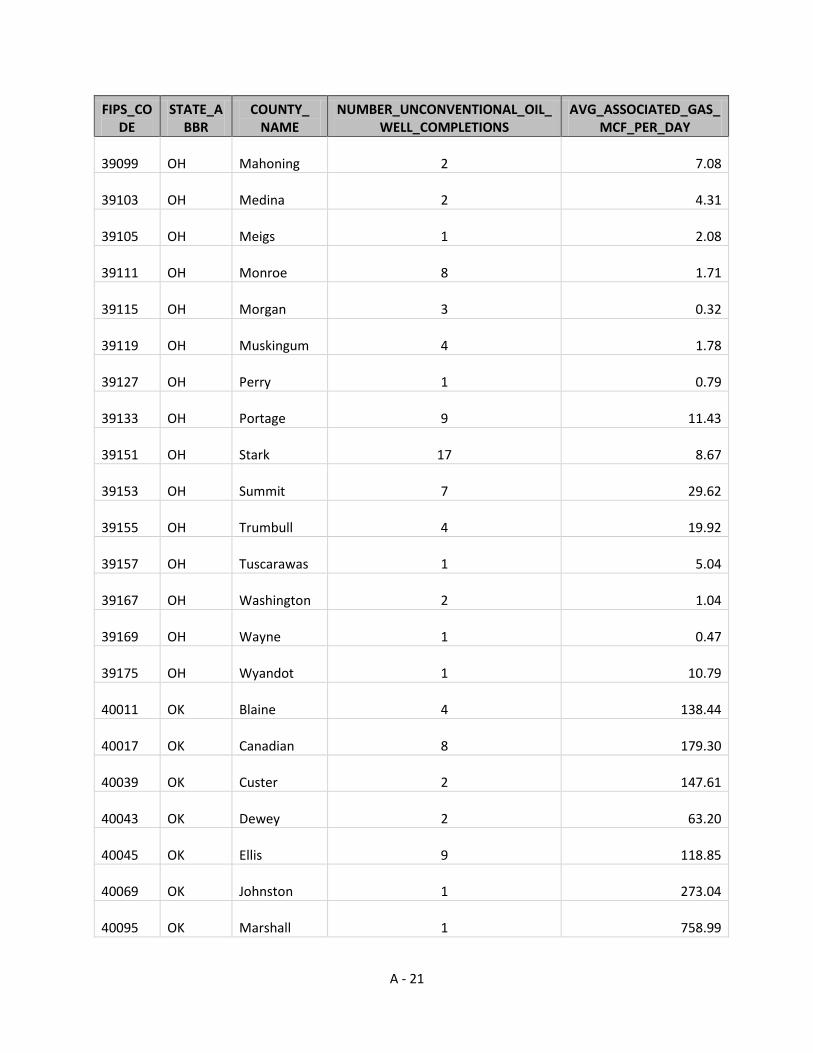
A -‐ 21
FIPS_CODE
STATE_ABBR
COUNTY_ NAME
NUMBER_UNCONVENTIONAL_OIL_WELL_COMPLETIONS
AVG_ASSOCIATED_GAS_MCF_PER_DAY
39099 OH Mahoning 2
7.08
39103 OH Medina 2
4.31
39105 OH Meigs 1
2.08
39111 OH Monroe 8
1.71
39115 OH Morgan 3
0.32
39119 OH Muskingum 4
1.78
39127 OH Perry 1
0.79
39133 OH Portage 9
11.43
39151 OH Stark 17
8.67
39153 OH Summit 7
29.62
39155 OH Trumbull 4
19.92
39157 OH Tuscarawas 1
5.04
39167 OH Washington 2
1.04
39169 OH Wayne 1
0.47
39175 OH Wyandot 1
10.79
40011 OK Blaine 4
138.44
40017 OK Canadian 8
179.30
40039 OK Custer 2
147.61
40043 OK Dewey 2
63.20
40045 OK Ellis 9
118.85
40069 OK Johnston 1
273.04
40095 OK Marshall 1
758.99

A -‐ 22
FIPS_CODE
STATE_ABBR
COUNTY_ NAME
NUMBER_UNCONVENTIONAL_OIL_WELL_COMPLETIONS
AVG_ASSOCIATED_GAS_MCF_PER_DAY
40129 OK Roger Mills 3
80.35
40149 OK Washita 1
283.55
40151 OK Woods 1
513.08
42019 PA Butler 1
3.00
42083 PA McKean 1
2.85
42123 PA Warren 1
1.17
42125 PA Washington 2
322.21
42129 PA Westmoreland 2
62.65
46063 SD Harding 1
85.59
48003 TX Andrews 16
30.60
48009 TX Archer 1
31.86
48013 TX Atascosa 69
121.44
48041 TX Brazos 17
88.27
48051 TX Burleson 6
64.72
48077 TX Clay 3
75.75
48079 TX Cochran 3
0.73
48097 TX Cooke 99
297.95
48103 TX Crane 19
110.50
48105 TX Crockett 19
159.07
48109 TX Culberson 1
2,500.75
48123 TX DeWitt 143
1,350.68
48127 TX Dimmit 317
385.75

A -‐ 23
FIPS_CODE
STATE_ABBR
COUNTY_ NAME
NUMBER_UNCONVENTIONAL_OIL_WELL_COMPLETIONS
AVG_ASSOCIATED_GAS_MCF_PER_DAY
48135 TX Ector 15
12.91
48149 TX Fayette 12
86.35
48151 TX Fisher 2
1.68
48163 TX Frio 58
130.36
48165 TX Gaines 1
3.92
48173 TX Glasscock 19
272.15
48177 TX Gonzales 196
104.35
48181 TX Grayson 3
489.50
48183 TX Gregg 3
23.02
48185 TX Grimes 7
586.87
48195 TX Hansford 3
93.42
48197 TX Hardeman 1
147.99
48201 TX Harris 1
1.84
48203 TX Harrison 1
27.06
48211 TX Hemphill 15
390.47
48225 TX Houston 1
127.46
48235 TX Irion 87
112.45
48237 TX Jack 22
122.06
48241 TX Jasper 2
1,387.63
48255 TX Karnes 303
396.04
48273 TX Kleberg 2
33.10
48283 TX La Salle 214
187.02

A -‐ 24
FIPS_CODE
STATE_ABBR
COUNTY_ NAME
NUMBER_UNCONVENTIONAL_OIL_WELL_COMPLETIONS
AVG_ASSOCIATED_GAS_MCF_PER_DAY
48285 TX Lavaca 13
83.04
48287 TX Lee 3
43.21
48289 TX Leon 16
73.46
48295 TX Lipscomb 82
413.52
48297 TX Live Oak 89
731.54
48301 TX Loving 26
297.66
48311 TX McMullen 125
287.58
48313 TX Madison 20
182.01
48317 TX Martin 1
50.01
48323 TX Maverick 18
140.75
48329 TX Midland 1
12.33
48331 TX Milam 2
51.29
48337 TX Montague 115
374.82
48351 TX Newton 2
2,539.85
48353 TX Nolan 22
22.87
48355 TX Nueces 3
1,746.66
48357 TX Ochiltree 82
261.41
48363 TX Palo Pinto 3
244.63
48365 TX Panola 2
220.47
48367 TX Parker 1
20.61
48371 TX Pecos 8
42.56
48373 TX Polk 4
1,394.01

A -‐ 25
FIPS_CODE
STATE_ABBR
COUNTY_ NAME
NUMBER_UNCONVENTIONAL_OIL_WELL_COMPLETIONS
AVG_ASSOCIATED_GAS_MCF_PER_DAY
48383 TX Reagan 14
70.77
48389 TX Reeves 37
194.11
48393 TX Roberts 21
445.09
48395 TX Robertson 12
28.45
48401 TX Rusk 1
16.21
48405 TX San Augustine 1
1,052.92
48413 TX Schleicher 1
171.38
48415 TX Scurry 5
84.33
48425 TX Somervell 2
1.29
48429 TX Stephens 2
27.98
48433 TX Stonewall 15
0.74
48439 TX Tarrant 1
60.16
48457 TX Tyler 2
1,099.59
48459 TX Upshur 1
49.13
48461 TX Upton 12
3.26
48475 TX Ward 73
375.79
48477 TX Washington 1
276.18
48479 TX Webb 44
874.17
48483 TX Wheeler 59
982.03
48493 TX Wilson 28
42.98
48495 TX Winkler 7
137.90
48497 TX Wise 3
342.57

A -‐ 26
FIPS_CODE
STATE_ABBR
COUNTY_ NAME
NUMBER_UNCONVENTIONAL_OIL_WELL_COMPLETIONS
AVG_ASSOCIATED_GAS_MCF_PER_DAY
48507 TX Zavala 45
30.86
54001 WV Barbour 1
1.05
54051 WV Marshall 1
782.02
54053 WV Mason 1
1.40
54103 WV Wetzel 7
81.30
56003 WY Big Horn 1
10.12
56005 WY Campbell 27
303.36
56007 WY Carbon 1
7.03
56009 WY Converse 45
190.09
56013 WY Fremont 1
6.52
56015 WY Goshen 4
11.56
56017 WY Hot Springs 1
0.11
56019 WY Johnson 2
29.93
56021 WY Laramie 21
59.33
56025 WY Natrona 1
0.03
56027 WY Niobrara 1
41.54
56029 WY Park 3
5.60
56031 WY Platte 2
8.15
56037 WY Sweetwater 8
67.04

A -‐ 27
UNCONVENTIONAL OIL NATIONWIDE NATIONWIDE UNCONVENTIONAL OIL WELL COMPLETIONS (WITH ZERO)
GEOGRAPHIC NUMBER_OF_
STATES NUMBER_OF_ COUNTIES
NUMBER_UNCONVENTIONAL_OI L_WELL_COMPLETIONS
AVG_ASSOCIATED_GAS_ MCF_PER_DAY
NATIONWIDE 18 233 6169 152.19
NATIONWIDE UNCONVENTIONAL OIL WELL COMPLETIONS (WITHOUT ZERO)
GEOGRAPHIC NUMBER_OF_
STATES NUMBER_OF_ COUNTIES
NUMBER_UNCONVENTIONAL_OI L_WELL_COMPLETIONS
AVG_ASSOCIATED_GAS_ MCF_PER_DAY
NATIONWIDE 16 195 5754 189.35