oil exploration and development in the north dakota
TRANSCRIPT
OIL EXPLORATION AND DEVELOPMENT IN THE NORTH DAKOTA WILLISTON BASIN: 1990-1991 UPDATE
by
Thomas J. Heck
MISCELLANEOUS SERIES NO. 77
NORTH DAKOTA GEOLOGICAL SURVEY
John Bluemle, State Geologist
1992

INDUSTRIAL COMMISSION OF NORTH DAKOTA
George A. Sinner Nicholas J. Spaeth SMall Vogel GOVERNOR AtTORNEY GENERAL COMMISSIONER OF AGRICUL1URh
NORTH DAKOTA GEOLOGICAL SURVEY John P. Bluemle, State Geologist
William A. McClellan, Asst. State Geologist
SURVEY STAFF
Richard A. Baker, Drafting Tec1midan Robert F. Bielc,. Geologist Randolph B. Burke, Carbonate Geologist Paul E. Diehl, Geologist LaRae L. Fey, Information Processor Operator Phillip 1.. Greer, Geologist Thomas J. Heclc, Geologist Darby A. Henke, InfortlUltion Processor Operator John W. Hoganson, Paleontologist Kent E. Hollands, Core Library Tec1midan Karen M. Gutenkunst, Business Manager Julie A. LeFever, Geologist/Core Library Director Jim S. Undholm, Data Processing Coordinator Mark R. Luther, Geologist Eula M. Mailloux, Clerk Annette M. Materi, Reaptionist Edward C. Murphy, Environmental GeolOgist Russell D. Prange, Lab Tec1mkian Evie A. Roberson, Administrative Officer
NORTH DAKOTA GEOLOGICAL SURVEY 600 EAST BOULEVARD, BISMARCK ND 58505~840
1992
----
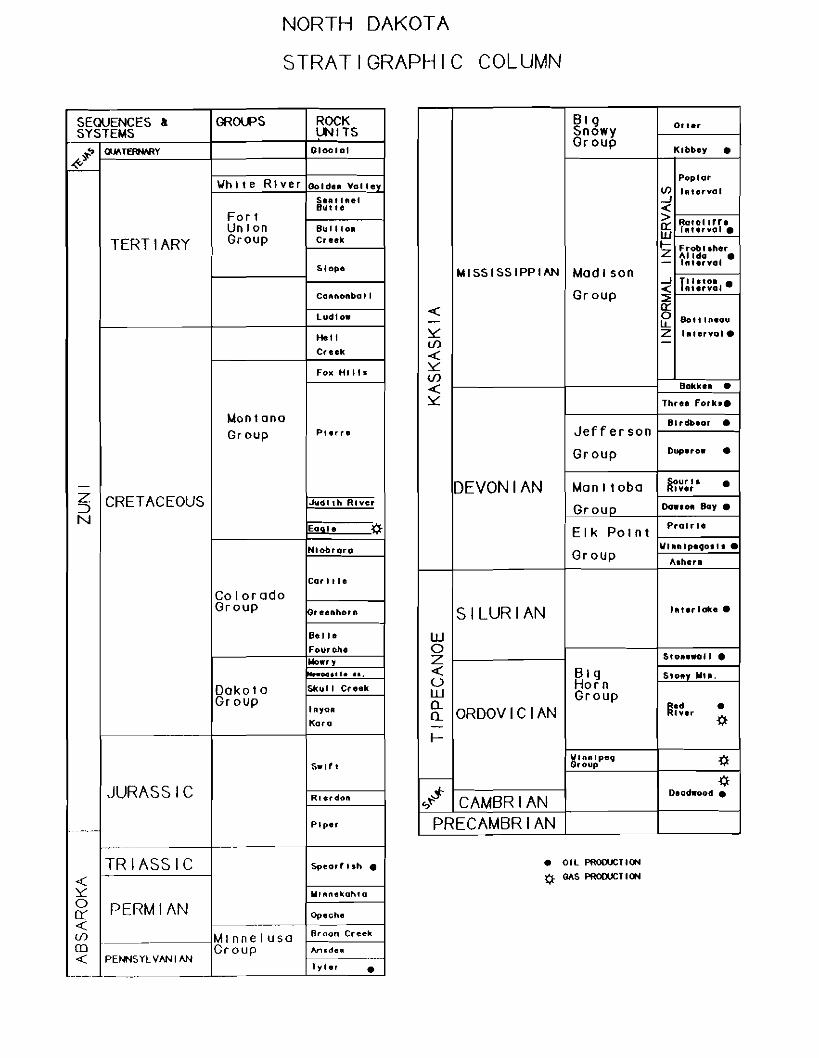
NORTH DAKOTA
STRATIGRAPHIC COLUMN
ROCKGROLPSSEQUENCES l LtlITSSYSTEMS
Oloolal0l.IfITERNARY~.,
.±-\/hlte River Gold... Vallev
SUtlftel Outte
For I BullionUn Ion CreekGroupTERTIARY Slope
Cannonball
ludlow
He" Creek
FoliC Hills
Montano Group Plene
-Z .Judith Rive,CRETACEOUS:J N
Eo 'e ~
Niobrara
Car Ille
Colorado Group Io,. ....horn
Oelle
Fourohe Wo.ry
_00111.1111 ....
Skull C....kDakota Group
tnyoR
Ko,a
Swl't
JURASSIC Riordan
Piper ~----
Spear' 1,1\ •TRIASSIC « Y: "' .. "ekol'",o
PERMIAN Opech ..tr «
8roon Creek(/) Minnelusa m l\rude"Group
PENNSYLVmlm« Tyler--_. - -~~ •
Big 0 •• 8rSnowyGroup
Kibbey • Poplar
<f] IAUrYOI .J <> Ralollffee:: Inurval •W t- Frobl.herZ Alida •
Interval-MISSISSIPPIAN Madison
.J T' I sto••nun'al<Group :::Eg;-<
Bott Ineou- LL Interval.ZY: -(/)
..:: Y: (/)
Bokku..:: • Y: Three foth.
Blrdbeo, •Jefferson DuperowGroup • aOUrl •Ive,Man IlobaDEVONIAN •
Dow.a" Bay.Grouo PrOlt 'eElk POint
'W1"nlp·to• u •Group
A.hern
Iflt.rlatl:e.SILURIAN W 0
Slo••wof I • Z ..:: Big Stony Mo.. 0 Horn W Group0 nod •lverORDOVICIAN0 r;t-I-
WlnnlpeQ ~Group
~ r;t Deadwood.
CAMBRIAN PRECAMBRIAN
'>#
• Oil PRODUCTION
(lc ....5 PflOOUCT ION
0

ISSN: 0078-1576
OIL EXPLORATION AND DEVELOPMENT IN THE NORTH DAKOTA
WILLISTON BASIN: 1990-1991 UPDATE
by
Thomas J. Heck
MISCELLANEOUS SERIES NO. 77
NORTH DAKOTA GEOLOGICAL SURVEY
John Bluemle, State Geologist
1992
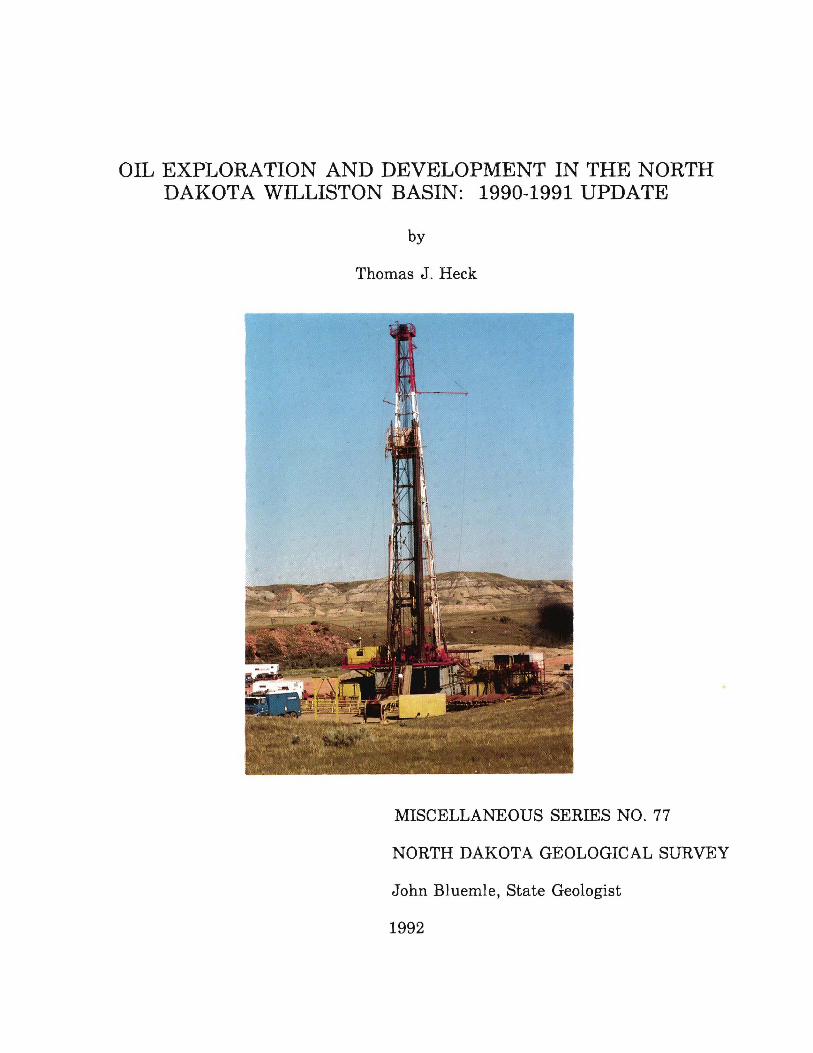
The cover photograph is the Axem Resources, Inc. #12-36H Tracy Mountain, a horizontal Tyler test drilled in the west-half of the southwest quarter of Section 36, Township 139 North, Range 101 West, Billings County. The test was drilled by Kenting Rig 11 as a development well to Fryburg Field in the Tracy Mountain area and is the first horizontally drilled Tyler test in North Dakota.

CONTENTS
ILLUSTRATIONS iv
ACKNOWLEDGEMENTS iv
INTRODUCTION 1
1980-1989 1
1990-1991 4
mSTORICAL SUMMARy 6
1990 8 Statistics 8 Drilling Activity 9
1991 17 Statistics 17 Drilling Activity 17
SUMMARy 19
REFERENCES 20
APPENDICES 21 Appendix I. 1990 New FieldJPool Discoveries 23 Appendix II. 1991 New FieldJPool Discoveries 25
iii

ILLUSTRATIONS
Figure Page 1. Bar diagram of annual revenue from quarterly state
oil-lease sales held for the period 1970-1991 2 2. Bar diagram of annual tax revenue generated by the production
and extraction taxes on crude oil for the period 1970-1991 3 3. Line graph of the number of oil wells drilled annually in
North Dakota since 1951 4 4. Line graph of the number of wildcat wells drilled annually
in North Dakota since 1951 5 5. Line graph of the number of new pools discovered annually
in North Dakota since 1951 6 6. Line graph of the annual oil production in North Dakota since 1951 7 7. Bar graph of the sources and percentage contribution to
North Dakota's biennial budget since 1981 ... . . . . . . . . . . . . . . . . . . .. 8 8. Line graph of the monthly average posted price in western North
Dakota and eastern Montana of 40-gravity "sweet" crude oil and the number of wells spudded monthly since January, 1986 9
9. Map of the known oil fields in western North Dakota with the 1990 new field discoveries shown 11
10. Map of the known oil fields in western North Dakota overlain with the approximate depositional limits of the Bakken Formation; where the Bakken Formation is a mature source rock, an immature source rock, and actively generating hydrocarbons: the Bakken "Fairway" is shaded 12
11. Map of the known oil fields in western North Dakota with the 1991 new field discoveries shown 13
Table Page 1. 1990 and 1991 new pool and field discoveries
listed by county and formation 14
ACKNOWLEDGEMENTS
This update benefitted from the review and suggestions from Bob Biek, Bill McClellan, and John Bluemle, members of the North Dakota Geological Survey staff. I would like to thank Jim Peterson of Axem Resources, Inc. for arranging access to the location of their '12-36H Tracy Mountain test during drilling. Their help was greatly appreciated.
iv

INTRODUCTION
The 1980s saw many changes in North Dakota's oil industry. The decade began with oil industry activity at record highs, a direct response of the domestic industry to the Arab oil embargo and subsequent rapid price increases of the 1970s. Oil prices began to decline in 1982 and industry activity also dropped to anew, lower level. Many thought that the industry had hit bottom in 1985, but over-production by OPEC caused oil prices to plunge precipitously to record lows in 1986. The oil industry has yet to recover from the price drop. The late 1980s saw industry activity in North Dakota at a level of activity far below the peaks of 1980-1981.
This update summarizes oil exploration and development of the 1980s and focuses on the events and changes of 1990 and 1991. Data presented here are largely from the North Dakota Industrial Commission's files as collected by the Oil and Gas Division. Additional data were provided by the State Tax Department, the State Land Department, and Koch Oil Company of Wichita, Kansas. Help from these sources is gratefully acknowledged. Interpretations of the data, however, are my own. Following the precedent set in the 1988-1989 update (Heck, 1990), the historical pre-1980 overview of exploration in North Dakota, included in all prior updates, has been dropped. The reader is referred to Fischer and Bluemle (1988) for this information.
1980-1989
During 1980, record levels of oil industry activity were recorded both nationally and in North Dakota. Oil prices were high, averaging $28/barrel
in North Dakota (Fischer and Bluemle, 1988). Operators aggressively pursued new plays and prospects, state lease sales brought record revenues (fig. 1), and tax revenues were climbing (fig. 2). Of the nearly 600 wells drilled (fig. 3) in North Dakota during 1980, 182 (31%) were wildcats (fig. 4). There were 84 new-pool discoveries (fig. 5) and production rose to 40,354,030 barrels, a second consecutive annual record (fig. 6).
The records set during 1980 fell in 1981 as the "oil boom" peaked in North Dakota. New record totals of 834 wells, including 267 wildcats, and 102 new pool discoveries were set. The 1980 annual production record was surpassed when 45,706,999 barrels of oil were produced during 1981, setting a third straight annual production record. State revenues increased as the new extraction tax began generating its first revenue (fig. 2). Together, the extraction and production taxes supplied more than 20 percent of the state's budget in 1981, the first year the extraction tax was in place (fig. 7).
The oil industry could not maintain a high level of activity after oil prices began to slip during 1982. However, oil production and tax revenues continued to climb despite a decrease in drilling because of a shift in drilling emphasis towards developing existing fields. Another reason for the continued increase in tax revenue is that a time-lag of one to three years exists between a field's discovery and its peak of production. Therefore, fields discovered in 1980 and 1981 would not see their peak production until 1982 to 1984.
Oil prices continued to decline dur
1

ANNUAL LEASE BONUS REVENUE
8<>-,,,---------------------------,
U 0.2 1.1 0.4
_..._._-----_._----_._-_._-_._. • 0
.0
'010 19'5 '010I'" "" YEAR
Figure 1. Bar diagram of annual revenue from quarterly state oil-lease sales held for the period 1970-1991. (Source: N.D. State Land Department).
ing 1983, exerting downward pressure on drilling. Wildcatting (fig. 4) was one-third of 1981 levels, reflecting the lower oil prices, but development drilling still remained high. Oil production however, continued to rise as did tax revenues (figs. 6 & 2). Drilling recovered slightly during 1984 for both wildcat and development wells (figs. 3 & 4). Oil production in North Dakota reached its all-time high at 52,654,336 barrels in 1984 (fig. 6), but tax revenues declined for the first time since 1973 (fig. 2) because of falling oil prices. Drilling activity resumed its decline during 1985 as oil prices slid further and began to fluctuate. Overproduction by OPEC caused a rapid
price drop in early 1986 (fig. 8), with prices falling to less than $10 a barrel for certain types of crude oil. Drilling virtually ceased and oil companies began to "downsize" and reduce spending in response to lower crude oil prices and uncertainties about future price levels. A continuing side effect of reduced drilling has been a decrease in the number and size of oil-field service companies in the state. Many companies have closed their doors due to bankruptcy or have moved out of state to cut costs.
From mid-1986 through early 1987 crude oil prices rose gradually; this was followed by a modest increase in drill
2

ANNUAL OIL TAX REVENUE
,._rr--~-------~-_...m.o~--- .....,I.... t ...
-~~H'-----
..·---------~m·--Iol P Z I Iol I> -Iol II:
..-.---
... ,.
.
.. •
• -!+---------------=
YEAR
I~ PRODUCTION TAX ~ EXTRACTlONTAX
Figure 2. Bar diagram of annual tax revenue generated by the production and extraction taxes on crude oil for the period 1970-1991. The extraction tax took effect on January 1, 1981. (Source: N.D. State Tax Commission).
ing from mid-1987 into early 1988. While the number of wells spudded did increase during the second halfof 1987, activity in the first half was so low (fig. 8) that only 190 wells were drilled during the year (fig. 3). In 1988, drilling jumped sharply to 255 wells. Some of the increase was the result of development drilling in Wabek Field, an important field along the Mississippian Sherwood shoreline. Wabek Field was discovered in 1985, but not truly devel· oped until 1988. As development of Wabek Field continued in 1989, a second important field, Plaza Field, was discovered and developed. Plaza Field produces from the Bluell interval,
which immediately overlies the Sherwood interval. Sperr, Stancel, & Hendricks (in press) estimate ultimate recoveries of 8 million barrels from Wabek Field and 3.5 million barrels from Plaza Field. These two fields are the largest Madison fields to have been discovered in several years.
Since 1986, when drilling plummeted in North Dakota, between two and three hundred wells and 40 to 75 wildcat wells have been drilled each year. In 1987 and 1989, the slowest years in recent times, drilling fell below 200 wells annually, the lowest levels recorded since 1974. Of the 190 total
3
TOTAL WELLS PER YEAR 900,.----------------------------,
834
688 100 "_ "-"--_._-,_.__ __._-_._,_..__ _--, _-_ _.__..,._._._--..__._~--"-"_ .._-"'--"_.._-_._-"'- __.,-'- _. ._-"' ".._"""-._..,,-.,
<Il..:l 500 ---.--.-------.-- 454 .----.------ ..--------------------.---.---.-.--..-- ----.--..----.----....--.-.-.-.-. ..:l
~ 300.'---.-- .-_._. . . Z74 •.__ Z85 _. ._.__._. ._.•._.. ._. ._.._._. .__ Z55 Z74
Z07 188 _100
90
1955 1960 1965 1970 1975 1980 1985 1990
YEAR
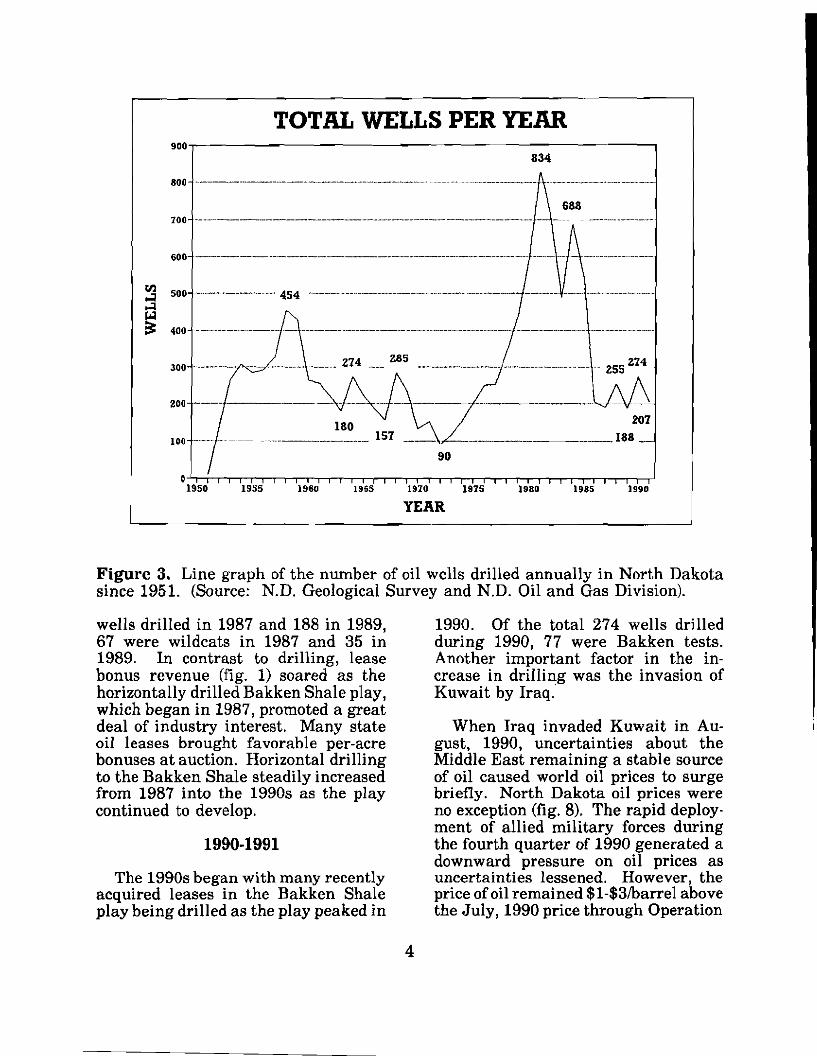
Figure 3. Line graph of the number of oil wells drilled annually in North Dakota since 1951. (Source: N.D. Geological Survey and N.D. Oil and Gas Division).
wells drilled in 1987 and 188 in 1989, 67 were wildcats in 1987 and 35 in 1989. In contrast to drilling, lease bonus revenue (fig. 1) soared as the horizontally drilled Bakken Shale play, which began in 1987, promoted a great deal of industry interest. Many state oil leases brought favorable per-acre bonuses at auction. Horizontal drilling to the Bakken Shale steadily increased from 1987 into the 1990s as the play continued to develop.
1990-1991
The 1990s began with many recently acquired leases in the Bakken Shale play being drilled as the play peaked in
1990. Of the total 274 wells drilled during 1990, 77 were Bakken tests. Another important factor in the increase in drilling was the invasion of Kuwait by Iraq.
When Iraq invaded Kuwait in August, 1990, uncertainties about the Middle East remaining a stable source of oil caused world oil prices to surge briefly. North Dakota oil prices were no exception (fig. 8). The rapid deploy· ment of allied military forces during the fourth quarter of 1990 generated a downward pressure on oil prices as uncertainties lessened. However, the price ofoil remained $1-$3/barrel above the July, 1990 price through Operation
4
----
WILDCATS PER YEAR 300,--------------------- --,
261
250-+--------------------1-1--
200
III 168
~ U
150Cl ...:l-~
100
50
148
110
67 58
39
1955 1960 1965 1970 1915 1980 1985 1990
YEAR
0 1950
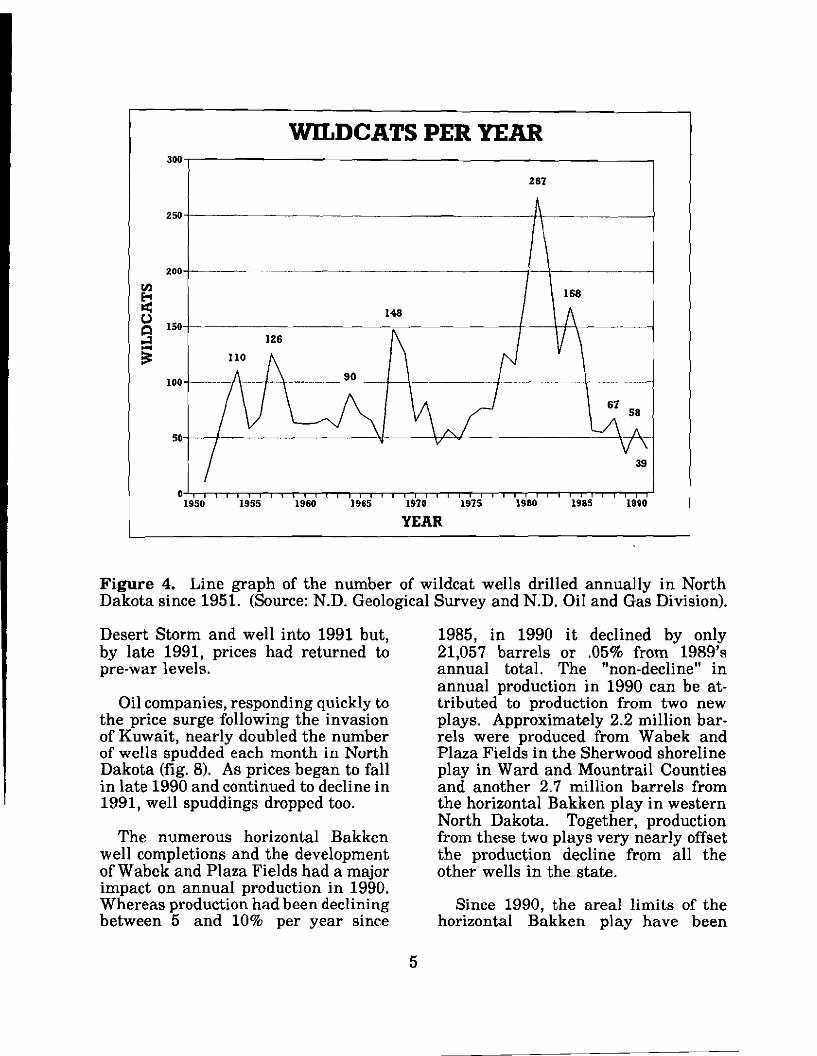
Figure 4. Line graph of the number of wildcat wells drilled annually in North Dakota since 1951. (Source: N.D. Geological Survey and N.D. Oil and Gas Division).
Desert Storm and well into 1991 but, by late 1991, prices had returned to pre-war levels.
Oil companies, responding quickly to the price surge following the invasion of Kuwait, nearly doubled the number of wells spudded each month in North Dakota (fig. 8). As prices began to fall in late 1990 and continued to decline in 1991, well spuddings dropped too.
The numerous horizontal Bakken well completions and the development ofWabek and Plaza Fields had a major impact on annual production in 1990. Whereas production had been declining between 5 and 10% per year since
1985, in 1990 it declined by only 21,057 barrels or .05% from 1989's annual total. The "non-decline" in annual production in 1990 can be attributed to production from two new plays. Approximately 2.2 million barrels were produced from Wabek and Plaza Fields in the Sherwood shoreline play in Ward and Mountrail Counties and another 2.7 million barrels from the horizontal Bakken play in western North Dakota. Together, production from these two plays very nearly offset the production decline from all the other wells in the state.
Since 1990, the areal limits of the horizontal Bakken play have been
5

NEW POOL DISCOVERIES 120-,----------~-------------_____,
102
21
48
19 20 --- ---------------------------- ------------- --------------'-=---=;---- ---
13 II
1955 )960 1965 1970
YEAR 1975 1980 1985
13
1990
Figure 5. Line graph of the number of new pools discovered annually in North Dakota since 1951. (Source: N.D. Geological Survey and N.D. Oil and Gas Division).
better defined and sustained production rates have often been less than anticipated. As a result, activity has slowed as companies reconsidered their return on investment from this expensive play. Of the 207 total wells drilled in 1991, 52 were Bakken wells.
HISTORICAL SUMMARY
From 1980-1985: record oil prices, revenues, and numbers of wells drilled early in the period were followed by gradual decline. In 1986, a major price drop caused drilling to plummet and, since then, activity has remained fairly constant at levels not seen since the
1960s (fig. 3). If a large newly discovered field is being developed or a new play is actively being evaluated in North Dakota, the number of wells drilled annually can be expected to be between 250 and 300 wells. Otherwise, approximately 200 wells will be drilled (fig. 3).
Annual production declines began in 1983 as fields aged and uneconomic wells were plugged and have not been offset with the present drilling levels. Production from two important plays, the Sherwood shoreline and the horizontal Bakken Shale plays, temporarily stopped the decline in 1990. The effect, however, was short-lived as the decline
6

ANNUAL PRODUCTION
52.654
50 .-.-.-.•.---.-------------------------- --- ----.----
Q ~
U 40 ::l Q O~ 3~M5 ll:: g ~ ~ 30-----------·..··27.IZ6 ------------.. ----------.....- ..--....
I 20
19.697
10 .--.-----.-----.--
YEAR
Figure 6. Line graph of the annual oil production in North Dakota since 1951. (Source: N.D. Geological Survey and N.D. Oil and Gas Division).
resumed in 1991. A return to a decline rate of 5-10%/year should be anticipated within a few years unless additional significant discoveries are made.
The discovery of the Wabek and Plaza Fields and the flurry of activity in the horizontal Bakken play clearly illustrate the only way to offset the state's decline in oil production: find and develop a new large oil field or a new oil play. In both the Sherwood shoreline and horizontal Bakken plays, most wells had initial production rates much higher than the typical well. Therefore, either additional new significant discoveries must be made or many more average new wells must be
completed. In either case, oil companies are required to invest a great deal of capital in the state. An alternative way to encourage investment might be with more favorable tax treatment trading off a lower per barrel revenue with more barrels being produced. Some methods that encourage capital investment are needed if we are to reverse the annual decline in production.
The North Dakota portion of the Williston Basin remains under-explored and many opportunities remain for finding large oil fields. A study of the petroleum potential of the Little Missouri National Grasslands by
7

BIENNIAL BUDGET SOURCES
<1+++.
-_.~ III~ /Ji ~ 1;:;/ ~ -.!%~~~ 1--·I%:: ~.~ ~
, ' @ ._--- - . - 1M m00
....__.._... ........-,...
.._-_.. •....... ... -.-. -
I
?til'
~ ~ ~
100
80
60
40
20
o 1980 1982 1984 1986
YEAR 1988 1990
~ OIL & GAS TAX 0 SALES TAX
o nJELS USE TAX !tlf!;J COAL TAX
~JNCOMETAX
o OTHER TAXES
Figure 7. Bar graph of the sources and percentage contribution to North Dakota's biennial budget since 1981. (Source: N,D. State Tax Commission).
Fischer et al. (1991), estimated that at least 100 million barrels of oil remain to be found in McKenzie, Dunn, Billings, and QQlden Valley Counties. Some of this oil was discovered by the horizontal Bakken play, but most of it has yet to be found. The discovery of a new 10 million barrel-plus field would result in additional drilling as operators would vie to discover another field, just as they did in the Bakken and Sherwood shoreline plays.
1990
STATISTICS
The total number of wells drilled
increased from 188 wells during 1989 to 274 in 1990, an increase of 86 wells (46%). The 1990 total included 58 wildcat wells, an increase of 23 (66%) over 1989 (figs. 3 & 4). State-wide, 21 new pools (fig. 6), of which 13 were new fields (fig. 9 & appendix I), were found. Dunn County and McKenzie County led the state with 6 and 5 discoveries, respectively (table 1). Success rates for the year were 26% for wildcat wells, nearly 67% for all other wells, and averages of nearly 58% for both. These numbers are a 1% improvement for all wells and a 5% improvement for wildcats over 1989. Footage drilled increased to 2,337,259 feet of hole during the year, an increase of 779,432 feet or
8

AVERAGE WESTERN WILLISTON BASIN SWEET CRUDE PRICE
-_._--_._.~------ .., , -_._------_._~----_._--_._._._---------_._--_._.._ ...-_. "
I,
. 5
I CRUDE OIL PRICES FROM KOCH OIL CO. I...:
JUl-. Jul-86 J.n-81 ,ul-87 Jan-88 Jul-sa IlI.n-89 lul·89 Jan-90 lul-90 Jan-91 lul-91 Jan-92
DATE
SWEET CRUDE PRICE WELL SPUDS
Figure 8. Line graph of the monthly average posted price in western North Dakota and eastern Montana of 40-gravity "sweet" crude oil and the number of wells spudded monthly since January, 1986. (Source: Koch Oil Co. and N.D. Oil and Gas Division).
50%. The increase is due to 86 more wells being drilled in 1990 as well as an increase in activity in the horizontal Bakken play. A horizontal Bakken well is longer than a vertical Bakken well because 2,000-3,500 feet of horizontal well-bore are drilled. Oil production in 1990 remained virtually the same as in 1989. A total of 36,716,459 barrels were produced, only 21,057 barrels less than in 1989.
DRILLING ACTIVITY
During 1990 the horizontal Bakken play overshadowed all other plays in
the state. The play saw 65 producing wells and 12 dry holes completed, a success rate of 84%. More wells were completed in the Madison Group, but the Bakken play generated more interest. The Bakken Formation is a fractured reservoir producing oil from a network of cracks or fractures in the rock. Fractured reservoirs, like the Bakken Formation, often have very high production rates. However, when two or more wells are completed in the same fracture network, the wells can interfere with each other's production. In such cases, extremely rapid decline rates are common. A good analogy is two straws in the same glass and two
9

thirsty people- the contents of the glass come out fast, but do not last very long and, whoever sips hardest or starts first, gets the most. Annual decline rates as high as 70-80%/year were not uncommon between interfering wells in the Bakken Shale. As a result, less oil will ultimately be recovered by each operator than is necessary to make the drilling of a horizontal Bakken well an economic venture.
The Bakken play is centered in the "Bakken Fairway" of southwestern North Dakota covering those parts of Billings, Golden Valley, and McKenzie counties close to the depositional limit of the Bakken Formation (fig. 10). A number of wells were drilled outside of the "fairway" to test the idea that the Bakken Formation was productive everywhere it was mature but, by the end of 1990, it was clear that the best Bakken wells were restricted to the "fairway". Elsewhere, the Bakken was a marginal producer at best. Of the 77 Bakken wells drilled in 1990, 54 were completed in 6 fields in the heart of the "fairway"; Ash Coulee, Bicentennial, Buckhorn, Elkhorn Ranch, Roosevelt, and Rough Rider Fields. Of the 54 wells, 51 were completed as producing wells; a success rate of 94% in the fairway. The high success rates in the fairway had helped make the horizontal Bakken play attractive to investors.
Within the "fairway", 12 wells were drilled in Ash Coulee and Elkhorn Ranch Fields. All 12 drilled in Ash Coulee Field produced oil, but one well in Elkhorn Ranch Field was a dry hole. Many of the Bakken wells drilled in the fairway, and in Ash Coulee Field in particular, were in response to the Slawson #1-7 Sidewinder, which was completed flowing 1,362 BO + 1,090 MCFPD in early February, 1990. The second and third Bakken completions
in Ash Coulee Field were disappointing, but the fourth flowed 485 BO + 276 MCFPD and the fifth topped them all at 1,914 BOPD. The 12 completed wells had an average initial potential (IP) of 554 BOPD, far and away the year's highest average IP for development wells in the state.
In Elkhorn Ranch Field, where the first horizontal Bakken well was drilled in 1987, the initial potentials (IPs) were not as high as those in Ash Coulee Field. The average IP was 201 BOPD although some of the individual wells had much higher flow rates. The lower IPs may in part be due to the fact that Elkhorn Ranch Field has a long history of Bakken production. The first Bakken production came from a vertical well that was completed in 1961. With such a long production history, the Bakken reservoir might have been at least partially depleted by both older vertical and more recent horizontal wells, thus lowering the average IP of those wells completed in 1990.
Rough Rider and Roosevelt Fields each had 8 Bakken comptetions during 1990 and only one, in Roosevelt Field, was a dry hole. Initial potentials averaged 284 BOPD for Rough Rider Field and 203 BOPD for Roosevelt Field. The initial potentials in two other "fairway" fields, Bicentennial and Buckhorn, averaged 140 BOPD and 340 BOPD, respectively, from 7 wells in Bicentennial and 6 producing wells of 7 completed in Buckhorn. The average IP of 340 BOPD in Buckhorn Field is attained only by including the IP from the Shell Western Exploration & Production #24-27 Connell located in section 27-T144N-R102W. The initial potential for this well was 1,503 BO + 1,278 MCFPD. If this well is excluded, the average IP for the other 5 comple
10

r-::---.----i·-·:----r---'---·;-r--t:~r.------,...-:....'-----TI : .,.... '... . ' • 'I ': t-"), '. : ST""/'. j ,,... .' ',,' ,':~I~" \ " !. .; DIV!D.E ~. .~;'j' _~. -, .. : . BOTTINEAU , ! ,. ', .., .. ,~.. n RENVIl,LE L "', .J. I'I .' I ~. '-.:1- . 1 I ~-' WI~IA~;---~-.~' _~UR~~-'l_~ -! .~ '.'L-~Jf"-----Ll.J)•
i CJTTEJl~., ,.. l MOUNTRAIL LL_______ ~ L \ t. ~. I • I I!, ..... :... -a"'""" 'I .\ WARD 'I 'I
I
\ I • .' ~ • McHENRY II • I ~ I I , , , ~~
I
~ ~:! ',' ~cKE~ZIE ~ ~' , , \'1_' .. f K BIG BEND ILL' ~.:. ' '. ",; , ,;' - ;~00N0------- --T---- r1 J" ..... .. .," • I :I
.., " \,.;,~.~ llll!~-T- " .~CEHTEHHW.MCLEAN r SHERIDAN 1\ ill: ,; ~~ ..' ~'J';"~ I' 'I \ I I SIC" II •." ..' ~,.~ .. .." GULCH' • i I I \
~- ' :.!-~-.J,; '. ... I, ~____ LlMERCER
I # -S DUNN ',--- , ni· .:.}. t"' BUTTE! i OLIVER i \ j'" . l~ 'r.:~:L~-' _----.r---.-1 __.L________ L \
1"..." ~"",. T liI
GOLDEN "1 '.~ 'I··'' . I' MDRTON 'I I
,, • • ii VALLEY 'BILLINGS,' STARK , --. ' i :" ,J-L-~~-T--' ----'---S L : l~ ~- , 'I \ I ' ! L iHEniNGER! , SLOPE.L I GRANT - ,
~----------l :---, .-J EMMONS \ I .. .. BOW"'AN, L___, ' I ._... ,., 1 11i' !-\:'.' , SIOUX: ~ __~ __~.~~:._L __~DA~: l . . .L .--.J
Figure 9, Map of the known oil fields in western North Dakota with the 1990 new field discoveries shown.
11

•
•
Figure 10. Map of the known oil fields in western North Dakota overlain with the approximate depositional limits of the Bakken Formation; where the Bakken Formation is a mature source rock, an immature source rock, and actively generating hydrocarbons: the Bakken "Fairway" is shaded. Modified from Webster, 1982 and Hanson and Long, 1991.
12

1 . I
!I.PPDt DES LACS
r::---.----:.-.:--.-r-""'-":~JI:-T,t-;'----.--··. '~'~-----11 I 0••~. ••• • ~I ,-- •• ' ,~, ' I I,I."~1 .' GIl&Mi. .; DIV!D.E , J .. L£,•.;. r _ ,; •.:" BOTTINEAU , i 'I' • ••.•• .• ':'~" (II RENVI~LE ~ 1" . .J. 1:\ . .' ~ .•. -.' l
• • I • • ,
~'~~~IA~;---:~-.~' 0_BUR~~:l_~ .., 0; 0L-;)J------Lri~
! ,.. l l.lOUNTRAIL LL~______ ~ L \ ~ ,.~, "QSl!l£A! .4 WARD! ! \: • .. ~. ' I l.leHENRY I :
~~ \ ~ ~ \ • , "'cKENZIE • • I I
~;!.. ' • :f:: . ,;' --(J.---------L--·r---Ld '" • ." • I , I
.... '. ~i;'~' ~-T~..... ~ . l.leLEAN r SHERIDAN 1\ ill, .... , .~ .,I , ..... " ;, •• ; 1- '. • I I :
0 l.lERC£R1'~' - . .~~~~. ·'. ::N~: ~. f-----~ :. "."1" i :--- , i :I· , ', , I OLIVER ,Ii'" .. L~ .,:J:--.~---r-----1 __.L________ L I:: l' 0 1_' -J. T BURLEIGH l ! GOLDEN'i ••~ j, ... 0 i l.lORTON i \ LVALLEY 'BILUNGS.' STARK • ' •
: .__rL-~~-T--· ----'-.J1 L.__: LJ f: .' 'I \i ! HETTINGER! L \ , SLOPE .L ~ GRANT , ~----------r :--, ElAlAONS I
BOWMAN L___I • • I I
l ' .."',' 0.. I Ii"\ ~..' -' , SIOUX'
:
I ~ __~_.:':.:::...:._L __~DA~~ __ • l______________________ _ -.J
Figure 11. Map of the known oil fields in western North Dakota with the 1991 new field discoveries shown.
13

Table 1- 1990 and 1991 New Pool and Field Discoveries Listed by County and Formation
1990 1991 Billings County
Total 0 1 Stonewall 0 1
Burke County Total 1 2 Madison 1 2
Divide County Total 1 2 Duperow 0 1 Silurian 0 1 Stonewall 1 0
Dunn County Total 6 1 Bakken 2 1 Madison 1 ° Red River 1 0 Silurian 1 0 Tyler 1 0
tions is 146 BOPD.
A number of new Bakken pools and/or fields were discovered during the year: Alkali Creek, Bailey, Big Bend, Big Gulch, Clark's Creek, New Home, and Truax. Appendix I lists location and production data for the discovery wells for these pools. Although a number of new Bakken pools were found, none are significant and most will be plugged and abandoned within a few years.
During 1990, 152 Madison wells were completed; 78 (52%) produced oil. The majority of the wells were scattered across north-central North Dakota in Burke, Bottineau, Mountrail, Renville, and Ward Counties. In Plaza Field, where 26 wells
1990 1991 McKenzie County
Total 5 1 Bakken 1 1 Madison 4 0
McLean County Total 2 0 Madison 2 0
Mountrail County Total 1 2 Bakken 1 1 Madison 0 1
Renville County Total 1 1 Madison 1 1
Williams County Total 4 3 Bakken 3 1 Red River 1 1 Silurian 0 1
were completed, 22 (85%) produced oil with an average IP of 127 BOPD. Several wells in Plaza Field produced in excess of 300 BOPD. These new wells, together with the 8 completed in 1989, produced 939,508 BO in 1990. As previously stated, the combined 1990 production of Plaza and Wabek Fields offset approximately one-half of the state's normal annual production decline.
The most significant new field discovery during 1990 was Lucky Mound Field in McLean County by Balcron Oil Company. The discovery well, the #3315 Wahner, located in Section 15TI50N-R89W, flowed 324 BOPD of 36gravity oil. The field is McLean County's first commercial oil field as well as an extension of the Sherwood
14

shoreline trend south from Wabek Field. During the remainder of 1990, two more producing wells and one dry hole were completed. The 3 producing wells had an average IF of 240 BOPD. A summary of Lucky Mound Field was published by R. Burke in the December, 1991 North Dakota Geological Survey Newsletter. For those seeking further information about Lucky Mound Field, a more detailed report is due out later in 1992. Burke estimates the primary recovery at Lucky Mound Field to be 3.7 million barrels of oil, a sizeable accumulation.
A second McLean County wildcat, the Balcron Oil Co. #42-35 BOC Zahnow-Federal, discovered Centennial Field along the Sherwood shoreline trend in Section 35-T149N-R89W. The well flowed 184 BO and 54 MCFPD. An earlier wildcat, drilled within the current field outline by Presidio Exploration Inc., was a dry hole. Unfortunately, Centennial Field has not lived up to the promise of the discovery well or other fields in the trend.
Another test of the Sherwood shoreline play was the Wiser Oil Company #1 Wiser State well in Werner Field. The well, located in Section 36-T146NR93W Dunn County, tested the extreme southwestern extent of the Sherwood play. Shows were encountered during drilling, but the operator decided not to attempt a completion. While unsuccessful, the presence and quality of shows may be an indication of a nearby accumulation. Only additional drilling will determine the southern productive extent of the Sherwood play.
Two other significant new finds were made during 1990. The first came in August, when Anschutz completed the #8-14 Watterud in Section 14-T160N
R95W, flowing 480 BO and 525 MCFPD from the Silurian Stonewall Formation. Stoneview Field was discovered in 1959 and already had production from the Madison, Bakken, Duperow, Winnipegosis, and Red River formations. The second was the Simon Butte Silurian pool discovered by the Pacific Enterprises Oil Company at their #42-18 S. E. Russian Creek well located in Section 18-T141N-R95W, Dunn County. The well flowed 262 BO + 1,072 BW + 25 MCFPD from the upper Silurian Interlake Formation. Despite good initial rates at both, neither was offset during 1990. These two discoveries are significant for two reasons. First, earlier tests of the Red River Formation within both fields had either not encountered or had missed the pay-zones and second, neither zone is presently productive in very many fields across the state. I believe that a closer look at these two zones in other fields would result in significant reserve additions. After all, each of these 2 fields has added more than 2 million barrels to the state's ultimate recovery.
A number of other fields and pools were discovered during 1990 (appendix I) but most of them appear to be limited reservoirs and have seen no further development. Two of the Madison discoveries may have a larger meaning. In Pierre Creek Field in southern McKenzie County, Meridian Oil Inc. completed the #41-25 Leland well from the Ratcliffe interval of the Madison Group flowing 223 BO + 138 MCFPD. Pierre Creek Field is a multi-pay oil field with established production from six other zones. Many of the oil fields in this part of the Williston Basin have multiple pay zones and the addition of Madison production adds a seventh to the list of possible zones. The second Madison discovery of interest was in Section 17-T149N-R93W, Dunn County,
15

at Mandaree Field. The Geolinear Company #1-17 Geolinear Packineau twinned an abandoned Red River test that had discovered the Mandaree Bakken pool. The IP of the well was only 40 BOPD but it is interesting because the Madison pool it found lies east of the Nesson Anticline in an area where very little Madison production has been established. A good field here would help open a large area for additional exploration.
Several infill/development drilling programs took place during 1990. In Mouse River Park Field, Miller Oil Co. and Long Petroleum drilled 11 development wells in an extension along the southwest edge of the field. All 11 produced oil with an average IP of just over 85 BOPD. Exhibits offered to the Industrial Commission at spacing hearings indicate that each well is expected to produce between 50,000 and 125,000 BO. Thus, these 11 wells have added between 550,000 and 1,375,000 BO to the fields' ultimate recovery.
Seven wells were drilled in Little Knife Field during 1990. Five of the 7 were productive with an average IP of 176 BOPD. The development program is of interest because 4 of the 5 producing wells extended Little Knife Field approximately 3 miles to the north and added 237,368 BO to the field's total production through 1991. Little Knife is one of the largest and most studied oil fields in the state, but 13 years after its discovery, the limits of the field are still being expanded.
Two Madison fields in north-central North Dakota also saw drilling activity. At Culver Field, discovered in 1989, 5 wells were drilled. Two of the wells produced oil with an average IP of 56 BOPD. Wacker Oil, Inc. drilled 6 wells in Elms Field in Bottineau Coun
ty. Unfortunately, only one well was productive and even this well had a very high water cut and is marginally economic at best.
An extension to the Fryburg Heath pool was drilled in the Tracy Mountain area by Axem Resources. The #4-25 Tracy Mountain Federal was completed pumping 175 BO + 27 BW + 35 MCFPD from the Heath. This well extended the pool approximately one mile farther southwest into Section 25TI39N-RI0IW.
Finally, several wells were drilled to evaluate the Devonian Winnipegosis Formation. A lease play occurred in North Dakota after the discovery of a productive pinnacle reef just north of the international border with Saskatchewan at Tablelands Field. Two tests, the Patrick Petroleum #1-4 Westerness in Section 4-TI60N-R93W and the Marathon Oil Co. #26-2 Laredo in Section 26-TI56N-R91W, were drilled on seismic anomalies that were interpreted to be pinnacle reefs, but both were dry holes. Four other Winnipegosis tests were drilled on the north end of the Nesson Anticline in T159N and TI60N-R96W. Three by Ampolex (Texas), Inc. and one by Berco Resources, Inc. These tests were all located on the Winnipegosis shelf edge and attempted to extend the Winnipegosis production from Temple and Hamlet Fields. All four were dry holes and probably mark the last Winnipegosis play for a few years.
The preceding sections briefly reviewed which wells and programs in 1990 were the most important and why. Wells were drilled in 91 fields to virtually every producing zone in North Dakota. The remainder of the wells completed in 1990 were one- or two-well field development, extension,
16

or wildcat attempts. Many of them will make money for the operating companies, but have no broader significance.
1991
STATISTICS
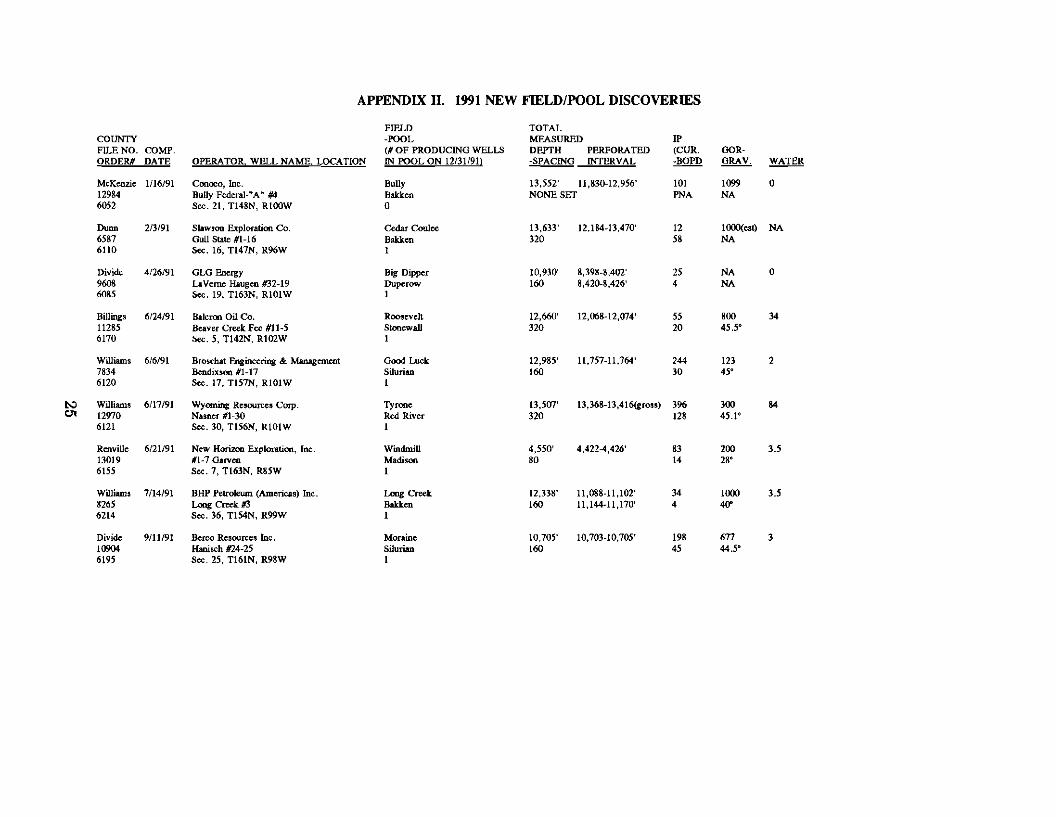
During 1991, drilling fell to 207 wells, 67 wells (24%) less than in 1990 (fig. 3). Of the 207 wells, 39 were wildcats, 19 less than in 1990 and a 33% decrease (fig. 4). Twelve new pools, of which 4 were new fields (fig. 11), were discovered during 1991; 4 in the Bakken Shale, 3 in the Madison Group, 2 in the Silurian, and one each in the Duperow, Stonewall, and Red River formations. Williams County led with 3 new discoveries followed by 2 each in Burke and Divide Counties and 1 each in Billings, Dunn, McKenzie, Mountrail, and Renville Counties (table 1 and appendix 11). Success rates for the year were approximately 18% for wildcat wells and 70% for all other wells, an average of about 60% for all wells. These represent increases of 2% for all wells and 3% for all non-wildcat wells. The success rate for wildcat wells fell by 8%. There were 1,728,550 feet of hole drilled in 1991, 608,709 feet (26%) less than in 1990. The reduction in footage drilled is due to decreases of 24% in wells drilled and 38%, from 77 to 48, in the number of Bakken wells drilled. Oil production resumed its decline in 1991 falling by a relatively modest 821,181 barrels, or 2.2%, to 35,895,278 (fig. 6).
DRILLING ACTIVITY
During 1991 the Bakken Formation remained an important target in North Dakota although, due to the decrease in the number of horizontal Bakken wells drilled, it was less important
than in 1990. The weakening interest in the Bakken Formation is evident from monthly completion and rig count statistics (fig. 10). Both the rig count and number of Bakken completions are high through 1990 and the first quarter of 1991. Nearly 43% of the 1991 Bakken completions were made in the first quarter. By mid-1991, 66% of the year's 48 Bakken completions had already been made. Most of the Bakken wells drilled in 1991 were located in the Bakken Fairway and in relatively few fields. Two-thirds of the wells were drilled in 6 fields in the center of the "fairway": Rough Rider (8 wells), Roosevelt (7), Ash Coulee (6), Elkhorn Ranch (5), Flat Top Butte (3), and Morgan Draw (3). Thirty-one were completed as oil wells, a 97% success rate. The average initial potential of all 31 wells was 349 BOPD. Field-wide average initial potentials ranged from a low of 184 BOPD in Elkhorn Ranch Field to a high of 429 BOPD in Ash Coulee Field. The highest IP for any single completion during 1991 was 1,204 BO + 873 MCFPD from the Slawson Exploration Company #1-141. C. Wolf, located in Ash Coulee Field in Section 14-T142N-RI02W, Billings County. Judging from the average initial potentials and success rates, the "Bakken fairway" remained a good place to drill in 1991.
During 1991, 132 Madison tests were completed, 62 as oil wells, for a 52% success rate. Thirty-six wildcats were drilled with 6 completed as oil wells, a 17% success rate. Development and extension wells hit on 62 of 96 attempts for a 65% success rate. Four new Madison fields were discovered; Osloe, Grover, Upper Des Lacs, and Windmill. Based upon performance curves of the discovery wells, only Upper Des Lacs Field, located in Section 5-T163N-R89W, Burke County,
17
appears to be a reservoir of any size.
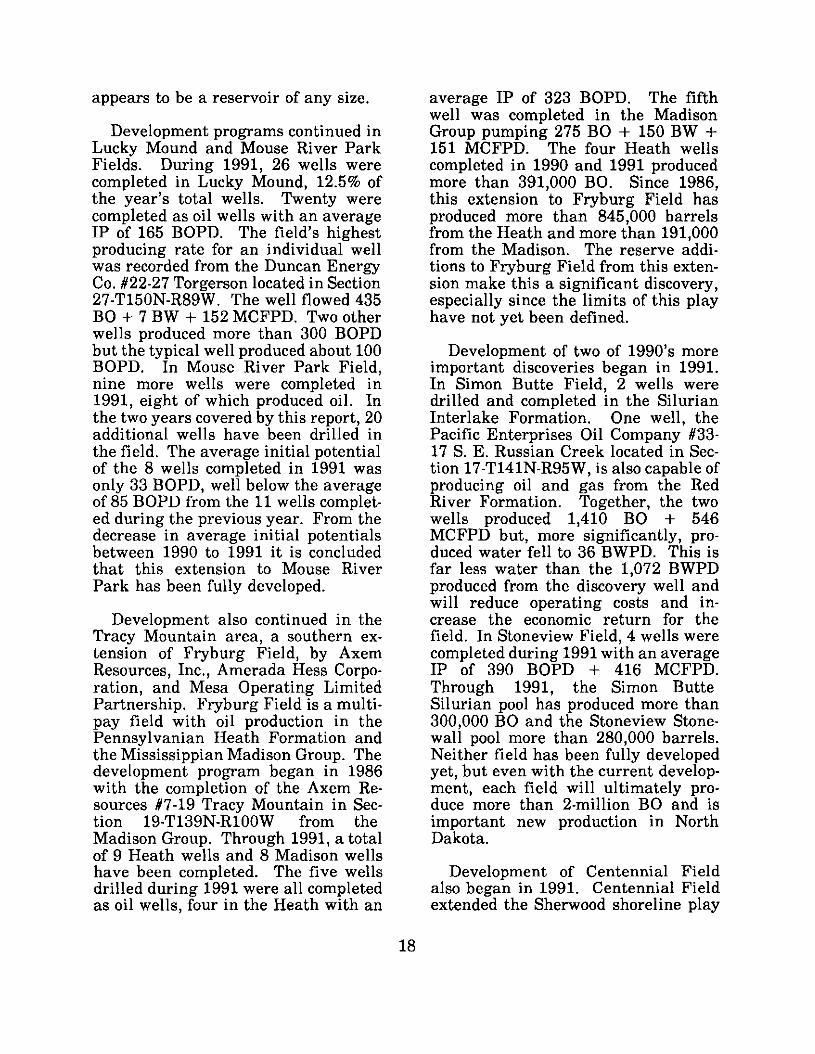
Development programs continued in Lucky Mound and Mouse River Park Fields. During 1991, 26 wells were completed in Lucky Mound, 12.5% of the year's total wells. Twenty were completed as oil wells with an average IP of 165 BOPD. The field's highest producing rate for an individual well was recorded from the Duncan Energy Co. #22-27 Torgerson located in Section 27-T150N-R89W. The well flowed 435 BO + 7 BW + 152 MCFPD. Two other wells produced more than 300 BOPD but the typical well produced about 100 BOPD. In Mouse River Park Field, nine more wells were completed in 1991, eight of which produced oil. In the two years covered by this report, 20 additional wells have been drilled in the field. The average initial potential of the 8 wells completed in 1991 was only 33 BOPD, well below the average of 85 BOPD from the 11 wells completed during the previous year. From the decrease in average initial potentials between 1990 to 1991 it is concluded that this extension to Mouse River Park has been fully developed.
Development also continued in the Tracy Mountain area, a southern extension of Fryburg Field, by Axem Resources, Inc., Amerada Hess Corporation, and Mesa Operating Limited Partnership. Fryburg Field is a multipay field with oil production in the Pennsylvanian Heath Formation and the Mississippian Madison Group. The development program began in 1986 with the completion of the Axem Resources #7-19 Tracy Mountain in Section 19-T139N-RlOOW from the Madison Group. Through 1991, a total of 9 Heath wells and 8 Madison wells have been completed. The five wells drilled during 1991 were all completed as oil wells, four in the Heath with an
average IP of 323 BOPD. The fifth well was completed in the Madison Group pumping 275 BO + 150 BW + 151 MCFPD. The four Heath wells completed in 1990 and 1991 produced more than 391,000 BO. Since 1986, this extension to Fryburg Field has produced more than 845,000 barrels from the Heath and more than 191,000 from the Madison. The reserve additions to Fryburg Field from this extension make this a significant discovery, especially since the limits of this play have not yet been defined.
Development of two of 1990's more important discoveries began in 1991. In Simon Butte Field, 2 wells were drilled and completed in the Silurian Interlake Formation. One well, the Pacific Enterprises Oil Company #3317 S. E. Russian Creek located in Section 17-T141N-R95W, is also capable of producing oil and gas from the Red River Formation. Together, the two wells produced 1,410 BO + 546 MCFPD but, more significantly, produced water fell to 36 BWPD. This is far less water than the 1,072 BWPD produced from the discovery well and will reduce operating costs and increase the economic return for the field. In Stoneview Field, 4 wells were completed during 1991 with an average IP of 390 BOPD + 416 MCFPD. Through 1991, the Simon Butte Silurian pool has produced more than 300,000 BO and the Stoneview Stonewall pool more than 280,000 barrels. Neither field has been fully developed yet, but even with the current development, each field will ultimately produce more than 2-million BO and is important new production in North Dakota.
Development of Centennial Field also began in 1991. Centennial Field extended the Sherwood shoreline play
18

8 miles south of Lucky Mound Field and demarcated the present southernmost boundary of the Sherwood play. Five wells were drilled in the field but only 2 produced oil. The extent of this field appears to be limited.
Finally, a number of new wells and recompletions successfully established new production from the Interlake, Stonewall, and Red River Formations. Broschat Engineering & Management completed the #1-17 SE Bendixson pumping 244 BO + 2 BW + 30 MCFPD. The well is located in Section 17-T157N-R101Wand is the discovery well for the Good Luck Silurian pool. In Section 25-T161N-R98W, Berco Resources completed the 624-25 Cenergy-Berco-Hanisch pumping 198 BO + 3 BW + 134 MCFPD. The well discovered the Moraine Silurian pool. Balcron Oil Co. recompleted the 611-5 Beaver Creek pumping 55 BO + 34 BW + 36 MCFPD. This well, although it does not produce significant amounts of oil and gas, is the discovery well for the Roosevelt-Stonewall pool. The last discovery of interest was in the Ordovician Red River Formation in Williams County. Wyoming Resources Corporation drilled the 61-30 Nasner in Section 30-T156N-R101W as a twin to the Gulf Oil Company 61-30-1A Nasner. The original Gulf well had produced almost 40,000 BO from the Stonewall Formation before salt collapsed the casing. Wyoming Resources' twin was completed flowing 396 BO + 84 BW + 132 MCFPD from the Red River Formation with what appears to be good Stonewall pay still behind pipe. All four of these discoveries clearly demonstrate that a considerable potential remains, often behind pipe in existing wells, from Silurian and Ordovician-age reservoirs. In the last two years alone, 28 wells were completed in one of these four pay
zones, an indication of how viable a target these deeper zones are.
SUMMARY
Two plays, the horizontal Bakken play and the Sherwood shoreline play, were the loci of industry interest in North Dakota during 1990 and 1991. At first, horizontal Bakken wells were drilled in many widely separated locations to test the idea that the formation could produce significant volumes of hydrocarbons everywhere it was a mature source rock. By late 1990 this theory was proven to be untrue and interest focused in the "Bakken fairway" of western North Dakota where initial potentials for individual wells were as high as 1,912 BOPD, but averaged around 300 BOPD. However, even in the "fairway" there were problems. The nature of the fracture system in the Bakken Formation resulted in reduced recoveries and less than desirable economics with the result that, by mid-1991, most of the companies active in the play had withdrawn from it. However, with proper attention to detail, economic Bakken wells are still possible, and some operators continue to prove this.
The Sherwood shoreline play began in 1987 with the development of Wabek Field. Activity continued into 1989 as Plaza Field was discovered and, more recently, with the discovery ofLucky Mound and Centennial Fields. Centennial Field has, so far, been a disappointment, but the other three fields have reserves of more than 15 million barrels of oil. Activity in the play has recently slowed somewhat but will eventually be resumed because the limits of the play have not yet been defined and the potential for more multi-million barrel fields is very real.
19

REFERENCES
Burke. R. B., 1991, Field summary for Lucky Mound Field, North Dakota Geological Survey Newsletter, J. P. Bluemle, ed., pp 21-24.
Fischer, D. W., and Bluemle, J. P., 1988, Oil exploration and development in the North Dakota Williston Basin: 1986-1987 update: North Dakota Geological Survey Miscellaneous Series 72, 36 p.
Fischer, D. W., LeFever, J. A., Heck, T. J., & Lever, R. D., 1991 Petroleum potential of the Little Missouri National Grasslands, North Dakota Geological Survey Report of Investigations No. 91, 52p.
Folsom, C. B. Jr.; 1980, A History of the North Dakota Geological Survey; N.D.G.S. Miscellaneous Series No. 58,51 p.
Hanson, W. B. & Long, G. I. W., 1991, Bakken Production and potential in the U. S. and Canada: can the fair
way be defined?, in W. B. Hanson, ed., Montana Geological Society 1991 Guidebook to Geology and Horizontal Drilling of the Bakken Formation, pp 69-88.
Heck, T. J., 1990, Oil exploration and development in the North Dakota Williston Basin: 1988-1989 update, North Dakota Geological Survey Miscellaneous Series No. 74, 22p.
Sperr, J. T., Stancel, S. G., & Hendricks, M. L., in preparation, Wabek and Plaza Fields: carbonate shoreline traps in the Williston Basin of North Dakota, North Dakota Geological Survey Report of Investigation.
Webster, R. W., 1982, Analysis of petroleum source rocks of the Bakken Formation (Devonian and Mississippian) in North Dakota: Masters thesis, University of North Dakota, Grand Forks, North Dakota, 150p.
20

APPENDICES
21

22

APPENDIX 1-1990 NEW FIELD/POOL DISCOVERIES
COUNTY FILE NO. ORDER#
COMPo DATE OPERATOR WELL NAME. LOCAnON
FIELD -POOL (# OF PRODUCING WELLS IN POOL ON 12/31191)
roTAL MEASURED DEPTH PERFORATED -SPACING INTERVAL
lP (CUR. ·BOPD
GORORAV. WATER
McKenzie !()l25 5757
1116190 Pennzoil Exploration & Production Co. Snowcover #13-22 BN Sec. 13. Tl47N, RI02W
Snowcover Madison 0
13,388 160
9,498-9,570 II PNA
636 41"
50
Williams 12773 5827
2nl90 Oryx Energy Co. MamlOO #l-HD Sec. 2, T154N, R95w
Alkali Creek Bokkon 1
12,800 640
10,270-11,380 15 2
13,333 38.5~
0
McKenzie 12806 5826
2/26f90 MeridiAn Oil, Inc. Leland #41-25 Sec. 25. T147N, RI03W
Pierre Cr«k Madison 2
11,350 160
9.202-9,230 223 24
618 33.5"
57
McKenzie 7366 5808
3nJ90 Duncan Energy Co. Olive Wells #1--6 Sec. 6, T151N, R94W
Clark5 Creek Bokkon 1
10,762 160
10,566-10,594 173 5
1200 46"
0
Dunn 12837 5838
3124/90 BIA Oil Producers 9002 JV-P HaystAck #1 Sec. 32, T148N, R97W
Round Top Butte Tyler 1
9,750 160
8,074-8,095 130 8
230 37.1"
6
~ ~
McKenzie 8372 5900
4/4/90 Graham RQYslty, LTD. Harold J. Rogness #1 Sec. 26. Tl50N. Rl00W
Timber Creek MadiM'ln 1
14,620 160
9,838-9,846 9,864-9.886
6 6
NA 39.6"
10
Williams 12862 5870
5122190 Slawson Exploration Company, Inc. AnderlWO #1-33 See. 33, Tl57N, RIOlW
Otte, Red River 1
13,260 320
13,078-13,088 86 5
800 45"
63
McKenzie 10643 6066
6/23/90 Pennzoil Exploration & Production Co. Boxcar Butte 1f17-33 BN Sec. 27, Tl48N, RI02W
South Boxcar Madison 0
13,530 ---NONE SET
5 PNA
NA NA
NA
Williams 12864 5994
7/2/90 American Hooter Exploration LTD. Dollar Joe #41-16 H6 Sec. 16. TI54N. R98W
Truax Bokkon 1
13,400 320
J1,58.7·13,237 15 PNA
NA 40.5"
NA
Mountuil 12893 5996
7/8/90 American Hunter Exploration LTD AHEL et aI Newtown IIffJ Sec. 24, Tl51N, R93W
Big Bend Bokkon 1
13,643 320
11,109-11,851 11,959-13,611
22 22
NA NA
NA

FIELD TOTAL COUNTY -POOL MEASURED 1P FILE NO. ORDER#
COMPo DATE OPERATOR, WELL NAME, LOCATION
(# OF PRODUCING WELLS IN POOL ON 12/31191>
DEPTH -SPACING
PERFORATED Th.'TERVAL
(CUR. -BOPD
GORGRAV. WATER
Renville 12951 5931
712519Q Barbara Fasken Kolbo #1-30 Sec. 30, Tl63N. R87W
Stafford Madison 0
5.350' 80
5,155-5,162' 29 PNA
438 34"
0
Burke 12931 5930
Divide 12906 5m
81519Q
8/11/90
Barbara Fasken Schmid Estate #1-36 sec. 36, T164N, R88W
AnllChutz Corp. Wattelbd #8-14 Sec. 14, T160N, R95W
Lake View Madison 0
Stoneview Stonewall 5
5,200' 80
12,282' 320
4,878-4,888' 4,951-4,955' 4,988-4,998 5,032-5,039' 11,690-11,714' 11.732-11,740' 12.004-12,110' (gross)
30 PNA
480 162
433 34"
1093 46'
175
20
Williams 9800 6015
811319Q Dallas Engineering. Inc. Simpson #1 8«.27, T158N, R97W
New Horne Bill'" 1
14,433' 40
9.014-9,107' 9,18Q..9,330'(gross) 9,406-9,470'
9 81
TSTM NA
46
MoLeon 12959 5898
8/16/90 Balcron Oil Co. Wahner #33-15 Sec. 15. T150N. R89W
Lucky MOWId Madison 24
8.150' 80
7,934-7,958' 324 43
NA 36'
36
I>:l oj:>.
Ihmn 12927 6055
D>mn 12785 6005
9/If90
9125/90
Union Pacific Resources Co. Andeker 44-34 #1 Sec. 34. T146N. R94W
Maxus Exploration Co. Carus Fee #21-19 Sec. 19. T147N, R96W
Bailey
Bill'" 1
Big Gulch Billon 1
13,556' 320
11,700' 160
10,971-11,871' 11,920-12,706' 12,747-13.531 '
11,27Q..1I,304' 11,334-11,364'
18 NA
22 NA
722 34'
NA 34'
0
0
M,Leon 12946 5951
10/6/90 Balcron Oil Co. BOC ZJlhnow Federal #42-35 Sec. 35, T149N, R89W
Centennial Madison 2
8,050' 80
7,948-7,951 ' 184 182
293 38'
0
Ihmn 12972 5949
10/8/90 Pacific Enterprise! Oil Co. S. E. Russian Creek #42-18 Sec. 18, Tl4IN, R95W
Simon Butte Silurian 3
11,750' 320
11,541-11.550' 11,680-11,686'
262 81
95 43.9"
1(172
Dunn 12960 6030
12/1190 Oeolinear Co. Geolinear Packineau #1-17 Sec. 17, Tl49N, R93W
Manda"" Madison 2
9,520' 160
9,348.9,372' 9,384-9,407'
40 14
NA 39"
25
Dunn 10783 6046
12/5/90 North Anterican Resources Co. Hansen Stale #23·16 Sec. 16, TI4SN, R93W
Lake Do Red River I
13,244' 320
13,150-13,155' 38 PNA
NA 26.9"
23
APPENDIX II. 1991 NEW FIELD/POOL DISCOVERIES
COUNTY FILE NO. ORDER#
COMPo DATE OPERATOR WELL NAME LOCATION
FIELD -POOL (# OF PRODUCING WELLS IN POOL ON 12/31f91l
TOTAL MEASURED DEPTH PERFORATED -SPACING INTERVAL
IP (CUR. ~BOPD
GaR-GRAV. WATER
McKenzie 12984 6052
I116!91 Canoeo, Inc. Bully Federal·"A· #4 Sec. 21, T148N, RlOOW
Bully Bakken 0
13,552' 11,830-12,956' NONE SET
101 PNA
1099 NA
0
Dunn 6587 6110
2/3/91 Slaw!oo Exploration Co. Gull Slate #1-16 Sec. 16, T147N, R96W
Cedar Coulee Bokk", 1
13,633' 320
12.184-13,470' 12 58
lOOO(est) NA
NA
Divide 9608 6085
4126/91 GlG Energy LaVerne Haugen #32-19 Sec. 19, T163N, RIOIW
Big Dipper DuperQW I
10,930' 160
8,398·8,402' 8,420-8,426'
25 4
NA NA
0
Billings 11285 6170
6124/91 Balcrm Oil Co. Beaver Creek Pee #11-5 Sec. 5, T142N, RI02W
Roosevelt Stonewall I
12,660' 320
12,068-12,074' 55 20
800 45.5"
34
Williams 7834 6120
6/6/91 Broschat Engineering & Management Bendixson #1-17 &e. 17, Tl57N, RIOIW
Good Luck Silurian 1
12,985' 160
11,757-11,764' 244 30
123 45"
2
~ 01
Williams 12970 6121
6/17/91 Wyoming Resources COIp. Nuner #1-30 Sec. 30, Tl56N, RI0lW
Tyrone Red River I
13,507' 320
13,368-13,416(gross) 396 128
300 45.1°
84
Renville 13019 6155
6/21191 New Horizon Exploration, Inc. 11-7 Garven Sec. 7, Tl63N, R85W
Windmill Madison I
4,550' 80
4,422-4,426' 83 14
200 28"
3.5
Williams 8265 6214
7/14/91 BHP Petroleum (Americas) Inc. LoDg C_1I3 Sec. 36, TI54N, R99W
LoDgC_
Bokk'" I
12,338' 160
11,088-11,102' 11, 144--11 ,170'
34 4
1000 40"
3.5
Divide 10904 6195
9/11/91 Berco Resources Inc. Hanisch #24-25 Sec. 25, Tl61N, R98W
Moraine Silurian 1
10,705' 160
10,703-10,705' 198 45
677 44S
3

COUNfY FILENO. ORDER#
COMPo DATE OPERATOR WELL NAME. LOCATION
FIELD -POOL (# OF PRODUCING WELLS IN POOL ON 12/31191)
TOTAL MEASURED DEPTH PERFORATED ·SPACING INTERVAL
IP (CUR. -BOPD
GORGRAV. WATER
Mountrail 7851 6205
10/4/91 Brook.' Exploratioo, Inc. Rogstad #1-11 Sec. 11, Tl55N, R91W
Stanley
Ball'" 1
9,560' 160
9,384-9,404' 9,454-9.484'
52(est) 3
NA NA
0
Mountrail 13193 6472
1116/91 Texaco Exp1oratioo & Productioo Rau #34-1 Sec. 34, T154N, R88W
Osloe Madison 1
7,650' 80
7,323-7,338' 7,367-7,372'
38 SI
710 27
159
Burke 13229 6280
1118/91 Barbara Fasken Fisher #1-5 Sec, 5, T163N, R89W
Upper Des Lacs Madison 1
5.500' 80
5.255-5,270' 54 52
155 37
0
Ow'" 13237 6278
11122/91 Long Petroleum, Inc. McCarroll #16-1 Sec. 16, T162N, R86W
Grover MadiSOll 1
5,100' 80
4.956-4,959' 25 11
175 28·
120
t>:l 0>