oil market dynamics and 2016 outlook noted in the summary, the oil market faces both demand and...
TRANSCRIPT

J.P. Morgan Center for Commodities at the University of Colorado Denver Business School
GLOBAL COMMODITIES APPLIED RESEARCH DIGEST | Research Council Corner | The Economist’s Edge | www.jpmcc-gcard.org | Spring 2016
28
Oil Market Dynamics and 2016 Outlook Bluford Putnam, Ph.D. Chief Economist, CME Group; and Member of the J.P. Morgan Center for Commodities’ Research Council at the University of Colorado Denver Business School
Dr. Bluford Putnam (center), Chief Economist at the CME Group, moderating the Energy Panel at the J.P. Morgan Center for Commodities’ (JPMCC’s) Research Council meeting in the Center’s CoBank Lecture Hall on April 18, 2015. He is flanked (left) by Professor James Hamilton, University of California, San Diego; and (right) by Professor Vince Kaminski, Rice University.
Introduction In the second half of 2014, the oil market experienced a powerful downward price adjustment, which was sustained throughout 2015; please see Figure 1 on the next page. There are several long-term supply and demand forces in play as well as some shorter-term response factors that make for a very difficult mix to analyze going forward. On the supply side, there are the technology-driven improvements in extraction techniques that ignited a production boom in the United States commencing back in 2006. On the demand side, there is the huge shift in the global growth environment from an emerging market boom period in the early 2000s to a sluggish growth period after

Oil Market Dynamics and 2016 Outlook
GLOBAL COMMODITIES APPLIED RESEARCH DIGEST | Research Council Corner | The Economist’s Edge | www.jpmcc-gcard.org | Spring 2016
29
the 2008-2009 Great Recession. Also, on the demand side, technology has been steadily at work making transportation considerably more fuel-efficient. Shorter-term factors include the time-lagged feedback loops and the behavioral responses as producers have adjusted to a lower oil price environment, as well as policy responses, such as the lifting of the US ban on crude oil exports.
Figure 1 WTI and Brent Crude Oil Prices
Our forward looking analysis of the long-term trends in the crude oil market, including sluggish global growth, continued advances in transportation fuel efficiency, and extraction technology improvements, suggest that the era of relatively low prices could last for many years. In hindsight, what seems remarkable is that oil prices stayed as high as they did for as long as they did before breaking down in the second half of 2014. This research report starts with a brief review of the three key long-term trends we perceive are the main drivers of crude oil prices, and we assess the probabilities of any shifts in these trends. Second, we take a look back at the perceived catalyst that “broke the camel’s back” – namely the OPEC decision in November 2014 to keep producing at high levels even as oil prices were falling – and see what lessons can be learned about the behavior of suppliers in a low price environment. That is, there are short-term and long-term feedback loops from prices to production decisions that are quite complex, and that worked to reinforce lower oil prices, at least in 2015.
Oil Market Dynamics and 2016 Outlook
GLOBAL COMMODITIES APPLIED RESEARCH DIGEST | Research Council Corner | The Economist’s Edge | www.jpmcc-gcard.org | Spring 2016
30
Finally, we cover an important change in market structure – namely the lifting of the US ban on crude oil exports – to appreciate some of the dynamic shifts involving relative price spreads inside the workings of the broader global oil market. As suggested above, both our long-term and short-term analyses place a high probability on the base case that the low crude oil price environment has many years to run. There are, however, a number of very low probability scenarios that could cause a return to higher prices, which deserve at least some passing consideration. Critical Long-Term Trends Argue for a Sustained Low Price Environment As noted in the summary, the oil market faces both demand and supply trends arguing for the continuation of low prices. The two persistent demand trends are (1) slow global growth and (2) continued advances in transportation fuel efficiency. The long-term supply trend is grounded in the pace of technology improvements related to continued reductions in extraction costs. None of these factors seem likely to change course over the next several years and some may be accelerating in intensity. Slow Global Growth China is decelerating. Brazil is in recession. Russia is in recession. Most emerging market countries are struggling to grow. In the mature, industrial countries, among the US, Europe, and Japan, about the best that can be expected is 2% real GDP growth, and even that low bar may tough to achieve in 2016. In essence, the era of strong commodity demand in the early 2000s that was supported by 10% real GDP growth in China and strong growth in many emerging market countries is long gone with little prospect of returning. And, in the post-2008 environment, the mature, industrial economies are struggling to produce anything better than lackluster growth. The implications of this growth outlook are for very sluggish growth in energy demand, and especially for crude oil. And, it is not clear what could change the growth prospects. China’s growth deceleration is based on four key factors. First, the country grew rapidly as it invested in infrastructure at an impressive pace in the decades from 1980-2010, but with modernization has come the reality of diminishing returns from new spending on nation-building projects. Second, the aging demographic pattern is making a transition to a more domestic-demand driven growth model extremely difficult. The over-65 age group will make up more than 20% of the economy in the 2020s, and retirees spend considerably less per person than working age individuals. Rolling back the one-child policy, as was done in 2015, may help ease the demographic challenges by 2050, but not over the next decade or two. It takes thirty years to make a thirty year-old and materially impact the growth of the labor force. Third, China has benefited from a large rural-to-urban migration that has supported growth for several decades. As the percent of the rural population declines in the 2020s, though, this source of growth for the economy will diminish as well. Finally, we note that China is still an export-dependent country. With its major trading partners no longer posting solid growth, exports have stagnated.

Oil Market Dynamics and 2016 Outlook
GLOBAL COMMODITIES APPLIED RESEARCH DIGEST | Research Council Corner | The Economist’s Edge | www.jpmcc-gcard.org | Spring 2016
31
Importantly, none of these four key factors pointing to a slower growth rate are reversible by short-term government policy adjustments. Indeed, China is experiencing both a natural process of reduced long-term growth potential as a result of the success of its modernization programs while also dealing with slow-moving demographic patterns and lackluster global growth. Policies such as devaluing the currency are not likely to help much on the growth front in the short-run, even if a depreciating exchange rate against its trading partners is the most likely scenario for the currency going forward. We are not forecasting a hard-landing for China, but just a very bumpy road to a 3% real GDP trend growth rate in the 2020s, which is neither supportive of higher commodity prices in general or oil prices specifically. There is a secondary effect related to China’s impact on many commodities beyond oil. China’s shadow banking system has depended heavily on using commodities as collateral for lending. During the China super-growth period, the use of commodities as collateral meant that commodity demand was accelerated beyond that associated with rapid economic growth.1 The reverse is true, too. As China has decelerated and commodity prices have fallen, some collateral has been released into the market and the demand for new commodity collateral for lending has fallen, making the China impact on commodity prices even more pronounced than the economic deceleration might suggest. The US, Europe, and Japan have all tried every manner of expansionary monetary policy to pump up growth since the 2008-2009 recession to no avail. The lack of success of monetary policy to create superior growth is because it cannot address the fundamental reasons for slow growth.2 The first and largest challenge to growth potential in these mature industrial countries is the demographic pattern. Populations are not growing and are aging while labor force growth is next to zero. On the demand side, as already noted for the case of China, per capita consumption spending declines for the retired demographic, and this is the faster growing segment of the population. With respect to potential GDP growth, if there is little to no labor force growth then it takes above average increases in labor productivity to create superior growth rates. While this is possible with technological gains and outsized capital investments, it is highly unlikely in mature economies. Indeed, without major tax and labor market structural reforms that are only remote possibilities, it seems unlikely that sustained, above-average labor productivity gains are possible. Low short-term interest rates and central bank asset purchases (i.e., quantitative easing) can raise asset prices above what they might have otherwise been, but there is little to no evidence that they can raise labor productivity. Recessions or slow growth in most of the emerging market countries are not so easily grouped into one cause. Commodity producing countries are naturally suffering in a slow demand world. But political risks are high and rising in a number of countries from Brazil to Turkey. And, in the Asian countries close to China, it is the deceleration of their big neighbor that dominates growth prospects. Regardless of the cause, it seems hard to project resurgence in emerging market country growth without either stronger growth in China or in the mature industrial countries, and neither is in the cards for 2016.

Oil Market Dynamics and 2016 Outlook
GLOBAL COMMODITIES APPLIED RESEARCH DIGEST | Research Council Corner | The Economist’s Edge | www.jpmcc-gcard.org | Spring 2016
32
Fuel Efficiency Also on the demand side, and not always given its proper due, is the continued progress in transportation fuel efficiency. Crude oil is 70% to 75% a transportation fuel in terms of the uses of refined petroleum product. The relentless march toward greater fuel efficiency is both impressive and a continued drag on crude oil demand growth. The elasticity of demand for crude oil with respect to real GDP growth is a on a long-run declining path. Indeed, there appears to be considerable gains still possible in the fuel efficiencies of internal combustion engine vehicles, including the ability to use lighter materials such as aluminum in pick-up truck frames. Natural gas is starting to make inroads into transportation in bus fleets, in long-haul truck transport, and in railroad engines. Electrical-driven vehicles are still a minute portion of the transportation system, but longer-term advances in battery technology could change that, especially if batteries can be made both lighter as well as more efficient. And, the promise of clean-burning hydrogen, with H2O coming out the exhaust pipe, remains a long-term dream attracting considerable research and development funding. Risk Factors While the base case of slow global growth has a very high probability associated with it, there are risks. First, global growth could be even slower, almost stagnant, if China’s deceleration turns into a hard landing. We give this possibility a meaningful 25% probability, and it would most likely point to a temporarily lower level of global crude oil prices. Second, supply disruptions are possible depending on how tensions in the Middle East, particularly relationships developments among Saudi Arabia, Iran, and Iraq. At the present time we place the probability of military action that would impair global supply as very small, less than 10%; nevertheless this possibility is worthy of close monitoring as this low probability event would come with huge price action potential to the upside. Appreciating the Catalyst for the Price Break When long-term supply and demand forces are in play, it can take markets many years to realize their full impact. Often there is a catalyst for a price break, which can be incorrectly interpreted just because of its association in timing with the critical event that may have been building for years. We argue that this was the case in the fall of 2014. Crude oil prices had been bouncing around $100/barrel all through the first half of the year 2014. Prices started drifting down in July 2014, and broke below $90/barrel in October 2014. In mid-November, prices broke below $80/barrel. On November 27th, 2014, the Organization of Petroleum Exporting Countries (OPEC) met in Vienna and decided to maintain production rather than cutback and try to support the market. Please see Figure 2 on the next page.

Oil Market Dynamics and 2016 Outlook
GLOBAL COMMODITIES APPLIED RESEARCH DIGEST | Research Council Corner | The Economist’s Edge | www.jpmcc-gcard.org | Spring 2016
33
Figure 2 NYMEX WTI Crude Oil: 2014
“Recording its concern over the rapid decline in oil prices in recent months, the Conference concurred that stable oil prices – at a level which did not affect global economic growth but which, at the same time, allowed producers to receive a decent income and to invest to meet future demand – were vital for world economic wellbeing. Accordingly, in the interest of restoring market equilibrium, the Conference decided to maintain the production level of 30.0 mb/d, as was agreed in December 2011.3 The OPEC statement, emphasizing the need for oil producing countries to keep producing to maintain their incomes, fueled concerns that oil prices would fall further, and fall they did. During 2015, much has been made by many analysts about the Saudi Arabian strategy to increase production to squeeze out high marginal cost producers. We would argue that this is much more rationale than strategy. That is, the key problem for Saudi Arabia, not to mention virtually every other OPEC member, is that their government spending programs were built on assumptions of crude oil prices staying above $80 per barrel (or perhaps a little higher) for as far as the eye could see. $40 per barrel oil puts tremendous domestic political risk into the equation for the governing authorities, as it makes it nearly impossible to continue with planned spending and subsidy programs without material adjustments.

Oil Market Dynamics and 2016 Outlook
GLOBAL COMMODITIES APPLIED RESEARCH DIGEST | Research Council Corner | The Economist’s Edge | www.jpmcc-gcard.org | Spring 2016
34
Indeed, Saudi Arabia has gone to the debt markets for new money as well as cutback government spending and subsidies. By increasing production, they were able in some small way to keep the cash flowing. As we analyze the behavioral response and feedback loops to lower prices in the crude oil market, we will again come back to the theme that long-term spending and liability commitments work to keep production strong, even with low prices, at least for an extended period of time, which creates complex lags in the price to production response cycles. Behavioral Feedbacks and Policy Responses Impact Crude Oil Spreads US Production Dynamics When crude oil prices collapsed by half in the fourth quarter of 2014, many analysts expected a relatively quick supply response based on models taught in every Economics 101 class. Unfortunately, the basic economics version of supply and demand knows nothing about debt, time, and cash flow, among many other things. Many wells in the United States were shut down in 2015 as predicted, but a focus on getting more oil from the most efficient wells kept production higher than most analysts expected.4 There were a couple of reasons for this common miscalculation. One has to appreciate the difference between cash flow and accounting reports. Oil producers, just like mom and pop convenience stores, know that cash is king. It is very easy to include non-cash items, such as depreciation, as well as certain investment or capital costs, into the calculation of how much money is required to produce the next barrel of oil. What really matters to the oil producer, though, is the actual cash costs of the next barrel of oil, and these cash costs can be substantially lower than the costs as measured by accounting principles and purported to represent the dollar cost per barrel.5 What this means is that on a going-forward cash basis, production that looked unprofitable on an accounting basis was still net cash flow positive or only small cash losers. So the producer kept on pumping – oil and cash. Debt matters, too, because many oil producers have a lot of it. If they were to shut their production down, there would not only be no flow of oil, but also no cash flow; and the cash is needed to pay their debts. Pumping oil at a loss makes sense if one can stay in the game for the long run and avoid bankruptcy. And then there are the advances in technology. Producers in the US using hydraulic fracturing methods and horizontal drilling have been increasingly improving their ability to finish wells faster and get to the new wells sooner at lower costs. “Finishing faster” simply means sharply increased production in the first months of a well’s life, allowing the producer to close the well sooner and move to the next location. Rigs are now available that can “walk” (albeit very slowly) to the next drill site. Enhanced fracturing techniques can improve extraction results. It all added up in 2015 to an ability by US producers to cut rig count and still maintain strong production. What may change in 2016 is the lagged impact of sharply reduced capital investment in 2015. That is, while producers were using technological improvements to get more oil from fewer rigs, they were not investing in new capabilities. Virtually every capital investment project that could reasonably be delayed

Oil Market Dynamics and 2016 Outlook
GLOBAL COMMODITIES APPLIED RESEARCH DIGEST | Research Council Corner | The Economist’s Edge | www.jpmcc-gcard.org | Spring 2016
35
in 2015 was, indeed, delayed or postponed indefinitely, while oil producers assessed their economic future in a lower price environment. By the second half of 2015, most producers had come to realize that that they were in for a very long period of lower prices, and the process of downsizing and consolidation began in earnest. We draw two conclusions from the mix of improved extraction technology and lack of new capital investment. First, when oil prices rise, at some threshold price, probably north of $50 per barrel yet well below $80 per barrel, new production will again be profitable and will come on line faster than in the past. Second, the lack of capital investment in 2015, and likely lack of investment in 2016, will start to hit production, such that US production in 2016 and beyond may show material declines from 2015 and 2014 levels so long as oil prices are below $50 per barrel. This capital investment impact may be much larger for higher cost production areas such as the North Sea, which has seen declining production of oil for over a decade and has higher ongoing maintenance and marginal costs. From a global supply picture, the reduced production from the US and the North Sea, and probably Alberta as well, in 2016, is not likely to impact prices since it may be more or less offset by rising production entering the world market from Iran. It is unclear how the balance will tilt, but the overall impact on prices may be more to cause short-term volatility within a wide price range rather than to push prices back onto a sustained rising trend. US Lifts Oil Export Ban The US crude oil export ban was lifted in December 2015 as part of the legislation to fund the Government through September 2016. The export ban was imposed back in 1975 under the administration of President Gerald Ford, in the midst of public anxiety over (a) the rising power of OPEC, (b) reduced US influence over global economic conditions, and (c) fears of slow growth and high inflation – then known as stagflation. In fact, through Presidential actions over the years and other rule changes, the ban was quite leaky, so to speak. As a result, the short-term impact on oil prices of lifting the export ban is likely to be relatively small in terms of prices and not an important driver for production. Nevertheless, anytime frictions and barriers to free trade are removed the market price discovery process is made more robust and capital allocation more efficient. Hence, the lifting of the export ban is a positive factor for the role of US oil (West Texas Intermediate, aka WTI) as a global benchmark. Here we provide our perspective on some of the key questions being asked. 1. What Has Really Changed? Under the old law, US refined product was allowed for export. Crude oil exports required licenses. Effectively, US crude oil could be exported to Canada and Mexico by permits, which were virtually automatically granted, as were re-exports of foreign-sourced oil, and some crude oil exports from California and Alaska. Moreover, the definition of refined product had been weakened in the last several years to include some lightly altered crude products (i.e., lighter condensate products). With the lifting of the crude oil ban, US producers now can export freely; however, do not expect much of a rise in

Oil Market Dynamics and 2016 Outlook
GLOBAL COMMODITIES APPLIED RESEARCH DIGEST | Research Council Corner | The Economist’s Edge | www.jpmcc-gcard.org | Spring 2016
36
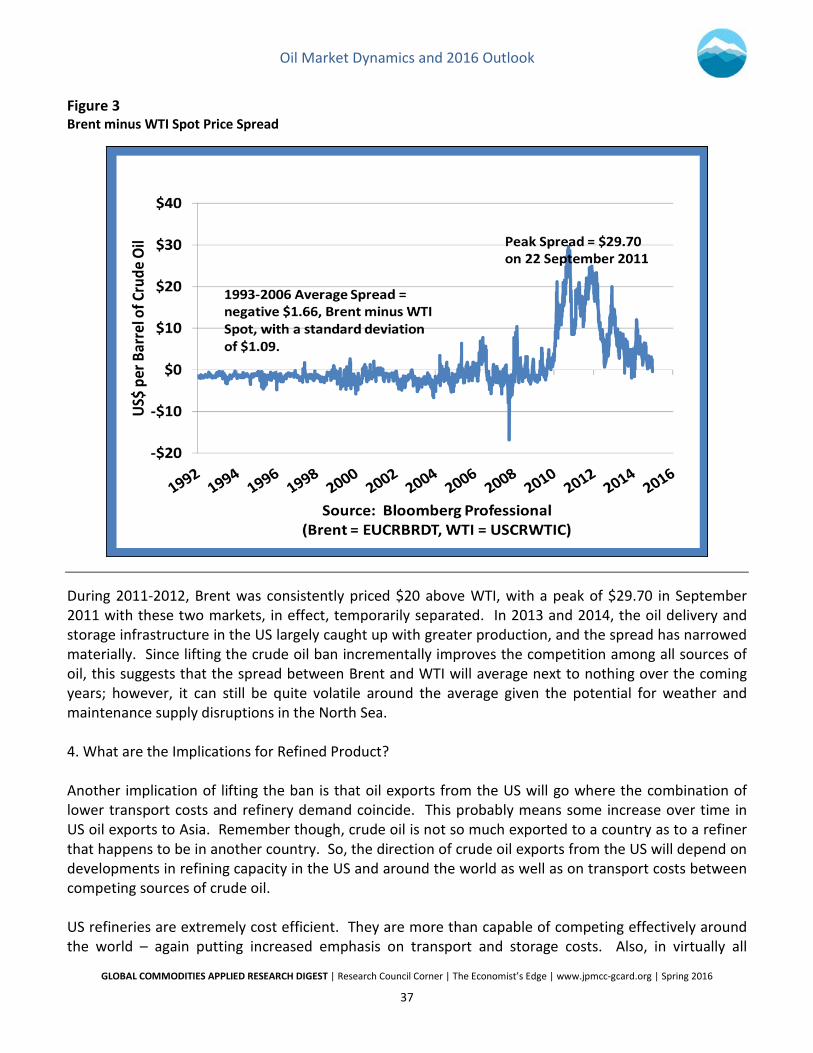
exports of crude oil any time soon. Indeed, the sum of crude oil plus refined product exports is likely to remain more or less on its current trend for 2016-2017. 2. Will Lifting the Crude Oil Export Ban Result in Greater US Production? No. The low price environment for crude oil globally that commenced in Q4/2014 is still with us, and the longer-term expectation for price is the key driver of future production. As noted earlier, China is still decelerating. Growth in emerging markets is slow. Europe, the US, Japan, all may grow 1% to 2% in real GDP terms. No major demand surges here. And as discussed in the technology trends section, oil is largely a transportation fuel. Transportation is becoming steadily more energy efficient. In short, as we have argued, the demand situation does not support a return to a higher price environment whether the US exports oil or not. Nevertheless, the lifting of the US crude oil export ban will mean some small benefits to US producers based on the tighter Bakken-WTI spreads, because Bakken and other domestic sweet crudes will now have new export markets that will bring higher revenue overall. 3. What is the Likely Impact on Brent-WTI and Other Crude Oil Price Spreads? Our view is that any policy change that removes market frictions and makes the connection among different sources of oil around the world more efficient will assist the robustness of the global oil price discovery process. Thus, the lifting of the US crude oil export ban could make an incremental difference in narrowing the spread between North Sea Brent and US West Texas Intermediate (WTI). Figure 3 on the next page shows the history of this spread since 1992. Indeed, in early December 2015, with news that the crude oil export ban might be lifted, there were some changes in the price spreads between different grades of crude. The WTI-Brent spread narrowed slightly in both spot and longer-dated futures. Also, the Bakken-WTI spread tightened. In addition, in the US Gulf Coast, WTI and LLS (Louisiana Light Sweet Crude) went up in price relative to the sour crude grades (e.g., Mars). The export ban artificially depressed sweet crude in the U.S. Gulf Coast market relative to sour crude. So, there was a perceptible change in the sweet-sour spread in the US Gulf Coast market in the weeks prior to the lifting of the crude oil export ban. Prior to 2006 and the emerging US oil production boom, WTI and Brent met, in a competitive sense, at the refineries in the northeast part of the US. From 1993-2006, the Brent-WTI spot price spread was typically extremely narrow and not very volatile. With the production boom, higher US oil production eventually overwhelmed the capacity to deliver oil where prices were higher, and refined product exports had not yet taken off.
Oil Market Dynamics and 2016 Outlook
GLOBAL COMMODITIES APPLIED RESEARCH DIGEST | Research Council Corner | The Economist’s Edge | www.jpmcc-gcard.org | Spring 2016
37
Figure 3 Brent minus WTI Spot Price Spread
During 2011-2012, Brent was consistently priced $20 above WTI, with a peak of $29.70 in September 2011 with these two markets, in effect, temporarily separated. In 2013 and 2014, the oil delivery and storage infrastructure in the US largely caught up with greater production, and the spread has narrowed materially. Since lifting the crude oil ban incrementally improves the competition among all sources of oil, this suggests that the spread between Brent and WTI will average next to nothing over the coming years; however, it can still be quite volatile around the average given the potential for weather and maintenance supply disruptions in the North Sea. 4. What are the Implications for Refined Product? Another implication of lifting the ban is that oil exports from the US will go where the combination of lower transport costs and refinery demand coincide. This probably means some increase over time in US oil exports to Asia. Remember though, crude oil is not so much exported to a country as to a refiner that happens to be in another country. So, the direction of crude oil exports from the US will depend on developments in refining capacity in the US and around the world as well as on transport costs between competing sources of crude oil. US refineries are extremely cost efficient. They are more than capable of competing effectively around the world – again putting increased emphasis on transport and storage costs. Also, in virtually all
Oil Market Dynamics and 2016 Outlook
GLOBAL COMMODITIES APPLIED RESEARCH DIGEST | Research Council Corner | The Economist’s Edge | www.jpmcc-gcard.org | Spring 2016
38
countries around the world, it is difficult to get the permits to build new refineries – not impossible, just hard. So, to build a new refinery, one needs billions of dollars, a steady source of foreseeable demand, and reasonable transport costs to get the crude oil from the source to the new refinery. Put another way, changes in the global environment for refineries will drive some shift in exports over the coming years, but not quickly, meaning US refined product exports will probably hold up quite well even as there may be incremental increases in crude oil exports. Long-term, as the competitive landscape for refineries adjusts, there may be some incremental narrowing of refined product price spreads relative to crude oil since the crude oil market will be just a little more efficient. This will take time and may turn out to be relatively small impact. 5. What is the State of the US infrastructure for Exporting Crude Oil? The lifting of the export ban will have the biggest impact in the U.S. Gulf Coast, and to a lesser extent on the West Coast and Alaska. The infrastructure for WTI exports in the U.S. Gulf Coast is already completed, and the U.S. is actively exporting some crude oil and lighter condensate products, not to mention all the Natural Gas Liquids (NGLs) such as propane (which use the same export terminals.) At this time, there is adequate capacity to handle any increases in export flow. Indeed, in January 2016 the first boat loaded with US crude was leaving Texas for Europe. Conclusion Our analysis points to a base case for a long period of low crude oil prices. The China-driven boom in emerging market demand is over. Slow growth due to aging demographic challenges will keep real GDP growth very slow in the mature industrial countries. Technological advances in fuel efficiency in transportation mean the elasticity of demand for crude oil with respect to economic growth is diminishing. And on the supply-side, further technological improvements in oil extraction are reducing costs, allowing more production from fewer oilrigs. This all adds up to a very long and prolonged period of low oil prices as our base case. The price risks to the downside for oil prices come mostly from the possibility of a hard landing in the Chinese economy leading to a global recession – not likely but worth considering. The price risks to the upside come from conflict in the Middle East, possibility involving Saudi Arabia and Iran, leading to major supply disruptions – again, this is a small probability event with a huge impact, so monitoring is required.
Endnotes All examples in this report are hypothetical interpretations of situations and are used for explanation purposes only. The views in this report reflect solely those of the author and not necessarily those of CME Group or its affiliated institutions. This report and the information herein should not be considered investment advice or the results of actual market experience.

Oil Market Dynamics and 2016 Outlook
GLOBAL COMMODITIES APPLIED RESEARCH DIGEST | Research Council Corner | The Economist’s Edge | www.jpmcc-gcard.org | Spring 2016
39
1 Shaun K. Roache and Marina Rousset, “China: Credit, Collateral, and Commodity Prices,” Hong Kong Monetary Authority, HKIMR Working Paper No. 27/2015, Fall 2015. 2 Bluford H. Putnam, “Essential Concepts Necessary to Consider When Evaluating the Efficacy of Quantitative Easing.” Review of Financial Economics 22.1 (2013): 1-7. 3 “OPEC 166th Meeting Concludes,” Press Release No. 7/2014, Vienna, Austria; November 27, 2014; http://www.opec.org/opec_web/en/press_room/2938.htm 4 James Hamilton, Professor of Economics, University of California at San Diego, Presentation on “Fracking, China, and the Geopolitics of Oil,” at the Research Council, J.P. Morgan Center for Commodities (JPMCC), University of Colorado Denver Business School, December 4, 2015. 5 Bluford H. Putnam, “Oil Price Lessons from 1983,” Euromoney, December 15, 2014; and Bluford H. Putnam and Desiree Schwartz, “Visualizing Energy Market Dynamics,” December 4, 2014, CME Group, also reprinted in the Hedge Fund Journal, December 2014. Author Biography BLUFORD PUTNAM, Ph.D. Chief Economist, CME Group Bluford (Blu) Putnam has served as Managing Director and Chief Economist of CME Group since May 2011. He is responsible for leading economic analysis on global financial markets by identifying emerging trends, evaluating economic factors and forecasting their impact on CME Group and the company's business strategy. He also serves as CME Group's spokesperson on global economic conditions and manages external research initiatives. Prior to joining CME Group, Dr. Putnam gained more than 35 years of experience in the financial services industry with concentrations in central banking, investment research and portfolio management. He most recently served as Managing Partner for Bayesian Edge Technology & Solutions, Ltd., a financial risk management and portfolio advisory service he founded in 2000. He also has served as President of CDC Investment Management Corporation and Managing Director and Chief Investment Officer for Equities and Asset Allocation at the Bankers Trust Company in New York. His background also includes economist positions with Kleinwort Benson, Ltd., Morgan Stanley & Company, Chase Manhattan Bank and the Federal Reserve Bank of New York. Dr. Putnam holds a bachelor's degree in liberal arts from Florida Presbyterian College (later renamed Eckerd College) and a Ph.D. in economics from Tulane University. He has authored five books on international finance, as well as many articles that have been published in academic journals and business publications. Dr. Putnam is also a member of the J.P. Morgan Center for Commodities’ Research Council at the University of Colorado Denver Business School.