oil spill monitoring handbook for pdfing - shoreline …shorelinescat.com/documents/manuals/amsa...
TRANSCRIPT
Oil Spill Monitoring
HANDBOOK

i
OIL SPILL MONITORING HANDBOOK
ii
Acknowledgments
This Handbook has been prepared by Wardrop Consulting (Australia) in association with the Cawthron Institute (New Zealand) at the request of the Australian Maritime Safety Authority (AMSA) and New Zealand Marine Safety Authority (MSA). A number of people and Agencies have contributed to this work and are acknowledged below (in alphabetical order).
Wardrop Consulting
Tracey Baxter, AMSA John Leeder, Leeder Consulting Trevor Gilbert, AMSA Leigh Stevens, Cawthron Institute Shayne Wilde, AMSA Julie Wall, NSW Waterways Authority
Julian Roberts, MSA NZ John A. Wardrop, Wardrop Consulting Figures in Guidelines S.3, S.5 and S.8 are from Wardrop, 2000. National Library of Australia Cataloguing-in Publication Data: AMSA. 2003. Oil Spill Monitoring Handbook. Prepared by Wardrop Consulting and the Cawthron Institute for the Australian Maritime Safety Authority (AMSA) and the Marine Safety Authority of New Zealand (MSA). Published by AMSA, Canberra. ISBN 0 642 70992 0 Authors Note: This document should be read in association with the Oil Spill Monitoring Background Paper (AMSA, 2003). Cover only updated (new AMSA and Maritime NZ logos) 2006. Cover photo by Jamie Storrie, Department of the Environment and Heritage. Copyright This work is copyright. Apart from any fair dealing for the purpose of study, research criticism or review, as permitted under the Copyright Act this publication must not be reproduced in whole or in part without the written permission of the Copyright Holder. Unless other authorship is cited in the text or acknowledgements above, the copyright holder is the Australian Maritime Safety Authority (AMSA) and the Marine Safety Authority of New Zealand (MSA). Enquiries should be directed to: The Manager, Environment Protection Standards, Australian Maritime Safety Authority, GPO Box 2181, Canberra City, ACT Australia 2601.

iii
TABLE OF CONTENTS Title Page iAcknowledgements iiNational Library of Australia Cataloguing-in Publication data iiAuthors Note iiCopyright iiTable of Contents iiiRapid Reference for Spill Response Monitoring Requirements vii 1.0 INTRODUCTION 11.1 The Purpose of this Handbook 11.2 Types of Monitoring 11.3 Using this Handbook 4 2.0 MONITORING PROGRAMME DESIGN AND EXECUTION 72.1 Designing the Programme 72.2 Setting Objectives: Defining the Question 72.3 Identifying Information Needs 102.4 Programme Design 11 2.4.1 Scale of the Programme 11 2.4.2 Field Assessment vs Field Sampling 11 2.4.3 Quality of Data 12 2.4.4 Design Constraints 142.5 Training Requirements 142.6 Resources 142.7 Field Deployment 152.8 Determining the End of the Programme 15 3.0 MONITORING THE MARINE ENVIRONMENT 173.1 Physical Environment 173.2 Oil at Sea 17 3.2.1 Monitoring the Oil Slick 19 3.2.2 Monitoring the Oil 193.3 Marine Environmental Effects 36 3.3.1 Habitats 36 3.3.2 Target Fauna and Flora 37 3.3.3 Parameters 38

iv
4.0 MONITORING THE SHORELINE ENVIRONMENT 45 4.1 Organisation of Shoreline Monitoring 45 4.2 Physical Environment 48 4.2.1 Substrate Type 48 4.2.2 Shoreline Form 48 4.2.3 Shoreline Energy 49 4.3 Oil on Shorelines 54 4.3.1 Aerial Surveys 54 4.3.2 Ground Surveys 57 4.3.3 Field Detection of Petroleum Hydrocarbons 57 4.3.4 Sediment Sampling Methods 63 4.4 Environmental Effects 69 4.4.1 Habitats 69 4.4.2 Target Fauna and Flora 69 4.4.3 Parameters 69 5.0 GENERAL METHODS 77 5.1 Field Sampling Methods 77 5.1.1 Selecting the Sampling Location 77 5.1.2 Use of Quadrats and Transects 78 5.2 Sample Handling 78 5.3 Photo-documentation 79 5.3.1 Using Photographs and Photo-quadrats 80 5.3.2 Photo-transects and Video-transects 80 5.4 Laboratory Methods 1: Chemical Analysis 85 5.5 Laboratory Methods 2: Toxicological Tests 85 6.0 SAFE FIELD OPERATIONS 87 6.1 Identifying Site Hazards 87 6.2 Personnel Tracking 90 6.3 Identifying Chemical Hazards 90 6.4 Monitoring Air Quality: Volatiles 90 6.5 Communications 90 7.0 DATA CONTROL AND MANAGEMENT 93 7.1 Data Transfer and Storage 93 7.2 Security and Data Control 93 7.3 Data Quality 94 8.0 FURTHER READING AND INFORMATION 97

v
APPENDIX A: GLOSSARY 99APPENDIX B: CONVERSION TABLES 103
LIST OF TABLES Table 1.1 Classification of Spill Monitoring According to
Primary Objectives 2
Table 1.2 Description of Monitoring According to the Stage of the Incident
3
Table 1.3 Examples of Type I and Type II Monitoring During a Spill Response
6
Table 2.1 Setting Objectives: Example Scenario 10Table 2.2 Design Constraints 13Table 2.3 Possible Monitoring Termination Criteria 16Table 7.1 Possible Monitoring and Sampling Errors 94
LIST OF FIGURES Figure 1.1 Stages in the Planning and Execution of a
Monitoring Programme 4
Figure 3.1 Manual Calculation of Surface Slick Trajectory 19Figure 4.1 Shoreline Segments 46Figure 4.2 General Indicators of Shoreline Energy 49Figure 4.3 Subsurface Oil 57Figure 4.4 Determining Sediment Sampling Method 63Figure 4.5 Mangroves Showing Brown (Dead) Leaves 76Figure 4.6 Oiled Mangroves 76Figure 5.1 Selected Quadrats 77Figure 5.2 Random Quadrats 77Figure 5.3 Counting Intertidal Epifauna within a Quadrat 78Figure 5.4 Transects 79Figure 5.5 Frame for Photo-documentation of Quadrats 80Figure 6.1 Environmental Hazards 92

vi
LIST OF GUIDELINES D.1 Designing a Monitoring Programme 8 M.1 Estimating Sea State 18M.2 Locating Oil Slicks at Sea 21M.3 Characterising Oil Slicks at Sea 22M.4 Video/Photo Surveying of Slicks at Sea 24M.5 Visual Monitoring of Dispersant Operations 25M.6 Sampling Surface Oil Slicks and Films 27M.7 Sampling of Subsurface Water 29M.8 Field Measurement of Oil in Water 31M.9 Sampling of Seabed Sediments 33M.10 Monitoring Damage to Commercial or Recreational Species 40M.11 Monitoring Damage to Marine Megafauna 41M.12 Monitoring Damage to Marine Flora 42M.13 Monitoring Damage to Plankton 43M.14 Sampling of Organisms for Taint Testing 44 S.1 Determining Sectors and Segments 47S.2 Characterising Shoreline Substrate 50S.3 Determining Beach Profile (Gradient) 51S.4 Aerial Survey of Shorelines 55S.5 Assessment of Oiled Shorelines: Surface Oil 58S.6 Assessment of Oiled Shorelines: Subsurface Oil 60S.7 Field Detection of Petroleum Hydrocarbons 62S.8 Obtaining Sediment Samples 64S.9 Calculating the Mass of Oil in Shorelines 68S.10 Monitoring Damage to Invertebrate Beach Fauna 70S.11 Monitoring Damage to Coastal Marine Mammals 71S.12 Monitoring Damage to Coastal Birds 72S.13 Monitoring Damage to Marine Reptiles 73S.14 Monitoring Damage to Coastal Flora 74 G.1 Handling of Samples 81G.2 Decontamination of Equipment 84G.3 Chemical Analysis of Samples 86 HS.1 Identification of Site Hazards 88HS.2 Deployment into Remote Areas 91 Q.1 Data Management 95

vii
THIS PAGE AND NEXT TO BE REPLACED WITH RAPID RESPONSE TABLE
(A4 FOLD-OUT)

viii
THIS PAGE AND PREVIOUS TO BE REPLACED WITH RAPID RESPONSE TABLE
(A4 FOLD-OUT)

Oil Spill Monitoring Handbook
1
1.0 INTRODUCTION 1.1 The Purpose of this Handbook This Handbook provides guidelines for undertaking monitoring for actual or potential marine spill responses. It focuses on oil spill monitoring; however the guidelines presented are also generally applicable for monitoring marine chemical spills. It is designed for use by personnel who are familiar with the field information needed during a spill response. A scientific background, whilst an advantage, is not required. The Handbook provides guidelines on the scope, scale and design of monitoring methods that relate primarily to monitoring undertaken to directly assist in the planning or execution of a spill response, and which is likely to be considered “reasonable” and “appropriate” by insurers and National agencies i.e. “Type I” monitoring, (see Section 1.2). “Type II” monitoring e.g. scientific investigation, pre-spill (baseline) monitoring, post spill monitoring, or the assessment of environmental or economic damages, is not specifically addressed by the Handbook, although many of the guidelines are also relevant for “Type II” studies. As such, this Handbook should be seen as a Guideline document, and not a set of rules that must be rigidly adhered to. Designers of both Type I and Type II programmes must consider the particular characteristics of the spill together with the specific objectives of their study and ensure the consequent design, methods, sampling size and other components of the programme meet their specific monitoring needs. 1.2 Types of Monitoring Classifying monitoring according to its underlying purpose helps define the likely methodologies to be used and to determine whether the monitoring is likely to be considered a legitimate spill response cost. A two-class monitoring nomenclature has been developed in Australia and New Zealand. The two classes are defined according to the Primary Objectives of the monitoring programme: • Type I Monitoring: which provides information of direct relevance to
spill response operations, i.e. information needed to plan or execute response or cleanup strategies.
Oil Spill Monitoring Handbook
2
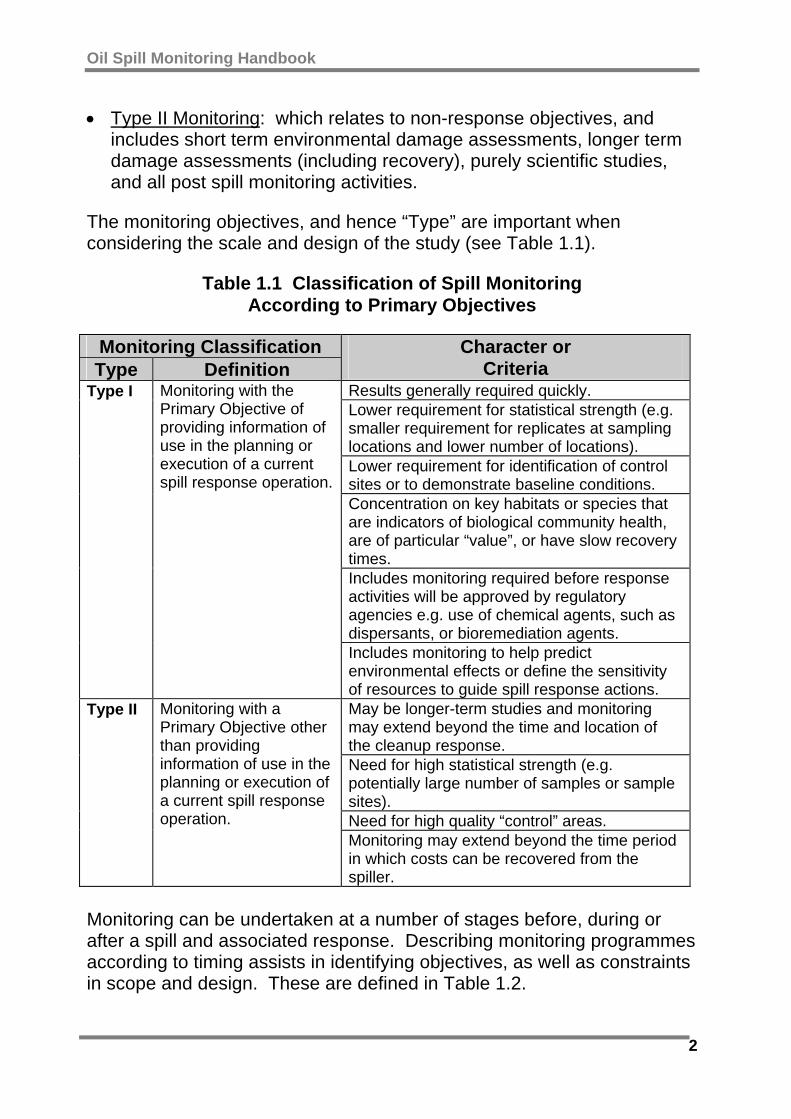
• Type II Monitoring: which relates to non-response objectives, and includes short term environmental damage assessments, longer term damage assessments (including recovery), purely scientific studies, and all post spill monitoring activities.
The monitoring objectives, and hence “Type” are important when considering the scale and design of the study (see Table 1.1).
Table 1.1 Classification of Spill Monitoring According to Primary Objectives
Monitoring Classification Type Definition
Character or Criteria
Results generally required quickly. Lower requirement for statistical strength (e.g. smaller requirement for replicates at sampling locations and lower number of locations). Lower requirement for identification of control sites or to demonstrate baseline conditions. Concentration on key habitats or species that are indicators of biological community health, are of particular “value”, or have slow recovery times. Includes monitoring required before response activities will be approved by regulatory agencies e.g. use of chemical agents, such as dispersants, or bioremediation agents.
Type I Monitoring with the Primary Objective of providing information of use in the planning or execution of a current spill response operation.
Includes monitoring to help predict environmental effects or define the sensitivity of resources to guide spill response actions. May be longer-term studies and monitoring may extend beyond the time and location of the cleanup response. Need for high statistical strength (e.g. potentially large number of samples or sample sites). Need for high quality “control” areas.
Type II Monitoring with a Primary Objective other than providing information of use in the planning or execution of a current spill response operation.
Monitoring may extend beyond the time period in which costs can be recovered from the spiller.
Monitoring can be undertaken at a number of stages before, during or after a spill and associated response. Describing monitoring programmes according to timing assists in identifying objectives, as well as constraints in scope and design. These are defined in Table 1.2.
Oil Spill Monitoring Handbook
3
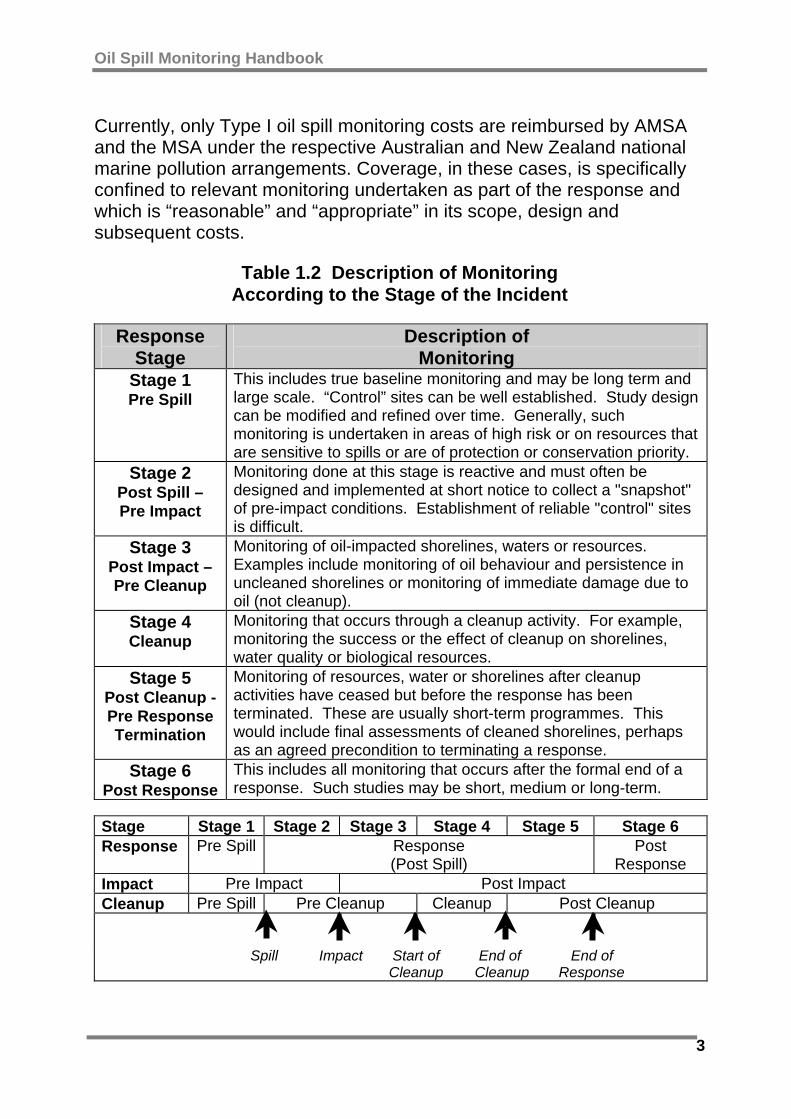
Currently, only Type I oil spill monitoring costs are reimbursed by AMSA and the MSA under the respective Australian and New Zealand national marine pollution arrangements. Coverage, in these cases, is specifically confined to relevant monitoring undertaken as part of the response and which is “reasonable” and “appropriate” in its scope, design and subsequent costs.
Table 1.2 Description of Monitoring According to the Stage of the Incident
Response
Stage Description of
Monitoring Stage 1 Pre Spill
This includes true baseline monitoring and may be long term and large scale. “Control” sites can be well established. Study design can be modified and refined over time. Generally, such monitoring is undertaken in areas of high risk or on resources that are sensitive to spills or are of protection or conservation priority.
Stage 2 Post Spill – Pre Impact
Monitoring done at this stage is reactive and must often be designed and implemented at short notice to collect a "snapshot" of pre-impact conditions. Establishment of reliable "control" sites is difficult.
Stage 3 Post Impact – Pre Cleanup
Monitoring of oil-impacted shorelines, waters or resources. Examples include monitoring of oil behaviour and persistence in uncleaned shorelines or monitoring of immediate damage due to oil (not cleanup).
Stage 4 Cleanup
Monitoring that occurs through a cleanup activity. For example, monitoring the success or the effect of cleanup on shorelines, water quality or biological resources.
Stage 5 Post Cleanup - Pre Response Termination
Monitoring of resources, water or shorelines after cleanup activities have ceased but before the response has been terminated. These are usually short-term programmes. This would include final assessments of cleaned shorelines, perhaps as an agreed precondition to terminating a response.
Stage 6 Post Response
This includes all monitoring that occurs after the formal end of a response. Such studies may be short, medium or long-term.
Stage Stage 1 Stage 2 Stage 3 Stage 4 Stage 5 Stage 6 Response Pre Spill Response
(Post Spill) Post
Response Impact Pre Impact Post Impact Cleanup Pre Spill Pre Cleanup Cleanup Post Cleanup
Spill Impact Start of
Cleanup End of
Cleanup End of Response

Oil Spill Monitoring Handbook
4
Type II monitoring costs are not currently reimbursed but in some cases may be recoverable from the spiller's insurer (e.g. a vessel’s Protection and Indemnity (P&I) Club), for example if damage assessment is required for prosecutions. In determining what is likely to be “reasonable”, consider the following: • Are results of significant value in the design, execution or assessment
of response actions? • Is the scope of the programme, and speed of obtaining results, the
minimum necessary to fulfil the stated objectives? • Does the level of accuracy reflect the operational needs of the
objective? 1.3 Using this Handbook This Handbook provides guidance for identifying the need for Type I monitoring programmes and for the design and execution of these. It does not, and cannot, provide ready-made monitoring programmes for all spill response needs. The development and execution of each monitoring programme must pass through a number of stages or tasks (Figure 1.1). The first of these involves determining what we hope to achieve through monitoring, i.e. setting objectives. The type of information (data) that should be collected is largely determined by the objectives. Guidelines for these tasks and for the design planning and execution of monitoring programmes are discussed in Section 2.
Figure 1.1 Stages in the
Planning and Execution of a Monitoring Programme
Oil Spill Monitoring Handbook
5
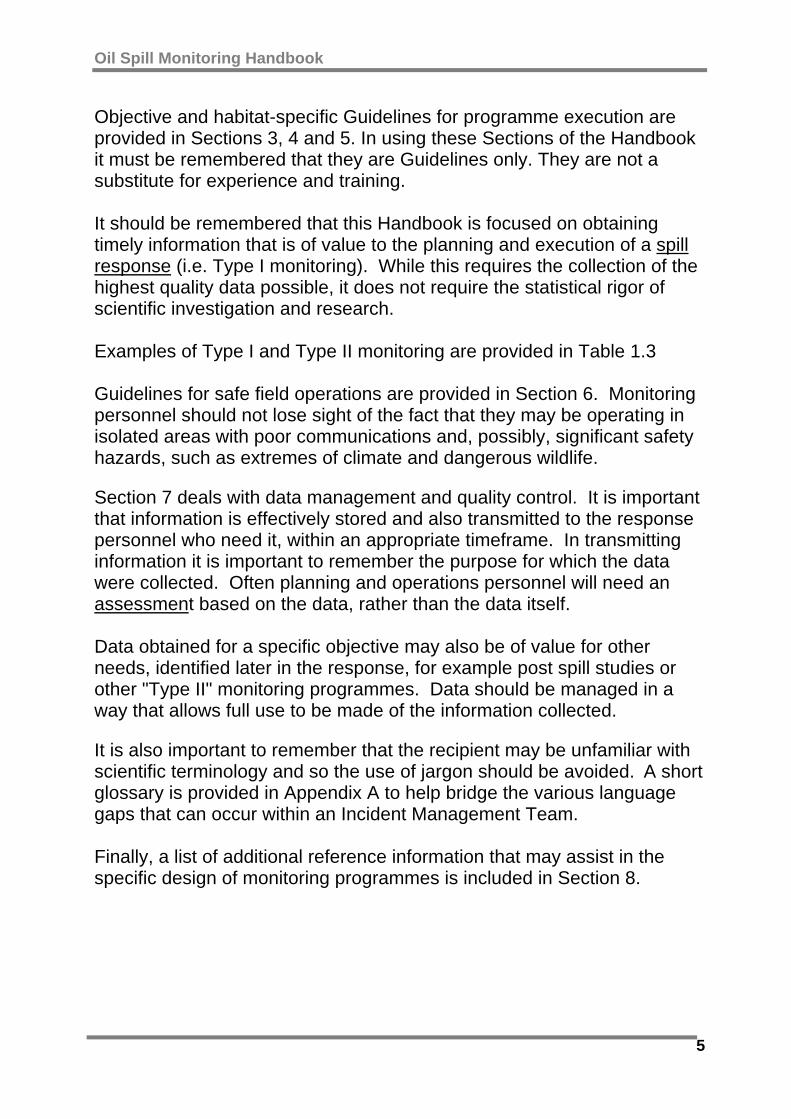
Objective and habitat-specific Guidelines for programme execution are provided in Sections 3, 4 and 5. In using these Sections of the Handbook it must be remembered that they are Guidelines only. They are not a substitute for experience and training. It should be remembered that this Handbook is focused on obtaining timely information that is of value to the planning and execution of a spill response (i.e. Type I monitoring). While this requires the collection of the highest quality data possible, it does not require the statistical rigor of scientific investigation and research. Examples of Type I and Type II monitoring are provided in Table 1.3 Guidelines for safe field operations are provided in Section 6. Monitoring personnel should not lose sight of the fact that they may be operating in isolated areas with poor communications and, possibly, significant safety hazards, such as extremes of climate and dangerous wildlife. Section 7 deals with data management and quality control. It is important that information is effectively stored and also transmitted to the response personnel who need it, within an appropriate timeframe. In transmitting information it is important to remember the purpose for which the data were collected. Often planning and operations personnel will need an assessment based on the data, rather than the data itself. Data obtained for a specific objective may also be of value for other needs, identified later in the response, for example post spill studies or other "Type II" monitoring programmes. Data should be managed in a way that allows full use to be made of the information collected. It is also important to remember that the recipient may be unfamiliar with scientific terminology and so the use of jargon should be avoided. A short glossary is provided in Appendix A to help bridge the various language gaps that can occur within an Incident Management Team. Finally, a list of additional reference information that may assist in the specific design of monitoring programmes is included in Section 8.
Oil Spill Monitoring Handbook
6
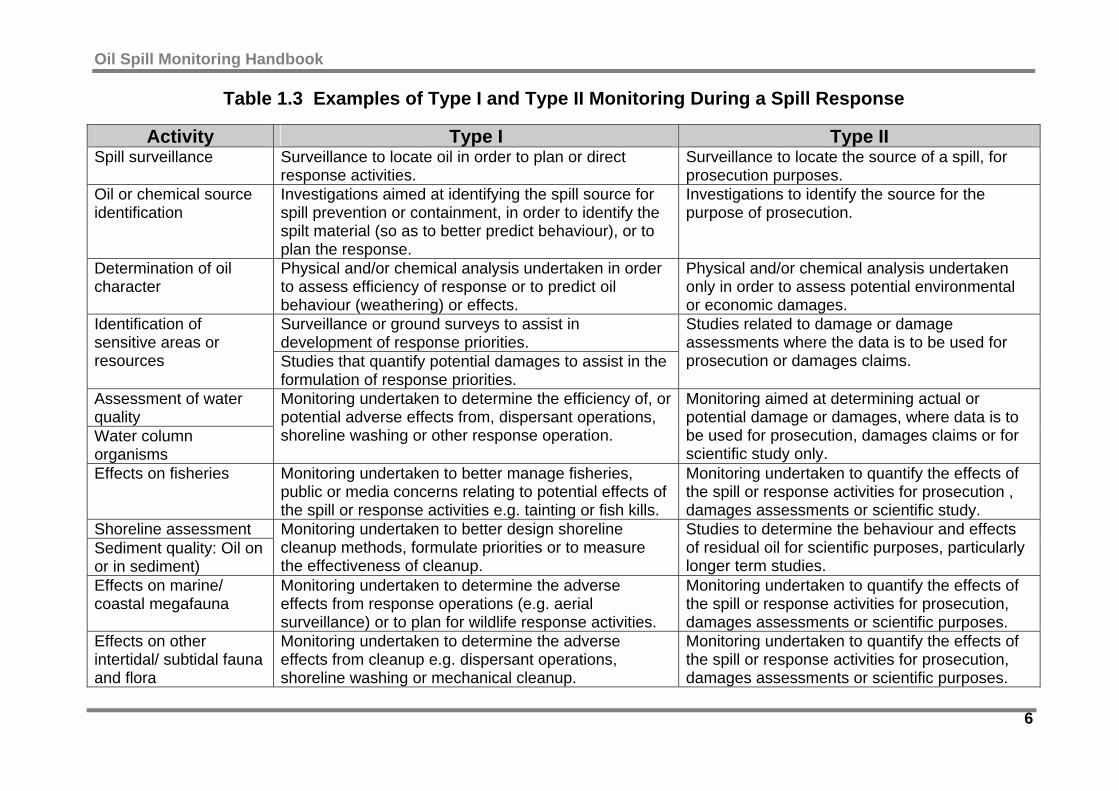
Table 1.3 Examples of Type I and Type II Monitoring During a Spill Response
Activity Type I Type II Spill surveillance Surveillance to locate oil in order to plan or direct
response activities. Surveillance to locate the source of a spill, for prosecution purposes.
Oil or chemical source identification
Investigations aimed at identifying the spill source for spill prevention or containment, in order to identify the spilt material (so as to better predict behaviour), or to plan the response.
Investigations to identify the source for the purpose of prosecution.
Determination of oil character
Physical and/or chemical analysis undertaken in order to assess efficiency of response or to predict oil behaviour (weathering) or effects.
Physical and/or chemical analysis undertaken only in order to assess potential environmental or economic damages.
Surveillance or ground surveys to assist in development of response priorities.
Identification of sensitive areas or resources Studies that quantify potential damages to assist in the
formulation of response priorities.
Studies related to damage or damage assessments where the data is to be used for prosecution or damages claims.
Assessment of water quality Water column organisms
Monitoring undertaken to determine the efficiency of, or potential adverse effects from, dispersant operations, shoreline washing or other response operation.
Monitoring aimed at determining actual or potential damage or damages, where data is to be used for prosecution, damages claims or for scientific study only.
Effects on fisheries Monitoring undertaken to better manage fisheries, public or media concerns relating to potential effects of the spill or response activities e.g. tainting or fish kills.
Monitoring undertaken to quantify the effects of the spill or response activities for prosecution , damages assessments or scientific study.
Shoreline assessment Sediment quality: Oil on or in sediment)
Monitoring undertaken to better design shoreline cleanup methods, formulate priorities or to measure the effectiveness of cleanup.
Studies to determine the behaviour and effects of residual oil for scientific purposes, particularly longer term studies.
Effects on marine/ coastal megafauna
Monitoring undertaken to determine the adverse effects from response operations (e.g. aerial surveillance) or to plan for wildlife response activities.
Monitoring undertaken to quantify the effects of the spill or response activities for prosecution, damages assessments or scientific purposes.
Effects on other intertidal/ subtidal fauna and flora
Monitoring undertaken to determine the adverse effects from cleanup e.g. dispersant operations, shoreline washing or mechanical cleanup.
Monitoring undertaken to quantify the effects of the spill or response activities for prosecution, damages assessments or scientific purposes.

Oil Spill Monitoring Handbook
7
2.0 MONITORING PROGRAMME DESIGN AND EXECUTION 2.1 Designing the programme A wide range of different variables must be considered when designing a monitoring programme. These are summarised in Guideline D.1 and discussed in the following sections. 2.2 Setting Objectives: Defining the Question Objectives are essentially a statement of why a monitoring programme is being undertaken. These are usually dictated by the Planning or Operations Sections of the Incident Management Team (IMT), i.e. those requesting the monitoring. Objectives should be specific, precise, measurable, result-oriented, realistic, attainable, meaningful, concise, clear, and understandable. Good objectives will largely determine the specific monitoring methods required, and will ensure programmes are no more complicated than necessary. Note that objectives do not usually specify details such as sample numbers or sampling frequency. When setting objectives it is important to understand how monitoring information will be used in the decision making process. If the available resources are insufficient to meet the set objectives of the monitoring programme, the programme is not worth undertaking. While the information needed to address a primary monitoring objective may seem obvious and easily obtainable, simply stated objectives can often involve a quite complicated scope of work (see the example in Table 2.1). Where objectives are not simple, adequate time must be allocated so that Monitoring personnel and Planning or Operations personnel can identify precisely what the programme is trying to achieve. This is particularly important where secondary objectives may need to be included in a monitoring programme to address aspects such as net environmental benefit, effectiveness versus efficiency, rates of recovery, and overall cost e.g. cleanup as well as waste disposal costs.

Oil Spill Monitoring Handbook
8
GUIDELINE FOR DESIGNING A MONITORING PROGRAMME D.1
Methodology 1. Set the objectives of the study 1.1 What specific question(s) needs to be answered? 1.2. Have knowledge gaps been identified and addressed? 1.3. Have limitations of not having information been evaluated? 1.4. Will the information gathered address all needs? 1.5. How will the information be managed and communicated? 1.6. Do specific objectives:
(a) Clearly and concisely state the purpose of monitoring? (b) Specify what the monitoring will achieve? (c) Indicate when the monitoring is complete?
2 Set the spatial boundaries of the study 3 Determine the scale of the programme 4 Estimate the level of variability (location/time) 5 Decide the level of accuracy required 6 Select suitable parameters for measurement 6.1 Are parameters able to detect changes/ trends?
6.2 Are measurements reliable, reproducible and cost-effective?
6.3 Are parameters appropriate for the time/scale of the study?
6.4 Are appropriate field techniques available?
Continued overpage
Page 1 of 2 D.1

Oil Spill Monitoring Handbook
9
7 Determine method for obtaining data 7.1 Can data collection be undertaken safely?
7.2 Can data be obtained by field measurements?
7.3 Does the design account for spatial and temporal variability?
7.4 Will the study provide information in a relevant timeframe? 7.5 Will samples need to be collected?
7.6 Will sampling devices collect representative samples?
7.7 Will sampling devices contaminate or affect the sample?
7.8 Will samples contaminate or affect the sampling devices?
7.9 What size sample containers are required?
7.10 Will samples need to be preserved before analysis?
7.11 Are procedures in place to track samples and field data?
7.12 Can potential sampling error be minimised?
7.13 Can potential sampling error be assessed?
7.14 Can data be analysed and accessed in a timely manner?
8 Determine sample numbers and schedule 8.1 Are replicates needed? 8.2 How frequently is sampling required?
9 Determine the likely duration of the study?
10 Obtain materials, plan deployment (logistics)
11 Determine data management requirements
Page 2 of 2 D.1
Oil Spill Monitoring Handbook
10
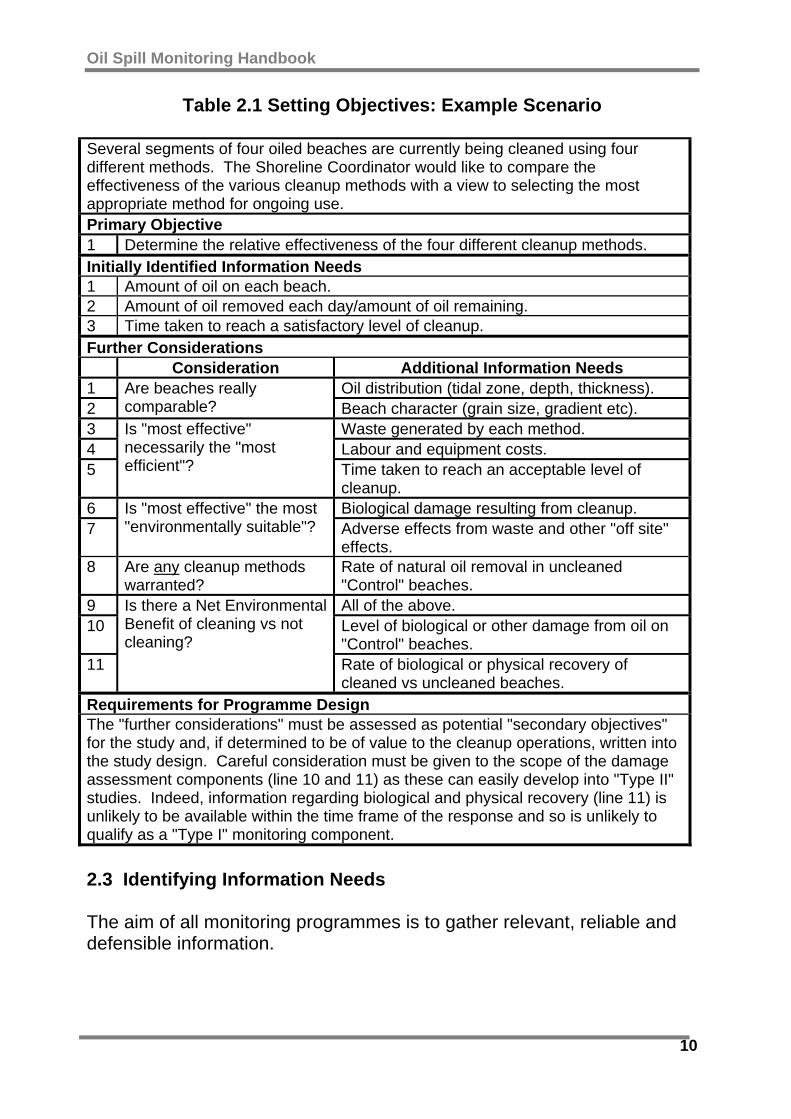
Table 2.1 Setting Objectives: Example Scenario
Several segments of four oiled beaches are currently being cleaned using four different methods. The Shoreline Coordinator would like to compare the effectiveness of the various cleanup methods with a view to selecting the most appropriate method for ongoing use. Primary Objective 1 Determine the relative effectiveness of the four different cleanup methods. Initially Identified Information Needs 1 Amount of oil on each beach. 2 Amount of oil removed each day/amount of oil remaining. 3 Time taken to reach a satisfactory level of cleanup. Further Considerations Consideration Additional Information Needs 1 Oil distribution (tidal zone, depth, thickness). 2
Are beaches really comparable? Beach character (grain size, gradient etc).
3 Waste generated by each method. 4 Labour and equipment costs. 5
Is "most effective" necessarily the "most efficient"? Time taken to reach an acceptable level of
cleanup. 6 Biological damage resulting from cleanup. 7
Is "most effective" the most "environmentally suitable"? Adverse effects from waste and other "off site"
effects. 8 Are any cleanup methods
warranted? Rate of natural oil removal in uncleaned "Control" beaches.
9 All of the above. 10 Level of biological or other damage from oil on
"Control" beaches. 11
Is there a Net Environmental Benefit of cleaning vs not cleaning?
Rate of biological or physical recovery of cleaned vs uncleaned beaches.
Requirements for Programme Design The "further considerations" must be assessed as potential "secondary objectives" for the study and, if determined to be of value to the cleanup operations, written into the study design. Careful consideration must be given to the scope of the damage assessment components (line 10 and 11) as these can easily develop into "Type II" studies. Indeed, information regarding biological and physical recovery (line 11) is unlikely to be available within the time frame of the response and so is unlikely to qualify as a "Type I" monitoring component. 2.3 Identifying Information Needs The aim of all monitoring programmes is to gather relevant, reliable and defensible information.
Oil Spill Monitoring Handbook
11
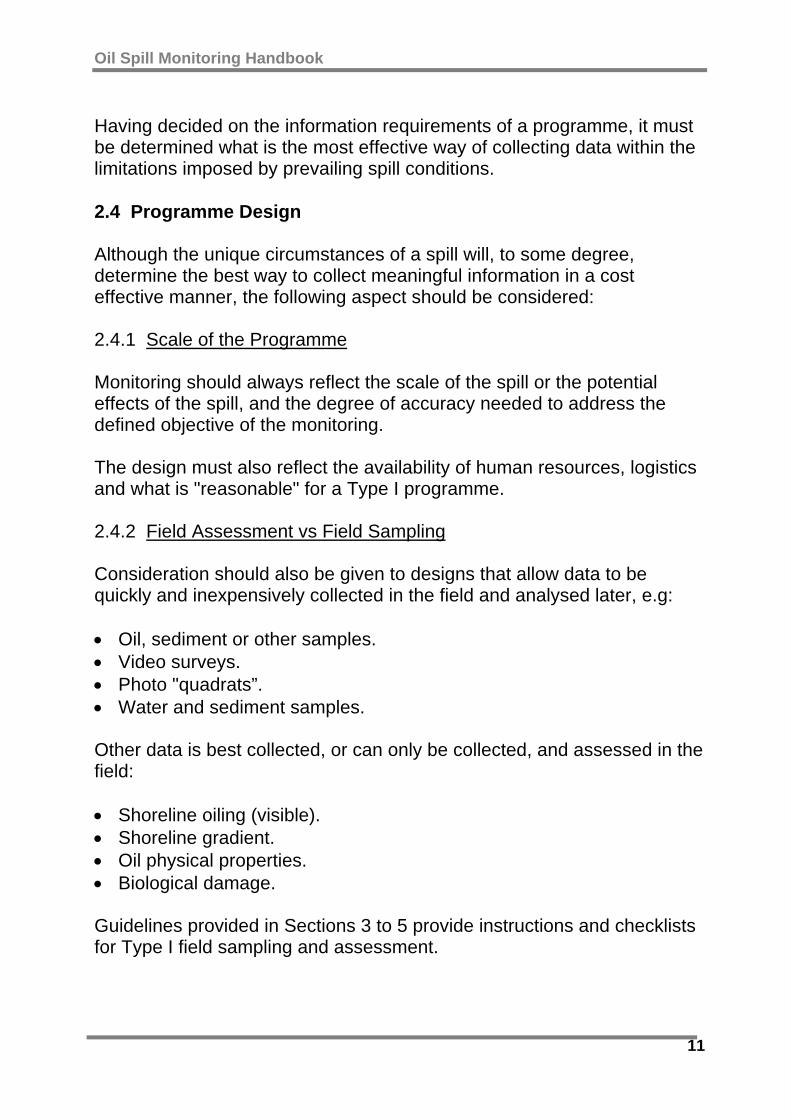
Having decided on the information requirements of a programme, it must be determined what is the most effective way of collecting data within the limitations imposed by prevailing spill conditions. 2.4 Programme Design Although the unique circumstances of a spill will, to some degree, determine the best way to collect meaningful information in a cost effective manner, the following aspect should be considered: 2.4.1 Scale of the Programme Monitoring should always reflect the scale of the spill or the potential effects of the spill, and the degree of accuracy needed to address the defined objective of the monitoring. The design must also reflect the availability of human resources, logistics and what is "reasonable" for a Type I programme. 2.4.2 Field Assessment vs Field Sampling Consideration should also be given to designs that allow data to be quickly and inexpensively collected in the field and analysed later, e.g: • Oil, sediment or other samples. • Video surveys. • Photo "quadrats”. • Water and sediment samples. Other data is best collected, or can only be collected, and assessed in the field: • Shoreline oiling (visible). • Shoreline gradient. • Oil physical properties. • Biological damage. Guidelines provided in Sections 3 to 5 provide instructions and checklists for Type I field sampling and assessment.

Oil Spill Monitoring Handbook
12
2.4.3 Quality of Data Type I monitoring has a lower requirement for data quality than Type II monitoring (Table 1.1). This does not mean that Type I monitoring data can be non-verifiable or unreliable, but that it does not always require the "statistical strength" of scientific research. It is not possible to define a minimum standard for Type I monitoring; each spill presents a unique suite of constraints (Table 2.2). However, wherever and whenever practical, Type I monitoring programmes should be designed using scientific principles such as: Control Sites A Control Site is an "unimpacted" site used for comparison with an impacted site. For example, if a programme is looking at the effectiveness of various shore cleaning methods, cleaned sites should be compared with similarly oiled sites that have received no cleaning. In this way, all methods can be compared with natural oil removal. In practice, Control Sites may be difficult to locate or preserve. In the example used here, it may be difficult to convince spill responders, or regulatory agencies, of the value of leaving a beach uncleaned for comparative purposes. In other cases there simply may be no Control Sites available. Replicate Samples or Sites Single observations and single samples are rarely adequate for drawing conclusions. Replicate samples should be taken, and replicate assessment sites or locations must be established, wherever possible. The number required will depend on the nature of the programme and the sensitivity of the issue being assessed. This sensitivity will reflect both environmental importance, as well as social, economic and political considerations. Personnel responsible for the planning and execution of programmes must have input into these discussions so that an adequate and feasible programme is implemented. In some cases, the scale of the monitoring programme will need to be determined at the highest level of the incident management team.
Oil Spill Monitoring Handbook
13
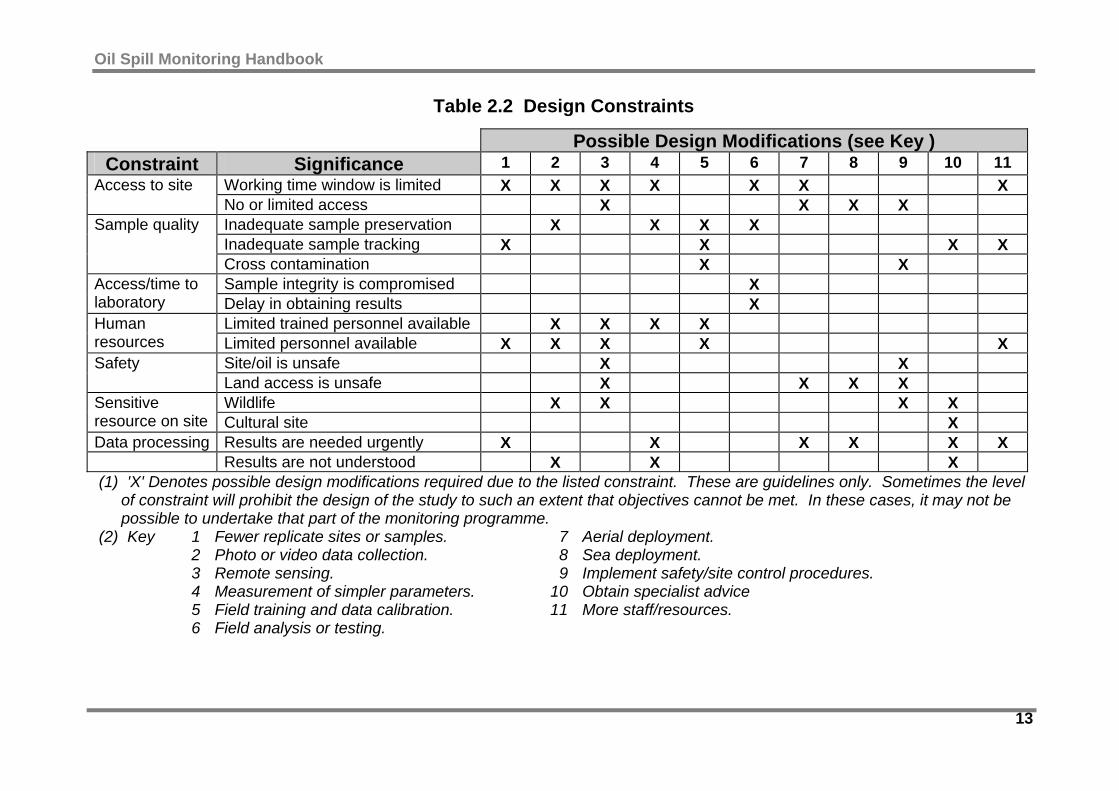
Table 2.2 Design Constraints
Possible Design Modifications (see Key ) Constraint Significance 1 2 3 4 5 6 7 8 9 10 11
Working time window is limited X X X X X X X Access to site No or limited access X X X X Inadequate sample preservation X X X X Inadequate sample tracking X X X X
Sample quality
Cross contamination X X Sample integrity is compromised X Access/time to
laboratory Delay in obtaining results X Limited trained personnel available X X X X Human
resources Limited personnel available X X X X X Site/oil is unsafe X X Safety Land access is unsafe X X X X Wildlife X X X X Sensitive
resource on site Cultural site X Data processing Results are needed urgently X X X X X X Results are not understood X X X (1) 'X' Denotes possible design modifications required due to the listed constraint. These are guidelines only. Sometimes the level of constraint will prohibit the design of the study to such an extent that objectives cannot be met. In these cases, it may not be possible to undertake that part of the monitoring programme. (2) Key 1 Fewer replicate sites or samples. 7 Aerial deployment. 2 Photo or video data collection. 8 Sea deployment. 3 Remote sensing. 9 Implement safety/site control procedures. 4 Measurement of simpler parameters. 10 Obtain specialist advice 5 Field training and data calibration. 11 More staff/resources. 6 Field analysis or testing.

Oil Spill Monitoring Handbook
14
Avoidance of Cross Contamination of Samples It is easy for field instruments to become contaminated when collecting samples. Monitoring personnel can also inadvertently contaminate samples when moving between sampling sites. Wherever possible, sampling personnel must employ procedures to avoid sample cross contamination. This can be achieved by using clean instruments for each sample, or by employing field decontamination procedures where sampling equipment and personnel are cleaned between sites. Decontamination procedures will need to consider the practical constraints of the spill, and must recognise that personnel may deploy to a site before decontamination facilities are established in the field. 2.4.4 Design Constraints Invariably the design of Type I monitoring programmes will need to be modified according to the prevailing conditions and constraints imposed by a spill. Constraints may be so severe that they compromise the integrity of some components of a programme to such a degree that their worth may become questionable. If this occurs, and alternative strategies are not available, the components should be discontinued. Poor data may be worse than no data. Table 2.2 lists some of the potential constraints to monitoring programme design. 2.5 Training Requirements Most Type I procedures, and the Guidelines provided in this Handbook, can be undertaken by personnel with adequate field instruction. Often, monitoring teams will need to comprise personnel with a range of skills, including local knowledge. Some procedures, such as biological assessments require higher levels of training. Where special training is required, this is indicated in the relevant Guideline. 2.6 Resources As a field deployment, monitoring activities will generally be undertaken in close cooperation with the Operations Section of an Incident Management Team.

Oil Spill Monitoring Handbook
15
Some resources, such as vehicles, helicopters communications equipment, as well as human resources may be in short supply, particularly in the early stages of a response. It is important that monitoring teams do not have to compete for these resources, but are allocated their share in a planned way, based on response priorities and safety needs. Human resources for field monitoring teams and monitoring support roles need both sufficient numbers of personnel, and an appropriate mix of skills. Planning, Operations and Incident Control personnel should be immediately involved if a programme is compromised through lack of resources. 2.7 Field Deployment Monitoring personnel may be the first response personnel to visit impacted sites and so must follow strict field deployment procedures. Guidelines for this are provided in Section 6. 2.8 Determining the End of the Programme A key aspect of monitoring is determining when response activities should no longer be continued. This may be because the cleanup activities are no longer effective, are having greater deleterious effect than the oil, or the benefit of the cleanup is insufficient to justify its cost, e.g: • Oil weathering to the extent that chemical dispersants are no longer
effective. • Shoreline cleanup causing oil to be entrained in sediment. • Mechanical recovery of small volumes of oil. Monitoring programmes should establish clear end points and termination criteria early in the response, acknowledging that different environmental values will have different criteria. Examples of termination criteria are presented in the following table.

Oil Spill Monitoring Handbook
16
Table 2.3 Possible Monitoring Termination Criteria
Environmental/ Resource Value Definition of Clean
Food organisms (e.g. fish, shellfish, seaweed) and water that may be extracted for human consumption
• Must meet statutory specification for residues and taints in food products.
• Has no significant adverse taste or smell attributable to the spill.
Surfaces (as used by birds, mammals, and reptiles)
• No visible slicks or sheens that could adhere to feathers, fur or skin.
• Compliance with ANZECC Water Quality Guidelines for the Protection of Aquatic Ecosystems.
Subsurface water (as habitat for fish, corals, seagrass, aquaculture species, etc.
• Oil concentrations must not exceed normal background concentrations, or
• Compliance with ANZECC Water Quality Guidelines for the Protection of Aquatic Ecosystems, or
• Must not be toxic to key species. Amenity of beaches and structures (e.g. jetties and slipways). Includes concepts of historic and cultural value
• No visible oil. • No oil that rubs off on people or boats. • Compliance with ANZECC Water Quality
Guidelines for Recreational Water Quality.Shoreline / Sediment (as habitat for algae, mangroves, molluscs, crustaceans, etc)
• Need not be visibly clean but remaining residues must not inhibit recovery through toxic or smothering effects.
• Complies with ANZECC Water Quality Guidelines for the Protection of Aquatic Ecosystems.
Shoreline (as an ecosystem interacting with other aquatic nearshore ecosystems)
• Remaining residues must not be mobile such that they will leach out into nearshore waters.

Oil Spill Monitoring Handbook
17
3.0 MONITORING THE MARINE ENVIRONMENT Marine spills usually require a rapid response with immediate mitigation actions often based on expected oil type, predicted trajectories and oil behaviour. There is a need for rapid acquisition of field data to confirm or revise this information, and to allow refinement of response plans and activities. Marine monitoring activities should be focussed on: • The physical conditions prevailing at sea, primarily sea states. • The location, movement and behaviour of the oil slick. • Changes in the characteristics of the oil. • Effects of the oil or response activities on the marine environment,
particularly biological components (fauna and flora) but also on commercial or recreational components.
3.1 Physical Environment Sea states and weather conditions can be major constraints on the effectiveness of marine response methods. Wave height, winds and currents can limit the deployment and effectiveness of booms and skimmers, while sea conditions affect the weathering of the oil at sea. Although predictions of weather and sea state are generally accurate, routine monitoring of conditions is important in planning marine response. Guideline M.1 provides information for field estimation of wind velocities and sea conditions and is designed for use from aircraft, vessels or from the shore. 3.2 Oil at Sea Monitoring of oil at sea includes monitoring of both location and behaviour of the oil slick and the character of the oil itself. Observations of slick behaviour, and/or changes in the physical or chemical character of the oil due to weathering, need to be formally recorded and logged. Accurate identification of resources impacted, and assessments of environmental damage or potential damage, are difficult without these data.

Oil Spill Monitoring Handbook
18
GUIDELINE FOR ESTIMATING SEA STATE M.1
Rationale Sea state influences the likely efficiency of marine operations such as containment and recovery and dispersant application, and must also be considered in assessing safety. While forecasts are generally accurate, field monitoring is recommended.
Methodology 1 Observe sea from land, air or vessel and relate to sea state classifications in the
Table below. 2 Check against available wind data and forecasts. Note: wind data may be
regional and not necessarily accurate.
Wind Speed (Kn)
Description Wave Height (m)
Beaufort Scale
Mean Range Wind Sea Mean Max. 0 0.5 0-1 Calm Flat. - - 1 2 1-3 Light air Ripples. 0.1 0.1 2 5 4-6 Light
breeze Small wavelets. No breakers. 0.2 0.3
3 9 7-10 Gentle breeze
Large wavelets. Some crests & scattered white caps.
0.6 1.0
4 13 11-16 Moderate breeze
Small waves. Fairly frequent white caps.
1.0 1.5
5 19 17-21 Fresh breeze
Moderate waves. Many white caps. Occasional spray.
2.0 2.5
6 24 22-27 Strong breeze
Large waves. Extensive white foam crests. Some spray.
3.0 4.0
7 30 28-33 Near gale Sea rises. White foam from breaking waves in streaks.
4.0 5.5
8 37 34-40 Gale Moderate, long waves. White foam blown in long streaks.
5.5 7.5
9 44 41-47 Strong gale
High waves. Dense streaks of foam. Wave crests begin to topple.
7.0 10.0
10 52 48-55 Storm Very high waves. Long hanging crests. Foam in large patches. Sea surface largely white.
9.0 12.5
11 60 56-63 Violent storm
Extreme waves (small-medium ships lost to view). Foam covered sea surface. Reduced visibility.
- -
12 - >64 Hurricane Air filled with foam and spray. Driving spray. Very reduced visibility.
>14 -
Page 1 of 1 M.1

Oil Spill Monitoring Handbook
19
3.2.1 Monitoring the Oil Slick Oil slicks at sea are routinely monitored by aerial surveillance. This includes monitoring of both the position and the character of the slick. Observations of slick character include area covered, percentage cover and gross changes to oil character (e.g. emulsification). Guidelines for this are provided in Guidelines M.2, M.3, and S.4, and also in a number of Field Guides (Section 8). In some oil spill situations, trajectory can be calculated manually from wind, current and oil data (see Figure 3.1), or by using computer-based oil spill trajectory models (OSTMs). For chemical spills, where the contaminant may not be visible, a variety of different field methods are available to facilitate visual tracking, e.g. the use of tracker buoys (drogues) and dyes. Three-dimensional spill models are also available.
Figure 3.1 Manual Calculation of Surface Slick Trajectory
Procedure: For each hour add the current velocity vector (in m or km) to 3% of the wind vector.
3.2.2 Monitoring the Oil Oil samples can indicate which equipment or cleanup methods are likely to be most effective. Time constraints often necessitate field assessment based on observations of the slick behaviour, rather than on a detailed laboratory analysis of the oil itself (see Guidelines M.3 and G.3).
Oil Spill Monitoring Handbook
20
Although detailed laboratory analysis is often too slow to provide data of operational (Type I) use, it can provide information relating to the potential persistence of oil and the likely recovery of oil impacted communities. This can be related back to decision making regarding the need for cleanup efforts. Oil in the Water Column The amount or character of oil suspended or dissolved in the water column may be required for oil mass balance calculations or for determining the extent of weathering. While this information may be required for planning the response (i.e. Type I monitoring), it is more likely to be required for identification of the spill source or for estimation of potential environmental damage assessments (i.e. Type II monitoring). The use of chemical dispersants will require a net environmental benefit analysis, which may need verification after the trialing of dispersant or after the initial application of dispersant. This may require measuring oil incorporated into the water column or underlying sediments (see Guideline M.5). Consequently, Guidelines for water column sampling are provided in Guidelines M.4, M.6 and M.7 and for marine sediments in Guideline M.8. Oil in Marine Sediments Oil is only rarely incorporated into seabed sediments as a result of the weathering of surface slicks. However, oil can be incorporated into marine sediments as a result of the natural redistribution of oiled pebbles, sands, and silts due to wave or following remobilisation by shoreline cleanup activities, particularly washing methods. Monitoring of both natural and cleanup induced sand redistribution may be necessary to better determine the net environmental benefit of natural cleaning or intervention.

Oil Spill Monitoring Handbook
21
GUIDELINE FOR LOCATING OIL SLICKS AT SEA M.2
Rationale Monitoring of slick position is needed to verify and recalibrate computer oil spill trajectory models (OSTM’s). The accuracy of OSTM results is often compromised by inaccurate data or lack of local wind and current data.
Methodology Select and commission aircraft. Aircraft should have: 1.1 Good downward visibility (e.g. fixed wing aircraft with an over-fuselage
wing, or helicopters). 1.2 Radios that allow direct communications with vessels or ground
personnel, if used in support of marine response or ground surveys.
1
1.3 Global (Geographic) Positioning System (GPS). Assemble equipment required: 2.1 Map or chart, suitable for marking up (preferably laminated). 2.2 Pens, pencils and eraser. 2.3 Camera (digital or video camera preferred). 2.4 Aerial Observation Report forms. 2.5 Reliable watch (the aircraft will have a clock).
2
2.6 Sunglasses. 3 Obtain information on the predicted location of the slick (e.g. OSTM output). 4 Discuss flight and surveillance programme with the Pilot. 5 Report departure time flight path and ETA to air control. 6 Proceed to predicted position. 7 Conduct a “ladder” search until slick is located (see Figure M.2.1). 8 Continue search over area to detect other slicks. 9 Record slick locations on map
or GPS coordinates. 10 If required, record slick
characteristics as per Guideline M.3.
11 Upon return, report safe arrival and time to air control.
12 Lodge GPS position data and/or copy of map with Operations Coordinator and document control.
Figure M.2.1
Page 1 of 1 M.2
Wind Aircraft Flight Path

Oil Spill Monitoring Handbook
22
GUIDELINE FOR CHARACTERISING OIL SLICKS AT SEA M.3
Rationale Monitoring of slick character is needed for planning marine response strategies. Slick area indicates the scale of the response needed. Percentage cover and slick thickness indicate likely efficiency of containment or dispersant methods and may also indicate the likely persistence of the slick.
Methodology Locate slick as per Guideline M.2. 1 Note: Preferred altitude is 300-500m (1000-1500 feet) for marine surveillance. Aircraft should orientate the observer to about a 30 degree angle. Determine the area of the slick. 2.1 Fly the length of the slick and record the time taken and the aircraft speed
(note: 1 knot = 0.5m per second or 1.8 km per hour). 2.2 Fly the width of the slick and record the time taken and the aircraft speed. 2.3 Calculate length and width using one of the following the formulae:
• Distance (in metres) = Time (seconds) x speed (knots) x 0.5. • Distance (in km) = Time (seconds) x speed (knots) x 1.8
2.4 Calculate approximate slick area as length x width
2
Note that this figure is an approximation of the area covered by all components of the slick including films. Determine the thickness and distribution of the oil in the slick. 3.1 Use the Table of oil colour below to estimate the thickness of the various
parts of the slick. 3.2 Estimate and record the relative proportions (Percentage Cover) of clean
water and each colour (or thickness) over the slick area. Use the Percentage Cover Aid in the Figure overpage. Data should be recorded on the Aerial Observation Form (in Appendix A) or similar data sheet.
3
3.3 Record other indications of thickness such as a distinct “edge” or a dampening of the water surface “texture” both of which indicate a thick slick.
Oil Colour and Thickness Description/
Colour Thickness
(mm) Volume
(m3/sq km) Silvery sheen 0.0001 0.1 Bright bands of rainbow colour 0.0003 0.3 Dull colours seen 0.001 1.0 Yellowish brown slick 0.01 10 Light brown or black slick 0.1 100 Thick dark brown or black slick 1.0 1,000
Page 1 of 2 M.3

Oil Spill Monitoring Handbook
23
Percentage Cover
Figure M.3.1
Methodology Continued If required, estimate volume of oil on the sea surface. 4.1 Calculate the area of each colour (thickness) of oil in the slick:
Ac = %Cc x At
4.2 Calculate the volume of oil in each colour by multiplying area by estimated thickness of oil in each colour (see Table on previous page).
Vc = Ac x Tc
Calculate total Volume of oil by adding the volumes for each colour. 4.3 The Table provided below can be used to calculate volumes.
4
Note: Polaroid sunglasses or camera lens filters should be avoided as these tend to darken the oil’s colours. Reflected glare should be reduced by altering the location of the aircraft (i.e. viewing with the sun behind the observer).
Description of Oil Thickness/ Colour
% Cover of Colour %Cc
Area of each Colour
Thickness of Colour Tc
Volume of the Slick Vc
Silvery sheen 0.0001mm Bright bands/rainbow 0.0003mm Dull colours 0.001mm Yellowish brown 0.01mm Light brown or black 0.1mm Thick dark brown/black 1.0mm Total % Cover of
Slick %Ct Area of oil in
Slick (At) Volume/ Sq Km can also
be used
Total Volume of Oil in Slick
Page 2 of 2 M.3
20% 30% 40% 50% 60% 70% 80%

Oil Spill Monitoring Handbook
24
GUIDELINE FOR VIDEO/PHOTO SURVEYING OF SLICKS AT SEA M.4
Rationale Regular video or photographic recording of a slick at sea can be useful in conveying the situation to the Incident Control Centre.
Methodology Select and commission aircraft. Aircraft should have: 1.1 Downward visibility (helicopter/fixed wing aircraft with over-fuselage wing). 1.2 Global (Geographic) Positioning System (GPS).
1
1.3 Slow speed. Assemble equipment required: 2.1 Map or chart, suitable for marking up (preferably laminated). 2.2 Pens, pencils and eraser. 2.3 Camera(s) (digital/video camera preferred, with date recording capability).
Note: Check batteries and film. 2.4 Map of coastline (topographic map rather than marine chart). Preferred
scale is 1:10,000 to 1:30,000. 2.5 Reliable watch (the aircraft will have a clock).
2
2.6 Sunglasses. 3 Obtain information on the predicted location of the slick. 4 Discuss flight and surveillance programme with the Pilot. 5 Report departure time flight path and ETA to air control. 6 Undertake a higher altitude (up to 500m) rapid fly over of the area to gain an
overall perspective of the extent of oiling. Conduct a low altitude survey of target shoreline. Use the following guidelines for speed and altitude (the pilot will determine the limits to these): Altitude (m) 30 60 100 >100 Speed (Knots) 20 30 50 Not
Recommended
7
Note: A new videotape or roll of film should be used for each new survey. Digital camera memory should be cleared at the end of each survey. Record video or photographic data: 9.1 Take video or still pictures at a downward angle of 30o-45o.
9
9.2 Avoid photographing into the sun. Use of a polarising filter should be avoided used as this will alter the colour of the oil Completed video tapes and film should be labelled with: 9.3.1 Date and time
9.3
9.3.2 Location (GPS/geographic name) at which it was started/finished. At the end of each survey: 10.1 Review: copy videos, digital photos, have film developed (> 2 prints). 10.2 Edit video tapes/digital video if necessary.
10
10.3 Label and catalogue videos/slides/photos.
Page 1 of 1 M.4

Oil Spill Monitoring Handbook
25
GUIDELINE FOR VISUAL MONITORING OF DISPERSANT OPERATIONS M.5
Rationale Ongoing monitoring of the effectiveness of dispersant application is required so that dispersants are used effectively and efficiently.
Methodology 1 Locate slick as per Guideline M.2. 2 Note the dimensions of the surface slick as per Guideline M.3. 3 Avoid undertaking observation under low light conditions (dawn, dusk, in haze or
fog). 4 Note: Always report the presence, number and location of marine mammals,
reptiles (turtles and crocodiles), birds and non-spill response vessels in the area.5 The usual colour of dispersed oil is a milky coffee or tea colour. The colour will
vary according to oil type and sea conditions such as sediment load. Generally, dispersants are applied to dark coloured oils and not diesels or light products. Note and be aware of the following sources of observational error: 6.1 “Herding” of the surface slick may occur when dispersants are applied.
This is due to the dispersant altering the oil-water surface tension causing the oil film to roll back and thicken. Although this may make the slick appear to break up or shrink, this is not effective dispersion. The oil remains on the surface and the slick may eventually reform.
6.2 Dispersant in seawater is a milky white colour. Observation of this suggests that the dispersant is not working. However, this may be due to inadequate targeting of the spraying operation rather than the non-effectiveness of the dispersant itself.
6.3 In turbid waters, the dispersed oil plume may be difficult to see. 6.4 Remaining surface oil may mask underlying dispersed oil plumes. 6.5 Dispersants may take several minutes to a few hours to work effectively.
Absence of an immediate effect does not mean that dispersants are not working.
6
6.6 If dispersant is being applied from a vessel, oil will not appear in the wake of the vessel. This is not indicative of effective chemical dispersion.
7 If no visible plume appears because conditions are not favourable for observation, then sampling should be considered (Guideline M.8).
8 Report any change in the colour or general appearance of the surface slick.
Page 1 of 2 M.5

Oil Spill Monitoring Handbook
26
Figure M.5.1 Dispersant Treated Oil (Photo: AMSA)
Figure M.5.2 Closeup of Dispersed Oil (Photo: Wardrop Consulting)
Page 2 of 2 M.5
Oil Spill Monitoring Handbook
27
GUIDELINE FOR SAMPLING SURFACE OIL SLICKS AND FILMS M.6
Rationale Oil samples may be required for analysis. Analysis may better determine oil physical character or determine its chemical character. The latter may be needed to quantify oil weathering or to identify the source of the oil. Note: The sample taken should be representative of the oil. If the slick is variable in appearance, or if more than one oil may be present, then multiple samples should be taken.
Methodology Determine number of samples required. Consider: 1.1 Size of slick. 1.2 Source of spill (number of potential oil slicks).
1
1.3 Distribution (number of locations) of slick. 2 Determine size of sample needed: Some samples need to be divided and
distributed for verification. It is better to divide a single sample than to take multiple samples from a slick, particularly if more than one oil could be involved. Decide platform to sample from (response/other vessel, shoreline) Consider: 3.1 The potential for contamination from response vessels. 3.2 Logistics.
3
3.3 Weather and other safety considerations (staff training and experience). Obtain sampling kits or supplies: 4.1 Sample jars (250 ml or other size). Pre cleaned, teflon or
aluminium cap or alfoil barrier. As required
4.2 Tape (for sealing jars). 2cm wide. 2 4.3 Slick/pooled oil sampling equipment: Wooden spatulas/
tongue depressors or stainless steel spatulas/spoons. 4.4 Sheen sampling equipment: TFE fluorocarbon polymer
nets or small squares of sorbent. 4.5 Disposable gloves 4.6 Sample identification labels.
>1/sample
4.7 Sorbent padding for storage cooler. 4.8 Sample Log Sheets. 4.9 Sample storage coolers with pre-frozen freezer blocks. 4.10 Chain of Custody Forms. 4.11 Waterproof plastic envelope.
4
4.12 Decontamination equipment if needed, (Guideline G.2). Sample oil: 5 IMPORTANT: Volatile oils can be flammable and produce toxic vapours. They should not be sampled by personnel in close proximity to the oil and NEVER within enclosed spaces. In these cases, samples may be taken using sorbent materials on the end of a fishing line. A fishing rod can be used to cast the sorbent into the oil from a safe distance.
Page 1 of 2 M.6

Oil Spill Monitoring Handbook
28
Methodology Continued 5.1 Take sample from the thickest part of the slick or film. This is usually the
“leading edge” of the slick. 5.2 If oil is not volatile, position vessel down wind from the oil so that oil is
moving towards the vessel. This reduces the chance of contamination from the vessel (Alternately, use sorbent and fishing line).
5.3 Take sample from bow, or at least to the forward, of the vessel and avoid contamination from vessel engines.
5.4 For thick slicks: Use sampling implement to recover oil. Avoid using the sample jar to skim the oil.
5.5 For films: Use a piece of sorbent material to soak up the oil film. This may need to be passed through the film several times. Place sample into clean jars and seal. Sample jars should be filled approximately 4/5ths full if oil is heavy or weathered. Expansion of the sample should not be a problem if samples are chilled properly – but it is better to be safe. Sorbents films or light, volatile oil samples should fill the jar to reduce evaporative loss (see Guideline M.6).
5.6
Note: If sorbents are used to collect oil, a sample of clean sorbent should also be sent to ensure that no contaminants are present on this. Label jars immediately with: 5.7.1 Sample number or code (Optional, but advisable for multiple
sampling at a single location). 5.7.2 Sample description (oil, debris, thick slick, film etc). 5.7.3 Time and Date (24 hr clock, Day/Month/Year). 5.7.4 Location (GPS coordinates or other description). 5.7.5 Name of person taking the sample.
5
5.7
5.7.7 Witness (If a sample for legal purposes). 5.8 Record the above information on a “Sample Log”. Reference any
photographs taken or other observations on the log. 6 Place sample in a cooled container (see Guideline G.1). 7 Complete chain of custody form for each container (see Guideline G.1).
Page 1 of 2 M.6

Oil Spill Monitoring Handbook
29
GUIDELINE FOR SAMPLING OF SUBSURFACE WATER M.7
Rationale The amount or character of oil or chemicals suspended or dissolved in the water column may require monitoring for identification of source, damage assessment, determination of weathering, or for oil mass balance calculations. This Guideline provides methods for obtaining discreet water samples at variable water depths. Note, Water samples can also be collected using the continuous flow fluorometer described in Guideline M.7.
Methodology 1 Deploy to area. Samples are taken from a suitable vessel.
If samples are required from below the oil slick: 2.1 Aerial support is recommended for
effective targeting. The sampler must be deployed through clean water, not through the oil. This can be achieved by: 2.2.1 Deploying a bottomless
perimeter from the side of the vessel, when in clean seas and slowly entering the oily area, or
Figure M.7.1 Clean Sampling from Vessel
2
2.2
2.2.2 Deploying a bottomless perimeter from the side of the vessel, and then removing oil from within the perimeter using sorbents (Figure M.7.1.).
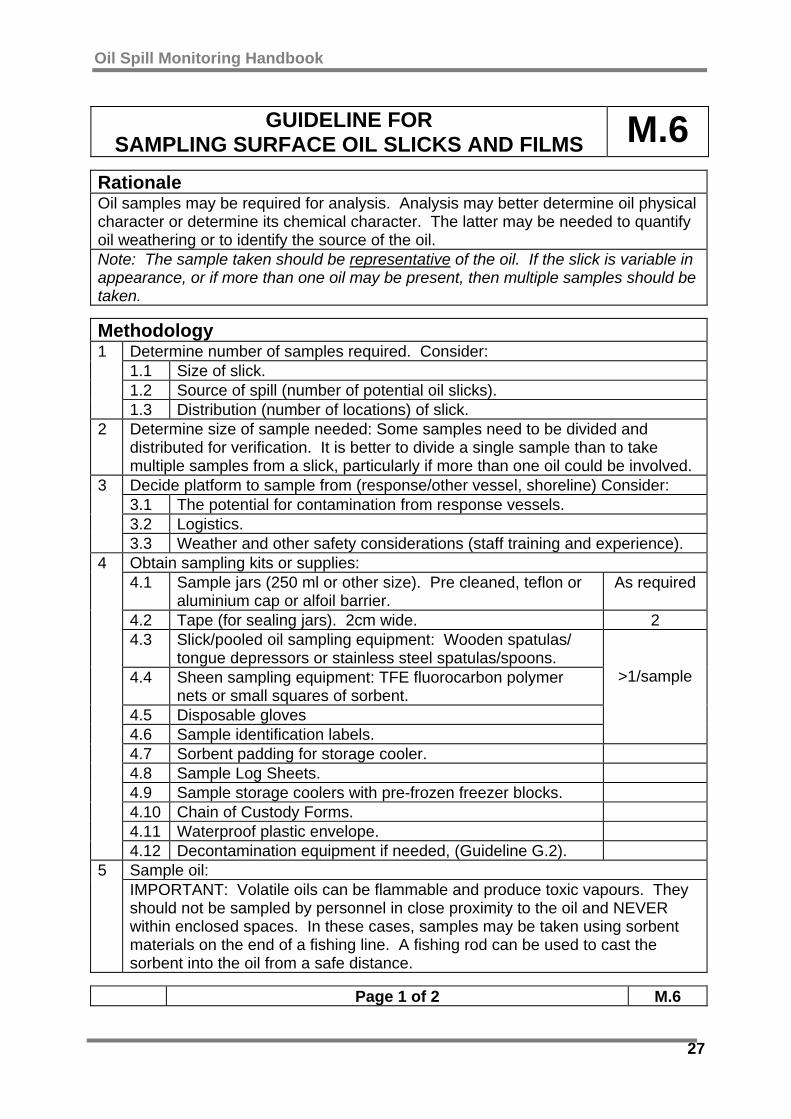
3 Samples can be taken using scientific equipment such as a “Niskin” bottle or “Nankin” bottle, or using improvised equipment like that shown in Figure M.7.2 and Figure M.7.3.
4 Samples should be collected from clean seas so that “background” hydrocarbon levels of the sea can be calculated.
5 Sample sizes should be 2 litres for total petroleum hydrocarbons (TPH), 2 litres for Polycyclic Aromatic Hydrocarbon (TPH) analysis and at least 50 ml for Volatile Organic Compunds (VOC) such as benzene, toluene & xylene (BTEX).
6 Samples should be stored and handled as per Guideline G.1.
Figure M.7.2 Improvised Water Sampler
Page 1 of 2 M.7
Oil Spill Monitoring Handbook
30
Figure M.7.3 Van Dorn Water Sampler (Figure from Cawthron Institute)
Page 2 of 2 M.7
Oil Spill Monitoring Handbook
31
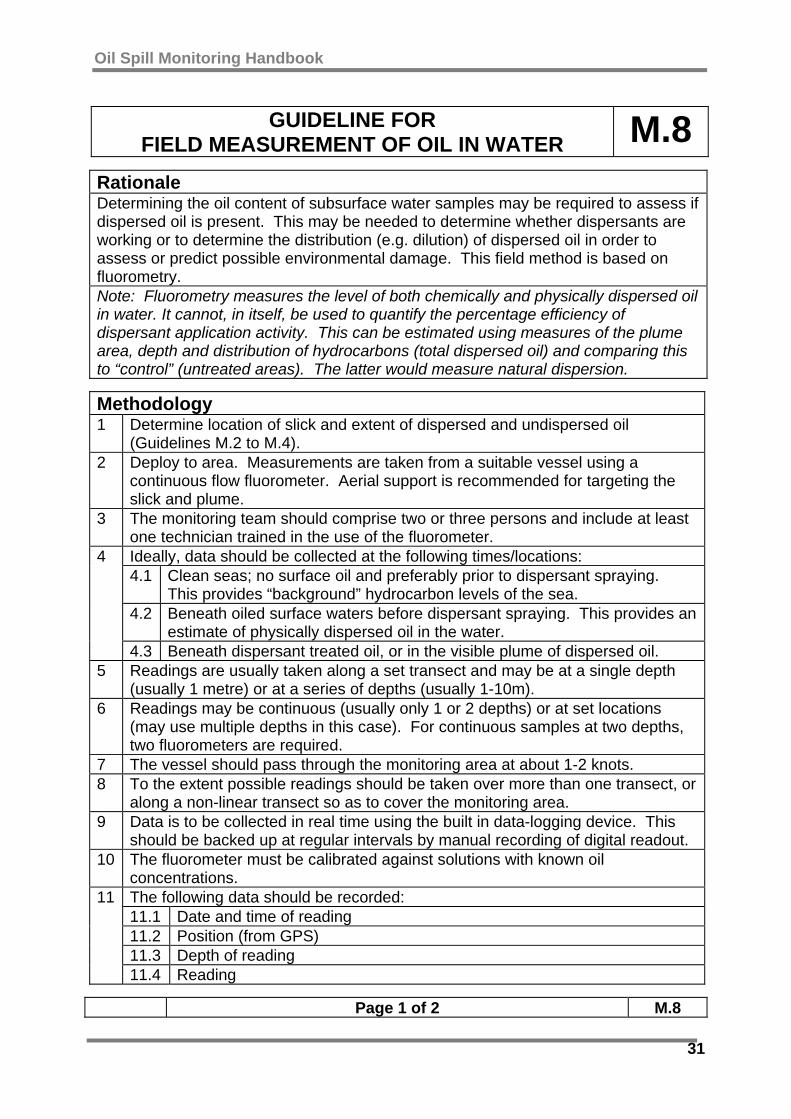
GUIDELINE FOR FIELD MEASUREMENT OF OIL IN WATER M.8
Rationale Determining the oil content of subsurface water samples may be required to assess if dispersed oil is present. This may be needed to determine whether dispersants are working or to determine the distribution (e.g. dilution) of dispersed oil in order to assess or predict possible environmental damage. This field method is based on fluorometry. Note: Fluorometry measures the level of both chemically and physically dispersed oil in water. It cannot, in itself, be used to quantify the percentage efficiency of dispersant application activity. This can be estimated using measures of the plume area, depth and distribution of hydrocarbons (total dispersed oil) and comparing this to “control” (untreated areas). The latter would measure natural dispersion.
Methodology 1 Determine location of slick and extent of dispersed and undispersed oil
(Guidelines M.2 to M.4). 2 Deploy to area. Measurements are taken from a suitable vessel using a
continuous flow fluorometer. Aerial support is recommended for targeting the slick and plume.
3 The monitoring team should comprise two or three persons and include at least one technician trained in the use of the fluorometer. Ideally, data should be collected at the following times/locations: 4.1 Clean seas; no surface oil and preferably prior to dispersant spraying.
This provides “background” hydrocarbon levels of the sea. 4.2 Beneath oiled surface waters before dispersant spraying. This provides an
estimate of physically dispersed oil in the water.
4
4.3 Beneath dispersant treated oil, or in the visible plume of dispersed oil. 5 Readings are usually taken along a set transect and may be at a single depth
(usually 1 metre) or at a series of depths (usually 1-10m). 6 Readings may be continuous (usually only 1 or 2 depths) or at set locations
(may use multiple depths in this case). For continuous samples at two depths, two fluorometers are required.
7 The vessel should pass through the monitoring area at about 1-2 knots. 8 To the extent possible readings should be taken over more than one transect, or
along a non-linear transect so as to cover the monitoring area. 9 Data is to be collected in real time using the built in data-logging device. This
should be backed up at regular intervals by manual recording of digital readout. 10 The fluorometer must be calibrated against solutions with known oil
concentrations. The following data should be recorded: 11.1 Date and time of reading 11.2 Position (from GPS) 11.3 Depth of reading
11
11.4 Reading
Page 1 of 2 M.8
Oil Spill Monitoring Handbook
32
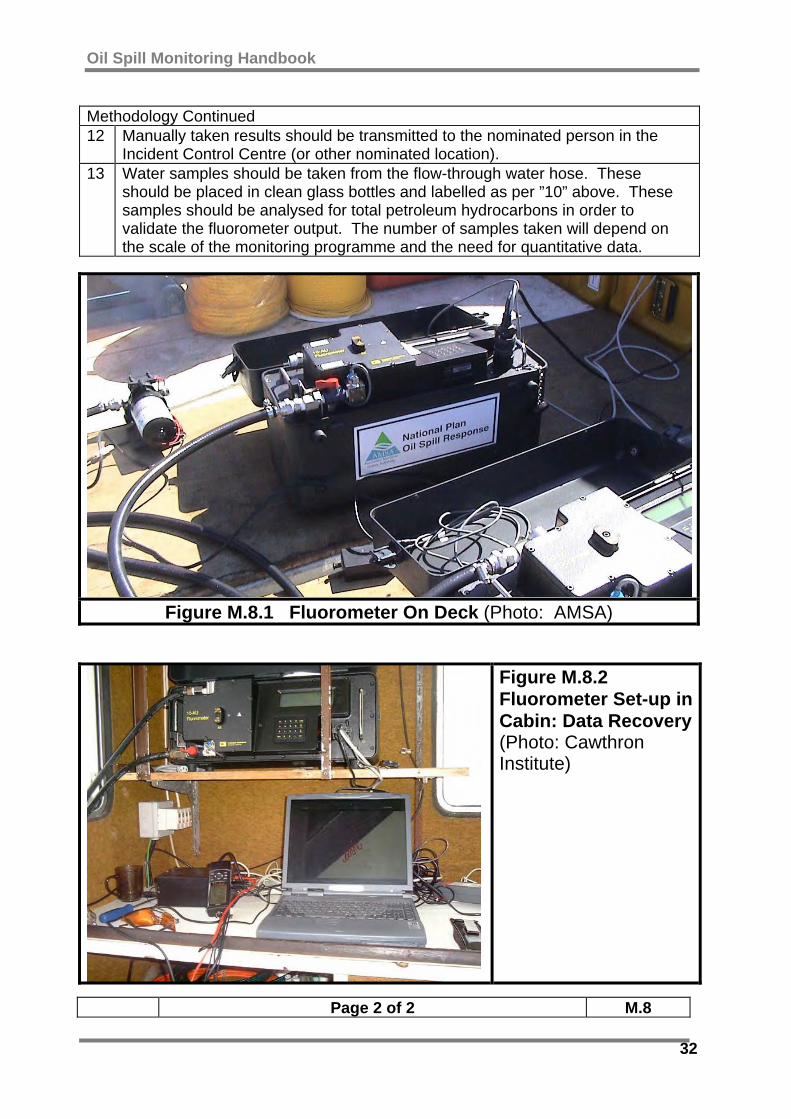
Methodology Continued 12 Manually taken results should be transmitted to the nominated person in the
Incident Control Centre (or other nominated location). 13 Water samples should be taken from the flow-through water hose. These
should be placed in clean glass bottles and labelled as per ”10” above. These samples should be analysed for total petroleum hydrocarbons in order to validate the fluorometer output. The number of samples taken will depend on the scale of the monitoring programme and the need for quantitative data.
Figure M.8.1 Fluorometer On Deck (Photo: AMSA)
Figure M.8.2 Fluorometer Set-up in Cabin: Data Recovery (Photo: Cawthron Institute)
Page 2 of 2 M.8

Oil Spill Monitoring Handbook
33
GUIDELINE FOR
SAMPLING OF SEABED SEDIMENTS M.9
Rationale Oil can become incorporated into offshore sediments through natural processes or due to shoreline cleanup methods. If this accumulates to a significant extent then alternative cleanup strategies may be required. This monitoring method is usually only required in shallow waters. Grab Samplers or Drop Corers can be used. The former are suitable for the wider set of sediments and sea conditions. Sample handling is also easier. Sample volume should be consistent between sites and surveys to allow cross comparison.
Methodology Determine the number of samples required. Consider: 1.1 Area of possible contamination.
1
1.2 Currents. Decide platform to sample from (response/other vessel, shoreline). Vessels should: 2.1 Be suited to expected weather and other safety considerations (staff
training and experience). 2.2 Be stable and suitable for expected water depths and sea states. 2.3 Provide adequate deck space (vessel should be > 5m). 2.4 Have shelter (e.g closed cabin). 2.5 Be equipped with communications, GPS and life preservation equipment.
2
2.6 Comply with state boating regulations re safety equipment. Obtain sampling kits or supplies: 3.1 Sample jars (250 ml or other larger size if biological
samples are to be taken). Pre cleaned, teflon or aluminium cap or alfoil barrier.
As Required
3.2 Tape (for sealing jars). 2cm wide. 2 3.3 Plastic sheeting 3.4 Sampling equipment (grab or corer: see 5) Note: if
biological samples are to be taken samples should be at least 10 cm depth and have a minimum surface area of at least 125 square centimetres
3.5 Disposable gloves 3.6 Sample identification labels.
>1/sample
3.7 Sorbent padding for storage cooler. 3.8 Sample Log Sheets. 3.9 Sample storage coolers with pre-frozen freezer blocks. 3.10 Chain of Custody Forms. 3.11 Waterproof plastic envelopes (for forms).
3
3.12 Decontamination equipment (Guideline G.2). 4 Samplers should be deployed in clean water, not through surface oil. A
perimeter may be used to keep the surface clean (see Guideline 7).
Page 1 of 3 M.9

Oil Spill Monitoring Handbook
34
M.9 Methodology Continued
Obtain samples: Grab Sampler: Spring loaded (see Figure M.9.1): 5.1.1 Lower the grab at a slow, constant speed (about 0.3m/second) to
avoid prematurely triggering the grab. 5.1.2 Once the seafloor is hit and the grab is triggered, recover the
grab slowly. 5.1.3 If sediments are muddy,
the grab may be cleaned in surface waters prior to bringing it on deck (Note: This should not be done if surface waters that may be oily).
5.1.4 The Grab Sampler should be opened over a sheet of plastic (but not emptied onto it).
5.1.5 Debris such as seagrass or algae should be separated from the sediment. The presence of this should be logged.
5.1.6 Note: This seagrass and algal material may be required for analysis, e.g. for the presence of entrained oil.
5.1.7 Sediment samples should be removed from the centre of the grab sample (i.e. away from the sides) using clean spatulas or scoop, and placed in clean jars.
Figure M.9.1 Example of Spring-loaded Grab Sampler (Photo: Cawthron Inst.)
5.1.8 Label jars with location, water depth, time and date, description. 5.1.9 Place unused sediment in bin.
5 5.1
5.9.10 Wash Grab Sampler in the sea, then distilled water. (see Guideline G.2).
Page 2 of 3 M.9
Oil Spill Monitoring Handbook
35
M.9 Methodology Continued
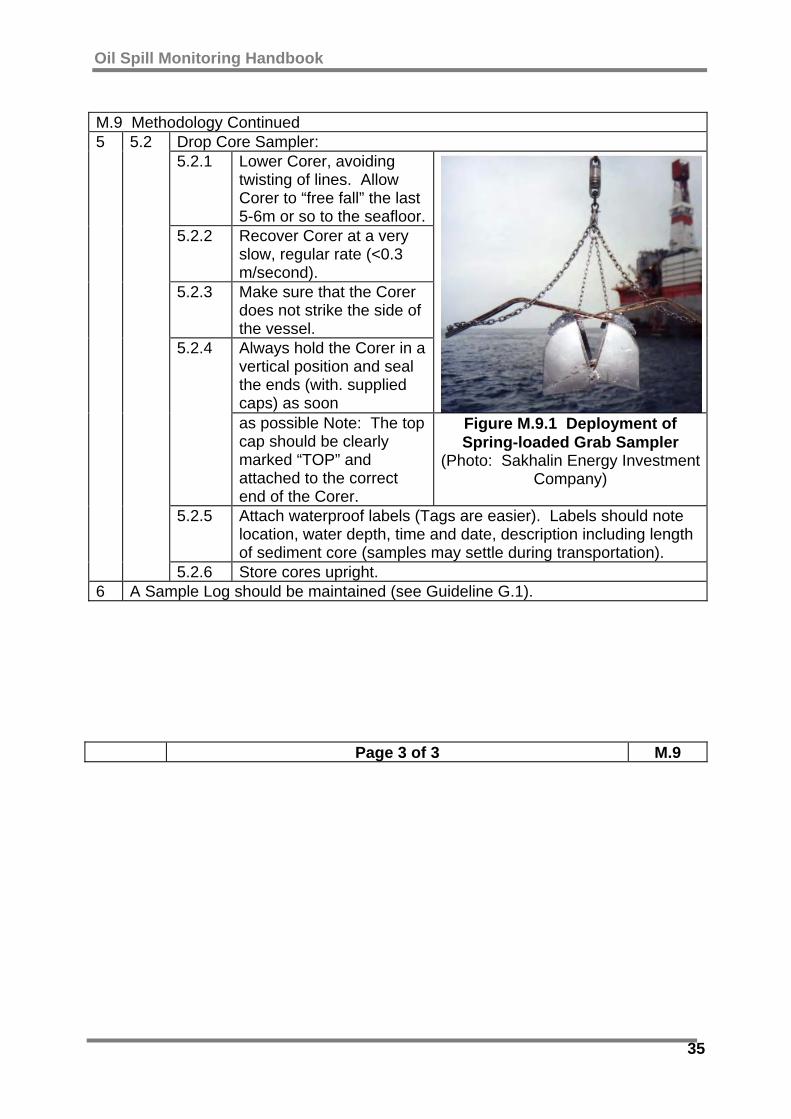
Drop Core Sampler: 5.2.1 Lower Corer, avoiding
twisting of lines. Allow Corer to “free fall” the last 5-6m or so to the seafloor.
5.2.2 Recover Corer at a very slow, regular rate (<0.3 m/second).
5.2.3 Make sure that the Corer does not strike the side of the vessel. Always hold the Corer in a vertical position and seal the ends (with. supplied caps) as soon
5.2.4
as possible Note: The top cap should be clearly marked “TOP” and attached to the correct end of the Corer.
Figure M.9.1 Deployment of Spring-loaded Grab Sampler
(Photo: Sakhalin Energy Investment Company)
5.2.5 Attach waterproof labels (Tags are easier). Labels should note location, water depth, time and date, description including length of sediment core (samples may settle during transportation).
5
5.2
5.2.6 Store cores upright. 6 A Sample Log should be maintained (see Guideline G.1).
Page 3 of 3 M.9
Oil Spill Monitoring Handbook
36
3.3 Marine Environmental Effects Marine biological resources are sometimes included in Type 1 monitoring to guide response options and cleanup activities, or to assist in media and public relations management. Detailed biological assessments are more commonly a Type 2 monitoring programme aimed at determining the effects of a spill. The monitoring of some biological effects, such as tainting of commercial or recreational food species, can be considered a Type I monitoring programme if information is needed to manage media or public perceptions of damage, or to decide whether a fishery should be temporarily closed or not. A programme with these objectives may be more limited in scope than one aimed at quantitatively determining the extent of tainting and calculating economic damages. Biological assessments must take into account the particular circumstances of a spill incident, and often require expert input to ensure the study objectives are met. 3.3.1 Habitats Offshore of the shoreline, monitoring may be divided into three broad habitat areas: • Surface water: As most fresh oils float on seawater, organisms at the
water surface are usually most vulnerable. Marine birds and mammals (particularly seals) are highly vulnerable because oil adheres readily to feathers and fur.
• Water column: Water column organisms are less vulnerable but can be exposed when oil is dispersed into the water column. Plankton and nekton are often affected, but effects are usually localised. Natural recovery of populations is usually rapid.
• Seabed: Seabed (benthic) communities are generally only of concern in shallow areas, and areas where oil either sinks or is entrained within sediment, e.g. by wave action or remobilisation of oiled shoreline sediment.
Oil Spill Monitoring Handbook
37
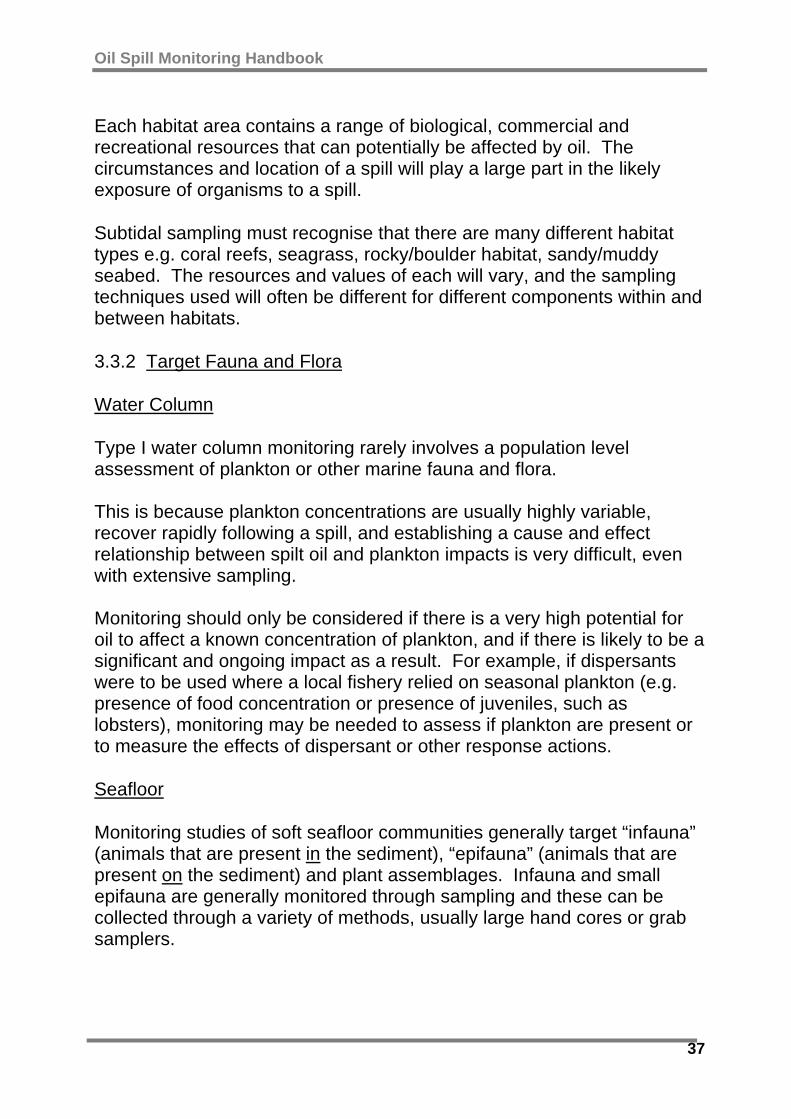
Each habitat area contains a range of biological, commercial and recreational resources that can potentially be affected by oil. The circumstances and location of a spill will play a large part in the likely exposure of organisms to a spill. Subtidal sampling must recognise that there are many different habitat types e.g. coral reefs, seagrass, rocky/boulder habitat, sandy/muddy seabed. The resources and values of each will vary, and the sampling techniques used will often be different for different components within and between habitats. 3.3.2 Target Fauna and Flora Water Column Type I water column monitoring rarely involves a population level assessment of plankton or other marine fauna and flora. This is because plankton concentrations are usually highly variable, recover rapidly following a spill, and establishing a cause and effect relationship between spilt oil and plankton impacts is very difficult, even with extensive sampling. Monitoring should only be considered if there is a very high potential for oil to affect a known concentration of plankton, and if there is likely to be a significant and ongoing impact as a result. For example, if dispersants were to be used where a local fishery relied on seasonal plankton (e.g. presence of food concentration or presence of juveniles, such as lobsters), monitoring may be needed to assess if plankton are present or to measure the effects of dispersant or other response actions. Seafloor Monitoring studies of soft seafloor communities generally target “infauna” (animals that are present in the sediment), “epifauna” (animals that are present on the sediment) and plant assemblages. Infauna and small epifauna are generally monitored through sampling and these can be collected through a variety of methods, usually large hand cores or grab samplers.
Oil Spill Monitoring Handbook
38
These communities may be highly variable over both space and time and consequently, it can be relatively difficult to separate background variation from effects. To overcome this, semi-quantitative methods may be used including: • Recording key species as simply rare, common, or abundant according
to a defined density or frequency of observation category • Percentage cover estimates of sessile (attached or encrusting) species
on substrate, and • Dredging, this provides a broad-scale indication of epibiota presence
and some indication of relative abundance. Seagrasses, corals and reef communities are usually monitored visually using divers or remote operated vehicles (ROVs), recording the numbers, area or percentage cover of epibenthic species. These are usually recorded along transects or in quadrats (Section 5.1.2). If seafloor communities are to be monitored it is advisable to simultaneously monitor sediment contaminant levels. In this way any relationships between contaminant levels and biological effects can be examined. 3.3.3 Parameters A number of effects may be monitored: • Mortality: For large animals and plants this can be monitored using
relatively simple procedures. Smaller organisms, such as plankton, require specialist input. Mortality of mobile organisms can be difficult to interpret particularly if estimates are based on counts of beach-cast individuals. In any case, estimates of bodies lost at sea are not likely to be accurate. Identification of mortality amongst plants may also need specialist input.
• Sublethal effects: Sublethal effects may be difficult to monitor and this generally requires specialist input. The most common example of a sublethal effect is tainting (Guideline 14). Other potential sublethal effects include bioaccumulation, behavioural changes or histopathological effects (e.g. presence of disease or lesions) but these are unlikely to be monitored as part of a Type I monitoring programme unless such effects can be directly attributed to the spill or response and if the information would influence response decisions.
Oil Spill Monitoring Handbook
39
• Changes in community structure e.g. changes in species’ diversity or
relative proportions. • Tainting; Tainting occurs when oil is ingested by fish, crustaceans or
molluscs and hydrocarbons are incorporated into fatty tissues. This imparts an oily taste to the meat and makes it unpalatable. Tainting can adversely affect commercial fisheries and also predatory species such as birds. Taint can be detected through chemical analysis or by a panel of individuals undertaking a “taste test”. The latter method is slower to establish, requires testing and calibration of participants and on occasion may be of questionable reliability. It is, generally, unsuitable as a Type I monitoring method. Only sample acquisition and chemical analysis is discussed in Guideline M.14. If tainting is detected then further monitoring may be required to determine the extent or financial cost of this (see IMO/FAO, 2003, Reilly and York, 2001, and Yender et al., 2002).
Oil Spill Monitoring Handbook
40
GUIDELINE FOR MONITORING DAMAGE TO COMMERCIAL OR RECREATIONAL SPECIES M.10
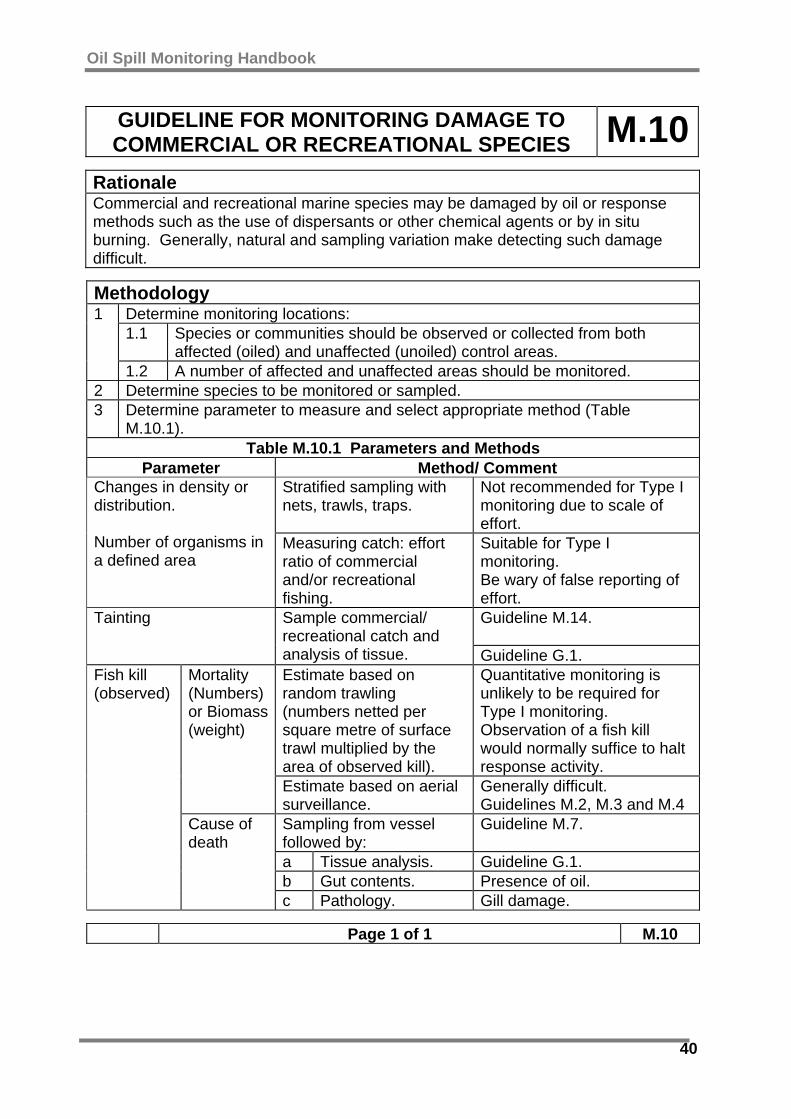
Rationale Commercial and recreational marine species may be damaged by oil or response methods such as the use of dispersants or other chemical agents or by in situ burning. Generally, natural and sampling variation make detecting such damage difficult.
Methodology Determine monitoring locations: 1.1 Species or communities should be observed or collected from both
affected (oiled) and unaffected (unoiled) control areas.
1
1.2 A number of affected and unaffected areas should be monitored. 2 Determine species to be monitored or sampled. 3 Determine parameter to measure and select appropriate method (Table
M.10.1). Table M.10.1 Parameters and Methods
Parameter Method/ Comment Stratified sampling with nets, trawls, traps.
Not recommended for Type I monitoring due to scale of effort.
Changes in density or distribution. Number of organisms in a defined area
Measuring catch: effort ratio of commercial and/or recreational fishing.
Suitable for Type I monitoring. Be wary of false reporting of effort. Guideline M.14.
Tainting Sample commercial/ recreational catch and analysis of tissue. Guideline G.1. Estimate based on random trawling (numbers netted per square metre of surface trawl multiplied by the area of observed kill).
Quantitative monitoring is unlikely to be required for Type I monitoring. Observation of a fish kill would normally suffice to halt response activity.
Mortality (Numbers) or Biomass (weight)
Estimate based on aerial surveillance.
Generally difficult. Guidelines M.2, M.3 and M.4
Sampling from vessel followed by:
Guideline M.7.
a Tissue analysis. Guideline G.1. b Gut contents. Presence of oil.
Fish kill (observed)
Cause of death
c Pathology. Gill damage.
Page 1 of 1 M.10

Oil Spill Monitoring Handbook
41
GUIDELINE FOR MONITORING DAMAGE TO MARINE MEGAFAUNA M.11
Rationale Large marine species may be damaged by oil or response methods such as the use of dispersants or other chemical agents, by in situ burning or by vessels involved in cleanup. The presence of megafauna, whether alive or dead, should be monitored throughout a spill response.
Methodology Determine sampling locations: 1.1 Species or communities should be observed or collected from both
affected (oiled) and unaffected (unoiled) control areas.
1
1.2 A number of affected and unaffected areas should be monitored. 2 Determine species to be monitored. 3 Determine parameter to measure and select appropriate method (Table
M.11.1). Table M.11.1 Parameters and Methods
Parameter Method/Comment Aerial surveys. Presence or
absence Group or species(1) Boat surveys.
Requires expert personnel.
Aerial surveys. Number of dead Boat surveys.
Expert personnel recommended. Guideline G.1
Mortality
Cause of death
Collection and analysis of biological samples, and pathology examination.
Done by veterinarian: Eye, nose, and/or gut damage or clogging, gut contents.
Activity Boat/shoreline surveys.
Requires expert personnel.
Oiled/unoiled Boat/shoreline surveys.
Requires expert personnel.
Status (Numbers)
Feeding/not feeding
Boat/shoreline surveys.
Requires expert personnel.
CAUTION! Personnel should not be in known crocodile areas unless accompanied by an experienced Wildlife Officer.
(1) Crocodiles, turtles, seals, sea lions, dugongs and cetaceans (whales/dolphins).
Page 1 of 1 M.11

Oil Spill Monitoring Handbook
42
GUIDELINE FOR
MONITORING DAMAGE TO MARINE FLORA M.12
Rationale The presence of emergent or shallow marine flora such as kelps and other algaes, or seagrass can be a major constraint on response activities. These species and associated communities can be damaged by oil, vessel activity, use of chemical agents and in situ burning. Shallow and emergent species may be damaged by containment and recovery operations.
Methodology
Determine monitoring locations: 1.1 Species or communities should be observed in both affected (oiled or
cleaned) and unaffected (unoiled or uncleaned) control areas.
1
1.2 A number of affected and unaffected areas should be monitored. 2 Determine species to be monitored. 3 Determine parameter to measure and select appropriate method (Table M.12.1).
Table M.12.1 Parameters and Methods Parameter Method/Comment
Boat/shoreline surveys Distribution of Oil on Plants
% cover on total plant area. Based on a visual
estimate of % cover
Plant Distribution
Depth/tidal elevation.
Boat/shoreline surveys
Aerial/satellite surveys Abundance (Loss of plants)
% cover of sea or sediment surface
Visual estimate of substrate or sea surface covered.
Loss of biomass.
% cover of sea surface or seafloor
Reduced plant coverage is the simplest indicator of loss of biomass.
Unlikely to be a Type I monitoring programme for large plants, as loss of whole plants or significant biomass may occur over a longer time period than the response. Guideline S.4.
Boat/shoreline surveys Aerial surveys
Leaf/frond damage
Chlorosis (bleaching). No. of leaves or % area affected
Leaves/fronds go yellow, loss of colour.
Loss of pigment may be an early sign of damage.
(1) These need to be compared to unoiled or uncleaned “control” areas.
Page 1 of 1 M.12

Oil Spill Monitoring Handbook
43
GUIDELINE FOR MONITORING DAMAGE TO PLANKTON M.13
Rationale Monitoring of plankton numbers is an unlikely for Type I monitoring because numbers may vary greatly, making non-gross effects difficult to detect, and the fact that recovery is likely to be rapid –either through reproduction or ingress of plankton from unaffected areas. Monitoring of specific plankton, such as larvae of commercial species, may needed to safeguard against adverse effects of response activities such as the use of chemical response agents or in situ burning methods.
Methodology 1 Determine monitoring locations: A number of affected and unaffected areas
should be monitored. 2 Determine parameter to measure and select appropriate method (Table
M.13.1). Table M.13.1 Parameters and Methods
Parameter Comment Number of Organisms
Biomass Boat surveys; plankton net trawls (see Figure M.13.1). Boat surveys; plankton net trawls.
Mortality Proportion of dead plankton
Laboratory or on site assessment, if laboratory assessment then expert packing and handling of samples is required. This task generally, requires expert interpretation.
Sublethal effects
“Moribund” zooplankton
Unlikely Type I monitoring. The significance of sublethal effects. are difficult to assess in the short time frame available.
Figure M.13.1 Plankton Net Trawl Sampler
(Photo: Cawthron Institute)
Page 1 of 1 M.13

Oil Spill Monitoring Handbook
44
GUIDELINE FOR SAMPLING OF ORGANISMS FOR TAINT
TESTING M.14
Rationale Fish, crustaceans and shellfish may ingest oil or oily sediments, resulting in the incorporation of hydrocarbons in fatty tissues. This can cause the meat to have an oily taste (or “taint”). It may be necessary to monitor commercial or recreational species to detect whether this has occurred.
Methodology Determine sampling locations: 1.1 Fish, crustaceans or molluscs should be collected from both affected
(oiled) and unaffected (unoiled) areas. Species may contain “background” hydrocarbons unrelated to the spill source.
1.2 A number of affected and unaffected areas should be sampled (see 3.1).
1
1.3 Location should be selected on the basis of the objectives of the programme, e.g: If tainting of commercial fish is being monitored then fish samples should be obtained from commercial fishing areas.
2 Determine species to be sampled. Species should be selected on the basis of the objectives of the programme, e.g. if tainting of commercial fish is being monitored then fish of a commercial species and size, should be targeted. Collect samples:
Samples can be collected from the chosen locations by monitoring teams. This method is prone to a number of potential errors: 3.1.1 The locations may not be representative of the fishing area or
predator feeding area. 3.1.2 Collection methods do not reflect the collection (targeting or catch)
methods of fisheries or predators.
3.1
3.1.3 It is a slow process and sample numbers are consequently small. Samples can be collected from commercial or recreational fishing operators. This avoids the potential sources of error (3.1.1 – 3.1.3), but: 3.2.1 This method cannot be used for other objectives, e.g. potential
effects on predators. 3.2.2 The “affected” location will be areas that were oiled. Fishing
activity is unlikely to occur in areas that are oiled.
3
3.2
3.2.3 Fishing activities may extend over both “affected” and “unaffected” (“control”) areas. It is possible to ask fishing operators to segregate samples of the catch, to place monitoring personnel on some vessels or to obtain samples from a different fishing area. In the last case these may not represent true “background” levels”).
4 Pack and handle samples as per Guideline G.1 5 Send for tissue analysis. For commercial/recreational catch this will be based
on fatty tissue only. For animal prey species, the whole sample should be analysed (including gut contents). Individual tissues and gut can be analysed, or the whole sample can be homogenised and tested.
Page 1 of 1 M.14
Oil Spill Monitoring Handbook
45
4.0 MONITORING THE SHORELINE ENVIRONMENT 4.1 Organisation of Shoreline Monitoring Oil impacted shorelines are usually divided into discrete management areas to plan and implement a shoreline response. This is usually done by the Shoreline Coordinator or delegated Supervisors who define response “Divisions”, “Sectors”, and “Segments”: • Divisions are very large management units and are unlikely to be
used in monitoring a spill response. • Sectors are generally based on logistics considerations. Support
facilities such as waste management sites, equipment stores, ablutions, canteens and other support facilities are usually organised within each Sector.
• Segments are lengths of shoreline that can be considered an individual work site. Segment boundaries will generally be defined on the basis of common substrate type, or less usually on common access points, ownership or jurisdiction. Sometimes cleanup or monitoring teams will define “Subsegments” “plots” or “transects” within a Segment. However, planning and response information is usually based at a Segment level, not at smaller units within it.
Guidelines for the delineation of Sectors and Segments are provided in Guideline S.1. Determination of Division, Sector and Segment boundaries is usually undertaken by the Shoreline Coordinator. Guidelines are provided here to ensure a consistency of approach in cases where monitoring teams precede cleanup teams. It is important that Shoreline Cleanup personnel systematically record information that can be important for future monitoring programmes, e.g: • The amount of sediment removed (type and volume). • Oil distribution before and after cleaning (see Guidelines S.5 & S.6). • Beach profiles before and after each cleanup (see Guideline S.3). • Use of chemical agents:
- Precise locations of applications onshore and inshore. - Volumes applied.
- Product name. • Cleanup activities (methods used, times).
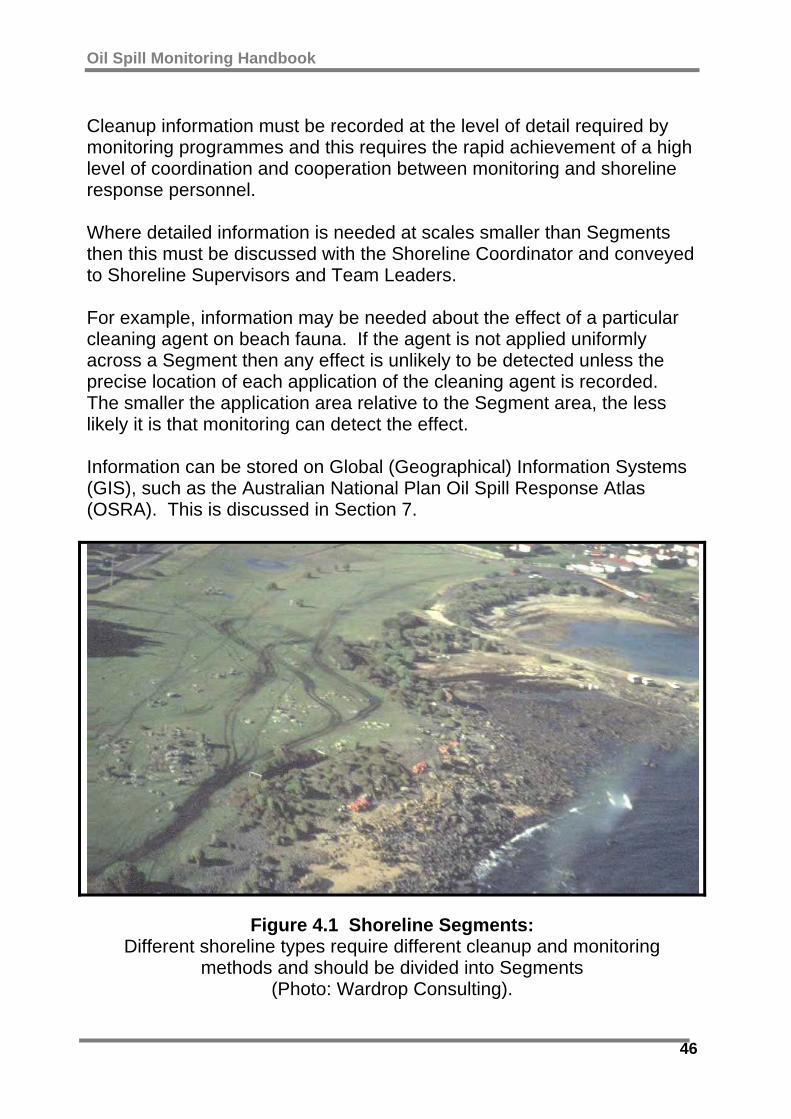
Oil Spill Monitoring Handbook
46
Cleanup information must be recorded at the level of detail required by monitoring programmes and this requires the rapid achievement of a high level of coordination and cooperation between monitoring and shoreline response personnel. Where detailed information is needed at scales smaller than Segments then this must be discussed with the Shoreline Coordinator and conveyed to Shoreline Supervisors and Team Leaders. For example, information may be needed about the effect of a particular cleaning agent on beach fauna. If the agent is not applied uniformly across a Segment then any effect is unlikely to be detected unless the precise location of each application of the cleaning agent is recorded. The smaller the application area relative to the Segment area, the less likely it is that monitoring can detect the effect. Information can be stored on Global (Geographical) Information Systems (GIS), such as the Australian National Plan Oil Spill Response Atlas (OSRA). This is discussed in Section 7.
Figure 4.1 Shoreline Segments:
Different shoreline types require different cleanup and monitoring methods and should be divided into Segments
(Photo: Wardrop Consulting).
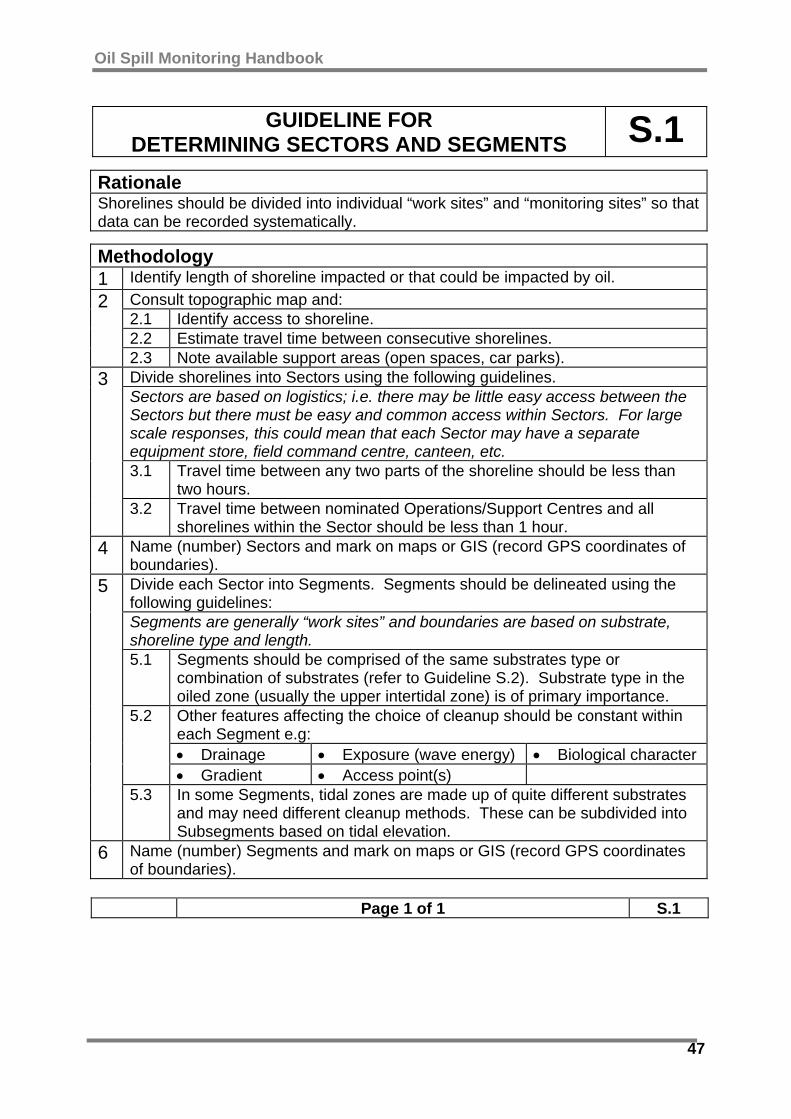
Oil Spill Monitoring Handbook
47
GUIDELINE FOR DETERMINING SECTORS AND SEGMENTS S.1
Rationale Shorelines should be divided into individual “work sites” and “monitoring sites” so that data can be recorded systematically.
Methodology 1 Identify length of shoreline impacted or that could be impacted by oil.
Consult topographic map and: 2.1 Identify access to shoreline. 2.2 Estimate travel time between consecutive shorelines.
2
2.3 Note available support areas (open spaces, car parks). Divide shorelines into Sectors using the following guidelines. Sectors are based on logistics; i.e. there may be little easy access between the Sectors but there must be easy and common access within Sectors. For large scale responses, this could mean that each Sector may have a separate equipment store, field command centre, canteen, etc. 3.1 Travel time between any two parts of the shoreline should be less than
two hours.
3
3.2 Travel time between nominated Operations/Support Centres and all shorelines within the Sector should be less than 1 hour.
4 Name (number) Sectors and mark on maps or GIS (record GPS coordinates of boundaries). Divide each Sector into Segments. Segments should be delineated using the following guidelines: Segments are generally “work sites” and boundaries are based on substrate, shoreline type and length. 5.1 Segments should be comprised of the same substrates type or
combination of substrates (refer to Guideline S.2). Substrate type in the oiled zone (usually the upper intertidal zone) is of primary importance. Other features affecting the choice of cleanup should be constant within each Segment e.g: • Drainage • Exposure (wave energy) • Biological character
5.2
• Gradient • Access point(s)
5
5.3 In some Segments, tidal zones are made up of quite different substrates and may need different cleanup methods. These can be subdivided into Subsegments based on tidal elevation.
6 Name (number) Segments and mark on maps or GIS (record GPS coordinates of boundaries).
Page 1 of 1 S.1
Oil Spill Monitoring Handbook
48
4.2 Physical Environment The physical characteristics of a shoreline largely determine how oil will behave over time, how the shoreline can most effectively be cleaned, and the likelihood that it can be damaged by oil and cleanup activities. The physical character of a shoreline can be described in terms of: • Substrate type. • Form;
- Geomorphological type. - Dimensions. - Profile or gradient.
• Energy (winds, waves). 4.2.1 Substrate Type The simplest way of describing substrate is on particle size (Guideline S.2). This, in part, determines the size of the spaces between particles, and this in turn influences the depth to which oil will penetrate and the ease with which wave action will remove the oil. These considerations are important in determining the need for, and type of, shoreline cleanup. Other considerations may also be important, such as: • The type of material that the substrate is made of. Sandstones and
other porous rocks are more difficult to clean than denser rock types. • Surface character of the particles. Boulders that are creviced or have
uneven surfaces are more difficult to clean than smooth surfaces. • Whether the substrate is natural or artificial. This reflects differences
in sensitivity – either real or perceived. • Shape of the substrate. Flat rocks have less “interstitial space” than
rounded ones. 4.2.2 Shoreline Form The size and shape of a shoreline Sector is important in evaluating cleanup options and activities. In particular, gradient (slope), width (LTM to HTM) and height (for cliffs and dunes) are important parameters for logistics. For smaller substrate shorelines (mud to cobble) these may change naturally, or be changed by cleanup activity.
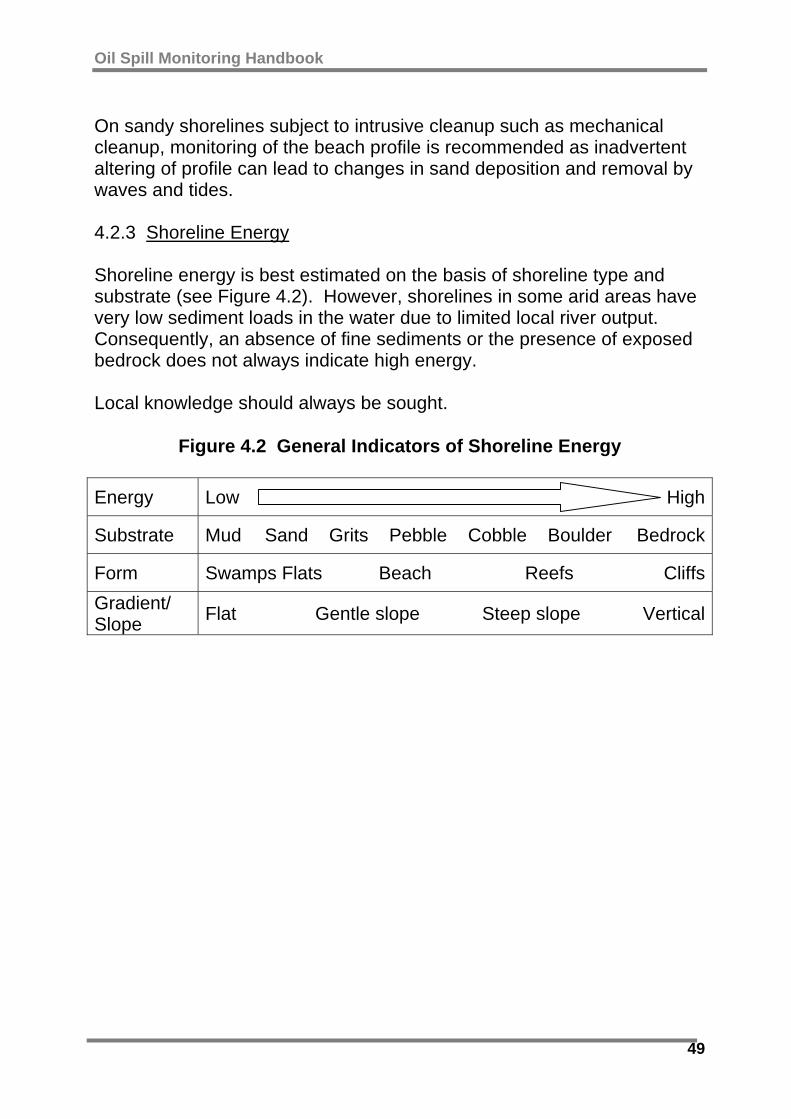
Oil Spill Monitoring Handbook
49
On sandy shorelines subject to intrusive cleanup such as mechanical cleanup, monitoring of the beach profile is recommended as inadvertent altering of profile can lead to changes in sand deposition and removal by waves and tides. 4.2.3 Shoreline Energy Shoreline energy is best estimated on the basis of shoreline type and substrate (see Figure 4.2). However, shorelines in some arid areas have very low sediment loads in the water due to limited local river output. Consequently, an absence of fine sediments or the presence of exposed bedrock does not always indicate high energy. Local knowledge should always be sought.
Figure 4.2 General Indicators of Shoreline Energy Energy Low High
Substrate Mud Sand Grits Pebble Cobble Boulder Bedrock
Form Swamps Flats Beach Reefs CliffsGradient/ Slope Flat Gentle slope Steep slope Vertical

Oil Spill Monitoring Handbook
50
GUIDELINE FOR
CHARACTERISING SHORELINE SUBSTRATE S.2
Rationale Substrate type (particle size) determines the size of the spaces between particles and this in turn influences the depth to which oil will penetrate, and the ease with which wave action will remove the oil. These considerations are important in determining the need for, and type of, shoreline cleanup.
Methodology Type Abbr. Descriptive Terms Explanation
Bedrock or
Rock
R • Porous/non-porous • Broken/not broken
(crevices/no crevices).
Porosity and crevices increase the likely persistence of the oil.
Boulder B • As above. >256mm diameter: Larger than a head.
Cobble C • Porous (e.g. coral, pumice)/non-porous.
64 – 256mm: Fist or brick to head-sized
Pebble P • Or use “shingle” if flattened.
4 – 64mm: Pen diameter to fist sized.
Granules/Gravel
G • Rounded/flat. • Compacted/loose.
2 – 4mm diameter.
Sand S • Fine to coarse. 0.06 – 2mm diameter. Mud/Silt/
Clay M • Note organic matter
(debris/ fauna/ flora). • Consolidated/loose. • Dry (e.g. mud cliffs).
<0.06mm diameter. Field Test: Mix with water: If it “clouds up” it is silt/mud. If it sinks/clears it is sand.
Earth/ Soil E • Generally only applicable to cliffs and seawalls. Ice I • Likely only in the Antarctic territories.
Shellgrit Sh • Wet/dry. Usually with sand (Sh/S). Coral(1) Co • Rubble/Boulder/
Cobble (e.g. Co-C). Use to describe dead coral areas, e.g. coral cobble.
Concrete(2) Cc • Rubble; rip-rap.(2)
Artificial substrates/forms should be described and marked on segment maps.
Wood W • Debris/logs; pilings. Debris can overlay other substrates.
Metal Mt • Pilings, sheeting. Usually artificial structures. 1. If corals are live, the shoreline should be described as coral noting its biological
character and substrate type. 2. The abbreviation “A” can be used to designate artificial structures when they are
not otherwise easily described, e.g. A-B would describe artificial boulder shoreline (i.e. rip-rap).
Page 1 of 1 S.2
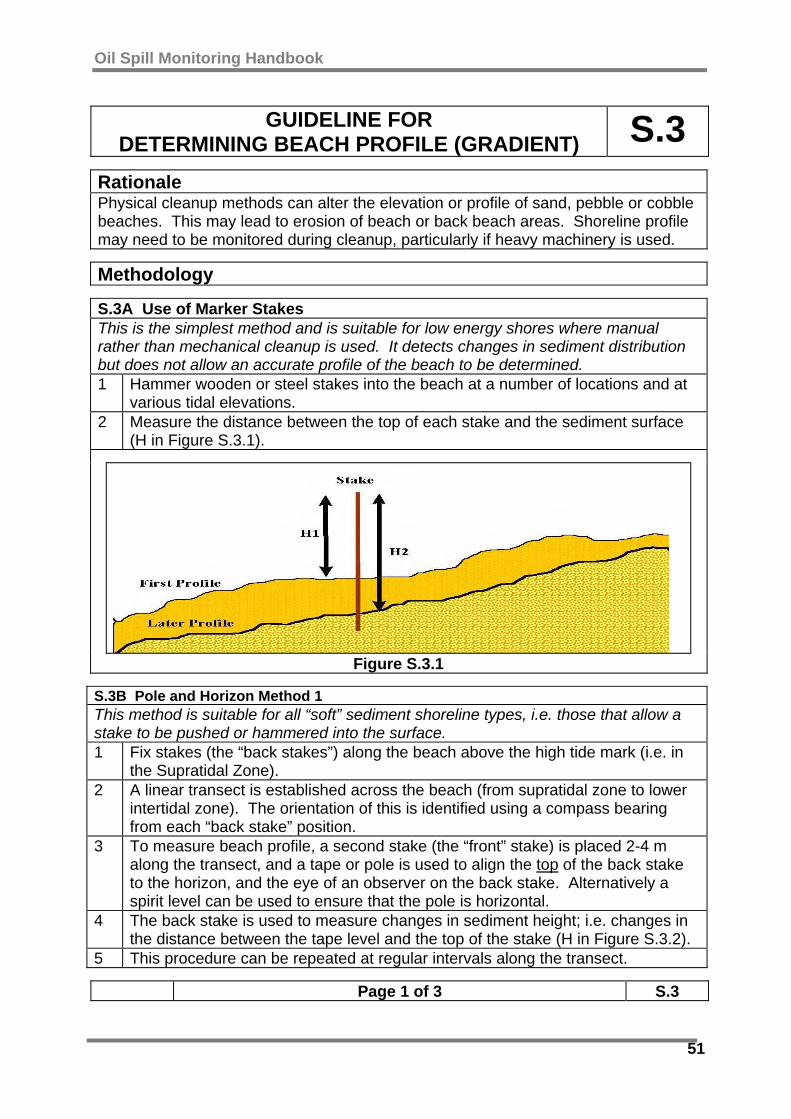
Oil Spill Monitoring Handbook
51
GUIDELINE FOR DETERMINING BEACH PROFILE (GRADIENT) S.3
Rationale Physical cleanup methods can alter the elevation or profile of sand, pebble or cobble beaches. This may lead to erosion of beach or back beach areas. Shoreline profile may need to be monitored during cleanup, particularly if heavy machinery is used.
Methodology
S.3A Use of Marker Stakes This is the simplest method and is suitable for low energy shores where manual rather than mechanical cleanup is used. It detects changes in sediment distribution but does not allow an accurate profile of the beach to be determined. 1 Hammer wooden or steel stakes into the beach at a number of locations and at
various tidal elevations. 2 Measure the distance between the top of each stake and the sediment surface
(H in Figure S.3.1).
Figure S.3.1
S.3B Pole and Horizon Method 1 This method is suitable for all “soft” sediment shoreline types, i.e. those that allow a stake to be pushed or hammered into the surface. 1 Fix stakes (the “back stakes”) along the beach above the high tide mark (i.e. in
the Supratidal Zone). 2 A linear transect is established across the beach (from supratidal zone to lower
intertidal zone). The orientation of this is identified using a compass bearing from each “back stake” position.
3 To measure beach profile, a second stake (the “front” stake) is placed 2-4 m along the transect, and a tape or pole is used to align the top of the back stake to the horizon, and the eye of an observer on the back stake. Alternatively a spirit level can be used to ensure that the pole is horizontal.
4 The back stake is used to measure changes in sediment height; i.e. changes in the distance between the tape level and the top of the stake (H in Figure S.3.2).
5 This procedure can be repeated at regular intervals along the transect.
Page 1 of 3 S.3
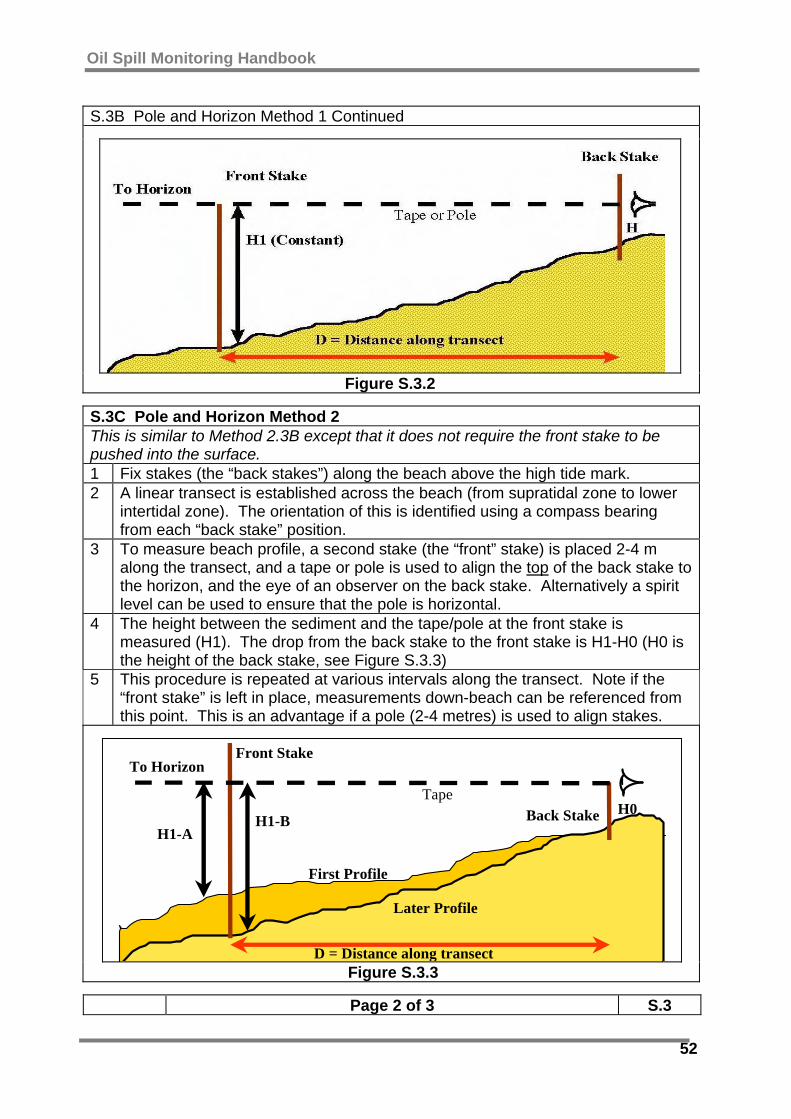
Oil Spill Monitoring Handbook
52
S.3B Pole and Horizon Method 1 Continued
Figure S.3.2
S.3C Pole and Horizon Method 2 This is similar to Method 2.3B except that it does not require the front stake to be pushed into the surface. 1 Fix stakes (the “back stakes”) along the beach above the high tide mark. 2 A linear transect is established across the beach (from supratidal zone to lower
intertidal zone). The orientation of this is identified using a compass bearing from each “back stake” position.
3 To measure beach profile, a second stake (the “front” stake) is placed 2-4 m along the transect, and a tape or pole is used to align the top of the back stake to the horizon, and the eye of an observer on the back stake. Alternatively a spirit level can be used to ensure that the pole is horizontal.
4 The height between the sediment and the tape/pole at the front stake is measured (H1). The drop from the back stake to the front stake is H1-H0 (H0 is the height of the back stake, see Figure S.3.3)
5 This procedure is repeated at various intervals along the transect. Note if the “front stake” is left in place, measurements down-beach can be referenced from this point. This is an advantage if a pole (2-4 metres) is used to align stakes.
To Horizon
First Profile
Later Profile
H1-BH1-A
Front Stake
TapeBack Stake H0
D = Distance along transect Figure S.3.3
Page 2 of 3 S.3
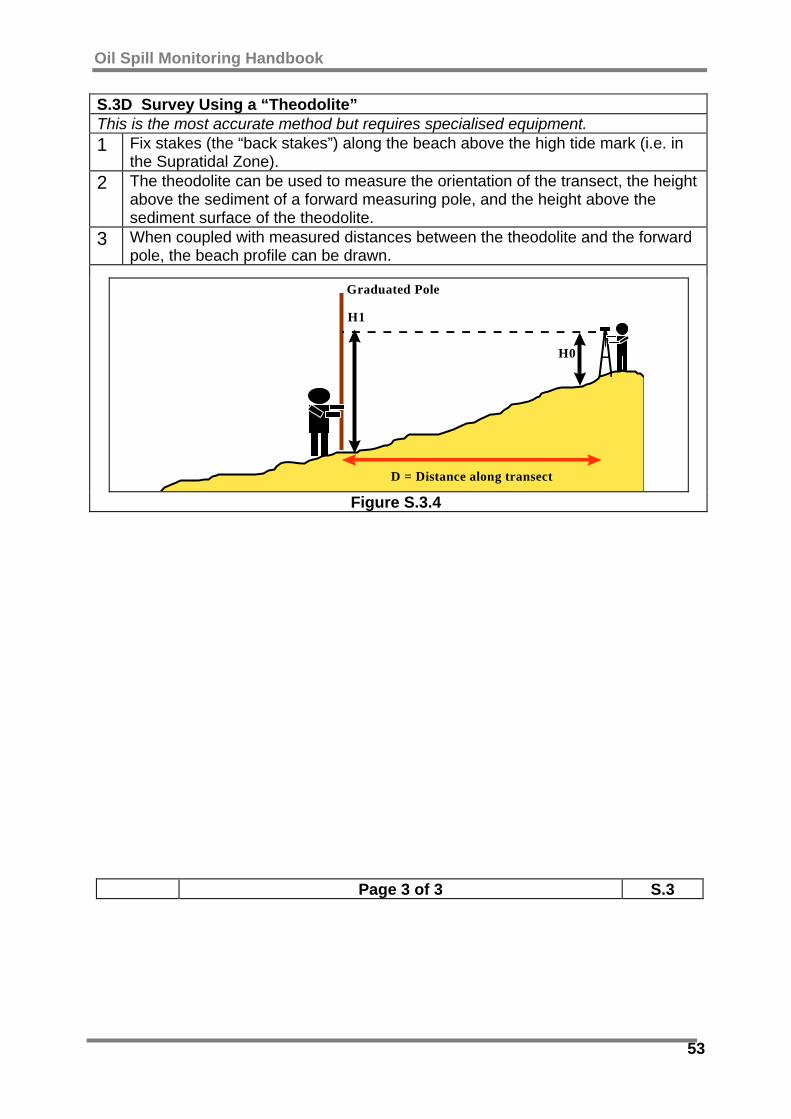
Oil Spill Monitoring Handbook
53
S.3D Survey Using a “Theodolite” This is the most accurate method but requires specialised equipment. 1 Fix stakes (the “back stakes”) along the beach above the high tide mark (i.e. in
the Supratidal Zone). 2 The theodolite can be used to measure the orientation of the transect, the height
above the sediment of a forward measuring pole, and the height above the sediment surface of the theodolite.
3 When coupled with measured distances between the theodolite and the forward pole, the beach profile can be drawn.
H1
H0
Graduated Pole
D = Distance along transect
Figure S.3.4
Page 3 of 3 S.3

Oil Spill Monitoring Handbook
54
4.3 Oil on Shorelines The amount and distribution of oil on, and in, shorelines may need to be measured and monitored in order to determine: • The most appropriate response strategies. • The effectiveness of cleanup methods. • The need for cleanup, e.g. to;
- Predict the likely persistence of oil on the shore. - Measure rates of natural removal.
• When cleanup should be terminated, e.g. when; - A satisfactory level of cleaning is achieved. - When cleaning efforts are achieving no significant benefit.
The presence and distribution of oil on shorelines can be monitored through aerial surveillance, ground surveys or through remote sensing. The amount of oil present can be estimated by visual observation or more accurately quantified through a combination of visual assessment of distribution together with sampling and chemical analysis. The combined visual-sampling approach is more accurate – provided that sampling has been done correctly – but this level of accuracy is not always needed for Type I monitoring. It is also slower in the provision of results. This Section provides Guidelines for both visual monitoring of oil on shorelines and for the sampling of sediments and oil for chemical analysis. Chemical analysis methods are overviewed in Section 6. 4.3.1 Aerial Surveys Aerial surveillance is the most rapid means of estimating the location of oil on shorelines, and the length and extent of the oily band. Locations can be accurately logged, and band widths and percentages of cover can be estimated (see Guideline S.4). However, it is rare that an accurate indication of oil thickness can be obtained using this technique, and therefore it is very difficult to quantify the oil present. Although experienced observers can often make good estimates, ground surveys are usually still required to verify estimates.
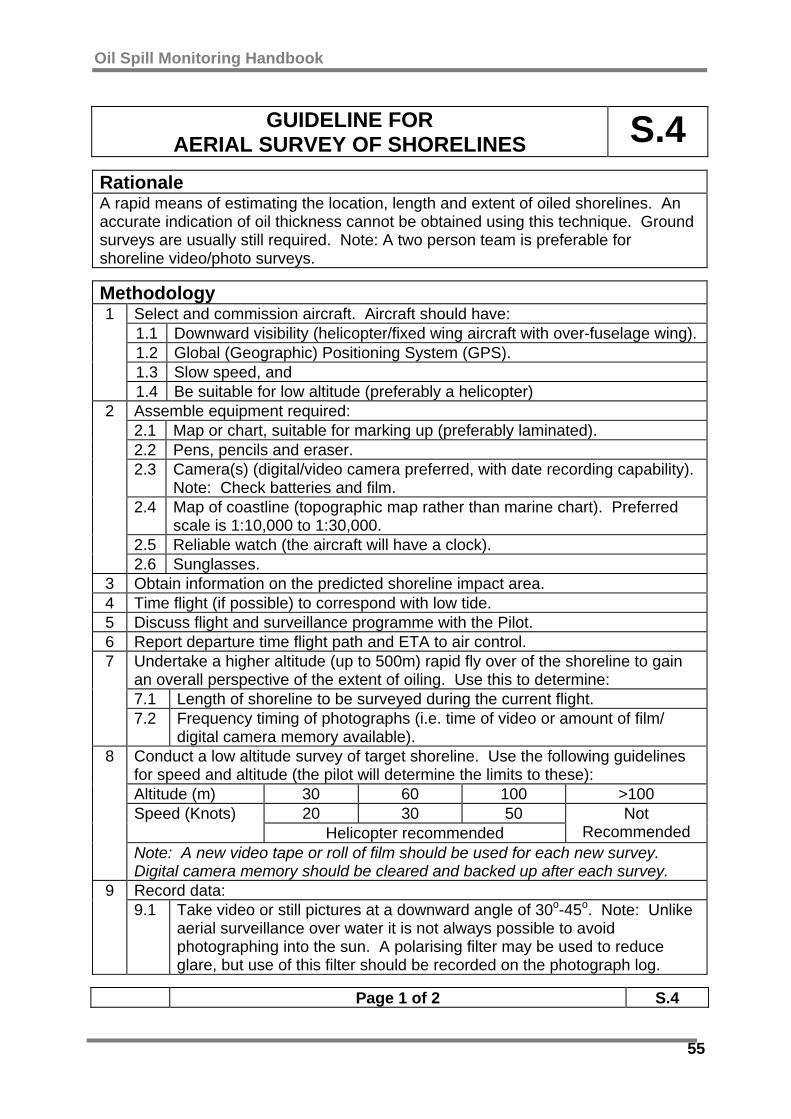
Oil Spill Monitoring Handbook
55
GUIDELINE FOR AERIAL SURVEY OF SHORELINES S.4
Rationale A rapid means of estimating the location, length and extent of oiled shorelines. An accurate indication of oil thickness cannot be obtained using this technique. Ground surveys are usually still required. Note: A two person team is preferable for shoreline video/photo surveys.
Methodology Select and commission aircraft. Aircraft should have: 1.1 Downward visibility (helicopter/fixed wing aircraft with over-fuselage wing). 1.2 Global (Geographic) Positioning System (GPS). 1.3 Slow speed, and
1
1.4 Be suitable for low altitude (preferably a helicopter) Assemble equipment required: 2.1 Map or chart, suitable for marking up (preferably laminated). 2.2 Pens, pencils and eraser. 2.3 Camera(s) (digital/video camera preferred, with date recording capability).
Note: Check batteries and film. 2.4 Map of coastline (topographic map rather than marine chart). Preferred
scale is 1:10,000 to 1:30,000. 2.5 Reliable watch (the aircraft will have a clock).
2
2.6 Sunglasses. 3 Obtain information on the predicted shoreline impact area. 4 Time flight (if possible) to correspond with low tide. 5 Discuss flight and surveillance programme with the Pilot. 6 Report departure time flight path and ETA to air control.
Undertake a higher altitude (up to 500m) rapid fly over of the shoreline to gain an overall perspective of the extent of oiling. Use this to determine: 7.1 Length of shoreline to be surveyed during the current flight.
7
7.2 Frequency timing of photographs (i.e. time of video or amount of film/ digital camera memory available).
Conduct a low altitude survey of target shoreline. Use the following guidelines for speed and altitude (the pilot will determine the limits to these): Altitude (m) 30 60 100 >100
20 30 50 Speed (Knots) Helicopter recommended
Not Recommended
8
Note: A new video tape or roll of film should be used for each new survey. Digital camera memory should be cleared and backed up after each survey. Record data: 9 9.1 Take video or still pictures at a downward angle of 30o-45o. Note: Unlike
aerial surveillance over water it is not always possible to avoid photographing into the sun. A polarising filter may be used to reduce glare, but use of this filter should be recorded on the photograph log.
Page 1 of 2 S.4
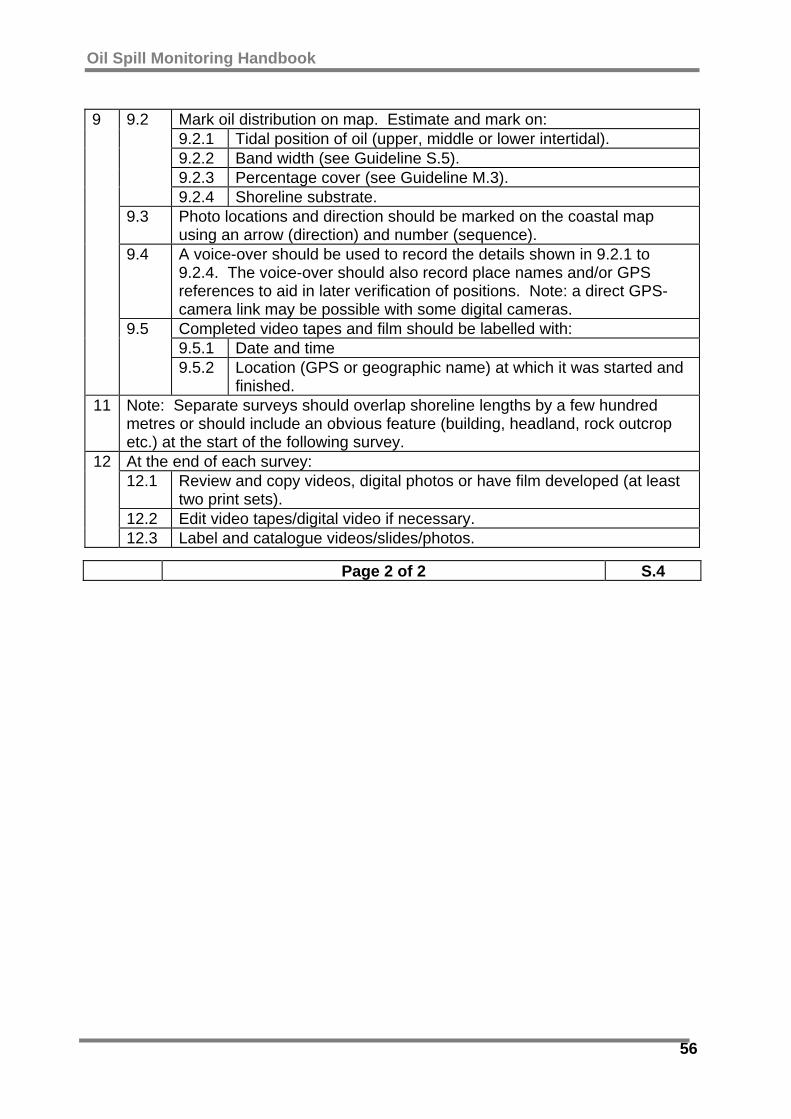
Oil Spill Monitoring Handbook
56
Mark oil distribution on map. Estimate and mark on: 9.2.1 Tidal position of oil (upper, middle or lower intertidal). 9.2.2 Band width (see Guideline S.5). 9.2.3 Percentage cover (see Guideline M.3).
9.2
9.2.4 Shoreline substrate. 9.3 Photo locations and direction should be marked on the coastal map
using an arrow (direction) and number (sequence). 9.4 A voice-over should be used to record the details shown in 9.2.1 to
9.2.4. The voice-over should also record place names and/or GPS references to aid in later verification of positions. Note: a direct GPS-camera link may be possible with some digital cameras. Completed video tapes and film should be labelled with: 9.5.1 Date and time
9
9.5
9.5.2 Location (GPS or geographic name) at which it was started and finished.
11 Note: Separate surveys should overlap shoreline lengths by a few hundred metres or should include an obvious feature (building, headland, rock outcrop etc.) at the start of the following survey. At the end of each survey: 12.1 Review and copy videos, digital photos or have film developed (at least
two print sets). 12.2 Edit video tapes/digital video if necessary.
12
12.3 Label and catalogue videos/slides/photos.
Page 2 of 2 S.4
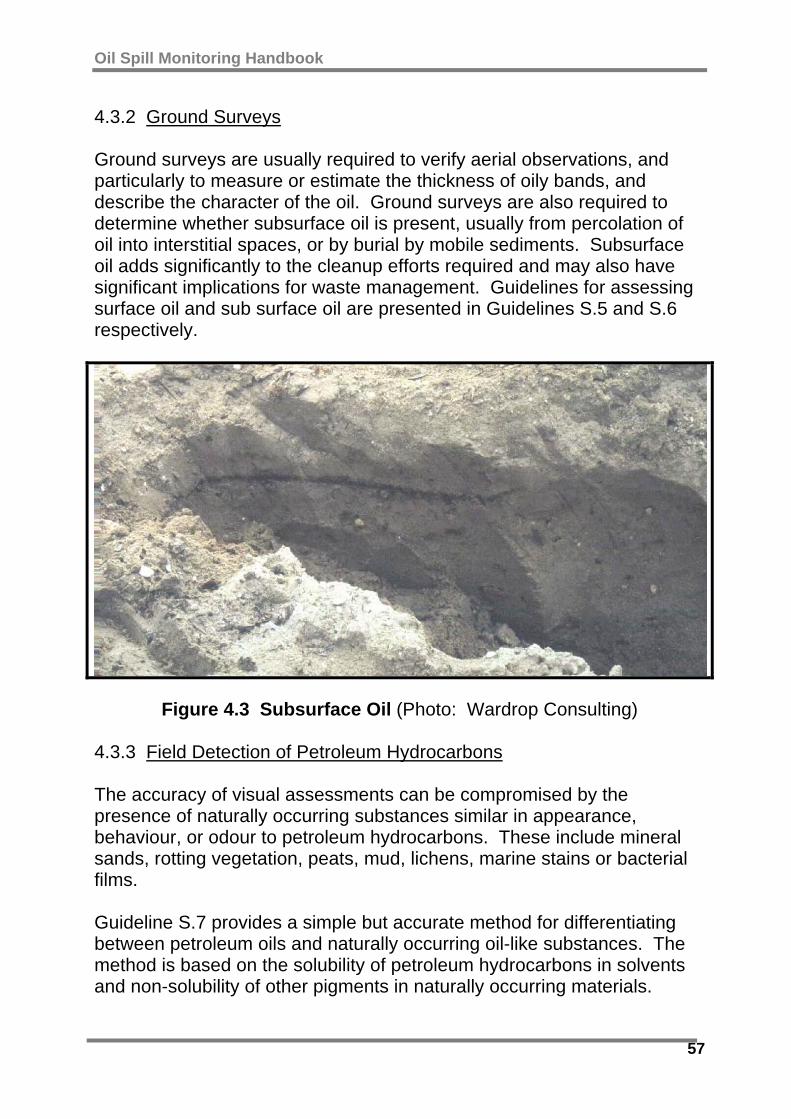
Oil Spill Monitoring Handbook
57
4.3.2 Ground Surveys Ground surveys are usually required to verify aerial observations, and particularly to measure or estimate the thickness of oily bands, and describe the character of the oil. Ground surveys are also required to determine whether subsurface oil is present, usually from percolation of oil into interstitial spaces, or by burial by mobile sediments. Subsurface oil adds significantly to the cleanup efforts required and may also have significant implications for waste management. Guidelines for assessing surface oil and sub surface oil are presented in Guidelines S.5 and S.6 respectively.
Figure 4.3 Subsurface Oil (Photo: Wardrop Consulting)
4.3.3 Field Detection of Petroleum Hydrocarbons The accuracy of visual assessments can be compromised by the presence of naturally occurring substances similar in appearance, behaviour, or odour to petroleum hydrocarbons. These include mineral sands, rotting vegetation, peats, mud, lichens, marine stains or bacterial films. Guideline S.7 provides a simple but accurate method for differentiating between petroleum oils and naturally occurring oil-like substances. The method is based on the solubility of petroleum hydrocarbons in solvents and non-solubility of other pigments in naturally occurring materials.

Oil Spill Monitoring Handbook
58
GUIDELINE FOR ASSESSMENT OF OILED SHORELINES: SURFACE OIL S.5
Rationale Monitoring the extent and distribution of oil on shorelines is needed for planning shoreline response strategies, methods and cleanup. This procedure sets out the method for describing oil on shoreline Segments (Guideline S.1). The general distribution of oil over large lengths of shoreline is monitored by using modified aerial surveillance procedures (Guideline S.3).
Methodology 1 Divide shoreline into Sectors and Segments (see Guideline S.1)
Record the following shoreline descriptors: 2.1 Length In metres 2.2 Width In metres, from high tide to low tide. 2.3 Gradient In degrees; approximate or as per Guideline S.3 2.4 Energy High, medium or low as suggested by form 2.5 Substrate Mud, sand, pebble etc. as per Guideline S.2
2
2.6 Form (or type) Cliff, platform cobble beach etc. 3 For each Segment, draw a sketch map showing the approximate location of the
oil. Record the following parameters for the oily band: 4.1 Length In km for Sectors or total, in m, for Segments.
The distance the oily band extends along the shoreline. 4.2 Width In metres. Average width of the oily band within a Segment or
Sector. Measured across a beach from high to low elevations. % Cover
Visual estimate of the percentage of the band (or average of bands). As per Figure below;
20% 30% 40% 50% 60% 70% 80%
4.3
Figure S.5.1 Po Pooled oil. Can be estimated or measured in mm or cm. Cv Cover. In mm, this is measurable (> 1mm thick) Ct Coat. Can be scratched off rock with fingernail. Ct will
mask the colour and texture of underlying substrate. St Stain. Cannot be scratched off rock. Texture of
substrate is visible through the oil
4
4.4 Oil Thick-ness
Fi/ Sh
Film (Fi) or Sheen (Sh). Transparent. The colour and texture of substrate is visible through the oil
5 If necessary, or requested, classify surface oiling as per Tables overpage.
Page 1 of 2 S.5
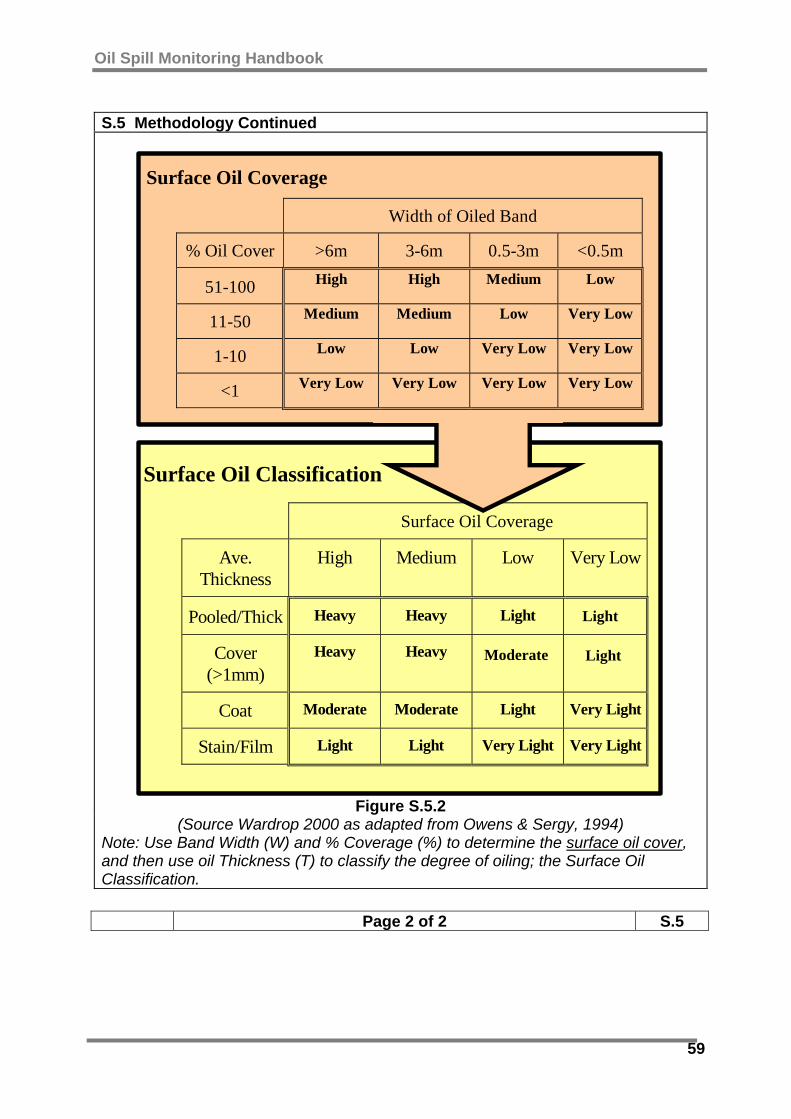
Oil Spill Monitoring Handbook
59
S.5 Methodology Continued
Width of Oiled Band
% Oil Cover >6m 3-6m 0.5-3m <0.5m
51-100 High High Medium Low
11-50 Medium Medium Low Very Low
1-10 Low Low Very Low Very Low
<1 Very Low Very Low Very Low Very Low
Initial Oil Coverage
Ave.Thickness
High Medium Low Very Low
Pooled/Thick Heavy Heavy Light Low
Cover(>1mm)
Heavy Heavy Light Low
Coat Moderate Moderate Light Very Light
Stain/Film Light Light Very Light Very Light
Surface Oil Coverage
Surface Oil Classification
Surface Oil Coverage
Light
LightModerate
Figure S.5.2
(Source Wardrop 2000 as adapted from Owens & Sergy, 1994) Note: Use Band Width (W) and % Coverage (%) to determine the surface oil cover, and then use oil Thickness (T) to classify the degree of oiling; the Surface Oil Classification.
Page 2 of 2 S.5

Oil Spill Monitoring Handbook
60
GUIDELINE FOR ASSESSMENT
OF OILED SHORELINES: SUB-SURFACE OIL S.6
Rationale Monitoring the extent and depth of oil in shorelines is needed for planning shoreline response strategies, methods and cleanup. This procedure sets out the method for describing subsurface oil.
Methodology 1 Divide shoreline into Sectors and Segments (see Guideline S.1).
Record the following shoreline descriptors: 2.1 Length In metres. 2.2 Width In metres, from high tide to low tide. 2.3 Gradient In degrees; approximate or as per Guideline S.3. 2.4 Energy High, medium or low as suggested by form. 2.5 Substrate Mud, sand, pebble etc. as per Guideline S.2.
2
2.6 Form (or type) Cliff, platform cobble beach etc. 3 Dig trenches or pits to detect subsurface oil. Narrow trenches are more
suitable for sandy substrates. Pits are more suitable for cobbles or small boulder substrates. The depth required will depend on substrate type and, for sand – pebbles, on sediment mobility (wave energy).
4 For each Segment, draw a sketch map showing the approximate location of subsurface oil detected. If possible, record the following parameters for the oily band: 5.1 Length In km for Sectors or total, in metres, for Segments.
The distance the oily band extends along the shoreline. 5.2 Width In metres. Average width of the oily band within a Segment or
Sector. Measured across a beach from high to low elevations.
5
Note percentage cover is difficult to estimate for subsurface oil. It can be approximated by digging a large number of pits through identified subsurface bands but this is usually not feasible. For each pit, or location along a transect trench, record the following: 6.1 Minimum
depth of oil In metres or cm. The distance from the beach surface to the top of the buried layer (see Figure S.6.1).
6.2 Maximum depth of oil
In metres or cm. The distance from the beach surface to the bottom of the oil layer.
6
6.3 Substrate type At various depths, or in the oily bands as required. Describe the oil in the oily layer: 7.1 Fluid Oil Low viscosity, i.e. will flow relatively freely. 7.2 Viscous Oil Oil will flow slowly. 7.3 Mousse/
Emulsified oil Generally viscous but distinguishable from the above by colour change (i.e. becomes lighter).
7
7.4 Tar Very viscous, and sticky oil. Tar tends to hold its shape when disturbed. Flows very slowly or not at all.
Page 1 of 2 S.6
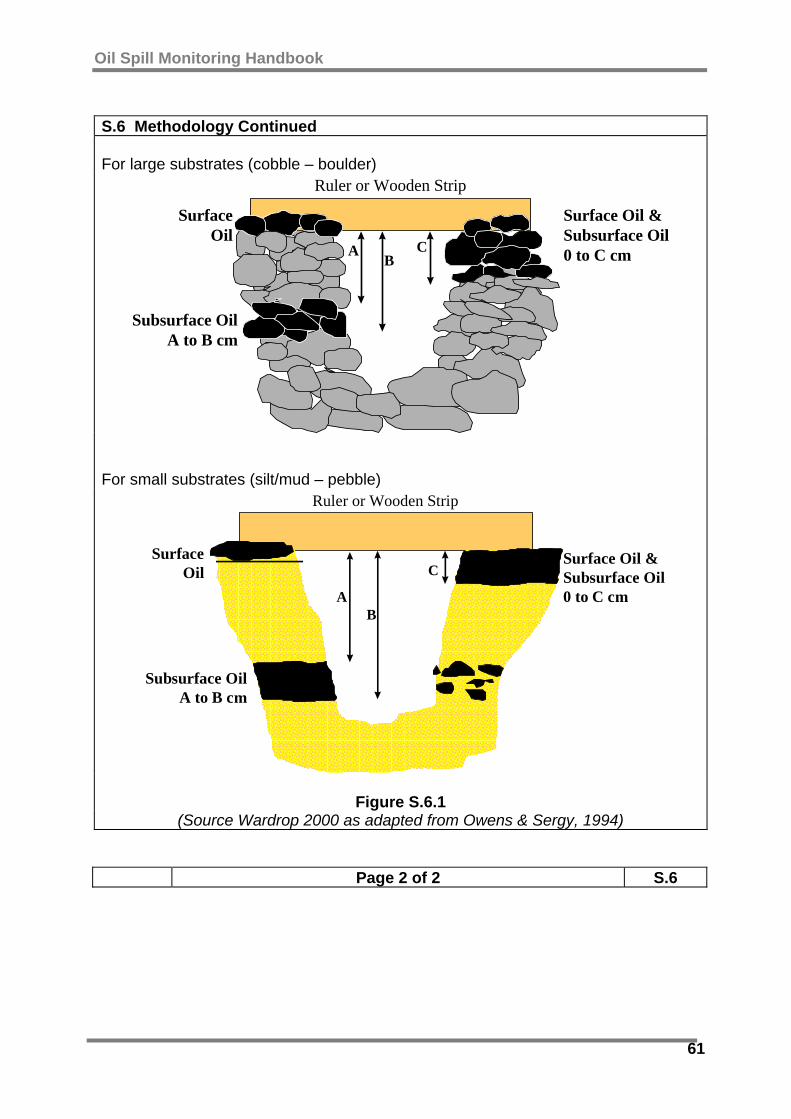
Oil Spill Monitoring Handbook
61
S.6 Methodology Continued For large substrates (cobble – boulder)
AB
C
Surface Oil &Subsurface Oil0 to C cm
SurfaceOil
Subsurface OilA to B cm
Ruler or Wooden Strip
For small substrates (silt/mud – pebble)
AB
C
Ruler or Wooden Strip
Surface Oil &Subsurface Oil0 to C cm
SurfaceOil
Subsurface OilA to B cm
Figure S.6.1 (Source Wardrop 2000 as adapted from Owens & Sergy, 1994)
Page 2 of 2 S.6

Oil Spill Monitoring Handbook
62
GUIDELINE FOR FIELD DETECTION OF PETROLEUM HYDROCARBONS S.7
Rationale A number of naturally occurring substances are similar in appearance, behaviour or odour to petroleum hydrocarbons and may be misreported as such. This method of identifying petroleum-oil is based on the solubility of petroleum hydrocarbons in solvents and non-solubility of other pigments in naturally occurring materials. The test provides a reliable indicator for the presence of petroleum oil but does not provide a measure of the amount or concentration of this.
Methodology Before leaving for the field, place 1-1.5 cm depth of hexane into a series of small test tubes. Stopper well, package and take into the field in a safe, waterproof container.
1
Caution: Care should be taken in handling hexane or any other chemical. Consult the relevant Material Safety Data Sheet (MSDS). Hexane and other solvents should be carried on aircraft only with the pilot’s approval.
2 Place a small amount of the “oil” or sediment into the test-tube or vial containing 0.5-1 cm of hexane.
3 Place a stopper on the tube and shake. Oil will dissolve in the hexane producing a brown colour (providing the oil is dark). Even small traces of most oils will produce a yellowish tinge to the otherwise clear hexane. Mineral sands and plant pigments will not dissolve and so will not discolour the hexane. The Table below lists some substances that may be mistaken for oil on, or in, shorelines:
Black lichens These can look like a coating of asphalt or like old weathered oil “splatter”.
Mineral sands These can be particularly misleading for aerial surveillance personnel but can also be mistaken for light oil stain on close examination.
Rotting algae or seagrass
These can form very fine fibred “peats” and can smell very “sulphury” and oil-like. These may easily be mistaken for layers of buried oil.
Fungal growths
These “smuts” occur on mangrove leaves and, like lichens, can look very much like dry asphalt residues.
4
5 Keep used test tubes for safe disposal on return to the Control Centre.
Page 1 of 1 S.7

Oil Spill Monitoring Handbook
63
4.3.4 Sediment Sampling Methods Calculating the mass balance of an oil spill may be of value in planning the overall response. For shorelines, rough estimates can be obtained by estimating the surface area of the oil (length of band x width of band x % cover) and multiplying it by the thickness. Estimates of oil thickness are unlikely to be accurate. For subsurface oil the method is inappropriate. There are a number of simple methods for sampling sediments and the most appropriate method depends on the character of the sediments, the nature and distribution of the oil, and the analysis that is going to be undertaken (see Figure 4.4).
Figure 4.4 Determining Sediment Sampling Method
The simplest sampling methods involve “push cores” (Guidelines S.8.1 and S.8.2). These methods cannot be used if the relative amounts of oil at various depths are required, as surface oil will be pushed down into the sediment by the side of the tubes.
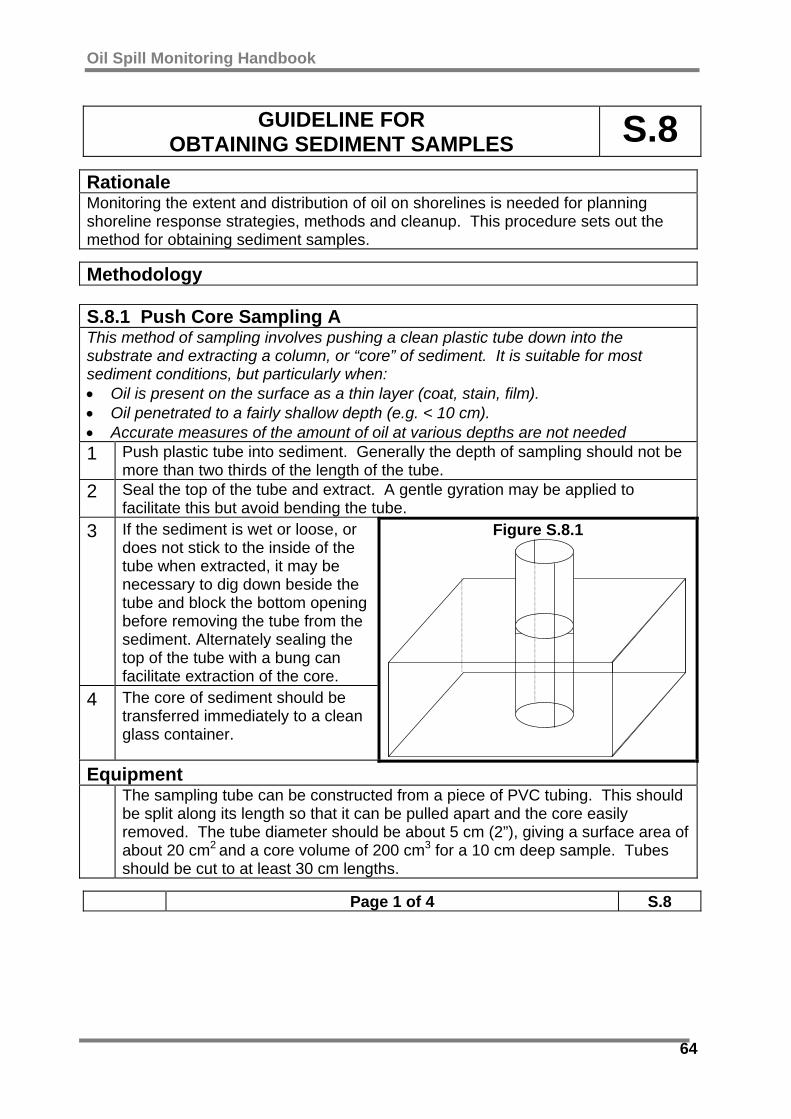
Oil Spill Monitoring Handbook
64
GUIDELINE FOR OBTAINING SEDIMENT SAMPLES S.8
Rationale Monitoring the extent and distribution of oil on shorelines is needed for planning shoreline response strategies, methods and cleanup. This procedure sets out the method for obtaining sediment samples.
Methodology S.8.1 Push Core Sampling A This method of sampling involves pushing a clean plastic tube down into the substrate and extracting a column, or “core” of sediment. It is suitable for most sediment conditions, but particularly when: • Oil is present on the surface as a thin layer (coat, stain, film). • Oil penetrated to a fairly shallow depth (e.g. < 10 cm). • Accurate measures of the amount of oil at various depths are not needed 1 Push plastic tube into sediment. Generally the depth of sampling should not be
more than two thirds of the length of the tube. 2 Seal the top of the tube and extract. A gentle gyration may be applied to
facilitate this but avoid bending the tube. 3 If the sediment is wet or loose, or
does not stick to the inside of the tube when extracted, it may be necessary to dig down beside the tube and block the bottom opening before removing the tube from the sediment. Alternately sealing the top of the tube with a bung can facilitate extraction of the core.
4 The core of sediment should be transferred immediately to a clean glass container.
Figure S.8.1
Equipment The sampling tube can be constructed from a piece of PVC tubing. This should
be split along its length so that it can be pulled apart and the core easily removed. The tube diameter should be about 5 cm (2”), giving a surface area of about 20 cm2 and a core volume of 200 cm3 for a 10 cm deep sample. Tubes should be cut to at least 30 cm lengths.
Page 1 of 4 S.8
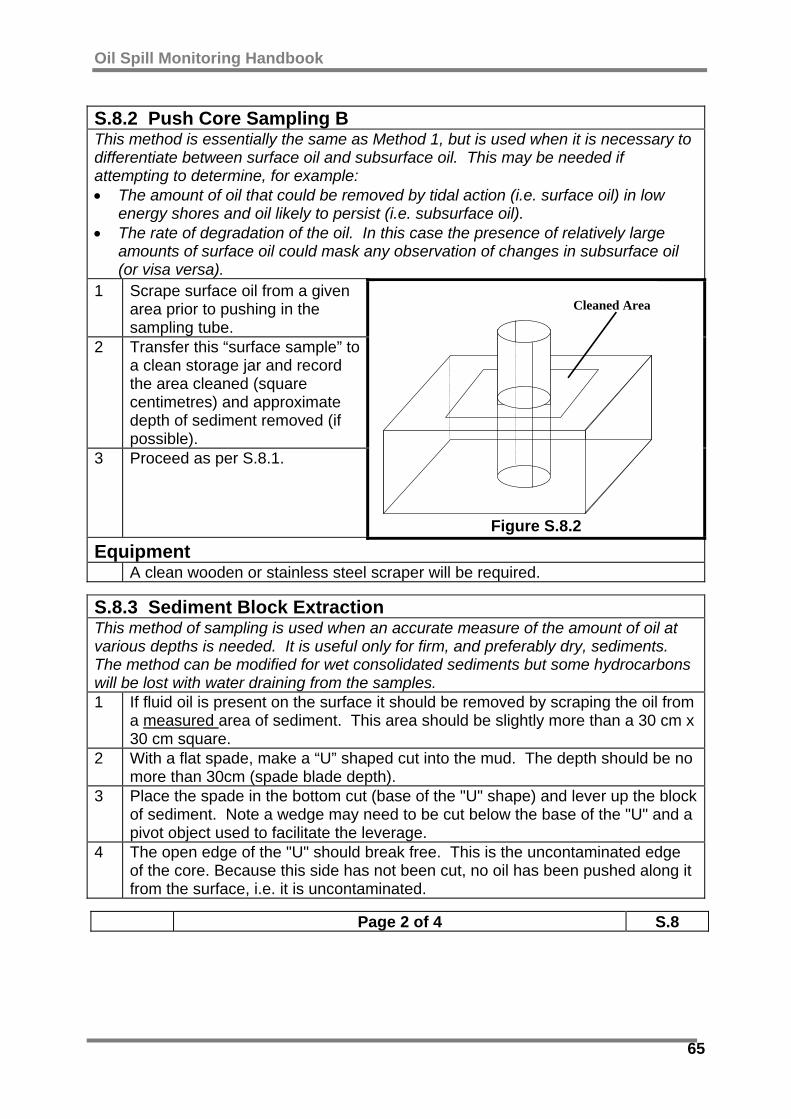
Oil Spill Monitoring Handbook
65
S.8.2 Push Core Sampling B This method is essentially the same as Method 1, but is used when it is necessary to differentiate between surface oil and subsurface oil. This may be needed if attempting to determine, for example: • The amount of oil that could be removed by tidal action (i.e. surface oil) in low
energy shores and oil likely to persist (i.e. subsurface oil). • The rate of degradation of the oil. In this case the presence of relatively large
amounts of surface oil could mask any observation of changes in subsurface oil (or visa versa).
1 Scrape surface oil from a given area prior to pushing in the sampling tube.
2 Transfer this “surface sample” to a clean storage jar and record the area cleaned (square centimetres) and approximate depth of sediment removed (if possible).
3 Proceed as per S.8.1.
Cleaned Area
Figure S.8.2
Equipment A clean wooden or stainless steel scraper will be required.
S.8.3 Sediment Block Extraction This method of sampling is used when an accurate measure of the amount of oil at various depths is needed. It is useful only for firm, and preferably dry, sediments. The method can be modified for wet consolidated sediments but some hydrocarbons will be lost with water draining from the samples. 1 If fluid oil is present on the surface it should be removed by scraping the oil from
a measured area of sediment. This area should be slightly more than a 30 cm x 30 cm square.
2 With a flat spade, make a “U” shaped cut into the mud. The depth should be no more than 30cm (spade blade depth).
3 Place the spade in the bottom cut (base of the "U" shape) and lever up the block of sediment. Note a wedge may need to be cut below the base of the "U" and a pivot object used to facilitate the leverage.
4 The open edge of the "U" should break free. This is the uncontaminated edge of the core. Because this side has not been cut, no oil has been pushed along it from the surface, i.e. it is uncontaminated.
Page 2 of 4 S.8

Oil Spill Monitoring Handbook
66
5 Samples from various depths can be taken by slicing into the back from this
open edge. Care should be taken not to sample close to the three cut (contaminated) sides
6 Note: If water percolates down the core, the core can be laid on its side so that water, and associated oil, drains along the core gradient not down the gradient.
7 Place sediment samples into labelled clean jars.
1. Make three deep* cuts into the sediment using a spade. Cut in a “U” shape leaving one side uncut.
.
2. Ease the sediment up using the spade. (It may be necessary to cut a wedge in the sediment adjoining the base of the “U”).
3. Extract the core by levering it out. Note that the open side of the “U” is “torn free. Support the block of sediment with the spade. Keep the block upright if possible.
4. Take samples at varying depths from the clean side. Take care not to sample close to the cut sides. These may have been contaminated by oil being pushed down by the spade.
* Depending on sampling needs and character of sediment. Generally <30 cm.
Figure S.8.3
Page 3 of 4 S.8
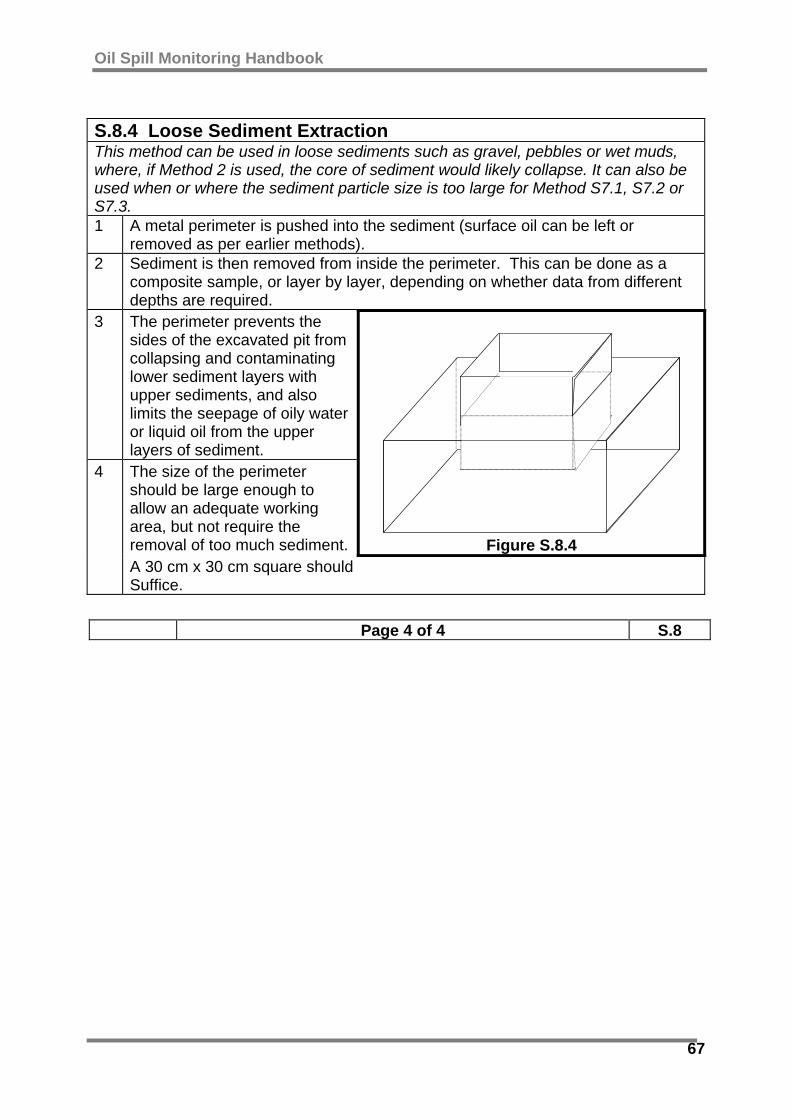
Oil Spill Monitoring Handbook
67
S.8.4 Loose Sediment Extraction This method can be used in loose sediments such as gravel, pebbles or wet muds, where, if Method 2 is used, the core of sediment would likely collapse. It can also be used when or where the sediment particle size is too large for Method S7.1, S7.2 or S7.3. 1 A metal perimeter is pushed into the sediment (surface oil can be left or
removed as per earlier methods). 2 Sediment is then removed from inside the perimeter. This can be done as a
composite sample, or layer by layer, depending on whether data from different depths are required.
3 The perimeter prevents the sides of the excavated pit from collapsing and contaminating lower sediment layers with upper sediments, and also limits the seepage of oily water or liquid oil from the upper layers of sediment. The size of the perimeter should be large enough to allow an adequate working area, but not require the removal of too much sediment.
Figure S.8.4
4
A 30 cm x 30 cm square should Suffice.
Page 4 of 4 S.8

Oil Spill Monitoring Handbook
68
GUIDELINE FOR CALCULATING THE MASS OF OIL IN SHORELINES: S.9
Rationale Calculating the mass balance of an oil spill may be of value in planning the overall response. This method is used in cases when accuracy is required and where chemical analysis of samples has been obtained.
Methodology 1 Determine the oil distribution as per Guideline S.5: 1.1 Calculate area of oil band. 1.2 Estimate the Percentage Coverage (% C) of the oil band. 1.3 Determine thickness of oil layer (if possible). 1.4 Determine possible depth of penetration/burial of oil in substrate. 2 Decide on the sampling method to be used (Guideline S.8). 3 Determine the depth of sediment to be sampled. 4 Sample sediment to that depth. 5 Analyse sediment for oil content. This will give the concentration of oil in mg/kg
(PPM) sediment. This is generally reported as a percentage of dry sediment. 6 Determine the density of the sediment (SGdry). This should be calculated for
both wet and dry sediment by the laboratory undertaking the analysis. This will also give the sediment’s water content as a percentage (Sedwater). Calculate the volume (in cubic meters) of sediment in band or Segment sampled. This may be oiled or random sediment depending on how the sample was taken (see Section 5). Vsed = A x D (all in metres)
7
Sediment Volume
Area of Sampling Depth of Oil (Sample)
Calculate the dry weight of sediment: = Vsed x SG dry Vsed x SG dry x (100-Sedwater)
8 Sediment
Dry Weight or 100
Calculate Mass of oil in sampling area: 9 Oil Mass = Sediment Dry Weight x PPM
10 To calculate the Volume of oil, divide mass by the Specific Gravity of the oil (this should be the SG of the residual oil not the original oil).
Page 1 of 1 S.9

Oil Spill Monitoring Handbook
69
4.4 Environmental Effects Shoreline biota may be included in Type 1 monitoring to determine the effects of cleanup. Ideally, this should involve a comparison of cleaned areas, oiled uncleaned areas, and unoiled areas. 4.4.1 Habitats Offshore of the shoreline, monitoring may be divided into a number of broad habitat types, usually based on substrate type and exposure (energy), for example: • Rock reefs (bedrock platform, boulder or mixed). • Cobble beaches. • Pebble beaches. • Mixed pebble and sand beaches. • Coarse sand beaches. • Fine sand beaches. • Mud or sand flats. Considerable variation occurs in the biota associated with each. Mudflats, for example, may be without obvious surface plants or animals or be associated with dense algal or seagrass beds. Infauna may be abundant and diverse or relatively sparse. The presence of birds, seals, crocodiles or nesting turtles will also greatly influence the nature of the monitoring programme. Considerable flexibility is required in the design of biological monitoring of shorelines. 4.4.2 Target Fauna and Flora This will reflect the particular sensitivities of the shoreline Segment. Species may be chosen on the basis of their perceived social, economic, cultural or ecological value, or because they are considered to be an “indicator” for wider community health. 4.4.3 Parameters Recommended parameters are provided in Guidelines S.10 to S.14.
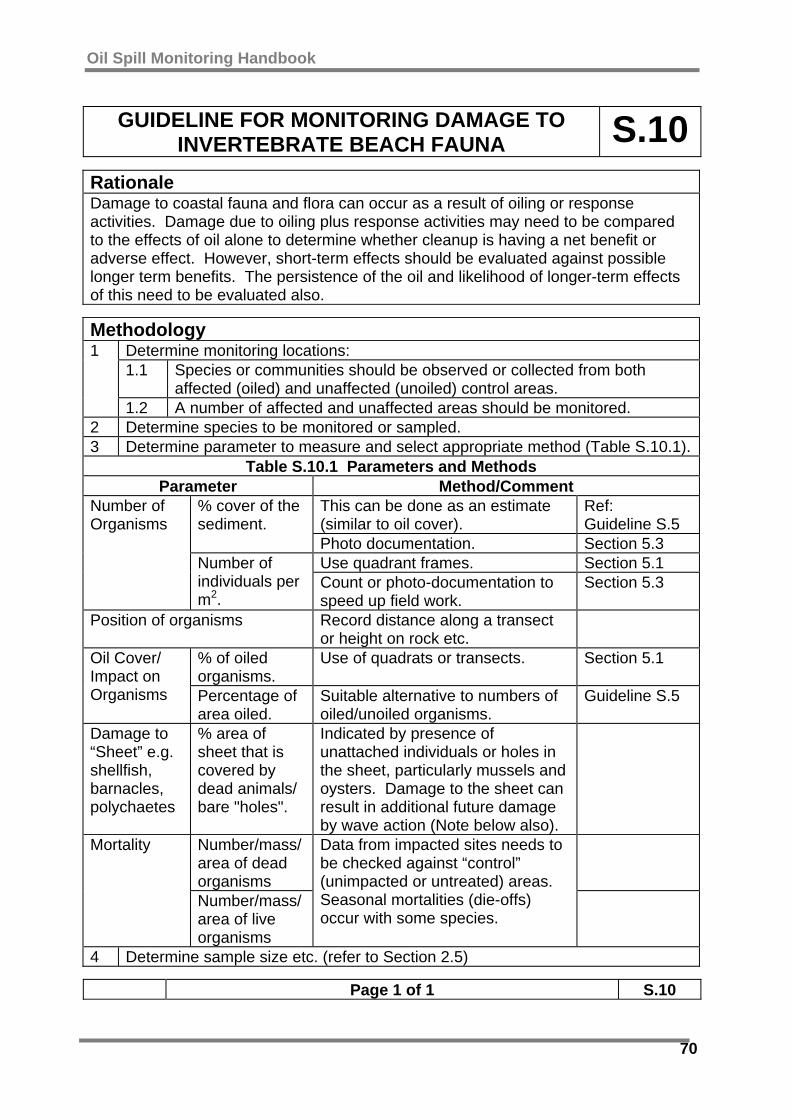
Oil Spill Monitoring Handbook
70
GUIDELINE FOR MONITORING DAMAGE TO INVERTEBRATE BEACH FAUNA S.10
Rationale Damage to coastal fauna and flora can occur as a result of oiling or response activities. Damage due to oiling plus response activities may need to be compared to the effects of oil alone to determine whether cleanup is having a net benefit or adverse effect. However, short-term effects should be evaluated against possible longer term benefits. The persistence of the oil and likelihood of longer-term effects of this need to be evaluated also.
Methodology Determine monitoring locations: 1.1 Species or communities should be observed or collected from both
affected (oiled) and unaffected (unoiled) control areas.
1
1.2 A number of affected and unaffected areas should be monitored. 2 Determine species to be monitored or sampled. 3 Determine parameter to measure and select appropriate method (Table S.10.1).
Table S.10.1 Parameters and Methods Parameter Method/Comment
This can be done as an estimate (similar to oil cover).
Ref: Guideline S.5
% cover of the sediment.
Photo documentation. Section 5.3 Use quadrant frames. Section 5.1
Number of Organisms
Number of individuals per m2.
Count or photo-documentation to speed up field work.
Section 5.3
Position of organisms Record distance along a transect or height on rock etc.
% of oiled organisms.
Use of quadrats or transects. Section 5.1 Oil Cover/ Impact on Organisms Percentage of
area oiled. Suitable alternative to numbers of oiled/unoiled organisms.
Guideline S.5
Damage to “Sheet” e.g. shellfish, barnacles, polychaetes
% area of sheet that is covered by dead animals/ bare "holes".
Indicated by presence of unattached individuals or holes in the sheet, particularly mussels and oysters. Damage to the sheet can result in additional future damage by wave action (Note below also).
Number/mass/ area of dead organisms
Mortality
Number/mass/ area of live organisms
Data from impacted sites needs to be checked against “control” (unimpacted or untreated) areas. Seasonal mortalities (die-offs) occur with some species.
4 Determine sample size etc. (refer to Section 2.5)
Page 1 of 1 S.10

Oil Spill Monitoring Handbook
71
GUIDELINE FOR MONITORING DAMAGE TO COASTAL MARINE MAMMALS S.11
Rationale Damage to marine mammals can occur as a result of oiling or response activities such as aerial over-flights. Damage due to response activities alone should be compared with those of oil plus response activities (and oil alone if relevant) to determine whether response efforts are having a net benefit or adverse effect. However, short-term effects should be evaluated against possible longer term benefits. The persistence of the oil and likelihood of longer-term effects of this need to be evaluated also.
Methodology Determine monitoring locations: 1 1.1 Feeding, haulout and breeding areas should be monitored whether oil-
impacted or not. 2 Determine species to be monitored or sampled. 3 Obtain relevant expertise. 4 Determine parameter to measure and select appropriate method (Table S.11.1).
Table S.11.1 Parameters and Methods Parameter Method/ Comment
Adult individuals. Number of Individuals Pups (if present).
Visual observation from air or ground survey.
Percentage of adults/pups oiled.
Difficult to determine. Observations must be taken at sufficient distance to avoid disturbing animals.
Percentage of fur covered.
Visual observation from air or ground survey. CAUTION. Do not approach pups or adults.
Refer to Table in Guideline S.5.1
Ground survey See note above re distance. This level of detail may be difficult to achieve on non-captive animals.
Pathology Dead animals. Expert task
Oil Distribution (Impact) on Organisms
Position of oil on animals, e.g: eyes, face, nose-mouth, pelt, respiratory or digestive tract.
veterinary examination
Live animals. Expert task
Number of dead adult seals.
May be very difficult to determine.
Possible Effects
Number of dead pups.
May be very difficult to determine.
Low level of accuracy: Dead animals may sink or otherwise be unobserved. Difficult to differentiate between oiled dead animal and dead oiled animal.
Page 1 of 1 S.11
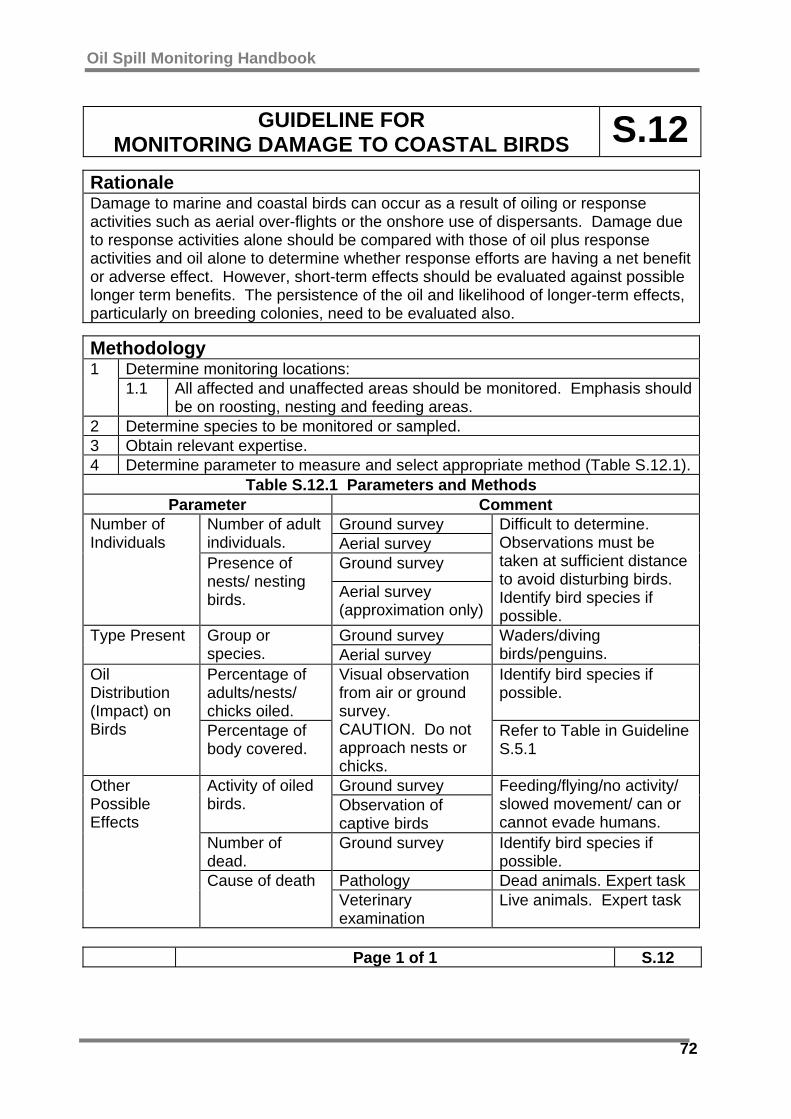
Oil Spill Monitoring Handbook
72
GUIDELINE FOR MONITORING DAMAGE TO COASTAL BIRDS S.12
Rationale Damage to marine and coastal birds can occur as a result of oiling or response activities such as aerial over-flights or the onshore use of dispersants. Damage due to response activities alone should be compared with those of oil plus response activities and oil alone to determine whether response efforts are having a net benefit or adverse effect. However, short-term effects should be evaluated against possible longer term benefits. The persistence of the oil and likelihood of longer-term effects, particularly on breeding colonies, need to be evaluated also.
Methodology Determine monitoring locations: 1 1.1 All affected and unaffected areas should be monitored. Emphasis should
be on roosting, nesting and feeding areas. 2 Determine species to be monitored or sampled. 3 Obtain relevant expertise. 4 Determine parameter to measure and select appropriate method (Table S.12.1).
Table S.12.1 Parameters and Methods Parameter Comment
Ground survey Number of adult individuals. Aerial survey
Ground survey
Number of Individuals
Presence of nests/ nesting birds. Aerial survey
(approximation only)
Difficult to determine. Observations must be taken at sufficient distance to avoid disturbing birds. Identify bird species if possible.
Ground survey Type Present Group or species. Aerial survey
Waders/diving birds/penguins.
Percentage of adults/nests/ chicks oiled.
Identify bird species if possible.
Oil Distribution (Impact) on Birds Percentage of
body covered.
Visual observation from air or ground survey. CAUTION. Do not approach nests or chicks.
Refer to Table in Guideline S.5.1
Ground survey Activity of oiled birds. Observation of
captive birds
Feeding/flying/no activity/ slowed movement/ can or cannot evade humans.
Number of dead.
Ground survey Identify bird species if possible.
Pathology Dead animals. Expert task
Other Possible Effects
Cause of death Veterinary examination
Live animals. Expert task
Page 1 of 1 S.12
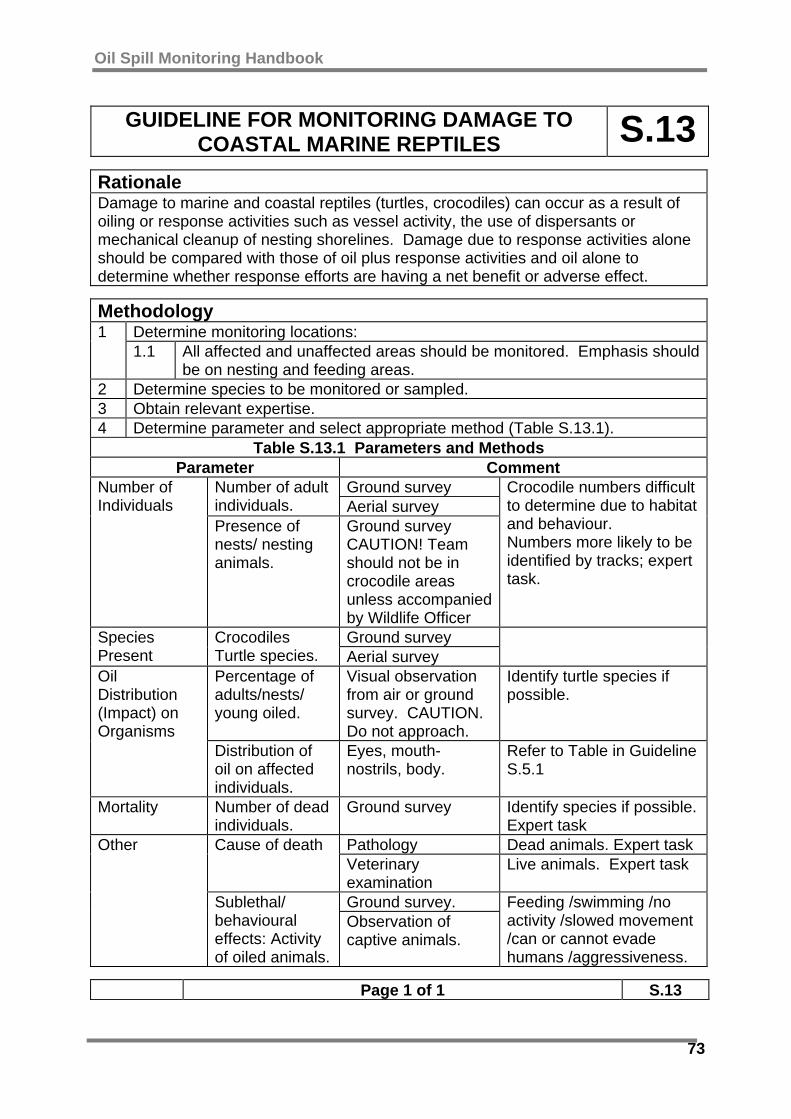
Oil Spill Monitoring Handbook
73
GUIDELINE FOR MONITORING DAMAGE TO COASTAL MARINE REPTILES S.13
Rationale Damage to marine and coastal reptiles (turtles, crocodiles) can occur as a result of oiling or response activities such as vessel activity, the use of dispersants or mechanical cleanup of nesting shorelines. Damage due to response activities alone should be compared with those of oil plus response activities and oil alone to determine whether response efforts are having a net benefit or adverse effect.
Methodology Determine monitoring locations: 1 1.1 All affected and unaffected areas should be monitored. Emphasis should
be on nesting and feeding areas. 2 Determine species to be monitored or sampled. 3 Obtain relevant expertise. 4 Determine parameter and select appropriate method (Table S.13.1).
Table S.13.1 Parameters and Methods Parameter Comment
Ground survey Number of adult individuals. Aerial survey
Number of Individuals
Presence of nests/ nesting animals.
Ground survey CAUTION! Team should not be in crocodile areas unless accompanied by Wildlife Officer
Crocodile numbers difficult to determine due to habitat and behaviour. Numbers more likely to be identified by tracks; expert task.
Ground survey Species Present
Crocodiles Turtle species. Aerial survey
Percentage of adults/nests/ young oiled.
Visual observation from air or ground survey. CAUTION. Do not approach.
Identify turtle species if possible.
Oil Distribution (Impact) on Organisms
Distribution of oil on affected individuals.
Eyes, mouth-nostrils, body.
Refer to Table in Guideline S.5.1
Mortality Number of dead individuals.
Ground survey Identify species if possible. Expert task
Pathology Dead animals. Expert task Cause of death Veterinary examination
Live animals. Expert task
Ground survey.
Other
Sublethal/ behavioural effects: Activity of oiled animals.
Observation of captive animals.
Feeding /swimming /no activity /slowed movement /can or cannot evade humans /aggressiveness.
Page 1 of 1 S.13

Oil Spill Monitoring Handbook
74
GUIDELINE FOR MONITORING DAMAGE TO COASTAL FLORA S.14
Rationale Damage to coastal flora can occur as a result of oiling or response activities. Damage due to oiling plus response activities may need to be compared to the effects of oil alone to determine whether cleanup is having a net benefit or adverse effect. However, short-term effects should be evaluated against possible longer-term benefits. The persistence of the oil and likelihood of longer-term effects of this need to be evaluated also. Methodology
Determine monitoring locations: 1.1 Species or communities should be observed or collected from both
affected (oiled) and unaffected (unoiled) control areas.
1
1.2 A number of affected and unaffected areas should be monitored. 2 Determine species to be monitored or sampled. 3 Determine parameter to measure and select appropriate method (Table S.14.1).
Table S.14.1 Parameters and Methods Parameter Comment
Ground survey Refer to Table in Guideline S.5
% cover of the sediment.
Aerial survey Large areas only Numbers Ground survey using
quadrats or transects Section 5.1. May occur in days/weeks.
Number or Abundance of Plants
Biomass(1): Mass of plants per m2
Ground survey Intrusive. Detailed study based on sampling in affected and control sites.
Ground survey using: Distance along transect. Transects Section 5.1
Distribution of Plants or Damage
Tidal zone/ elevation.
Beach gradient Guideline S.3 Distribution of Oil on Plant Mat
% of plant area oiled.
Ground survey Suitable for algaes and seagrasses. Refer to Table in Guideline S.5.
Maximum and minimum height of oil.
Ground survey
% cover of whole plant
Ground survey
% cover of foliage
Ground survey
Suitable for macrophytes such as mangroves, tea-trees and offshore kelps (kelp depth may be used rather than height). Refer to Table in Guideline S.5.
Distribution of Oil on Plant
Position on plant
Ground survey Roots/ leaves/ trunk.
(1) Unlikely to be required as Type I monitoring
Page 1 of 2 S.14
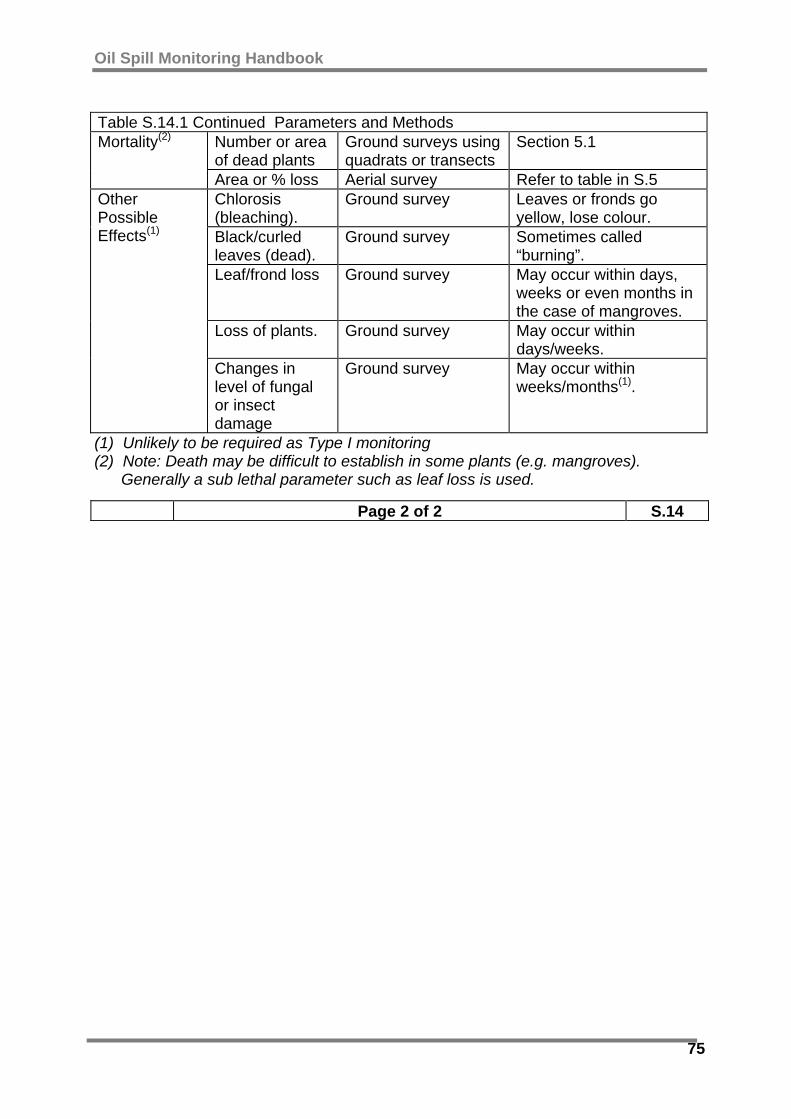
Oil Spill Monitoring Handbook
75
Table S.14.1 Continued Parameters and Methods
Number or area of dead plants
Ground surveys using quadrats or transects
Section 5.1 Mortality(2)
Area or % loss Aerial survey Refer to table in S.5 Chlorosis (bleaching).
Ground survey Leaves or fronds go yellow, lose colour.
Black/curled leaves (dead).
Ground survey Sometimes called “burning”.
Leaf/frond loss Ground survey May occur within days, weeks or even months in the case of mangroves.
Loss of plants. Ground survey May occur within days/weeks.
Other Possible Effects(1)
Changes in level of fungal or insect damage
Ground survey May occur within weeks/months(1).
(1) Unlikely to be required as Type I monitoring (2) Note: Death may be difficult to establish in some plants (e.g. mangroves). Generally a sub lethal parameter such as leaf loss is used.
Page 2 of 2 S.14
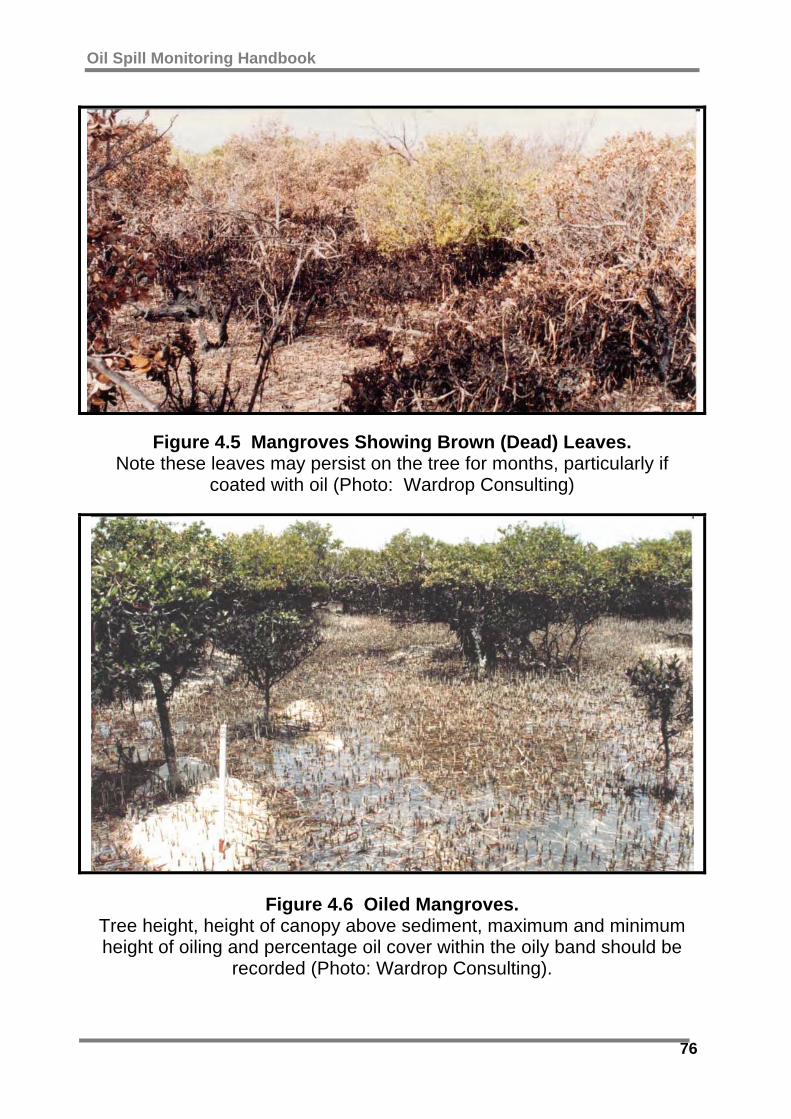
Oil Spill Monitoring Handbook
76
Figure 4.5 Mangroves Showing Brown (Dead) Leaves.
Note these leaves may persist on the tree for months, particularly if coated with oil (Photo: Wardrop Consulting)
Figure 4.6 Oiled Mangroves. Tree height, height of canopy above sediment, maximum and minimum height of oiling and percentage oil cover within the oily band should be
recorded (Photo: Wardrop Consulting).

Oil Spill Monitoring Handbook
77
5.0 GENERAL METHODS 5.1 Field Sampling Methods 5.1.1 Selecting the Sampling Location The basic aim of a sampling design is to ensure field samples are representative of the area, habitat or community being investigated, and are collected efficiently and cost effectively. There are three basic approaches relevant to selecting sample locations: • Authoritative or Selective
Sampling. This sampling is deliberately biased to specific areas, e.g. visibly oil-free and oil-impacted sites. It is ideal for Type I monitoring as it allows a smaller number of samples to be collected from the areas of most interest. However, it has a relatively high potential for error if variability is unknown.
Figure 5.1 Selected Quadrats • Random Sampling. This is a
more scientifically valid method but usually requires a large number of sample locations. For monitoring that may be legally challenged, or scientifically scrutinised, this method is recommended. (This is unusual for Type I monitoring though).
• Systematic Sampling: This
sampling area uses a grid or consistent pattern across the
Figure 5.2 Random Quadrats
defined area. This approach is most suitable when looking for non-obvious contaminated locations, such as subsurface oil.
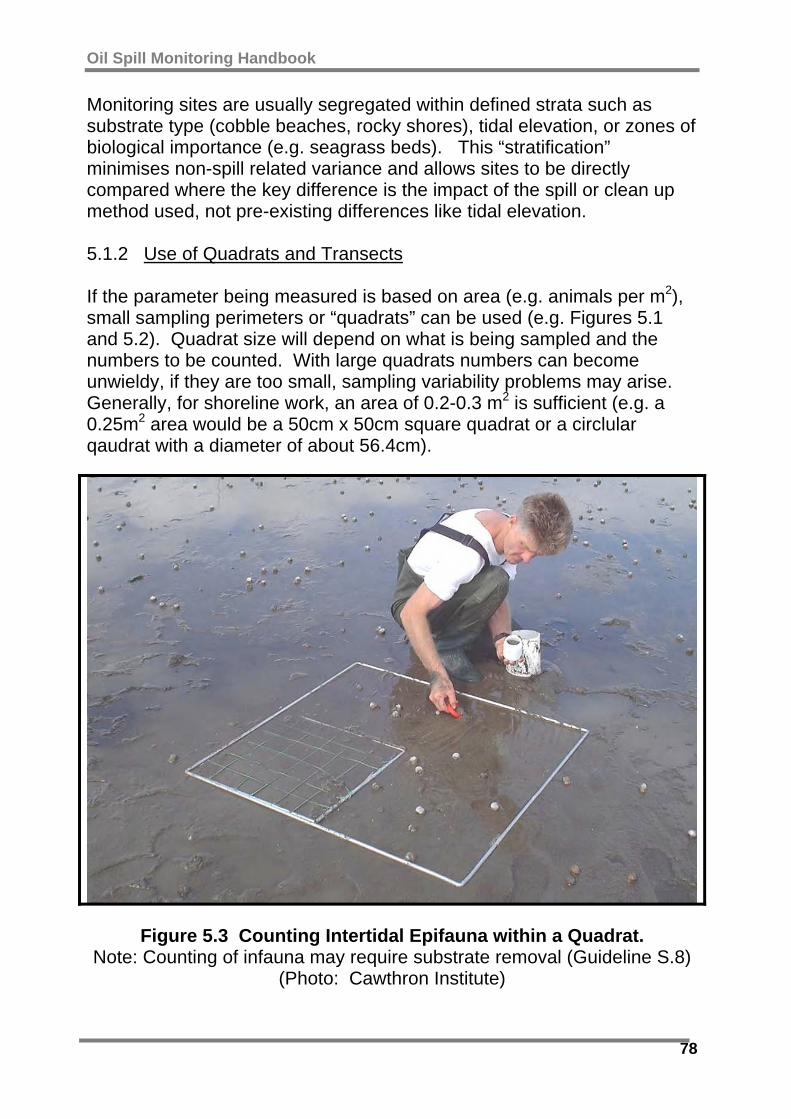
Oil Spill Monitoring Handbook
78
Monitoring sites are usually segregated within defined strata such as substrate type (cobble beaches, rocky shores), tidal elevation, or zones of biological importance (e.g. seagrass beds). This “stratification” minimises non-spill related variance and allows sites to be directly compared where the key difference is the impact of the spill or clean up method used, not pre-existing differences like tidal elevation. 5.1.2 Use of Quadrats and Transects If the parameter being measured is based on area (e.g. animals per m2), small sampling perimeters or “quadrats” can be used (e.g. Figures 5.1 and 5.2). Quadrat size will depend on what is being sampled and the numbers to be counted. With large quadrats numbers can become unwieldy, if they are too small, sampling variability problems may arise. Generally, for shoreline work, an area of 0.2-0.3 m2 is sufficient (e.g. a 0.25m2 area would be a 50cm x 50cm square quadrat or a circlular qaudrat with a diameter of about 56.4cm).
Figure 5.3 Counting Intertidal Epifauna within a Quadrat.
Note: Counting of infauna may require substrate removal (Guideline S.8) (Photo: Cawthron Institute)

Oil Spill Monitoring Handbook
79
The number of quadrats used will be determined by the method of selecting the sample locations (Section 5.1.1), and for the need for statistical strength.
Figure 5.4 Transects
Transects are surveyed lines, usually passing from high to low tide, along which samples are taken. Like quadrats, transects can be positioned selectively, randomly or at regular intervals. Sampling points or quadrats can be distributed along the transect continuously, selectively, randomly, or at regular intervals. In the last case this would effectively be the same as a grid pattern. 5.2 Sample Handling Samples must be handled in such a way as to ensure that they remain uncontaminated, unspoiled by decomposition, breakdown or separation (e.g. due to heat or freezing).
Samples should be clearly labelled and, if necessary secured from potential loss or tampering. Guideline G.1 provides instructions for sample handling. 5.3 Photo-documentation Photographic documentation can range from video or photo-surveys of coastlines or slicks at sea to detailed photographs of quadrats, transects, or individual impacted plant and wildlife. Photo documentation has the advantages that skilled interpretation of data can be done later, remotely and be consistently interpreted. This overcomes problems of shortage of skilled staff and the need to calibrate estimates by different field staff. More accurate calculations of percentage cover and numbers may also be possible.

Oil Spill Monitoring Handbook
80
5.3.1 Use of Photographs and Photo-quadrats A photo-quadrat consists of a camera and frame designed to take a photo of a small quadrat area (Figure 5.5). Photo-quadrats are often used for subtidal studies where time constraints placed on divers do not allow for in situ sampling. Photographs should be of sufficient scale to allow the later quantification of: • Numbers of plants or
animals (e.g number of barnacles in the quadrat).
• Area covered by plants or animals (e.g mussels); usually measured as a percentage.
• Identification of genus or species (or whatever level of taxonomic resolution is required).
Figure 5.5 Frame for Photo-documentation
of Quadrats (Photo: Cawthron Institute) Note: Example has lights for seafloor use, these may not be needed for shorelines.
Each photograph should include an object to provide a measure of scale. In the case of a photo-quadrat this would be provided by the perimeter of the quadrat. 5.3.2 Photo-transects or Video-transects Photo-transects comprise a series of continuous or regularly spaced photographs (usually quadrats) along a transect. Video-transects are simply videotapes of the biota, substrate or oil along a transect. Care must be taken to maintain a constant height or provide a scale along the entire length of the transect.
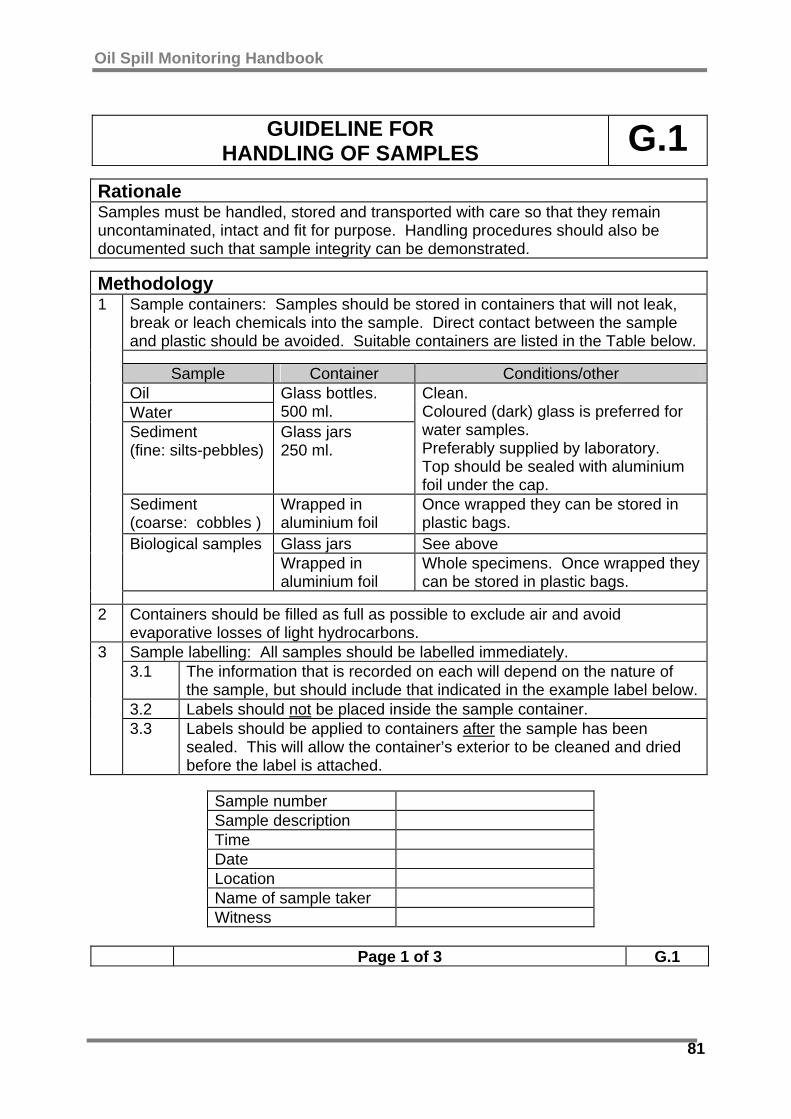
Oil Spill Monitoring Handbook
81
GUIDELINE FOR
HANDLING OF SAMPLES G.1
Rationale Samples must be handled, stored and transported with care so that they remain uncontaminated, intact and fit for purpose. Handling procedures should also be documented such that sample integrity can be demonstrated.
Methodology Sample containers: Samples should be stored in containers that will not leak, break or leach chemicals into the sample. Direct contact between the sample and plastic should be avoided. Suitable containers are listed in the Table below.
Sample Container Conditions/other Oil Water
Glass bottles. 500 ml.
Sediment (fine: silts-pebbles)
Glass jars 250 ml.
Clean. Coloured (dark) glass is preferred for water samples. Preferably supplied by laboratory. Top should be sealed with aluminium foil under the cap.
Sediment (coarse: cobbles )
Wrapped in aluminium foil
Once wrapped they can be stored in plastic bags.
Glass jars See above Biological samples Wrapped in aluminium foil
Whole specimens. Once wrapped they can be stored in plastic bags.
1
2 Containers should be filled as full as possible to exclude air and avoid evaporative losses of light hydrocarbons. Sample labelling: All samples should be labelled immediately. 3.1 The information that is recorded on each will depend on the nature of
the sample, but should include that indicated in the example label below.3.2 Labels should not be placed inside the sample container.
3
3.3 Labels should be applied to containers after the sample has been sealed. This will allow the container’s exterior to be cleaned and dried before the label is attached.
Sample number Sample description Time Date Location Name of sample taker Witness
Page 1 of 3 G.1
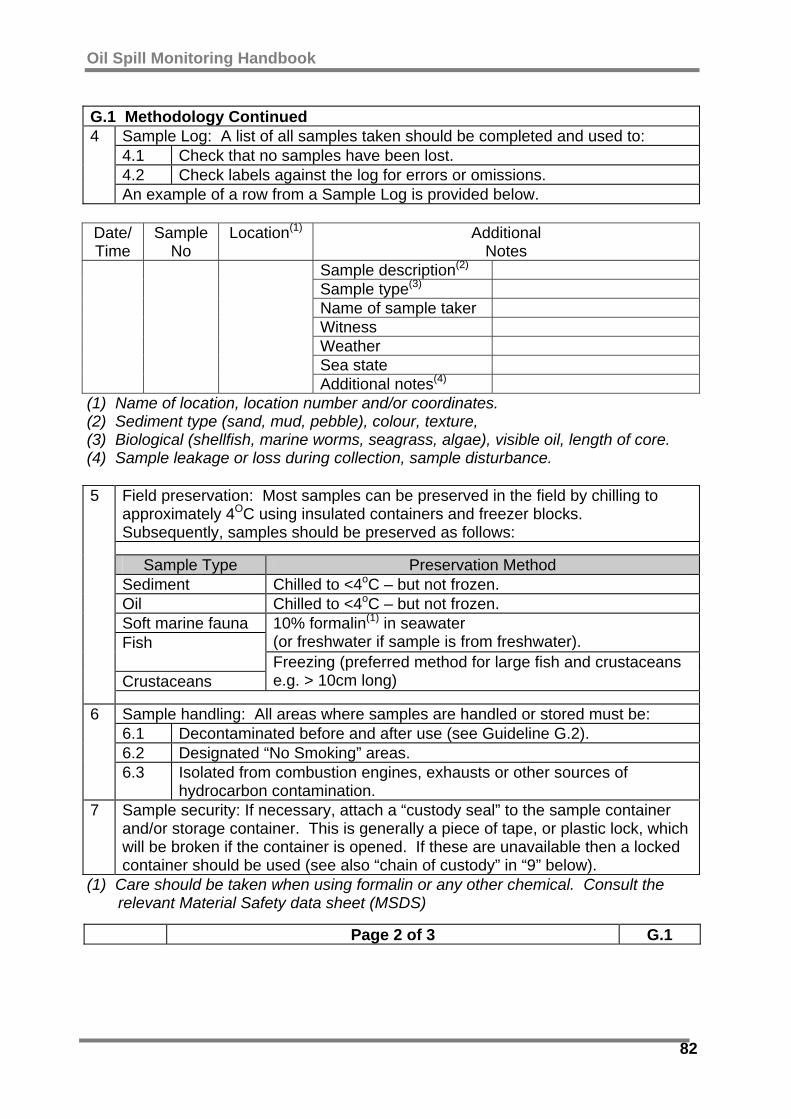
Oil Spill Monitoring Handbook
82
G.1 Methodology Continued Sample Log: A list of all samples taken should be completed and used to: 4.1 Check that no samples have been lost. 4.2 Check labels against the log for errors or omissions.
4
An example of a row from a Sample Log is provided below. Date/ Time
Sample No
Location(1) Additional Notes
Sample description(2) Sample type(3) Name of sample taker Witness Weather Sea state
Additional notes(4) (1) Name of location, location number and/or coordinates. (2) Sediment type (sand, mud, pebble), colour, texture, (3) Biological (shellfish, marine worms, seagrass, algae), visible oil, length of core. (4) Sample leakage or loss during collection, sample disturbance.
Field preservation: Most samples can be preserved in the field by chilling to approximately 4OC using insulated containers and freezer blocks. Subsequently, samples should be preserved as follows:
Sample Type Preservation Method Sediment Chilled to <4oC – but not frozen. Oil Chilled to <4oC – but not frozen. Soft marine fauna 10% formalin(1) in seawater
(or freshwater if sample is from freshwater). Fish
Crustaceans Freezing (preferred method for large fish and crustaceans e.g. > 10cm long)
5
Sample handling: All areas where samples are handled or stored must be: 6.1 Decontaminated before and after use (see Guideline G.2). 6.2 Designated “No Smoking” areas.
6
6.3 Isolated from combustion engines, exhausts or other sources of hydrocarbon contamination.
7 Sample security: If necessary, attach a “custody seal” to the sample container and/or storage container. This is generally a piece of tape, or plastic lock, which will be broken if the container is opened. If these are unavailable then a locked container should be used (see also “chain of custody” in “9” below).
(1) Care should be taken when using formalin or any other chemical. Consult the relevant Material Safety data sheet (MSDS)
Page 2 of 3 G.1
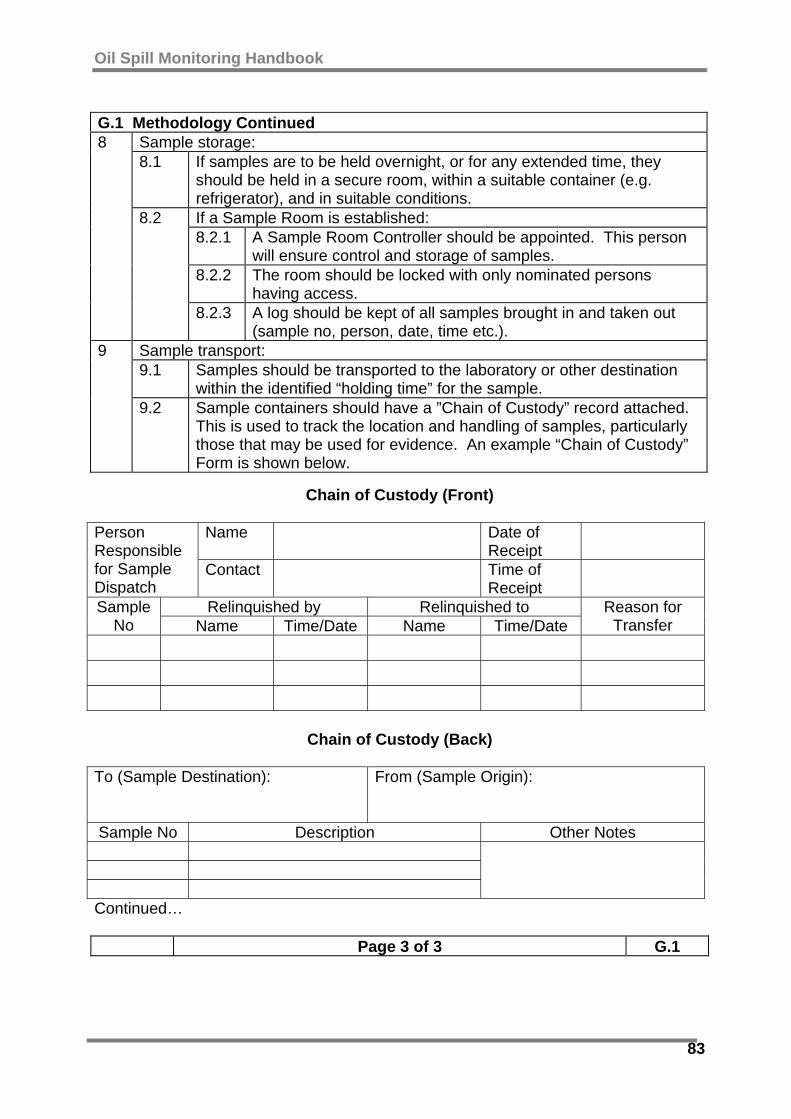
Oil Spill Monitoring Handbook
83
G.1 Methodology Continued
Sample storage: 8.1 If samples are to be held overnight, or for any extended time, they
should be held in a secure room, within a suitable container (e.g. refrigerator), and in suitable conditions. If a Sample Room is established: 8.2.1 A Sample Room Controller should be appointed. This person
will ensure control and storage of samples. 8.2.2 The room should be locked with only nominated persons
having access.
8
8.2
8.2.3 A log should be kept of all samples brought in and taken out (sample no, person, date, time etc.).
Sample transport: 9.1 Samples should be transported to the laboratory or other destination
within the identified “holding time” for the sample.
9
9.2 Sample containers should have a ”Chain of Custody” record attached. This is used to track the location and handling of samples, particularly those that may be used for evidence. An example “Chain of Custody” Form is shown below.
Chain of Custody (Front)
Name Date of Receipt
Person Responsible for Sample Dispatch
Contact Time of Receipt
Relinquished by Relinquished to Sample No Name Time/Date Name Time/Date
Reason for Transfer
Chain of Custody (Back) To (Sample Destination):
From (Sample Origin):
Sample No Description Other Notes
Continued…
Page 3 of 3 G.1
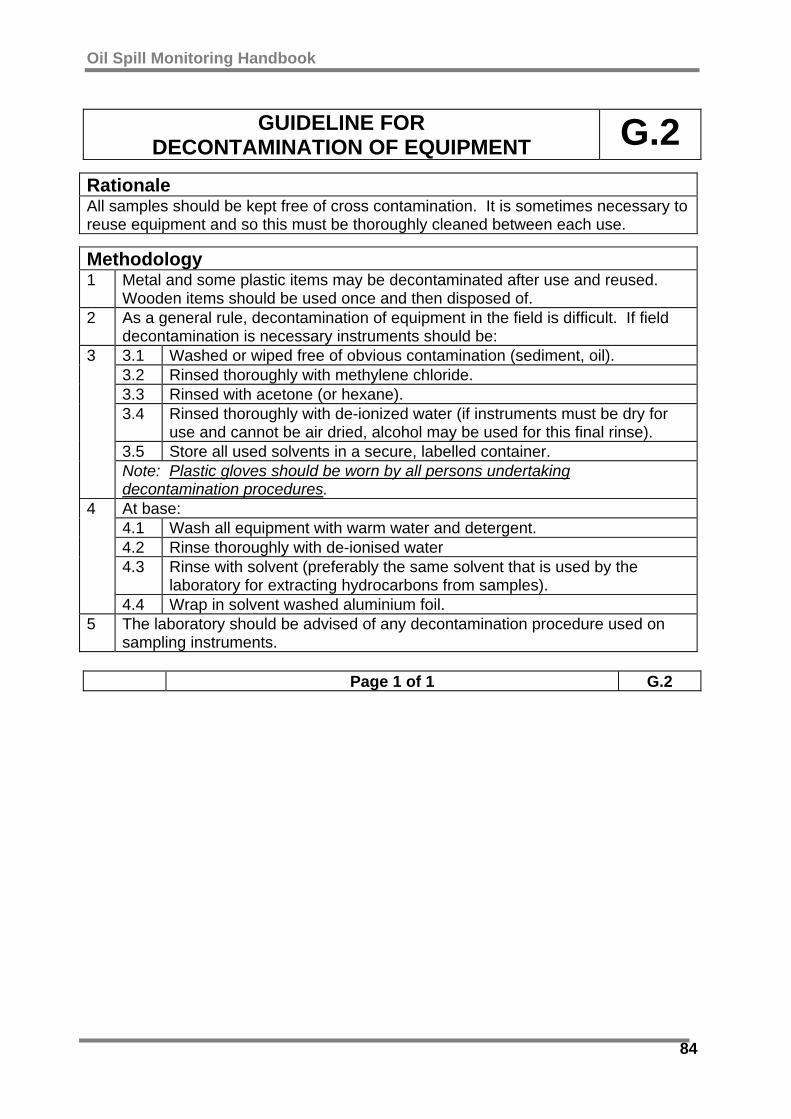
Oil Spill Monitoring Handbook
84
GUIDELINE FOR DECONTAMINATION OF EQUIPMENT G.2
Rationale All samples should be kept free of cross contamination. It is sometimes necessary to reuse equipment and so this must be thoroughly cleaned between each use.
Methodology 1 Metal and some plastic items may be decontaminated after use and reused.
Wooden items should be used once and then disposed of. 2 As a general rule, decontamination of equipment in the field is difficult. If field
decontamination is necessary instruments should be: 3.1 Washed or wiped free of obvious contamination (sediment, oil). 3.2 Rinsed thoroughly with methylene chloride. 3.3 Rinsed with acetone (or hexane). 3.4 Rinsed thoroughly with de-ionized water (if instruments must be dry for
use and cannot be air dried, alcohol may be used for this final rinse). 3.5 Store all used solvents in a secure, labelled container.
3
Note: Plastic gloves should be worn by all persons undertaking decontamination procedures. At base: 4.1 Wash all equipment with warm water and detergent. 4.2 Rinse thoroughly with de-ionised water 4.3 Rinse with solvent (preferably the same solvent that is used by the
laboratory for extracting hydrocarbons from samples).
4
4.4 Wrap in solvent washed aluminium foil. 5 The laboratory should be advised of any decontamination procedure used on
sampling instruments.
Page 1 of 1 G.2

Oil Spill Monitoring Handbook
85
5.4 Laboratory Methods 1: Chemical Analysis Methods for the chemical analysis of oil, oil in water or oiled sediments, or other laboratory procedures are specialised tasks beyond the level of knowledge required for the design and execution of Type I monitoring. However, monitoring personnel should have a general knowledge of the types of analysis and testing available, and should understand exactly what information the various analytical methods can provide before taking samples and sending them for analysis. Guideline G.3 provides some guidelines for the type of analytical tests needed to fulfil a number of objectives or information needs. 5.5 Laboratory Methods 2: Toxicological Tests Toxicity data may be used when assessing the potential impact of a spill, or spill response products, but toxicity testing is extremely unlikely to be required for Type I monitoring. Toxicity data report the effect of a substance on a particular organism under defined test conditions. Test conditions in most cases are significantly different to those likely to be encountered outside of the laboratory, and often provide very little indication of the environmental effect that a substance will have under spill conditions. In particular, field exposure periods are generally much shorter, and concentrations dilute much faster, than those used in the laboratory. Before commissioning or applying toxicity data it is very important to consider its relevance and applicability.
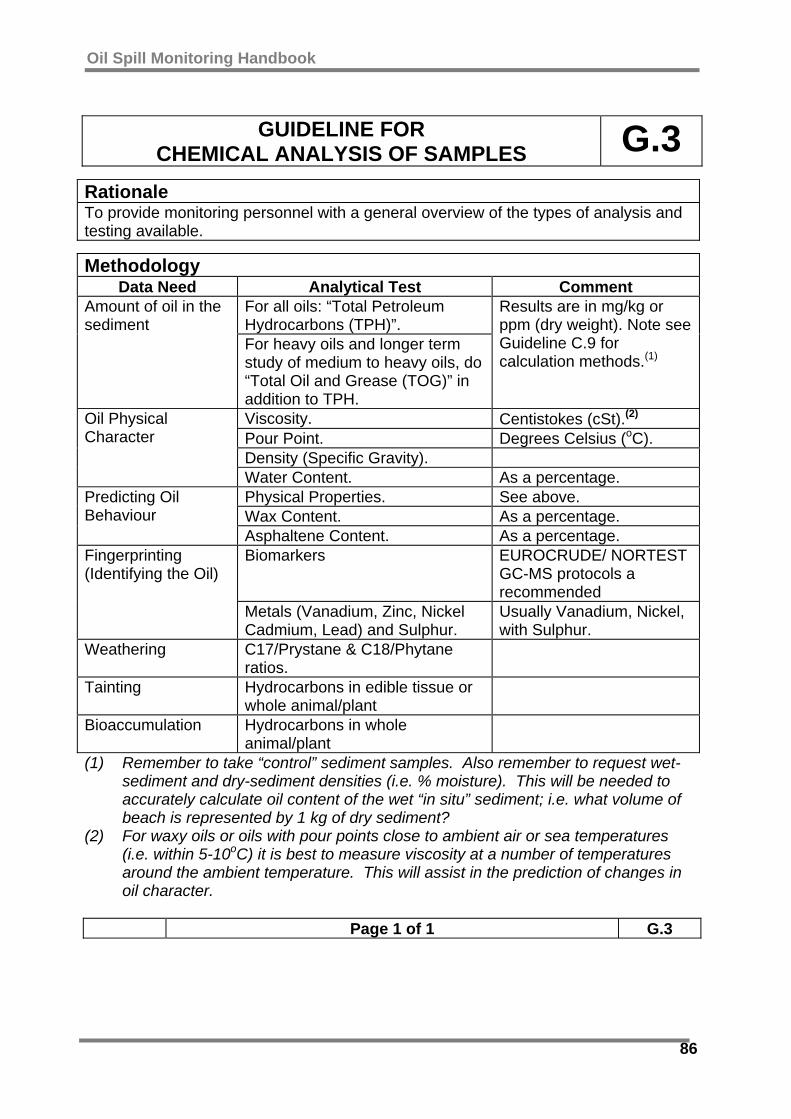
Oil Spill Monitoring Handbook
86
GUIDELINE FOR
CHEMICAL ANALYSIS OF SAMPLES G.3
Rationale To provide monitoring personnel with a general overview of the types of analysis and testing available.
Methodology Data Need Analytical Test Comment
For all oils: “Total Petroleum Hydrocarbons (TPH)”.
Amount of oil in the sediment
For heavy oils and longer term study of medium to heavy oils, do “Total Oil and Grease (TOG)” in addition to TPH.
Results are in mg/kg or ppm (dry weight). Note see Guideline C.9 for calculation methods.(1)
Viscosity. Centistokes (cSt).(2) Pour Point. Degrees Celsius (oC). Density (Specific Gravity).
Oil Physical Character
Water Content. As a percentage. Physical Properties. See above. Wax Content. As a percentage.
Predicting Oil Behaviour
Asphaltene Content. As a percentage. Biomarkers EUROCRUDE/ NORTEST
GC-MS protocols a recommended
Fingerprinting (Identifying the Oil)
Metals (Vanadium, Zinc, Nickel Cadmium, Lead) and Sulphur.
Usually Vanadium, Nickel, with Sulphur.
Weathering C17/Prystane & C18/Phytane ratios.
Tainting Hydrocarbons in edible tissue or whole animal/plant
Bioaccumulation Hydrocarbons in whole animal/plant
(1) Remember to take “control” sediment samples. Also remember to request wet-sediment and dry-sediment densities (i.e. % moisture). This will be needed to accurately calculate oil content of the wet “in situ” sediment; i.e. what volume of beach is represented by 1 kg of dry sediment?
(2) For waxy oils or oils with pour points close to ambient air or sea temperatures (i.e. within 5-10oC) it is best to measure viscosity at a number of temperatures around the ambient temperature. This will assist in the prediction of changes in oil character.
Page 1 of 1 G.3
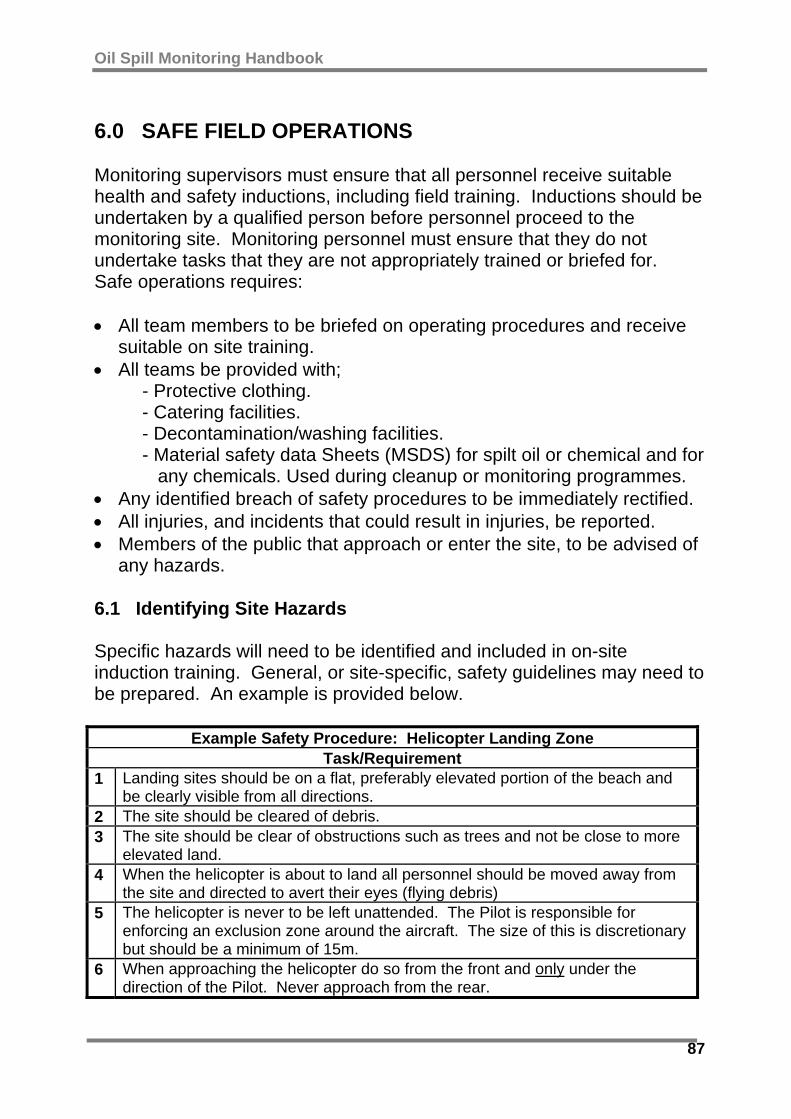
Oil Spill Monitoring Handbook
87
6.0 SAFE FIELD OPERATIONS Monitoring supervisors must ensure that all personnel receive suitable health and safety inductions, including field training. Inductions should be undertaken by a qualified person before personnel proceed to the monitoring site. Monitoring personnel must ensure that they do not undertake tasks that they are not appropriately trained or briefed for. Safe operations requires: • All team members to be briefed on operating procedures and receive
suitable on site training. • All teams be provided with; - Protective clothing. - Catering facilities. - Decontamination/washing facilities. - Material safety data Sheets (MSDS) for spilt oil or chemical and for any chemicals. Used during cleanup or monitoring programmes. • Any identified breach of safety procedures to be immediately rectified. • All injuries, and incidents that could result in injuries, be reported. • Members of the public that approach or enter the site, to be advised of
any hazards. 6.1 Identifying Site Hazards Specific hazards will need to be identified and included in on-site induction training. General, or site-specific, safety guidelines may need to be prepared. An example is provided below.
Example Safety Procedure: Helicopter Landing Zone Task/Requirement
1 Landing sites should be on a flat, preferably elevated portion of the beach and be clearly visible from all directions.
2 The site should be cleared of debris. 3 The site should be clear of obstructions such as trees and not be close to more
elevated land. 4 When the helicopter is about to land all personnel should be moved away from
the site and directed to avert their eyes (flying debris) 5 The helicopter is never to be left unattended. The Pilot is responsible for
enforcing an exclusion zone around the aircraft. The size of this is discretionary but should be a minimum of 15m.
6 When approaching the helicopter do so from the front and only under the direction of the Pilot. Never approach from the rear.
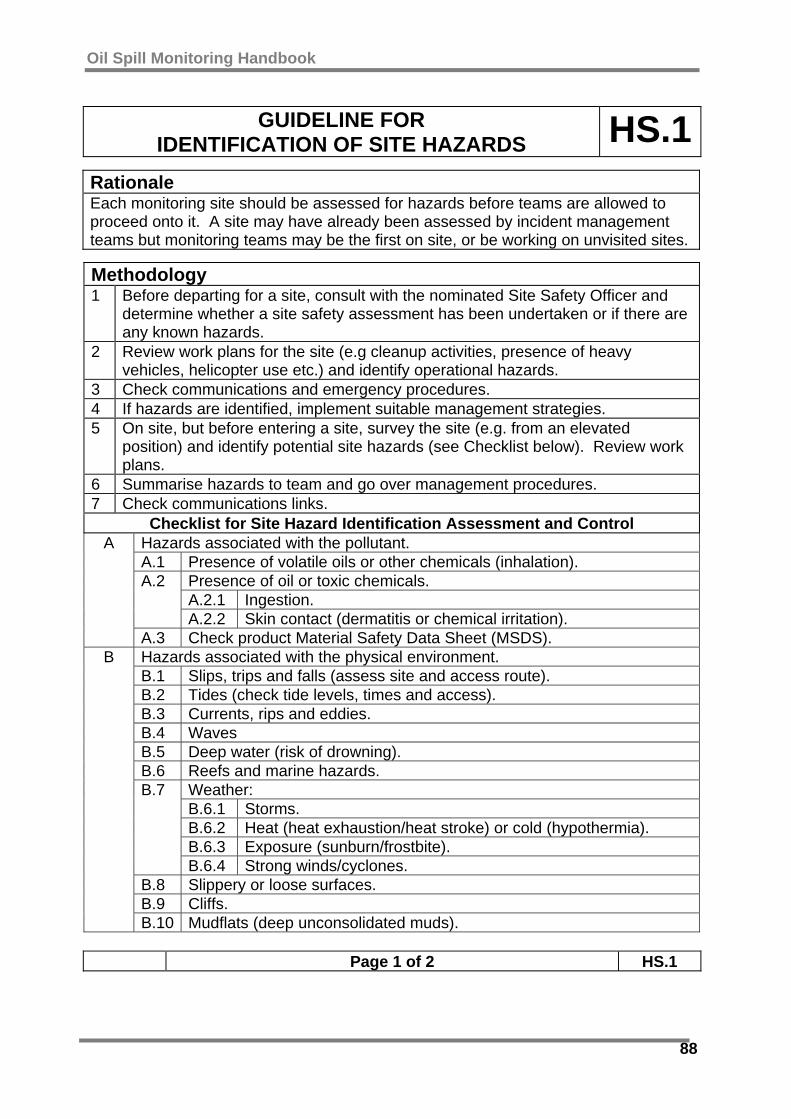
Oil Spill Monitoring Handbook
88
GUIDELINE FOR IDENTIFICATION OF SITE HAZARDS HS.1
Rationale Each monitoring site should be assessed for hazards before teams are allowed to proceed onto it. A site may have already been assessed by incident management teams but monitoring teams may be the first on site, or be working on unvisited sites.
Methodology 1 Before departing for a site, consult with the nominated Site Safety Officer and
determine whether a site safety assessment has been undertaken or if there are any known hazards.
2 Review work plans for the site (e.g cleanup activities, presence of heavy vehicles, helicopter use etc.) and identify operational hazards.
3 Check communications and emergency procedures. 4 If hazards are identified, implement suitable management strategies. 5 On site, but before entering a site, survey the site (e.g. from an elevated
position) and identify potential site hazards (see Checklist below). Review work plans.
6 Summarise hazards to team and go over management procedures. 7 Check communications links.
Checklist for Site Hazard Identification Assessment and Control Hazards associated with the pollutant. A.1 Presence of volatile oils or other chemicals (inhalation).
Presence of oil or toxic chemicals. A.2.1 Ingestion.
A.2
A.2.2 Skin contact (dermatitis or chemical irritation).
A
A.3 Check product Material Safety Data Sheet (MSDS). Hazards associated with the physical environment. B.1 Slips, trips and falls (assess site and access route). B.2 Tides (check tide levels, times and access). B.3 Currents, rips and eddies. B.4 Waves B.5 Deep water (risk of drowning). B.6 Reefs and marine hazards.
Weather: B.6.1 Storms. B.6.2 Heat (heat exhaustion/heat stroke) or cold (hypothermia). B.6.3 Exposure (sunburn/frostbite).
B.7
B.6.4 Strong winds/cyclones. B.8 Slippery or loose surfaces. B.9 Cliffs.
B
B.10 Mudflats (deep unconsolidated muds).
Page 1 of 2 HS.1

Oil Spill Monitoring Handbook
89
HS.1 Methodology Continued
Hazards associated with the biological environment. C.1 Inappropriate handling of oiled birds or other animals (particularly eye
injuries). Presence of potentially aggressive/harmful wildlife.
C
C.2 C.2.1 Crocodiles, Seals, Sea Lions.
Hazards associated with the cleanup. Injuries from machinery: D.1.1 Burns/scalds D.1.2 Entanglement.
D.1
D.1.3 Crushed or broken limbs, hands. D.1.4 Noise. D.2 Presence of vehicles (collisions and motor vehicle accidents). D.3 Presence of buoys, booms, anchor cables. D.4 Handling, storage and use of potentially harmful chemicals and
cleaning agents. D.5 Use of MSDS. D.6 Handling and storage of fuels and lubricants.
D
D.7 Manual handling/lifting (back / lifting injuries). Hazards associated with response personnel. E.1 Conditions arising from alcohol and / or drug use. E.2 Conditions arising from existing (known or unknown) medical
conditions: E.2.1 Heart attacks. E.2.2 Epileptic seizure. E.2.3 Hypoglycaemic (or hyperglycaemic) episodes (diabetes). E.2.4 Asthma attack.
E
E.2.5 Other.
Page 2 of 2 HS.1
Oil Spill Monitoring Handbook
90
6.2 Personnel Tracking It is essential that the movements and whereabouts of monitoring teams and personnel are tracked throughout the response. This responsibility may rest with the Operations Officer, Logistics Officer or other Incident Management Team officer, depending on how functions are assigned for each incident response. However, the person in charge of the monitoring programme must ensure that monitoring personnel are being tracked and that adequate support is provided, particularly if they are to be deployed into areas with poor communications (see section 6.4) or with limited access. Personnel tracking guidelines are provided as part of Guideline HS.2. 6.3 Identifying Chemical Hazards The oil or chemical that has been spilled may present a hazard. A Materials Safety Data Sheet (MSDS) should be available for the product and this should be supplied to monitoring personnel by the Incident Safety Officer, Health and Safety Coordinator or some other nominated Incident Management Team member. The person in charge of monitoring must ensure that the relevant MSDS is obtained, distributed and explained to field teams. 6.4 Monitoring Air Quality: Volatiles Some oils and chemicals can constitute respiratory hazards. If this is indicated, each work site must be tested, and assessed as safe, by a qualified individual. Relevant health and safety and workplace regulations should be consulted. 6.5 Communications Monitoring teams may need to deploy to remote areas with poor communications. If this occurs, the person in charge of the monitoring programme must ensure that adequate communications equipment is supplied or that alternative arrangements are put in place (see Guideline HS.2).

Oil Spill Monitoring Handbook
91
GUIDELINE FOR DEPLOYMENT INTO REMOTE AREAS HS.2
Rationale Monitoring teams may need to deploy into areas where there is little or no field support and where communications may be limited. It is important that safety procedures are established and followed.
Methodology 1 Determine personnel and monitoring equipment needs (refer to relevant
guidelines) Assess logistics resources needs: 2.1 Accommodation. 2.2 Transport for personnel. 2.3 Catering and water supply. 2.4 Decontamination/washing facilities. 2.5 Toilets. 2.6 Field support (shade/rest areas). 2.7 Other support. 2.8 Fuel. 2.9 Equipment storage area or facility. 2.10 On site maintenance. 2.11 Waste storage areas.
2
2.12 Other. Assess existing access. If necessary request deployment of an assessment team to investigate: 3.1 Road condition (including river crossings). 3.2 Ferry/barge services. 3.3 Boat ramps. 3.4 Airstrips. 3.5 Indigenous title or cultural sites (are permits required?). 3.6 Vegetation/habitats of significance.
3
3.7 Hazards. 4 If needed, develop a deployment plan and submit to the relevant Operations Officer or
Incident Controller. Assess communications. 5.1 Ensure that teams are equipped with suitable equipment in working order.
5
5.2 If communications is not possible via telephones or radios, arrange regular over-flights to verify that teams are safe.
6 Submit a travel plan each day to the Incident management team delegated person 7 Before departing, report departure, time, destination and ETA to the delegated person. 8 Report arrival at each site, and departures and destinations to the delegated person. 9 Report arrival back at base at the end of the day.
Page 1 of 1 HS.2
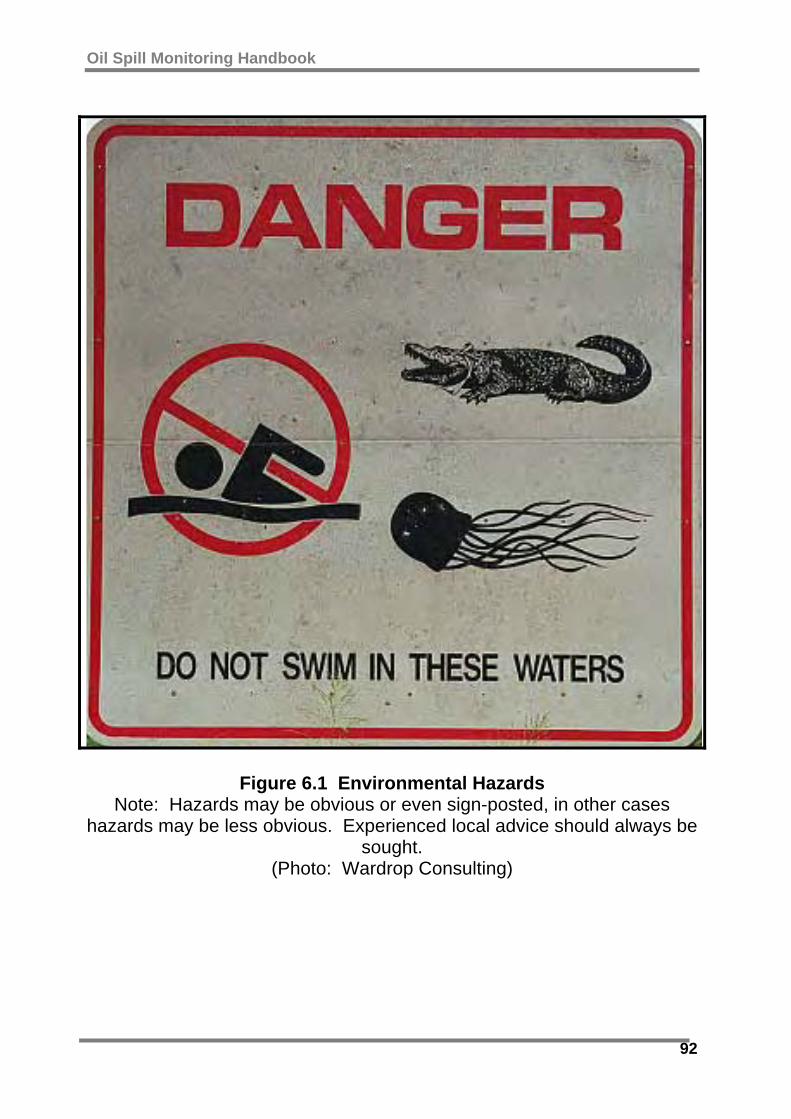
Oil Spill Monitoring Handbook
92
Figure 6.1 Environmental Hazards
Note: Hazards may be obvious or even sign-posted, in other cases hazards may be less obvious. Experienced local advice should always be
sought. (Photo: Wardrop Consulting)
Oil Spill Monitoring Handbook
93
7.0 DATA CONTROL AND MANAGEMENT Data may be obtained in a number of different formats: • Forms. • Photographs (digital or film). • Video (digital or tape). • Maps. • Notebooks and logs. • Portable GPS/GIS units. • Verbal transmission. • Laboratory reports. • Samples (biological, sediment or oil). Whatever the format, it is essential that data are quickly and effectively stored and transmitted, and that the accuracy of the collected data, and of any consequent analysis, is optimised. 7.1 Data Transfer and Storage All data should be backed up as soon as possible. This applies to data as it is acquired in the field, as it is transmitted, as well as when it is compiled and stored. Reliance on a single copy of data, whether on paper or digitally recorded, must be avoided. Digital recording of data has the advantage that, in some areas, it can be transmitted immediately to the Incident Control Centre for instant use. This also provides an immediate backup, if receipt is confirmed. However, such transmission may be either unreliable or unavailable in many regions. Regardless of field methodology, central digital storage of data is recommended for ease of transport, access and data analysis. 7.2 Security and Data Control Some information collected by monitoring teams can be misinterpreted or misused. Central control of the assessment and dissemination of information is usual in spill response. Type I monitoring programmes should be compliant with these requirements.
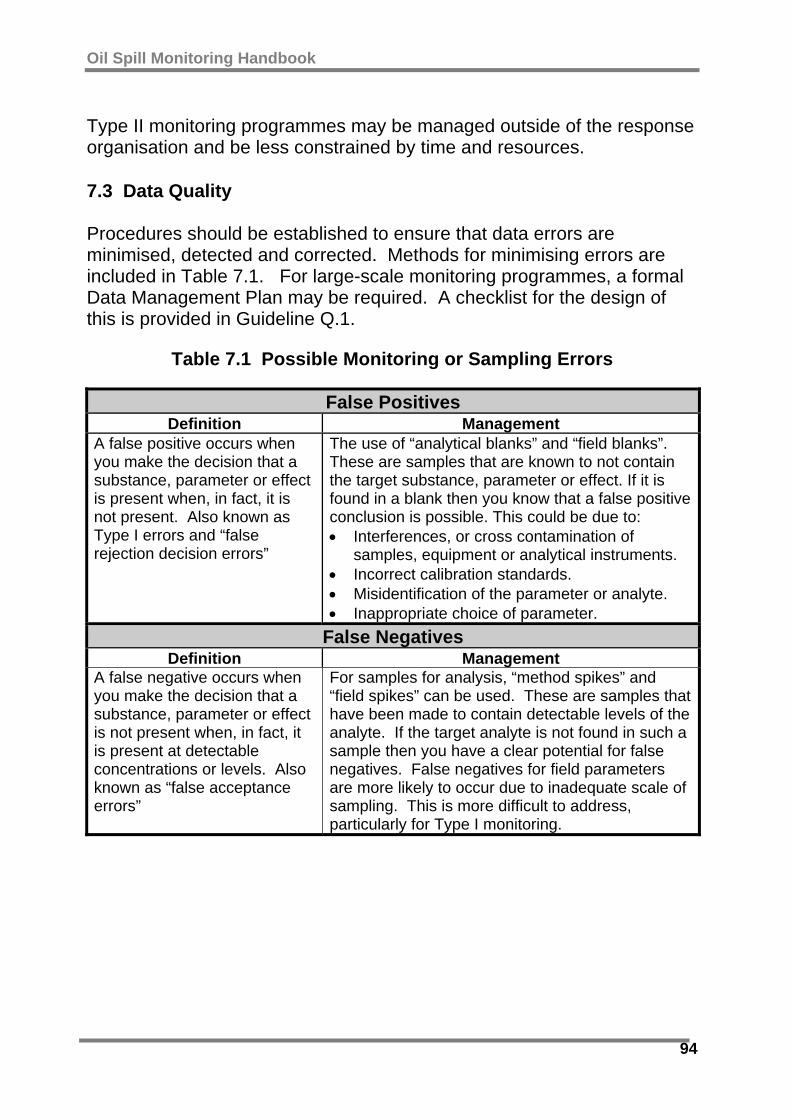
Oil Spill Monitoring Handbook
94
Type II monitoring programmes may be managed outside of the response organisation and be less constrained by time and resources. 7.3 Data Quality Procedures should be established to ensure that data errors are minimised, detected and corrected. Methods for minimising errors are included in Table 7.1. For large-scale monitoring programmes, a formal Data Management Plan may be required. A checklist for the design of this is provided in Guideline Q.1.
Table 7.1 Possible Monitoring or Sampling Errors
False Positives Definition Management
A false positive occurs when you make the decision that a substance, parameter or effect is present when, in fact, it is not present. Also known as Type I errors and “false rejection decision errors”
The use of “analytical blanks” and “field blanks”. These are samples that are known to not contain the target substance, parameter or effect. If it is found in a blank then you know that a false positive conclusion is possible. This could be due to: • Interferences, or cross contamination of
samples, equipment or analytical instruments. • Incorrect calibration standards. • Misidentification of the parameter or analyte. • Inappropriate choice of parameter.
False Negatives Definition Management
A false negative occurs when you make the decision that a substance, parameter or effect is not present when, in fact, it is present at detectable concentrations or levels. Also known as “false acceptance errors”
For samples for analysis, “method spikes” and “field spikes” can be used. These are samples that have been made to contain detectable levels of the analyte. If the target analyte is not found in such a sample then you have a clear potential for false negatives. False negatives for field parameters are more likely to occur due to inadequate scale of sampling. This is more difficult to address, particularly for Type I monitoring.

Oil Spill Monitoring Handbook
95
GUIDELINE FOR DATA MANAGEMENT Q.1
Rationale Data management is needed for all monitoring programmes but will depend on the scale, complexity and purpose of each programme. This Guideline provides a basic checklist for the development of a Data Management Plan.
Methodology Data management pre-planning: 1.1 Develop standard forms for all field data. 1.2 Establish a standard methodology for assigning location names, sample
numbers and descriptors. 1.3 Prepare and provide pre-printed photo or sample log forms, labels and/ or
chain of custody forms. 1.4 Establish data storage system (hard copy/computer database/GIS). 1.5 Obtain and supply maps and other recording equipment as required. 1.6 Establish sample handling/management procedures (Guideline G.1).
1
1.7 Assign responsibilities for data management, overall and in the field. Field data recording and handling: 2.1 Ensure that data is documented on standard format forms, log books,
film, tape or disk. 2.2 Assign the task of data recording task to one person per team. If more
than one person or one team is involved in these tasks, then training and field calibration of measurements should be undertaken.
2
2.3 Ensure that all data recorded in the field is recorded in a data log (data type, location, time, custodian and location of storage).
Initial data validation, compilation and storage: 3.1 Assign responsibility and procedure for checking data for errors and
ensuring that corrective action is taken. 3.2 All data (and all formats) should be backed-up as soon as possible.
3
3.3 Ensure that all data and samples are properly stored. Assessment and compilation of data (data reduction): 4.1 Assign responsibility for checking requests for analysis, calculations etc. 4.2 Establish responsibility and procedures for assessment, verification and
storage of data.
4
4.3 Ensure that laboratory or third party responsibility and procedures for the internal review of all analysis, calculations etc. has been established.
Page 1 of 2 Q.1
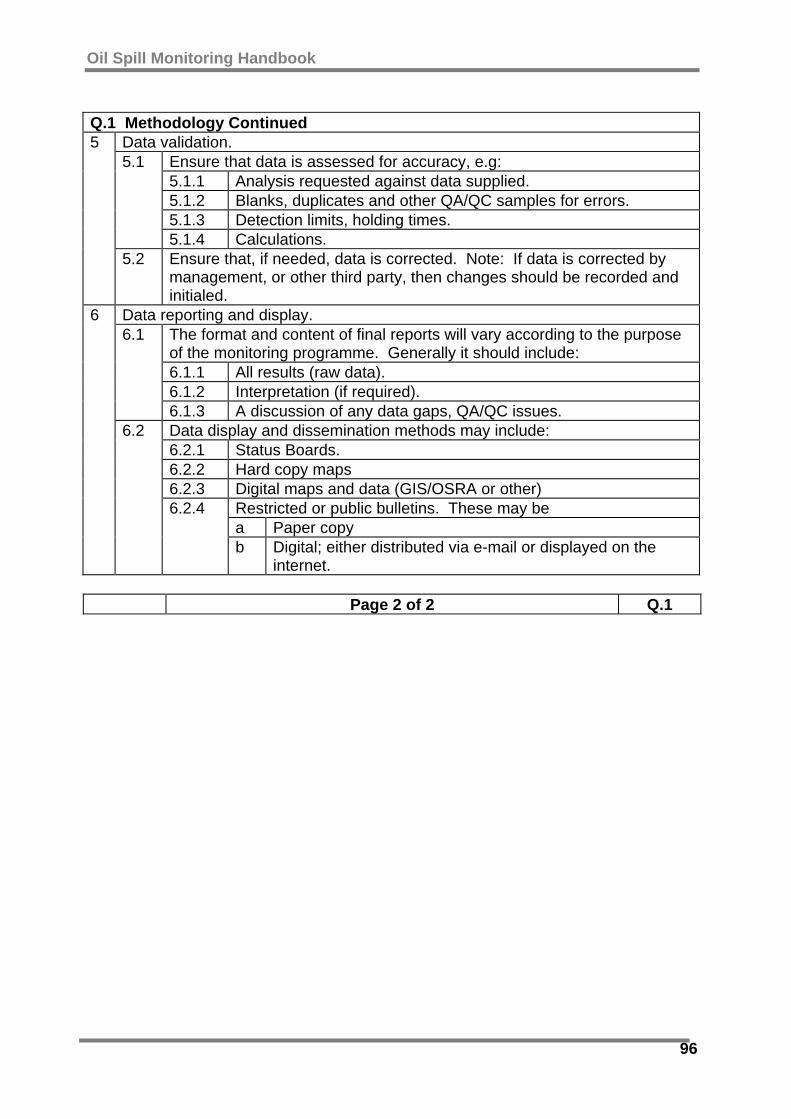
Oil Spill Monitoring Handbook
96
Q.1 Methodology Continued
Data validation. Ensure that data is assessed for accuracy, e.g: 5.1.1 Analysis requested against data supplied. 5.1.2 Blanks, duplicates and other QA/QC samples for errors. 5.1.3 Detection limits, holding times.
5.1
5.1.4 Calculations.
5
5.2 Ensure that, if needed, data is corrected. Note: If data is corrected by management, or other third party, then changes should be recorded and initialed.
Data reporting and display. The format and content of final reports will vary according to the purpose of the monitoring programme. Generally it should include: 6.1.1 All results (raw data). 6.1.2 Interpretation (if required).
6.1
6.1.3 A discussion of any data gaps, QA/QC issues. Data display and dissemination methods may include: 6.2.1 Status Boards. 6.2.2 Hard copy maps 6.2.3 Digital maps and data (GIS/OSRA or other)
Restricted or public bulletins. These may be a Paper copy
6
6.2
6.2.4
b Digital; either distributed via e-mail or displayed on the internet.
Page 2 of 2 Q.1

Oil Spill Monitoring Handbook
97
8.0 FURTHER READING AND INFORMATION AMSA, Marine Environment Protection Services. Identification of Oil on
Water: Aerial Observation and Identification Guide. ASTM (American Society for Testing and Materials). 1997. ASTM
Standards on Environmental Sampling. Second Edition. ASTM West Conshohocken.
Baker, J.M and W.J. Wolff (Eds). 1987. Biological Surveys of Estuaries and Coasts. Cambridge University Press.
Cooper, K. and H.L. Rees. 2002. Aquatic Environment Protection Analytical Methods No 13: Review of Standard Operating Procedures (SOPs). Centre for Environment, Fisheries and Aquaculture Science.
English, S, C. Wilkinson and V. Baker. 1994. Survey for Tropical Marine Resources. ASEAN-Australia Marine Science Project: Living Coastal Resources. Published by the Australian Institute of Marine Science, Townsville, Australia 4810.
International Maritime Organization (IMO). 1998. Manual on Oil Pollution, Section VI: IMO Guidelines for Sampling and Identification of Oil Spills.
International Maritime Organization (IMO)/Food and Agricultural Organization (FAO). 2003. Guidance on Managing Seafood Safety During & After Oil Spills. IMO Publication I590E.
Kuklick, J. H. 1991. Guide to Field Sampling Equipment for Use in Oil Spill Studies. Prepared for NOAA Hazardous Materials Response and Assessment Division by Research Planning Institute. RPI/SR/91/4/24-1
NOAA/ ORCA/ Hazardous Materials Response and Assessment Division. Open Water Oil Identification Job Aid.
NOAA/ NOS/ Hazardous Materials Response and Assessment Division. Dispersant Application Observers Job Aid.
Petroleum Industry Research Forum (PERF). Guidelines for the Scientific Study of Oil Spill Effects. PERF Project 94-10. Downloaded from http://www.api.org/ehs/guidelines.
Reilly, T. I. And R K. York. 2001. Guidance on Sensory Testing and Monitoring of Seafood for Presence of Petroleum Taint Following an Oil Spill. NOAA Technical Memorandum NOS OR&R 9. National Oceanic and Atmospheric Administration, Seattle, Washington. pp 107.
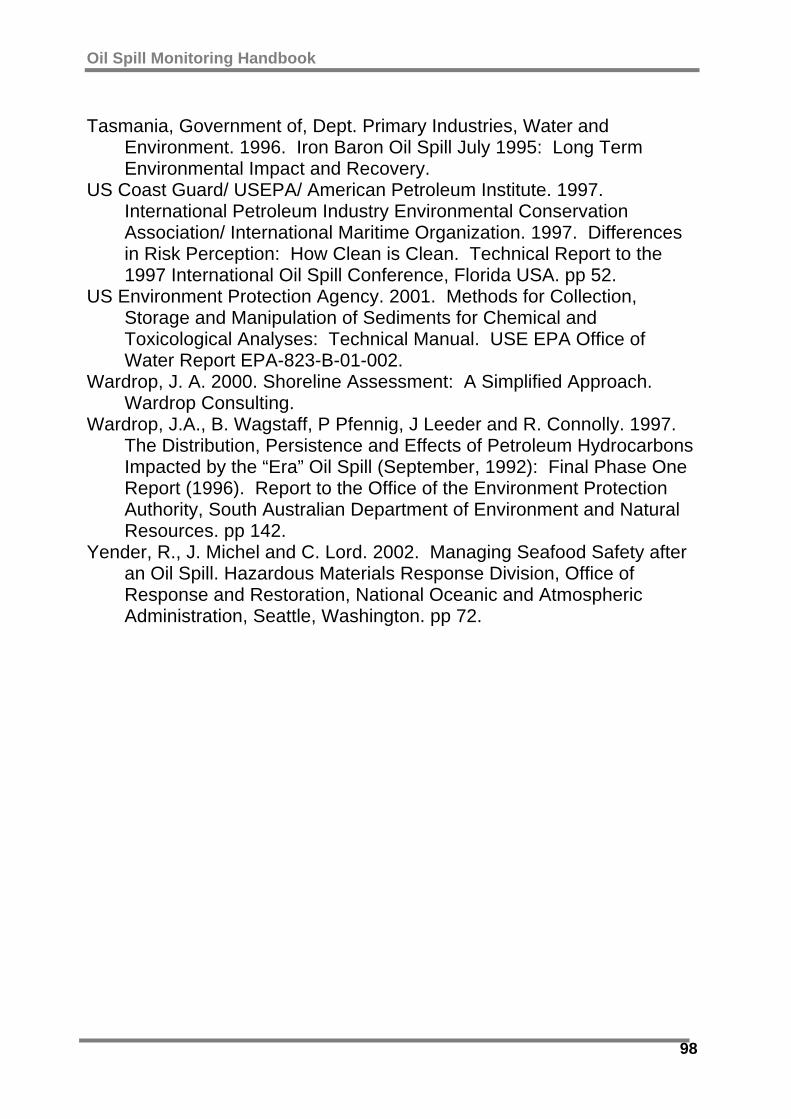
Oil Spill Monitoring Handbook
98
Tasmania, Government of, Dept. Primary Industries, Water and
Environment. 1996. Iron Baron Oil Spill July 1995: Long Term Environmental Impact and Recovery.
US Coast Guard/ USEPA/ American Petroleum Institute. 1997. International Petroleum Industry Environmental Conservation Association/ International Maritime Organization. 1997. Differences in Risk Perception: How Clean is Clean. Technical Report to the 1997 International Oil Spill Conference, Florida USA. pp 52.
US Environment Protection Agency. 2001. Methods for Collection, Storage and Manipulation of Sediments for Chemical and Toxicological Analyses: Technical Manual. USE EPA Office of Water Report EPA-823-B-01-002.
Wardrop, J. A. 2000. Shoreline Assessment: A Simplified Approach. Wardrop Consulting.
Wardrop, J.A., B. Wagstaff, P Pfennig, J Leeder and R. Connolly. 1997. The Distribution, Persistence and Effects of Petroleum Hydrocarbons Impacted by the “Era” Oil Spill (September, 1992): Final Phase One Report (1996). Report to the Office of the Environment Protection Authority, South Australian Department of Environment and Natural Resources. pp 142.
Yender, R., J. Michel and C. Lord. 2002. Managing Seafood Safety after an Oil Spill. Hazardous Materials Response Division, Office of Response and Restoration, National Oceanic and Atmospheric Administration, Seattle, Washington. pp 72.

Oil Spill Monitoring Handbook
99
APPENDIX A GLOSSARY

Oil Spill Monitoring Handbook
100
Assessment The evaluation of data, obtained by surveillance, sampling or monitoring, in order to quantify or predict an effect or behaviour.
Backbeach The area behind the shoreline. More precisely, behind the Supratidal Zone.
Benthic Seafloor Benthos Benthic organisms. Biota All living things. Plants, animals and microorganisms. Cetaceans Whales, dolphins and porpoises. Control site An "unaffected" reference site that is used to indicate the status of
the environment or resource without the influence of oil, chemical or cleanup.
Data reduction The act of putting data into a database for analysis or production of maps, tables etc.
Emulsion Mixture of oil and water. Emulsions may be oil in water emulsion or water in oil emulsion (mousse).
Endpoint The measure being taken, for example "parts per million hydrocarbon in water" or "number of dead penguins per km of shoreline" etc. In other words it is a group of data. Often interchangeable terms include "parameter" or "data set".
Encrusting Growing on a substance. Epifauna/ Epiflora
Organisms that live on or attached to the surface of the seabed e.g. seaweed, scallops, lobsters, abalone.
Fingerprinting With respect to oil spills, the procedure for determining the range of chemical parameters (i.e the chemical character) of an oil. Most oils have a characteristic balance of components and so oils from different samples can be compared and matched.
GPS Global Positioning System. Satellite linked instrument for fixing your geographic position.
Hypothesis A hypothesis is an idea that is to be tested. It may be similar to an objective but some monitoring objectives require the testing of a number of hypotheses, others require none. A Type I example would be an objective of "compare cleaning methods A and B". Data would include a measure of oil left on or in the beach, but might also included volume of sediment removed/waste generated or a measure of environmental damage due to each method. A number of hypotheses would be tested e.g. "that method A removes more oil than method B". A useful concept in the design of monitoring programmes. See also "null hypothesis".
Infauna Organisms that live within sediments, e.g. worms, shellfish, crabs Intertidal The zone between the low tide mark and the high tide mark. Invertebrate An animal without a backbone (molluscs, crustacea, etc.) ITZ Intertidal Zone LITZ Lower Intertidal Zone. MITZ Mid Intertidal Zone.
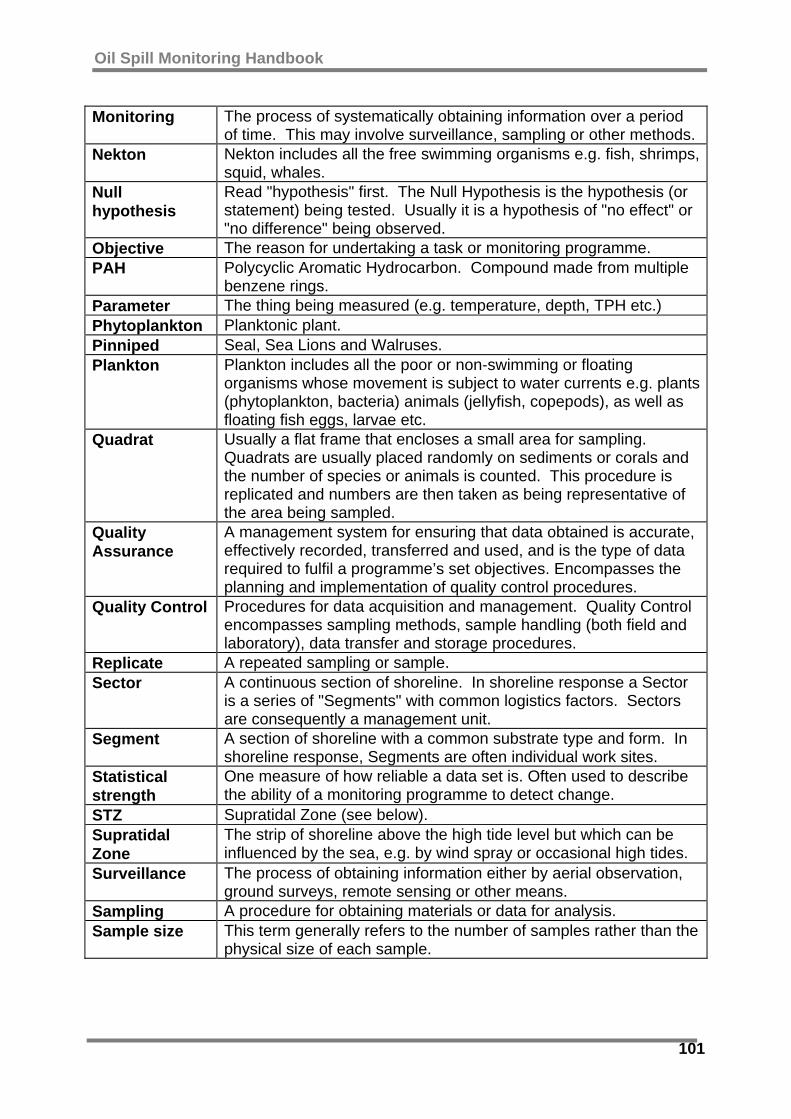
Oil Spill Monitoring Handbook
101
Monitoring The process of systematically obtaining information over a period of time. This may involve surveillance, sampling or other methods.
Nekton Nekton includes all the free swimming organisms e.g. fish, shrimps, squid, whales.
Null hypothesis
Read "hypothesis" first. The Null Hypothesis is the hypothesis (or statement) being tested. Usually it is a hypothesis of "no effect" or "no difference" being observed.
Objective The reason for undertaking a task or monitoring programme. PAH Polycyclic Aromatic Hydrocarbon. Compound made from multiple
benzene rings. Parameter The thing being measured (e.g. temperature, depth, TPH etc.) Phytoplankton Planktonic plant. Pinniped Seal, Sea Lions and Walruses. Plankton Plankton includes all the poor or non-swimming or floating
organisms whose movement is subject to water currents e.g. plants (phytoplankton, bacteria) animals (jellyfish, copepods), as well as floating fish eggs, larvae etc.
Quadrat Usually a flat frame that encloses a small area for sampling. Quadrats are usually placed randomly on sediments or corals and the number of species or animals is counted. This procedure is replicated and numbers are then taken as being representative of the area being sampled.
Quality Assurance
A management system for ensuring that data obtained is accurate, effectively recorded, transferred and used, and is the type of data required to fulfil a programme’s set objectives. Encompasses the planning and implementation of quality control procedures.
Quality Control Procedures for data acquisition and management. Quality Control encompasses sampling methods, sample handling (both field and laboratory), data transfer and storage procedures.
Replicate A repeated sampling or sample. Sector A continuous section of shoreline. In shoreline response a Sector
is a series of "Segments" with common logistics factors. Sectors are consequently a management unit.
Segment A section of shoreline with a common substrate type and form. In shoreline response, Segments are often individual work sites.
Statistical strength
One measure of how reliable a data set is. Often used to describe the ability of a monitoring programme to detect change.
STZ Supratidal Zone (see below). Supratidal Zone
The strip of shoreline above the high tide level but which can be influenced by the sea, e.g. by wind spray or occasional high tides.
Surveillance The process of obtaining information either by aerial observation, ground surveys, remote sensing or other means.
Sampling A procedure for obtaining materials or data for analysis. Sample size This term generally refers to the number of samples rather than the
physical size of each sample.

Oil Spill Monitoring Handbook
102
Transect A line across a beach or other area along which sampling or data
collection occurs. Generally, shoreline transects run from high tide to low tide and perpendicular to the direction of the beach.
TPH Total Petroleum Hydrocarbons. UITZ Upper Intertidal Zone Zooplankton Planktonic animals.

Oil Spill Monitoring Handbook
103
APPENDIX B CONVERSION TABLES

Oil Spill Monitoring Handbook
104
Volume US Gallon Imp. Gallon Barrel (Oil) Cubic Feet Cubic Inches Cubic Metres Cubic cm Litres
1.0 0.833 2.38 x 10⁻² 0.1337 231 3.79x10⁻³ 9785.41 3.785 1.2 1.0 2.86 x 10⁻² 0.161 277.42 4.55x10⁻³ 4546.1 4.55 42 35 1.0 5.615 9,792.9 0.159 158,970 158.97
7.48 6.23 0.18 1.0 1728 0.0283 28,316.8 28.32 4.33x10⁻³ 3.6x10⁻³ 1.03 x 10⁻⁴ 5.78x10⁻⁴ 1.0 1.64x10⁻⁵ 16.39 0.16
264.2 220 6.29 35.31 61,023.74 1.0 1x10⁶ 1000 2.64x 10⁻⁴ 2.2x10⁻⁴ 6.29 x 10⁻⁶ 3.53x10⁻⁵ 0.061 1x10⁻⁶ 1.0 0.001
0.26 0.22 6.29 x 10⁻³ 3.53x10⁻² 61 02 0.001 1,000 1.0 Length
Inch Feet Yards Mile N Mile Fathom cm Metres Km 1.0 0.08 0.03 1.57x10⁻⁵ 1.37x10⁻⁵ 0.14 2.54 0.0254 2.54x10⁻⁵ 12 1.0 0.33 1.89x10⁻⁴ 1.65x10⁻⁴ 0.167 30.48 0.3048 3.05x10⁻⁴ 36 3 1.0 5.68x10⁻⁴ 4.94x10⁻⁴ 0.5 91.144 0.9144 9.14x10⁻⁴
63,360 5280 1760 1.0 0.87 880 160,934 1,609 1.609 72,914 6076 2025 1.15 1.0 1012.7 1,852 1.852
72 6 2 1.14x10⁻³ 9.87x10⁻⁴ 1.0 182,29 1.822 1.83x10⁻³ 0.394 0.03 0.01 6.21x10⁻⁶ 5.4x10⁻⁶ 0.00547 1.0 0.01 0.00001 39.37 3.28 1.09 6.21x10⁻⁴ 5.4x10⁻⁴ 0.547 100 1.0 0.001
39,398 3,281 10,93.6 0.62 0.54 547 100,000 1,000 1.0 1 micron = 1 millionth of a meter = 1000 nanometers
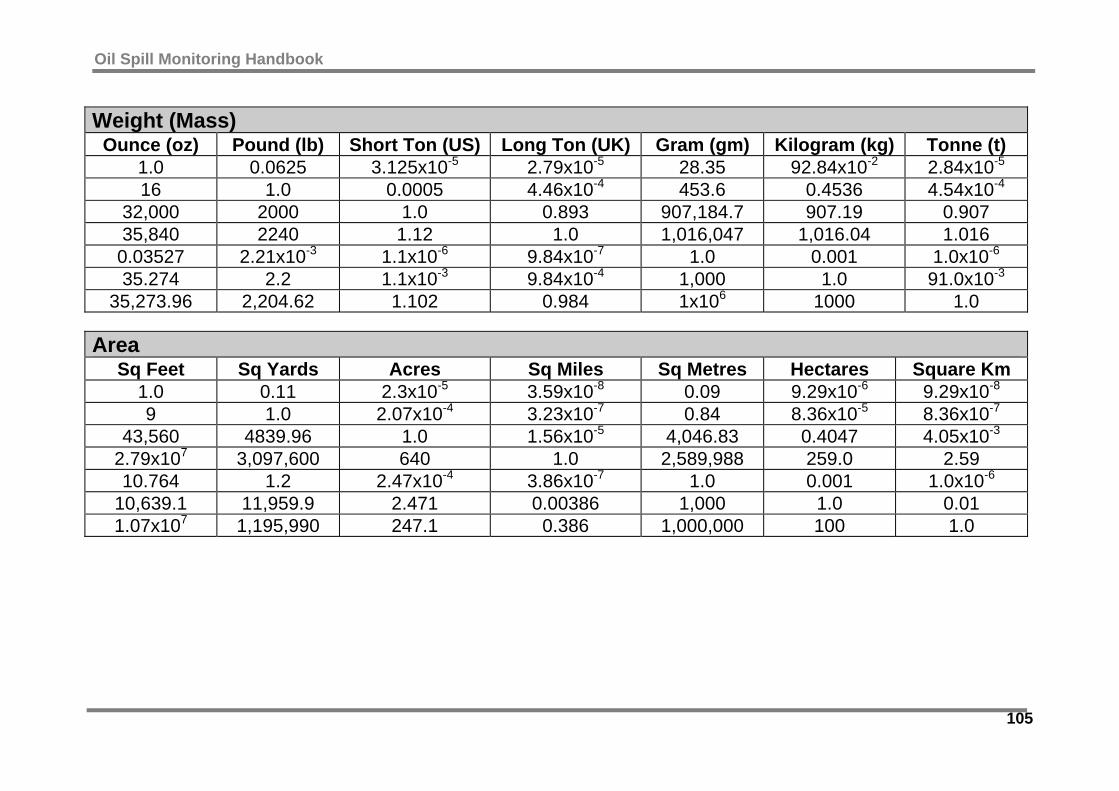
Oil Spill Monitoring Handbook
105
Weight (Mass) Ounce (oz) Pound (lb) Short Ton (US) Long Ton (UK) Gram (gm) Kilogram (kg) Tonne (t)
1.0 0.0625 3.125x10⁻⁵ 2.79x10⁻⁵ 28.35 92.84x10⁻² 2.84x10⁻⁵ 16 1.0 0.0005 4.46x10⁻⁴ 453.6 0.4536 4.54x10⁻⁴
32,000 2000 1.0 0.893 907,184.7 907.19 0.907 35,840 2240 1.12 1.0 1,016,047 1,016.04 1.016
0.03527 2.21x10⁻³ 1.1x10⁻⁶ 9.84x10⁻⁷ 1.0 0.001 1.0x10⁻⁶ 35.274 2.2 1.1x10⁻³ 9.84x10⁻⁴ 1,000 1.0 91.0x10⁻³
35,273.96 2,204.62 1.102 0.984 1x10⁶ 1000 1.0 Area
Sq Feet Sq Yards Acres Sq Miles Sq Metres Hectares Square Km 1.0 0.11 2.3x10⁻⁵ 3.59x10⁻⁸ 0.09 9.29x10⁻⁶ 9.29x10⁻⁸ 9 1.0 2.07x10⁻⁴ 3.23x10⁻⁷ 0.84 8.36x10⁻⁵ 8.36x10⁻⁷
43,560 4839.96 1.0 1.56x10⁻⁵ 4,046.83 0.4047 4.05x10⁻³ 2.79x10⁷ 3,097,600 640 1.0 2,589,988 259.0 2.59 10.764 1.2 2.47x10⁻⁴ 3.86x10⁻⁷ 1.0 0.001 1.0x10⁻⁶
10,639.1 11,959.9 2.471 0.00386 1,000 1.0 0.01 1.07x10⁷ 1,195,990 247.1 0.386 1,000,000 100 1.0
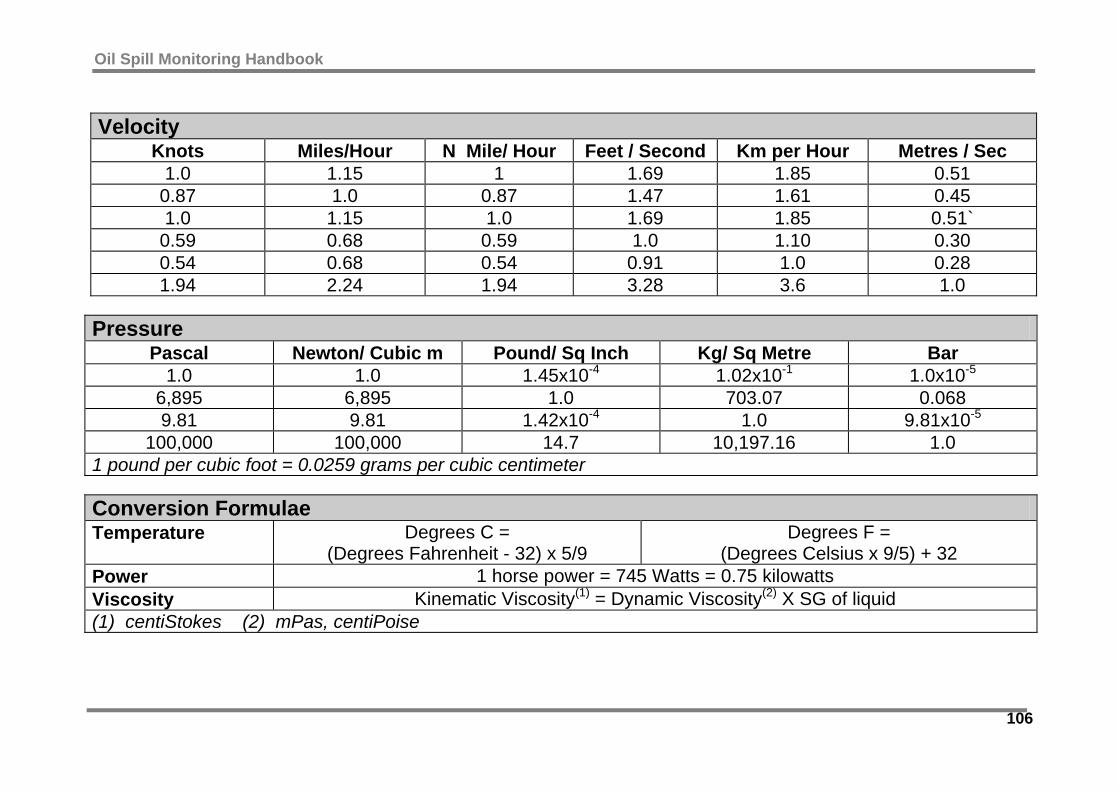
Oil Spill Monitoring Handbook
106
Velocity
Knots Miles/Hour N Mile/ Hour Feet / Second Km per Hour Metres / Sec 1.0 1.15 1 1.69 1.85 0.51
0.87 1.0 0.87 1.47 1.61 0.45 1.0 1.15 1.0 1.69 1.85 0.51`
0.59 0.68 0.59 1.0 1.10 0.30 0.54 0.68 0.54 0.91 1.0 0.28 1.94 2.24 1.94 3.28 3.6 1.0
Pressure
Pascal Newton/ Cubic m Pound/ Sq Inch Kg/ Sq Metre Bar 1.0 1.0 1.45x10⁻⁴ 1.02x10⁻¹ 1.0x10⁻⁵
6,895 6,895 1.0 703.07 0.068 9.81 9.81 1.42x10⁻⁴ 1.0 9.81x10⁻⁵
100,000 100,000 14.7 10,197.16 1.0 1 pound per cubic foot = 0.0259 grams per cubic centimeter Conversion Formulae Temperature Degrees C =
(Degrees Fahrenheit - 32) x 5/9 Degrees F =
(Degrees Celsius x 9/5) + 32 Power 1 horse power = 745 Watts = 0.75 kilowatts Viscosity Kinematic Viscosity(1) = Dynamic Viscosity(2) X SG of liquid (1) centiStokes (2) mPas, centiPoise