oilfield impacts and the north dakota department of … · oilfield impacts and the north dakota...
TRANSCRIPT
Oilfield Impacts and the
North Dakota Department of Health
Environmental Health Section
October 2016
Environmental Health Section
North Dakota Department of Health
918 East Divide Avenue
Bismarck, North Dakota
Table of Contents I. Background 1
A. Division of Air Quality 2
B. Division of Laboratory Services 2
C. Division of Municipal Facilities 3
D. Division of Waste Management 3
E. Division of Water Quality 4
F. Section Chief’s Office 5
II. Impacts of Oilfield Activity 6
A. Division of Air Quality 6
B. Division of Laboratory Services 10
C. Division of Municipal Facilities 11
D. Division of Waste Management 14
E. Division of Water Quality 18
III. Current Challenges 24
A. Division of Air Quality 24
B. Division of Laboratory Services 24
C. Division of Municipal Facilities 24
D. Division of Waste Management 24
E. Division of Water Quality 24
Figures Figure 1. Environmental Health Section Organizational Chart 1
Figure 2. Air Quality Enforcement Actions 6
Figure 3. Air Quality Citizen Complaints Investigated 7
Figure 4. Air Quality Facility Inspections 7
Figure 5. Air Quality Compliance Tests Reviewed 8
Figure 6. Air Quality Well Permit Registrations 8
Figure 7. Radioactive Materials License Applications 9
Figure 8. Microbiology Sample Volume 10
Figure 9. Chemistry Sample Volume 11
Figure 10. Public Water Systems 12
Figure 11. SDWA Violations 12
Figure 12. PWS Meeting Operator Certification Requirements (Water Distribution) 13
Figure 13. Plans and Specifications Approvals - Water and Wastewater Projects 13
Figure 14. State Revolving Loan Fund - Total Project Amount from Intended Use Plans 14
Figure 15. Hazardous Waste Large Quantity Generators 15
Figure 16. MSW and Special Waste Landfills 15
Figure 17. Tons of Oilfield Special Waste Generated 16
Figure 18. Increases in Underground Storage Tank Installations 16
Figure 19. Waste Transporter Permits 17
Figure 20. Solid Waste Inspections 17
Figure 21. Number of Spills by Year 19
Figure 22. Spill Response by Staff 19

Figure 23. NDPDES Permits Workload 20
Figure 24. Ground Water Protection Program Workload (2009-Present) 22
Figure 25. Ground Water Protection Program Workload (2009-Present) 22
Figure 26. Enforcement Penalties and Number of Cases 23

1
Oilfield Impacts and the North Dakota Department of Health
Environmental Health Section
I. Background The Environmental Health Section of the North Dakota Department of Health (NDDoH) is responsible
for safeguarding North Dakota’s air, land and water resources. The section, which has 174 employees,
works closely with local, state and federal entities to address public and environmental health concerns
and implement protection policies and programs. The section has a Chief’s Office and five divisions:
Air Quality, Laboratory Services, Municipal Facilities, Waste Management and Water Quality.
Figure 1. Environmental Health Section Organizational Chart

2
A. Division of Air Quality
The Division of Air Quality consists of two major programs with 36 full-time positions and one half-
time position. There are 23.5 environmental scientist positions, one environmental sciences
administrator, and six environmental engineers which all require the minimum of a four-year degree. In
addition, there are three electronic technicians and one data processing coordinator who have two-year
technical degrees, and two administrative support staff.
Air Pollution Control Program
This program promotes clean air activities, conducts compliance activities and initiates enforcement
actions to correct air pollution problems. Program staff responsibilities include implementing the Clean
Air Act, evaluating permit applications, conducting computer modeling of potential impacts to air
quality, issuing permits that restrict emission levels to ensure standards are met and operating an
ambient air quality monitoring network.
Radiation Control and Indoor Air Quality Program
This program performs two major functions: (1) regulating the development and use of ionizing and
non-ionizing radiation sources to protect North Dakotans and the environment, and (2) evaluating and
mitigating asbestos, radon, lead and other indoor air quality concerns, as well as implementing a public
awareness and education program concerning these health risks.
Field activities supporting the above programs include inspecting facilities to ensure compliance,
enforcing laws, investigating air pollution complaints and operating a statewide ambient air quality
monitoring network.
B. Division of Laboratory Services
The Division of Laboratory Services has two principal support programs. There are 35 full-time
employees. Twenty-six are professional microbiologists or chemist positions requiring the minimum of
a four-year degree, and nine are support staff, including four medical laboratory technicians and two
chemistry laboratory technicians who have two-year degrees.
Chemistry
The chemistry laboratory provides analytical chemistry data to environmental protection, public health,
agricultural and petroleum regulatory programs in the state. The laboratory also maintains a
certification program for North Dakota laboratories that provide environmental testing services. The
department’s environmental protection programs use laboratory data to monitor and/or regulate air
quality; solid and hazardous waste; municipal wastewater; agricultural runoff; surface, ground and
drinking water quality; petroleum products; and other media of environmental or public health concern.
Microbiology
The microbiology laboratory (i.e., the public health laboratory) performs testing in the areas of
bacteriology, mycology, parasitology, immunology, virology, molecular diagnostics, bioterrorism
response, and dairy and water bacteriology. The laboratory is responsible for providing rapid, accurate
detection and identifying organisms that may threaten public health.
3
C. Division of Municipal Facilities
The Division of Municipal Facilities administers three programs. There are 31 full-time employees.
Fifteen are environmental scientists, and 13 are environmental engineers requiring the minimum of a
four-year degree. There is one grants/contract officer position, which also requires a four-year degree,
and two administrative support personnel.
Public Water Supply Supervision (PWSS)
This program works with the public water systems (PWS) in North Dakota (currently 571) to ensure
drinking water meets all standards established by the Safe Drinking Water Act (SDWA). This is
accomplished by monitoring drinking water quality and providing technical assistance. Currently, 96.8
percent of community water systems are meeting all applicable health-based standards under the SDWA
– one of the highest compliance rates in the region and country (EPA goal for 2015 is 92 percent
nationwide).
Training and certification is provided for operators of water treatment and distribution facilities and
wastewater collection and treatment plants. There are about 1,141 certified operators in the state.
A total of 93 percent of public water systems are meeting operator certification requirements for water
treatment (no EPA goal). There are 79 percent of community water systems meeting operator
certification requirements for water distribution (no EPA goal).
Staff administer the fluoridation program and provide technical assistance to private systems. A total of
68 communities add fluoride to their drinking water. Of the population served by these communities, 95
percent (about 619,054) receive optimally fluoridated drinking water (no EPA goal).
Drinking Water State Revolving Loan Fund (DWSRF)
This program provides low-interest loans to help public water systems finance the infrastructure needed
to comply with the SDWA. Since program inception (1997) through December 31, 2015, loans totaling
about $424 million have been approved. Staff members also review drinking water projects to ensure
compliance with state design criteria before construction and provide technical assistance.
Clean Water State Revolving Loan Fund (CWSRF)
This program provides low-interest loans to fund conventional wastewater and nonpoint source pollution
control needs. Since program inception (1990) through December 31, 2015, loans totaling about $825
million have been approved. Staff members also review wastewater projects to ensure compliance with
state design criteria before construction and provide technical assistance.
Field activities supporting the above programs include: (1) inspecting about 606 public water and
wastewater systems to ensure compliance with all public health standards, (2) inspecting State
Revolving Loan Fund construction projects to ensure they meet state and federal requirements, and (3)
investigating complaints.
D. Division of Waste Management
The Division of Waste Management works to safeguard public health through four programs. There are
25 full-time positions and one half-time position, consisting of 15.5 environmental scientist positions,
five environmental engineers, one environmental sciences administrator, the division director (all of
which require the minimum of a four-year degree), and three administrative support staff.

4
Hazardous Waste Program
This program regulates 760 facilities that generate, store, treat, dispose or transport hazardous waste.
The program also coordinates assessments and cleanups at Brownfield sites (properties underdeveloped
due to actual/perceived contamination) and performs inspections at sites known or suspected to have
equipment containing polychlorinated biphenyls (PCBs).
Solid Waste Program
This program regulates the collection, transportation, storage and disposal of nonhazardous solid waste.
Resource recovery, waste reduction and recycling are promoted. The program helps individuals,
businesses and communities provide efficient, environmentally acceptable waste management systems.
There are 448 facilities under this program and about 880 permitted waste transport companies.
Underground Storage Tank Program
This program regulates petroleum and hazardous substance storage tanks, establishes technical standards
for the installation and operation of underground tanks, maintains a tank notification program,
establishes financial responsibility requirements for tank owners and provides for state inspection and
enforcement. The program works with retailers and manufacturers to ensure specifications and
standards for petroleum and antifreeze are met. There are 935 facilities currently regulated under this
program. In addition, the UST Program supervises the cleanup of any leaking underground storage tank
facility and other petroleum product releases.
Abandoned Motor Vehicle Program
The Abandoned Motor Vehicle Program focuses on assisting political subdivisions in the cleanup of
abandoned motor vehicles and scrap metal.
Field activities supporting the above programs includes compliance assistance, sampling, training, site
inspections and complaint investigations.
E. Division of Water Quality
The Division of Water Quality protects water quality through five programs. There are 38 full-time
positions, consisting of 29 environmental scientists, four environmental sciences administrators, four
environmental engineers (all of which require the minimum of a four-year degree) and one
administrative assistant.
North Dakota Pollutant Discharge Elimination System (NDPDES) Permit Program
This program issues the federally required National Pollutant Discharge Elimination System (NPDES)
permits for discharge of pollutants to surface waters. This may include pollutants carried by stormwater,
in addition to direct discharge of wastewater. Many industries and municipalities require these permits.
This program also issues permits to septic tank pumpers regulating the collection and proper disposal of
domestic wastewater. The permits may be individual permits issued to one facility or general permits
where multiple facilities are covered under one permit.
Watershed Management Program
This program monitors the health of North Dakota watersheds through sampling and analysis of water
quality and aquatic life in lakes, rivers, streams and reservoirs. For those water bodies that are not
usable for their designated use, plans are developed to achieve improvements in water quality. These
5
plans are implemented in conjunction with the local conservation districts and landowners. This
program also provides cost share assistance, information and education to help meet water quality goals.
Ground Water Protection Program
This program includes the (1) Wellhead and Source Water Protection Programs to define the
susceptibility of public water systems to contaminant sources, (2) Underground Injection Control (UIC)
Program which helps prevent contamination of drinking water by injection wells, and (3) Ambient
Ground Water Monitoring Program which assesses the quality of ground water resources with regard to
agricultural and oilfield-related chemical contamination. In addition, trained personnel provide
immediate response to emergency spills and continued investigation/enforcement if necessary to fully
address environmental impacts. Program staff also fulfills open records requests typically received as
part of property transactions or as Freedom of Information Act requests from the general public.
Spill Investigation Program
This program receives and reviews all the spill reports for the state, and responds with the assistance of
other EHS divisions and other agencies. The response may include the collection of additional
information, assignment to other agencies, field inspection and on-scene coordination. Staff with this
program collects environmental samples of soil and water, and work with the responsible party to ensure
spills are remediated and waters of the state, both ground and surface water, are protected. To provide a
timely response to a critical incident, this program maintains two staff in the field five days a week and
one staff person on call weekends and holidays. One staff person maintains phone coverage 24 hours a
day, seven days a week in case of an incident. Staff members also work with various industries to help
prepare for response to an incident and to educate them on proper remediation and assessment of a spill.
Field activities supporting the above programs include inspecting wastewater treatment facilities and
septic tank pumpers, and compliance audits/sampling to ensure permit requirements are met; inspecting
construction and industrial site stormwater controls; meetings with local/state entities to assess nonpoint
source project goals; ambient monitoring of lakes and rivers; evaluating domestic water sources for
potential contaminant sources; annual collection/analysis of samples from vulnerable aquifers;
overseeing remediation of spills with potential to reach water sources; and responding to complaints.
F. Section Chief’s Office
Division activities are coordinated by the Section Chief’s Office, which has 8.25 full-time employees
(FTEs) and an attorney assigned by the Office of Attorney General. Employees oversee quality
assurance procedures; help coordinate public information efforts; assist with staff training; and
coordinate computer and data management activities, emergency response efforts, enforcement of
environmental regulations and funding requests. The Chief’s Office works with the section’s divisions,
various government agencies, industry and the public to set environmental protection policy and ensure
the proper implementation of environmental protection programs.

6
II. Impacts of Oilfield Activity
A. Division of Air Quality Expanded activity in the oilfield has increased the workload in the division due to the number of
licensing/permitting, inspection, enforcement and air quality complaint response activities.
The number of air pollution sources in the state has increased due to oil activity, resulting in an increase
in workload (Figures 2, 3, 4 and 5). The number of oil wells registered in the state has risen from less
than 2,000 to nearly 10,000 (Figure 6). Similar increases have been seen in the number of regulated
crude oil storage tanks, compressor stations and gas plants. The increase in the number of regulated air pollution sources, as well as increasing regulatory
requirements/complexity, has resulted in the continued need for significant staff expertise and resources.
Figure 2. Air Quality Enforcement Actions
0
5
10
15
20
25
30
35
40
2007 2008 2009 2010 2011 2012 2013 2014 2015
Air Quality Enforcement Actions

7
Figure 3. Air Quality Citizen Complaints Investigated
Figure 4. Air Quality Facility Inspections
0
10
20
30
40
50
60
70
80
90
100
2007 2008 2009 2010 2011 2012 2013 2014 2015 2016
Air Quality Citizen Complaints Investigated
0
20
40
60
80
100
120
140
160
2008 2010 2012 2014 2016 2017 (projected)
Air Quality Facility Inspections

8
Figure 5. Air Quality Compliance Tests Reviewed
Figure 6. Air Quality Well Permit Registrations
0
20
40
60
80
100
120
140
2007 2008 2009 2010 2011 2012 2013 2014 2015
Air Quality Compliance Tests Reviewed
0
2000
4000
6000
8000
10000
12000
2000 2002 2004 2006 2008 2010 2012 2013 2014 2015 2016
Wel
l R
egis
trati
on
s
Air Quality Well Permit Registrations

9
Many companies in the oilfield use instrumentation technologies containing radioactive material, and
there has been a large increase in the number of companies actively using such materials. Several
operators have been identified as improperly using these materials, potentially placing members of the
public and the environment at risk. In response, the NDDoH has investigated an increasing number of
allegations regarding improper handling of radioactive materials.
Radioactive materials license activities have stabilized to about 200 per year since 2014 (Figure 7). This
is partly due to the impact of the recent downturn in oil and gas exploration and production activities.
The NDDoH published TENORM (Technologically Enhanced, Naturally Occurring Radioactive
Materials) rules, which became effective January 1, 2016. As a result, the NDDoH has increased the
number of public and industry informational workshops it conducts. In addition, increased workload
demands have been placed upon the division as a result of the licensure of all TENORM radioactive
waste transporters, the increase in the number of facilities that treat TENORM and the increased
frequency in inspections of these facilities.
Figure 7. Radioactive Materials License Applications
Additional direct and indirect impacts on the division include:
Expansion of the Tesoro Refinery, plus permitting work for proposed diesel refineries and a full-
scale gasoline refinery.
Increased compliance activities (inspections, testing/report reviews, etc.) relating to the new
Dakota Prairie Refining diesel refinery.
Increased permitting and compliance activities relating to gas plants, compressor stations and oil
storage terminals.
Extensive effort on Bakken Pool Permitting and Compliance Guidance Document for oil wells.
Increased telephone and email inquiries pertaining to air pollution control requirements.
65
85
105
125
145
165
185
205
225
2011 2012 2013 2014 2015 2016
Radioactive Materials License Applications
10
Increased oil- and gas-related complaints and inquiries from public.
Operating of a new Williston monitoring site to measure air quality.
Inspections and study of radiation from frack sand and drilling mud.
Increased permitting activity, along with increased particulate control inspections of more rock,
sand and gravel plants (three times higher than in the past), due to greater demand for these
materials in the oilfield.
Road dust has become a significant source of air pollution.
New Environmental Protection Agency regulations directed at energy development.
Expansion of the Tioga Gas Plant
B. Division of Laboratory Services
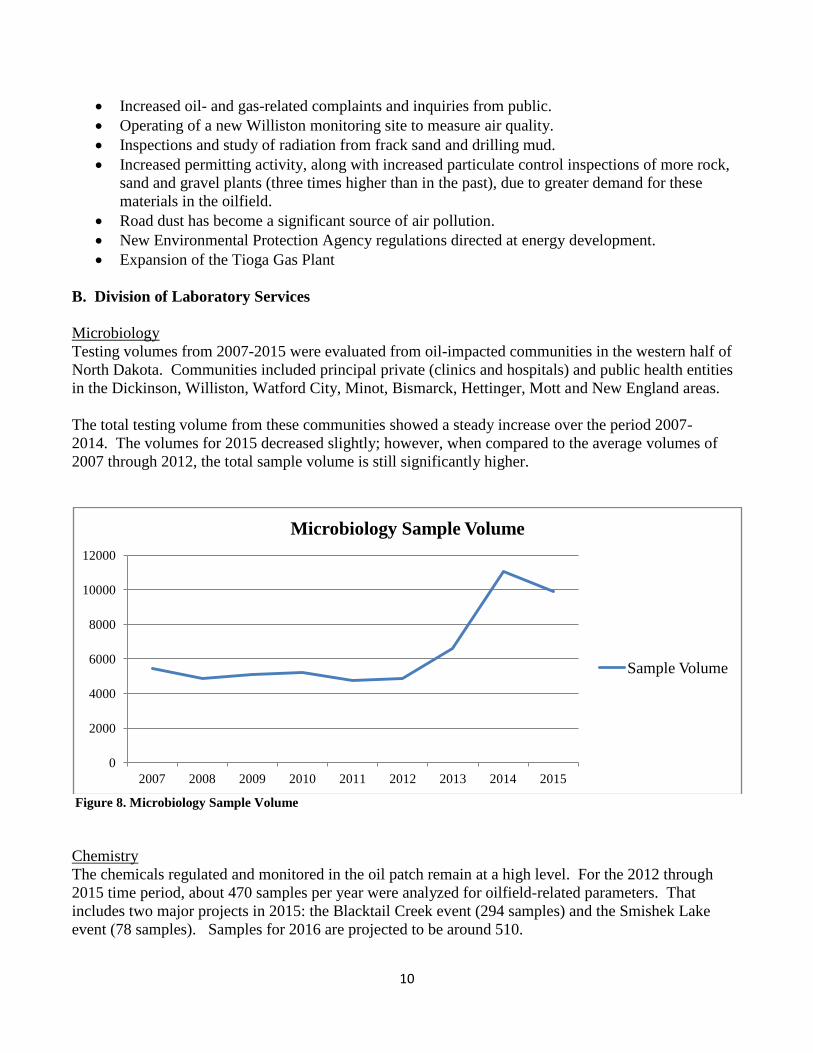
Microbiology
Testing volumes from 2007-2015 were evaluated from oil-impacted communities in the western half of
North Dakota. Communities included principal private (clinics and hospitals) and public health entities
in the Dickinson, Williston, Watford City, Minot, Bismarck, Hettinger, Mott and New England areas.
The total testing volume from these communities showed a steady increase over the period 2007-
2014. The volumes for 2015 decreased slightly; however, when compared to the average volumes of
2007 through 2012, the total sample volume is still significantly higher.
Figure 8. Microbiology Sample Volume
Chemistry
The chemicals regulated and monitored in the oil patch remain at a high level. For the 2012 through
2015 time period, about 470 samples per year were analyzed for oilfield-related parameters. That
includes two major projects in 2015: the Blacktail Creek event (294 samples) and the Smishek Lake
event (78 samples). Samples for 2016 are projected to be around 510.
0
2000
4000
6000
8000
10000
12000
2007 2008 2009 2010 2011 2012 2013 2014 2015
Microbiology Sample Volume
Sample Volume

11
Since July of 2015, parameters most commonly requested are complete mineral chemistry (including
bromide), diesel range organics (DRO), gasoline range organics (GRO), and benzene, toluene,
ethylbenzene and xylenes (BTEX).
Figure 9 depicts, if the Blacktail Creek and Smishek Lake events are excluded, the number of samples
analyzed annually by the Chemistry laboratory for the 2014-2016 period has remained consistent.
Figure 9. Chemistry Sample Volume
C. Division of Municipal Facilities
Keeping pace with the new drinking water and wastewater facilities in oil-impacted areas has been a
challenge. Figure 10 shows that the total number of PWSs regulated by the division significantly
increased from 2010 through 2014. It goes on to show a decrease in the number of PWSs tracked over
the last year. However, the division still continues to monitor these systems to ensure that, as oil
activities and PWSs become active once again, they continue to meet all SDWA requirements.
Figure 11 shows the total number of SDWA violations had been increasing since 2010. It also shows a
decrease in the number of violations over the last year. This decline in the number of violations is due
to smaller PWSs becoming consecutive users of larger providers, allowing them to return to compliance.
The closing of others in oil-impacted counties has also had an impact on compliance rates. However,
even with the decline, the long-term average is still double when compared to 2008 through 2010.
Implementation of the Revised Total Coliform Rule during 2016 will further impact the division’s
workload and compliance rates in the future.
0 200 400 600 800 1000
2012
2013
2014
2015
2016
Chemistry Sample Volume
Oil Field Response (actual)
Oil Field Response (projected
through 12/31/2016)
Special Project: Blacktail
Creek Spill
Special Project: Smishek Lake
Spill

12
Figure 10. Public Water Systems
Figure 11. SDWA Violations
Under state law (North Dakota Century Code 23-26), all persons operating water and wastewater
systems, with some exceptions, must be certified by the NDDoH. Figure 12 generally shows decreased
numbers of water distribution operators being certified since 2011. Two principal factors have been
responsible for the decrease in certification: (1) operator turnover (certified operators leaving for higher
paying jobs in the oilfield); and (2) new systems that do not have a certified operator. Both of these
factors still exist, but higher-paying oilfield jobs may be harder to find. Through training and site
inspections, the division continues to stress the importance of having a certified operator. In oil-
0
100
200
300
400
500
600
700
08 09 10 11 12 13 14 15
Public Water Systems
PWS # Total
PWS # Oil-Impacted
Counties
0
50
100
150
200
250
300
350
400
450
500
08 09 10 11 12 13 14 15
SDWA Violations
# Total SDWA Violations
# SDWA Violations in
Oil-Impacted Counties

13
impacted counties, the primary need has been for water distribution operators because most new systems
obtain drinking water from other regulated sources (no treatment required) and either haul wastewater to
another permitted system or provide on-site wastewater disposal. Compliance with operator
certification requirements for water treatment and wastewater collection/treatment also may decrease if
more systems choose to develop/treat their own drinking water sources or treat/discharge wastewater.
Figure 13 shows a large increase in plans and specifications submittals/approvals since 2010, largely due
to projects in the oilfield. Project submittals decreased in 2015, but remained high and required
extended review time. Many were submitted by out-of-state engineering firms (120 to date) unfamiliar
with North Dakota requirements, resulting in extended review time. Many had mechanical wastewater
treatment plants and/or large on-site disposal systems which require additional time for review and
approval. On-site disposal systems have not historically been used or addressed by the division.
Finally, many involved as-built situations which require more time to resolve design and construction
issues. Considerable time also is spent: (1) evaluating and addressing noncompliant or failing
wastewater systems, many of which were built and expanded without local or state approval and which
have undergone numerous ownership or management changes; and (2) developing new design standards
and policies to address issues primarily related to projects in the oilfield.
Figure 12. PWS Meeting Operator Certification Figure 13. Plans and Specifications Approvals - Water and
Requirements (Water Distribution) Wastewater Projects
Figure 14 shows the number of projects/dollar value on the CWSRF and DWSRF lists increased
significantly since 2010. For 2016, the preliminary dollar value of projects is $669 million for the
DWSRF and $516 million for the CWSRF. This will result in a large number of SRF projects to
implement, increasing workload on top of attempting to keep pace with more technical reviews for non-
SRF and oilfield projects.
0
20
40
60
80
100
08 09 10 11 12 13 14 15
Operator Certification
Water Distribution
% PWS
0
100
200
300
400
500
08 09 10 11 12 13 14 15
Plans and
Specifications Approvals
Approvals

14
Figure 14. State Revolving Loan Fund - Total Project Amount from Intended Use Plans
Additional workload impacts to those shown in the above tables include: educating systems on SDWA
requirements, implementing/enforcing the requirements, and compliance/technical assistance in
addressing SDWA violations; responding to complaints; answering calls and emails about proposals for
new/expanded housing facilities; addressing vendor/engineer inquiries; and attending visits and
presentations on alternative wastewater treatment systems and project proposals.
D. Division of Waste Management
Oilfield activity has significantly increased the workload, from facilities directly operated by oilfield-
related businesses and from peripheral businesses supporting the increasing general population. There
are more oilfield service companies generating large quantities of hazardous waste and other support
businesses, such as tank manufacturers generating more hazardous waste. Even with the slowdown in
oil well drilling activity, the service and support companies remain active. There has been no decrease
in the number of large quantity generators of hazardous waste or the overall quantity of hazardous waste
generated. New gas stations and truck stops are being built or expanded. Both municipal landfills and
oilfield special waste landfills are dealing with new types and greatly increased volumes of waste.
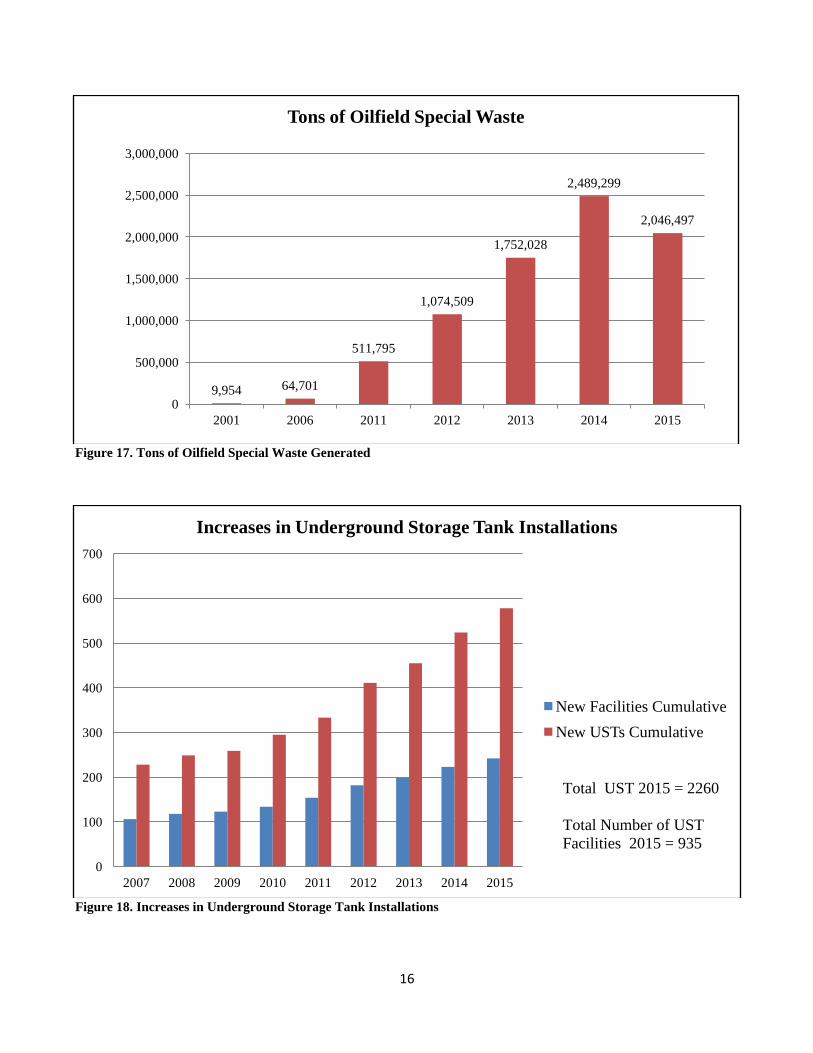
Figures 15 through 20 show the changes in hazardous waste large quantity generators (LQGs),
municipal solid waste (MSW) and special waste landfills, tons of oilfield special waste, number of solid
waste inspections, new or expanded underground storage tank (UST) facilities, and new waste
transporter permits. The division also has three staff members on the EHS Division of Water Quality
spill response team, which requires considerable field work and office follow-up. Figure 22 on page 19
of this report shows spill response numbers.
0
100
200
300
400
500
600
700
800
2008 2009 2010 2011 2012 2013 2014 2015 2016
State Revolving Loan Fund
CWSRF ($M)
DWSRF ($M)

15
Figure 15. Hazardous Waste Large Quantity Generators
Figure 16. MSW and Special Waste Landfills
0
5
10
15
20
25
30
2009 2012 2013 2014 2015 2016
Hazardous Waste Large Quantity Generators
0
2
4
6
8
10
12
14
2009 2010 2011 2012 2013 2014 2015
MSW and Special Waste Landfills
Modifications or New
Applications
Active Oilfield Waste
Landfills
Pre-Applications
16
Figure 17. Tons of Oilfield Special Waste Generated
Figure 18. Increases in Underground Storage Tank Installations
9,954 64,701
511,795
1,074,509
1,752,028
2,489,299
2,046,497
0
500,000
1,000,000
1,500,000
2,000,000
2,500,000
3,000,000
2001 2006 2011 2012 2013 2014 2015
Tons of Oilfield Special Waste
0
100
200
300
400
500
600
700
2007 2008 2009 2010 2011 2012 2013 2014 2015
Increases in Underground Storage Tank Installations
New Facilities Cumulative
New USTs Cumulative
Total UST 2015 = 2260
Total Number of UST
Facilities 2015 = 935
17
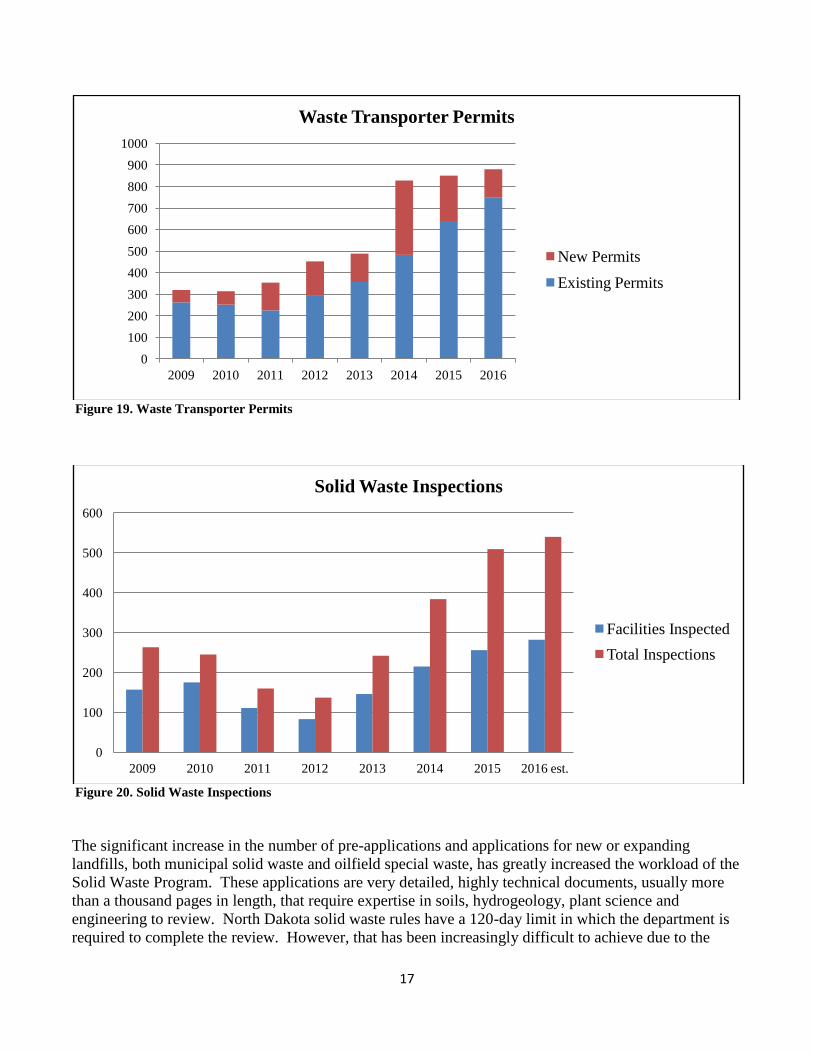
Figure 19. Waste Transporter Permits
Figure 20. Solid Waste Inspections
The significant increase in the number of pre-applications and applications for new or expanding
landfills, both municipal solid waste and oilfield special waste, has greatly increased the workload of the
Solid Waste Program. These applications are very detailed, highly technical documents, usually more
than a thousand pages in length, that require expertise in soils, hydrogeology, plant science and
engineering to review. North Dakota solid waste rules have a 120-day limit in which the department is
required to complete the review. However, that has been increasingly difficult to achieve due to the
0
100
200
300
400
500
600
700
800
900
1000
2009 2010 2011 2012 2013 2014 2015 2016
Waste Transporter Permits
New Permits
Existing Permits
0
100
200
300
400
500
600
2009 2010 2011 2012 2013 2014 2015 2016 est.
Solid Waste Inspections
Facilities Inspected
Total Inspections

18
volume of applications and inquiries received. At the same time, there is an increased need for
inspections at the existing facilities and site visits to the new facility locations, which also takes
significant staff time. This has resulted in a backlog for inspections and permits for other regulated solid
waste facilities around the state. All of the programs in the Division of Waste Management have been
affected by oilfield activities, but the Solid Waste Program has been affected the most.
Two new oilfield and industrial waste landfills were permitted, and two were significantly expanded in
2015. The Solid Waste Program conducted 505 inspections of 254 facilities and followed up on 154
reports of prohibited waste rejected by solid waste disposal facilities. Five pre-application reviews were
completed for proposed oilfield/industrial waste landfills in 2015.
In 2016, three permits were issued, one for a new oilfield/industrial waste landfill and two for
expansions of existing facilities. Permits for expansion of two MSW landfills in the west (McKenzie
County and Williston) have been approved, and a pre-application for the Dickinson MSW landfill
expansion was approved.
By the end of September 2016, the Solid Waste Program had conducted 356 inspections of 186 facilities
and followed up on 130 reports of waste rejected by solid waste disposal facilities due to prohibited
waste (including potential radioactive materials). In 2016, the division issued a contract with the Upper
Missouri District Health Unit and McKenzie County for up to $100,000 from the Abandoned Auto
Program Fund to address the problem of campers, trailers and mobile homes abandoned due to the
decline in oilfield activity.
An entirely new issue arose during the Bakken oil boom regarding the generation and proper
management of Technologically Enhanced Naturally Occurring Radioactive Material (TENORM).
TENORM is low-level radioactive waste that is generated primarily in oilfield exploration and
production activities. It includes materials such as filter socks, tank bottom sludge and pipe scale.
Responding to illegal dumping and improper management incidents has taken considerable staff time, as
TENORM is a major concern of the public. The division is overseeing rejected waste loads at landfills
and the cleanup of illegal dump sites, although the number of incidents has decreased since
implementation of requirements for TENORM waste containers on all well sites. The division worked
with Argonne National Laboratory to study the risks to oilfield workers and the general public. New
administrative rules regarding the proper handling, recordkeeping, reporting and disposal of TENORM
have been approved and are being implemented. Three landfill applications for managing TENORM
have been received for review.
E. Division of Water Quality
Spill Investigation Program
This program is primarily responsible for responding to spills with the potential to impact waters of the
state and following up on appropriate remediation. The program handles two different types of spills:
oilfield and non-oilfield related. Of the spills that have been reported since July 1, 2015, there are
currently less than 20 oilfield-related spills and less than 20 non-oilfield related spills awaiting initial
inspection. Between July 1, 2015 and September 27, 2016, the program reviewed 1,967 total spills and
has responded to 810, assigning the rest to other agencies. Of the 810 spills inspected, there are 371 that
need additional on-site follow-up. Spills with the greatest potential to adversely impact the environment
are evaluated as soon as possible. As the number of oil and gas facilities increase, the potential for the

19
number of spills is expected to increase as well. Figures 20 and 21 illustrate the change in number of
spills reported and the response by staff for each calendar year.
Figure 21. Number of Spills by Year *Estimate at end of 2016
Figure 22. Spill Response by Staff * Estimate at end of 2016 **Response may include several actions
(e.g., review to determine if follow-up is necessary, phone conversations and inspections).
528 630 586
729
1386 1494
2073
2596
2011
1466*
0
500
1000
1500
2000
2500
3000
2007 2008 2009 2010 2011 2012 2013 2014 2015 2016
Number of Spills by Year
Spills
141
1383
2135
2806
2566
2351*
0
500
1000
1500
2000
2500
3000
2011 2012 2013 2014 2015 2016
Spill Response by Staff
Review and/or
Response**
20
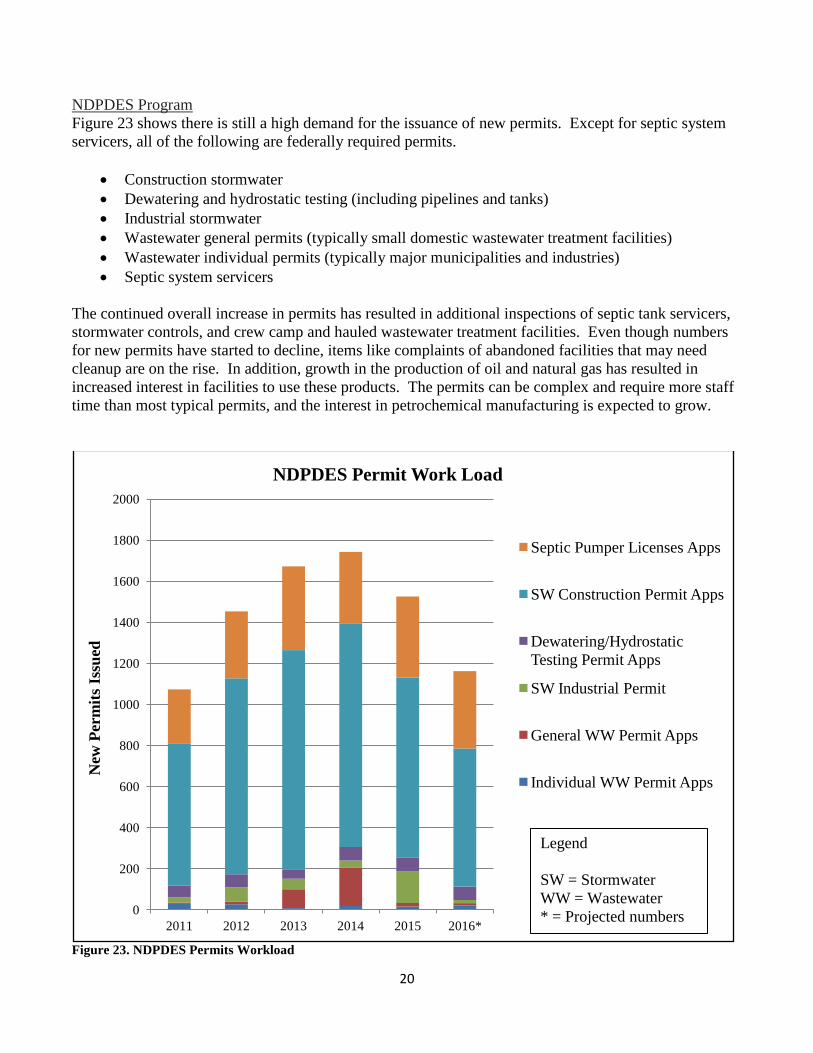
NDPDES Program
Figure 23 shows there is still a high demand for the issuance of new permits. Except for septic system
servicers, all of the following are federally required permits.
Construction stormwater
Dewatering and hydrostatic testing (including pipelines and tanks)
Industrial stormwater
Wastewater general permits (typically small domestic wastewater treatment facilities)
Wastewater individual permits (typically major municipalities and industries)
Septic system servicers
The continued overall increase in permits has resulted in additional inspections of septic tank servicers,
stormwater controls, and crew camp and hauled wastewater treatment facilities. Even though numbers
for new permits have started to decline, items like complaints of abandoned facilities that may need
cleanup are on the rise. In addition, growth in the production of oil and natural gas has resulted in
increased interest in facilities to use these products. The permits can be complex and require more staff
time than most typical permits, and the interest in petrochemical manufacturing is expected to grow.
Figure 23. NDPDES Permits Workload
0
200
400
600
800
1000
1200
1400
1600
1800
2000
2011 2012 2013 2014 2015 2016*
New
Per
mit
s Is
sued
NDPDES Permit Work Load
Septic Pumper Licenses Apps
SW Construction Permit Apps
Dewatering/Hydrostatic
Testing Permit Apps
SW Industrial Permit
General WW Permit Apps
Individual WW Permit Apps
Legend
SW = Stormwater
WW = Wastewater
* = Projected numbers

21
Ground Water Protection Program
The oil boom has significantly increased the water appropriation applications received by the State
Water Commission for review (Figure 24), primarily related to industrial uses of ground water.
Approximately 64 water appropriation permit reviews were completed in 2015, and it is estimated that
100 reviews will be completed in 2016.
Figure 24 also shows significant impact on the Underground Injection Control (UIC) Program. The
number of potential UIC sites (crew camps, oil service companies, vehicle repair businesses, etc.)
continues to increase. In 2015, it was estimated that approximately 325 businesses in western North
Dakota may have Class V wells and therefore require inspection. Available staff was able to inspect
approximately 35 facilities in 2015. In 2016, it is estimated approximately 350 facilities may warrant
inspection. Additional potential UIC sites have yet to be evaluated. The program has responded to
many requests for information about Class I injection wells and is in the process of permitting two Class
I wells. One new Class I well is projected for permitting in 2016. Many proposed oilfield waste
disposal sites are also considering Class I wells, and some facilities are evaluating injection of treated
wastewater as a disposal option.
The number of public water systems in the oilfield has significantly increased, and each system requires
the completion of a Wellhead Protection Area report. This report includes the delineation of the
protection area, completion of a contaminant source inventory and a susceptibility analysis (Figure 25).
In the last year, 32 reports have been prepared, including four reports for new non-community water
systems. It is estimated that 65 reports will be prepared in 2016.
A significant number of calls have come from the public related to sampling of private wells (e.g., how
to sample, where to send samples, what to analyze, perceived impacts to wells, etc.). Workload related
to siting reviews for landfills and facilities, such as confined animal feeding operations (CAFOs), has
increased significantly (Figure 25). Before the oil boom, one or two landfill pre-applications were
received per year. In 2015, two oilfield special waste landfill pre-applications were received and
reviewed by program staff. If the facilities obtain zoning approval, they will move through the
application process requiring review by program staff. It is estimated that approximately 10 landfill and
CAFO siting evaluations will be completed in 2016.
A number of Freedom of Information Act open-records requests (194) were processed by program staff
during 2015 (Figure 24). In 2014, 180 requests were processed. It is anticipated that approximately 239
requests will be processed by program staff in 2016. Due to the past growth in oil and gas production,
North Dakota is known nationwide as a large oil- and gas-producing state, and this has resulted in
increased information requests from across the country. Many of these requests are broad in scope and
take additional staff time to compile.
The Western Ground Water Monitoring Program was implemented in 2013 to evaluate ground water
conditions in selected aquifers within the oil-producing areas of northwestern North Dakota.
Approximately 135 observation wells in 20 aquifers are sampled as part of the Western Program. The
initial round of sampling was completed between fall of 2013 and 2015. Sampling is currently being
conducted on a 1.5-year rotation; approximately 45 wells are sampled each spring and each fall. Based
on the results obtained as the sampling program progresses, wells may be added or deleted from the
sampling program. The Western Program is conducted separately from the Agricultural Ground Water

22
Monitoring Program that was implemented in 1992, and it adds more workload for Ground Water
Protection Program staff.
Figure 24. Ground Water Protection Program Workload (2009-Present)
Figure 25. Ground Water Protection Program Workload (2009-Present)
30
90
125 135
120 120
64
100
12 18 30
112
223
180 194
239
30
56
32
350
300
325 325
350
0
50
100
150
200
250
300
350
400
2009 2010 2011 2012 2013 2014 2015 2016
Nu
mb
er
of
Even
ts
Ground Water Protection Program Workload
Water
Appropriation
Review
Public Inquiry
(Open Record
Requests)
Business
Needing
Evalution -
UIC Class V
0 0 0 1 1 2 2 1 2 4 7
15
8 11
2
10 15
52
75
111
56 62
32
65
0
20
40
60
80
100
120
2009 2010 2011 2012 2013 2014 2015 2016
Nu
mb
er
of
Even
ts
Ground Water Protection Program Workload
Permitting of
UIC Class I
Landfill/Facility
Siting Review
Wellhead
Protection Area
Report
23
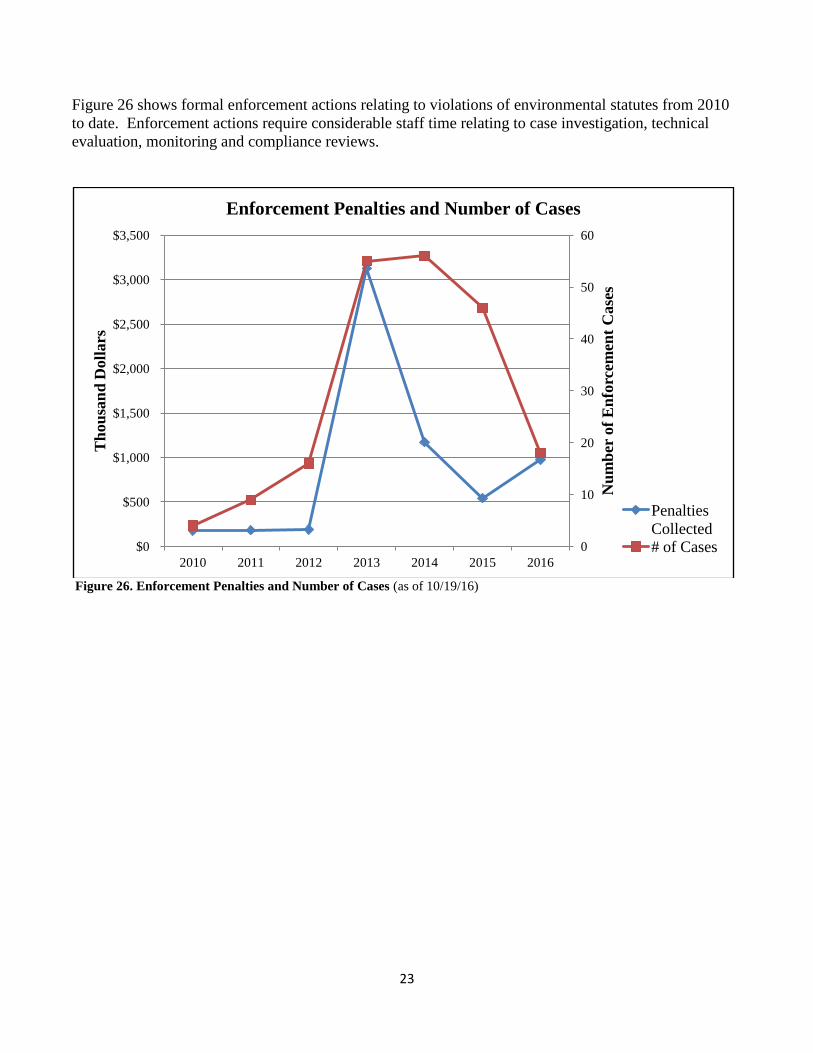
Figure 26 shows formal enforcement actions relating to violations of environmental statutes from 2010
to date. Enforcement actions require considerable staff time relating to case investigation, technical
evaluation, monitoring and compliance reviews.
Figure 26. Enforcement Penalties and Number of Cases (as of 10/19/16)
0
10
20
30
40
50
60
$0
$500
$1,000
$1,500
$2,000
$2,500
$3,000
$3,500
2010 2011 2012 2013 2014 2015 2016
Nu
mb
er o
f E
nfo
rcem
ent
Case
s
Th
ou
san
d D
oll
ars
Enforcement Penalties and Number of Cases
Penalties
Collected # of Cases
24
III. Current Challenges
A. Division of Air Quality
Given the increased level of workload and complexity of the rules and regulations implemented and
enforced, the division will be challenged to maintain its level of regulatory oversight and air quality
monitoring.
B. Division of Laboratory Services
The division will be exploring ways to preserve the capabilities of the laboratory within existing
budgets. Maintenance of instruments and replacement or upgrading of equipment and supplies are
crucial to continued laboratory proficiency.
C. Division of Municipal Facilities The division continues to experience increases in workload due to oilfield development activities. The
increased workload is compounded by implementation of new and revised SDWA and State Revolving
Loan Fund (SRLF) Program requirements; heightened community interest in using the SRLF programs
for financial assistance to address infrastructure needs; and stagnant or reduced federal funding which
impacts the division’s ability to maintain state delegation for its programs. These challenges are not
short-term but long-term.
D. Division of Waste Management
The significant increase in the number of pre-applications and applications for new or expanding
landfills, both municipal solid waste and oilfield special waste, has greatly increased the workload. At
the same time, there is an increased need for inspections at existing facilities and site visits to the new
facility locations, which also takes significant staff time. Responding to illegal dumping and improper
TENORM management incidents has also taken considerable staff time. At current budget levels, the
division intends to address the existing workload with current staff.
E. Division of Water Quality
The Division of Water Quality continues to address both current and past spills to ensure appropriate
cleanup. Continued oversight of ongoing remediation projects will require the retention of existing
trained staff and the training of replacements due to turnover. Current budget level restraints will
necessitate using existing positions. Enforcement actions and field/permitting activities will be
prioritized.

Section
Chief
701.328.5150
L. David Glatt
Assistant
Attorney General
701.328.5151 or
701.328.3640
Margaret (Maggie)
Olson
Laboratory
Services
701.328.6140+
701.328.6272++
Myra Kosse
Air Quality
Division
701.328.5188
Terry O’Clair
Municipal
Facilities
Division
701.328.5211
D. W ayne Kern
Waste
Management
Division
701.328.5166
Scott Radig
Water Quality
Division
701.328.5210
Karl Rockeman
North Dakota Department of HealthEnvironmental Health Section
–Chemistry –Air Quality –Clean Water State –Solid Waste –Special Projects Jim Quarnstrom* Permitting & Revolving Fund Program Coordinator
Compliance David Bergsagel Steven Tillotson* Peter Wax Chemistry QA/QC Jim Semerad & Lab Certification –Drinking Water –Hazardous Waste –Permits Cindy Auen –Air Quality State Revolving & PCB Program Program
Planning Fund Program Curtis Erickson Marty Haroldson Tom Bachman David Bruschwein
–Microbiology –Air Quality –Drinking Water –Underground –Watershed Christie Massen* Monitoring Program Storage Tank & Management Chuck Hyatt Greg Wavra L.U.S.T. Program Program Microbiology QA/QC Carl Ness Michael Ell Heather Sease
–Radiation & –Ground Water Microbiology Indoor Air Protection
Environmental Dale Patrick Program Lab Certification Carl Anderson & FDA Dairy Certification –Spill Investigation Lisa Well Program
Bill Suess
*Assistant Director
+Chemistry Phone #++Microbiology Phone #
September 2016

REV: 12/21/16
North Dakota Department of Health Environmental Health Section Gold Seal Center, 918 East Divide Avenue, Bismarck, ND 58501-1947 Fax Number (701) 328-5200 Website: www.ndhealth.gov/ehs
Information Directory Environmental Health Section Chief’s Office (701) 328-5150
Chief: L. David Glatt
Performance Partnership Agreement & Grants Coordination - Teri Lunde
Information Technology Coordination - Gold Seal Center Campus - Allen Johnson
Lab Campus - Kevin Kosse
Data Management - Gary Haberstroh
Public Communication/Information, Development & Staff Training - Melissa Miller
Legal - Margaret Olson (701) 328-5151
Division of Air Quality (701) 328-5188
Director: Terry O'Clair
Air Quality Permitting & Compliance -
Jim Semerad > Air Quality Permits > Air Quality Inspections > Emission/Stack Testing > Emission Inventory > Open Burning (other than landfills) > Visible Emission/Odor Certification > Oil and Gas Wells > Air Quality Questions and Complaints
Air Quality Planning - Tom Bachman > Dispersion Modeling > State Implementation Planning
Air Quality Monitoring – Chuck Hyatt > Ambient Air Quality Data > Ambient Network Operations
Radiation & Indoor Air Quality - Dale Patrick > Radioactive Materials > Radon > X-Ray Machines > Asbestos > Indoor Air Quality > Mammography Quality Assurance > Lead Paint
Laboratory Services 2635 East Main, P.O. Box 5520, Bismarck, ND 58506-5520, Fax: (701) 328-6280 Director: Myra Kosse Division of Chemistry (701) 328-6140
Assistant Director: Jim Quarnstrom
Quality Assurance/Quality Control: Cindy Auen Analysis of Environmental Samples Environmental Laboratory Certification
Division of Microbiology (701) 328-6272
Assistant Director: Christie Massen
Quality Assurance/Quality Control: Heather Sease Analysis of Clinical Public Health Specimens and Environmental Microbiology Including Laboratory Certification
Environmental Microbiology: Lisa Well
Division of Municipal Facilities (701) 328-5211
(701) 328-6628 (Environmental Training Center) Director: D. Wayne Kern
Clean Water State Revolving Loan Fund
Program - Dave Bergsagel > Clean Water Revolving Loan Fund > Plan Review (wastewater systems)
Drinking Water State Revolving Loan Fund
Program - David Bruschwein > Drinking Water Revolving Loan Fund > Plan Review (water systems)
Drinking Water Program - Greg Wavra > Safe Drinking Water Act > Community Fluoridation Program > Training and Certification of Water &
Wastewater Facility Operators > Inspections of Water & Wastewater Facilities > North Dakota Water & Pollution Control
Conference > Publication of the Official Bulletin
REV: 12/21/16
Division of Waste Management (701) 328-5166
Director: Scott Radig Assistant Director: Steve Tillotson
Solid Waste Program - Steve Tillotson Solid Waste Management: Municipal, Industrial, Special & Inert Waste > Permits, Inspections > Operator Training & Certification > Open Burning (at solid waste facilities) > Transfer Stations Coal Combustion & Offsite Oilfield Waste Land Treatment Scrap Tires & Tire Recycling Waste Reduction, Recycling & Composting Energy Recovery Biomass (waste wood, etc.) Nutrient Management (Ag Processing) Emergency Waste & Debris Management Abandoned & Dangerous Buildings Abandoned Motor Vehicle Projects, Auto Salvage & Scrap Metal Pollution Prevention (P2) Solid Waste Planning
Hazardous Waste Program & Toxic
Substance Control Act - Curt Erickson Hazardous Waste > Permits > Inspections > Corrective Action Superfund > CERCLIS Sites > Emergency Response Emergency Spill Response > Site Assessment > Site Remediation Brownfields Laboratory/Agricultural/Household Chemical
Wastes Polychlorinated Biphenyls (PCBs) Used Oil Infectious Waste Waste Transporter Permits
Underground Storage Tank Program - Carl Ness Underground Storage Tanks (USTs) Leaking Underground Storage Tank (L.U.S.T.) > Petroleum Trust Fund > Hazardous Substances > Assessment, Remediation Above-ground Storage Tanks (ASTs) Antifreeze Registration > Spills, Assessments Petroleum Products Testing > Certification of Biofuels Blender Pump Installation Spill Response
Division of Water Quality (701) 328-5210
Director: Karl Rockeman
Watershed Management - Michael Ell > Water Quality Standards > Nonpoint Source Pollution Management > Rivers and Stream Monitoring and Assessment > Clean Lakes Assessments > Fish Consumption Advisory > Watershed Management > Water Quality Modeling
Water Quality Special Projects - Peter Wax > 404 Dredge & Fill > 401 Water Quality Certification > Environmental Impact Statements
(EIS) Review > Water Quality Standards
Spill Investigation Program - Bill Suess > Spill Response
Wastewater Facility/Permits - Marty Haroldson > North Dakota Pollutant Discharge Elimination
System (NDPDES) Permits > Wastewater Releases > Stormwater Regulations > Feedlot Inspections/Approval/Runoff > Septic Pumpers > Small Business Assistance > Pretreatment
Groundwater Protection Program - Carl
Anderson > Underground Injection Control (UIC) Program > Source Water Protection > Groundwater Remediation and Assessment
OTHER Environmental Information Environmental Health Section
Fargo Office, 1120 28th Ave. N., Suite B, Fargo, ND 58102, (701) 499-5207, Fax (701) 235-7394
Towner Office, 314 Main St. S. #2, Towner, ND 58788, (701) 537-2043, Fax (701) 537-2044
Environmental Hot Line 1-800-755-1625
Environmental Training Center 2639 E. Main Ave., Bismarck, ND 58501, (701) 328-6628, Fax (701) 328-6206
Approvals of Anhydrous Ammonia Facilities - State Ag Dept. (701) 328-2231
Emergency Response Spills - State Radio 1-800-472-2121 (in-state) or (701) 328-9921 (out-of-state)
Oil Field Related Spills - Oil & Gas Division (701) 328-8020
Petroleum Tank Release Compensation Fund (PTRCF) - Jeff Bitz - ND Insurance Dept. (701) 328-9600
SARA Title III - Department of Emergency Services Fraine Barracks, P.O. Box 5511, Bismarck, ND 58506-5511, (701) 328-8100