oilfield services market conditions and trends 2016 · 2018-07-02 · oilfield services market...
TRANSCRIPT

Oilfield Services MarketConditions and Trends 2016Segments: drilling, well maintenance and workover, geophysicsApril 2017

Oilfield services market conditions and trends 2016Segments: drilling, well maintenance and workover, and geophysics
© 2017 ООО «Делойт Консалтинг» 2
0
20
40
60
80
100
120
140
Deloitte, 03.04.2017 World Bank, 24.01.2017
Oil prices remained volatile during 2016. According to experts, the recovery will be a slow, long-term process
Forecast weighted average* oil price
USD/barrel
Source: Deloitte and World Bank forecasts
* The weighted average price is a combination of prices for Brent and WTI crude oil taken with equal weights
2024F2023F2022F2021F2020F2019F2018F2017F2011 20162015201420132012
Highly volatile prices with an outlook for long-term recovery
• Oil prices remained volatile in 2016, with the average price down by 16 percent from 2015
• This volatility has oil and gas companies regularly updating their short- and long-term forecasts for oil prices
• Meanwhile, experts agree that the recovery of oil prices will be slow in the long term. The World Bank does not expect a price of USD 70 per barrel until 2025.
Oilfield services market conditions and trends 2016Segments: drilling, well maintenance and workover, and geophysics
© 2017 ООО «Делойт Консалтинг» 3
9985
360
550
780
61.792.9
396
607600
2016
2015
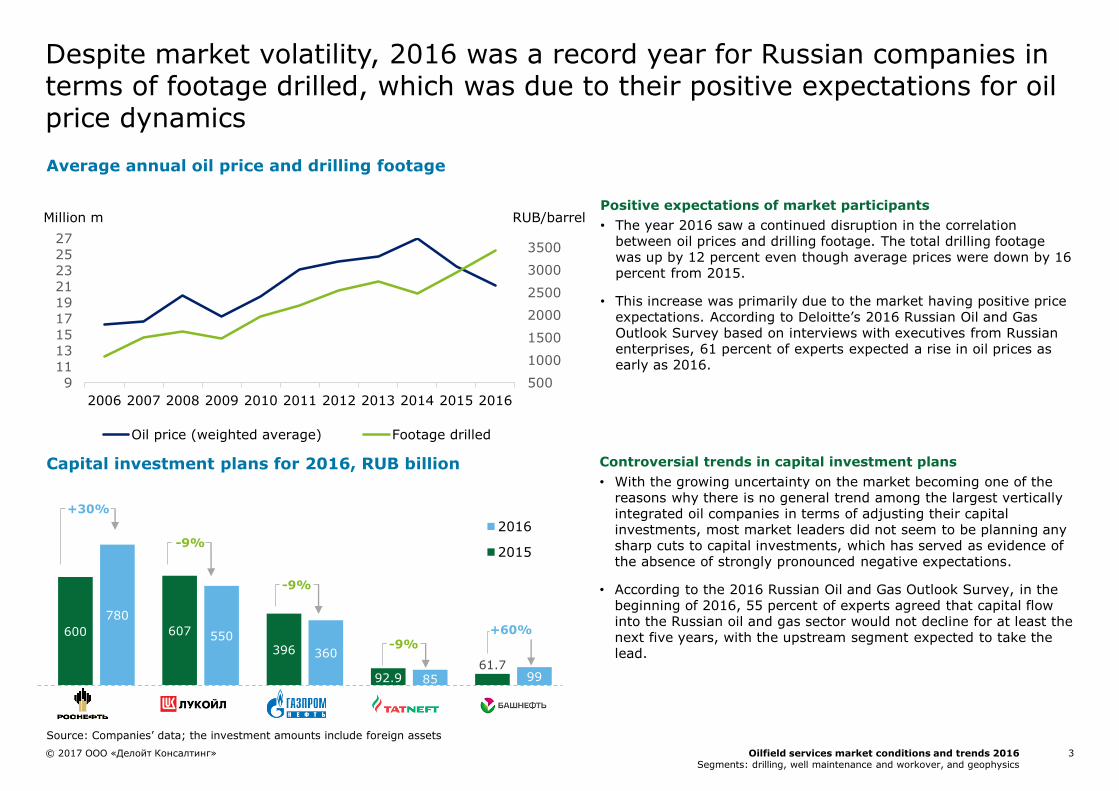
Despite market volatility, 2016 was a record year for Russian companies in terms of footage drilled, which was due to their positive expectations for oil price dynamics
9111315171921232527
2006 2007 2008 2009 2010 2011 2012 2013 2014 2015 2016
500
1000
1500
2000
2500
3000
3500
Oil price (weighted average) Footage drilled
RUB/barrelMillion m
Source: Companies’ data; the investment amounts include foreign assets
-9%
-9%
-9%
Controversial trends in capital investment plans
• With the growing uncertainty on the market becoming one of the reasons why there is no general trend among the largest vertically integrated oil companies in terms of adjusting their capital investments, most market leaders did not seem to be planning any sharp cuts to capital investments, which has served as evidence of the absence of strongly pronounced negative expectations.
• According to the 2016 Russian Oil and Gas Outlook Survey, in the beginning of 2016, 55 percent of experts agreed that capital flow into the Russian oil and gas sector would not decline for at least the next five years, with the upstream segment expected to take the lead.
Average annual oil price and drilling footage
Positive expectations of market participants
• The year 2016 saw a continued disruption in the correlation between oil prices and drilling footage. The total drilling footage was up by 12 percent even though average prices were down by 16 percent from 2015.
• This increase was primarily due to the market having positive price expectations. According to Deloitte’s 2016 Russian Oil and Gas Outlook Survey based on interviews with executives from Russian enterprises, 61 percent of experts expected a rise in oil prices as early as 2016.
Capital investment plans for 2016, RUB billion
+30%
+60%

Oilfield services market conditions and trends 2016Segments: drilling, well maintenance and workover, and geophysics
© 2017 ООО «Делойт Консалтинг» 4
• In 2016, exploration drilling reached 887 thousand m, up by 20 percent (147 thousand m) from 2015.
• Among the companies analyzed, Rosneft has posted a significant growth in exploration drilling. In 2015, Rosneft reduced exploration drilling by 35 percent. However, 2016 saw the company boost this activity by 80 percent. LUKOIL and Bashneft along with mid- and small-size oil producers have also attained an increase in drilling operations.
• A significant reduction in exploration drilling came from RussNeft, Gazprom Neft, Slavneft and Tatneft, which was likely due to the uncertainty on the market and the suspended participation in anexpensive exploration project.
5.8 5.06.7
9.1
4.94.1
4.3
4.53.6
3.82.8
2.52.9
2.72.9
2.5
1.71.6
2.3
2.6
2013 2014 2015 2016
Other
Bashneft*
RussNeft
Tatneft
Slavneft
Gazprom neft
LUKOIL
Surgutneftegaz
Rosneft
+13% +12%-7%
0.15 0.17 0.110.20
0.22 0.200.21
0.20
0.20 0.23
0.17
0.18
0.09
0.11 0.08
0.11
0.16
2013 2014 2015 2016
The overall optimism on the market has resulted in production drilling and exploration drilling increasing by 12 percent and 20 percent, respectively
Source: “Oil and Gas Vertical” journal, CDU TEK, company data Source: “Oil and Gas Vertical” journal, CDU TEK, company data
+1%
0.820.74
0.82
-10% +20%
Exploration drilling, million m
24.6
21.9
19.420.8 0.89
• Overall exploration drilling in 2016 was up by 12 percent to 24.6 million m, from 21.9 million m in 2015.
• This increase in production drilling was seen for most oil majors, particularly for Rosneft where the number went up by 36 percent.
• While RussNeft and Slavneft have also enjoyed a rise in drilling rates, their impact on the overall drilling performance is not so notable due to their small market share. Surgutneftegaz, Bashneft, Tatneft along with small and medium size oil producers have also contributed to this positive dynamic in drilling.
• LUKOIL and Gazprom Neft are among the companies that have reduced their drilling operations.
Production drilling, million m
Note: * Bashneft is presented separately from Rosneft to enable comparisons between periods.

Oilfield services market conditions and trends 2016Segments: drilling, well maintenance and workover, and geophysics
© 2017 ООО «Делойт Консалтинг» 5
4.43.4
4.56.0
4.6
3.8
3.9
4.1
2.7
2.81.9
1.7
2.4
1.5 1.2
0.9
1.5
1.31.7
1.6
2013 2014 2015 2016
Others
Bashneft
RussNeft
Tatneft
Slavneft
Gazprom neft
LUKOIL
Surgutneftegaz
Rosneft 1.4 1.62.2
3.10.4 0.3
0.4
0.4
0.9 1.0
0.9
0.7
0.5
1.3
1.61.6
0.8
0.9
1.0
1.2
0.3
0.4
0.6
1.0
2013 2014 2015 2016
Even though horizontal drilling still remains a driver for footage drilled it has continued to decrease, the growth rate moderated to 19 percent in 2016 from 33 percent in 2014
Directional drilling, million m
16.6
5.8
7.4
Source: “Oil and Gas Vertical” journal, CDU TEK, company dataSource: “Oil and Gas Vertical” journal, CDU TEK, company data
14.614.0
4.3
+33%
Horizontal drilling, million m
15.9
-16% +4% +9%
8.8
+27% +19%
• In 2016, directional drilling accounted for 15.9 million m, reaching the pre-crisis level of 2013 and posting a growth of 9 percent from 2015.
• Rosneft accounts for a major portion of this growth, with a 33 percent increase. Surgutneftegaz saw a 5 percent increase. Meanwhile, LUKOIL, Gazprom Neft along with small- and medium-size oil companies in the aggregate had reductions in their directional drilling activities.
• In 2016, the market continued the trend from 2014, with most key players continuing to ramp up horizontal drilling. Even though this type of drilling still remains a driver in footage drilled the growth rate moderated to 19 percent in 2016 from 33 percent in 2014
• With a growth of 41 percent in horizontal drilling, Rosneft has made a major contribution to the total increase. Bashneft, RussNeft and Slavneft along with small- and medium-size oil companies in the aggregate have also posted a growth, compared to the previous year. At the same time, LUKOIL and Surgutneftegaz have reduced their horizontal drilling footage considerably.

Oilfield services market conditions and trends 2016Segments: drilling, well maintenance and workover, and geophysics
© 2017 ООО «Делойт Консалтинг» 6
1.7%
4.5% 5.0% 5.8%3.4%
3.8%1.9% 0.9%
2013 2014 2015 2016
Far East
Caucasus and
Southern Federal
District
Western Siberia remains a leader in drilling volumes; however, the share of other regions has grown considerably over 2014-2016
Production drilling by region
84.2% 79.1% 77.9% 81.0%
10.0% 12.2% 14.2% 11.3%
5.8% 8.7% 7.9% 7.7%
2013 2014 2015 2016
Other regions
Volga District
Western Siberia65.5%
56.3% 52.2% 52.7%
24.5%27.8% 30.4% 28.6%
10.0% 15.9% 17.4% 18.8%
2013 2014 2015 2016
3.4% 5.8%
13.5% 12.9%5.3%6.3%
2.7% 2.5%
2013 2014 2015 2016
Source: “Oil and Gas Vertical” journal, CDU TEK, Deloitte analysisSource: “Oil and Gas Vertical” journal, CDU TEK, Deloitte analysis
Exploration drilling by region
• Western Siberia is still Russia’s main oil region accounting for 81 percent of footage in production drilling. Stable growth in production drilling has been continuously observed in Eastern Siberia; the period 2013-2016 saw a triple growth in footage. In 2016, this growth accounted for 5.8 percent of the overall production drilling in Russia. At the same time, the Timan-Pechora Region experienced a reduction demonstrating 0.9 percent in 2016 from 3.8 percent in 2014.
• With 52.7 percent of the overall exploration drilling, Western Siberia continues as an exploration drilling leader. Drilling in Eastern Siberia grew from 3.4 percent in 2013 to 12.9 percent in 2016.
20.8 million m
19.4 million m
21.9 million m
0.82 million m
0.82 million m
0.74 million m
24.6 million m
0.89 million m

Oilfield services market conditions and trends 2016Segments: drilling, well maintenance and workover, and geophysics
© 2017 ООО «Делойт Консалтинг» 7
28%21% 19%
21%
20%18%
14%
15% 18%
28%33% 37%
2014 2015 2016
Other
KAToil-Drilling
Targin
Targas
Eriell
RN-Drilling
Surgutneftegaz
EDC 25%30%
36%
21%20%
18%
20% 13%10%
14%13% 10%
6%6% 7%
8% 11% 11%
2014 2015 2016
Other
RussNeft
Bashneft
Tatneft
Slavneft
LUKOIL
Gazprom neft
Surgutneftegaz
Rosneft
Source: Deloitte estimates, company data Source: CDU TEK
Rosneft has also seen a growth in in-house drilling due to the acquisition of Targin, a company that accounts for a significant portion of services provided for Bashneft (acquired by Rosneft earlier)
Supply on the drilling market (based on footage drilled)
Demand on the drilling market (based on footage drilled)
• Rosneft, Surgutneftegaz, Gazprom Neft and LUKOIL, Russia’s four largest oil companies, continue to contribute to more than 70 percent of the demand on the drilling market.
• As for the supply side, according to estimates by Deloitte, EDC remains the only large independent drilling provider on the drilling market. However, its market share experienced a reduction to 19 percent in 2016, from 28 percent in 2014.
• In 2016, one of the most notable effects on the structure of the oil service market was the acquisition by Rosneft of a controlling stake in Bashneft and 100 percent stake in Targin, an oilfield service provider accounting for more than 70 percent of the drilling services provided for Bashneft, a company acquired by Rosneft earlier.
• As a result, Rosneft has expanded the drilling equipment assets by 19 percent. With this, the share of in-house drilling services is expected to grow to 60 percent.

Oilfield services market conditions and trends 2016Segments: drilling, well maintenance and workover, and geophysics
© 2017 ООО «Делойт Консалтинг» 8
12.2 10.6 11.9
9.18.5
9.1
7.78.4
8.8
3.2 3.84.3
8.22.1
2.6
2014 2015 2016
Other
RussNeft
Slavneft
Gazprom neft
Bashneft
Tatneft
Surgutneftegaz
LUKOIL
Rosneft37.0 40.4 45.6
28.830.8
32.2
16.116.3
18.5
17.5 6.6
5.9
2014 2015 2016
45.7
+10%
109.1
122.1
+12%
43.2
39.4
-14%
115.9
-6%
The rise in expenses for well maintenance and workover is due to the desire to increase oil recovery at existing oil deposits
Well maintenance costs, billion RUB
Source: CDU TEKSource: CDU TEK
Workover costs, billion RUB
• In 2016, total maintenance costs increased by 10 percent for well maintenance services and by 12 percent for workover services, compared to 2015. However, given the reduction in these costs in 2015 this increase is not so significant if compared to 2014. As for well maintenance services in 2016, this figure remains lower than in 2014 while workover services saw a rather modest rise of 5 percent from 2014.
• The growth in service costs was driven by: A growth in the number and complexity of wells (horizontal wells and horizontal sidetrack wellbores) due to changing production conditions The aging of well stock, including a growth in water cuts An increase in the technical complexity of certain workover processes
• The well maintenance and workover segments are characterised by a high concentration of demand, with only three companies Rosneft, LUKOIL and Surgutneftegaz accounting for 70 to 80 percent of the overall demand.
• Following the acquisition of Targin, the number of maintenance and workover teams at Rosneft has increased by 30 percent, with the share of in-house maintenance services expected to increase to 40 percent.

Oilfield services market conditions and trends 2016Segments: drilling, well maintenance and workover, and geophysics
© 2017 ООО «Делойт Консалтинг» 9
1.1% 1.8% 2.0%
3.7%3.2%
4.8%1.1% 0.9%
1.0%1.4% 1.3%
1.5%
2014 2015 2016
Far East
Caucasus and
Southern Federal
District
Western Siberia is losing its share in well maintenance and workover costs. In 2015-2016, investment in maintenance in the Volga District and Eastern Siberia grew considerably
Well maintenance distribution by region
58.1%48.8% 46.1%
34.7%44.0% 44.5%
7.3% 7.2% 9.4%
2014 2015 2016
Other regions
Volga District
Western Siberia
43.4% 37.7% 35.6%
51.7% 54.4% 56.5%
4.9% 8.0% 7.9%
2014 2015 2016
2.8% 3.2% 4.1%
0.5%2.6% 1.2%
2014 2015 2016
Source: CDU TEK, * Deloitte analysisSource: CDU TEK, Deloitte analysis
Workover distribution by region
• The distribution of well maintenance services by region has changed significantly over the past two years.
• In 2014 Western Siberia was the leading spender in this segment. However, in 2015 Western Siberia significantly decreased its share in favor of the Volga District and the Timan-Pechora Region. This trend continued into 2016, with Western Siberia seeing its share decline from 58 percent to 46 percent by the year end, which is down by 12 percent from 2014. At the same time, the Volga District and the Timan-Pechora Region saw their total share increase by almost 8 percent. The distribution of other regions by aggregate well maintenance costs changed insignificantly.
• The regional structure of workover costs has also changed notably over past two years, but not as much as in the case of well maintenance spending. The Volga District saw its share in the regional structure of workover costs increase by 5 percent while the share of Western Siberia decreased by about 8 percent. The shares of the Caucasus, Timan-Pechora and Eastern Siberia in the investment in workover increased insignificantly.
RUB 45.7 billion RUB 39.4 billion RUB 115.9 billion RUB 109.1 billionRUB 43.2 billion RUB 122.1 billion

Oilfield services market conditions and trends 2016Segments: drilling, well maintenance and workover, and geophysics
© 2017 ООО «Делойт Консалтинг» 10
147.5 156.1 144.6
98.853.4 57.5
2014 2015 2016
Offshore exploration
Onshore exploration
The slump in oil prices in 2015 triggered a decrease in geophysical survey spending by the government and investors, and there was also a reduction in geophysical costs as part of offshore projects
Geophysical survey spending dynamics in the mining and oil and gas industries,
RUB billion
Offshore exploration reduction
• In 2015, exploration costs saw a significant decrease due to cost reductions on offshore projects down by 46 percent from 2014.
• This was primarily driven by offshore projects put on hold as oil prices went down. These were suspended for less expensive projects with more quickly achievable results.
• In 2016, exploration investment continued to shrink, with overall exploration spending down by 4 percent compared to 2015 as a result of the reduction in onshore exploration.
56.2 59.6 63.0
7.5 5.46.9
16.8 4.73.9
2014 2015 2016
Other sources of
finance*
Federal budget
Equity capital
-14%
81 70
Source: The Federal Agency on Subsoil Usage; Deloitte analysis
Source: The Federal Agency on Subsoil Usage; Deloitte analysis
Geophysical survey costs
• In 2016, geophysical services (Geographic Information System (GIS) and seismic survey) reached RUB 74 billion, up by 6 percent from 2015 and down by 9 percent from 2014.
• Economic sanctions still remain a constraint on the inflow of capital.
• Reduction of governmental expenses has resulted from the expected reduction of the federal budget due to budget saving measures.
• Investment is expected to stabilise in 2017.
* Regional budgets of the Russian Federation, credits, funds received from Russian and foreign investors
246
210
-15%
Territorial structure of the exploration market in the oil and gas industry, RUB billion
74
202
-4%
Note: Costs are exclusive of VAT
+6%

Oilfield services market conditions and trends 2016Segments: drilling, well maintenance and workover, and geophysics
© 2017 ООО «Делойт Консалтинг» 11
34.4 33.322.4
35.9
6.210.0
73.1
90.2
42.449.6
2013 2014 2015 2016**
Other
Slavneft
Novatek
Surgutneftegaz
Bashneft
Gazprom
LUKOIL
Rosneft
In 2015, the seismic exploration market saw a significant slowdown
Seismic exploration 2D*, line km
Source: Company reports, the Federal Agency for Mineral ResourcesSource: Company reports, the Federal Agency for Mineral Resources
• In 2015, the seismic exploration market saw a significant slowdown, with 2D seismic services down by 44 % and 3D seismic services down by 22 percent.
• With a 40 percent share of the seismic segment in 2016, Rosneft is the key demand booster on the 2D seismic exploration market.
112
143
-44%
80
10.9
21.9
7.211.2
7.8
6.5
6.1
13.3
12.6
20.0
28.9 8.7
4.2
37.8
2013 2014 2015 2016**
68
57
44
-22%
Seismic exploration 3D*, sq. km
90
50
+28% +13%-17% +14%
* - The market data includes oil and gas as well as mining industries** - As regards the data for 2016, Rosneft and Surgutneftegaz are the only companies shown separately. Other companies are included in “Other” due to unavailable data.

Oilfield services market conditions and trends 2016Segments: drilling, well maintenance and workover, and geophysics
© 2017 ООО «Делойт Консалтинг» 12
Trends in the Russian oilfield services market
Source: 2016 Oil and Gas Outlook Survey, company data, Deloitte analysis
Oilfield Services market
•Key players continuing to keep their market positions•Changes in the regional demand structure•Focus on higher efficiency•Increasing use of inter-nal sources of funding
Internal obstacles
• Lack of skilled labour
• High worn-out state of production and fixed assets
Customer pressure• Expectations required
for continuous quality enhancement and cost optimisation
Positive trends
•Growth in oil production
•Growth in drilling, well maintenance and workover services•Increase of demand for local services
Macroeconomic factors• Volatile oil prices• Continuing economic sanctions, including limited ability in
adopting or purchasing new technology or knowledge and limited access to external capital

deloitte.ru
About Deloitte
Deloitte refers to one or more of Deloitte Touche Tohmatsu Limited, a UK private company limited by guarantee (“DTTL”), its network of member firms, and their related entities. DTTL and each of its member firms are legally separate and independent entities. DTTL (also referred to as “Deloitte Global”) does not provide services to clients. Please see www.deloitte.com/about for a detailed description of DTTL and its member firms.
Deloitte provides audit, consulting, financial advisory, risk management, tax and related services to public and private clientsspanning multiple industries. Deloitte is a globally connected network of member firms which, according to Fortune, comprises 400 of the largest 500 companies in the world among its clients. With a globally connected network of member firms in more than 150 countries and territories, Deloitte brings world-class capabilities and high-quality service to clients, delivering the insights they need to address their most complex business challenges. Deloitte's more than 244,000 professionals are committed to becoming the standard of excellence. To learn more about Deloitte, please visit us at:Facebook, LinkedIn or Twitter.
This communication contains general information only, and none of Deloitte Touche Tohmatsu Limited, its member firms, or its and their affiliates (the “Deloitte Network”), are, by means of this publication, rendering any professional advice or services. Before taking any decision or action that may impact your situation or financial position, please make sure to consult a professional advisor. No entity in the Deloitte Network shall be responsible for any loss whatsoever sustained by any person who relies on this publication.
© 2017 OOO Deloitte Consulting All rights reserved