oklahoma department of career and technology...
TRANSCRIPT
OKLAHOMA DEPARTMENT OF CAREER AND TECHNOLOGY EDUCATION
EXISTING INDUSTRY TRAINING PROGRAM: ECONOMIC IMPACT,
RETURN ON INVESTMENT, AND CUSTOMER SATISFACTION
By
ERICK JAMES REYNOLDS
Bachelor of Science in Education Oklahoma State University
Stillwater, Oklahoma 1989
Master of Science in Education
Oklahoma State University Stillwater, Oklahoma
1994
Submitted to the Faculty of the Graduate College of
Oklahoma State University in partial fulfillment of
the requirements for the degree of
DOCTOR OF EDUCATION July, 2005
ii
OKLAHOMA DEPARTMENT OF CAREER AND TECHNICAL EDUCATION
EXISTING INDUSTRY TRAINING PROGRAM: ECONOMIC IMPACT,
RETURN INVESTMENT, AND CUSTOMER SATISFACTION
Thesis Approved:
Dr. Lynna Ausburn Thesis Adviser
Dr. Margaret Scott
Dr. May Jo Self
Dr. Kenneth Stern
Dr. A. Gordon Emslie Dean of the Graduate College
iii
ACKNOWLEDGMENTS
The researcher wishes to thank, Dr. Margaret Scott, Dr. Mary Jo Crawford Self,
and Dr. Kenneth Stern. Their input and support allowed the candidate to successfully
navigate and complete this doctoral program. A special thank you is given to Dr. A.
Lynna Ausburn for her unwavering support and dedication to this project. Her attention
to detail, experience with the process, and availability is greatly appreciated.
The researcher wishes to thank ODCTE personnel, especially Mr. Ken Yowell ,
Mr. Brady McCullough, and Mr. Bruce DeMuth, for their support of this project.
Doc and Jim Mac, THANKS!! You have been my mentors and more importantly
my friends. I know sometimes that has been a challenge!!!
To the Wheeler family I want to say THANKS!! You have lived this process
with us the last 5 years. The blood in our veins may not be the same, but you are as
family as family can be. I love you guys!!!
Thanks to Dr. John Bedenbender. I would not have had an opportunity to pursue
my education if it were not for your support and flexibility many years ago.
A special thank you goes to Stephanie, Anton, and Michelle. I hope you know
that all the miles driven and sleep lost is because of my love for you. Always work hard
and treat people right, even when it might cost you personally.
To my mom and dad, Norman and Marilyn Reynolds, I thank you for your
support and belief in me through the years. Dad, this doctorate is dedicated to you. I
know that you always wanted to get yours and life got in the way. Thanks!!
iv
To Randy and Sari, Bryan, Amy, Rachel, Trey and Jace, thanks for your support,
love and friendship through the years. I miss you lots!! I look forward to a time when I
can see you on a more regular basis.
And last, but certainly not least, to my wife Anita. I love you. I do not deserve
you. I am thankful for all of the good times we have spent together. I will try to slow
down a little now and spend more quality time with you!!!! You are the finest school
administrator that I have ever had the privilege of knowing. Thank you, Dr. Reynolds!!
v
TABLE OF CONTENTS
Chapter Page
I. INTRODUCTION . . . . . . . 1
Statement of the Problem . . . . . 5 Purpose of the Study . . . . . . 6 Research Questions . . . . . . 6 Assumptions and Limitations of the Study . . . 7 Operational Definitions . . . . . 8 The Researcher in Context . . . . . 9
Significance of the Study . . . . . 10
II. REVIEW OF THE LITERATURE . . . . . 12
Introduction . . . . . . . 12 Kirkpatrick’s Model and ROI . . . . . 13 Increased Emphasis on ROI: Reasons and Examples . 17
Intangibles of Return on Investment (ROI) . . . 21 Barriers to ROI . . . . . . 24 Costs and Time . . . . 25
Fear and Misunderstanding . . . . 26 Inadequate Data and Measuring System . . 27 Lack of ROI Process Skills . . . . 28 ROI Procedures and Calculations . . . . 32 ROI Procedures . . . . . 32 ROI Calculation Formula . . . . 35
What to Include in Costs & Benefits in ROI Calculation 37 Value and Benefits of ROI . . . . . 39 Customer Satisfaction . . . . . . 41 Focus Groups . . . . . . . 43 Summary . . . . . . . 50
III. RESEARCH METHODOLOGY . . . . . 52
Purpose of the Study . . . . . . 52
Research Questions . . . . . . 52 Design . . . . . . . . 54 Population and Sample . . . . . 55 Data Sources and Instrumentation . . . . 72 Archived Data from ODCTE . . . . 72 Questionnaire . . . . . . 72
vi
Chapter Page
Focus Group . . . . . . 75 Procedures . . . . . . . 75
Archived Data from ODCTE . . . . 75 Questionnaire . . . . . . 76 Focus Group . . . . . . 77
Data Analysis . . . . . . . 79
IV. FINDINGS . . . . . . . . 80
Data Collection . . . . . . 80 Data Analysis . . . . . . . 80 Focus Group . . . . . . . 101
V. CONCLUSIONS, RECOMMENDATIONS, AND SUMMARY . 110 Conclusions . . . . . . . 112 Recommendations . . . . . . 116 Summary . . . . . . . 117 REFERENCES. . . . . . . . . 120 APPENDICES . . . . . . . . 128
APPENDIX A – SURVEY QUESTIONNAIRE . . . 129
APPENDIX B - RAW DATA EXAMPLE-ODCTE . . . 134
APPENDIX C – FOCUS GROUP TRANSCRIPT . . . 136
APPENDIX D – RESPONSES TO OPEN-ENDED QUESTIONS . 160
APPENDIX E – IRB APPROVAL FORM . . . . 175
vii
LIST OF TABLES
Table Page
I. Oklahoma Businesses that Participated in Existing Industry Training 2000-2004 . . . . . . . . 56
II. Major Training Topics Undertaken in the Population: Existing Industry
Training Program 2000-2004 . . . . . . 65 III. Population and Sample: Oklahoma Businesses Participating in Existing
Industry Training 2000-2004 . . . . . . 66 IV. Population vs. Sample: Number of Classes/Training Invoiced in Existing
Industry Training Program 2000-2004 . . . . 68 V. Population vs. Sample: Number of Businesses in Urban and Rural
Areas 2000-2004 69 VI. Population vs. Sample: Number of Small, Medium, and Large Oklahoma Existing Industry Businesses-2004 . . . 71 VII. New Employees Hired, Average Wage for New Employees, and Number of New Employees Still Employed Today . . . 81 VIII. Ratings (on a 5-point scale) for All Five Customer Satisfaction Questions Found in Survey Questionnaire . . . . . 84 IX. Summary of Responses by Category for Questions 6-10 . . . 85 X. Frequencies of Business Demographic Variables in Sample (n=59) . 86 XI. Cross-Tabulation: Frequency of Satisfaction Ratings for Local Technology Center Staff During Training Program x Community Size of Business . . . . . . . 88 XII. Cross-Tabulation: Frequency of Satisfaction Ratings for Timeliness of
Response by Local Technology Center Staff Upon Initial Request For Training x Community Size of Business . . . . 89
XIII. Cross-Tabulation: Frequency of Satisfaction Ratings for Communication Between Your Business and the Local Technology Center Staff x Community Size of Business . . . . . 90
viii
Table Page XIV. Cross-Tabulation: Frequency of Satisfaction Ratings for Handling of Problems (if applicable) by the Local Technology Center Staff x Community Size of Business . . . . . . 90 XV. Cross-Tabulation: Frequency of Satisfaction Ratings for Overall Experience with the Existing Industry Training Program x Community Size of Business . . . . . . 91 XVI. Cross-Tabulation: Frequency of Satisfaction Ratings for Local Technology Center Staff During Training Program x Number of Employees . . . . . . . . 92 XVII. Cross-Tabulation: Frequency of Satisfaction Ratings for Timeliness of Response by Local Technology Center Staff Upon Initial Request for Training x Number of Employees . . . . . 93 XVIII. Cross-Tabulation: Frequency of Satisfaction Ratings for Communication Between Your Business and the Local Technology Center Staff x Number of Employees . . . . . . 93 XIX. Cross-Tabulation: Frequency of Satisfaction Ratings for Handling of Problems (if applicable) by the Local Technology Center Staff x Number of Employees . . . . . . 94 XX. Cross-Tabulation: Frequency of Satisfaction Ratings for Overall Experience with Existing Industry Training Program x Number of Employees . . . . . . . . 95 XXI. Cross-Tabulation: Frequency of Satisfaction Ratings for Local Technology Center Staff During Training Program x Gross Sales (Previous Year) . . . . . . . 95 XXII. Cross-Tabulation: Frequency of Satisfaction Ratings for Timeliness of Response by Local Technology Center Staff Upon Initial Request for Training x Gross Sales (Previous Year) . . . . 96 XXIII. Cross-Tabulation: Frequency of Satisfaction Ratings for Communication Between Your Business and the Local Technology Center Staff x Gross Sales (Previous Year) . . . . . . 97 XXIV. Cross-Tabulation: Frequency of Satisfaction Ratings for Handling of Problems (if applicable) By the Local Technology Center Staff x Gross Sales (Previous Year) . . . . . . 97
ix
Table Page XXV. Cross-Tabulation: Frequency of Satisfaction Ratings for Overall Experience with Existing Industry Training Program x Gross Sales (Previous Year) . . . . . . . 98
XXVI. Mean Satisfaction Ratings of Businesses (n=59) on Aspects of Existing Industry Training Program . . . . . . 99
1
CHAPTER I
INTRODUCTION
Oklahoma businesses face myriad challenges in today’s economy.
One of the greatest of these challenges is the need to maintain a well-trained workforce.
The longevity of a well-trained workforce is a serious concern for all business managers
and owners. According to the Southport Institute, a conservative adult education think
tank located in Washington, D.C., less than five percent of all small businesses in the
U.S. provide any training at all for their employees. This reality, combined with the fact
that 57 percent of the workforce is in small businesses, creates a real dilemma as to how
to re-train the American workforce (Presley, 1995). Regular turnover of staffing causes
Oklahoma businesses to spend already tight resources to continually train and re-train
new employees. It is the mission of the Oklahoma career technology center system to
assist in providing the needed training and re-training of staff for Oklahoma businesses.
This study examined the “business of education” as it relates to the training
conducted for Oklahoma businesses by the Oklahoma Department of Career and
Technology Education (ODCTE). This training is provided through the Existing Industry
Training program conducted in the Oklahoma technology centers throughout the state.
This is the only facet of training conducted by ODCTE that is looked at in this research
study.
The Oklahoma Department of Career and Technology Education (ODCTE)
described the state’s technology center system as follows:
2
The foundation for Oklahoma's statewide network of 29 technology center
districts, operating a total of 54 campuses statewide, was laid in 1966
when Oklahoma voters approved a constitutional amendment allowing the
establishment of what were then called area vocational-technical schools.
Oklahoma's technology centers serve full-time students, both high school
pupils and adult learners. Also, district residents, usually adults, flock to
the centers to learn new skills or enhance existing ones in popular short-
term courses. While high school students attend tuition-free, adult students
are charged nominal tuition to offset costs. Students are frequently able to
earn credit hours for their studies from local colleges. In FY02, more than
14,000 high school students enrolled in Oklahoma's technology centers.
Most attend approximately three hours per day, either in the morning or
the afternoon. Due to increased graduation requirements, centers are
adapting schedules and pursuing other avenues to provide students with
the flexibility they need to attend. The centers also serve more than 11,000
full-time adult enrollments. In FY03, enrollment in the CareerTech
system's business and industry training programs offered by Oklahoma's
technology centers totaled more than 315,000. These programs are
primarily in three different categories: industry-specific and existing
industry, adult and career development, and the Training for Industry
Program (TIP) (ODCTE, 2005).
One program conducted by the CareerTech technology centers in support of
Oklahoma business is the Existing Industry Training Program. Existing industry training
programs are customized to fit the needs of businesses or industries already located in
3
Oklahoma. They can be offered either at a technology center or on site at a business or
industry. The programs prepare employees to operate new equipment or emerging
technology or to meet the changing demographics of the workforce. Training can range
from three hours to several hundred hours. One particularly successful program in this
arena is safety training. Results of this training have been impressive in dramatically
reducing workplace injuries, and as a result, saving millions of dollars in workers'
compensation premiums for Oklahoma companies (ODCTE, 2005).
The Existing Industry Training program has been marketed and described by the
ODCTE (2000) as follows:
Existing industries are the cornerstone of Oklahoma’s economy.
That’s why we’re committed to helping you make sure your
existing employees are up-to-speed on the latest technologies and
processes. Intended to serve companies that bring new dollars into
the state (for example, manufacturers, distribution centers and
business service centers), the Existing Industry Training program
provides customized training and services at little or no cost to the
company. The program can be used for upgrade training for your
existing workforce when you install new equipment, processes,
technology, computerized manufacturing applications and/or
training for new product lines. It can also be used for supervisory
training.
This program is not to be confused with the ODCTE’s Training for Industry
Program (TIP). The TIP program is similar to the Existing Industry Training program in
that it is related to new job creation. However, the TIP program is available to businesses
4
that are new to the State of Oklahoma versus those businesses that already reside in the
state (ODCTE, 2000).
Despite its history of service to Oklahoma business, the Existing Industry
Training program has not been subjected to systematic economic impact analysis or to a
study of its return on investment (ROI). ROI is a relatively new form of analysis that is
currently an important component in the evaluation of training programs.
Economic impact means many different things to individuals and organizations.
Merriam Webster (2005) defined “economic” as “of, relating to, or based on the
production, distribution, and consumption of goods and services” (p.12) and “impact” as,
“impinge on,” “strike forcefully,” and “cause to strike forcefully” (p. 14). Vogelsong,
Graefe, and Estes (2001) stated that economic impact studies provide information on the
amount and nature of spending generated by an agency/organization, facility, program, or
event and are completed for a variety of purposes. To continue with this line of thinking,
it was the intention of this researcher to describe the way in which the CareerTech
technology centers have impacted the economies of those locales in which they are
located through the use of the Existing Industry Training program.
Return on Investment (ROI) refers to knowing what one is getting in return for an
investment of money, time, and other resources. In the workplace learning and
performance field, ROI means calculating the return on the training or HRD investments
(ASTD, 2002). Return on investment is often hard to measure but still worthy of review.
Staples (2003) discussed this situation:
The problem is, while billions are being poured into professional
education, the human-resource or training execs who typically oversee the
expenditure have few tools to prove, measurably and unequivocally, that
5
this nebulous thing called learning has stuck. “The goal, ultimately, is to
quantify how much a company’s investment in people boosts the bottom
line,” says Allan Bailey, CEO of Learning Designs Online, a training
consulting form based in Mississauga, Ont. “It’s all coming from a
heightened awareness of the need to monitor more closely what [trainers]
are doing, and how they’re doing it” (p. 123).
Statement of the Problem
Oklahoma career technology centers tout themselves as being the “economic
development” wing of Oklahoma education. One particular program within the
Oklahoma system having an economic mission is the Existing Industry Training program.
Despite its avowed economic focus, currently a lack of empirical data existing to
demonstrate a positive return on investment, economic impact, and customer satisfaction
from training conducted under this program for by the Career Technology (CareerTech)
system. In the current state and national economic climate, accountability is a huge
concern for all who are involved in education. The taxpayers demand accountability, and
legislation such as No Child Left Behind reinforces the need for education to demonstrate
successful outcomes. Oklahoma legislators and others continue to question the way the
Oklahoma CareerTech system spends its substantial allotted appropriations. While this
study did not look at the CareerTech system as a whole, it did specifically examine (1)
the Existing Industry Training program and how it has impacted Oklahoma economically
since its inception and (2) how satisfied Oklahoma businesses are with its services. As a
system, the CareerTech technology centers believe they produce good results for
Oklahoma business. However, this is really an assumption due to a lack of empirical data
to support this conclusion. In conducting this study, it was the position of this researcher
6
that the CareerTech technology center system could be strengthened substantially if this
belief could be validated empirically.
Purpose of the Study
The purpose of this study was to describe the return on investment (ROI), the
economic impact, and the customer satisfaction with training completed (for Oklahoma
businesses and individual Oklahomans) under the Existing Industry Training program by
CareerTech technology centers. Companies that invest more heavily in workplace
learning are generally more successful, more profitable and more highly valued on Wall
Street (Densford, 1999). This study examined the effects of investment in workplace
learning in Oklahoma by describing and making public return on investment, economic
impact, and customer satisfaction data relating to training completed for business and
industry clientele and full-time program completers at Oklahoma CareerTech centers.
Specifically, this study sought to:
1. Identify and measure the economic impact and return on investment (ROI) of
training completed within the context of the Existing Industry Training program (for
Oklahoma businesses)by Oklahoma technology centers.
2. Describe the customer satisfaction of those served by the Existing Industry
Training program provided by the Oklahoma technology center districts.
Research Questions
This study was guided by four research questions:
1. What is the economic impact and return on investment (ROI) of training
completed within the context of the Existing Industry Training program (for Oklahoma
businesses) by Oklahoma career technology centers?
7
2. What is the general level of customer satisfaction with training conducted in
the context of the Existing Industry Training program by Oklahoma career technology
centers for selected Oklahoma businesses?
3. Are there differences in the level of customer satisfaction with training
conducted in the context of the Existing Industry Training program by Oklahoma career
technology centers for selected Oklahoma businesses based on size of community in
which the business resides, number of individuals employed by the business, or annual
gross sales of the business?
4. How do primary stakeholders (focus group) in the Existing Industry Training
program perceive the findings of this study and potential impacts on the program?
Question number one was addressed by analyzing archived data collected from
the Business and Industry Services (BIS) division of the Oklahoma Department of Career
and Technology Education (ODCTE) in Stillwater, Oklahoma. This data was available
for all 29 technology center school districts. The researcher also obtained additional
necessary data from a questionnaire survey concerning economic impact and return on
investment.
Question numbers two and three were addressed by developing and administering
a customer satisfaction questionnaire that was mailed to all past users of training
conducted under the Existing Industry Training program. Question four was addressed
through a focus group procedure during which the researcher presented the study data to
relevant stakeholders for analysis and discussion.
Assumptions and Limitations of the Study
The following assumptions and limitations were accepted in the conduct of this study:
1. It was assumed that respondents answered accurately and honestly.
8
2. The possibility of misinterpretation of questions or statements existed because
the research questionnaire was administered by mail and the researcher was not present at
businesses during completion of the questionnaire.
3. It was assumed that archived economic data about training completed for
Oklahoma businesses within the context of the Existing Industry Training program was
collected by the ODCTE in an open and honest manner from accurate data provided by
Oklahoma businesses.
4. The sample obtained for the study was small and not strongly representative
of the population. This created major limitations on the generalization of findings
beyond the sample.
Operational Definitions
The following definitions were used in the context of this study:
1. BIS: Business and Industry Services: A division within each Oklahoma
technology center that concentrates on serving the training needs of businesses and
industries located within their particular district and surrounding areas.
2. Career and Technical Education: Formerly vocational education. In
Oklahoma, the general designation is Career and Technology Education or CareerTech.
3. Customer Satisfaction: Indication of approval by Oklahoma businesses
participating in the Existing Industry Training program, as measured by responses to
several questions using a five – point Likert scale for this study.
4. Economic Impact: The amount of change in a local or larger economy as
a result of the training completed within the context of the Existing Industry Training
program by an Oklahoma technology center.
9
5. Oklahoma Technology Center: A technical school that is part of a larger
statewide system consisting of 29 districts and 54 campuses.
6. Return on Investment: The amount of positive effect, both financial and
intangible, in relation to the amount of financial and human capital invested in a training
project completed within the context of the Existing Industry Training program by an
Oklahoma technology center. Operationally, the calculation of ROI is a financial
analysis that compares the costs (C) of a program to its net benefits (B). It is expressed
as a percent, derived from the basic formula (Phillips, 2002):
ROI = B – C or Net Benefit x 100C
The financial ROI is calculated with the following formula:
ROI = B – C or Net Benefit x 100C
The Researcher in Context
The researcher spent several years in manufacturing prior to entering education
and training. The expectation in this environment was that an employee must produce at
a given rate to retain employment and, therefore, the employee retained a certain amount
of worth to the organization. It is important to understand that the researcher works daily
within the CareerTech environment and has personal knowledge of the Existing Industry
Training Program. The researcher believed he had developed those necessary
relationships over 10 years of tenure within the system that would help in gaining access
to needed data and ensure participation in this study by other ODCTE personnel and
Oklahoma businesses. It was the hope of this researcher to show empirically that the
efforts of CareerTech yield a positive return on investment (ROI) for the taxpayers of the
State of Oklahoma. However, it was the goal of this research to determine, empirically,
10
the amount of worth, positive or negative, that the Existing Industry Training program
yields to these same taxpayers.
Significance of the Study
This research provided a snapshot of customer satisfaction and return on
investment (ROI) as they pertain to training conducted under the Existing Industry
Training programs for business and industry by Oklahoma technology centers. ROI is an
integral part of every day operations and cannot be ignored, whether the professional
belongs to the public or private sector (Williams, 2003, ¶ 8). It is particularly critical to
establish and report ROI on training programs in a time of heightened public demand for
accountability in education and training programs.
The findings of this research will serve business and industry coordinators,
school administrators, and school boards of Oklahoma technology centers in a variety of
ways. They can be of considerable use in the area of marketing training to business and
industry. The study is potentially important to all individuals within the Oklahoma
CareerTech technology center system charged with serving the BIS clientele and other
community members within the centers’ respective districts. The findings will enable
these individuals to take a critical look at how they market to these BIS clients and to
support their marketing efforts with empirical evidence.
Furthermore, the study will help school superintendents address future funding
requirements with their political representatives. It highlights the effectiveness of the
Oklahoma career and technology center system in meeting its mission and illuminates
areas where improvements can be made. At this writing, accountability is a major issue
among Oklahoma technology centers, their administrators, Oklahoma legislators, and the
citizens of Oklahoma. It is the hope of this researcher that providing empirical analysis

11
of the effectiveness of Oklahoma technology centers in one of their primary missions
through the findings of this study will provide ODCTE with data to enhance their efforts
as it relates to economic development in the state.
12
CHAPTER II
REVIEW OF LITERATURE
Introduction
In a time of increasing corporate, legislative, and public demand for sound
financial stewardship and fiscal accountability, training programs are no longer exempt
from the necessity to demonstrate their financial value to the organizations that sponsor
them. Unfortunately, trainers, teachers, and other educators have not been well schooled
in modern techniques for producing evidence of their productivity in terms of dollar
values. Brauchle and Schmidt stated that this “… puts trainers at a disadvantage when
dealing with their more financially literate colleagues” (2004, p. 71).
School administrators with financial control in the education world, like their
counterparts in the business world, are currently concerned with the monetary benefits of
instructional programs. It is increasingly true that:
The costs of training are usually measured in dollars or translated to
dollars, a powerful measuring scale that has enormous emotional appeal to
managers. Next to a dollar measure of costs, questionnaires or
assumptions based on a needs analysis often seem like weak arguments.
What is needed are methods that can show the value of training in terms
that managers can understand (Brauchle & Schmidt, 2004, p. 71).
While most trainers and educators may agree with Parry (1996) that “…training
doesn’t cost... it pays, and HRD is an investment, not an expense” (p. 72), it is
increasingly advantageous to be able to demonstrate the financial benefit of training
13
programs. Numerous tools and techniques have been deployed to assist with this goal.
Brauchle and Schmidt (2004) reviewed 11 training assessment strategies using both soft
and hard data, and ranging in rigor and overall value from low to high.
Despite the existence of many of these assessment strategies for more than a
decade, a common criticism of training programs has often been that their financial return
on investment is not measured (Mendoza, 1995). Other researchers have also this to be
true in recent years. Fagiano (1995) asserted that “The statistics everyone wants, those
that would tell us the return on training dollars spent, have proven to be stubbornly
elusive” (p. 12).
Kirkpatrick’s Model and ROI
It was in response to this need that Jack Phillips pioneered and codified the Return
on Investment, or ROI, process for assessing the financial value of training programs.
Phillips’ concept of ROI was grounded in the well established four-level evaluation
model created by Donald Kirkpatrick to classify training outcomes and provide a
framework for explaining evaluation (Brauchle & Schmidt, 2004).
Kirkpatrick’s model (1996) provided one of the earliest and most widely
accepted theoretical frameworks, the four levels of evaluation, within which the context
of return on investment (ROI) can be viewed and studied. Kirkpatrick identified four
levels of evaluation used in, and leading up to, measuring return on investment (ROI).
Kirkpatrick’s evaluation levels are:
Level One: Reaction or Attitudes. Were the participants pleased with
the training program as presented? Kirkpatrick (1996)
described reaction as how well trainees like a program.
14
Abernathy (1999) summarized Level 1 as asking, “Did you
like the training?” (p. 20).
Level Two: Learning. Did the participants learn from the training
program? Brown & Seidner (1998) described Level 2 as
the extent to which participants changed attitudes,
developed knowledge, or increased skills by attending a
training program.
Level Three: Application or Behavior. Was the behavior of the
participants changed as a result of the training program?
Did they apply what they learned in their job performance?
Abernathy (1999) asserted that Level 3 asks participants the
question, “Did the training help you do your job better and
increase performance?” (p. 20).
Level Four: Results. Did the participants’ change in behavior result in a
positive change in their organizations? Did it have a
positive impact on the organizations’ bottom lines?
Kirkpatrick (1996) suggested that final results could
include increased production, improved quality, decreased
costs, reduced accidents, increased sales, reduced turnover,
or higher profits. Abernathy (1999) claimed that Level 4
assessment asked, “Did the company…increase profits,
customer satisfaction, and so forth as a result of the
training?” (p. 20).
15
While Kirkpatrick’s model has been well accepted and highly successful as a
framework for conceptualizing assessment of training programs, some researchers have
charged that it stops short of reaching full analysis of costs and benefits (Bernthal, 1995).
Phillips addressed this by adding a fifth level to Kirkpatrick’s four levels of evaluation,
and called it return on investment or ROI. In proposing his fifth level of evaluation,
Phillips (1997) argued that Kirkpatrick’s previous four did not make specific enough
correlation between dollars spent on training and dollars produced by the training. More
conservative and rigorous than the older cost-benefit analysis (CBA), ROI addresses the
issue of whether an initiative or program is financially worth the money put into it. It
compares training’s monetary benefits to its costs and essentially asks whether a program
has a bottom-line impact that justifies its cost (L.J. Ausburn, personal communication,
October 15, 2003; Brauchle & Schmidt, 2004). Phillips (2002) explained ROI
conceptually as follows:
The ROI calculation is the financial rationale used by accountants,
chief financial officers, and executives to measure the return on all
investments. The term ROI is already familiar to all executives
and operational managers. It is not a new fly-by-night catch phrase
with an unknown meaning that can only be explained through
elaborate presentations and is only understood in a very small area
of the organization (p. 100).
Brauchle and Schmidt (2004) agreed with Phillips’ assertion that ROI is
not new in either concept or importance. They stated that:
Return on investment has been a critical issue for trainers and top
executives in recent years and is a topic frequently listed on
16
meeting agendas. This technique probably should receive more
emphasis from educators than it has in the past (p. 77).
As indicated by Brauchle and Schmidt (2004), the use of ROI is currently much in
demand in the analysis and evaluation of training programs. To admit to clients and
senior managers that the impact of training cannot be measured would suggest that
training does not add value or that training need not be subjected to accountability
processes. In practice, ROI must be explored, considered, and ultimately implemented in
most organizations (Phillips, 1997). A good example of the value of ROI is provided by
the experience of Motorola. At that company, ROI was extremely useful in justifying
training programs. Calculating an ROI on the billions spent for training eliminated the
concern of senior executives. After the company determined in the 1980s that its quality
and sales training programs were returning $30 to $33 for every dollar invested, the
positive effect of education was never questioned (Densford, 1999). Many business
leaders still view training as an overhead expense. With thorough ROI evaluations,
training departments can convince businesses to view them as partners in creating the
assets that are crucial to organizational success (Davidore & Schroeder, 1992).
Training specialists and e-learning advocates have suggested that the partnership
between a training department and its sponsoring organization involves three groups
within the organization, and that each group may be interested in different levels of
evaluation. The senior management group is concerned with financials such as profit,
cash flow, and stock price, and thus may be most interested in ROI or Level 5 evaluation.
The supervisor / manager group, by contrast, is more likely to be concerned with issues
such as increased output, employee retention, reduced absenteeism, increased employee
morale, and a better educated workforce. For this group, evaluations at Kirkpatrick’s
17
Levels 2 – 4 may be most valuable. The third group, the employees / learners being sent
to training programs, are concerned with personal issues such as gaining more
demonstrable skills that may lead to better pay, quality of learning experiences,
recognition for attending training and gaining new skills, self–esteem, feeling valued by
the company, and being seen as a mentor to others. For this group, evaluations at Levels
1 and 2 may hold the most value (Mosher, n.d. a).
Increased Emphasis on ROI: Reasons and Examples
There are several examples in the literature that highlight justifications for the
increased emphasis on return on investment, especially where it concerns training. The
following is an explanation of increased emphasis on return on investment in knowledge
– based companies:
Measuring the return on investment on a stock is easy enough: simply
divide the amount it gained (or lost) by the price you paid. For CIBC
senior executive Donna MacCandlish, however, calculating return on
investment is a tad more daunting: as vice-president of financial –
solutions support within the bank’s wealth-management division,
MacCandlish … leads a team of 50 people who design and deliver
training programs for various professionals. “It’s very difficult to put a
value on your business when the assets are truly the people and what’s in
their heads,” she says. That is causing knowledge-driven U.S. companies,
along with a select few in Canada, to seek help. In a trend known by its
catchphrase, return on investment, or ROI, accounting techniques and
other quasi-scientific methods are fast being adapted to evaluate staff
improvement. Inventing science-inspired metrics to improve training
18
evaluation has blossomed into an industry unto itself, complete with best-
selling books, pricey certification courses (to teach trainers how to train
properly), and in Canada, a new entity called the Canadian ROI Network,
which launched this spring. There is even an annointed champion of the
movement, former-banker-turned-consultant Jack Phillips. A veritable
Jack Welch of training, Phillips jets to speaking engagements and
meetings with clients that include the CIA and Internal Revenue Service,
Fed Ex, Lockheed Martin, Motorola and even Harley-Davidson ( Staples,
2003, p. 123).
There are other examples in the literature concerning reasons for the increased
emphasis on return on investment, especially in the area of training. Hubbard wrote
concerning his experience with return on investment:
… we can look at diversity’s impact on organizations in terms of return-
on-investment and can calculate it. It’s a huge opportunity. It’s not about
counting heads; it’s about making heads count. The Diversity
Measurement and Productivity Institute, a division of Hubbard &
Hubbard, helps companies decide what to measure and how to measure it.
Seven other divisions offer services from customized training and
development to management research and technologies, and such products
as Hubbard’s and others’ books, as well as MetricLink, a proprietary
productivity-measurement software with more than 300 user organizations
(Hubbard, 2003, p. 42).
Return on investment is even being given some consideration by the world of
professional sports:

19
By landing Alex Rodriguez, the New York Yankees have other teams
griping that the sport’s competitive balance is gone. Impose a cap on
player’s salaries, demanded Boston Red Sox owner John Henry. How
ironic that Henry, who made his fortune on Wall Street, hasn’t grasped
the genius of Yank owner George Steinbrenner. With the signing of A-
Rod for $112 million over seven years, the Yank’s star-studded lineup will
cost Steinbrenner a projected $185 million this season. But in baseball,
it’s not how much money your spend—but who you spend it on—that
counts. Steinbrenner’s investment in players such as Derek Jeter and
Bernie Williams has enabled his team to go to the World Series six times
since 1996 and capture four championships. Other rich teams that have
spent heavily on players since 1996, such as the Los Angeles Dodgers,
New York Mets and Boston Red Sox, have had scant postseason success.
We devised a return-on-investment ratio for teams that had payrolls of
$100 million or more in 2002: Take the five-year percent change in team
value and divide it by the five-year percent change in player expenses.
Upshot: The Yankee’s ROI ratio of 1.3 is highest among the big payroll
teams and almost twice as high as that of the Red Sox. The Yankees are
hauling in higher ticket, sponsorship and television revenue. George
Steinbrenner, value investor (Ozanian, 2004, p. 56).
Pescuric & Byham (1996) offered the following example of reasons for the value
of ROI:
Today’s organization is flatter and less hierarchical. Employees take on
more responsibilities as their organizations try to do more with less. As a
20
result, people have more demands on their time. The “do more with less”
credo applies to training as well as other parts of the organization. With
time, money, and resources preciously guarded, it’s no wonder that
organizations demand solutions that offer return on the organization’s
investment as well as that of the learners’ ( p. 25).
This discussion of the efforts of one East coast banking corporation to make
return on investment part of its daily operations provided yet another perspective:
At first glance it sounded like a pricey proposition: First Union Corp.
training execs wanted a company to build 48 new training centers.
Bricks, mortar, construction labor, new computers: it could seem like
quite a blow to the bottom line. But the Charlotte, N.C. bank built all 48
centers, constructing them up and down the East Coast. Despite the
expense, today First Union saves more than $700 training every one of its
10,000 tellers. How? It made the gains by replacing two-week stand-up
training courses with 20- to 24- hour CBT-based courses. Multimedia can
save you money over the long haul. That’s a fact, plain and simple. And
what’s more, you can even calculate the hard dollar return on investment.
You keep the bean counter happy and the students learning (Hall, 1997,
p. 1).
Another example of increased ROI emphasis related it to worker competency:
In the new reality, an organization needs a well-developed competency
plan or roadmap for it’s (sic) workforce from the management team to
shop floor operations. It is obvious that training and education will need
to be extended to all employees based on competency determined

21
roadmaps and business needs. Hence, identifying and developing a sound
framework that can measure returns on this investment become of
paramount importance. To help ensure a good return, organizational
training and education must be focused on it’s (sic) needs and must result
in measurable changes in knowledge, skills, and abilities. The investment
must also result in measurable changes in knowledge, skills, and abilities.
The investment must also result in behavioral change, make a difference to
business results as well as meet the needs of the learner. At the end of the
day, it will be the learner ROI that is most valuable (Tian, 2001, p. 2).
Intangibles of Return on Investment (ROI)
While ROI tends to focus on tangible monetary benefits of training, its advocates
acknowledge there are also intangible training outcomes that must be considered. One of
the pioneers of return on investment, Jack Phillips, provided insight concerning the
intangibles of return on investment:
Not all measures can or should be converted to monetary values. By
design, some are captured and reported as intangible measures. Although
they may not be perceived as valuable as the measures converted to
monetary values, intangible measures are critical to the overall evaluation
process. In some programs, such as interpersonal skills training, team
development, leadership, communications training, and management
development, the intangible or non-monetary benefits can be more
important than monetary or tangible measures. Consequently, these
measures should be monitored and reported as part of the overall
evaluation. In practice, every training program, regardless of its nature,
22
scope, and content, will have intangible measures associated with it. The
challenge is to efficiently identify and report them (Phillips, 1997, p. 171).
Phillips (2002) also defined the nature of intangible benefits of training, stating
that they could “include items such as: improved public image, increased job satisfaction,
increased organizational commitment, enhanced technology leadership, reduced stress,
improved teamwork, improved customer service; or reduced customer–response time”
(pp. 75-76).
The literature offers other examples of the intangibles that companies enjoy as a
result of the concept of return on investment. Hoffman (2002) wrote that “companies
that implement online training systems for a “modest” five – or six – figure investment
typically generate strong financial returns through cost reductions in areas such as travel,
human resources overhead, regulatory compliance and customer support.” There are
other examples of intangibles in the literature, including Sorenson’s (2002) example of
the indirect cost of ineffective training:
Irrespective of the real or perceived value of training, reducing costs will
increase the ROI. Costs associated with training can be categorized as
direct costs and indirect costs. Other certain opportunities may be lost
without such training. Direct costs are the actual costs of conducting
training, including the cost of acquiring or developing instructional
materials, purchasing training aids and equipment, and paying for the
training and trainee’s time. Indirect costs are the costs that result from
inadequate training or no training at all. Indirect costs include: higher
operating costs associated with reduced efficiency, system repair and
maintenance costs associated with equipment casualties and inadequate
23
preventive maintenance, additional labor costs and medical expenses
associated with lost time accidents and worker’s compensation claims,
fines for noncompliance with regulatory agency requirements, personal
injury, property damage, and other liability lawsuits arising from system
malfunctions and poor IAQ (p. 34).
Cross (2001) talked about intangibles of return on investment, stating that, “One
of the problems with measuring training’s influence on worker productivity is that there
are many areas of productivity that are intangible and difficult to quantify, such as ideas,
abilities, experience, insight, motivation, and so forth” (pg. not available in online
document). Another perspective on the intangibles of return on investment addressed
soft benefits:
“I’ve yet to meet a CFO who will write down soft benefits – improved
customer satisfaction, increased worker productivity and improved market
competitiveness, for example – and use them in an ROI calculation,” says
Jay Pieper, vice president for corporate development and treasury affairs
at Partners Healthcare System in Boston. “They’re just too hard to
account for in financial terms.” But that doesn’t mean they aren’t there
(Koch, 2002, p. 5).
Soft skills are particularly difficult to account for in ROI calculation. Setaro
(1999) addressed this issue directly, asserting that employee soft skills such as learning to
work cooperatively in groups, coming to work on time, interpersonal skills, etc. are
almost impossible to place a dollar value on but are invaluable to a company’s bottom
line. Setaro did, however, suggest that soft skills can sometimes be valued by the
decrease in employer turnover, which helps reduce the cost of training and increase the
24
company’s continuity between departments. Other researchers have contended that many
benefits of training that at first glance appear to be intangible can actually have a bottom
– line impact that can be translated into dollar terms (L.J. Ausburn, personal
communication, October 15, 2003; Phillips, 2002). On the other hand, Kurtus (2001) was
critical of soft skills training and its so–called intangible benefits. According to Kurtus:
Very often there are no specific or measurable goals to achieve for a
training session. This is especially true in many of the “soft skills” taught
to managers. It is very difficult to measure the results of a manager style
training seminar. In fact, the goal for such training might be something
like: “To be a better manager,” whatever that means. If there is no way to
measure the effectiveness of the training, the company might be better off
simply giving the people the money to go on a vacation (p. 3).
ROI can be found in such areas as energy management and power plant
operations. Blankenship (2004) offers up an essay discussing the use of “trace heating,”
which is the use of heated cable to help keep pipes unfrozen during times of extreme
weather. The payback periods achieved were 23 weeks for the power matching controller
and 19 weeks for the proportional controller system. Translated to U.S. values, that
equates to annual energy savings of $8,500.00 per mile of “trace heating” cable.
Barriers to ROI
While ROI can be highly beneficial and has been widely used for training
assessment in industry, there are several barriers to its implementation. The literature has
identified the following barriers to ROI:
• Costs and time,
• Fear and misunderstanding,
25
• Inadequate data and measuring systems, and
• Lack of ROI process skills.
Costs and Time
Phillips (1997) acknowledged early in this development of the ROI process that it
adds additional costs and time to the evaluation of training programs, and “this barrier
alone stops many ROI implementations early in the process” (p. 13). Adelgais (2001)
agreed, pointing out that it takes more time and money to calculate ROI than is required
in other forms of evaluation. The additional costs of ROI have been estimated at 3-5
percent of a company’s total training and performance improvement budget (Phillips,
1997; P. Phillips, 2002). Mosher (n.d. b) also acknowledged the costs of ROI, pointing
out that:
Calculating true ROI in learning takes an investment in time and money.
It’s a difficult and involved process with many abstract issues and
processes. It’s not as simple as subtracting two numbers and seeing if you
get a negative or a positive (p. 1).
Adelgais (2001) referred to another source of dollar and time expenditures
required for ROI and indicated the need for establishing clear timelines for its
completion:
Staff must be trained to calculate and/or interpret the ROI of a program. It
is a very intensive strategy to implement and staff can lose steam rather
quickly if there are no specific deadlines in place for them (p. 3).
While acknowledging that added evaluation time and costs can be a barrier to
ROI implementation, some experts have presented rebuttal arguments. Phillips (2002)
argued that “…the added amount should not be excessive” and that “the additional
26
investment in ROI should be offset by the results achieved from implementation (e.g. the
elimination or prevention of unproductive or unprofitable programs)” (p. 95). Ellis
(2004) related ROI costs to timing and selection of programs selected for evaluation. He
suggested that it is necessary to decide at what point to assess a program because “…
measuring constantly can be very costly; measuring strategically is definitely much
better and much more effective” (pp. 1 -2). Ellis also indicated that an essential part of
controlling ROI costs by strategic measurement was the careful selection of programs to
assess, asking “What programs should be evaluated for ROI? What programs shouldn’t?
Where do you draw the line?” (p. 2). Mosher (n.d. b) also supported ROI, stating that
despite its costs and complexities, “…the outcome can be well worth the ‘I’ in ROI
(INVESTMENT!) (p. 2).
Fear and Misunderstanding
Another major barrier to the application of ROI is a fear that it will be used in a
punitive fashion. Phillips (1997) indicated that there may be a concern about the
consequence of negative ROI. Adelgais (2001) supported this viewpoint, stating that,
“There is a fear of a negative ROI. Many do not want it proven that a training program is
actually bad for a company” (p. 3).
In addition to fear of punitive uses of ROI, many managers may have another
concern about its use in evaluation: They may simply not want to look at the “real”
numbers, fearing that ROI will negate their preference for managing by internal feelings.
Cross (2001) claimed his experience “… has shown that most senior executives have
more faith in gut feeling than in numbers” (p. 6). Mosher (n.d. b) commented on this
issue specifically as it applies to evaluating training, stating that, “ROI has always

27
bothered me because few organizations truly want to measure it at a true learning
outcome level” (p.1).
Another fear of ROI often expressed by trainers and training departments is that it
will be used to justify selection of the cheapest training programs and techniques, basing
choices on costs rather than quality. The Sterling Institute (1998 – 2003) cautioned
against this misuse of ROI and indicated it missed the real point of this method of
assessment:
We believe that the real purpose of calculating a ROI on training programs
is to demonstrate that participants are able to effect organizational
performance as a result of what they learn in the classroom. ROI should
not, in our judgment, be used simply as a way to demonstrate that one
training program is less expensive than another and, therefore, worth its
investment. Cost comparisons of training programs and training
technologies are vital parts of the buying process that training departments
should be expected to perform. The types of cost analyses represent
training’s due diligence (p. 1).
Inadequate Data and Measuring System
Successful use of ROI to assess the financial impact and benefits of training
programs is a sophisticated process that requires the development and maintenance of an
extensive measurement system and a large data base of costing and other related
information. Considerable time and effort are necessary to maintain such a system, and it
is simply lacking in many organizational institutions. This creates a substantial barrier to
successful implementation of ROI, described by Rummler and Brache (1995) as follows:
28
Most managers do not have a valid, integrated, manageable, set of
measures. Those who do have appropriate and comprehensive measures
usually fail to take the next step, which is to use them as the basis for a
measurement system, which includes mechanisms for gathering actual
performance information, comparing it to the goals, and communicating
that information to those who can use it. Those who do have such a
measurement system often don’t use it appropriately (p. 156).
Lack of ROI Process Skills
All proponents of ROI acknowledge in their writings its complexity and its
dependence on a well–refined set of skills for successful implementation. Several
specific aspects of the ROI skills barrier have been addressed in the literature. One
important skill requirement for successful ROI is knowing how to select suitable training
programs for ROI analysis. The first requirement for a training program to be analyzed
for ROI, as consistently pointed out in the literature, is that it should be a “big” program.
ROI is an expensive and time-consuming process and should be saved for large–scale
programs in terms of costs, number of participants, longevity, and visibility or PR value
to the organization (Phillips, 1997; Phillips, 2002). Second, a training program must be
in effect for some time before its ROI can be calculated; new programs are not suitable
for accurate ROI analysis (Adelgais, 2001). A third requirement of programs selected for
ROI is that their benefits must not be largely intangible or “soft.” For example, Kurtus
(2001) claimed that “soft skills” training for managers can be very difficult to assess in
terms of financial benefits. As another example of a program not well suited for ROI
analysis, due to its intangible benefits, Gordon and Richardson (2004) discussed
information security:
29
ROI can’t be applied perfectly to information security because often
the return on information security purchases and deployments is
intangible. Sure, companies invest in some solutions that offer benefits
beyond security – faster network throughout in a new router that supports
VPNs, for example – and they can calculate the ROI of these indirect
benefits. But security requires factoring in the expectations of loss.
Statistically, some losses are expensive but unlikely to occur in any given
year, for instance, so the expectation of loss over a period of years has to
include years in which there is no loss. Furthermore, the accounting –
based notion of ROI doesn’t take into account that great chestnut of
economic theory, the “time value” of money (p. 68).
Another skill that is critical for successful ROI, and yet often lacking in
companies that attempt its implantation, is knowing how to translate benefits of improved
employee performance into dollar terms. This is a complex process that requires both
knowledge of translation procedural options and practice in carrying them out. The
dollar conversion issue is frequently mentioned in the literature as a skill barrier in ROI
(Phillips, 1994, 1996a, 1997; Phillips, 2002; Setaro, 1999). A good step–by–step
example of the conversion of performance data to monetary terms was provided by
Phillips in an article on ROI calculations:
Step 1: Focus on a single unit. For hard data, identify a particular
unit of improvement in output (such as products, services, and
sales), quality (often measured in terms of errors, rework, and
product defects or rejects), or time (to complete a project or
respond to a customer order). A single unit of soft data can be one
30
employee grievance, one case of employee turnover, or a one-point
change in the customer – service index.
Step 2: Determine a value for each unit. Place a value on the
unit identified in step 1. That’s easy for measures of production,
quality, time, and cost. Most organizations record the value of one
unit of production or the cost of a product defect. But the cost of
one employee absence, for example, is difficult to pinpoint.
Step 3: Calculate the change in performance. Determine the
performance change after factoring out other potential influences
on the training results. This change is the output performance,
measured as hard or soft data, that is directly attributable to
training.
Step 4: Obtain an annual amount. The industry standard for an
annual – performance change is equal to the total change in
performance data during one year. Actual benefits may vary over
the course of a year or extend past one year.
Step 5: Determine the annual value. The annual value of
improvement equals the annual performance change, multiplied by
the unit value. Compare the product of this equation to the cost of
the program, using this formula: ROI = net annual value of
improvement – program cost (Phillips, 1996a, p. 22).
This calculation procedure presented by Phillips raises another important
skill for ROI implementation: isolation of the effects of training. Adelgais (2001)
stated emphatically that “It is difficult to isolate the effects of specific training or
31
programs and provide accurate estimates” (p. 2), yet Phillips indicated it is
essential to isolate the effects of training from other factors that can affect
business results if ROI is to be fair and accurate (Phillips, 1996b). The
importance of isolating the effects of training is obvious when one considers that
improvements in job performance are usually only partially due to training
programs. Other variables such as trainees’ ages and work experience, seasonal
work patterns, economic changes, shifts in management, equipment breakdowns,
and customer attitudes, etc. can influence performance data and make it difficult
to determine the actual effect of specific training on ROI results (Shelton &
Alliger, 1993). The method frequently recommended for isolating training effects
from other factors is use of control groups (Brown, 2001; Phillips, 1996b;
Phillips, 2002).
Phillips described the use of control groups in ROI as follows:
A highly credible approach for isolating the effect of training is the
use of control groups in an experimental training design. The
experimental group receives training; the control group does not.
Participants in both groups should be similar demographically,
selected at random, and subjected to the same environmental
influences. It isn’t necessary to take pre-program measurements of
the two groups. Rather, measurements taken after training show
the difference in performance between the two groups that can be
attributed directly to training. For example, Federal Express gave
20 new employees training in driving company vans. Their post-
training performance was compared with a control group of 20
32
new employees who hadn’t received the special training. The two
groups’ performance was tracked for 90 days in 10 performance
categories, including accidents, injuries, and errors. Experts from
engineering, finance, and other groups assigned dollar values to the
performance categories. The ultimate outcome was that the
training showed a 24 percent return on investment (Phillips, 1996b,
p. 30).
Other additional ways to isolate training’s effect on performance include
trend–line analysis, forecasting, participant estimation, supervisor estimation,
management estimation, customer input, expert estimation, and subordinate input
(Brown, 2001; Phillips, 1996b; Shelton & Alliger, 1993).
A final issue related to ROI skills is an appropriate innovative attitude by
both management and employees. The successful champion of ROI must be
willing to learn, change, and try new things, using ROI as a process improvement
tool. Without this attitude and approach, it may be best not to try (Phillips, 2002).
Without this attitude, an organization may fail to successfully implement ROI
even if it has the technical skills to do so.
ROI Procedures and Calculations
ROI Procedures
Prior to performing ROI assessment of a training program, it was hoped
that the program to be assessed was funded because it was well aligned with the
organization’s strategic goals. In presenting an eight–step process for aligning
training initiatives with organizational goals, Bahlis (2004) explained:
33
Unless you are running training as a revenue generating business,
your budget is viewed as an expense – which is being continually
scrutinized, and the demand for training most likely exceeds your
capacity. As a result, you need to focus your resources on the most
important initiatives to maximize your training investment and
demonstrate its value…how do you decide which programs to
fund? ...it all boils down to how much time, money, and resources
are required to run various programs and the benefits generated in
return. To identify the benefits, clear links should be established
between training activities and organizational goals …as a result,
the success and importance of training is not measured by the skills
and competencies that are being developed, but by the impact of
the newly acquired skills and competencies on “performance”
(p. 1).
Before ROI is undertaken, it is also necessary to select an appropriate program for
complex and rigorous analysis. Experts have pointed out that selected programs should
be “big” in terms of costs and scope (Phillips, 1997), in existence for sometime
(Adelgais, 2001), and able to provide “hard” data benefits (Kurtus, 2001).
Once an appropriate training program is selected for ROI assessment,
implementation can be undertaken by following established procedures and making
required calculations. Phillips provided a six–step basic process for performing ROI:
1. Collect evaluation data on a training program at Kirkpatrick’s Level 4
(Results).
34
2. Ask the question, “Did on–the–job application produce measurable
results?”
3. Isolate the effects of training from other factors that may have contributed
to the results.
4. Convert the results to monetary benefits.
5. Total the costs of training.
6. Compare the monetary benefits with the costs. (Phillips, 1996a).
Brown listed a similar basic five steps:
1. Obtain data to demonstrate the changes in behavior, e.g. that gathered
through surveys, questionnaires, on–the–job observations, post–program
interviews, focus groups, and performance models.
2. Isolate the effect of training, e.g. through the use of control groups, trends
lines, and forecasting models.
3. Convert the data to monetary value by focusing on a unit of measure,
determining a value for that unit, calculating the change in performance
data, determining the annual amount for the change, and calculating the
total value of the improvement.
4. Tabulate the program costs: This is the value of the cost of taking the
people away from their jobs for training, including salary and benefits.
5. Calculate the return on investment by dividing the net benefits by the costs
times 100 percent (Brown, 2001).
The basic ROI process has the important advantage of assessing training in terms
that are credible and important to an organization’s management. Davidore and
Schroeder explained this as follows:
35
To show a credible return on investment for training, describe results in
the context of the financial and performance models that the company’s
decision makers already use to measure business results. Three key
business objectives – quality, timeliness, and operational costs – are often
important to senior and line managers, are usually achievable with good
training, and are generally possible to monitor (1992, p. 71).
ROI Calculations Formula
The generally accepted formula for calculating ROI is:
ROI = (Total benefits - costs/costs) x 100
or
Net Benefits / Costs x 100
ROI is expressed as a percent that represents the proportion of training cost that is
returned to the organization in financial benefits. Davidore and Schroeder explained the
general formula as follows:
One way to calculate a return on the training investment is to divide
operational savings or revenue increases resulting from training by the
training program costs. Then multiply the results by 100 (1992, p. 71).
Another general interpretation of the ROI formula was offered by Brauchle and
Schmidt:
To get ROI, the training costs are subtracted from the total benefits to get
the net benefits, and then the net benefits are divided by the costs. The
formula for this is ROI (%) = net program benefits / program costs x 100
(2004, p. 82).
36
Several good examples of ROI calculations are provided in the literature.
Davidore and Schroeder offered the following:
For example, suppose half the sales force is randomly selected for training
that costs $100,000 to develop and $100,000 to deliver. Six months after
training, if the trained salespeople sell $50,000 more than the people who
received no training, the ROI is 25%. If the trained sales force sells
$50,000 more in the next six months as well, the ROI is 50 percent (1992,
p. 71).
Another example was presented by Phillips:
Suppose a training program produces benefits of $321,600 with a cost of
$38,233. …the net benefits were $321,600 - $38,233 = $283,367. ROI is
$283,367 : $38,233 = 7.41. Using the ROI formula, for every $1 invested
in the program, there was a return on investment of $7.41 in net benefits
(Phillips, 1996c, p. 81).
Another ROI calculation recommended by several experts is called “payback
period.” Brauchle and Schmidt (2004) asserted that, “This technique usually makes the
assumption that the cash proceeds generated by a training intervention are constant over
time, and it calculates the time period needed to pay back the original investment”
(p. 82).
Phillips (1996c) gave the formula for payback period as:
Payback Period = Total Investment / Net Annual Savings
Brauchle and Schmidt (2004) explained the calculation for the ROI example
presented above:
37
…the total investment is $38,233, and the net benefits are $321,600. If
there is no time period specified, it can be safely assumed that the net
benefits are for a period of one year, because budgeting is usually done on
an annual basis. Using these figures with the formula produces an answer
of .1188837 years or 43 days. In this instance, the original training
investment was paid back within 43 days (p. 82).
Barnard (2002) approached payback period slightly differently. According to
Barnard:
Another way of looking at ROI is to calculate how many months it
will take before the benefits of the training match the costs and the
training pays for itself. This is called the payback period.
Payback period = costs / monthly benefits
Payback period is a powerful measure. If the figure is relatively
low, then management should be that much more encouraged to
make the training investment. As a measure, it also has the
advantage of not requiring an arbitrary benefit period to be
specified (p. 1).
What to Include in Costs and Benefits in ROI Calculation
Several experts have offered guidance in establishing what items to
include in costs and benefits in the ROI formula. Shepherd (1999) contended that
costs should include training design and development, promotion, administration,
faculty, materials, facilities, and student costs. He claimed that costs related to
student participation in training were probably the most significant costs, but
38
should only be considered if the training takes place when the student / worker
would otherwise be on the job. Specifically, Shepherd explained:
It is only necessary to charge a student’s cost against
the program if training is undertaken in time that would
otherwise be productive and paid for, so you only need to estimate
the amount of travel and training that is undertaken in productive
work time, i.e. not in slack time, breaks or outside work hours.
When an employee goes through a training program in work
time, the organization is not only having to pay that person’s
payroll costs, they are (sic) also losing the opportunity for that person to
add value to the organization. When a salesperson is in a course,
they are (sic) not bringing in new business. Similarly, a production line
worker is not creating products, a researcher is not developing new
ideas and an accountant is not finding ways to save money. If an
employee can be easily replaced while they are (sic) undergoing
training, then there is no lost opportunity - the cost is simply the
employee’s payroll cost. In many cases, however, it is simply not
practical to obtain a suitable replacement, so the output that the
employee would have generated in the time that they are (sic) receiving
will be lost. In this case, the true cost of employee being trained is
the lost opportunity – the ‘opportunity cost.’ The calculation of
opportunity costs goes beyond the scope of this article, but, suffice
to say, they are greater than an employee’s payroll costs and need
to be considered in any serious evaluation of costs (1999, p. 4).
39
Probably the most extensive and complete identification of costs that should be
included in an ROI analysis of a training program was provided by Phillips (2002). Her
sample “fully loaded cost sheets” are highly useful in developing ROI costing
calculations.
Benefits expressed in monetary terms are the other critical component of ROI
calculation. Shepherd (1999) indicated that financial items claimed as benefits should
include those accruing from improved performance of trainees, labor savings as a result
of training, increased productivity as a result of training, and money not lost as a result of
not training. In other words, the time employees spent in training was not lost time.
Value and Benefits of ROI “We recognize that using ROI to analyze the effectiveness of training programs is
becoming both a political and operational imperative in an age when staff budgets are
increasingly scrutinized and every line item has to be justified” (Sterling Institute, 1998 –
2003, pg. not available in online document). Training budgets have become a major
expense for businesses and for educational programs. In the corporate world, it is
recognized that industries that spend an above average amount on training have a return
on investment of 45 percent more than the annual S & P 500 index and that sound
investment in training and education means more money for everyone (Bassi &
McMurrer, 2001). This gives some credence to the trainers’ claim that “…training
doesn’t cost…it pays, and HRD is an investment, not an expense” (Parry, 1996, p. 72).
However, in reality in today’s climate of increasing fiscal accountability, training budgets
are “being continually scrutinized” (Bahlis, 2004, p. 1) and, in both education and
industry, one of the first areas to receive budget cuts is training (Shepherd, 1999). In this
climate, the benefits of ROI as a tool for measuring and reporting the effects of training
40
programs is clear: It “expresses the results of training programs in terms of dollars, a
metric that is of common interest to managers and decision makers” (Brauchle &
Schmidt, 2004, p. 91), and it can help trainers resist cuts in their budgets (Shepherd,
1999). Dollar measures of training impacts have an enormous appeal to managers, and
failure to use such measures can disadvantage trainers and educators when they must deal
with their “more financially literate colleagues” (Brauchle & Schmidt, 2004, p. 71).
Phillips claimed that four distinct and important benefits come from the
implementation of evaluation of training programs within an organization:
1. Measurement of the contribution a program made to the organization and
determination if it was a good investment.
2. Determination of which programs contribute most to the organization and
establishment of priorities for high–impact programs.
3. Placing a focus on the results of all programs.
4. Assistance in convincing management that training or education is a sound
investment and not just an expense (Phillips, 1997).
Many organizations now believe that training, like other aspects of their
operation, should be evaluated to validate it as a profitable business tool with the ability
to improve its performance, profit margin and competitive edge (Shepherd, 1999). With
its unique ability to tie training outcomes to an organization’s bottom line, properly
performed ROI can provide substantive information upon which to base training support
(Brown, 2001). This represents a solid value for trainees and educators.
41
Customer Satisfaction
In a highly competitive business climate, the issue of customer satisfaction
and its impact on an organization’s bottom line has become an important element
in both operations and assessment of corporate performance in a wide variety of
industries. Lang (2004) described the implementation of customer satisfaction
efforts at Ford Motor Company, where customer satisfaction was related to
product quality:
Unfortunately, while Ford vehicles were progressing in every other
aspect, automatic transmissions were the Achilles’ heel of the
vehicle. According to Ken Williams, the manufacturing director
for Automatic Transmissions, …“We had a horrible reputation –
no durability.” [The company] developed a three-year plan to turn
around the automatic transmission line and achieve a 6 to 8 percent
improvement rating in customer satisfaction (pp. 72-73).
Macarthur (2004) described the importance of customer satisfaction to the
fast food industry, where perceptions of product quality and customer service are
critical to survival in a competitive business:
Among the four burger chains, Burger King has declined to its
lowest rating in overall quality perceptions over the past year,
while the other three have improved customer satisfaction scores,
according to data from Sandelman & Associates. Compared to the
fourth quarter of 2002, Burger King’s overall quality rating fell
four points, according to QuickTrack data that asks consumers who
42
have visited the chain within three months to rate their experience
based on food, service, atmosphere and price. By contrast,
McDonalds gained two points, Hardee’s gained four points and
Wendy’s improved by nine points (p. 76).
Purdum (2003) discussed the need to provide great customer service in
manufacturing. He asserted that indeed, manufacturing is no longer about making
things; it’s about customer satisfaction, adaptation, anticipation and innovation,
and using every resource available to survive or be eaten if the global shift that is
taking place is ignored. Lundquist (2003) talked about IBM’s misguided attempts
to impress the marketplace and at the same time not serve the need of its
customers. According to Lindquist, IBM bragged that 53 percent of its profits
came from consulting services. This proved to be a constant source of irritation to
customers, who wanted IBM to give more energy to serving their needs, and
made their feelings felt on the company’s profits.
O’Brien and Manross (2002) addressed the difference between customer
satisfaction and the idea of customer loyalty. They indicated the obvious, in that,
you must strive for customer satisfaction. More important in their discussions,
however, was the idea that a loyal customer will exhibit those behaviors that
support the very existence of an organization. Holloway (2002) commented on
Air Canada and its deplorable record of customer satisfaction, which would
eventually impact customer loyalty and, thus, corporate profitability and survival.
According to Holloway:
Canadians love to hate Air Canada, and so do Canadian businesses.
With an overall satisfaction rating of only 16%, Air Canada was
43
the lowest-ranked of the 19 companies in our survey. To put that
figure into perspective, three times as many people were happier
dealing with the taxman than with the beleaguered airline. But the
news gets even worse for Air Canada. WestJet Airlines, the only
real competitor for business traffic in Canada, earned an approval
rating of 89%, the highest of any company in the survey (p. 78).
Because customer satisfaction is crucial to the survival of any organization
and the ROI of the services it provides, it was included in the assessment of the
Existing Industry Training Program in this dissertation study.
Focus Groups
The focus group is a well recognized tool of qualitative research. It is also a
common technique for probing participant feelings and opinions in mixed–model
research designs. Greenbaum (1998) supported the effectiveness of focus groups for a
variety of purposes:
Qualitative research encompasses several different techniques, each of
which has inherent strengths and weaknesses. Focus groups are one
important technique among them. When used appropriately, focus
groups can be extremely effective in generating meaningful information
about consumer attitudes toward a variety of different topics (p. 15).
Krueger (1988) also supported the usefulness of focus groups and claimed they
were superior to other methods frequently used in education for obtaining information for
decision–making.
Focus groups have been a mainstay in private sector marketing research.
More recently, public sector organizations are beginning to discover the
44
potential of this procedure. Educational and nonprofit organizations have
traditionally used face-to-face interviews and questionnaires to get
information. Unfortunately, these popular techniques are sometimes
inadequate in meeting information needs of decision makers. The focus
group is unique from these procedures; it allows for group interaction and
greater insight into why certain opinions are held. Focus groups can
improve the planning and design of new programs, provide means of
evaluating existing programs, and produce insights for developing
marketing strategies (p.15).
Focus groups are well established as a qualitative data–gathering tool, and the
definition of the technique is straightforward:
A focus group interview is an interview with a small group (usually four
to eight people) who are asked to think about a series of questions asked
by the interviewer. The participants are seated together in a group and get
to hear one another’s responses to the questions. Often they offer
additional comments beyond what they originally had to say once they
hear the other responses. They may agree or disagree; consensus is
neither necessary or desired. The object is to get at what people really
think about an issue or issues in a social context where participants can
hear the views of others and consider their own views accordingly
(Frankel & Wallen, 2003, p. 462).
Some researchers have claimed that focus groups should be used primarily for
exploratory purposes. However, Morgan (1988) refuted this position, and also posited
several uses for focus groups when combined with other forms of data collection:
45
Asserting that focus groups should not be relegated to a preliminary or
exploratory role must not … blind us to the value of linking focus
groups with other forms of data collection, both qualitative and
quantitative. In this vein, focus groups are useful for
1. orienting oneself to a new field;
2. generating hypotheses based on informants’ insights;
3. evaluating different research sites or study populations;
4. developing interview schedules and questionnaires;
5. getting participants’ interpretations of results from earlier
studies (p. 11).
In this dissertation study, the researcher used a focus group for Morgan’s purpose
number 5. The study focus group was used as a sounding board to ascertain whether or
not the findings of the study seemed to be accurate in the eyes of a group of stakeholders
from the Business and Industry Services Directors and CareerTech professionals who are
involved on a daily basis with the Existing Industry program. This procedure was similar
in concept and purpose to that used by Linkenbach (1995) in a study of alcohol servers in
Montana. This procedure used a focus group to get stakeholders’ buy-in and ownership
of the study’s findings and recommendations.
Morgan & Krueger (1993) suggested that focus groups should be considered
when the researcher wants to learn more about the degree of consensus that may be
present on a given topic:
Often a major part of our research goal is to learn more about the range of
opinions or experiences that people have. Focus groups have a strong
advantage here because the interaction in the group can provide an explicit
46
basis for exploring this issue. Of course, the degree of consensus in the
group can only become open to observation if the researchers make it clear
that they want to hear a range of opinions, so one should never mistake the
failure to disagree for the actual presence of consensus (p. 17).
Schensul, LeCompte, Nastasi and Borgatti (1999) also discussed the purposes and
uses of focus groups:
1.) Provide access to a rich source of data on social norms, behaviors,
opinions and attitudes, and the structural features of a group or
community and cultural patterns. These can be used in
conjunction with other sources of information to provide a well-
rounded picture of the population, or to develop cultural
intervention materials for use in behavioral change programs.
2.) Reveal the full range of variation in possible responses to questions
for use in survey construction.
3.) Demonstrate styles of dialogue and debate among people who
share or differ in important ways.
4.) Provide some evidence of likely quantitative variation in the target
population in key independent and dependent variable domains.
5.) Provide the basis for generating important hypotheses that can be
tested both qualitatively – through other focused group interviews -
and quantitatively – in survey research designs based on focus
group data (p. 111).

47
One advantage of focus groups is their ability to provide information on the range
of opinions and feelings held by participants. On the subject of response range in focus
groups, Merton, Fiske and Kendall (1990) provided the following analysis:
The first criterion of an effective focused interview to be considered in
detail is that of range: the extent of relevant data provided by the
interview. Without implying any strict measure of range, we consider it
adequate if the interview yields substantial data which (1) exemplify types
of responses to the situation which were anticipated on the basis of a prior
analysis of the situation; (2) suggest types of inter-relations between
responses to the situation which were obtained in some other way (for
example, through questionnaires or observation); (3) bear upon aspects,
which were not anticipated on the basis of prior analysis. The greater the
coverage of these three types of data, the more nearly the criterion of
range is satisfied (p. 41).
In this study, the researcher selected members of the focus group who had a stake
in the outcome of the process and who the researcher felt would be open and honest in
providing range in the assessment of the findings of the study. If the focus group
findings were not open and honest and did not represent the present “snapshot” of the
Existing Industry program, then they would have been of no value to the researcher or to
CareerTech as a system.
Another important aspect of focus groups is the domain of information
represented by and in the group. Fern (2001) discussed this domain of shared and
unshared information within a focus group:
Assume that for any focus group purpose, there is a domain of relevant
48
information distributed across group members. This domain is the sum of
all the information held by individual group members. Group members
share part of this information, and the other part is not shared. The shared
information is common or everyday knowledge that results from the
similar backgrounds and life experiences of the individuals making up the
group. The unshared part of the information is that which one individual
knows but others do not. This information is unique because no two
individuals have exactly the same life experiences. As a result, the
domain of information available to the group and its moderator is
unequally distributed across group members, depending on the degree to
which members share similar backgrounds and experiences. Each group
member possesses a different subset of the total available information
(p. 114).
Focus groups are subject to many social interactions and constraints that can
affect the participants’ ability to open up and reveal their thoughts and feelings. Goebert
and Rosenthal (2002) discussed this issue and the role of the focus group moderator in
controlling the group’s interactions and keeping them on target:
When you’re in a group, all of your little social antennae go up. As a
panelist, you’re responding to the fact that the man next to you has a tiny
stain on his tie; the one to the right has crossed eyes; and the panelist
across from you is beautiful, and you’re captivated and jealous at the same
time. You’re struggling to make ends meet, and the woman over there has
told you she’s putting in a swimming pool and just got back from a
vacation in Bermuda. The moderator has to get rid of all this extraneous
49
stuff and help people focus on her client’s area of interest without letting
them realize that’s what they’re doing (p. 35).
The researcher understood in this study the concept of shared and unshared information. The researcher also understood the importance of trying to get the focus group “focused” on the subject at hand. Taking the above factors and applying them to
the larger context here concerning the use of focus groups for this particular study, the
researcher found there was a clarity of purpose here as it pertained to the use of focus
groups. The researcher was striving to insure that the findings of the study were accurate
and really did make sense to those who live the experience on a daily basis. Individuals
were picked to be part of the focus group because of the fact that they worked as part of
the environment of the Existing Industry program. The researcher had a large grouping
of resources available to help perform the needed steps to bring this research project to
fruition, and he felt comfortable that these resources were all willing to help see this
project through because of a sense of urgency to see just what the results of this study
would be. The researcher used appropriate participants not only for the focus group in
particular but for the large study overall. Useful data could not be gathered without the
use of appropriate participants.
In analyzing how a good focus group meeting should be conducted, Krueger
(1993) offered a summary of the ten factors that go into making a quality focus group
gathering:
The ten factors that directly influence quality in focus group interviews are
(1) clarity of purpose, (2) appropriate environment, (3) sufficient
resources, (4) appropriate participants, (5) skillful moderator, (6) effective
questions, (7) careful data handling, (8) systematic and verifiable analysis,
50
(9) appropriate presentation, and (10) honor the participant, client, and
method. Quality in each of these areas may be jeopardized. Not all
threats to quality are equivalent. Some are minor, some are major, and
others are situational. These situational factors depend on the experience
level of the researcher, the environment, and the problem (p. 85).
The researcher attempted in this study to serve as a skillful moderator for the
focus group process and keep, as much as possible, human bias from influencing the
process. Careful detail was given to the development of questions used with the focus
group. This was done based on guidelines offered by Krueger (1998) concerning the
development of questions to be used with a focus group:
The first principal is to ask questions in a conversational manner. Because
the focus group is a social experience, conversational questions are
essential to create and maintain an informal environment. But what makes
one question conversational and another awkward often depends on the
situation.
The wording of the questions should be direct, forthright,
comfortable, and simple. Are the questions easy to ask, or do you stumble
over words? It is critical that the language is appropriate for the intended
audience. Furthermore, the meaning of the question must be clearly
conveyed orally. Some questions are great when written but are confusing
or stilted when asked orally (pp. 3-4).
Summary
Current literature clearly shows that return on investment is viewed as
critical to businesses in general. One can also assume it is critical to Oklahoma

51
businesses. The literature reviewed here presented evidence of a rising emphasis
on return on investment, a look at the intangibles that must be considered as well
as barriers to return on investment. It also presented the mechanics of measuring
return on investment. This literature review also provided information concerning
customer satisfaction and the use of focus groups as a qualitative research tool
which helped shape the study’s procedures.
Concerning ROI, the literature reinforced the researcher’s positive view of
this assessment tool and led to an agreement with the view of Jack Phillips:
While there is almost universal agreement that more attention is
needed on ROI, it is promising to note that the number of
successful examples of ROI calculation is increasing. The process
is not difficult. The approaches, strategies, and techniques are not
overly complex and can be useful in a variety of settings. The
combined and persistent efforts of practitioners and researchers
will continue to refine the techniques and create successful
applications (Phillips, 1997, p. 23).
52
CHAPTER III
RESEARCH METHODOLOGY
Purpose of the Study
The purpose of this study was to describe the return on investment (ROI), the
economic impact, and the customer satisfaction with training completed (for Oklahoma
businesses and individual Oklahomans) under the Existing Industry Training program of
the CareerTech technology centers. Companies that invest more heavily in workplace
learning are generally more successful, more profitable and more highly valued on Wall
Street (Densford, 1999). This study examined the effects of investment in workplace
learning in Oklahoma by describing and making public return on investment, economic
impact, and customer satisfaction data relating to training completed for business and
industry clientele and full-time program completers at Oklahoma CareerTech technology
centers.
Specifically, this study sought to:
1. Identify and measure the economic impact and return on investment (ROI) of
training completed within the context of the Existing Industry Training program by
Oklahoma technology centers for Oklahoma businesses.
3. Describe the customer satisfaction of those served by the Existing Industry
Training program provided by the Oklahoma technology center districts.
Research Questions
This study was guided by four research questions:
53
1. What is the economic impact and return on investment (ROI) of training
completed within the context of the Existing Industry Training program by Oklahoma
career technology centers for selected Oklahoma businesses?
2. What is the general level of customer satisfaction with training conducted in
the context of the Existing Industry Training program by Oklahoma career technology
centers for selected Oklahoma businesses?
3. Are there differences in the level of customer satisfaction with training
conducted in the context of the Existing Industry Training program by Oklahoma career
technology centers for selected Oklahoma businesses based on size of community in
which the business resides, number of individuals employed by the business, or annual
gross sales of the business?
4. How do primary stakeholders (focus group) in the Existing Industry Training
program perceive the findings of this study and potential impacts on the program?
Question number one was addressed by analyzing archived data collected from
the Business and Industry Services (BIS) division of the Oklahoma Department of Career
and Technology Education (ODCTE) in Stillwater, Oklahoma. This data was available
for all 29 technology center school districts. The researcher also obtained additional
necessary data from a questionnaire survey concerning economic impact and return on
investment.
Questions two and three were addressed by developing and administering a
customer satisfaction questionnaire that was mailed to all past users of training conducted
under the Existing Industry Training program. Question four was addressed through a
focus group procedure during which the researcher presented the study data to relevant
stakeholders for analysis and discussion.
54
Design
This study was descriptive in nature. Fraenkel & Wallen defined descriptive
studies as those “that describe a given state of affairs as fully and carefully as possible”
(2003, p. 14). Hopkins defined a descriptive study as one within which “…no attempt is
made to change behavior or conditions--you measure things as they are” (2000, p. 1).
Leedy and Ormrod defined descriptive research as that “type of research involving either
identifying the characteristics of an observed phenomenon or exploring possible
correlations among two or more phenomena. In every case, descriptive research
examines a situation as it is” (2001, p. 191).
This study employed both quantitative and qualitative data gathered through
archival data, a survey questionnaire and a focus group. This allows the study to be
classified as mixed methods research, defined by Johnson and Onwuegbuzie as “…the
class of research where the researcher mixes or combines quantitative and qualitative
research techniques, methods, approaches, concepts or language into a single study”
(2004, p. 17). The researcher wanted to ensure that all available pertinent data were
included in the study and thought that that would be impossible without including both
types of data in the study.
Quantitative data are obtained when the variable being studied is measured
along a scale that indicates how much of the variable is present.
Quantitative data are reported in terms of scores. Higher scores indicate
that more of the variable (such as weight, academic ability, self-esteem, or
interest in mathematics) is present than do lower scores (Fraenkel &
Wallen, 2003, p. 200).
55
By contrast, qualitative data can be gathered in a variety of ways and forms
including:
Words or pictures rather than numbers. The kinds of data collected in
qualitative research include interview transcripts, field notes, photographs,
audio recordings, videotapes, diaries, personal comments, memos, official
records, textbook passages, and anything else that can convey the actual
words or actions of people (Fraenkel & Wallen, 2003, p. 431).
The quantitative data gathered for this study included responses to survey
questions that asked respondents to rate their levels of customer satisfaction with the
Existing Industry Training program. The respondents were asked to rate this level of
satisfaction on a Likert-type scale with the highest level of satisfaction being a “5” and
the lowest level of satisfaction being a “1.” Respondents were also asked to provide
quantitative data concerning number of new jobs created, level of employee wages at
time of training, and demographics. Some of the qualitative data for this study were
collected through the use of open-ended questions which allowed the respondents to
explain more fully their particular views and thoughts concerning customer satisfaction
with the Existing Industry Training program. Other qualitative data came from a focus
group of stakeholders in the Existing Industry Training program.
Population and Sample
When considering populations and samples, it is important to understand the
definitions of each and the differences between the two. According to Frankel and
Wallen, a “sample” in a research study refers to any group on which information is
obtained. The larger group to which one hopes to apply the results is called the
“population” (2003, p. 96).
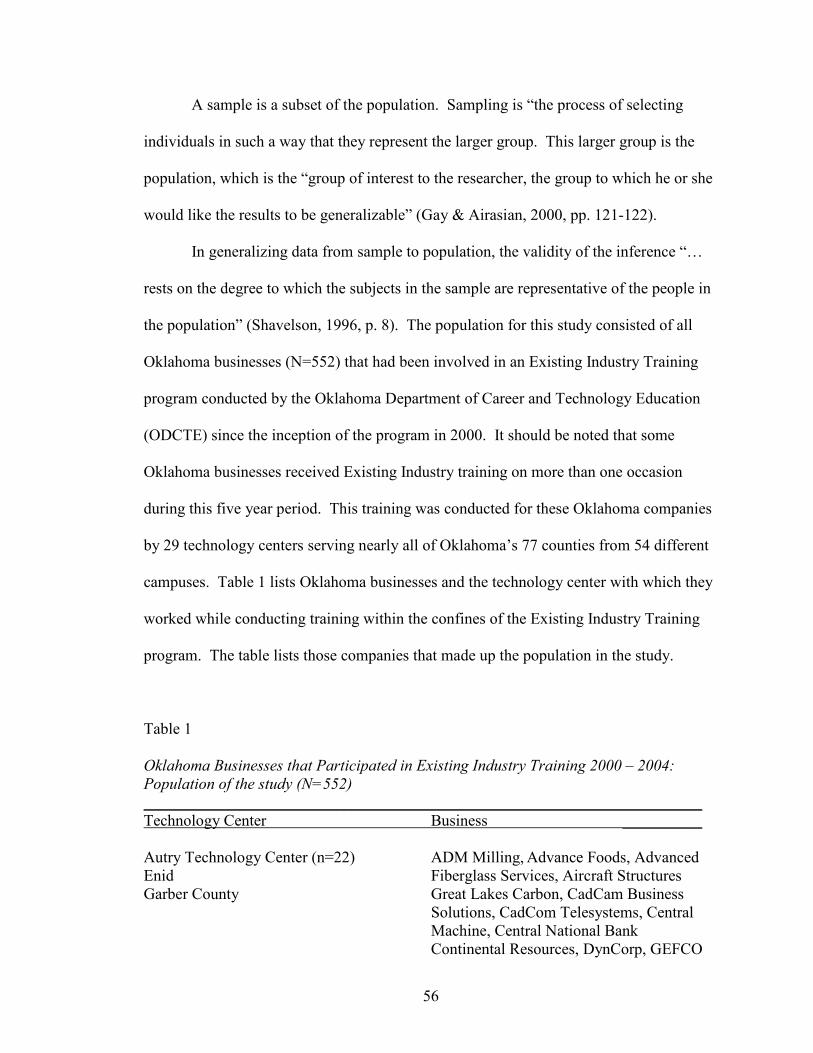
56
A sample is a subset of the population. Sampling is “the process of selecting
individuals in such a way that they represent the larger group. This larger group is the
population, which is the “group of interest to the researcher, the group to which he or she
would like the results to be generalizable” (Gay & Airasian, 2000, pp. 121-122).
In generalizing data from sample to population, the validity of the inference “…
rests on the degree to which the subjects in the sample are representative of the people in
the population” (Shavelson, 1996, p. 8). The population for this study consisted of all
Oklahoma businesses (N=552) that had been involved in an Existing Industry Training
program conducted by the Oklahoma Department of Career and Technology Education
(ODCTE) since the inception of the program in 2000. It should be noted that some
Oklahoma businesses received Existing Industry training on more than one occasion
during this five year period. This training was conducted for these Oklahoma companies
by 29 technology centers serving nearly all of Oklahoma’s 77 counties from 54 different
campuses. Table 1 lists Oklahoma businesses and the technology center with which they
worked while conducting training within the confines of the Existing Industry Training
program. The table lists those companies that made up the population in the study.
Table 1
Oklahoma Businesses that Participated in Existing Industry Training 2000 – 2004: Population of the study (N=552) ______________________________________________________________________Technology Center Business __________
Autry Technology Center (n=22) ADM Milling, Advance Foods, Advanced Enid Fiberglass Services, Aircraft Structures Garber County Great Lakes Carbon, CadCam Business
Solutions, CadCom Telesystems, Central Machine, Central National Bank Continental Resources, DynCorp, GEFCO
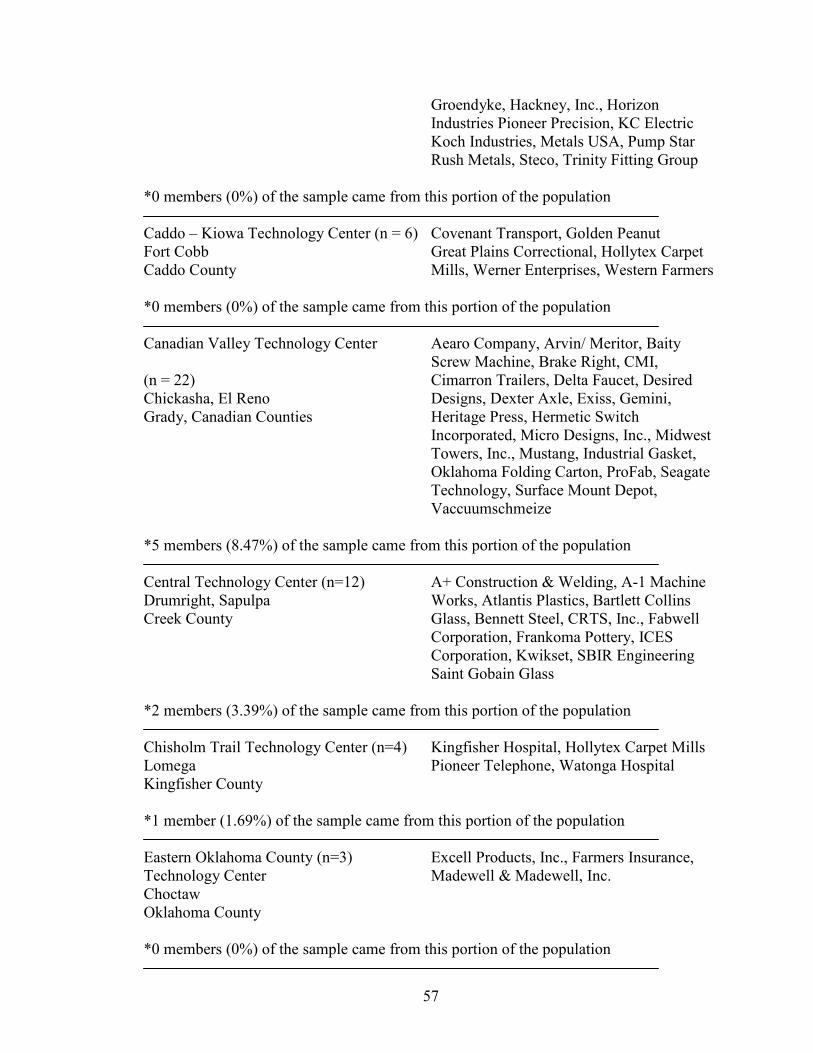
57
Groendyke, Hackney, Inc., Horizon Industries Pioneer Precision, KC Electric
Koch Industries, Metals USA, Pump Star Rush Metals, Steco, Trinity Fitting Group
*0 members (0%) of the sample came from this portion of the population
Caddo – Kiowa Technology Center (n = 6) Covenant Transport, Golden Peanut Fort Cobb Great Plains Correctional, Hollytex Carpet Caddo County Mills, Werner Enterprises, Western Farmers
*0 members (0%) of the sample came from this portion of the population
Canadian Valley Technology Center Aearo Company, Arvin/ Meritor, Baity Screw Machine, Brake Right, CMI, (n = 22) Cimarron Trailers, Delta Faucet, Desired Chickasha, El Reno Designs, Dexter Axle, Exiss, Gemini, Grady, Canadian Counties Heritage Press, Hermetic Switch
Incorporated, Micro Designs, Inc., Midwest Towers, Inc., Mustang, Industrial Gasket, Oklahoma Folding Carton, ProFab, Seagate Technology, Surface Mount Depot, Vaccuumschmeize
*5 members (8.47%) of the sample came from this portion of the population
Central Technology Center (n=12) A+ Construction & Welding, A-1 Machine Drumright, Sapulpa Works, Atlantis Plastics, Bartlett Collins Creek County Glass, Bennett Steel, CRTS, Inc., Fabwell
Corporation, Frankoma Pottery, ICES Corporation, Kwikset, SBIR Engineering Saint Gobain Glass
*2 members (3.39%) of the sample came from this portion of the population
Chisholm Trail Technology Center (n=4) Kingfisher Hospital, Hollytex Carpet Mills Lomega Pioneer Telephone, Watonga Hospital Kingfisher County *1 member (1.69%) of the sample came from this portion of the population
Eastern Oklahoma County (n=3) Excell Products, Inc., Farmers Insurance, Technology Center Madewell & Madewell, Inc. Choctaw Oklahoma County *0 members (0%) of the sample came from this portion of the population
58
Francis Tuttle Technology Center (n=34) Acker Industries, Autocraft Industries, Oklahoma City Bridgestone Firestone, CMI, Climate Oklahoma County Master, Chef’s Requested Foods, DataModes, Daniluk, Eaton Corporation, GENCO, Governair, Hobby Lobby, IEC,
International Environmental, ISO Consortium, Jet Services, Jetta Corp.,
Kim Ray, L&S Automotive Products, Lean Manufacturing, Little Giant Pump, Metal Container, PepeTools, Inc., Pro-Cert,
Printing, Inc., Ralston Purina, Reynolds & Reynolds, Richardson Foods, SemaSys, Steel Fabricators, Taylor Valve, Trinity,
Unit Parts, Xsequor *0 members (0%) of the sample came from this portion of the population
Gordon Cooper Technology Center (n=21) American Correctional Industries, Artic Shawnee Temp., Central Plastics, DISA Goff, Inc., Pottowatomie County Eaton Corporation, Enviro Systems, Exxon
Mobile, Goodhope Machine, Higgins Aviation, Mobile Chemical, Oklahoma Waffles, Shawnee Fabricators, Shawnee Milling, TDGI, TDK, TS&H, Tinker, Train the Trainer SLC500, Upinor, Wood Group,
Wolverine Tube *4 members (6.78%) of the sample came from this portion of the population
Great Plains Technology Center (n=31) Advance Systems Technology, Advancia, Lawton Advance/Eagle/Titan, Assurant Group, Commanche County Ayers Nursing Home, Bar-S Foods, C&C Distributors, Cosmetic Specialty Labs, Drewry Communications, Eagle AST,
Eagle Controls, Eagle Systems, Frederick Hospital, Goodyear, Great Plains, ISIS, ITT, KSWO, Lawton Constitution, Memorial Hospital, Metzeier Automotive, Pippin Bros, Inc., Quality Baking Company, Republic Paperboard, Shifflett, Silverline Plastics, Southwest Machine Tool, Telso, Tempe Inland, Winian Oaks Living Center, Winter Oaks Living Center
*0 members (0%) of the sample came from this portion of the population
Green Country Technology Center (n=15) Alliance American, American Exchange Okmulgee Bank, Anchor Glass, Braden Cargo,
59
Okmulgee County Beeline Products, CP Kelco, Callidus Technologies, Cobra Manufacturing,
Kelco Biopolymers, Morris State Bank, NDE Pipeline, Operating Engineers Local 2B, Parker Hannifin/Racor, Polyvision,
Swearingen Machine Shop *1 member (1.69%) of the sample came from this portion of the population High Plains Technology Center (n=19) Cactus Drilling, Cheyenne Drilling, Woodward Deepwater Chemicals, Emergency Medical Woodward County Services, Heritage Manor, Key Energy,
Mutual of Omaha, NW Electric, Newman Memorial Hospital, Northwest Crane Services, Patterson Drilling, Seaboard, Terra International, Unibridge Systems, Unit Drilling, Unit Rig, Weatherford Artificial Lift, Western Farmers, Woodward Iodine
*6 members (10.17%) of the sample came from this portion of the population Indian Capital Technology Center (n=15) American Foundry, Borg Warner, Baldor Muskogee Electric, Cherokee Nation Industries, East Muskogee County Pointe Manufacturing, Fort James, Georgia
Pacific, Gerber Coburn, Life Line Communications, Manufacturing Companies, Mrs. Smith’s Bakery, Park Mfg./Blue Wave Boats, Schrader Bridgeport, Waterlow Industries, Whitlock Packaging Corp.
*0 members (0%) of the sample came from this portion of the population Kiamichi Technology Center (n=29) AES Shady Point, Allied Stone, Inc., Wilburton Bibler Brothers Lumber, Boeing, Choctaw Multiple Counties Manufacturing, Coleman, Custom Molded
Plastics, Deepwater, Franklin Electric, Haskell County Health Care, Huntsman Packaging, Kiamichi Area Stone Alliance,
Latimer County Hospital, National Oilwell, Pliant Corporation, Pre-Paid Legal, R&R Monogramming, Rosewood, Simmons,
Simonton Windows, Southeast Alarm, Southeast Public Library, Sundowner Trailers, TotalNet Management, Unifirst,
VIP Webcoat, Western Farmers, Weyerhauser, Wortz Companies
60
*4 members (6.78%) of the sample came from this portion of the population
Meridian Technology Center (n=16) Armstrong World Industries, Audio Stillwater Innovations, Autoquip, Charles Machine Payne County Works, Creative Labs, Inc., Fluid
Technologies, Inc., Frontier Electronic Center, Logan County Hospital, Mercruiser, National Standard, Perry Memorial Hospital, Quebecor World,
Railroad, Red Gate, REN Corporation, Tech Trol *0 members (0%) of the sample came from this portion of the population
Metro Technology Center (n=17) Ace Metal Finishing, Advanced Financial Oklahoma City Solutions, Chef’s Requested Foods, Oklahoma County Cingular Wireless, Clean-It, Clement Foods,
CNC Metal Products, Dallas-Miller Logistics, International Environmental,
Lamson & Sessions, Lucas Color Card, Morrison Distribution, Phi Technologies,
Public Supply, Resources, Inc., Total Protection Services, W.H. Stewart
*2 members (3.39%) of the sample came from this portion of the population
Mid America Technology Center (n=8) Barrett Trailer, Chicago Miniature Lamps, Wayne Curwood, FairMeds.Com, Rural Electric McClain County Cooperative, Sharp Metal Fabricators, Viskase Corp., Walker & Sons *0 members (0%) of the sample came from this portion of the population
Mid-Del Technology Centers (n=22) Accurate Labs, American Airlines, Arinc, Oklahoma City Chromalloy, Collins & Aikman (Textron), Oklahoma County Dana Chassis, Dana Corporation, Dana
Wix, Day & Zimmerman, Defense Logic Agency (DLA), Evans Electric, Fred Jones Ford, MTM Recognition, Ordermatic Corporation, Quad Graphics, SMC Technologies, Inc., Sooner Lift, Southwest / American Airlines, Stately, Inc., Textron, Western Plastics, Wood Group
*2 members (3.39%) of the sample came from this portion of the population
Moore Norman Technology Center (n=31) A&J Industries, A&H Fabricators, ARDCO, Moore, Norman Beam’s Industries, Benham Infrastructure,
61
Cleveland County Bio-Cide International, Boise Express, Boise Office Products, Cendant Travel, Charles Machine Work, CMP Corporation, Coorstek, Dana Wix, Enviro Systems,
Flow Boy, Fowler Design Group, Hitachi Corporation, KF Industries, Machine Tool Enterprise, Inc., McKinney Partnership,
RadioTronix, Risk Metrics Group, Shaklee, Southwestern Wire, Tinker,
Tower Tech, Vaughan Foods, Weather Decision Tech, Inc., Weather News,
Yamanouchi/Shaklee, York International *0 members (0%) of the sample came from this portion of the population
Northeast Technology Center (n=25) Advance Mfg. & Hope Industries, Prior AeroStar International, Automotive Services Multiple Counties Blitz USA, Cinch Manufacturing, Control
Components, Dana Corp., Boston Weatherhead, Dura-Line, Garner Garage,
GLMC, Grand River Dam Authority, Hope Industries, Labinal, Inc., Lakewood Cabinetry, Malone’s CNC Machining, Inc., Newell, Nupar Manufacturing, Precision Manufacturing & Machine, Quality Wood Products, Sawdust Factory, Tracker Marine Group, Umicore,
UPCO, Verdigris Valley Industrial Council, Worthington Industries *7 members (11.86%) of the sample came from this portion of the population
Northwest Technology Center (n=21) Beadles Nursing Home, Cargill Salt, Alva, Fairview Chesapeake Energy, Community National Woods, Major Counties Bank, Davidson Electric, Fairview
Fellowship Home, Fairview Municipal Hospital, Fairview Savings and Loan,
Farmer’s Merchant’s Bank, GammaStream, IO-2 Services, Long Term Care, Mabar, Inc., Marten’s Equipment, Mobile Products,
Plane Plastics, Progressive Windows, U.S. Gypsum, Value Added Products, Waldon, Inc., Western Gas *10 members (16.95%) of the sample came from this portion of the population
Pioneer Technology Center (n=26) Air Systems Components, Albertson, Ponca City Asbury Machine, Bippo, Inc., Concraft,
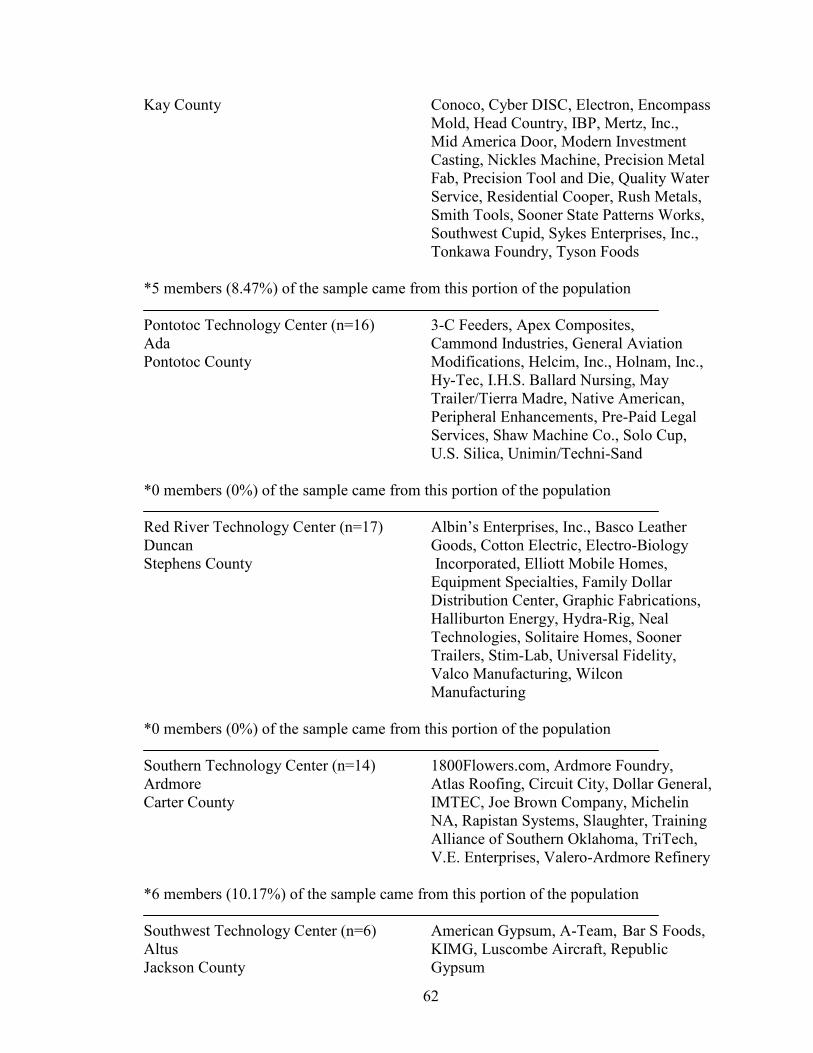
62
Kay County Conoco, Cyber DISC, Electron, Encompass Mold, Head Country, IBP, Mertz, Inc., Mid America Door, Modern Investment Casting, Nickles Machine, Precision Metal Fab, Precision Tool and Die, Quality Water Service, Residential Cooper, Rush Metals,
Smith Tools, Sooner State Patterns Works, Southwest Cupid, Sykes Enterprises, Inc., Tonkawa Foundry, Tyson Foods *5 members (8.47%) of the sample came from this portion of the population
Pontotoc Technology Center (n=16) 3-C Feeders, Apex Composites, Ada Cammond Industries, General Aviation Pontotoc County Modifications, Helcim, Inc., Holnam, Inc.,
Hy-Tec, I.H.S. Ballard Nursing, May Trailer/Tierra Madre, Native American, Peripheral Enhancements, Pre-Paid Legal Services, Shaw Machine Co., Solo Cup,
U.S. Silica, Unimin/Techni-Sand *0 members (0%) of the sample came from this portion of the population
Red River Technology Center (n=17) Albin’s Enterprises, Inc., Basco Leather Duncan Goods, Cotton Electric, Electro-Biology Stephens County Incorporated, Elliott Mobile Homes,
Equipment Specialties, Family Dollar Distribution Center, Graphic Fabrications, Halliburton Energy, Hydra-Rig, Neal Technologies, Solitaire Homes, Sooner Trailers, Stim-Lab, Universal Fidelity, Valco Manufacturing, Wilcon Manufacturing
*0 members (0%) of the sample came from this portion of the population
Southern Technology Center (n=14) 1800Flowers.com, Ardmore Foundry, Ardmore Atlas Roofing, Circuit City, Dollar General, Carter County IMTEC, Joe Brown Company, Michelin
NA, Rapistan Systems, Slaughter, Training Alliance of Southern Oklahoma, TriTech,
V.E. Enterprises, Valero-Ardmore Refinery *6 members (10.17%) of the sample came from this portion of the population
Southwest Technology Center (n=6) American Gypsum, A-Team, Bar S Foods, Altus KIMG, Luscombe Aircraft, Republic Jackson County Gypsum
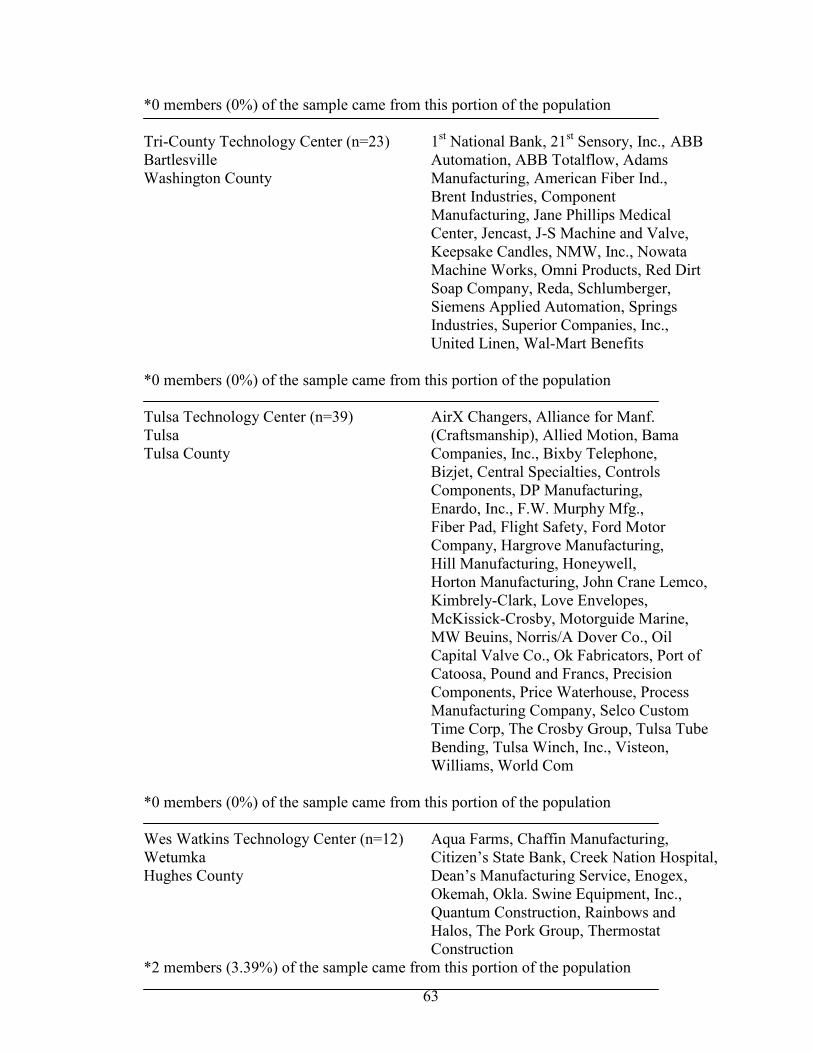
63
*0 members (0%) of the sample came from this portion of the population
Tri-County Technology Center (n=23) 1st National Bank, 21st Sensory, Inc., ABB Bartlesville Automation, ABB Totalflow, Adams Washington County Manufacturing, American Fiber Ind.,
Brent Industries, Component Manufacturing, Jane Phillips Medical Center, Jencast, J-S Machine and Valve, Keepsake Candles, NMW, Inc., Nowata Machine Works, Omni Products, Red Dirt Soap Company, Reda, Schlumberger, Siemens Applied Automation, Springs Industries, Superior Companies, Inc.,
United Linen, Wal-Mart Benefits *0 members (0%) of the sample came from this portion of the population
Tulsa Technology Center (n=39) AirX Changers, Alliance for Manf. Tulsa (Craftsmanship), Allied Motion, Bama Tulsa County Companies, Inc., Bixby Telephone,
Bizjet, Central Specialties, Controls Components, DP Manufacturing,
Enardo, Inc., F.W. Murphy Mfg., Fiber Pad, Flight Safety, Ford Motor Company, Hargrove Manufacturing,
Hill Manufacturing, Honeywell, Horton Manufacturing, John Crane Lemco,
Kimbrely-Clark, Love Envelopes, McKissick-Crosby, Motorguide Marine, MW Beuins, Norris/A Dover Co., Oil Capital Valve Co., Ok Fabricators, Port of Catoosa, Pound and Francs, Precision Components, Price Waterhouse, Process Manufacturing Company, Selco Custom Time Corp, The Crosby Group, Tulsa Tube Bending, Tulsa Winch, Inc., Visteon,
Williams, World Com *0 members (0%) of the sample came from this portion of the population
Wes Watkins Technology Center (n=12) Aqua Farms, Chaffin Manufacturing, Wetumka Citizen’s State Bank, Creek Nation Hospital, Hughes County Dean’s Manufacturing Service, Enogex, Okemah, Okla. Swine Equipment, Inc.,
Quantum Construction, Rainbows and Halos, The Pork Group, Thermostat Construction
*2 members (3.39%) of the sample came from this portion of the population
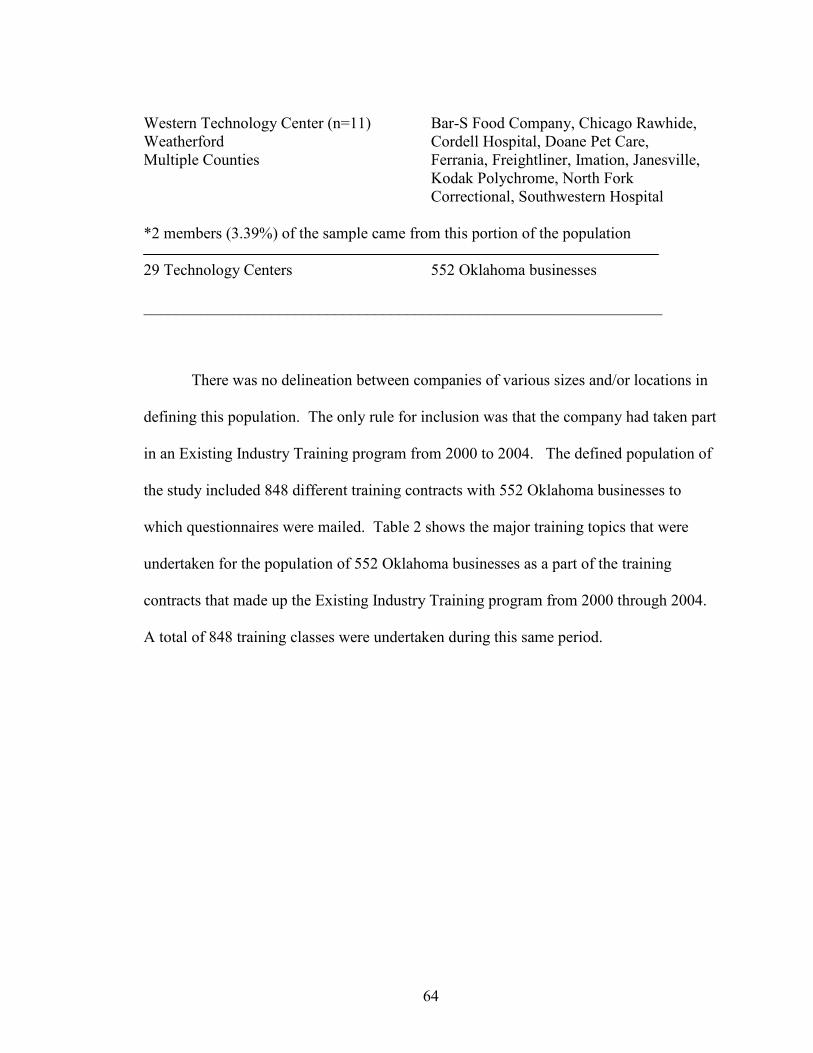
64
Western Technology Center (n=11) Bar-S Food Company, Chicago Rawhide, Weatherford Cordell Hospital, Doane Pet Care, Multiple Counties Ferrania, Freightliner, Imation, Janesville,
Kodak Polychrome, North Fork Correctional, Southwestern Hospital
*2 members (3.39%) of the sample came from this portion of the population
29 Technology Centers 552 Oklahoma businesses
_________________________________________________________________
There was no delineation between companies of various sizes and/or locations in
defining this population. The only rule for inclusion was that the company had taken part
in an Existing Industry Training program from 2000 to 2004. The defined population of
the study included 848 different training contracts with 552 Oklahoma businesses to
which questionnaires were mailed. Table 2 shows the major training topics that were
undertaken for the population of 552 Oklahoma businesses as a part of the training
contracts that made up the Existing Industry Training program from 2000 through 2004.
A total of 848 training classes were undertaken during this same period.
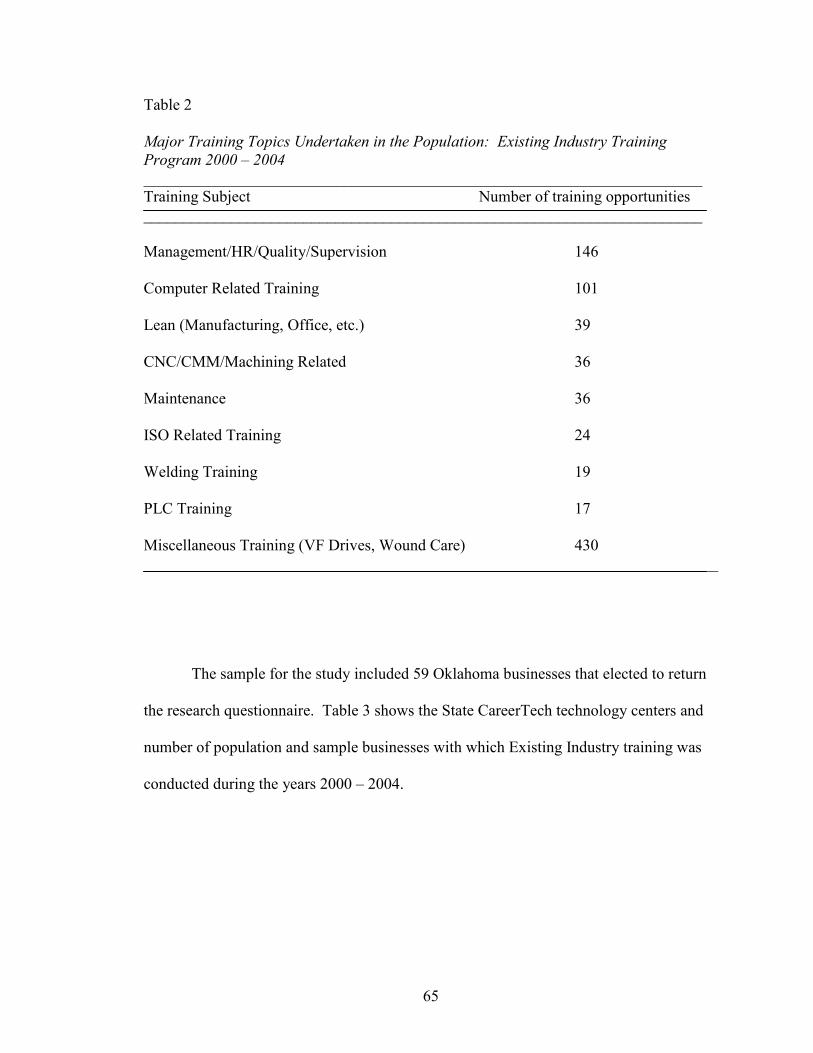
65
Table 2
Major Training Topics Undertaken in the Population: Existing Industry Training Program 2000 – 2004 ______________________________________________________________________ Training Subject Number of training opportunities ______________________________________________________________________
Management/HR/Quality/Supervision 146
Computer Related Training 101
Lean (Manufacturing, Office, etc.) 39
CNC/CMM/Machining Related 36
Maintenance 36
ISO Related Training 24
Welding Training 19
PLC Training 17
Miscellaneous Training (VF Drives, Wound Care) 430 ________________________________________________________________________
The sample for the study included 59 Oklahoma businesses that elected to return
the research questionnaire. Table 3 shows the State CareerTech technology centers and
number of population and sample businesses with which Existing Industry training was
conducted during the years 2000 – 2004.
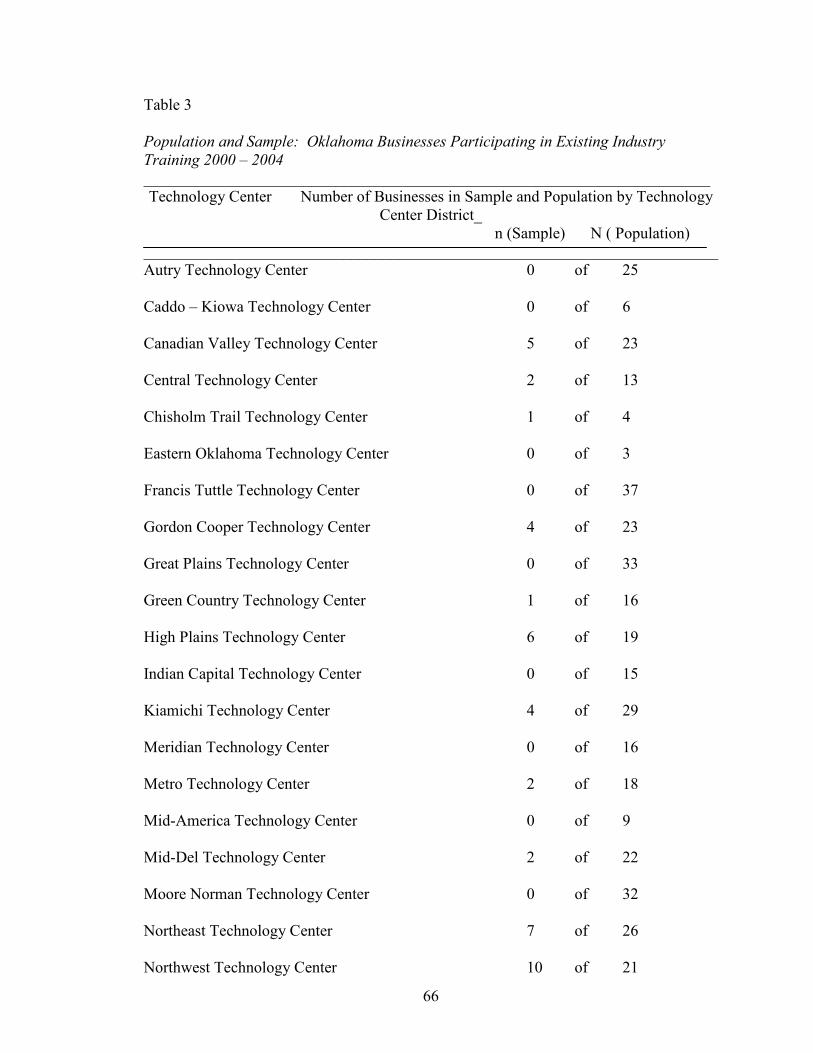
66
Table 3
Population and Sample: Oklahoma Businesses Participating in Existing Industry Training 2000 – 2004 _______________________________________________________________________ Technology Center Number of Businesses in Sample and Population by Technology
Center District_ n (Sample) N ( Population) ________________________________________________________________________ Autry Technology Center 0 of 25
Caddo – Kiowa Technology Center 0 of 6
Canadian Valley Technology Center 5 of 23
Central Technology Center 2 of 13
Chisholm Trail Technology Center 1 of 4
Eastern Oklahoma Technology Center 0 of 3
Francis Tuttle Technology Center 0 of 37
Gordon Cooper Technology Center 4 of 23
Great Plains Technology Center 0 of 33
Green Country Technology Center 1 of 16
High Plains Technology Center 6 of 19
Indian Capital Technology Center 0 of 15
Kiamichi Technology Center 4 of 29
Meridian Technology Center 0 of 16
Metro Technology Center 2 of 18
Mid-America Technology Center 0 of 9
Mid-Del Technology Center 2 of 22
Moore Norman Technology Center 0 of 32
Northeast Technology Center 7 of 26
Northwest Technology Center 10 of 21
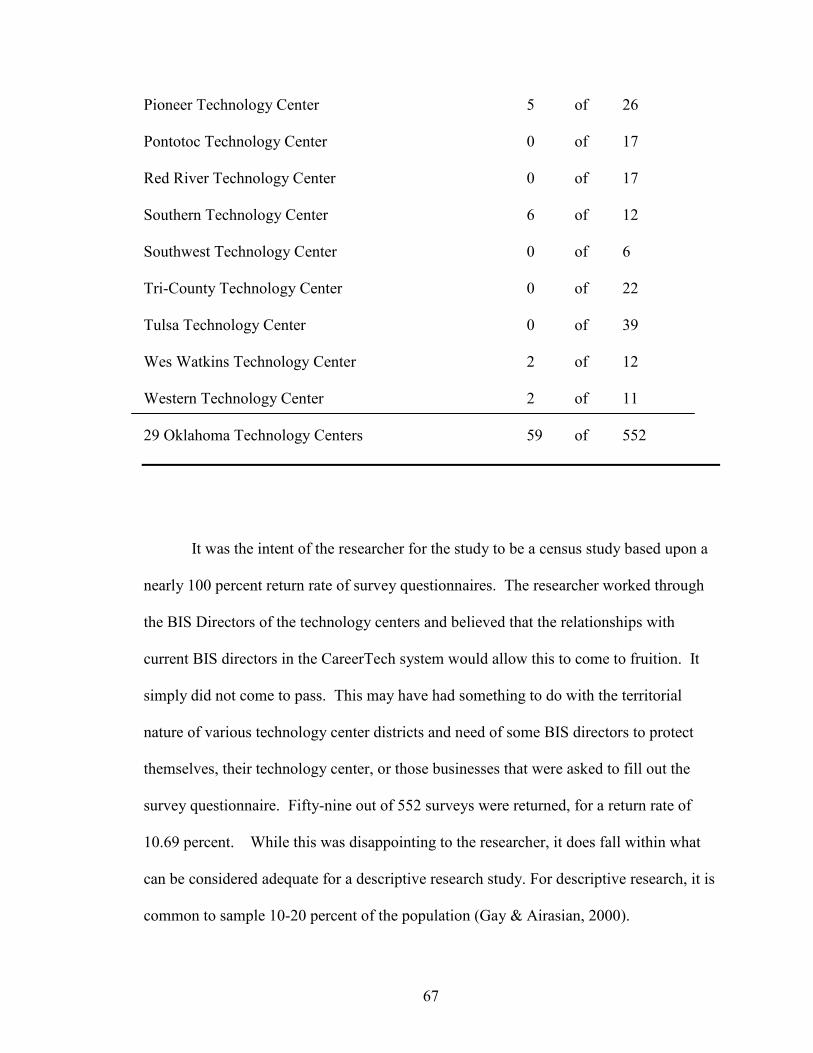
67
Pioneer Technology Center 5 of 26
Pontotoc Technology Center 0 of 17
Red River Technology Center 0 of 17
Southern Technology Center 6 of 12
Southwest Technology Center 0 of 6
Tri-County Technology Center 0 of 22
Tulsa Technology Center 0 of 39
Wes Watkins Technology Center 2 of 12
Western Technology Center 2 of 11
29 Oklahoma Technology Centers 59 of 552
It was the intent of the researcher for the study to be a census study based upon a
nearly 100 percent return rate of survey questionnaires. The researcher worked through
the BIS Directors of the technology centers and believed that the relationships with
current BIS directors in the CareerTech system would allow this to come to fruition. It
simply did not come to pass. This may have had something to do with the territorial
nature of various technology center districts and need of some BIS directors to protect
themselves, their technology center, or those businesses that were asked to fill out the
survey questionnaire. Fifty-nine out of 552 surveys were returned, for a return rate of
10.69 percent. While this was disappointing to the researcher, it does fall within what
can be considered adequate for a descriptive research study. For descriptive research, it is
common to sample 10-20 percent of the population (Gay & Airasian, 2000).
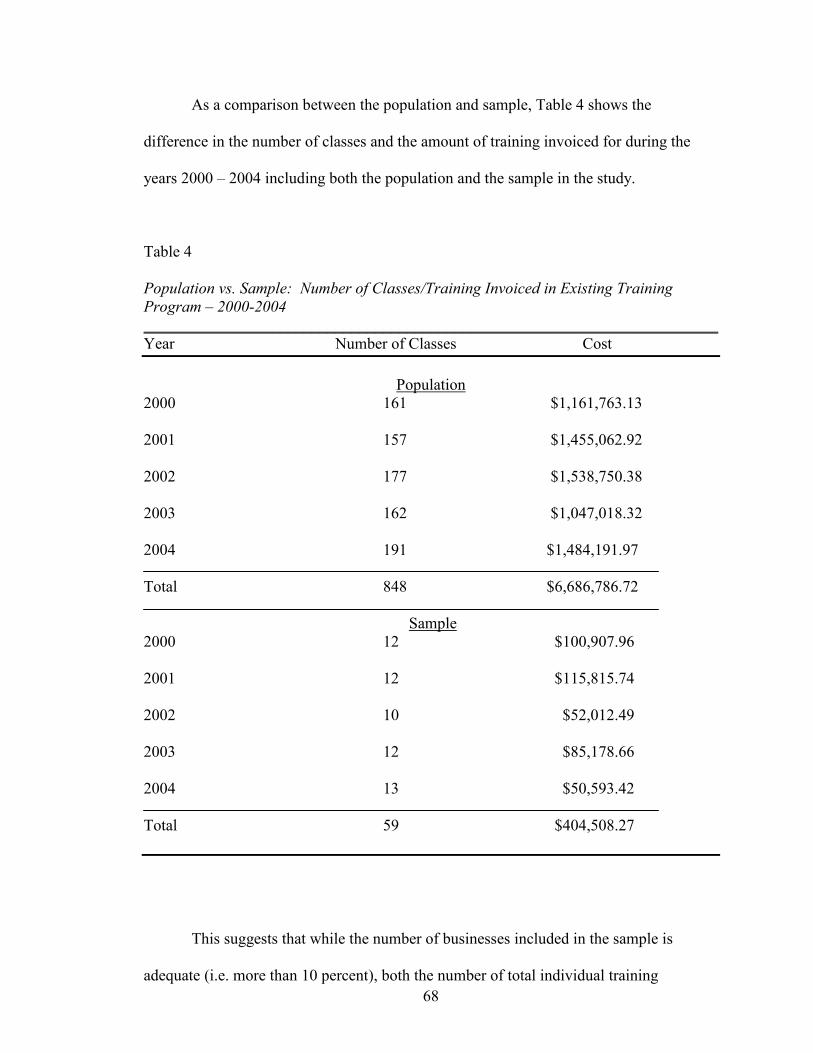
68
As a comparison between the population and sample, Table 4 shows the
difference in the number of classes and the amount of training invoiced for during the
years 2000 – 2004 including both the population and the sample in the study.
Table 4
Population vs. Sample: Number of Classes/Training Invoiced in Existing Training Program – 2000-2004 ________________________________________________________________________Year Number of Classes Cost
Population2000 161 $1,161,763.13 2001 157 $1,455,062.92 2002 177 $1,538,750.38 2003 162 $1,047,018.32 2004 191 $1,484,191.97 Total 848 $6,686,786.72
Sample2000 12 $100,907.96 2001 12 $115,815.74 2002 10 $52,012.49 2003 12 $85,178.66 2004 13 $50,593.42 Total 59 $404,508.27
This suggests that while the number of businesses included in the sample is
adequate (i.e. more than 10 percent), both the number of total individual training
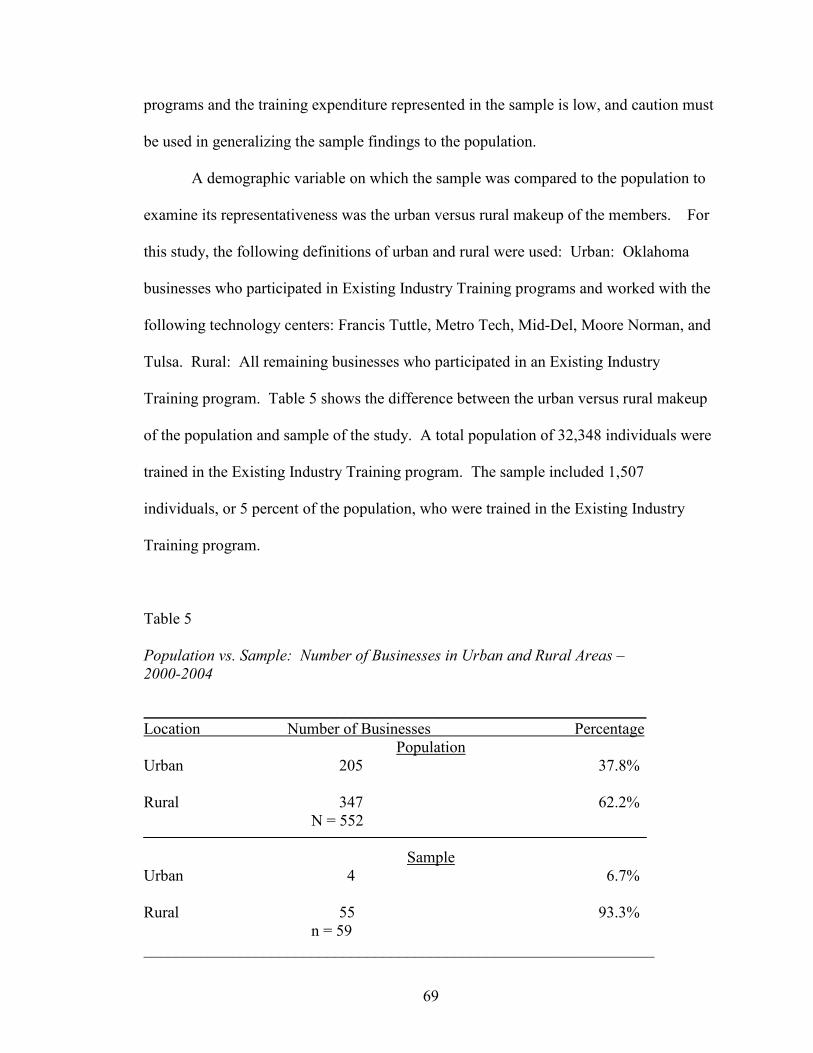
69
programs and the training expenditure represented in the sample is low, and caution must
be used in generalizing the sample findings to the population.
A demographic variable on which the sample was compared to the population to
examine its representativeness was the urban versus rural makeup of the members. For
this study, the following definitions of urban and rural were used: Urban: Oklahoma
businesses who participated in Existing Industry Training programs and worked with the
following technology centers: Francis Tuttle, Metro Tech, Mid-Del, Moore Norman, and
Tulsa. Rural: All remaining businesses who participated in an Existing Industry
Training program. Table 5 shows the difference between the urban versus rural makeup
of the population and sample of the study. A total population of 32,348 individuals were
trained in the Existing Industry Training program. The sample included 1,507
individuals, or 5 percent of the population, who were trained in the Existing Industry
Training program.
Table 5 Population vs. Sample: Number of Businesses in Urban and Rural Areas – 2000-2004 _______________________________________________________________Location Number of Businesses Percentage
PopulationUrban 205 37.8% Rural 347 62.2% N = 552
SampleUrban 4 6.7% Rural 55 93.3% n = 59________________________________________________________________
70
The researcher ran a χ2 statistical analysis on the above data. This
(observed – expected) χ2 = Σ --------------------
expected statistical analysis yielded a chi-square of 23.49 with 1 degree of freedom at an alpha
level (p) of .00. These data indicate that the number of trained individuals represented in
the sample is small (i.e. 5 percent), and that the sample has a significantly different
urban/rural make-up from the population. These are additional indications of reasons for
caution in generalizing the sample findings to the population.
A second demographic variable on which the sample was compared with the
population to determine its representativeness was the sizes of the businesses. For this
study, small, medium, and large businesses were defined as follows:
Small: 0 – 100 employees
Medium: 101 – 300 employees
Large: 301 + employees
Table 6 shows the number of businesses of each size in the population and
sample. For this comparison, only 2004 data were used because data for previous years
were not available.
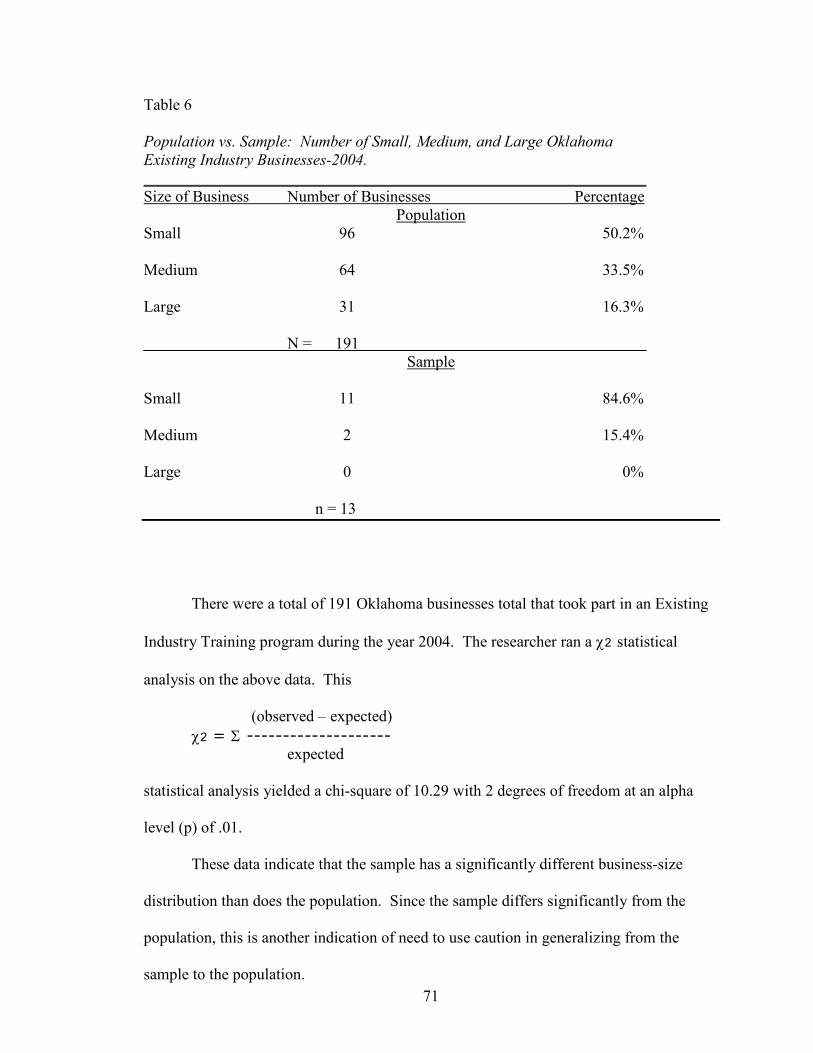
71
Table 6
Population vs. Sample: Number of Small, Medium, and Large Oklahoma Existing Industry Businesses-2004. _______________________________________________________________Size of Business Number of Businesses Percentage
PopulationSmall 96 50.2% Medium 64 33.5% Large 31 16.3%
N = 191 Sample
Small 11 84.6% Medium 2 15.4% Large 0 0%
n = 13
There were a total of 191 Oklahoma businesses total that took part in an Existing
Industry Training program during the year 2004. The researcher ran a χ2 statistical
analysis on the above data. This
(observed – expected) χ2 = Σ --------------------
expected statistical analysis yielded a chi-square of 10.29 with 2 degrees of freedom at an alpha
level (p) of .01.
These data indicate that the sample has a significantly different business-size
distribution than does the population. Since the sample differs significantly from the
population, this is another indication of need to use caution in generalizing from the
sample to the population.
72
The researcher should always exercise caution when attempting to generalize the
findings of the sample to the population of a study. It is generally preferable to the
researcher to be able to generalize the findings of the sample to the population.
According to Frankel and Wallen:
Population generalizability refers to the degree to which a sample
represents the population of interest. If the results of a study only apply to
the group being studied, and if that group is fairly small or is narrowly
defined, the usefulness of any findings is seriously limited (2003, p. 109).
Since, in this study, the sample is small (n=59) as compared to the overall
population (N=552) of the study, and differs significantly from the population on at least
two important demographic variables, the researcher suggests that great caution be used
when attempting to generalize the findings. For this reason, data analysis was entirely
descriptive and no inferential statistics were applied in this study.
Data Sources and Instrumentation
Archived Data from ODCTE
The researcher worked with officials at the Oklahoma Department of Career and
Technology Education (ODCTE) to secure archived data for the Existing Industry
Training Program during the years, 2000 – 2004. This archived data included the project
number, date of training, technology center involved in each training contract, Oklahoma
business involved in that particular training contract, type of training, number of
employees at that particular Oklahoma business, number of employees trained in that
particular training project, and cost of that particular training project. The researcher, as
well as officials at ODCTE, recognized that this type of research offered a comprehensive
73
opportunity to empirically study the Existing Industry Training Program for the first time
ever.
Questionnaire
The questionnaire used in the study was developed based on a questionnaire that
was previously employed by the researcher during a Master’s thesis research project.
The questionnaire was constructed so as to allow for collection of data from several
different perspectives. The questionnaire is available in Appendix A for review.
The first section of the questionnaire asked the participating Oklahoma businesses
to rate their level of satisfaction with the Existing Industry Training program. There were
five questions that included data concerning each company’s opinion concerning the
level of satisfaction in the following areas:
1. Local technology staff assistance during Existing Industry Training
program.
2. Timeliness of response by local technology center staff upon initial
request for training.
3. Communication between the Oklahoma business and the local technology
center staff during Existing Industry Training program.
4. Handling of problems (if applicable) by local technology center staff
during Existing Industry Training program.
5. Rating of overall experince by Oklahoma comp any with Existing
Industry training program.
These questions were formatted such that the respondent was asked to rate
each question using a five-point Likert type scale. Response was made by
circling the appropriate number, using the following scale:
74
1 = Very Dissatisfied
2 = Dissatisfied
3 = No Opinion
4 = Satisfied
5 = Very Satisfied
The second section of the questionnaire asked some open-ended questions
concerning what each business “liked the most” concerning the Existing Industry training
program. It also included questions concerning what each business “liked the least,” and
what these businesses “would like to see changed about the Existing Industry Training
program.” Finally, each business was asked to “describe or explain the results or effects
of the training received through the Existing Industry Training program” on its business.
The third section of the questionnaire asked some specific questions concerning
the return on investment and economic impact of training provided through the Existing
Industry training program, including:
1. Number of jobs created as a result of Existing Industry Training program.
2. Average wage (per hour) for new employees at the time they received
training as part of the Existing Industry Training program.
3. Number of these employees still employed today.
4. Average wage (per hour) of these employees today.
5. Average wage (per hour) of existing employees at the time they received
training as part of the Existing Industry Training program.
6. Number of existing employees still employed today.
7. Average wage (per hour) of existing employees today.
75
8. Amount of monies saved, realized, and/or gained (increased output,
improved efficiency, improved profits, fewer accidents, less down time,
etc.) as a result of the Existing Industry Training program over the five
year period 2000 – 2004.
The final section of the questionnaire asked each Oklahoma business to supply
demographic information about its particular company, including location by county, size
of community within which the business resides, number of employees, and gross sales
for the previous year.
Focus Group
A focus group interview is an inexpensive, rapid appraisal technique that can
provide managers with a wealth of qualitative information on performance of
development activities, services, and products, or other issues (Kumar, 1987, p. 1).
Following are some guidelines for selecting participants for focus groups:
Most focus groups research relies on purposive sampling with researchers
selecting participants based on the project and on the potential
contributions of participants. Alternatively, participants can be randomly
selected form a larger group that should be able to give insight into a topic
(Barnett,2005; Miles & Huberman,1984, p. 1).
The researcher used purposive sampling to develop a focus group of stakeholders,
and scheduled a meeting in May, 2005, to review the findings of the research study.
Procedures
Archived Data from ODCTE
The researcher worked with officials of ODCTE to obtain archived data
concerning the Existing Industry Training program for the timeframe of 2000 – 2004.
76
There were no problems in obtaining this data, and the data provided a holistic look at the
Existing Industry Training program for the timeframe 2000 – 2004. An example of raw
data is available for review in Appendix B. This data was used in tabulating descriptive
data on the study’s population and sample, and on economic impact and ROI
calculations.
Questionnaire
The questionnaire was developed from a questionnaire previously employed by
the researcher. The questionnaire was submitted to and approved for use by the
Institutional Review Board. The researcher used a small group of Oklahoma BIS
Directors to pilot and validate the questionnaire prior to sending out the 552
questionnaires to the study’s population. From this process, the researcher received some
valuable input concerning how to better present the questionnaire to the population.
Small, non-substantive changes were made to the questionnaire based upon the input of
the pilot group. The questionnaires were then readied and mailed to Oklahoma BIS
Directors to be distributed to each of the 552 Oklahoma businesses that participated in the
Existing Industry Training program.
The researcher sent packets to each BIS Director that contained the questionnaires
for each Oklahoma business that resided within that particular technology center district.
Instructions were included with each packet that asked the BIS Director to mail each
questionnaire to a particular business and follow up the mailing with a phone call. The
BIS Director also had the option of hand delivering the questionnaire to the business.
Postage was included with each questionnaire to allow for return mail of the
questionnaire to the researcher. Out of 59 questionnaires that were returned to the
researcher, 57 of those were mailed directly to the researcher from the businesses. Two
77
were mailed to CareerTech and then forwarded on to the researcher. Also included were
two Participant Consent Forms. Each business was asked to sign both copies of the
Participant Consent Form, fill out the questionnaire, keep one copy of the Participant
Consent Form, and mail the other along with the filled out questionnaire to the
researcher. The questionnaires were mailed out in early November of 2004 and the
sample (n=59) were recovered by early February of 2005.
Focus Group
Focus groups are well established as a qualitative data–gathering tool, and the
definition of the technique is straightforward:
A focus group interview is an interview with a small group (usually four
to eight people) who are asked to think about a series of questions asked
by the interviewer. The participants are seated together in a group and get
to hear one another’s responses to the questions. Often they offer
additional comments beyond what they originally had to say once they
hear the other responses. They may agree or disagree; consensus is
neither necessary or desired. The object is to get at what people really
think about an issue or issues in a social context where participants can
hear the views of others and consider their own views accordingly
(Frankel & Wallen, 2003, p. 462).
The researcher used a focus group in this study in a similar fashion to that used by
Linkenbach (1995). In both studies, the focus group was employed as a sounding board
to review the findings and give input of their knowledge and insights into the data from
the research prior to releasing the results to the general public. This process allowed
78
community stakeholders to provide their own insights, beliefs, and thoughts about the
meaning of the data (Gay & Airasian, 2000).
The focus group was made up of stakeholders from the Existing Industry Training
program process. These individuals included two BIS Directors, Existing Industry
Training program personnel and the BIS department management team members from
the Oklahoma Department of Career and Technology Education (ODCTE). The focus
group meeting was held at the ODCTE in Stillwater, Oklahoma. The focus group was
asked to answer the following questions concerning economic impact, return on
investment, and customer satisfaction.
Focus Group Questions
1. What does the data reveal to you concerning Return on Investment,
Economic Impact and/or Customer Satisfaction concerning the Existing Industry
Training Program? Do you agree with the findings, yes or no, and why?
2. What does the term ROI or Return on Investment mean to you and your
organization? Is it a good idea / bad idea?
3. Please relate you relative knowledge of ROI?
4. What barriers do you see to implementing a coordinated ROI initiative in
your organization?
5. What outcomes (positive/negative) do you see as a result of implementing
a coordinated ROI initiative in your organization?
6. If you do not now employee an ROI initiative in your organization, why
not and do you see any advantages or disadvantages to implementing an ROI initiative in
the near future?
79
7. After reviewing the findings of this study, what are your impressions,
ideas, comments concerning the present situation in the State of Oklahoma as it relates to
the implementation of ROI by Oklahoma businesses?
The proceedings of the meeting were recorded on audio tape and transcribed into
written form. The written transcription from the focus group meeting is available for
review in Appendix C.
Data Analysis
Data analysis was performed on the economic impact and ROI components of the
study using descriptive statistics and the standard ROI calculation formula. Customer
satisfaction data from the research survey of Oklahoma businesses were analyzed with
summary descriptive statistics and cross-tabulations. The data obtained from the focus
group were analyzed qualitatively using content analysis and thematic coding.
80
CHAPTER IV
FINDINGS
Data Collection
The researcher incorporated a variety of methods to collect the data as analyzed
here. For this study, data were collected from archived information at the Oklahoma
Department of Career and Technology Education (ODCTE), from a sample of Oklahoma
businesses (n=59) who elected to take part in an ODCTE Existing Industry Training
program, and through a focus group process modeled after Linkenbach’s Montana
Alcohol Server’s Study (1995).
Data were collected to answer each of the research questions presented in chapters
one and three. Following is the data presentation related to each of the study’s research
questions.
Data Analysis
Research Question 1: Economic Impact and ROI of Existing
Industry Training Program
Research question number one asked, “What is the economic impact and Return
on Investment (ROI) of training conducted within the context of the Existing Industry
Training program by ODCTE?” The researcher used both archived and survey
questionnaire data to answer this question. Economic impact was assessed in terms of
employment, wages, and financial benefits reported by participating Oklahoma
businesses. Table 7 presents relevant data relating to economic impact of the Existing
Industry Training program to the Oklahoma businesses in the sample. Table 7 shows the
data concerning the new jobs created, wages paid, and new employees still employed as a
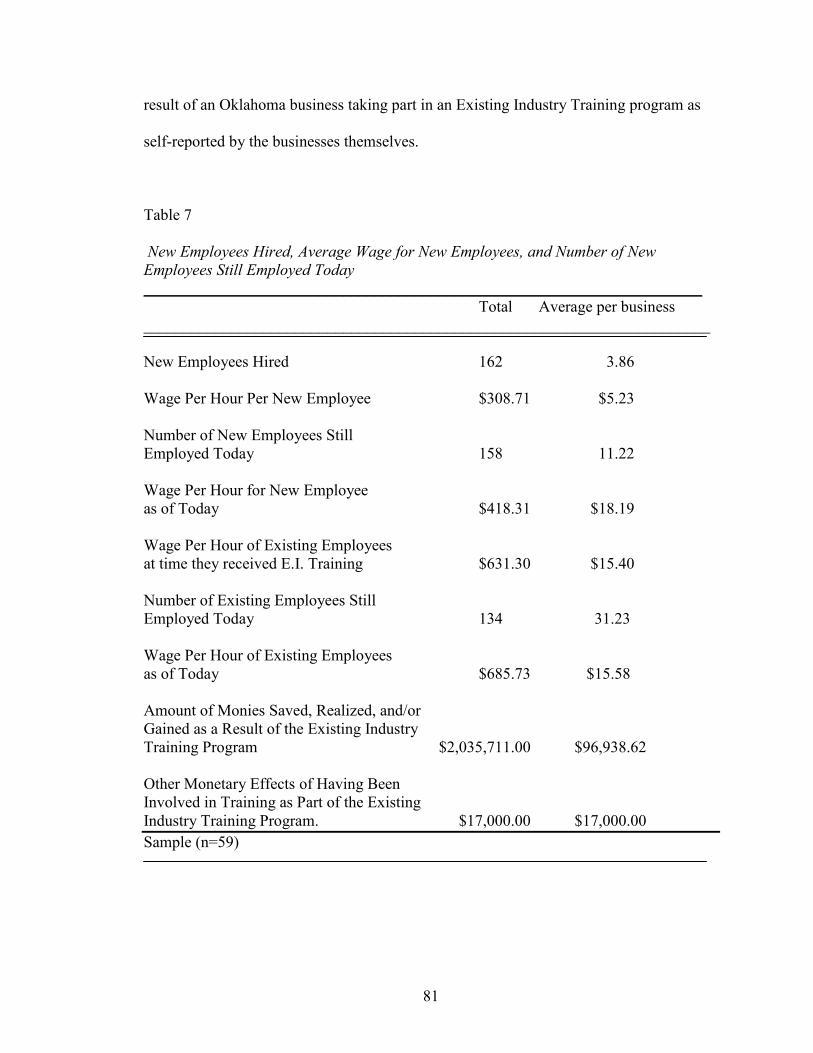
81
result of an Oklahoma business taking part in an Existing Industry Training program as
self-reported by the businesses themselves.
Table 7
New Employees Hired, Average Wage for New Employees, and Number of New Employees Still Employed Today ______________________________________________________________________
Total Average per business _______________________________________________________________________ New Employees Hired 162 3.86 Wage Per Hour Per New Employee $308.71 $5.23 Number of New Employees Still Employed Today 158 11.22 Wage Per Hour for New Employee as of Today $418.31 $18.19 Wage Per Hour of Existing Employees at time they received E.I. Training $631.30 $15.40 Number of Existing Employees Still Employed Today 134 31.23 Wage Per Hour of Existing Employees as of Today $685.73 $15.58 Amount of Monies Saved, Realized, and/or Gained as a Result of the Existing Industry Training Program $2,035,711.00 $96,938.62 Other Monetary Effects of Having Been Involved in Training as Part of the Existing Industry Training Program. $17,000.00 $17,000.00 Sample (n=59)
82
The sample data showed that 162 new employees were hired as a result of an
Oklahoma businesses taking part in an Existing Industry Training program. Of interest to
the researcher was the fact that the average wage for new employees per hour was $7.53.
The average as of the date of the filling out of the survey questionnaire was $15.40. It
would be dangerous to generalize that the training conducted as a part of the Existing
Industry Training program had an effect on the average wage per hour of these
employees. However, there was a large increase over this timeframe. Of course, the
number that represents the largest amount of economic impact was the “Amount of
Monies Saved, Realized, and/or Gained as a result of the Existing Industry Training
Program,” which totaled $2,035,711.00.
To calculate the Return on Investment (ROI) for the Existing Industry Training
program, both cost and benefit data were necessary. ROI calculation requires extensive
costing data, as illustrated in the suggested costing sheets developed by Patricia Phillips.
The above listed data was not available from ODCTE. This study revealed that they do
not collect this data at the present time. Some relevant data were collected as part of the
survey questionnaire sent to the participating Oklahoma businesses. The researcher could
obtain from ODCTE only an overall costing figure which represents the funds spent by
ODCTE to fund the program during the years 2000-2004. This same definition was
applied to the ROI benefits figure. The financial benefits of the program were derived
from the self-reported figures as supplied by members of the sample. The researcher
obtained from the data gathered on the sample (n=59) the cost to the Oklahoma
Department of Career and Technology Education (ODCTE) for conducting Existing
Industry Training. The total cost to the Department for conducting the training equaled
$409,861.30. As reported above, the self-reported amount of monies saved, realized,
83
and/or gained by Oklahoma businesses as a result of taking part in the Existing Industry
Training program during this same period equaled $2,035,711.00. Applying Phillips’
Return on Investment formula, the data revealed the following:
ROI = B – C or Net Benefit x 100C
ROI = $2,035,711.00 – $409,861.30 x 100$409,861.30
Return on Investment = 3.96 x 100 = 396 percent
The above formula yields a Return on Investment of $3.96 for every $1.00
expended by the ODCTE to fund the training conducted for the 59 businesses in the
sample during the years 2000-2004. The researcher understands and readily admits that
all costs incurred by the Oklahoma businesses (e.g. employee wages paid while attending
training, etc.) who took part in Existing Industry Training are not included in the above
equation. The data required for full ROI calculations are presently unavailable in the
ODCTE system.
Research Question 2: General Customer Satisfaction with Existing Industry
Training Program
Research question number two asked, “What is the general level of customer
satisfaction with training conducted in the context of the Existing Industry Training
program by Oklahoma career technology centers for selected Oklahoma businesses?”
Data were collected as part of the survey questionnaire through the use of both five-point
Likert scale items and open-ended response questioning techniques.
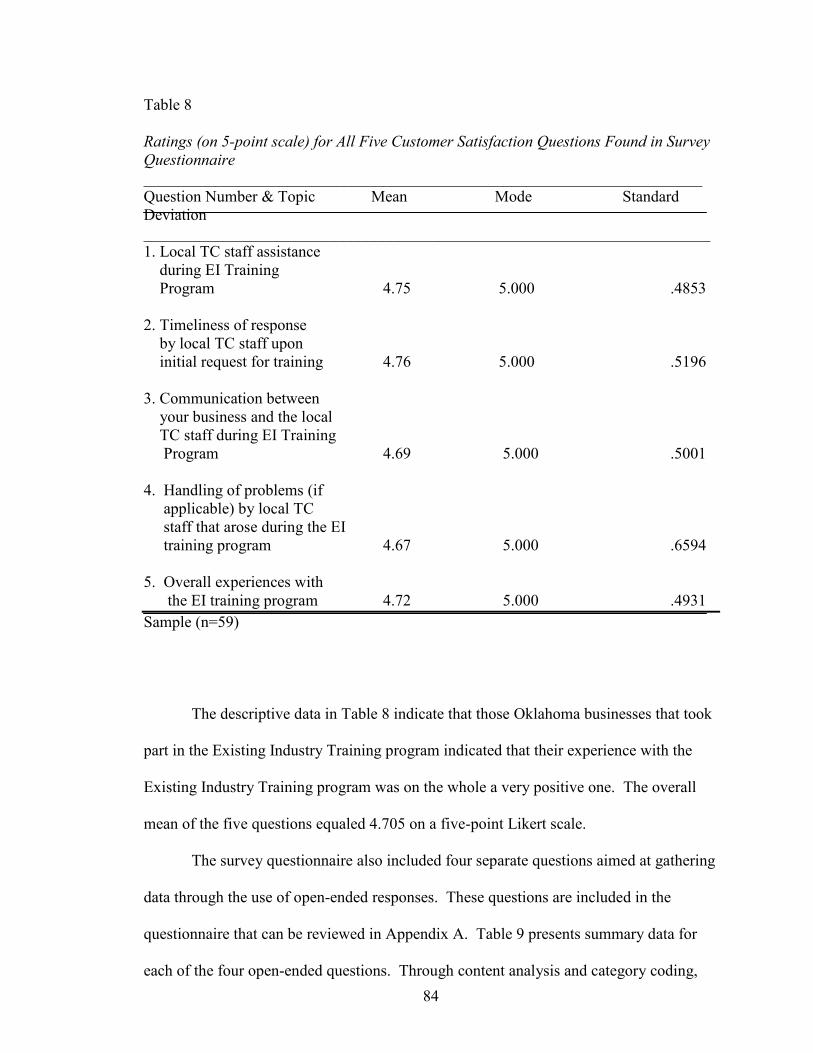
84
Table 8
Ratings (on 5-point scale) for All Five Customer Satisfaction Questions Found in Survey Questionnaire ______________________________________________________________________ Question Number & Topic Mean Mode Standard Deviation _______________________________________________________________________ 1. Local TC staff assistance during EI Training Program 4.75 5.000 .4853 2. Timeliness of response by local TC staff upon initial request for training 4.76 5.000 .5196 3. Communication between your business and the local TC staff during EI Training Program 4.69 5.000 .5001 4. Handling of problems (if applicable) by local TC staff that arose during the EI training program 4.67 5.000 .6594 5. Overall experiences with the EI training program 4.72 5.000 .4931 Sample (n=59)
The descriptive data in Table 8 indicate that those Oklahoma businesses that took
part in the Existing Industry Training program indicated that their experience with the
Existing Industry Training program was on the whole a very positive one. The overall
mean of the five questions equaled 4.705 on a five-point Likert scale.
The survey questionnaire also included four separate questions aimed at gathering
data through the use of open-ended responses. These questions are included in the
questionnaire that can be reviewed in Appendix A. Table 9 presents summary data for
each of the four open-ended questions. Through content analysis and category coding,
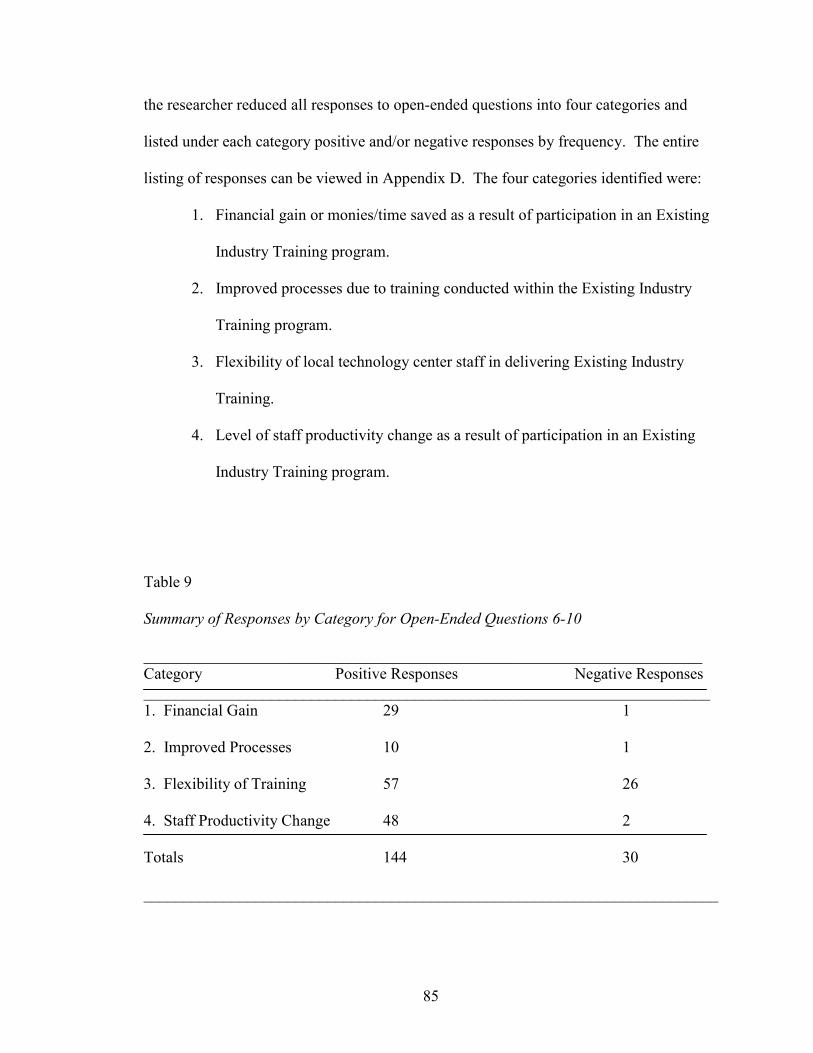
85
the researcher reduced all responses to open-ended questions into four categories and
listed under each category positive and/or negative responses by frequency. The entire
listing of responses can be viewed in Appendix D. The four categories identified were:
1. Financial gain or monies/time saved as a result of participation in an Existing
Industry Training program.
2. Improved processes due to training conducted within the Existing Industry
Training program.
3. Flexibility of local technology center staff in delivering Existing Industry
Training.
4. Level of staff productivity change as a result of participation in an Existing
Industry Training program.
Table 9
Summary of Responses by Category for Open-Ended Questions 6-10
______________________________________________________________________ Category Positive Responses Negative Responses _______________________________________________________________________ 1. Financial Gain 29 1
2. Improved Processes 10 1
3. Flexibility of Training 57 26
4. Staff Productivity Change 48 2
Totals 144 30
________________________________________________________________________
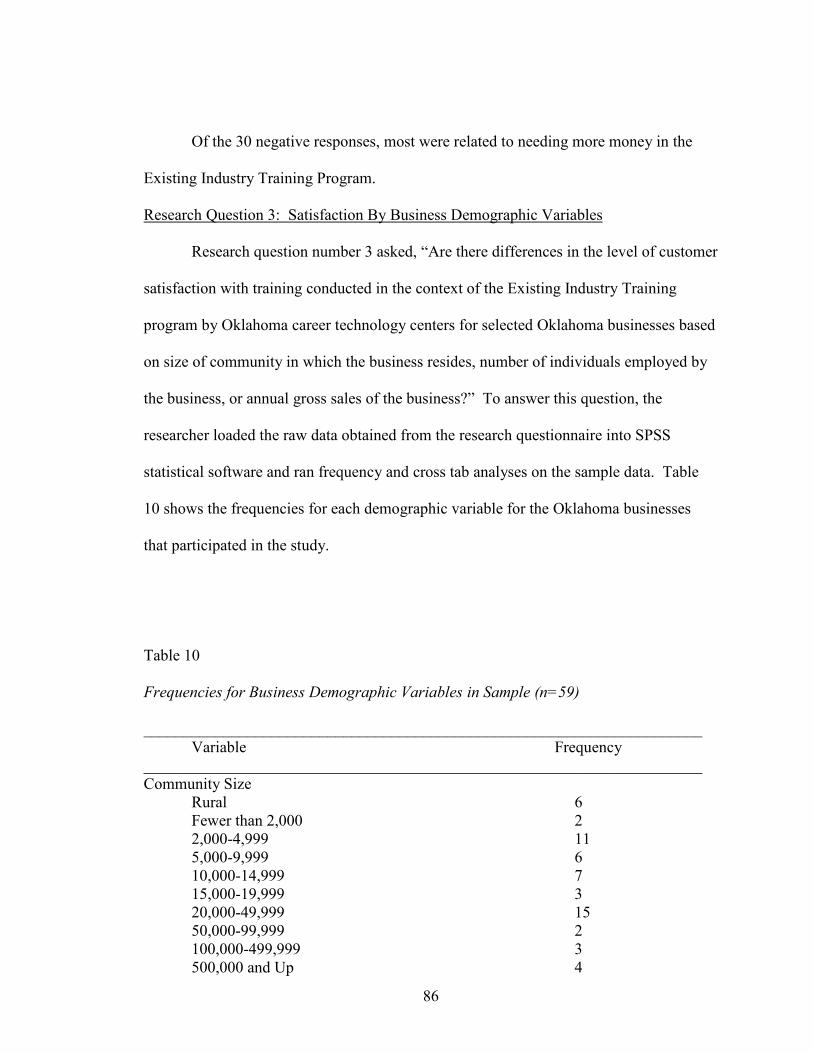
86
Of the 30 negative responses, most were related to needing more money in the
Existing Industry Training Program.
Research Question 3: Satisfaction By Business Demographic Variables
Research question number 3 asked, “Are there differences in the level of customer
satisfaction with training conducted in the context of the Existing Industry Training
program by Oklahoma career technology centers for selected Oklahoma businesses based
on size of community in which the business resides, number of individuals employed by
the business, or annual gross sales of the business?” To answer this question, the
researcher loaded the raw data obtained from the research questionnaire into SPSS
statistical software and ran frequency and cross tab analyses on the sample data. Table
10 shows the frequencies for each demographic variable for the Oklahoma businesses
that participated in the study.
Table 10
Frequencies for Business Demographic Variables in Sample (n=59)
______________________________________________________________________ Variable Frequency
______________________________________________________________________ Community Size Rural 6 Fewer than 2,000 2
2,000-4,999 11 5,000-9,999 6 10,000-14,999 7 15,000-19,999 3 20,000-49,999 15 50,000-99,999 2 100,000-499,999 3 500,000 and Up 4
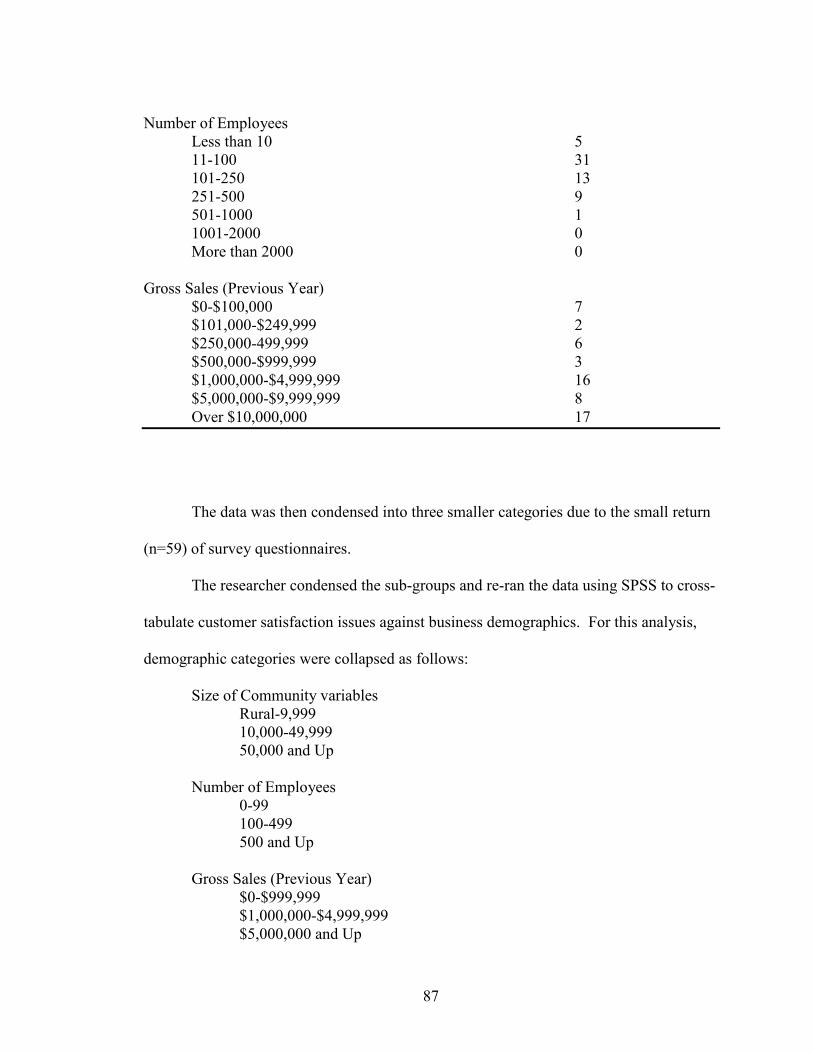
87
Number of Employees Less than 10 5
11-100 31 101-250 13 251-500 9 501-1000 1 1001-2000 0 More than 2000 0
Gross Sales (Previous Year) $0-$100,000 7 $101,000-$249,999 2 $250,000-499,999 6 $500,000-$999,999 3 $1,000,000-$4,999,999 16 $5,000,000-$9,999,999 8 Over $10,000,000 17
The data was then condensed into three smaller categories due to the small return
(n=59) of survey questionnaires.
The researcher condensed the sub-groups and re-ran the data using SPSS to cross-
tabulate customer satisfaction issues against business demographics. For this analysis,
demographic categories were collapsed as follows:
Size of Community variables Rural-9,999 10,000-49,999
50,000 and Up
Number of Employees 0-99
100-499 500 and Up
Gross Sales (Previous Year) $0-$999,999
$1,000,000-$4,999,999 $5,000,000 and Up
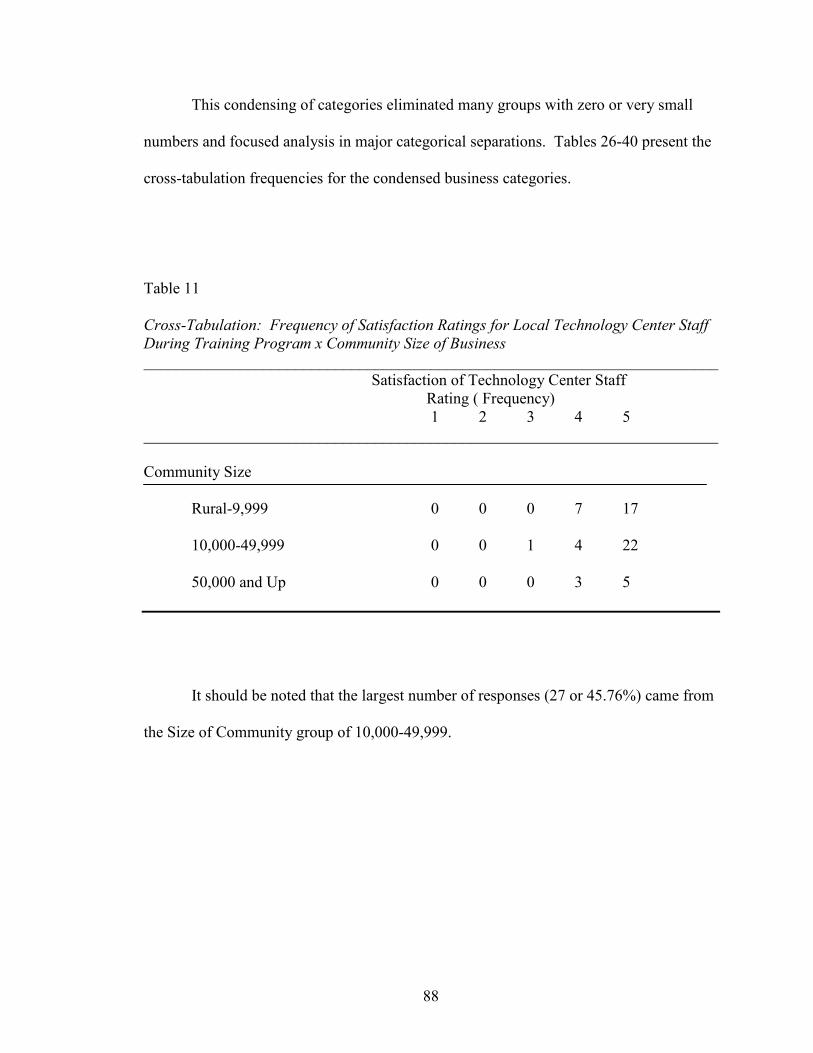
88
This condensing of categories eliminated many groups with zero or very small
numbers and focused analysis in major categorical separations. Tables 26-40 present the
cross-tabulation frequencies for the condensed business categories.
Table 11
Cross-Tabulation: Frequency of Satisfaction Ratings for Local Technology Center Staff During Training Program x Community Size of Business ________________________________________________________________________
Satisfaction of Technology Center Staff Rating ( Frequency)
1 2 3 4 5________________________________________________________________________
Community Size
Rural-9,999 0 0 0 7 17
10,000-49,999 0 0 1 4 22
50,000 and Up 0 0 0 3 5
It should be noted that the largest number of responses (27 or 45.76%) came from
the Size of Community group of 10,000-49,999.

89
Table 12
Cross-Tabulation: Frequency of Satisfaction Ratings for Timeliness of Response by Local Technology Center Staff Upon Initial Request for Training x Community Size of Business ________________________________________________________________________
Satisfaction of Technology Center Staff Rating ( Frequency)
1 2 3 4 5
________________________________________________________________________
Community Size
Rural-9,999 0 0 1 5 18
10,000-49,999 0 0 1 4 22
50,000 and Up 0 0 0 3 5
________________________________________________________________________
It should be noted that the largest number of responses (27 or 45.76%) came from
the Size of Community group of 10,000-49,999.

90
Table 13
Cross-Tabulation: Frequency of Satisfaction Ratings for Communication Between Your Business and the Local Technology Center Staff x Community Size of Business _______________________________________________________________________
Satisfaction of Technology Center Staff Rating ( Frequency)
1 2 3 4 5
_______________________________________________________________________ Community Size
Rural-9,999 0 0 0 7 17
10,000-49,999 0 0 1 5 21
50,000 and Up 0 0 0 4 4
_______________________________________________________________________
It should be noted that the largest number of responses (27 or 45.76%) came from
the Size of Community group of 10,000-49,999.
Table 14
Cross-Tabulation: Frequency of Satisfaction Ratings for Handling of Problems (if applicable) By the Local Technology Center Staff x Community Size of Business ______________________________________________________________________
Satisfaction of Technology Center Staff Rating ( Frequency)
1 2 3 4 5______________________________________________________________________ Community Size
Rural-9,999 0 0 4 2 18
10,000-49,999 0 0 2 4 21
50,000 and Up 0 0 0 2 6
________________________________________________________________________
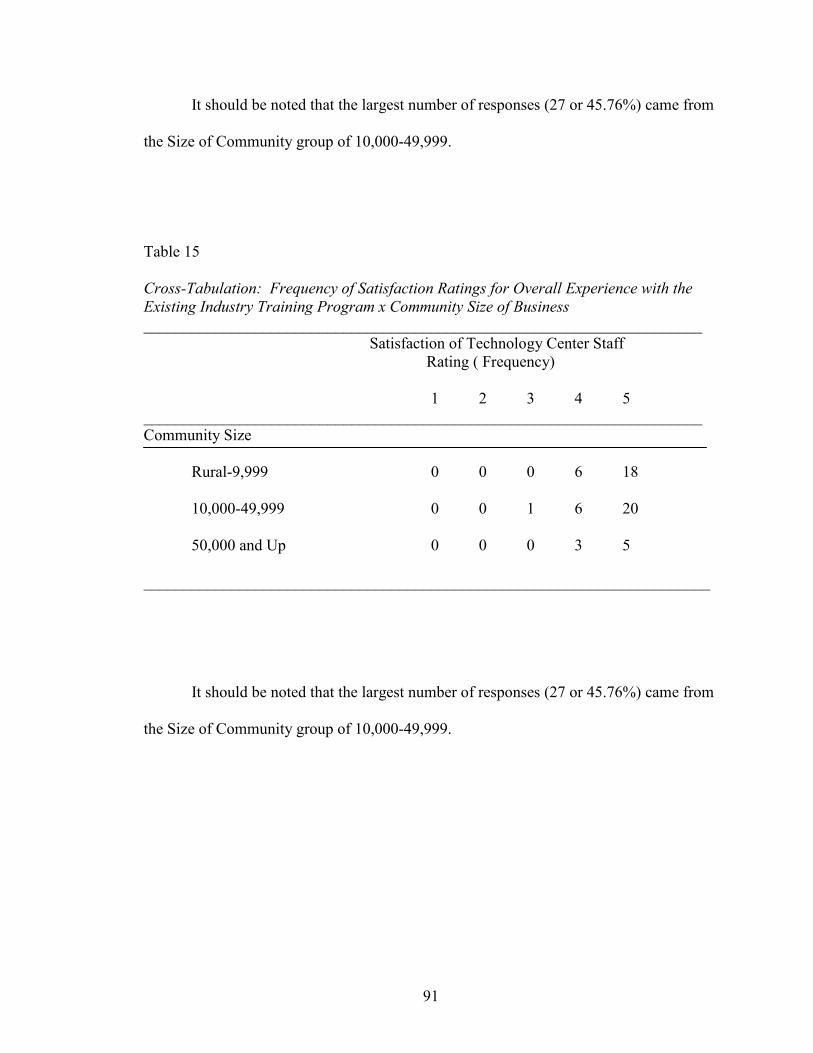
91
It should be noted that the largest number of responses (27 or 45.76%) came from
the Size of Community group of 10,000-49,999.
Table 15
Cross-Tabulation: Frequency of Satisfaction Ratings for Overall Experience with the Existing Industry Training Program x Community Size of Business ______________________________________________________________________
Satisfaction of Technology Center Staff Rating ( Frequency)
1 2 3 4 5
______________________________________________________________________ Community Size
Rural-9,999 0 0 0 6 18
10,000-49,999 0 0 1 6 20
50,000 and Up 0 0 0 3 5
_______________________________________________________________________
It should be noted that the largest number of responses (27 or 45.76%) came from
the Size of Community group of 10,000-49,999.
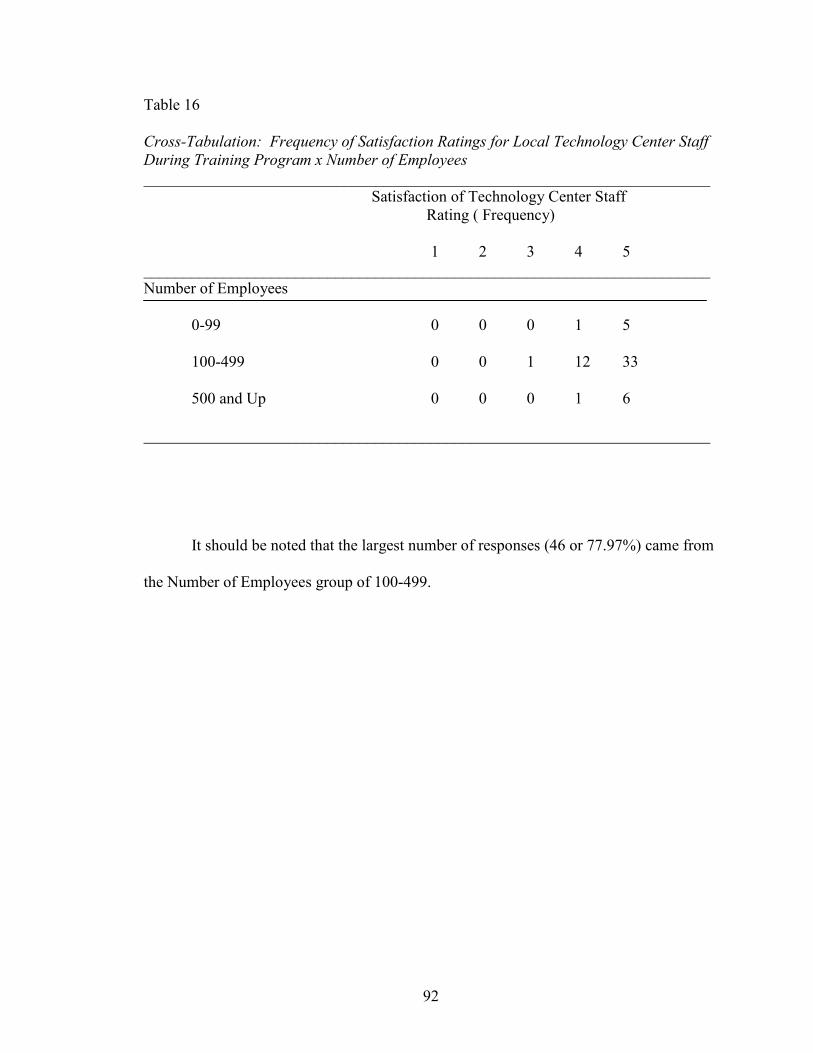
92
Table 16
Cross-Tabulation: Frequency of Satisfaction Ratings for Local Technology Center Staff During Training Program x Number of Employees _______________________________________________________________________
Satisfaction of Technology Center Staff Rating ( Frequency)
1 2 3 4 5
_______________________________________________________________________ Number of Employees
0-99 0 0 0 1 5
100-499 0 0 1 12 33
500 and Up 0 0 0 1 6
_______________________________________________________________________
It should be noted that the largest number of responses (46 or 77.97%) came from
the Number of Employees group of 100-499.
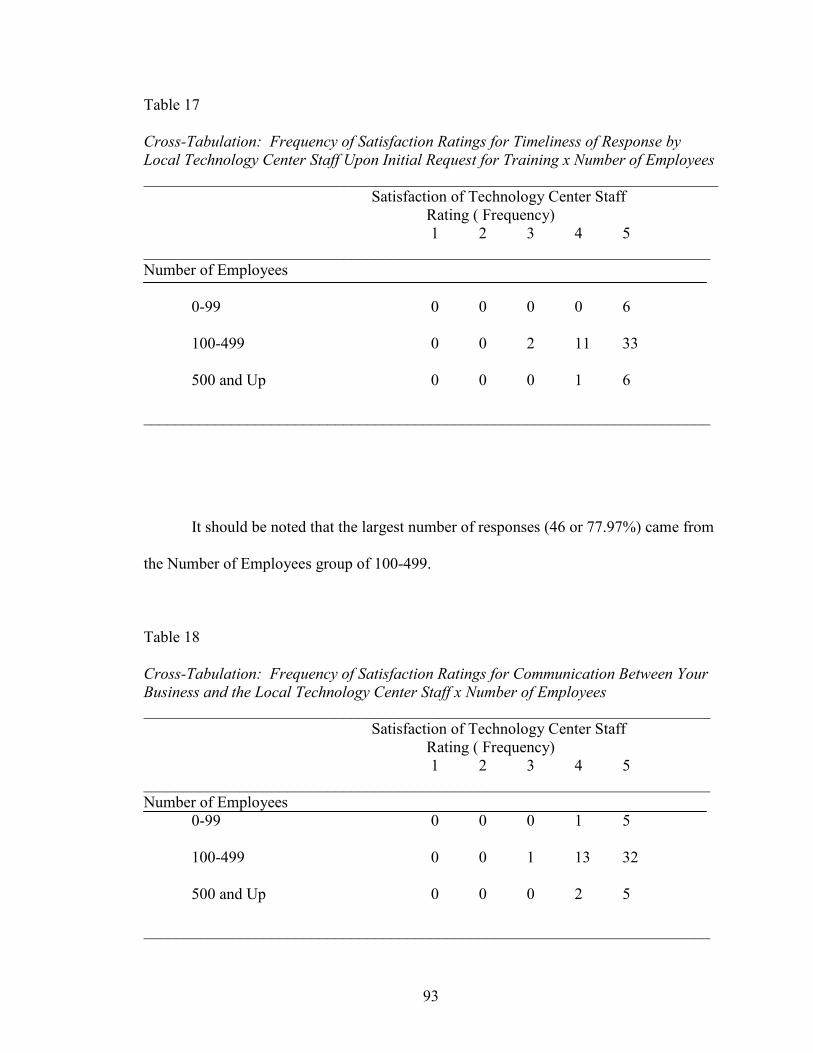
93
Table 17
Cross-Tabulation: Frequency of Satisfaction Ratings for Timeliness of Response by Local Technology Center Staff Upon Initial Request for Training x Number of Employees ________________________________________________________________________
Satisfaction of Technology Center Staff Rating ( Frequency)
1 2 3 4 5_______________________________________________________________________ Number of Employees
0-99 0 0 0 0 6
100-499 0 0 2 11 33
500 and Up 0 0 0 1 6
_______________________________________________________________________
It should be noted that the largest number of responses (46 or 77.97%) came from
the Number of Employees group of 100-499.
Table 18
Cross-Tabulation: Frequency of Satisfaction Ratings for Communication Between Your Business and the Local Technology Center Staff x Number of Employees _______________________________________________________________________
Satisfaction of Technology Center Staff Rating ( Frequency)
1 2 3 4 5_______________________________________________________________________ Number of Employees
0-99 0 0 0 1 5
100-499 0 0 1 13 32
500 and Up 0 0 0 2 5
_______________________________________________________________________
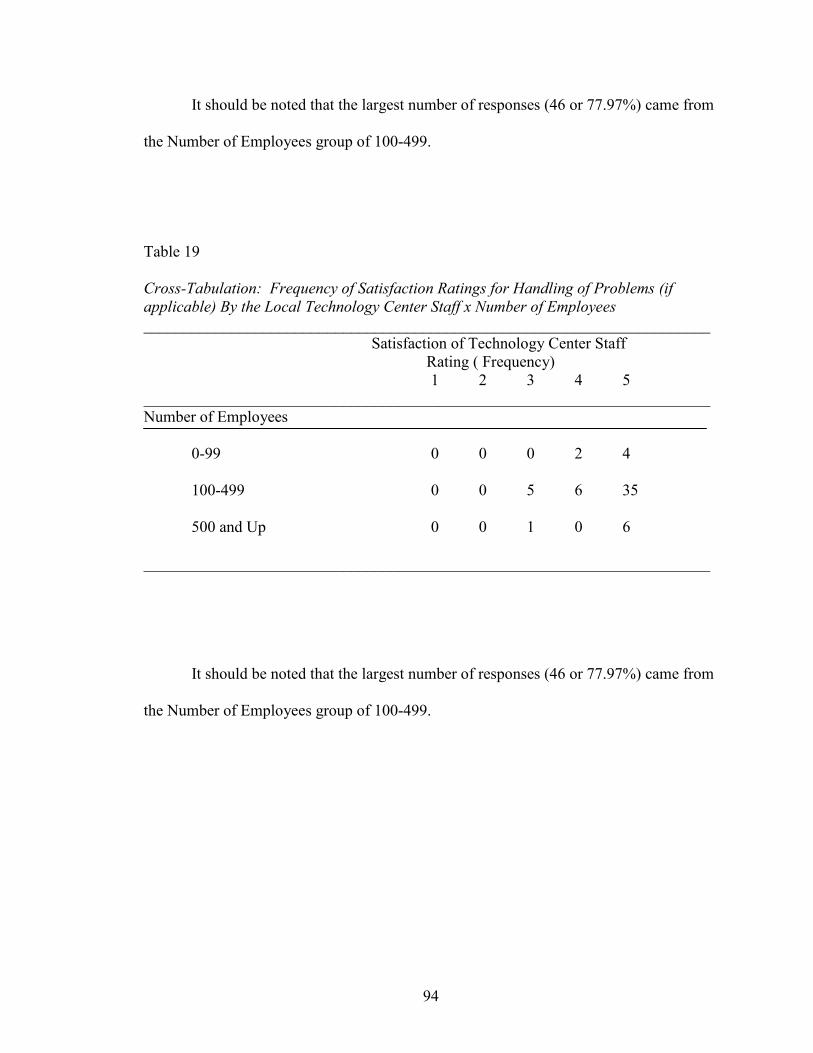
94
It should be noted that the largest number of responses (46 or 77.97%) came from
the Number of Employees group of 100-499.
Table 19
Cross-Tabulation: Frequency of Satisfaction Ratings for Handling of Problems (if applicable) By the Local Technology Center Staff x Number of Employees _______________________________________________________________________
Satisfaction of Technology Center Staff Rating ( Frequency)
1 2 3 4 5_______________________________________________________________________ Number of Employees
0-99 0 0 0 2 4
100-499 0 0 5 6 35
500 and Up 0 0 1 0 6
_______________________________________________________________________
It should be noted that the largest number of responses (46 or 77.97%) came from
the Number of Employees group of 100-499.
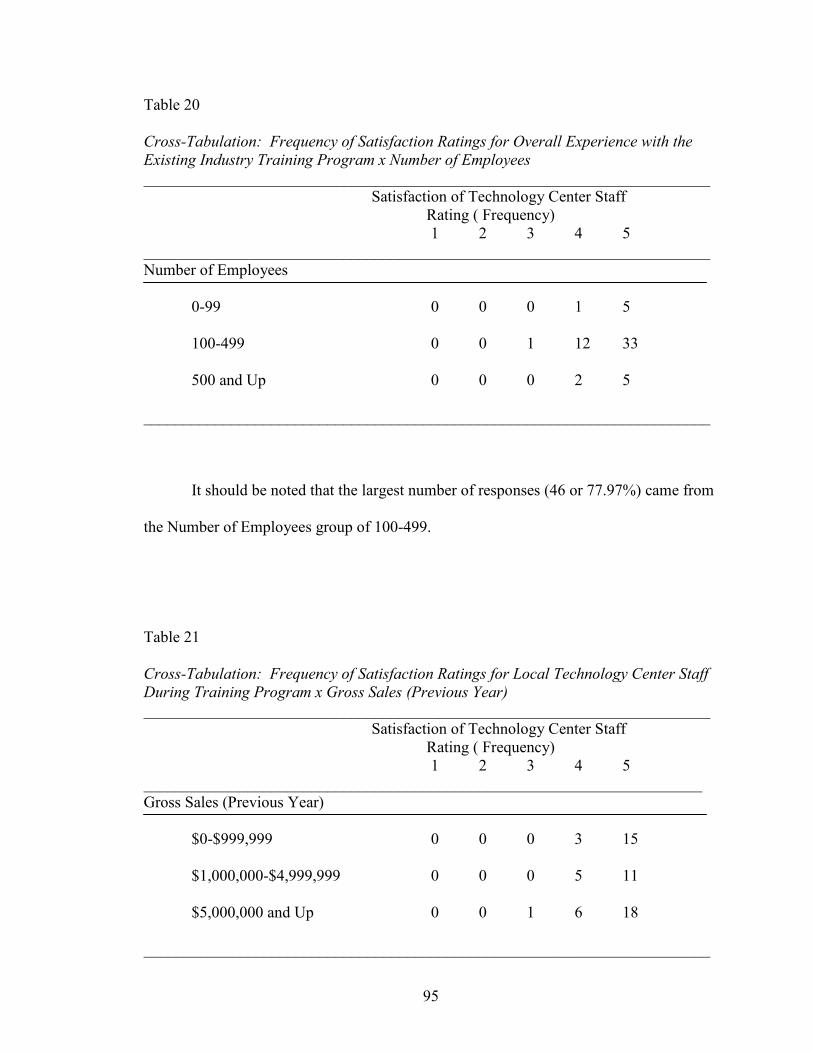
95
Table 20
Cross-Tabulation: Frequency of Satisfaction Ratings for Overall Experience with the Existing Industry Training Program x Number of Employees _______________________________________________________________________
Satisfaction of Technology Center Staff Rating ( Frequency)
1 2 3 4 5_______________________________________________________________________ Number of Employees
0-99 0 0 0 1 5
100-499 0 0 1 12 33
500 and Up 0 0 0 2 5
_______________________________________________________________________
It should be noted that the largest number of responses (46 or 77.97%) came from
the Number of Employees group of 100-499.
Table 21
Cross-Tabulation: Frequency of Satisfaction Ratings for Local Technology Center Staff During Training Program x Gross Sales (Previous Year) _______________________________________________________________________
Satisfaction of Technology Center Staff Rating ( Frequency)
1 2 3 4 5______________________________________________________________________ Gross Sales (Previous Year)
$0-$999,999 0 0 0 3 15
$1,000,000-$4,999,999 0 0 0 5 11
$5,000,000 and Up 0 0 1 6 18
_______________________________________________________________________
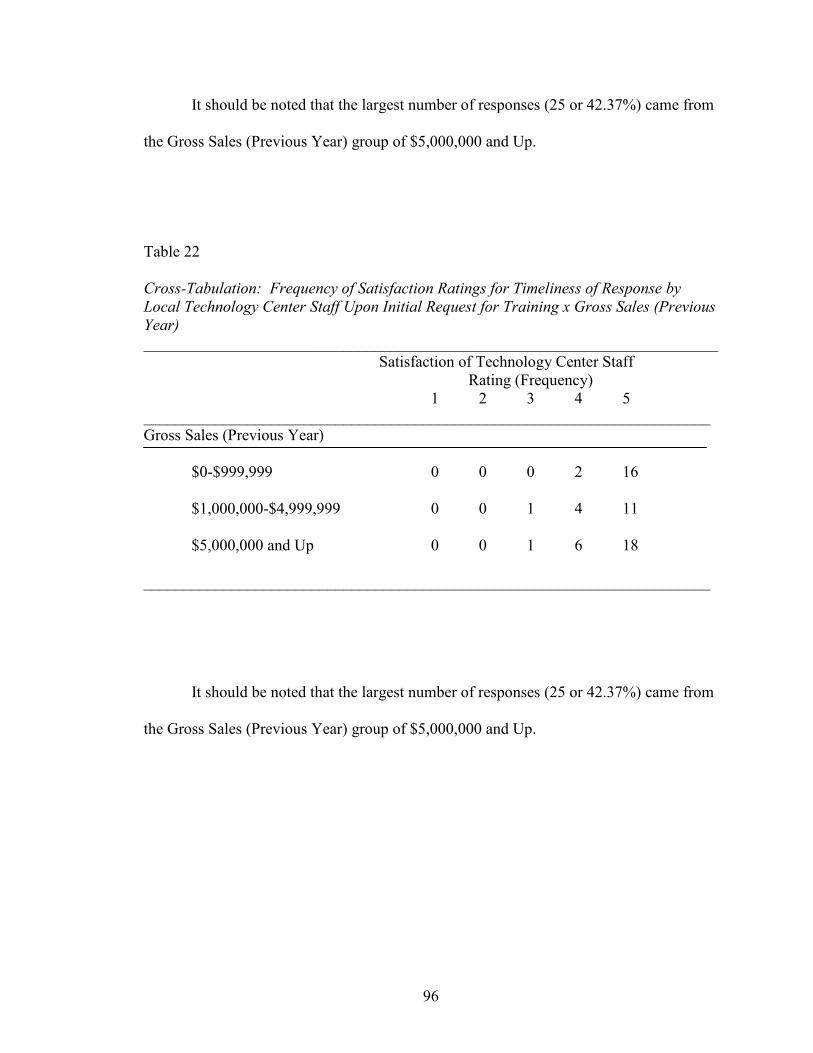
96
It should be noted that the largest number of responses (25 or 42.37%) came from
the Gross Sales (Previous Year) group of $5,000,000 and Up.
Table 22
Cross-Tabulation: Frequency of Satisfaction Ratings for Timeliness of Response by Local Technology Center Staff Upon Initial Request for Training x Gross Sales (Previous Year) ________________________________________________________________________ Satisfaction of Technology Center Staff
Rating (Frequency) 1 2 3 4 5_______________________________________________________________________ Gross Sales (Previous Year)
$0-$999,999 0 0 0 2 16
$1,000,000-$4,999,999 0 0 1 4 11
$5,000,000 and Up 0 0 1 6 18
_______________________________________________________________________
It should be noted that the largest number of responses (25 or 42.37%) came from
the Gross Sales (Previous Year) group of $5,000,000 and Up.
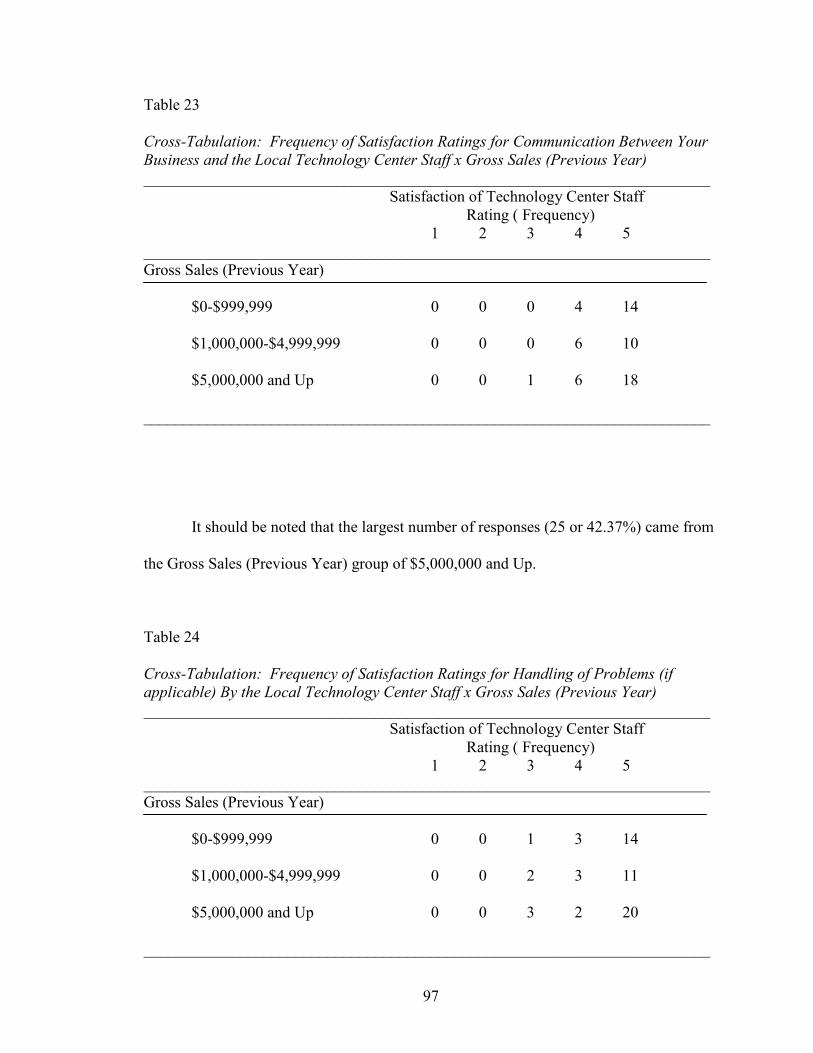
97
Table 23
Cross-Tabulation: Frequency of Satisfaction Ratings for Communication Between Your Business and the Local Technology Center Staff x Gross Sales (Previous Year) _______________________________________________________________________
Satisfaction of Technology Center Staff Rating ( Frequency)
1 2 3 4 5_______________________________________________________________________ Gross Sales (Previous Year)
$0-$999,999 0 0 0 4 14
$1,000,000-$4,999,999 0 0 0 6 10
$5,000,000 and Up 0 0 1 6 18
_______________________________________________________________________
It should be noted that the largest number of responses (25 or 42.37%) came from
the Gross Sales (Previous Year) group of $5,000,000 and Up.
Table 24
Cross-Tabulation: Frequency of Satisfaction Ratings for Handling of Problems (if applicable) By the Local Technology Center Staff x Gross Sales (Previous Year) _______________________________________________________________________
Satisfaction of Technology Center Staff Rating ( Frequency)
1 2 3 4 5_______________________________________________________________________ Gross Sales (Previous Year)
$0-$999,999 0 0 1 3 14
$1,000,000-$4,999,999 0 0 2 3 11
$5,000,000 and Up 0 0 3 2 20
_______________________________________________________________________
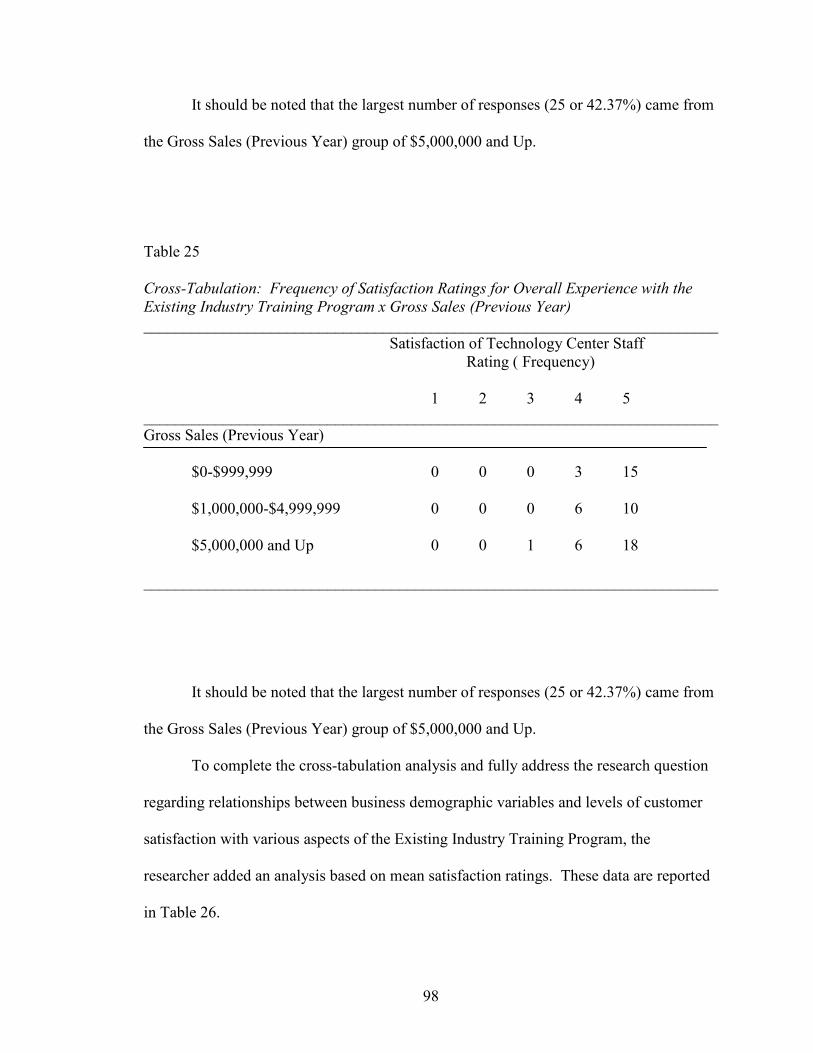
98
It should be noted that the largest number of responses (25 or 42.37%) came from
the Gross Sales (Previous Year) group of $5,000,000 and Up.
Table 25
Cross-Tabulation: Frequency of Satisfaction Ratings for Overall Experience with the Existing Industry Training Program x Gross Sales (Previous Year) ________________________________________________________________________
Satisfaction of Technology Center Staff Rating ( Frequency)
1 2 3 4 5
________________________________________________________________________ Gross Sales (Previous Year)
$0-$999,999 0 0 0 3 15
$1,000,000-$4,999,999 0 0 0 6 10
$5,000,000 and Up 0 0 1 6 18
________________________________________________________________________
It should be noted that the largest number of responses (25 or 42.37%) came from
the Gross Sales (Previous Year) group of $5,000,000 and Up.
To complete the cross-tabulation analysis and fully address the research question
regarding relationships between business demographic variables and levels of customer
satisfaction with various aspects of the Existing Industry Training Program, the
researcher added an analysis based on mean satisfaction ratings. These data are reported
in Table 26.
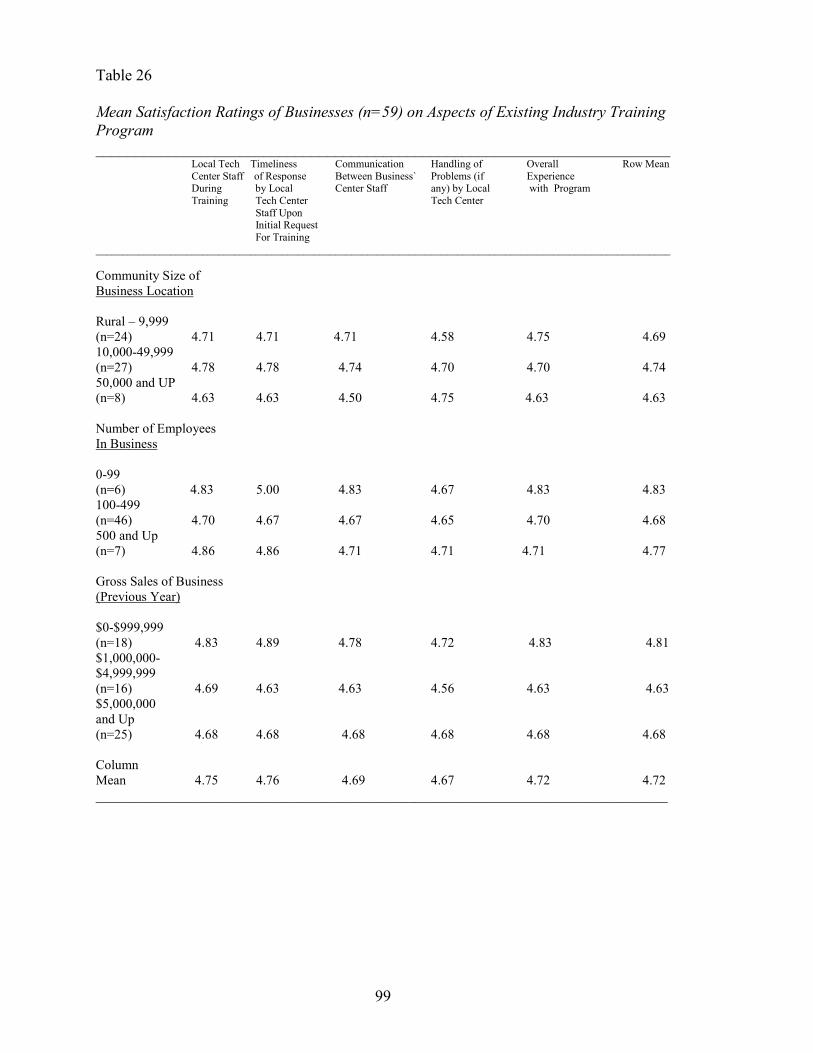
99
Table 26 Mean Satisfaction Ratings of Businesses (n=59) on Aspects of Existing Industry Training Program ________________________________________________________________________ Local Tech Timeliness Communication Handling of Overall Row Mean Center Staff of Response Between Business` Problems (if Experience During by Local Center Staff any) by Local with Program Training Tech Center Tech Center Staff Upon Initial Request For Training ____________________________________________________________________________________________________________ Community Size of Business Location
Rural – 9,999 (n=24) 4.71 4.71 4.71 4.58 4.75 4.69 10,000-49,999 (n=27) 4.78 4.78 4.74 4.70 4.70 4.74 50,000 and UP (n=8) 4.63 4.63 4.50 4.75 4.63 4.63 Number of Employees In Business
0-99 (n=6) 4.83 5.00 4.83 4.67 4.83 4.83 100-499 (n=46) 4.70 4.67 4.67 4.65 4.70 4.68 500 and Up (n=7) 4.86 4.86 4.71 4.71 4.71 4.77 Gross Sales of Business (Previous Year)
$0-$999,999 (n=18) 4.83 4.89 4.78 4.72 4.83 4.81 $1,000,000- $4,999,999 (n=16) 4.69 4.63 4.63 4.56 4.63 4.63 $5,000,000 and Up (n=25) 4.68 4.68 4.68 4.68 4.68 4.68 Column Mean 4.75 4.76 4.69 4.67 4.72 4.72 ______________________________________________________________________________________
100
In general, the means for all the demographic sub-groups were very similar, and
highly positive. Thus, there is no observable relationship between the business
demographic variables and customer satisfaction ratings.
Table 26 indicates that the highest mean response to customer satisfaction
question number one came from the number of employees sub-group of 500 and Up.
This mean was 4.86. The highest mean response to customer satisfaction question
number two came from the number of employees sub-group of 0-99. This mean was
5.00. The highest mean response to customer satisfaction question number three came
from the number of employees sub-group of 0-99. This mean was 4.83. The highest
mean response to customer satisfaction number four came from the gross sales of
business (previous year) sub-group of $0-$999,999. This mean was 4.72. The highest
mean response to customer satisfaction number five came under this same gross sales of
business (previous year) sub-group of $0-$999,999. This mean was 4.83. The highest
overall mean response came from the number of employees in business sub-group of 0-
99. This mean was 5.00. The lowest overall mean response came from the community
size of business location sub-group of 50,000 and up. This mean was 4.50.
The row means in each demographic area reveal the following. The highest row
mean within the demographic factor, Community Size of Business Location, fell in the
sub-group of 10,000-49,999. This mean was 4.74. The highest row mean within the
demographic factor, Number of Employees in Business, fell in the sub-group of 0-99.
This mean was 4.83. The highest row mean within the demographic factor, Gross Sales
of Business (Previous Year), fell in the sub-group of $0-$999,999. This mean was 4.81.
The data showed that the highest customer satisfaction levels fell with Oklahoma
101
businesses that resided in communities that ranged in size from 10,000-49,999. These
businesses employed 0-99 employees, and had sales from $0-$999,999.
Focus Group
The researcher met with the focus group on May 18, 2005, at the Oklahoma
Department of Career and Technology Education (ODCTE) in Stillwater, Oklahoma.
The meeting was held at 1:00 p.m. The participants in attendance included three State
Department BIS personnel, two BIS directors from technology centers, and the
researcher. There were two Oklahoma business owners who were scheduled to be in
attendance at this focus group meeting. However, at the last minute, they both had to
cancel because of unanticipated job responsibilities. In the analysis reported here, the
people in attendance for the focus group meeting are identified as follows:
RES: Researcher SD1: State Department Person Number One
SD2: State Department Person Number Two SD3: State Department Person Number Three BIS1: BIS Director Number One BIS2: BIS Director Number Two
The researcher began the focus group by welcoming the participants and
informing all present that he was recording these proceedings and that the recording
would be transcribed and then the recording would be properly disposed of. None of the
participants voiced any concern about the recording of the session. The focus group
meeting was recorded, and the recording was used to create a written transcription that
was the basis for the following analysis of the focus group input. The researcher was
unable to send the findings to all those in attendance at the focus group meeting prior to
the time of the meeting. Thus, the first order of business was to go over the research in
general terms and look at the findings. This was followed by asking the focus group the
102
questions as discussed in Chapter III. The entire transcript of the focus group meeting is
available in Appendix C.
Several major findings came from the focus group meeting, including the
following:
1. The focus group participants did not appear to be concerned about the
relatively small size of the sample in the study, indicating an acceptance of its adequacy.
However, they raised the issue of why the sample may have been small.
I know that you had hoped for more, but I think on mail-outs, it’s way
above the national average (SD3).
It would be interesting to know if the response had anything to do with the
relationship and rapport between the technology center and the company
(SD1).
2. The focus group indicated support for the ROI concept and process, and
that they felt more importance should be placed on ROI understanding and
implementation in CareerTech on a statewide basis.
…We are going through a culture change both here in the agency and out
in companies from a standpoint of we think programs are pretty good but
we cannot say for a fact what kind of return we have received on a given
project (SD2).
I’d like some way in the guidelines as part of that existing industry
agreement that says you will complete this so that we can collect data on
100 percent of the projects (SD3).
I think that we need to have a situation to where the IC has told the
company that when the training is completed a survey is going to be
103
conducted and that we are going to ask certain questions and then we will
come back in 6 months and follow up with similar questions. That way,
everybody will be expecting that and that will help eliminate the problem
of a small sample. Our sample then should be 100 percent and the
answering of the survey will be a condition of receiving existing industry
funds (BIS1).
I think that when you look at business, the agency, and the tech centers,
we may be handicapping the tech centers without having a unified
statewide effort to figure ROI (SD2).
Well, in the next year, there will be a statewide coordinated effort to
helping improve our technology system for capturing ROI data. A number
of things are going to come from that. A positive through that process is
that the schools will have to become more educated in gathering this kind
of data. And then from that point, working with the tech center and the
industries together we want to make sure that all entities are talking ROI.
That statewide initiative will help in gathering this type of information
(SD2).
3. The focus group supported this study’s findings and indicated a belief in
their value.
Item 46. Three employees received promotions and pay raises as a result
of the training they received (SD2).
I like number 42. “Without it as a small and new business, we would have
a very difficult time equipping ourselves and getting started…. That kind
of says it all (BIS2).

104
The funds that are put into existing industry, I’m glad to see the 3.96.
That is important to point out to local folks (BIS1).
I think, before, we were just guessing on return on investment. We did not
have any real data that we could put our arms around; and we definitely
did not know what the return on investment percentage was. I think now
we’ve got data. The sample size is small, and I hope we can look at ways
to improve the sample size; and, hopefully, we will be able to continue
this and build it into our database and we will have it (SD3).
We’re in the process of trying to do some economic impact information
statewide…. Some of this information would be valuable, I think, for a
researcher for look at initially. Would you mind that being shared (SD1)?
I was about to request another ¾ of a million for existing industry over the
next couple of years. You’re helping here (SD1).
This ought to help (SD3).
I do agree with the findings. I think this program is a way for us to be
more proactive with companies using the program as an incentive to help
promote more and better training (SD2).
I felt all along that the program was good and beneficial and a way for us
to get in the door to help train and tool up and retrain…. It is reaffirming
what I felt. Certainly I agree with the findings and, hopefully, this is some
data that we can build on for the future (BIS1).
4. The focus group recognized both benefits and barriers to the
implementation of ROI. Many of the ones they mentioned mirrored what has been
reported in the ROI literature. One important barrier recognized by the focus group
105
stakeholders was that the business would need to be convinced of the value of ROI before
it could be successfully implemented.
It will entail our businesses making a paradigm shift so that this is not seen
as a negative. We need to position this in the right way that will allow
these companies to be receptive to this change and be receptive to that
(SD2).
If you took any of our business owners and said to them, “I can show you
a way that you can invest 1dollar and you will receive 4 dollars return on
that investment,” they would take the time to come to a meeting. At this
time they just do not see the importance of it (BIS2).
Another barrier pointed out by the focus group was concern that fair, accurate,
and uniform ROI data might not be collected if it was done by outside sources.
I think the only disadvantage to implementing ROI is if we get in a hurry
and we contract with a source that is not providing valid, factual
data…(SD3).
If you cannot believe the numbers, nothing else will matter (BIS2).
And it needs to be holistic. This type of ROI information should be
holistic for our system, not just the Existing Industry Program (SD2).
Another barrier to ROI implementation stressed by the focus group – and
frequently discussed in the ROI literature – was lack of ROI knowledge, skills, and well-
developed, uniform measurement systems.
…that’s some pretty deep stuff when you get into it. I don’t think a lot of
our smaller companies have somebody that understands how to really
calculate ROI. They only look at the bottom line. Are they getting
106
trained? Are they increasing profits? That’s about as close as they come
right now to any kind of effort to calculate ROI (BIS1).
Something that we’ve talked about is we are doing quite a bit across the
state on business excellence and Black Belt, green belts, statistical tools
for gathering data on return on investment. We would not be able to do it
on every project, but we would be able to pull a sample to where we can
go in and, if they say they want XYZ training, we could benchmark where
they are right now, do the training, and then, like you say, come back in a
few months and measure again and then maybe a year later. We have
talked about that in the past but right now we do not have the people to do
it (SD3).
We are not going to get all of you guys to agree on how to measure ROI,
and we are going to continue to flounder until we present the way it is
going to be measured (SD1).
A process or an equation needs to be developed so that we are comparing
apples to apples (BIS1).
So, are you saying that one of the barriers is that we are not all figuring
ROI in the same way now (RES)?
Yes (SD3).
Yes (BIS1).
We need to formulize that mechanism so that we can remove that barrier
that exists because the schools have a 101 different ways of doing things
and they are not always the same. We see that that is a problem.
Industry’s barrier to this is that they probably do not have enough
107
education in ROI to understand what ROI is and why it might be
important to them. A big barrier is that the schools, businesses, and
people here at the agency just do not have a good handle on what should
really be considered when looking at ROI. All of these folks must be able
to reach a level of understanding on this subject that shows that they “get
it” (SD2).
This lack of ROI skills and uniform measurement system discussed by the focus
group was consistent with the researcher’s findings that adequate data for calculating
fully-loaded ROI costs and benefits were not currently available in the CareerTech
system.
Finally, the focus group acknowledged the “fear” barrier that is very often
presented in the ROI literature.
That has been a barrier across the board that handicaps us from the gate
because we do not know what the end result will be. Some people will not
be willing to do it because they may not like what the end result will look
like (SD2).
Amen (SD3)!!
There will be resistance because people do not want to give up
information because they are afraid that it might affect them personally
depending upon the outcome (SD2).
In addition to barriers to ROI, the focus group also recognized several potential
advantages or benefits, many of which are prominent in the literature.
[ROI] will give you a clear picture of profits versus losses of your training
dollars in more tangible terms (SD3).
108
That is something that everybody understands, dollars and cents (BIS2).
And to have this kind of information when you are speaking to the
legislature about funding is invaluable (SD2).
…. that’s how we can approach either TIP or existing industry; we can
show them a return from their tax monies as well. We can equate it back
to the fact that they paid X amount, and they get a return on investment on
the taxes they paid (SD2).
I see it as an opportunity to receive funding to help train people, but it is
also a weaning process that, hopefully, serves as a seed to help companies
understand that as they grow they will have come up with funding to help
with their training needs (SD2).
5. Overall, the stakeholders in the focus group were supportive of this study
and its findings. They were also supportive of the ROI concept and the importance of its
role in assessment of the Existing Industry Training Program, and indicated a willingness
to pursue its implementation further.
It is interesting that a lot of small business account for 50 percent of the
population, and 84 percent of your sample. [The ROI] speaks to the value
that this program adds to small business (SD2).
The biggest value that I see ROI making, which is not such a new concept,
is thinking about always equating value as in the “proof’s in the pudding.”
Here is the program, so there it is a given that good things will come from
it, whereas ROI is a way to take a pulse check and see if a program is truly
doing what it designed to do. If it is not adding value, then we need to
probably get rid of it-more from findings like this that shows the ROI of a

109
program versus just throwing dollars at a new program, which is kind of
what we have done in the past. If a program is not adding value, we need
to be re-aligning our focus (SD2).
I am impressed. I think that we are right on with this. I think that as we
begin going down this path, our knowledge will increase and that will
yield more pertinent data, and it will help to increase our relationship with
business in Oklahoma. The comments that we have received serve as an
affirmation of the system. That relationship is so key to being successful
(SD2).
It will yield a better product in the long run (SD3).
110
CHAPTER V
CONCLUSIONS, RECOMMENDATIONS, AND SUMMARY
Summary of Study
The purpose of this study was to identify and measure the economic impact and
return on investment of the CareerTech Existing Industry Training Program. In addition,
the level of customer satisfaction with the program was also assessed and described.
Results of this study may offer more insight for stakeholders in the program as they make
decisions concerning their participation in this program. Also, it may serve school
administrators as they manage the program, and legislators as they make decisions
concerning the continued funding of this particular training program.
The population for this study was 552 different Oklahoma businesses that had
participated in the Existing Industry Training Program during the years 2000 – 2004.
The study was originally intended to be a census study based on participation of all 552
of these businesses. However, due to several unexpected barriers, the actual participation
rate was much lower. In fact, the three different companies that reside within the
researcher’s district failed to return questionnaires. The actual sample was 59 Oklahoma
businesses that completed and returned survey questionnaires. This represented a return
rate of 10.68% of the population, which represented a limitation of the study and raised
caution about generalizing the findings.
The responding Oklahoma businesses were asked to rate their feelings concerning
their level of satisfaction with five different aspects of the Existing Industry Training
program. They were also asked to provide wage data for employees who were hired as a
111
result of the Existing Industry Training Program as well as existing employees who had
taken part in the program. Additionally, each Oklahoma business was asked to provide
the following demographic data: location of business by county, size of community in
which the business was located, number of employees, yearly gross sales, and their
SIC/NAICS code. Some data on the costs of the Existing Industry Training Program
were obtained from the archives of the Oklahoma Department of Career and Technology
Education (ODCTE). These data were used collectively to analyze and describe the
economic impact, return on investment (ROI), and customer satisfaction levels of the
program.
The research questions addressed in this study included the following:
1. What is the economic impact and return on investment (ROI) of training
completed within the context of the Existing Industry Training program by Oklahoma
career technology centers for selected Oklahoma businesses?
2. What is the general level of customer satisfaction with training conducted in
the context of the Existing Industry Training program by Oklahoma career technology
centers for selected Oklahoma businesses?
3. Are there differences in the level of customer satisfaction with training
conducted in the context of the Existing Industry Training program by Oklahoma career
technology centers for selected Oklahoma businesses based on size of community in
which the business resides, number of individuals employed by the business, or annual
gross sales of the business?
4. How do primary stakeholders in the Existing Industry Training program
perceive the findings of this study and potential impacts on the program?
112
Research question one was addressed using descriptive analysis of data
provided by the ODCTE and the participating businesses, and the Phillips
standard ROI calculation formula. Question number two and three were
addressed with descriptive statistics and cross-tabulations. Question four was
addressed through qualitative analysis of the input of a focus group of relevant
stakeholders.
The study’s review of literature included the following areas of interest:
Kirkpatrick’s Levels of Evaluation Model and ROI, Intangibles of Return on
Investment (ROI), Barriers to ROI, ROI Procedures and Calculations, Value and
Benefits of ROI, Customer Satisfaction, and use of Focus Groups.
Conclusions
Economic Impact
For the sample in this study the Existing Industry Training program had a
positive economic impact on those local businesses that took part in the training
program.
Economic impact was assessed in terms of employment, wages, and
financial benefits reported by participating Oklahoma businesses. The average
wage of new employees in the sample at the time of participating in a Existing
Industry Training Program was $7.53 per hour. The average wage as of today for
these same employees is $18.19. The data revealed that the sample of 59
businesses realized in monies saved or gained a total of $2,035,711.00.
Return on Investment
The Existing Industry Training Program had a positive return on
investment for those Oklahoma businesses represented in the sample. For each
113
dollar spent by the ODCTE on the Existing Industry Training program, Oklahoma
businesses (n=59) realized a return on this investment of $3.96 on average. This
represents an ROI of nearly 400%.
These findings were based on a very limited calculation using data that
included overall costs provided by ODCTE and return on investment data
reported by businesses. However, it is at least an initial indication of the positive
effect the program has had on the involved Oklahoma businesses. The
implication of this finding is that the ROI for the entire population of Oklahoma
businesses that have participated in the Existing Industry Training Program may
have been positive, and this program may be a good starting point for ROI
analysis in the CareerTech system.
Customer Satisfaction
The Existing Industry Training program is seen by the Oklahoma
businesses in this study as being a positive program that provides needed training
at a very high level of satisfaction to Oklahoma businesses. The grand mean
across the five satisfaction questions equaled 4.72 on a 5-point Likert scale.
The data revealed that the most positive aspects of the Existing Industry
Training Program, from a customer satisfaction perspective, fell in two areas.
These included the following: Local technology center staff assistance during an
Existing Industry Training Program and timeliness of response by local
technology center staff upon initial request for training. The mean response for
the technology center staff assistance question was 4.75. The mean response for
the timeliness question was 4.76. Customer satisfaction levels were not related to
the size of community of businesses, number of employees, or gross business
114
sales. Rather, the satisfaction level was relatively consistent across those
variables on all five measured aspects of customer satisfaction.
Barriers to Return on Investment
The limited size of the sample (n=59) versus the size of the population for
the study (N=552) indicates to the researcher that there exists barriers and, more
generally, a lack of understanding of the positive impact that ROI data can have
on Oklahoma businesses.
The difficulties encountered in obtaining participation in this study
suggest that barriers exist at this time to the implementation of ROI assessment in
industry programs in the ODCTE. There is also a general lack of understanding
of the positive impact that ROI data can have on Oklahoma businesses. The
researcher encountered problems in the return of questionnaire surveys, receiving
only 59 out of an original mailing of 552. The literature indicated that fear and
lack of understanding of the ROI process may lead to resistance to implementing
ROI initiatives. This same fear may have led to the limited number of returned
questionnaire surveys. Phillips (1997) discussed the fact that many businesses
may fear that a negative ROI might have negative and lasting effects on
employees and management alike. The lack of understanding concerning the
benefits of a properly completed ROI study may have played a significant role in
the limited amount of data gathered by ODCTE in this particular area. The
understanding simply does not exist at this time to develop the kinds of
techniques needed to acquire the proper data to adequately reveal the ROI data of
the Existing Industry Training Program at this time. The focus group touched on
this subject. One of the stakeholders responded “….I think that when you look at
115
business, the agency, and the tech centers, we may be handicapping the tech
centers without having a unified statewide effort to figure ROI…..”
Low Level of Understanding of ROI
There is a low level of understanding by technology center BIS staff
members as to the positive impact that ROI data can have on Oklahoma
businesses and the Oklahoma Department of Career and Technology Education,
and a sense that there are currently some barriers to ROI implementation.
The literature indicated that there must be a minimum acceptable level of
understanding of ROI and ROI skills to successfully implement an ROI initiative
in an organization. Phillips (1997, 2002) indicated that not all programs are good
candidates for ROI evaluations, and that programs need to have been in existence
for some time prior to implementing an ROI initiative to measure the return on
investment. The input from the focus group in this study suggested an awareness
by ODCTE stakeholders that the critical levels of understanding and skills to
implement ROI are not yet present. A stakeholder in the focus group stated “….a
big barrier is that the school, businesses, and people here at the agency just do not
have a good handle on what should really be considered when looking at ROI.
All of these folks must be able to reach a level of understanding on this subject
that shows that they ‘get it’….”
ROI and Customer Satisfaction
ROI and Customer Satisfaction Assessment have a future in the
CareerTech system. ODCTE has emerging interest and willingness to learn more
about ROI and to consider its implementation. ODCTE also has interest in
obtaining more data on its customer satisfaction.

116
As indicated in the focus group responses, ODCTE is and must take an honest
look at how it collects data and what it collects data on in the future. “….I think that
when you look at business, the agency, and the tech centers, we may be handicapping the
tech centers without having a unified statewide effort to figure ROI….”
Recommendations
Based upon the findings of this study, several recommendations are
proposed. These recommendations include:
1. A concentrated, widespread effort should be undertaken to expand the
understanding and importance of economic impact, return on investment, and
customer satisfaction as it relates to the Existing Industry Training Program and
those Oklahoma businesses who are involved in the program.
2. A statewide, standardized system of measuring economic impact,
return on investment, and customer satisfaction should be developed by the
Oklahoma Department of Career and Technology Education to better enable the
system as a whole to present a cohesive look at the capabilities of CareerTech as a
whole, and the Existing Industry Training Program in particular.
3. Expanded, continued research in this particular area of study should be
conducted to better highlight the economic impact, return on investment, and
customer satisfaction of the Existing Industry Training Program. This will afford
ODCTE personnel and school administrators a good position from which they can
ask for additional funding to help with the economic development efforts in the
state of Oklahoma. It might also help attract new business growth in Oklahoma
when businesses see that the Existing Industry Training Program offers them a leg
up over what they might receive in the way of incentives when considering
117
whether or not to locate a new business or expand an existing business here in the
State of Oklahoma.
4. The present study should be replicated as a full census study to obtain
relevant data on all Oklahoma businesses participating in the Existing Industry
Training Program. This would help paint a much broader picture of the effects of
the program, positive or negative, and allow the decision makers to obtain a well
rounded look at the Existing Industry Training Program prior to making decisions
concerning funding and other issues that surround this program. Input should be
sought from all those business owners who’s companies participated in the
Existing Industry Training program and other relevant business people from
outside the CareerTech system.
Summary
The researcher is confident in the capabilities of the CareerTech system as
a whole. It was the hope of the researcher through this research to better highlight
these capabilities in general, and in particular those capabilities and possibilities
that are made available to Oklahoma businesses through the Existing Industry
Training Program. The difficulties encountered in conducting this study and the
data from the stakeholder focus group make it obvious that the system as a whole
still lacks the needed motivation and skills to gather and measure the required
data to show all who are interested how the CareerTech system helps to improve
Oklahoma businesses’ bottom line through a variety of programs including the
Existing Industry Training Program. This will require a paradigm shift within the
system to place initiatives such as ROI at the forefront of the thought processes of
all those who are involved in training in general and the Existing Industry
118
Training program in particular. Limited participation in the study by state BIS
directors; lack of adequate, appropriate accounting data by ODCTE; and
acknowledged lack of ROI skills by ODCTE staff are all indicators of this
situation. The state BIS directors tend be protective of those businesses which
they serve. This may have had some impact on the return rate of the
questionnaire survey. More training in the area of ROI is needed not only for the
ODCTE BIS staff but also for BIS directors throughout the state. This will help
to promote ROI and the measuring of ROI for training programs conducted in the
State of Oklahoma by ODCTE and technology centers. It may be necessary for
technology centers to begin to conduct ROI training for those Oklahoma
businesses that they serve thereby helping to raise awareness to the importance of
accountability and the measuring of the effectiveness of training. Further research
is needed concerning the differences between urban and rural Oklahoma
businesses who participated in this study and who participate in the Existing
Industry program. This research should try and ascertain why the response rate
from rural businesses was much higher than that of their urban counterparts.
Although the number of those Oklahoma businesses who responded as a
part of the study was small, those who did respond, for the most part, responded
positively to their particular experiences in the Existing Industry Training
Program. They also claimed a solid ROI for the program in terms of returned
financial benefits to their companies. These two findings, coupled with the
interest and willingness displayed by the ODCTE staff, suggest that conditions are
favorable for the beginning of successful implementation of comprehensive
customer satisfaction and ROI assessment of the agency’s BIS programs. This

119
implementation has significant potential benefits for the CareerTech system in an
era of public and legislative scrutiny and fiscal accountability.
120
REFERENCES
Abernathy, D. (1999). Thinking outside the solution box. Training and Development, 53
(2), 18-23. Adelgais, S. (2001). Return on investment – An evaluative framework. Retrieved
January 20, 2005 from: http://coe.sdsu.edu/eet/Articles/roi/
American Society for Training & Development (2002). ROI of human capital. Retrieved
January 25, 2005, from:
http://search.epnet.com.argo.library.okstate.edu/login.aspx?direct=true&db=afh&
an=7732248
Bahlis, J. (2004). Where training resources should be allocated. ROI network news,
Summer 2004. Available online at www.bnhexpertsoft.com. Retrieved March 4,
2005.
Barnard, J. (2002). Return on Training Investment. Retrieved September
10, 2003, from:
www.esi-intl.com/public/publications/112002trainingroi.asp
Barnett, J. M. (2005). Focus group tips for beginners. Retrieved March 27, 2005 from:
http://www-tcall.tamu.edu/orp/orp1.htm
Bassi, L. J., & McMurrer, D.P. (2001). Do firms’ investments in training pay off?
Unisys World News, July, pp. 3-4.
121
Bernthal, P. (1995). Evaluation that goes the distance. Training and Development, 49
(9), 41-45.
Blankenship, S. (2004). Power plant operators need to keep things heated up. Power
Engineering, 108, 9. Retrieved May 17, 2004 from
http://80-search.epnet.com.argo.library.okstate.edu/direct.asp?an
=12840760&db=afh
Brauchle, P.E, & Schmidt, K. (2004). Contemporary approaches for assessing outcomes
on training, education, and HRD programs. Journal of Industrial Teacher
Education, 41 (3), 71-97.
Brown, B.J. (2001). Return on investment in training. Stillwater, OK: Edmond Low
Library. (ERIC Document Reproduction Service No. ED 459359)
Brown, S., & Seidner, C. (1998). Evaluating corporate training: Models and issues.
Boston: Kluwer Academic Publishers.
Cross, J. (2001). A fresh look at ROI. Learning Circuits, American Society for Training
and Development, Retrieved September 28, 2003 from
www.learningcircuits.org/2001/jan2001/cross.html
Davidore, E. A, & Schroeder, P. A. (1992). Demonstrating ROI of training. Training
and Development, 46, 70-72.
Densford, Lynn (1999). Calculating the bottom line impact of training and development
efforts. Employee Benefit News, 13, 1-4.
Ellis, K. (2004). What’s the ROI of ROI? Training Mag.com. Retrieved January 29,
2005 from:
http://www.trainingmag.com/training/reports_analysis/feature_display.js
?vnu_content_id=1000752027
122
Fagiano, D. (1995). Making training quantifiable. Supervision, 56 (16), 12-13. Fern, E. F. (2001). Advanced focus group research. Thousand Oaks: Sage. Fraenkel, J. R. & Wallen, N. E. (2003). How to design and evaluate research in
education. New York: McGraw – Hill. Gay, L. R. & Airasian, P. (2000). Educational research: Competencies for analysis and
application. Columbus, OH: Merrill Publishing. Goebert, B. & Rosenthal, H. M. (2002). Beyond listening: Learning the secret language
of focus groups. New York: John Wiley & Sons, Inc. Gordon, L., & Richardson, R. (2004). INFOSEC Economics: New approaches to
improve your data defenses. Network Computing. Retrieved May 22, 2004 from
http://www.nwc.com/showitem.jhtml?docid=1506f4
Guba, E. G., & Lincoln, Y. S. (1985). Effective evaluation. San Fransisco: Jossey-Bass.
Hall, B. (1997). If you need a million bucks…you gotta know your ROI.
Retrieved September 12, 2003, from www.caibt.com/roi3.htm
Hoffman, T. (2002). On line training, E-business integration yield big returns.
Computerworld, 36, p. 12.
Holloway, A. (2002). I’m down here, guys. Canadian Business, 75, 77-81.
Hopkins, W. G. (2000). Quantitative research design. Retrieved March 25, 2005 from:
www.sportsci.org/jour/0001/wghdesign.html
Hubbard, E. (20030. By the numbers. Training and Development, 57, 42-46.
Johnson, R.B., & Onweugbuzie, A. J. (2004). Mixed methods research: A research
paradigm whose time has come. Educational Researcher, 33 (7), 14-26.
Kirkpatrick, D. L. (1996). Evaluating training programs: The four levels. San Fransisco:
123
Koch, C. (2002). Why doesn’t your ROI add up? You do the math.
Retrieved September 28, 2003, from www.darwinmag.com/read/030102/roi.htm
Krueger, R. A. (1988). Focus groups: A practical guide for applied research. Newbury
Park: Sage.
Krueger, R. A. (1993). Successful focus groups: Advancing the state of the art. (D. L.
Morgan, (Ed.). Newbury Park: Sage.
Kumar, K. (1987). Conducting focus group interviews. Retrieved March 27, 2005 from:
http://www.usaid.gov/pubs/usaid_eval/ascii/pnaby233.txt
Kurtus, R. (2001). Determining training return-on-investment (ROI). Retrieved January
29, 2005 from: http://www.school-for-champions.com/training/roi.htm
Lang, M. (2004). A driving force. Design News, 60, 72-75.
Leedy, P. D. & Ormrod, J. E. (Eds.). (2001). Practical research: planning and design.
Columbus: Merrill Prentice Hall.
Lundquist, E. (2003). Taking IBM to school. eWeek, 20, p 25.
Linkenbach, J. (1995). Behind the big sky bar: The Montana alcohol server’s study.
Unpublished doctoral dissertation, Montana State University, Bozeman.
Macarthur, K., Atkinson, C., Chura, H., & Sanders, L. (2004). What’s eating Burger
King. Advertising Age, 75, 1-2.
Mendoza, R. (1995). Is there a payoff? Sales Marketing Management, 47, 64-71.
Merriam – Webster Online Dictionary (2005-a). Retrieved January 17, 2005 from
http://www.m-w.com/cgi-
bin/dictionary?book=Dictionary&va=economic&x=14&y=7

124
Merriam – Webster Online Dictionary (2005-b). Retrieved January 17, 2005 from
http://www.m-w.com/cgi-
bin/dictionary?book=Dictionary&va=impact&x=16&y=13
Merton, R. K., Fiske, M. & Kendall, P. L. (1990). The focused interview: A manual of
problems and procedures (2nd ed.). New York: The Free Press. Miles, M. B., & Huberman, A. M. (1984). Qualitative data analysis: A sourcebook of
new methods. Beverly Hills, CA: Sage. Morgan, D. L. (1988). Focus groups as qualitative research. Newbury Park: Sage. Morgan D. L. & Krueger, R. A. (1993). Successful focus groups: Advancing the state of
the art. (D. L. Morgan, (Ed.). Newbury Park: Sage.
Mosher, B. (n.d.a). ROI serves many masters. Element K. Retrieved June 21, 2004 from
http://www.elementk.com/training_advice/htm/04-03-ROI.asp
Mosher, B. (n.d.b) ROI or ROE: What are we really measuring? Element K. Retrieved
January 30, 2005, from:
http://www.elementk.com/training_advice/htm/04-02-roiorroe.asp
O’Brien, P., & Manross, G. (2002). Building Customer Loyalty. Parks and Recreation,
37, 50 – 53.
Oklahoma Department of Career and Technology Education (2000). Technology center
instructions for providing enrollment and program data. Stillwater, OK: ODCTE
Press.
Oklahoma Department of Career and Technology Education (2005). Retrieved January
16, 2005, from
http://www.okcareertech.org/measuringup/SysOverview/DeliverySys/DeliverySy
s.html
125
Ozanian, M. K. (2004). George Steinbrenner, Meet Warren Buffett. Forbes, 173, 56.
Parry, S. B. (1996). Measuring training’s ROI. Training and
Development, 50 (5), 72-77.
Pescuric, A. & Byham, W. C. (1996). The new look of behavior modeling. Training &
Development, 50, 24 – 31. Phillips, J. (Ed.) (1994). In action: Measuring return on investment. (Vol. I).
Alexandria, VA: American Society for Training and Development. Phillips, J. J. (1996a). How much is the training worth? Training & Development, 50
(4), 20 – 25. Phillips, J. J. (1996b). Was it the training? Training & Development, 50, 28 – 33.
Phillips, J. J. (1996c). The search for best practices. Training and Development, 50 (2),
42-47. Phillips, J. J. (1997c). Return on investment in training and performance
improvement programs. Houston: Gulf Publishing Company.
Phillips, P. (2002). The bottom line on ROI: Basics, benefits, & barriers
to measuring training & performance improvement. Atlanta: CEP Press.
Presley, L. E. (1995). Characteristics of high performing, post
secondary, educational institutions conducting workplace training for small
to medium sized businesses. Unpublished doctoral dissertation, Oklahoma
State University, Stillwater. Purdum, T. (2003). Survival of the fittest. Industry Week, 252, 22-26. Rummler, G. A. & Brache, A. P. (1997). Improving performance: How to manage the
white space on the organizational chart. San Francisco: Jossey – Bass.
126
Schensul, J. J., LeCompte, M. D., Nastasi, B. K., & Borgatti, S. P. (1999). Enhanced
ethnographic methods: Audiovisual techniques, focused group interviews, and
elicitation techniques. Walnut Creek: Alta Mira.
Setaro, J. (1999). E-learning I.O. Learning Circuits, June, 2001. Shavelson, R. J. (1996). Statistical reasoning for the behavioral sciences. Boston:
Pearson Custom Publishing. Shelton, S., & Alliger, G. (1993). Who’s afraid of level 4 evaluation? Training and
Development, 47 (6), 43-46. Shepherd, C. (1999). Assessing the ROI of training. Retrieved September
28, 2003, from www.fastrak-onsulting.co.uk/tactix/features/tngroi/tngroi.html
Sorenson, S. M. (2002). Training for the long run: a cost-benefit perspective.
Engineered Systems, 19, 34.
Staples, S. (2003). Cult of accountability: Does employee training pay off? Accounting
techniques and science-inspired metrics evaluate return on investment. Canadian
Business, 76, 123 – 124. Sterling Institute (1998-2003). Retrieved September 25, 2003, from
www.sterlinginstitute.com/co/tl/roi/siroil.htm
Tian, O. (2001). Enhancing the bottom line: Manpower training and the
return on investment. Retrieved September 13, 2003, from
www.refresher.com/!trainingroi.html
Vogelsong, H., Graefe, A., & Estes, C. (2001). Economic impact analysis: A look at
useful methods. Retrieved January 24, 2005 from:
http://search.epnet.com.argo.library.okstate.edu/login.aspx?direct=true&db=afh&
an=4235811

127
Williams, J. C. (n.d.). Return on investment analysis. Retrieved September 25, 2003,
from www.gsu.edu/~mstswh/courses/it7000/papers/returnon.htm

128
APPENDICES

129
APPENDIX A
SURVEY QUESTIONNAIRE

130
Oklahoma Department of Career and Technology Education Existing Industry Training Program
Customer Satisfaction/Return on Investment /Economic Impact Survey
Please rate your feelings about the following aspects of the Existing Industry Training program. Circle the number that represents your feelings or fill in the blank to answer questions regarding the program.
Rating Scale Very Satisfied Satisfied No Opinion Dissatisfied Very Dissatisfied 1. The local technology center staff assistance to my business during the Existing Industry Training program process.
5 4 3 2 1
2. Timeliness of response by local technology center staff upon initial request for training.
5 4 3 2 1
3. Communication between your business and the local technology center staff during the Existing Industry Training program.
5 4 3 2 1
4. Handling of problems (if applicable) by the local technology center staff that arose during the Existing Industry Training program.
5 4 3 2 1
5. Please rate your overall experiences with the Existing Industry Training program.
5 4 3 2 1
6. Please tell us what your business likes most about the Existing Industry Training Program.

131
7. Please tell us what your business likes least about the Existing Industry Training program.
8. Please tell us what your business would like to see changed about the Existing Industry Training program.
9. Please describe or explain the results or effects of the training received through the Existing Industry Training program on your business.
In the past five years, your business has been involved in ________ Existing Industry training projects involving ________ employees. The topics of this training have been: a. b. c. d. e. f. g. h. i.

132
Customer Satisfaction/Return on Investment/Economic Impact Survey (con’t.)
Please answer the following questions based on the information from the previous page: 10. Number of new jobs created as a result of Existing Industry training
program:______
11. Average wage (per hour) for these new employees at the time they received training as part of the Existing Industry training program:______
12. Number of these employees still employed as of today:______
13. Average wage (per hour) of these employees as of today: ______ 14. Average wage (per hour) of existing employees at the time they received training
as part of the Existing Industry training program:______ 15. Number of existing employees still employed today:______ 16. Average wage (per hour) of existing employees as of today:______ 17. Amount of monies saved, realized, and/or gained (increased output, improved efficiency, improved profits, fewer accidents, less down time, etc.) as a result of the Existing Industry training program over the five year period 2000 – 2004):__________________ 18. Other monetary effects (positive or negative) of having been involved in training as part of the Existing Industry training program:
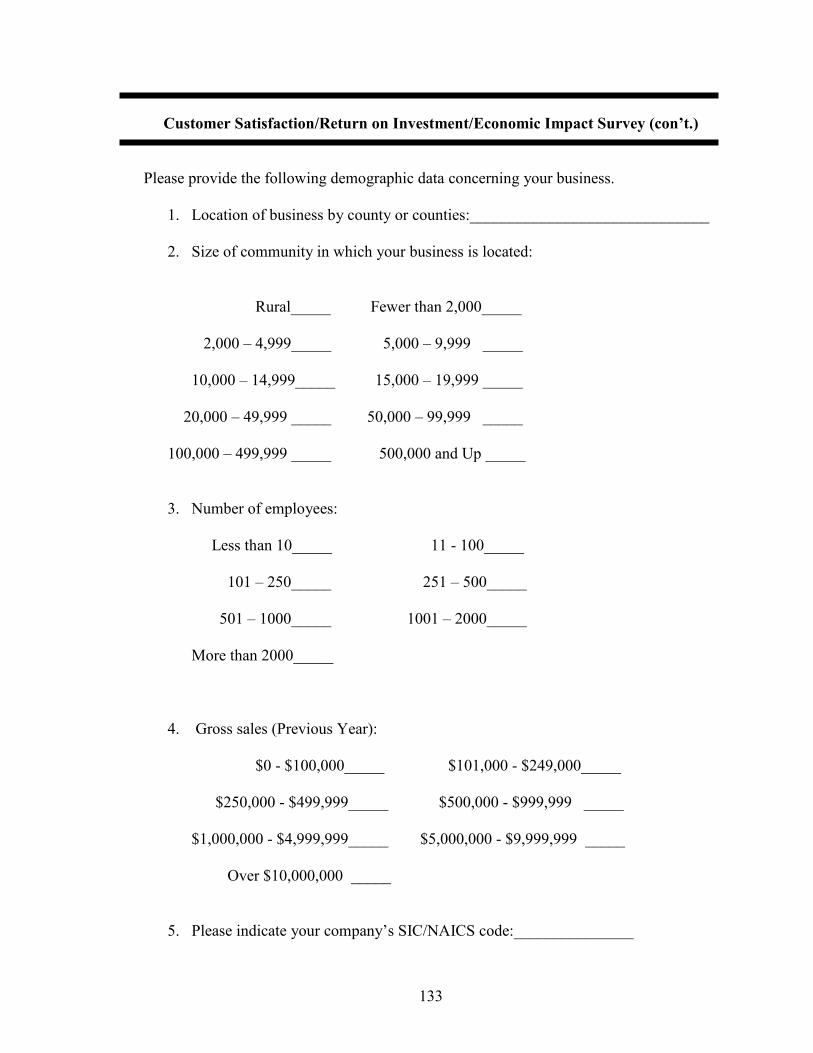
133
Customer Satisfaction/Return on Investment/Economic Impact Survey (con’t.)
Please provide the following demographic data concerning your business. 1. Location of business by county or counties:______________________________ 2. Size of community in which your business is located:
Rural_____ Fewer than 2,000_____
2,000 – 4,999_____ 5,000 – 9,999 _____
10,000 – 14,999_____ 15,000 – 19,999 _____
20,000 – 49,999 _____ 50,000 – 99,999 _____ 100,000 – 499,999 _____ 500,000 and Up _____
3. Number of employees:
Less than 10_____ 11 - 100_____
101 – 250_____ 251 – 500_____
501 – 1000_____ 1001 – 2000_____
More than 2000_____
4. Gross sales (Previous Year):
$0 - $100,000_____ $101,000 - $249,000_____
$250,000 - $499,999_____ $500,000 - $999,999 _____
$1,000,000 - $4,999,999_____ $5,000,000 - $9,999,999 _____
Over $10,000,000 _____
5. Please indicate your company’s SIC/NAICS code:_______________

134
APPENDIX B
RAW DATA EXAMPLE – ODCTE

135
Pioneer Tech. Center
$31,144.00
934 09/13/03 Cooper Compression
45 CNC 10 $6,800.00 $0.00 0% $24,344.00 32
953 10/04/03 Lindsey Manufacturing
46 18 $2,900.00 $2,900.00 100% $21,444.00 32
987 01/04/04 Conoco Phillips 698 204 A OSHA
20 $12,000.00 $12,000.00 100% $9,444.00 32
1003 02/09/04 Tonkawa Foundry
30 TPM 20 $3,300.00 $3,300.00 100% $6,144.00 32
1004 02/09/04 Tyson Foods 530 HACPP 20 $2,930.00 $2,964.00 101% $3,214.00 321046 05/11/04 Mertz 120 CPI 16 $1,400.00 $1,229.40 88%

136
APPENDIX C
FOCUS GROUP TRANSCRIPT

137
RES: A little background. I decided to do this project on economic impact,
customer satisfaction, and return on investment of the Existing Industry
Training program so I asked State Department personnel to get me all the
data on those years that we have had this program. 2000-2004, five years.
And this is all the information I used to develop this research plus a whole
lot of other stuff for these years. We put together a questionnaire here that
I sent out and I actually sent out 552 of those. I spent around $1,400 in
postage. I received back 59. So is a little over 10% return on my mailing.
We sent a questionnaire out to every training contract that occurred during
this time frame.
BIS1: That’s over the life of the program?
RES: Yes, over the life of the program, 2000-2004, 5 years.
At this point, the researcher passed out copies of the focus group questions and
allowed the participants a few minutes to look over the questions before proceeding.
SD1: Is this the only group that you are going address concerning this topic.
RES: Yes
SD3: There was supposed to be 2 industry folks here today.
RES: Yes, that is the reason that the questions are written as they are.
SD1: OK. I was just trying to make sense of the questions.
At this point, the researcher passed out a rough draft of Chapter 3 for the
participants to look at before proceeding.
RES: Look on page 2 of Chapter 3, there are four research questions there and
that is what the study has been based on. Any questions or comments
about the research questions? (No verbal response). If you look over on

138
page 5, it talks about the population being 552, and then if you look at
page 6 through page 14, it tells you by each technology center every
business that we had a training contract with.
SD1: It would be interesting to know if the response had anything to do with the
relationship and rapport between the technology center and the company.
RES: Yes it would
SD1: It is interesting that some of these that serve a large number, there are no
responses from. If the shoe fits, wear it.
RES: I did not get any responses from my three companies.
SD1: I am going to use Tulsa as an example. There’s 39 listed and no
responses.
RES: The two I delivered mine too; I know they got them; I called them several
times, but I never received them back. And, I work with these folks all the
time.
BIS1: That really curious on your return.
RES: I know. If you look on page 16, it tells you how many we sent out and
how many we received back by technology center, and of course at the
bottom that we sent out 552 and got back 59.
SD3: I know that you had hoped for more, but I think on mail outs its way
above the national average.
SD1: Oh, yeah, its like 2%
RES: Yes, its like a little over 10% response rate
BIS1: Northwest almost had a 50% return rate
RES: Yes, so did Southern
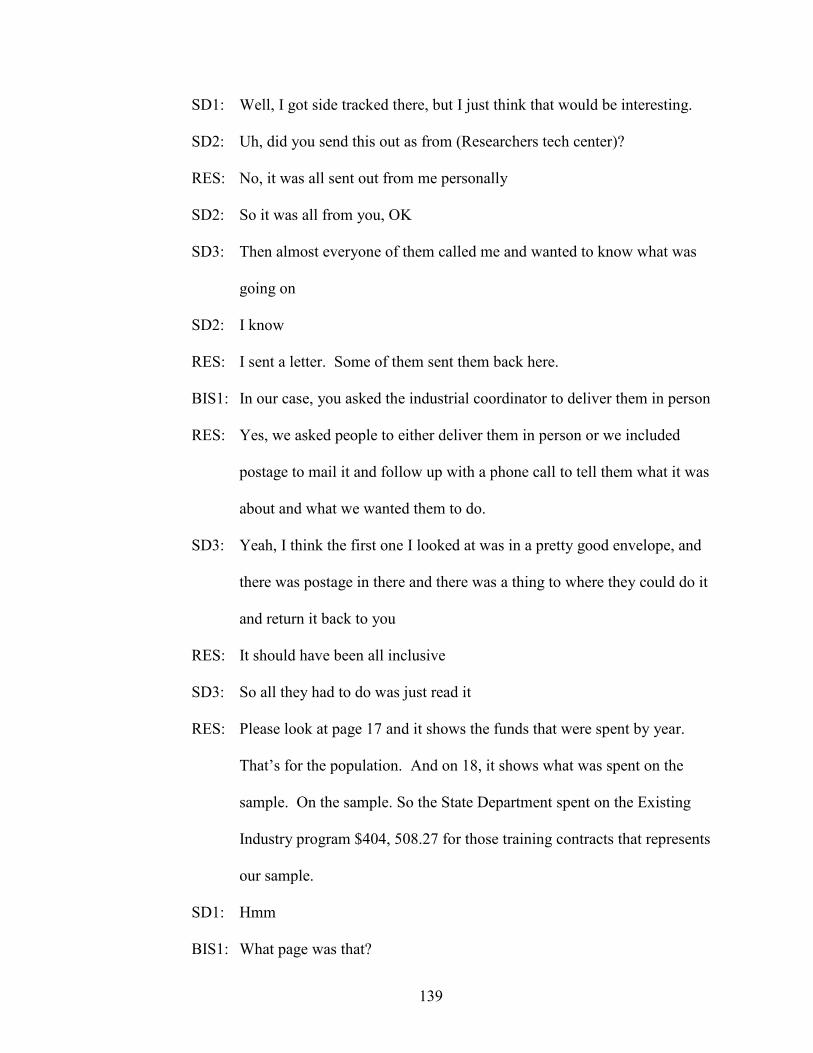
139
SD1: Well, I got side tracked there, but I just think that would be interesting.
SD2: Uh, did you send this out as from (Researchers tech center)?
RES: No, it was all sent out from me personally
SD2: So it was all from you, OK
SD3: Then almost everyone of them called me and wanted to know what was
going on
SD2: I know
RES: I sent a letter. Some of them sent them back here.
BIS1: In our case, you asked the industrial coordinator to deliver them in person
RES: Yes, we asked people to either deliver them in person or we included
postage to mail it and follow up with a phone call to tell them what it was
about and what we wanted them to do.
SD3: Yeah, I think the first one I looked at was in a pretty good envelope, and
there was postage in there and there was a thing to where they could do it
and return it back to you
RES: It should have been all inclusive
SD3: So all they had to do was just read it
RES: Please look at page 17 and it shows the funds that were spent by year.
That’s for the population. And on 18, it shows what was spent on the
sample. On the sample. So the State Department spent on the Existing
Industry program $404, 508.27 for those training contracts that represents
our sample.
SD1: Hmm
BIS1: What page was that?
140
RES: Page 18.
BIS1: That’s amazing
SD3: $400,000; is that about right?
SD1: So your smaller utilizers, dollar wise, are the ones that responded
RES: Look on page 19 and look at the urban/rural difference
RES: The number of businesses in the population was 62% rural and in the
sample was 93% rural.
SD1: How did you define rural?
RES: Uh, I defined urban as Tulsa, Moore-Norman, Francis Tuttle, Metro Tech,
and Mid-Dale. I considered those to be urban. The rest of them I
considered them to be rural. That how I defined them
SD1: And really, that a, if you take individual years there would be quite a
variation, because weren’t we at 80% rural at one point in time for
Existing industry?
RES: That was just me call as a researcher, basically
SD1: Sure, sure. Because it was almost completely opposite of TIP when you
look at these numbers.
RES: Then on 19, if you look at the bottom and the top of 20, that is how I
defined company size, 0-100 is small, 101-300 medium, and 301+ was
large. And the table on 20 gives you break down of companies based on
the size of business.
SD2: It is interesting that a lot of small business account for 50% of the
population, and 84% of your sample. It speaks to the value that this
program adds to small business.
141
RES: This program is a life saver for many of these small businesses.
RES: OK
SD1: Can I side track us again just a little bit?
RES: Sure
SD1: Were in the process of trying to do some economic impact information
statewide. Actually be contracting with OSU to do that, and this time we
will be including BIS and both your guys are probably aware that we have
tried to do that before, however the exact methodology couldn’t be agreed
upon by BIS people across the state. Uh, so were gonna direct what that
looks like to kinda get us off high center. Some of this information would
be valuable I think for a researcher for look at initially. Would you mind
that being shared?
RES: No, not at all. That fine. That’s why I did this study.
SD1: OK
RES: And its not done yet, but it should be done before the end of Juen
SD1: Sure, sure. We too have to develop questionnaires.
At this time, the researcher passed out the rough draft of Chapter 4 for the
participants to look at prior to proceeding.
RES: Chapter 4 is not complete yet. Look on page 2 first. Table 7 is basically
the responses that I got on the questionnaire which are on page 3 of your
questionnaire. Those are the responses from the sample that I got that
includes new employees hired, etc.
142
SD1: So these are new jobs created, not necessarily intended at the time the
training was implemented.
RES: Well, question 10 was worded as new jobs created as a result of the exisitn
industry training program.
SD1: So it’s a result of the training. If we knew the jobs were gonna be created
before we went in to do the training, then we might have looked at TIP.
Because if they qualified for TIP, they wouldn’t have used existing
industry.
SD2: Or you could look at it as, they didn’t realize or company wasn’t aware of
TIP, they hired the people, or their there, existing industry upgraded their
skill to fill that slot. TIP is out of the question.
SD1: I’m looking at it as an unexpected result.
SD3: So am I
RES: They had a need, so they hired them to fill that need when they knew they
could go this route to get them trained.
SD1: OK
RES: Make sense?
BIS1: The difference between the average wage per hour for new employee,
$7.53 and the average wage for existing employee as today, $18.00. Why
is there that large of difference?
RES: I am not sure. That was simply what was reported. You have to go back
and understand that we only had a sample of 59, so we may have had a
couple of spikes in the wages that kind of skewed the average.
SD3: It is also out over 5 years

143
RES: Right, so
SD1: Ok, I am still struggling here, ok?
RES: Ok
SD1: We know we had 162 new hires, do we know whether or not we went in to
a company, we did training, we moved out, and because of increased
productivity or whatever, these people were then hired? Or, are these
people, they were hired and then they were then put into training.
RES: I think that is a better statement. I can’t assume that because I don’t know
for sure
SD1: Ok, so its not an unexpected result of the existing industry training. The
existing industry training did not lead to company expansion in the area of
new jobs.
RES: I think you can based on the way that question 10 is worded, so, let say
you need machinist. I can’t afford to get them trained, but I got a program
that can get them trained if I can afford to hire them.
SD2: Or you could look at it, irregardless of initiative, the demand of that
company who hired new employees exists. TIP wasn’t what helped them
to add new slots. They have added them. As I read this, the existing
industry initiative helped them bring those employees up to speed to help
them become productive.
RES: Well, they got them productive faster.
SD1: I think that there is more than one way to look at it.
SD3: If you look at what took place at Shackley and the existing industry
training that they did down there, they actually ended up bringing it in
144
from California, and that was a 100 jobs. I don’t know that reported out in
here, I didn’t look at that, they knew they were going to expand.
California lost and we won. Ok, another situation, if a company, say their
product is cycled and they are down, they wouldn’t be eligible for TIP if
they were below their baseline, even though they are hiring new people,
they worked with the schools actually put the people on the payroll and
then sent these people to the existing industry training. So, we were
actually training people that were employed. But it did create new jobs.
SD1: OK
RES: Look at the second column, next to the last figure, amount of money
realized, saved or gained as a result of the existing industry training
program. $2, 035,711.00. That came directly off of the responses to the
surveys.
SD1: That’s with the $400,000 investment
RES: That’s what I am getting at. So, if you go to the next page, page 3, look
down there about 2/3 of the way, take Phillips ROI formula and apply that,
for the sample of 59 that we received, you run the formula and you get a
ROI of 396%, so, for every dollar we invested in the sample through the
existing industry training program, we got $3.96 back in value. The thing
we don’t know is things such as the cost to the companies for the
employees while they went to training and were still being paid. This is
just saying, for the monies that the State Department invested, and based
on the monies that the companies told us were saved, gained and/or
realized, that’s what the ROI calculation spit out.
145
SD1: I was about to request another ¾ of a million for existing industry over the
next couple of years. Your helping here.
SD3: This ought to help
RES: The deal is, again we are only looking at 59, not 552.
SD1: OK
BIS1: Have we ever had any estimates as to what that would be?
SD1: Not on existing industry. We have done some on TIP. If you look at
Tulsa and Moore Norman, they have done some things on some BIS type
training but not; those haven’t been developed like they should have been
developed.
SD1: When we do it we are going to arrive at the numbers the same way you
did. The numbers have to be supplied by the company.
SD2: But the other thing, I think one of the things that will help us to improve, if
we arrive at a tool that allowed us to evaluate the success of the dollars
and the success of how it was implemented at the company, and we did
that by project, there could probably be an equation of the dollars going up
based on today’s information, uhm, rather than going back 5 years; we can
show it more directly instead of trying to remember back over a span of
time.
RES: If you look at it in a linear mode, the result expand tremendously.
SD1: Yeah, because you get a cumulative effect. Sure, this lead to this, and this
and this; its kind of like running backwards through a funnel.
SD3: I got a phone call this morning where we invested a little over $21,000 and
the school is going to wind up selling around $102,000 in training, and the
146
time they take their real expenses out, they will realize around $40,0000 in
real profit, because of the existing industry program. We developed 6
programs, specialized training sessions for this company and they are
going to buy $102,000 in training.
RES: The whole issue is making sure you ask the right questions when
developing a realistic tool to measure ROI
SD1: I think that it has to come from here (State Department)
RES: It does
SD1: We are not going to get all of you guys to agree on how to measure ROI,
and we are going to continue to flounder until we present the way it is
going to be measured.
SD2: And to have this kind of information when you are speaking to the
legislature about funding is invaluable.
RES: Ok, look at page 4, research question number 2, general satisfaction with
existing industry training program; there were 5 questions on this
questionnaire, the front page of it, the first one was; we are asking to have
them rate their level of satisfaction with 5 being very satisfied to 1 being
very dissatisfied. Look on the bottom of page 4, the mean rating on
question 1 was a 4.72. So, they are pretty satisfied. Ok? Same thing with
question number 2.
At this point, SD1 was called out of the focus group meeting. The rest of the
group continued on with the meeting.
147
RES: The first 5 questions, the mean of all those questions indicates the people
were either satisfied or they were very satisfied. Somewhere in between
there.
SD3: We got a little room to improve
RES: Sure; questions about that or comments. If you look at table 9 on page 5,
question 6 through 10, please tell us about what you like, dislike, what you
want to change, etc. I took all the responses in the Appendix and then I
reduced all of these responses into the 4 categories found on page 5. I
tried to rate each response as either positive or negative. So out of 174
responses that I boiled down into these categories, there were 144 that
were positive, and 30 that were negative. I can tell you that most of the
negatives were “we need more money in the program”.
SD2: Negative comment not meaning relating to quality.
RES: I chose as a researcher to handle those, from a program standpoint, as a
negative comment.
SD3: I agree with you that we need more money, but on the other side, we are
not spending everything we get right now.
RES: Page 6, table 10, and page 7 tells you the frequency of how the satisfaction
came out as compared to community size, number of employees, and
gross sales. What we have in the sample is a lot of small companies
bringing in a lot of big money.
SD3: I’d like someway in the guidelines as part of that existing industry
agreement that says you will complete this so that we can collect data on
100% of the projects.
148
RES: I think that is do-able
SD2: That goes back to my point of saying per project, based on the agreement,
you do an evaluation of the exact dollars.
RES: Because then you can get actual costs of what it cost to send people to
training since you are most likely paying them while they are there.
SD3: That will give you a more clear picture of profits versus losses of your
training dollars in more tangible terms.
RES: The rest of those tables breaks down the satisfaction level by all the
different demographic data. Thing I would tell you is that in the sample
we had no 1’s (Very Dissatisfied) or 2’s (Dissatisfied). There are a few
3’s (NO Opinion), mostly 4’s (Satisfied), and the majority are 5’s (Very
Satisfied).
BIS1: Do you get the feeling while we are out there in the field with these
companies, do they feel like they are getting something for nothing. Do
they feel like they are getting some of their tax dollars back?
BIS2: That’s what I think
SD2: I think its how that local staff presents that program to the companies.
BIS1: And unless we just really screw things up, they are going to be pretty
happy I would think.
SD2: And that’s how we can approach either TIP or existing industry, we can
show them a return from their tax moneys as well. We can equate it back
to the fact that they paid X amount, and they get a return on investment on
the taxes they paid.
149
SD3: I have went out and just spot checked some classes. A number of times
when you ask one of the students who is putting on the training and they
respond “well the company sent me over here”. And then I would have to
go back and get with the IC or the instructor; I thought we agreed that we
were going to start the training off with “here’s a program that is out of
your tax dollars, its funneled to the schools.
BIS2: That maybe something that you can add to the agreement also.
At this point, the researcher passed out appendix that contained the answers to the
open-ended questions on the survey. The group looked over the appendix prior to
proceeding.
RES: What you have in front of you is the answers to questions 6,7,8, and 9.
Please take a minute and look through there.
SD2: It is interesting to me that these answers represent a broad arrangement of
ideas and viewpoints.
RES: If you do not see 59 responses to each question, that means they left it
blank. I put every answer in there verbatim.
SD2: This is another area I hoped would come out of this. On number 40, it
talks about making our decision easier to buy and upgrade equipment.
The indicators of not only being able to put a dollar figure to it. Its one
thing to do training, but it is also important that they recognize how
important it is to be able to bring in equipment and immediately follow it
up with training.
BIS2: You will see several times through here the word “flexibility”.
150
SD3: I saw in there the comment concerning no carryover to the next fiscal year.
That’s just basically a clarification.
SD2: Look at number 6 on page 5. Uh, request funds for 1 project requiring
other projects to be postponed.
SD2: 34 is a point that may be reflected in local schools making good use of
funds. Some schools do not even know where the application is and that
may contribute to a delay in a decision being made as to whether or not a
project will be funded.
SD3: I have seen a few where they have kind of been hung up because of
multiple campuses and where the BIS director actually has to sign off on
it, and then the campus director, and then it goes to the superintendent to
sign, and then it goes back to the IC before being mailed to the State
Department.
SD2: The point that SD1 was making about trying to separate TIP and existing
industry, existing industry contributing to safety. That is a different pot of
money, it may help to contribute to the overall process of getting people
trained. It is just another way to help get your foot in the door with many
of these companies.
RES: Any other comments concerning open-ended questions 6,7,8, 9.
SD2: Item 46. Three employees received promotions and pay raises as a result
of the training they received.
BIS2: I like number 42. “Without it as a small and new business, we would have
a very difficult time equipping ourselves and getting started. Our
employees to compete in this business. That kind of says it all.
151
At this point the focus group looked the formal questions developed for this group
meeting. Below are the responses to those questions.
Question number 1.
What does the data reveal to you concerning Return on Investment, Economic
Impact and/or Customer Satisfaction concerning the Existing Industry Training Program?
Do you agree with the findings, yes or no, and why?
SD3: I think before,we were just guessing on return on investment. We did not
have any real data that we could put our arms around, and we definitely
did know what the return on investment percentage was. I think now
we’ve got some data. The sample size is small and I hope we can look at
ways to improve the sample size and hopefully we will be able to continue
this and build it into our database and we will have it.
SD2: I said before, it is affirmation that we’ve talked and we have made the
assumption that this program is adding value. What brought us to today
is not what will take us forward. The types of things we do need to be
looking at not only from a legislative standpoint but also an industry
standpoint is find ways of helping them to understand why things like a
training budget might be important to consider as a company grows and
changes. I see it as an opportunity to receive funding to help train people,
but it is also a weaning process that hopefully serves as a seed to help
companies understand that as they grow they will have come up with
funding to help with their training needs. I do agree with the findings. I
think this program is a way for us to be more proactive with companies
152
using the program as an incentive to help promote more and better
training.
BIS1: I felt all along that the program was good and beneficial and a way for us
to get in the door to help train and tool up and retrain. One example of
that is in Sapulpa at Bennett Steel where they have had to let some people
go but they have hired a whole new set of welders with different skill sets
to help sustain growth in the company. It is reaffirming what I felt.
Certainly I agree with the findings and hopefully this is some data that we
can build on for the future.
Question number 2 & 3.
What does the term ROI or Return on Investment mean to you and your
organization? Is it a good idea/bad idea? Please relate your relative knowledge of ROI?
SD3: If I set there and look at our agency, in order to have that you have made
an investment in something and your selling something and taking all of
your cost out of it and you get what’s left, that’s your return. Ok. At the
agency, up until probably a year and a half, two years ago, that about half
of us up here felt like our customers was the tech centers. And the tech
centers, we don’t sell them anything. But until we make the leap, and we
are now, to where business and industry or that industry base out there is
all of our customers. Now, if we help that customer grow and sell more
products, making it’s products cheaper, adding more profit to that
organization, then there will be more of that ad valorem tax paid into that
pot so that when we get our 4% of the education budget, then that budget
will go. I think for a long time up here, we were mixed. I think that you
153
could have said “who’s our customer” and some of them would said the
superintendents, some of them the BIS directors, some of them the tech
centers, and there would not have been a half a dozen of them that would
have said that their customers were business and industry. We are
working through that.
SD2: The biggest value that I see ROI making, which is not such a new concept,
of thinking about always equating value, as in the proofs in the pudding.
Here is the program, so there it is a given that good things will come from
it, where as ROI is a way to take a pulse check and see if a program is
truly doing what it designed to do. If it is not adding value, then we need
to probably get rid of it more from finding like this that show the ROI of a
program versus just throwing dollars at a new program which is kind of
what we have done in the past. If a program is not adding value, we need
to be re-aligning our focus.
BIS1: The process of calculating ROI was discussed at a workshop in Tulsa a
year to a year and a half ago, and that’s some pretty deep stuff when you
get into it. I don’t think a lot of our smaller companies have somebody
that understands how to really calculate ROI. They only look at the
bottom line. Are they getting trained, are they increasing profits, that’s
about as close as they come right now to any kind of effort to calculate
ROI. At our school, for the full time programs, if the kids don’t get jobs
then that is not a good investment. I think that ROI means different things
to different people. The funds that are put into existing industry, I’m glad
to see the 3.96. That is important to point out to local folks.
154
BIS2: That is something that everybody understand, dollars and cents.
SD2: Sure
SD3: Sure
SD2: And that’s a direct correlation of a mind set. We are going through a
culture change both here in the agency and out in company’s from a
standpoint of we think programs are pretty good but we cannot say for a
fact what kind of return we have received on a given project.
RES: So, then is it a fair statement to say then that people don’t know how to
arrive at the numbers such as these that are generated out of Phillips
formula?
SD3: I was going to give you an example of 4 or 5 companies that I work with.
If you look at ROI and the bottom line of these companies, they thought
they were all making money at a fast pace and now, none of them are in
business. They all went bankrupt. They did not know what their return on
investment was and they paid for it by losing their companies. Now if you
some of the latest books, your accounting people did know how to figure
return on investment, but they could not get management to listen to their
findings. They did not call it that earlier, but that is what it has always
been.
RES: So, they weren’t accounting for all the costs.
SD2: It is one thing to say that it is adding almost $4.00 to every dollar that you
invest. Its another thing to show that there may be an opportunity to really
add value to a process. We can say that everything we do meets a demand
but it may not always look pretty from a standpoint of dollars.
155
RES: Is it a fair statement to say that you cannot always put everything into
dollars and cents?
ALL: Yes
RES: But it may still have added value.
Question number 4.
What barriers do you see to implementing a coordinated ROI initiative in our
organization?
SD3: I personally believe that you are going to have to use something to bring
out this information. I fully believe that business and industry is our
customers. We have got to use something that business agrees is a factual
and proven way to figure return on investment. Then the rest of us will
have to put our data into that and be satisfied with that until something
better comes along.
BIS1: A process or an equation needs to be developed so that we are comparing
apples to apples.
RES: So, are you saying that one of the barriers is that we are not all figuring
ROI in the same way now?
SD3: Yes
BIS1: Yes
SD2: I think that when you look at business, the agency, and the tech centers,
we may be handicapping the tech centers without having a unified
statewide effort to figure ROI. We need to formulize that mechanism so

156
that we can remove that barrier that exists because the schools have a 101
different ways of doing things and they are not always the same. We see
that that is a problem. Industries barrier to this is that they probably do not
have enough education in ROI to understand what ROI is and why it
might be important to them. A big barrier is that the school, businesses,
and people here at the agency just do not have a good handle on what
should really be considered when looking that ROI. All of these folks
must be able to reach a level of understanding on this subject that shows
that they “get it”.
BIS1: I think that we need to have a situation to where the IC has told the
company that when the training is completed a survey is going to be
conducted and that we are going to ask certain questions and then we will
come back in 6 months and follow up with similar questions. That way,
everybody will be expecting that and that will help eliminate the problem
of a small sample. Our sample then should be 100% and the answering of
the survey will be a condition of receiving existing industry funds.
BIS2: Our sample will then become our entire population.
SD3: Something that we’ve talked about is we are doing quite a bit across the
state on business excellence and Black Belt, green belts, statistical tools
for gathering data on return on investment. We would not be able to do it
on every project, but we would be able to pull a sample to where we can
go in and if they say they want XYZ training, we could benchmark where
they are right now, do the training, and then, like you say, come back in a

157
few months and measure again and then maybe a year later. We have
talked about that in the past but right now we do not have the people to do
it.
BIS2: So, maybe, when you get that instrument developed, then you can have an
independent source come take the measurements and then its not us saying
“this is what we’ve done” it is an independent sources saying “this is what
they’ve done.”
SD2: That has been a barrier across the board that handicaps us from the gate
because we do not know what the end result will be. Some people will not
be willing to do it because they may not like what the end result will look
like.
SD3: Amen!!
SD2: There will be resistance because people do not want to give up
information because they are afraid that it might effect them personally
depending upon the outcome.
Question number 5.
What outcomes (positive/negative) do you see as a result of implementing a
coordinated ROI initiative in your organization?
SD2: Well, in the next year, there will be a statewide coordinated effort to
helping improve our technology system for capturing ROI data. A number
of things are going to come from that. A positive through that process is
that the schools will have to become more educated in gathering this kind
of data. And then from that point, working with the tech center and the
158
industry’s together we want to make sure that all entities are talking ROI.
That statewide initiative will help in gathering this type of information.
BIS1: I have a concern about adding another layer to what is that we are asked to
do on a daily basis. We have some old dogs in the system that will resist
this type of change and I like what you said about possibly having an
outside entity help in the gathering of this data. Of course, that is
expensive when you bring in outside people to do that. Is there is some
way we can sugar coat this so that it doesn’t look like just another thing to
do. They want you to help with paying for the training but they do not
want something else to do.
SD2: It will entail our businesses making a paradigm shift so that this is not seen
as a negative. We need to position this in the right way that will allow
these companies to be receptive to this change and be receptive to that.
BIS2: If you took any of our business owners and said to them, “I can show you
a way that you can invest 1dollar and you will receive 4 dollars return on
that investment”, they would take the time to come to a meeting. At this
time they just do not see the importance of it.
SD3: We have done some black belt training in the past which in kind of
expensive, but we co-share the cost of doing the training. We pay the cost
but ask for the data on the training in return. Then part of their actual
certificate is held until that data is received.
BIS1: They won’t mind if they know up front that that they will be expected to
provide this kind of information as a part of the training agreement.
159
The researcher and the focus group members agreed that question number 6 had
already been answered with the following exception.
SD3: I think the only disadvantage to implementing ROI is if we get in a hurry
and we contract with a source that is not providing valid, factual data….
BIS2: If you cannot believe the numbers, nothing else will matter.
SD2: And it needs to be holistic. This type of ROI information should be
holistic for our system, not just the existing industry program.
BIS2: We also have to look at the ROI data in a linear mode. If we successfully
train somebody and they stay in that job for 10 years, we should be able to
account for that ROI over that entire period.
Question number 7.
After reviewing the findings of this study, what are your impressions, ideas,
comments concerning the present situation in the State of Oklahoma as it relates to the
implementation of ROI by Oklahoma businesses?
SD2: One of the things that wasn’t represented here because they are not here
are how much our comments today would be aligned with the comments
from business. I am impressed. I think that we are right on with this. I
think that as we begin going down this path, our knowledge will increase
and that will yield more pertinent data and it will help to increase our
relationship with business in Oklahoma. The comments that we have
received serve as an affirmation of the system. That relationship is so key
to being successful.
SD3: It will yield a better product in the long run.

160
APPENDIX D
RESPONSES TO OPEN-ENDED QUESTIONS
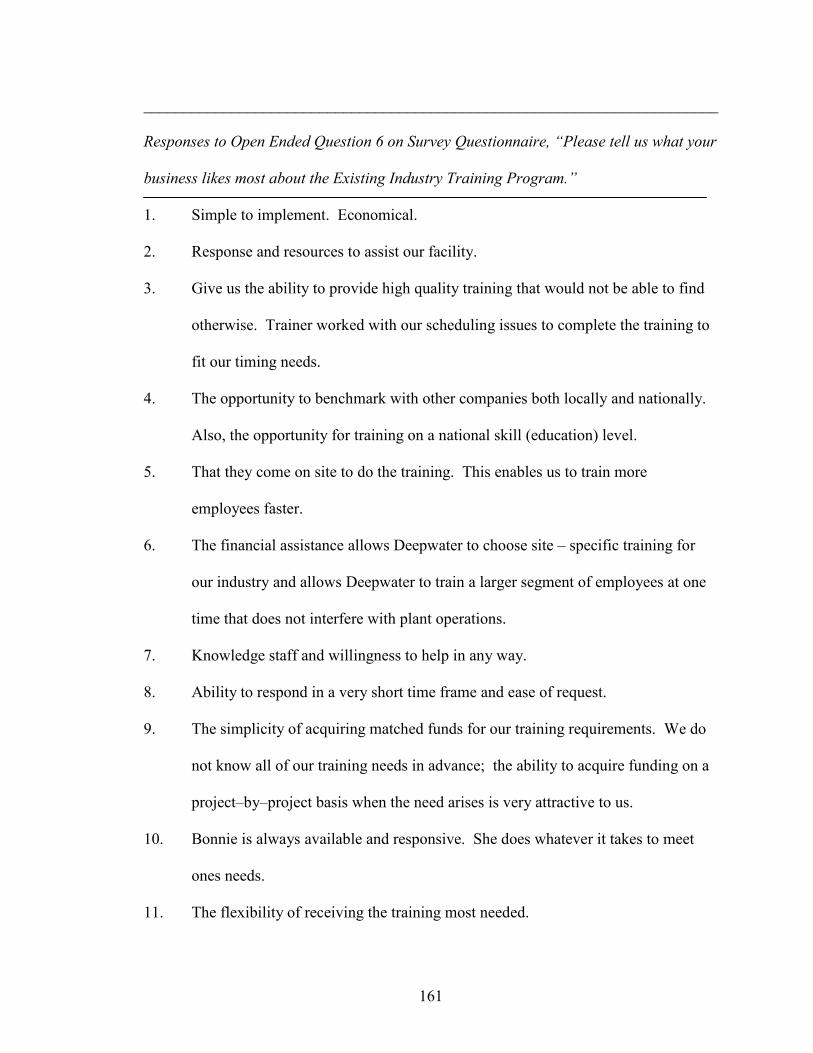
161
________________________________________________________________________
Responses to Open Ended Question 6 on Survey Questionnaire, “Please tell us what your
business likes most about the Existing Industry Training Program.”
1. Simple to implement. Economical. 2. Response and resources to assist our facility. 3. Give us the ability to provide high quality training that would not be able to find
otherwise. Trainer worked with our scheduling issues to complete the training to
fit our timing needs.
4. The opportunity to benchmark with other companies both locally and nationally.
Also, the opportunity for training on a national skill (education) level.
5. That they come on site to do the training. This enables us to train more
employees faster.
6. The financial assistance allows Deepwater to choose site – specific training for
our industry and allows Deepwater to train a larger segment of employees at one
time that does not interfere with plant operations.
7. Knowledge staff and willingness to help in any way.
8. Ability to respond in a very short time frame and ease of request.
9. The simplicity of acquiring matched funds for our training requirements. We do
not know all of our training needs in advance; the ability to acquire funding on a
project–by–project basis when the need arises is very attractive to us.
10. Bonnie is always available and responsive. She does whatever it takes to meet
ones needs.
11. The flexibility of receiving the training most needed.
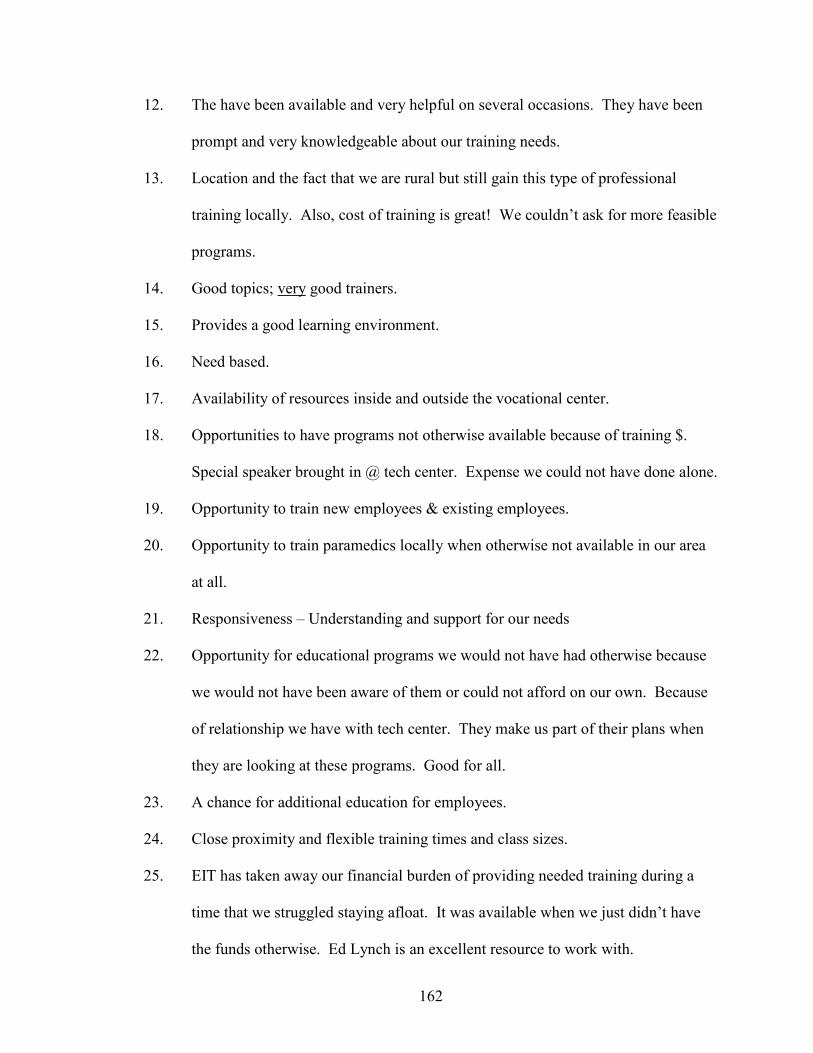
162
12. The have been available and very helpful on several occasions. They have been
prompt and very knowledgeable about our training needs.
13. Location and the fact that we are rural but still gain this type of professional
training locally. Also, cost of training is great! We couldn’t ask for more feasible
programs.
14. Good topics; very good trainers.
15. Provides a good learning environment.
16. Need based.
17. Availability of resources inside and outside the vocational center.
18. Opportunities to have programs not otherwise available because of training $.
Special speaker brought in @ tech center. Expense we could not have done alone.
19. Opportunity to train new employees & existing employees.
20. Opportunity to train paramedics locally when otherwise not available in our area
at all.
21. Responsiveness – Understanding and support for our needs
22. Opportunity for educational programs we would not have had otherwise because
we would not have been aware of them or could not afford on our own. Because
of relationship we have with tech center. They make us part of their plans when
they are looking at these programs. Good for all.
23. A chance for additional education for employees.
24. Close proximity and flexible training times and class sizes.
25. EIT has taken away our financial burden of providing needed training during a
time that we struggled staying afloat. It was available when we just didn’t have
the funds otherwise. Ed Lynch is an excellent resource to work with.
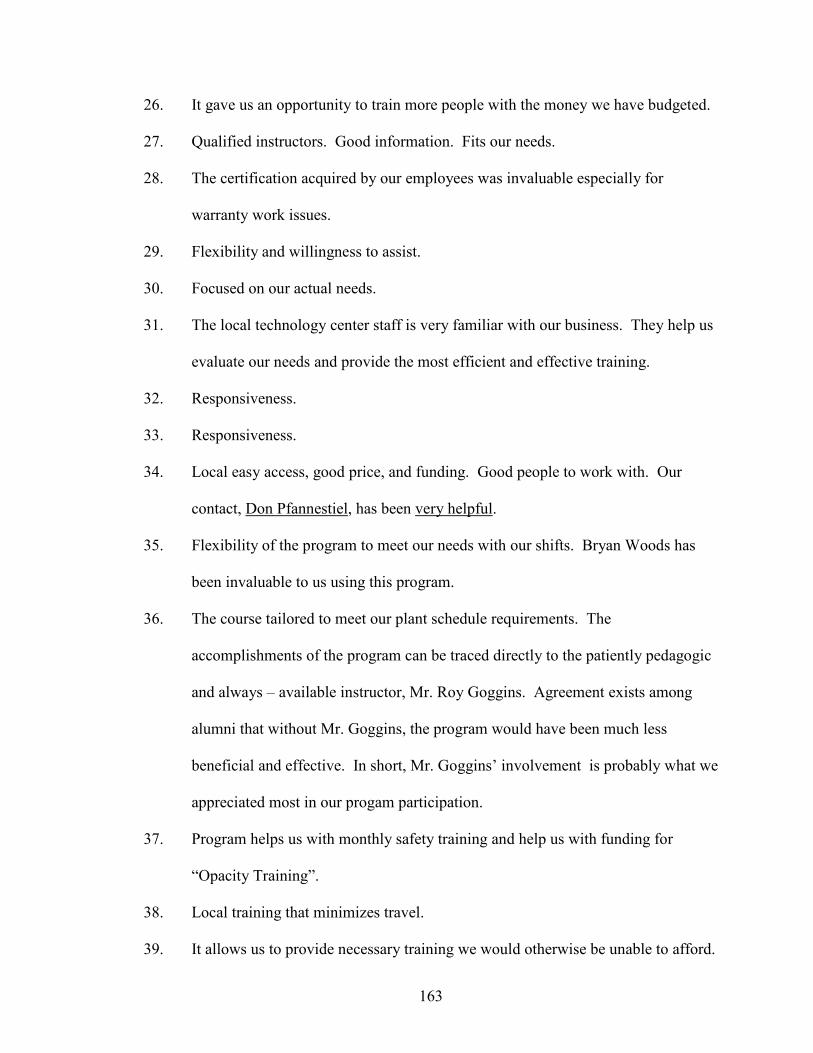
163
26. It gave us an opportunity to train more people with the money we have budgeted.
27. Qualified instructors. Good information. Fits our needs.
28. The certification acquired by our employees was invaluable especially for
warranty work issues.
29. Flexibility and willingness to assist.
30. Focused on our actual needs.
31. The local technology center staff is very familiar with our business. They help us
evaluate our needs and provide the most efficient and effective training.
32. Responsiveness.
33. Responsiveness.
34. Local easy access, good price, and funding. Good people to work with. Our
contact, Don Pfannestiel, has been very helpful.
35. Flexibility of the program to meet our needs with our shifts. Bryan Woods has
been invaluable to us using this program.
36. The course tailored to meet our plant schedule requirements. The
accomplishments of the program can be traced directly to the patiently pedagogic
and always – available instructor, Mr. Roy Goggins. Agreement exists among
alumni that without Mr. Goggins, the program would have been much less
beneficial and effective. In short, Mr. Goggins’ involvement is probably what we
appreciated most in our progam participation.
37. Program helps us with monthly safety training and help us with funding for
“Opacity Training”.
38. Local training that minimizes travel.
39. It allows us to provide necessary training we would otherwise be unable to afford.
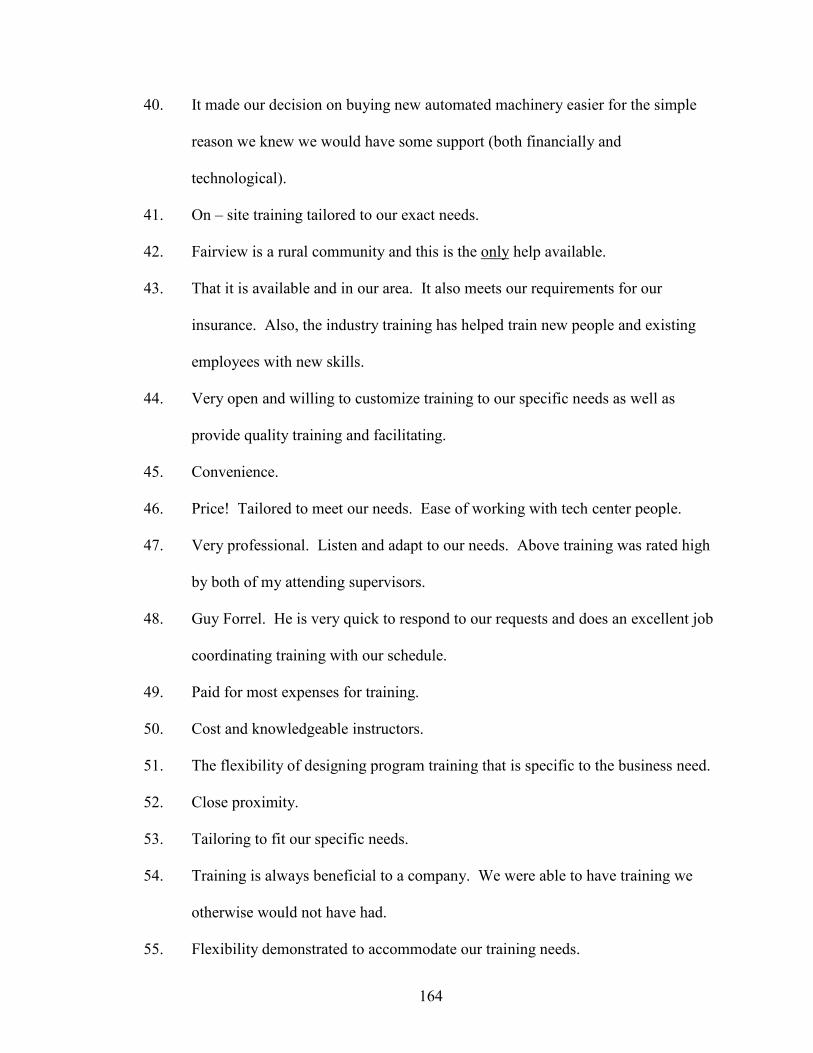
164
40. It made our decision on buying new automated machinery easier for the simple
reason we knew we would have some support (both financially and
technological).
41. On – site training tailored to our exact needs.
42. Fairview is a rural community and this is the only help available.
43. That it is available and in our area. It also meets our requirements for our
insurance. Also, the industry training has helped train new people and existing
employees with new skills.
44. Very open and willing to customize training to our specific needs as well as
provide quality training and facilitating.
45. Convenience.
46. Price! Tailored to meet our needs. Ease of working with tech center people.
47. Very professional. Listen and adapt to our needs. Above training was rated high
by both of my attending supervisors.
48. Guy Forrel. He is very quick to respond to our requests and does an excellent job
coordinating training with our schedule.
49. Paid for most expenses for training.
50. Cost and knowledgeable instructors.
51. The flexibility of designing program training that is specific to the business need.
52. Close proximity.
53. Tailoring to fit our specific needs.
54. Training is always beneficial to a company. We were able to have training we
otherwise would not have had.
55. Flexibility demonstrated to accommodate our training needs.
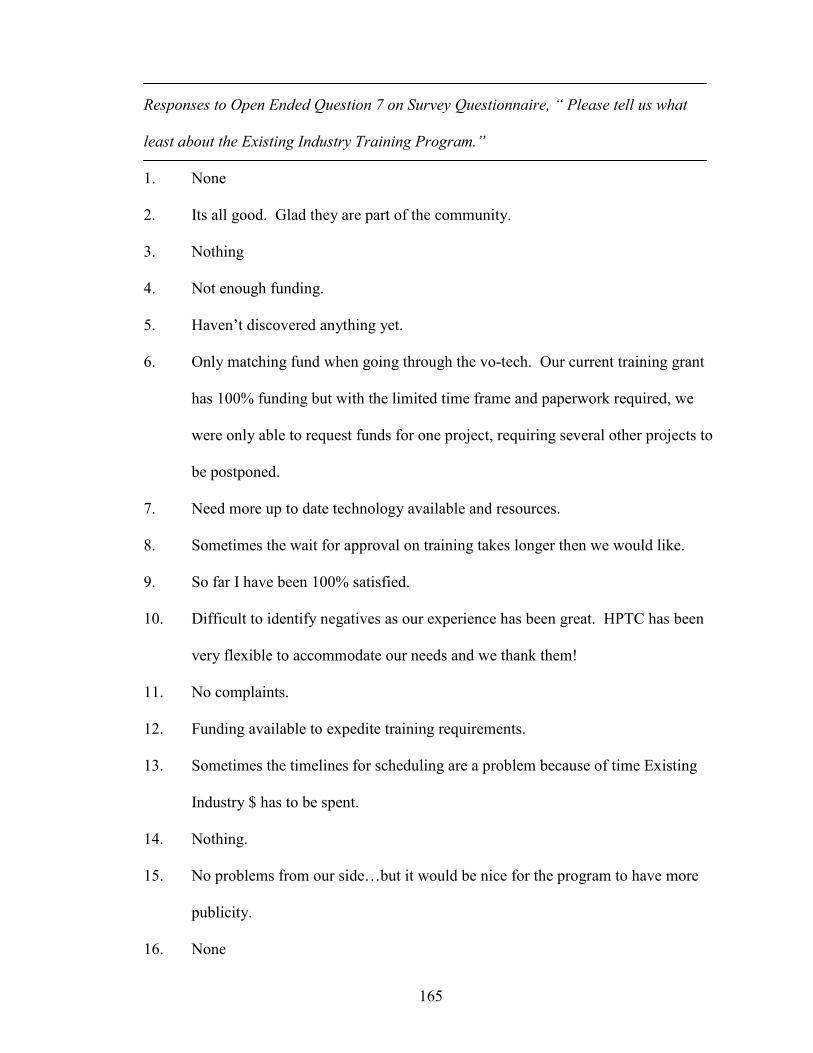
165
Responses to Open Ended Question 7 on Survey Questionnaire, “ Please tell us what
least about the Existing Industry Training Program.”
1. None
2. Its all good. Glad they are part of the community.
3. Nothing
4. Not enough funding.
5. Haven’t discovered anything yet.
6. Only matching fund when going through the vo-tech. Our current training grant
has 100% funding but with the limited time frame and paperwork required, we
were only able to request funds for one project, requiring several other projects to
be postponed.
7. Need more up to date technology available and resources.
8. Sometimes the wait for approval on training takes longer then we would like.
9. So far I have been 100% satisfied.
10. Difficult to identify negatives as our experience has been great. HPTC has been
very flexible to accommodate our needs and we thank them!
11. No complaints.
12. Funding available to expedite training requirements.
13. Sometimes the timelines for scheduling are a problem because of time Existing
Industry $ has to be spent.
14. Nothing.
15. No problems from our side…but it would be nice for the program to have more
publicity.
16. None
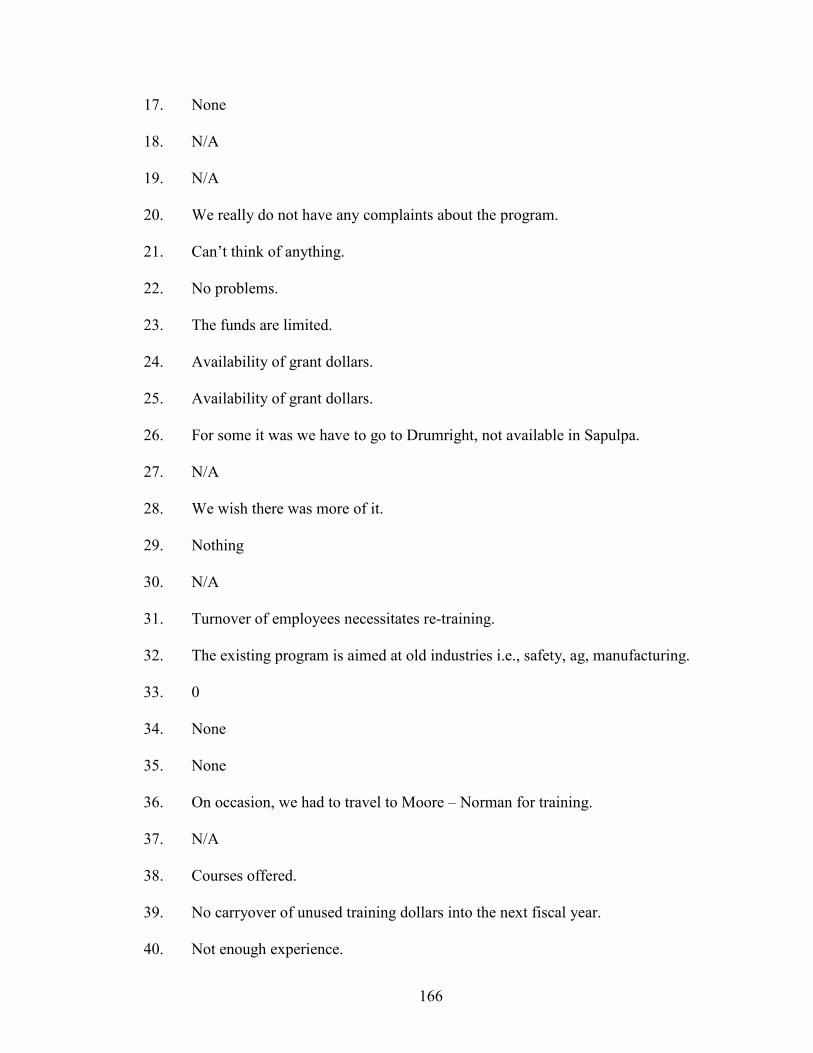
166
17. None
18. N/A
19. N/A
20. We really do not have any complaints about the program.
21. Can’t think of anything.
22. No problems.
23. The funds are limited.
24. Availability of grant dollars.
25. Availability of grant dollars.
26. For some it was we have to go to Drumright, not available in Sapulpa.
27. N/A
28. We wish there was more of it.
29. Nothing
30. N/A
31. Turnover of employees necessitates re-training.
32. The existing program is aimed at old industries i.e., safety, ag, manufacturing.
33. 0
34. None
35. None
36. On occasion, we had to travel to Moore – Norman for training.
37. N/A
38. Courses offered.
39. No carryover of unused training dollars into the next fiscal year.
40. Not enough experience.

167
Responses to Open Ended Question 8 on Survey Questionnaire, “Please tell us what your
business would like to see changed about the Existing Industry Training Program.”
1. N/A
2. Maybe more funds available.
3. Allow unused training $ to be carried forward for 1 fiscal year.
4. More course.
5. Please continue the great work!
6. Hold refresher courses for ISO QMS training.
7. None. Please keep us informed.
8. Nothing.
9. Were very pleased – don’t see any changes needed.
10. Training that embraces new technologies that converge systems and applications.
11. N/A
12. Nothing
13. More money set up for the program.
14. The computer aided training software should be edited for errors and
contradictions through review by several experts in the given field and their
critical evaluations used as contributions in course refinement.
15. Nothing on out part, but with the other area businesses would utilize this program.
16. Expand the Sapulpa program.
17. Secure more grant dollars.
18. Secure more grant dollars.
19. More information about availability.
20. None

168
21. More money and less restrictions.
22. I think sometimes we don’t know what we need. Maybe a simple analysis
process could be used to determine needs. I know we need to “own” it.
23. None
24. None
25. No specific changes.
26. More $$$$$$$
27. N/A
28. N/A
29. More $. Otherwise, we are grateful to participate anytime.
30. More team and soft skills available for all employees sectors.
31. Nothing. Perhaps add additional classes related to heavy industry.
32. Again – no ideas to offer here.
33. Nothing
34. Stream – line the steps it takes to get approved for training.
35. See 7.
36. We are not made aware of the availability of training funds until the very end of
the year and were lucky to get in a class before the deadline. The employee had
to leave the same day funding was approved. I think we were offered use of
unused, excess funds.
37. Good system as is.
38. None at this time, except possibly frequent media involvement for positive
feedback in the community and at the statewide level.
39. Nothing.
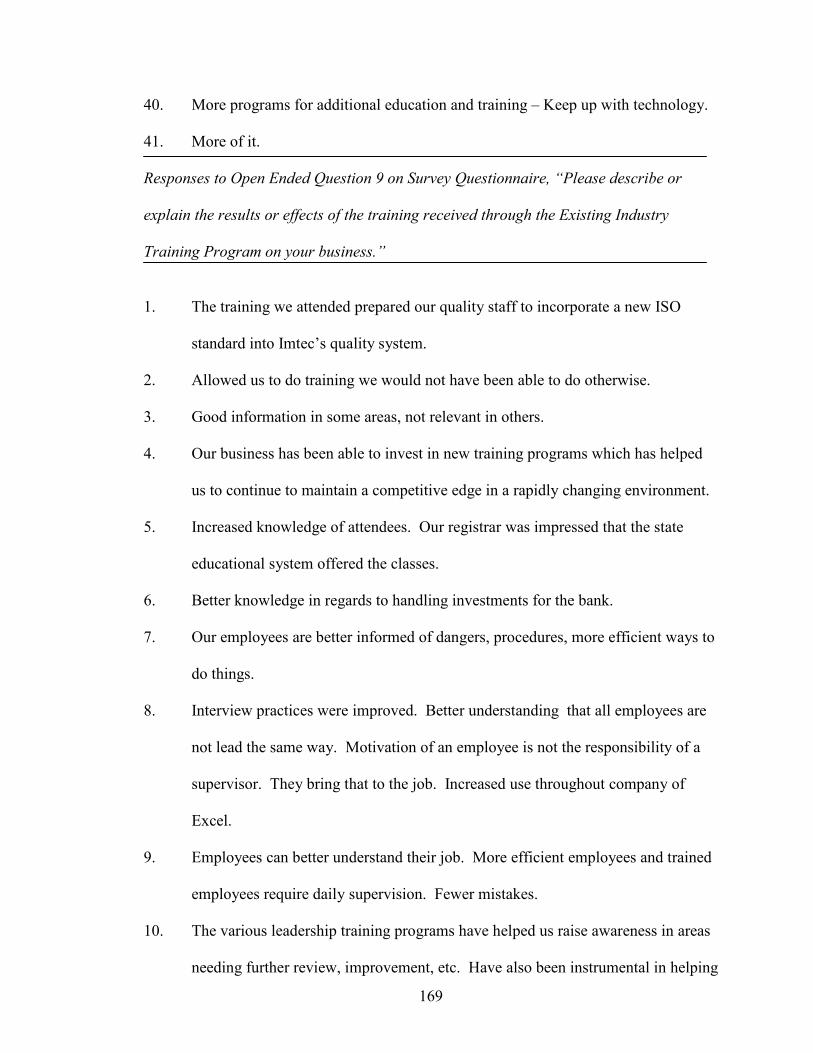
169
40. More programs for additional education and training – Keep up with technology.
41. More of it.
Responses to Open Ended Question 9 on Survey Questionnaire, “Please describe or
explain the results or effects of the training received through the Existing Industry
Training Program on your business.”
1. The training we attended prepared our quality staff to incorporate a new ISO
standard into Imtec’s quality system.
2. Allowed us to do training we would not have been able to do otherwise.
3. Good information in some areas, not relevant in others.
4. Our business has been able to invest in new training programs which has helped
us to continue to maintain a competitive edge in a rapidly changing environment.
5. Increased knowledge of attendees. Our registrar was impressed that the state
educational system offered the classes.
6. Better knowledge in regards to handling investments for the bank.
7. Our employees are better informed of dangers, procedures, more efficient ways to
do things.
8. Interview practices were improved. Better understanding that all employees are
not lead the same way. Motivation of an employee is not the responsibility of a
supervisor. They bring that to the job. Increased use throughout company of
Excel.
9. Employees can better understand their job. More efficient employees and trained
employees require daily supervision. Fewer mistakes.
10. The various leadership training programs have helped us raise awareness in areas
needing further review, improvement, etc. Have also been instrumental in helping
170
us develop plans / outlines for improving communication, customer service, and
trust building.
11. The tig welding was very beneficial to our company. We had several contracts
during 2000 and 2001 which required tig welding. The safety training is always
beneficial because it helps keep our workers comp insurance premiums at a lower
rate. It is important to our insurer to know that we take safety seriously.
12. The training in fixed wireless and routing enabled us to accomplish tasks that
were unavailable or required very expensive (Cisco) solutions that were
proprietary.
13. Our nurses particularly have been able to be exposed to additions and current
information in patient care. Our management staff was able to learn about
customer service and bring it back to the workplace and share with other
employees.
14. We were able work smarter, be more economical, and safer while doing our work.
15. Much better and safer painter.
16. The employees are much faster and more efficient in the job.
17. Safety training meets our needs for various topics such as PPE, Bloodborne
Pathogens, Hearing, etc. Opacity training was needed to meet requirements of a
DEQ are quality permit.
18. Thanks largely to Mr. Goggins, our maintenance staff now possesses a broader
and more thorough grasp of the physical principles on which our equipment
operates. This understanding has helped decrease time required for isolating
equipment malfunctions and formulating more effective and expedient corrective
strategies.
171
19. The safety training we have received through this program has saved us not only
in lost time accidents, workers compensation premium cost, legal fees, but we can
now use monies for safety incentives.
20. Improved skills for employees
21. Mapping was necessary for ISO 9001/2000 certification.
22. Documented our customer service program.
23. We are very fortunate to have had the training. My company has improved the
way we market ourselves. I believe we have seen more awareness and possibly
business because of the marketing training. We have reviewed and updated our
sales goals and what services we want to provide. We have clearly reviewed what
our strengths are and why we are different than other companies. We are then
able to communicate that information.
24. Lean manufacturing training result in a productivity increase of 20% with
expectations of internal improvement.
25. Offers well rounded programs to help us succeed. Improves general morale of
staff.
26. Provided well trained certified employees in a reasonable length of time. Gave us
the ability to complete warranty work with employees that were not previously
able because of requirements.
27. Better trained employees requiring less training on our part.
28. This program gives us the chance to train our employees on the latest technology.
This gives us a better trained workforce which results in a safer workforce.
29. We were able to fast track a new engineering software that significantly reduced
programming time and improved program accuracy. Also trained our workforce
172
in lean mfg. principals and techniques providing cost savings as well as reducing
flow times in several areas.
30. Gave employees some basic knowledge of procedures and also safety issues.
31. Employees were sponsored by the program to go to Chicago for special training
on a new press.
32. Motivational to employees. Good learning opportunity that is applicable to the
real world that we work in.
33. We have paramedics today for our service only because of this training. Tech
center worked it to fit our EMT’s schedule and our needs. Much extra energy and
effort done by tech centers to make this work!!
34. Better employees. Better trained employees.
35. Enhanced skills. Better PR. Better patient care and customer service.
36. Allows us to keep up with technological advances required for our employee
population.
37. Provided positive reinforcement to diverse workforce management. Class
participants attended 3 training sessions. Improved esprit de corps tremendously.
38. Participants in the “Lead” leadership classes have gained insight into management
practices. We have used this as pre-supervisor training instead of as supervisor
training and had good results. The process controller classes give a good
overview of a technical subject in a distraction free environment.
39. Supervisor improved knowledge of labor laws and increased interviewing skills.
40. Better prepare staff. More confident supervisor and management staff. Higher
morale. Better productivity. More efficient.
173
41. We are required to have each employee receive 4 days of training per year and
these programs help us to meet that requirement. It helps to upgrade the
competency and skill level of several of our employees. It also helps us to meet
our OSHA requirements.
42. Without it, as a small and new business, we would have had a very difficult time
getting started and equipping ourselves and our employees to compete in this
business.
43. Shift in management style with second generation of ownership.
44. Although Mr. DeCou is no longer with the company (moved away), the training
he received made him more productive at using our programming system. This
helped relieve the back log in our machine programming.
45. Training funds provide professional development opportunity for top managers.
This group is not easy to assemble – How funding enabled us to bring in speaker
w/ recognized credentials.
46. Increased productivity – Three employees received promotion and pay raise.
47. We have been able to maintain and implement a high-level of advanced training
and remain in compliance with strict federal guidelines and improved our
relationships with our major customers by improving on our quality systems with
this training.
48. Through this program we were able to train all of our licensed nurses in ACLS
training. Since these nurses have to handle anything that comes to our ER, they
are now much better trained to handle these emergencies.
174
49. The results from lean training for all employees was very favorable. The
employees were very favorable. The employees enjoyed the training and gained
first hand experience of the process.
50. Our inspection department and manufacturing lead people received better
understanding of quality’s impact on the whole organization and how to do their
jobs better. Learned real examples of how to use sampling and avoid over
inspection.
51. The training was a great success and help in our facility. It provided many of our
employees one on one access to our IMS representative that a regional meeting
could not provide. Money is extremely tight for small hospitals so we appreciate
the assistance.
52. Improved quality of PCBs. Improved production rate. Improved social
interaction.

175
APPENDIX E
IRB APPROVAL FORMS
176

177
VITA
Erick James Reynolds
Candidate for the Degree of
Doctor of Education
Thesis: OKLAHOMA DEPARTMENT OF CAREER AND TECHNOLOGY EDUCATION EXISITING INDUSTRY TRAINING PROGRAM: ECONOMIC IMPACT, RETURN ON INVESTMENT, AND CUSTOMER SATISFACTION
Major Field: Occupational and Adult Education Biographical:
Personal Data: Born Fredonia, Kansas, October 14, 1957, the son of Norman and Marilyn Reynolds.
Education: Graduated from Emporia Senior High School, Emporia, Kansas, in May 1975; received Bachelor of Science Degree in Trade and Industrial Education from Oklahoma State University at Stillwater in May, 1989; received Master of Science Degree in Occupational and Adult Education from Oklahoma State University at Stillwater in May, 1994; completed requirements for the Doctor of Education Degree at Oklahoma State University in July, 2005.
Professional Experience: Drafting Instructor, Meridian Technology Center, July
1991 to May, 1993; Drafting Instructor, Gordon Cooper Technology Center, July 1993 to May, 1994; Drafting Instructor, Francis Tuttle Technology Center, May 1994 to May, 1996; Industrial Coordinator, Eastern Oklahoma County Technology Center, August, 1999 to May, 2001; Director of Business and Industry Training, Eastern Oklahoma County Technology Center, May, 2001 to present.
Name: Erick James Reynolds Date of Degree: July, 2005
Institution: Oklahoma State University Location: Stillwater, Oklahoma
Title of Study: OKLAHOMA DEPARTMENT OF CAREER AND TECHNOLOGY EDUCATION EXISTING INDUSTRY TRAINING PROGRAM:
ECONOMIC IMPACT, RETURN ON INVESTMENT, AND CUSTOMER SATISFACTION
Pages in Study: 177 Candidate for the Degree of Doctor of Education
Major Field: Occupational and Adult Education
Scope and Method of Study: The purpose of this study was to describe the return on investment (ROI), the economic impact, and the customer satisfaction with training completed under the Existing Industry Training program by CareerTech technology centers for Oklahoma businesses and individual Oklahomans. Participants in the study included 59 Oklahoma businesses who participated in an Existing Industry Training program. Each participant completed a questionnaire that provided data about the economic impact, return on investment (ROI), and customer satisfaction as a result of having participated in an Existing Industry Training program. Descriptive statistics , cross-tabs, and chi-square were used to analyze the data. Stakeholder input from a focus group was analyzed qualitatively. Findings and Conclusions: The participants indicated by their responses that the Existing Industry Training program had a positive economic impact on those local businesses that took part in the training program. The research revealed that the Existing Industry Training program had a positive return on investment for those Oklahoma businesses represented in the sample. For each dollar spent by the ODCTE on the Existing Industry Training program, Oklahoma businesses realized a return on this investment of nearly 400%. The Existing Industry Training program is seen as being a positive program that provides needed training at a very high level of satisfaction to Oklahoma businesses. The overall mean of the five satisfaction questions equaled 4.72 on a 5-point Likert scale. The limited size of the sample (n=59) versus the size of the population for the study (N=552) indicates to the researcher that there exists barriers and more generally a lack of understanding of the positive impact that ROI data can have on Oklahoma businesses. There appears to be a low level of understanding by technology center BIS staff members as to the positive impact that ROI data can have on Oklahoma businesses and the Oklahoma Department of Career and Technology Education. Adviser’s Approval: _____________Dr. Lynna Ausburn__________________