oklahoma health & health systems peter budetti, md, jd bartlett foundation professor of public...
TRANSCRIPT
OKLAHOMAHEALTH & HEALTH SYSTEMS
Peter Budetti, MD, JDBartlett Foundation Professor of Public Health
College of Public Health, University of OklahomaJune 15, 2007
Grateful acknowledgment to my colleagueMichael Lapolla, Director, Center for Health Policy Research
College of Public Health, University of Oklahoma
OKLAHOMAHEALTH & HEALTH SYSTEMS

It took a while but …we eventually received the message

OKLAHOMAOUR HEALTH CARE “DUST BOWL” PROBLEMS ARE NOT NEW
10 YEARS OF WARNINGSOklahoma State Board of Health
Annual “State of the State’s Health”1997-2006
INTERNATIONAL HURRICANE WARNING
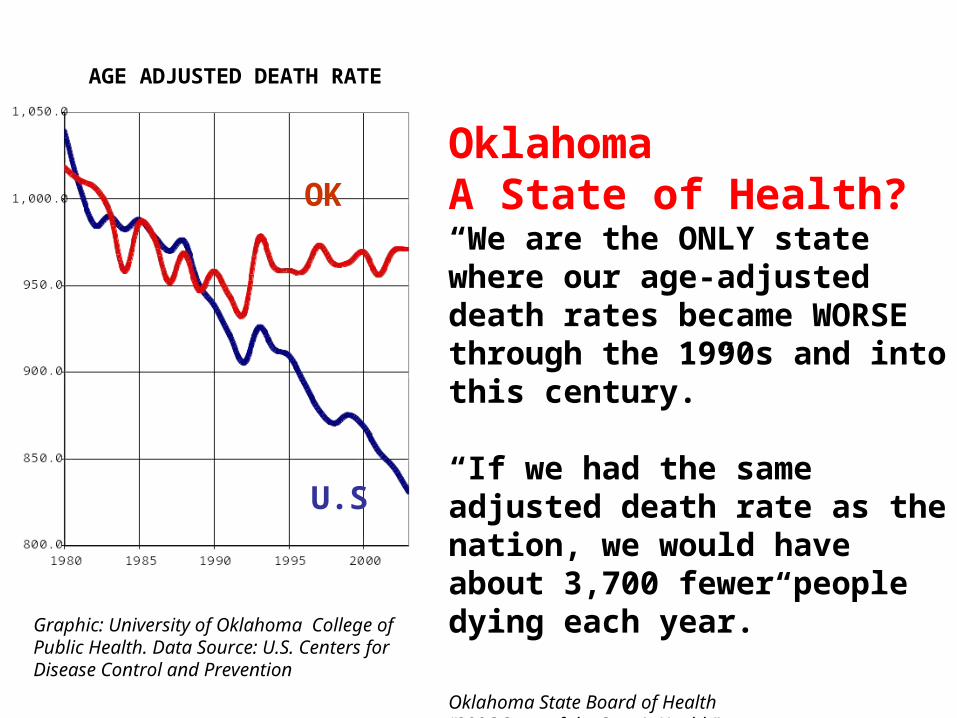
OklahomaA State of Health?“We are the ONLY state where our age-adjusted death rates became WORSE through the 1990s and into this century.”
“If we had the same adjusted death rate as the nation, we would have about 3,700 fewer people dying each year.”
Oklahoma State Board of Health“2006 State of the State’s Health”
Graphic: University of Oklahoma College of Public Health. Data Source: U.S. Centers for Disease Control and Prevention
AGE ADJUSTED DEATH RATE
U.S
OK

4444
40
4546
44
4140
4141
383939
3231
3030
0
5
10
15
20
25
30
35
40
45
50
1990 1991 1992 1993 1994 1995 1996 1997 1998 1999 2000 2001 2002 2003 2004 2005 2006
OKLAHOMAUnited Health Foundation
America’s Health Rankings – 2006

AHRQ’s STATE SNAPSHOTSOKLAHOMA

National Average
1,029
1,011
1979AGE ADJUSTED DEATH RATES
THE TEN STATES WITH THE HIGHEST RATES Source: Centers for Disease Control. Graphic: OU College of Public Health
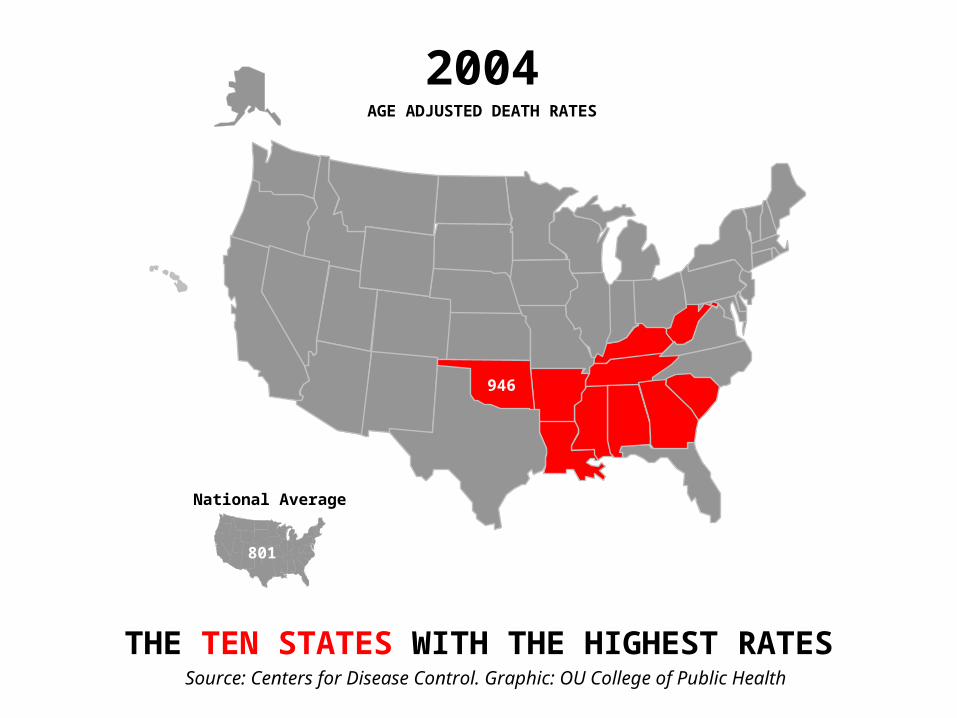
National Average
946
801
2004AGE ADJUSTED DEATH RATES
THE TEN STATES WITH THE HIGHEST RATES Source: Centers for Disease Control. Graphic: OU College of Public Health
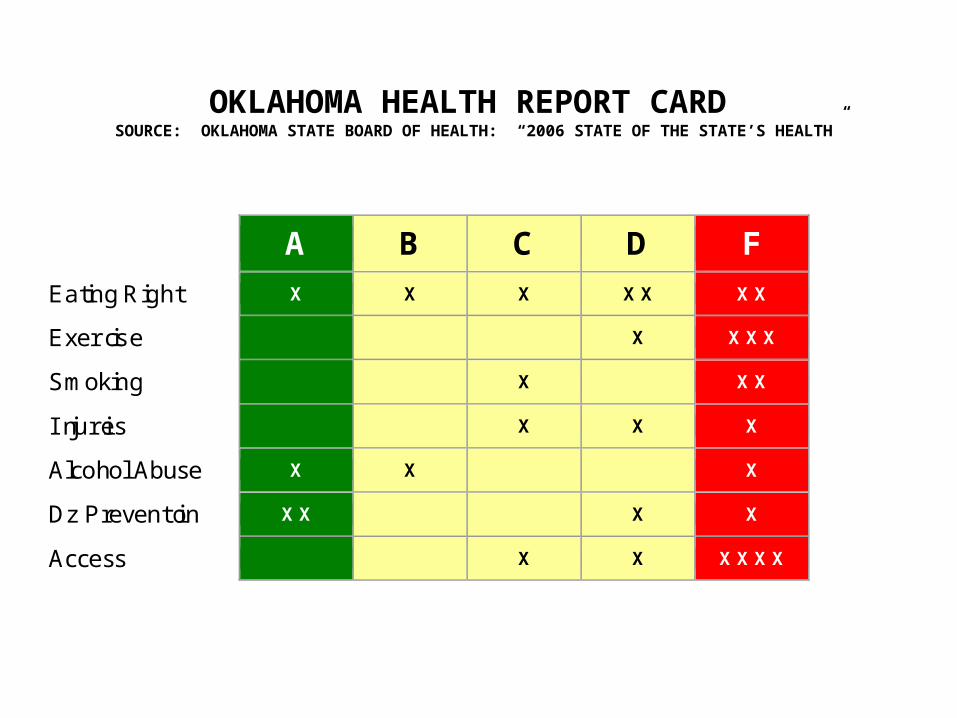
OKLAHOMA HEALTH REPORT CARD SOURCE: OKLAHOMA STATE BOARD OF HEALTH: “2006 STATE OF THE STATE’S HEALTH”
A B C D F
Eating Right X X X X X X X
Exercise X X X X
Smoking X X X
Injuries X X X
Alcohol Abuse X X X
Dz Prevention X X X X
Access X X X X X X
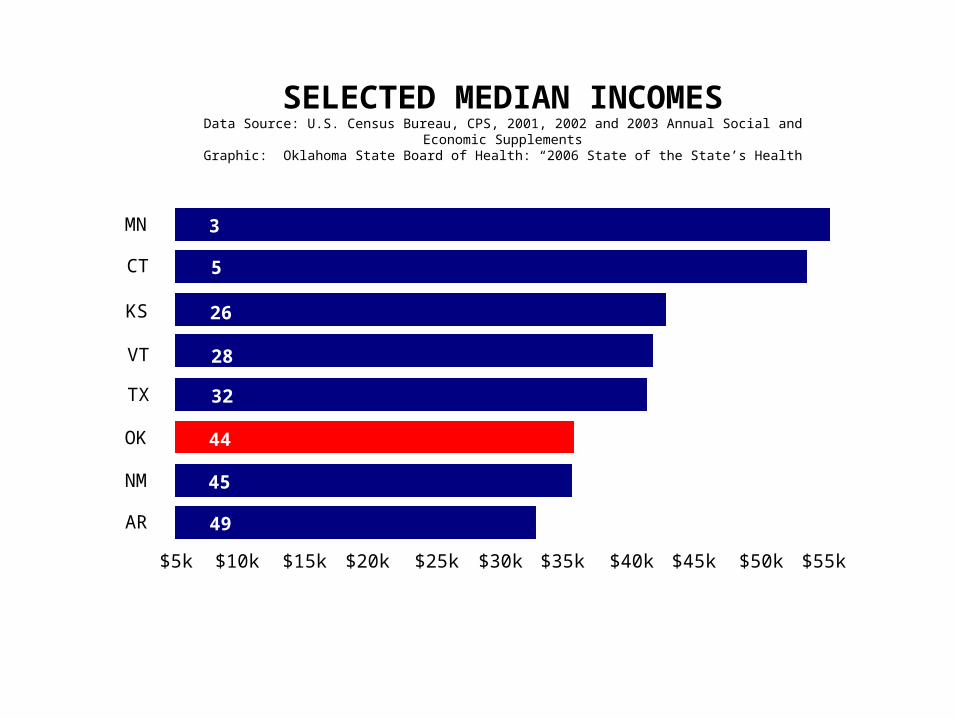
$5k $10k $15k $20k $25k $30k $35k $40k $45k $50k $55k
MN
CT
KS
VT
TX
OK
NM
AR
SELECTED MEDIAN INCOMESData Source: U.S. Census Bureau, CPS, 2001, 2002 and 2003 Annual Social and Economic Supplements
Graphic: Oklahoma State Board of Health: “2006 State of the State’s Health
3
5
26
28
32
44
45
49
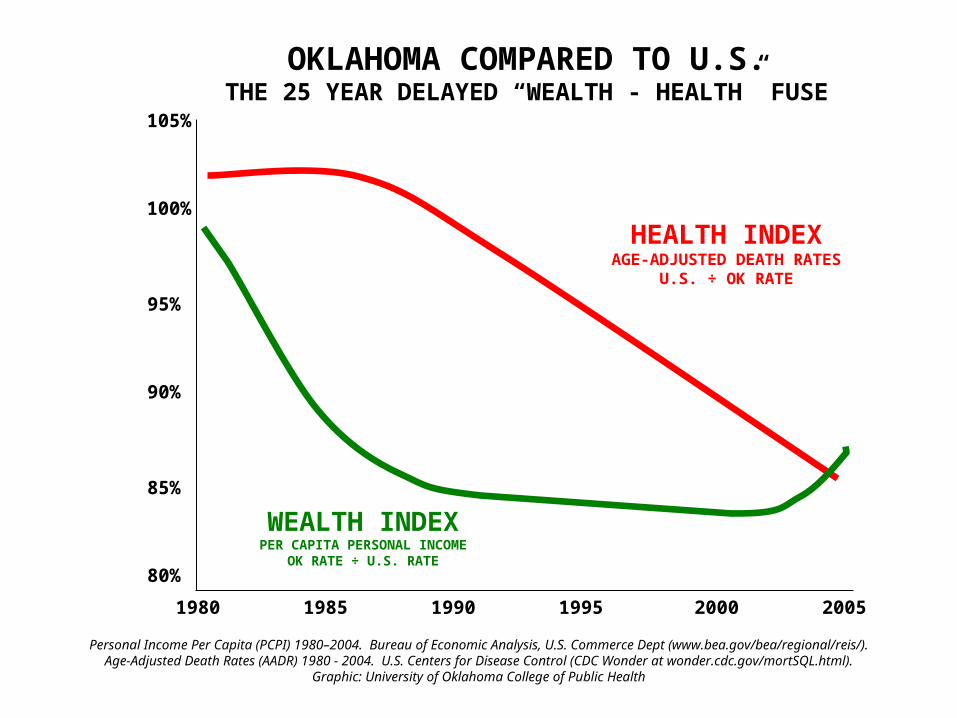
HEALTH INDEXAGE-ADJUSTED DEATH RATES
U.S. ÷ OK RATE
WEALTH INDEXPER CAPITA PERSONAL INCOME
OK RATE ÷ U.S. RATE
1980
OKLAHOMA COMPARED TO U.S.THE 25 YEAR DELAYED “WEALTH - HEALTH” FUSE
1985 1990 1995 2000 2005
105%
80%
100%
95%
90%
85%
Personal Income Per Capita (PCPI) 1980–2004. Bureau of Economic Analysis, U.S. Commerce Dept (www.bea.gov/bea/regional/reis/).Age-Adjusted Death Rates (AADR) 1980 - 2004. U.S. Centers for Disease Control (CDC Wonder at wonder.cdc.gov/mortSQL.html).
Graphic: University of Oklahoma College of Public Health
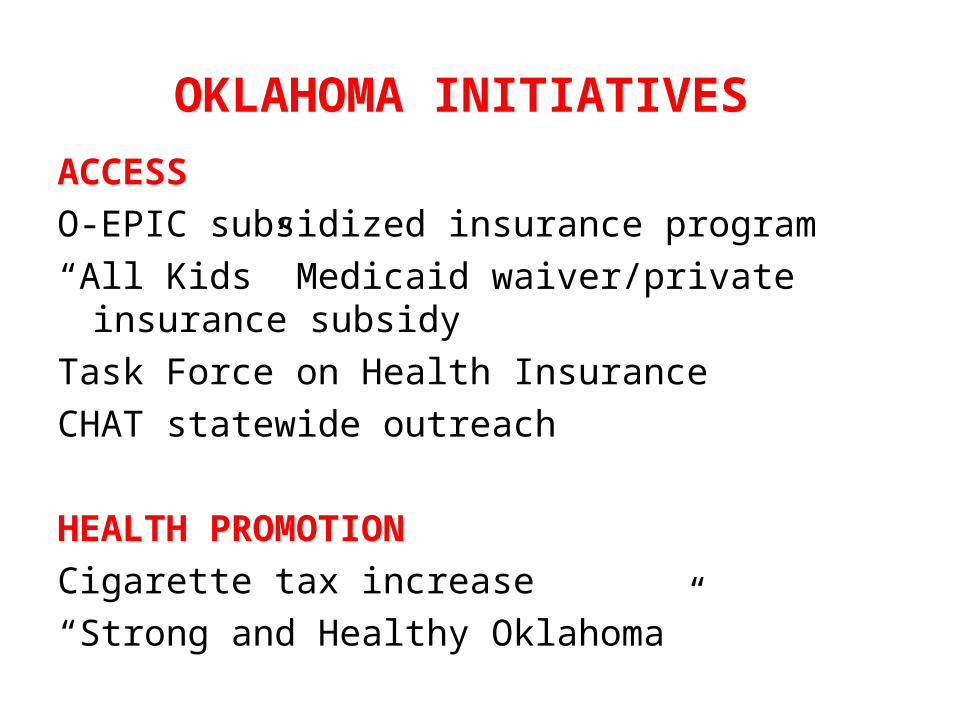
OKLAHOMA INITIATIVES ACCESS
O-EPIC subsidized insurance program
“All Kids” Medicaid waiver/private insurance subsidy
Task Force on Health Insurance
CHAT statewide outreach
HEALTH PROMOTION
Cigarette tax increase
“Strong and Healthy Oklahoma”
Oklahoma Employer/EmployeePartnership for Insurance Coverage
-
500
1,000
1,500
2,000
2,500
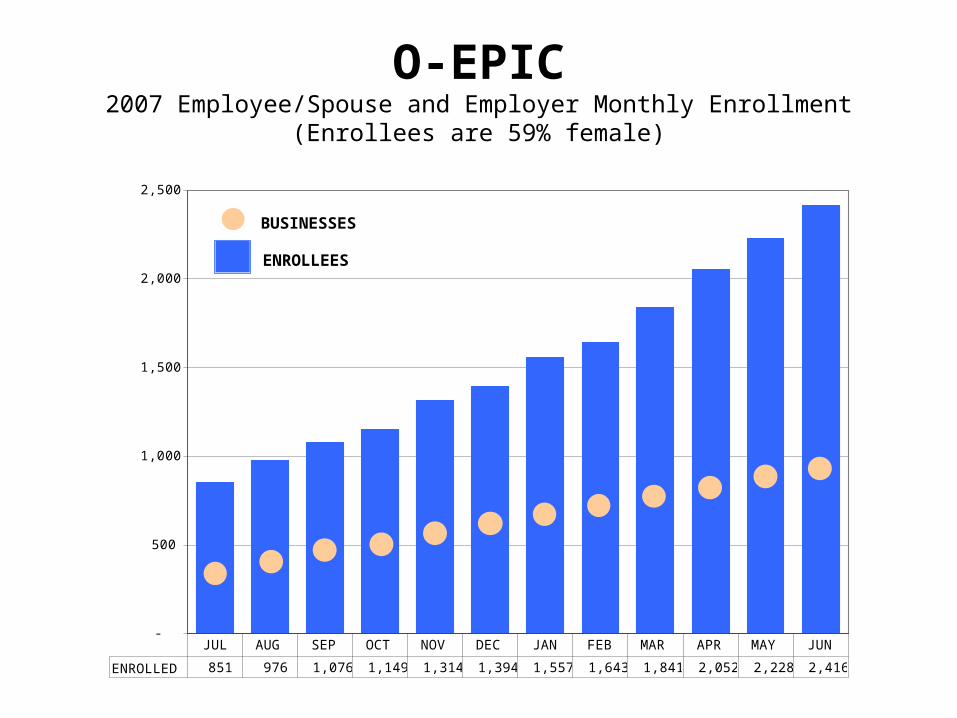
ENROLLED 851 976 1,076 1,149 1,314 1,394 1,557 1,643 1,841 2,052 2,228 2,416
JUL AUG SEP OCT NOV DEC JAN FEB MAR APR MAY JUN
BUSINESSES
ENROLLEES
O-EPIC2007 Employee/Spouse and Employer Monthly Enrollment
(Enrollees are 59% female)
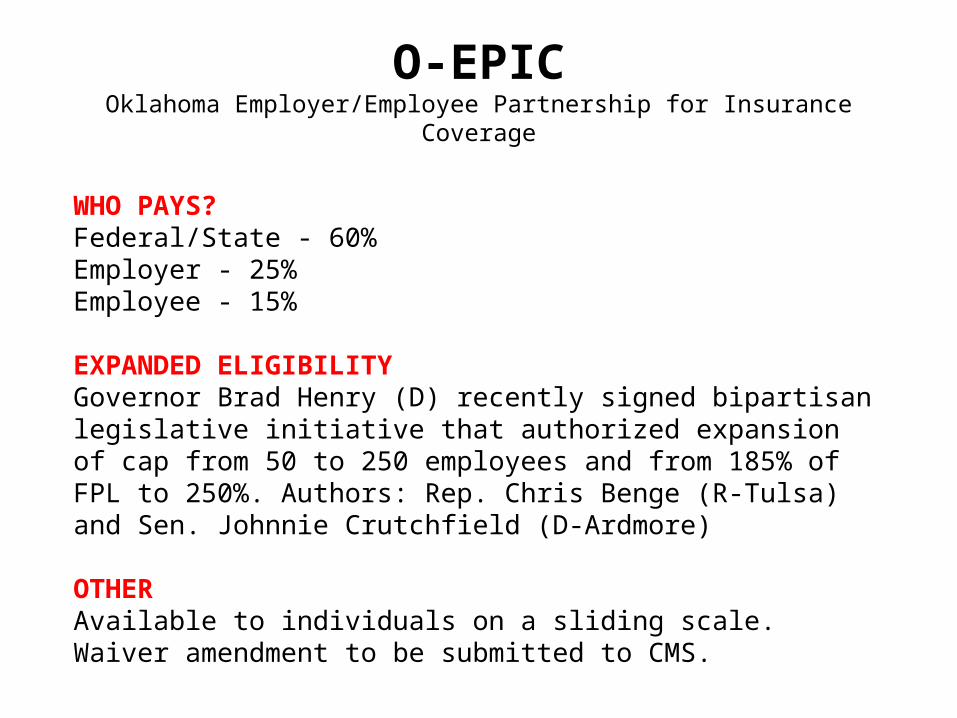
WHO PAYS?Federal/State - 60%Employer - 25%Employee - 15%
EXPANDED ELIGIBILITYGovernor Brad Henry (D) recently signed bipartisan legislative initiative that authorized expansion of cap from 50 to 250 employees and from 185% of FPL to 250%. Authors: Rep. Chris Benge (R-Tulsa) and Sen. Johnnie Crutchfield (D-Ardmore)
OTHERAvailable to individuals on a sliding scale.Waiver amendment to be submitted to CMS.
O-EPICOklahoma Employer/Employee Partnership for Insurance Coverage

“ALL-KIDS” INSURANCE EXPANSION
• Increased eligibility level for children from Medicaid level of 185% FPL to 300%.SoonerCare (Medicaid) already added some 100,000 children
between 2003 and 2007
• Creates eligibility for an estimated 40,000+ children to buy private insurance. Parents pay 26% of premium and state/federal governments pay the balance.
• State funds provided by the OK Tobacco Tax.
• A bipartisan initiative recently signed by Governor. Authors were State Senator Tom Adelson (D-Tulsa) and State Representative Doug Cox, MD (R-Grove).
KIM HOLLANDOKLAHOMA INSURANCE COMMISSIONER
INITIATIVES FOR OKLAHOMA
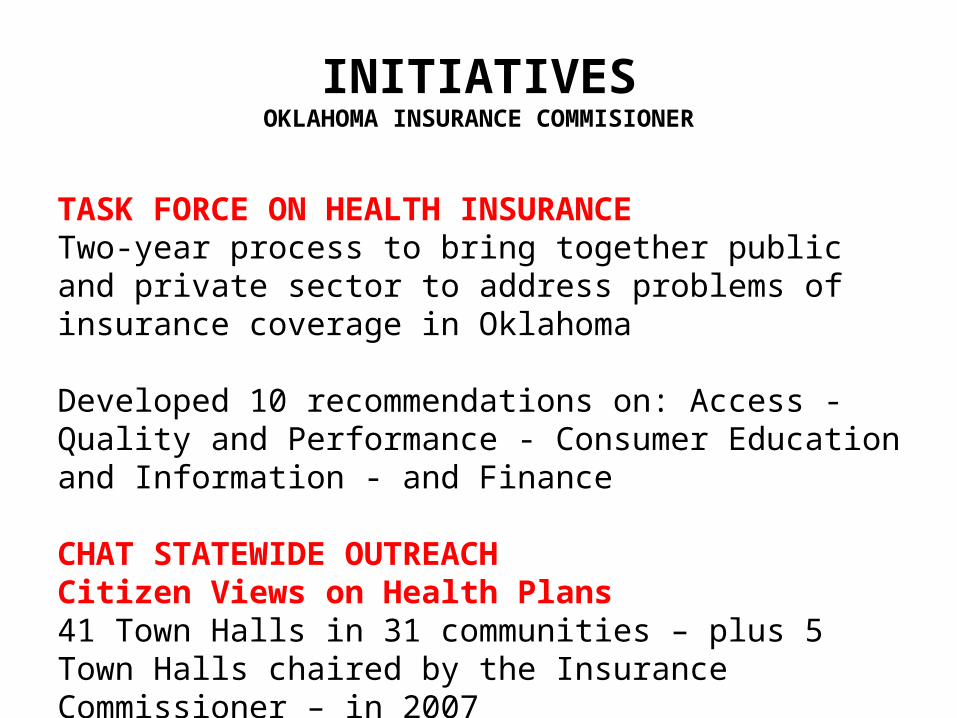
INITIATIVESOKLAHOMA INSURANCE COMMISIONER
TASK FORCE ON HEALTH INSURANCETwo-year process to bring together public and private sector to address problems of insurance coverage in Oklahoma
Developed 10 recommendations on: Access - Quality and Performance - Consumer Education and Information - and Finance
CHAT STATEWIDE OUTREACHCitizen Views on Health Plans41 Town Halls in 31 communities – plus 5 Town Halls chaired by the Insurance Commissioner – in 2007
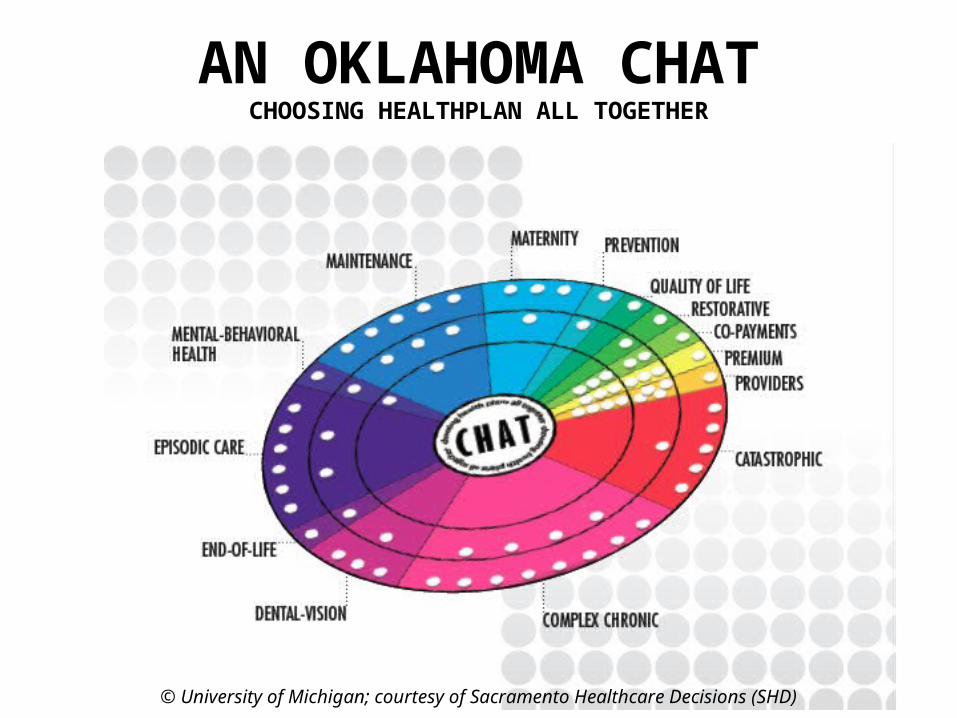
AN OKLAHOMA CHATCHOOSING HEALTHPLAN ALL TOGETHER
© University of Michigan; courtesy of Sacramento Healthcare Decisions (SHD)
OKLAHOMATOBACCO TAX INCREASE
In 2004, voters approved Governor Brad Henry’s proposal to increase tobacco excise taxes to $1.03/pack – an increase of $.80 (net increase was $.55/pack because sales taxes were eliminated)Separate legislation restricted smoking in restaurants

DATA FROM KFF.ORG FOR 2004-2005 except as noted MASSACHUSETTS OKLAHOMA
Population 6,344,540 3,442,720
Low Income 1,866,820 1,388,520
Household Income $54,617 $38,895
Gross State Product
$328,535 million $120,549 million
Tax Collections $2,815 per capita $1,933 per capita
2004 Medicaid Expenditures
State $2.9 billion
Total $5.8 billion
State $596 million
Total $2.6 billion
2007 DSH $287 million $29 million
Uninsured number 681,500 659,370
Uninsured percent 11% 19%
THE BAD NEWS? We have a long way to go. THE GOOD NEWS? We’ve already started and know we have a long way to go.