oklahoma monthly climate summary august 2021
TRANSCRIPT

Copyright © 2021 Board of Regents of the University of Oklahoma. Oklahoma Monthly Climate Summary 1
AUGUST 2021Oklahoma Monthly Climate Summary
August 2021 Statewide Extremes
Description Extreme Station Day
High Temperature 106°F Several 24, 25
Low Temperature 52°F Kenton 5
High Precipitation 7.63 in. Hugo --
Low Precipitation 0.24 in. Freedom --
August 2021 Statewide StatisticsTemperature
Average Depart. Rank (1895-2021)
Month (Aug) 80.8°F 0°F 62nd Warmest
Season-to-Date (Jun-Aug) 79.4°F -0.7°F 48th Coolest
Year-to-Date (Jan-Aug) 61.1°F -1.6°F 34th Coolest
Precipitation
Total Depart. Rank (1895-2021)
Month (Aug) 2.44 in. -0.79 in. 51st Driest
Season-to-Date (Jun-Aug) 10.60 in. -0.09 in. 44th Wettest
Year-to-Date (Jan-Aug) 25.67 in. 0.42 in. 42nd Wettest
Depart. = departure from 30-year normal
A run of hot, dry weather finished off climatological summer in true Oklahoma fashion following a delightfully mild first two months of the season. There was very little in the way of severe weather during the month, just a smattering of hail and high wind reports scattered about the state. A hazard of another kind managed to flourish in the arid conditions, however, with drought once again gaining a toehold across parts of northwestern Oklahoma. The USDA indicated 43% of the state’s topsoil was considered short to very short of moisture by the end of the month. Reports of withered crops and depleted ponds began to multiply in areas plagued by the extended dry weather. Some areas had gone nearly 2 months without a single day with at least a quarter-inch of rainfall.
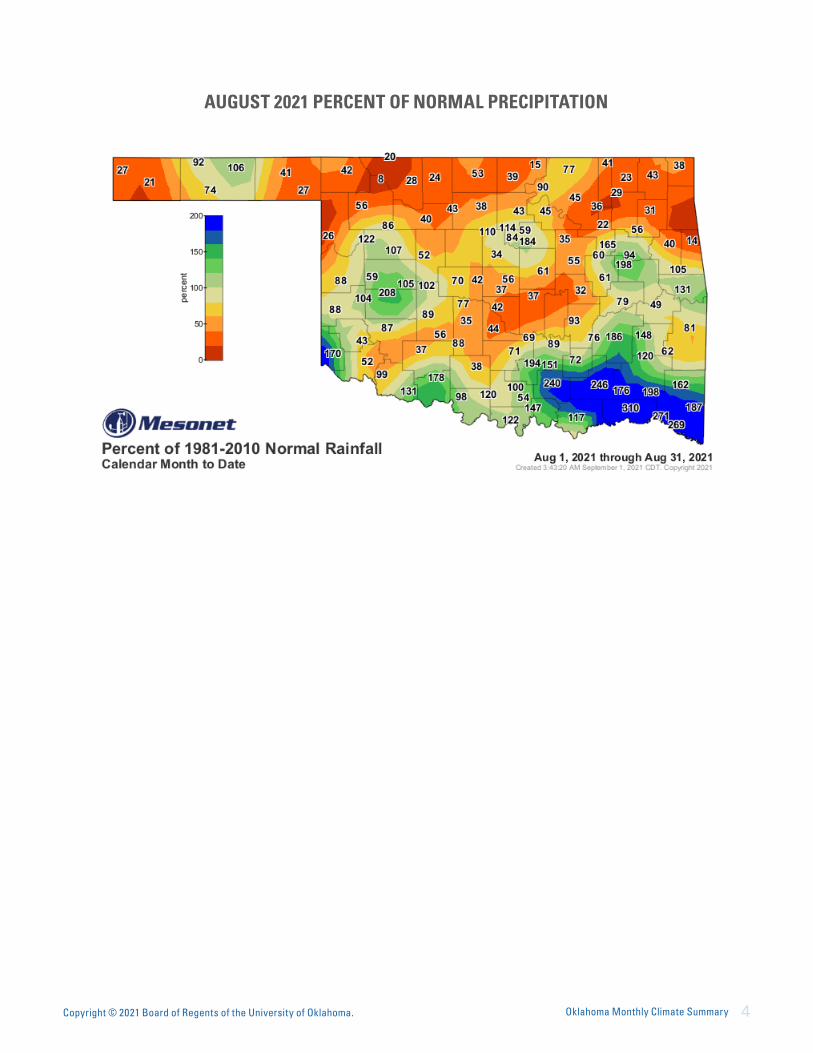
According to preliminary data from the Oklahoma Mesonet, the statewide average precipitation total for the month
finished at 2.44 inches, 0.79 inches below normal and ranked as the 51st driest August since records began in 1895. Deficits of 1-3 inches were common across the northern one-third of the state, while surplus amounts of 2-5 inches were found along Oklahoma’s southern border. Most sites fell below normal by 1-2 inches, in general. The Mesonet site at Hugo led the state with 7.63 inches during August, a surplus of 5.2 inches. Freedom brought up the rear with 0.24 inches, 2.7 inches below normal. The climatological summer—June 1 through Aug. 31—was 0.09 inches below normal statewide with an average of 10.6 inches, the 44th wettest such period on record. Significant dryness was evident across northern Oklahoma during summer with deficits of 3-6 inches common from the western Panhandle through north central regions. The Mesonet site at Cloudy in far southeastern Oklahoma led the summer months with 21.8 inches of rain for a surplus of 10.5 inches. Buffalo’s summer total of 3 inches was 6.1 inches below normal. The first 8 months of the year saw an
average surplus of only 0.42 inches across the state at 25.67 inches, the 42nd wettest January-August on record.
The statewide average temperature came in at 80.8 degrees, exactly normal for the month and ranked as the 62nd warmest August since records began in 1895. Some areas of the state were significantly warmer than others. The Panhandle was 1.2 degrees above normal for the month, the 41st warmest August on record for that area of the state, while south central Oklahoma enjoyed their 43rd coolest at 1.1 degrees below normal. The month’s highest reading of 106 degrees occurred at Beaver and Hooker on the 24th and again at Alva on the 25th. Heat index values reached as high as 113 degrees at Okmulgee and Porter, and the Mesonet’s 120 sites recorded values of at least 110 degrees 86 times throughout the month. The lowest actual air temperature reading was 52 degrees from Kenton on Aug. 5. The summer
finished at 79.4 degrees, 0.7 degrees below normal and ranked as the 48th coolest June-August period on record. The highest temperature of the summer was 107 degrees, reported at both Eva and Goodwell on June 23, and the lowest was Boise City’s 47 degrees back on June 2. The year remained solidly on the cool side at 61.1 degrees, 1.6 degrees below normal and the 34th coolest January-August on record.

Copyright © 2021 Board of Regents of the University of Oklahoma. Oklahoma Monthly Climate Summary 2
Drought increased from just over 1% of the state at the end of July to nearly 5% to end August. The latest outlooks from the Climate Prediction Center show equal chances for above-, below-, and near-normal precipitation and temperature values across the entire state for September. Despite the lack of a clear signal, the threat of more hot, dry weather in early September brought concerns for more drought development. CPC’s September Drought Outlook deems drought development “likely” through much of the Panhandle into southwest Oklahoma, and northwestern down through east central Oklahoma. A larger area of existing drought in the northwest is expected to persist through the month.

Copyright © 2021 Board of Regents of the University of Oklahoma. Oklahoma Monthly Climate Summary 3
AUGUST 2021 OBSERVED PRECIPITATION
AUGUST 2021 DEPARTURE FROM NORMAL PRECIPITATION
Copyright © 2021 Board of Regents of the University of Oklahoma. Oklahoma Monthly Climate Summary 4
AUGUST 2021 PERCENT OF NORMAL PRECIPITATION

Copyright © 2021 Board of Regents of the University of Oklahoma. Oklahoma Monthly Climate Summary 5
AUGUST 2021 AVERAGE TEMPERATURE
AUGUST 2021 DEPARTURE FROM NORMAL TEMPERATURE

Copyright © 2021 Board of Regents of the University of Oklahoma. Oklahoma Monthly Climate Summary 6
MESONET MONTHLY SUMMARY FOR AUGUST 2021
MEAN HIGH LOW TOT HIGH MEAN HIGH LOW TOT HIGHNAME TEMP TEMP DAY TEMP DAY HDD CDD PPT 24-HR DAY NAME TEMP TEMP DAY TEMP DAY HDD CDD PPT 24-HR DAY
PANHANDLE Arnett 79.6 102 24 55 3 0 452 .70 .20 13 Goodwell 79.0 105 24 56 17 0 435 1.75 .78 7Beaver 81.0 106 24 57 2 0 495 1.09 .33 13 Hooker 79.2 106 24 56 17 0 441 2.27 1.48 7Boise City 76.4 102 9 55 5 1 353 .68 .38 15 Kenton 77.1 102 9 52 5 0 376 .82 .51 27Buffalo 82.6 105 24 58 3 0 547 1.19 .56 1 Slapout 80.0 105 24 59 3 0 464 .73 .34 29Eva 77.2 104 24 55 5 0 378 2.56 1.99 1
NORTH CENTRAL Alva 82.5 106 25 57 3 0 541 .91 .56 7 May Ranch 82.0 105 25 57 3 0 528 .65 .47 29Blackwell 80.6 99 25 61 3 0 482 1.35 .54 16 Medford 81.8 102 25 59 3 0 519 1.86 .88 1Breckinridge 81.5 101 25 59 4 0 510 1.29 .92 1 Newkirk 80.6 99 25 60 2 0 484 .48 .29 21Cherokee 83.2 105 25 58 2 0 564 .83 .29 1 Red Rock 81.1 100 25 59 4 0 500 1.35 .51 1Fairview 82.1 102 25 57 3 0 530 1.15 .77 8 Seiling 80.8 99 12 55 3 0 491 2.41 1.19 17Freedom 81.7 105 25 58 2 0 519 .24 .07 1 Woodward 80.8 102 25 57 3 0 490 1.56 .53 7Lahoma 81.1 101 25 59 3 0 501 1.43 .49 1
NORTHEAST Bixby 81.2 98 12 60 4 0 503 4.26 3.82 13 Pawnee 81.4 99 25 61 4 0 508 1.66 .47 1Burbank 79.9 99 12 58 4 0 462 3.12 1.40 16 Porter 81.2 98 12 62 4 0 502 2.70 2.09 21Copan 80.7 99 25 61 3 0 487 1.25 .66 13 Pryor 80.5 97 12 62 4 0 482 1.00 .49 13Foraker 79.2 96 25 59 4 0 441 2.60 1.03 21 Skiatook 81.1 97 25 64 4 0 498 1.26 1.00 13Inola 80.7 97 12 62 4 0 485 1.86 .90 13 Talala 80.7 98 23 60 4 0 486 .87 .51 13Jay 80.0 98 26 61 4 0 465 ***** ***** *** Tulsa 83.0 99 25 63 4 0 558 .66 .24 21Miami 79.8 96 25 59 4 0 459 1.27 .42 19 Vinita 79.3 96 25 61 4 0 444 1.30 .71 17Nowata 80.0 98 25 56 4 0 466 .68 .30 13 Wynona 81.0 98 25 60 4 0 495 1.73 1.02 21
WEST CENTRAL Bessie 80.5 98 9 60 3 0 480 7.08 2.66 13 Erick 80.4 101 9 57 3 0 477 2.66 1.31 1Butler 80.5 100 25 57 3 0 482 1.76 .92 1 Putnam 79.7 97 12 58 3 0 456 2.96 1.42 21Camargo 79.5 99 12 53 3 0 451 3.05 1.33 21 Watonga 81.3 99 9 60 2 0 505 1.81 1.04 21Cheyenne 79.8 99 24 61 3 0 460 2.67 1.04 13 Weatherford 81.0 100 9 60 3 0 495 3.69 1.09 21Elk City 80.3 98 9 62 3 0 473 3.35 1.55 1
CENTRAL Acme 80.6 96 25 58 3 0 485 2.68 1.35 19 Norman 81.5 98 25 63 3 0 512 1.46 .43 17Bristow 79.9 97 25 56 4 0 461 1.65 1.03 21 Oilton 80.3 98 25 57 4 0 473 1.08 .66 8Lake Carl Blac 80.4 97 12 57 4 0 478 3.53 2.59 21 OKC East 81.7 99 25 61 4 0 518 1.20 .42 8Chandler 80.6 97 25 61 4 0 484 1.81 .83 21 Okemah 81.6 99 25 61 4 0 516 .99 .49 8Chickasha 81.4 99 25 59 3 0 508 1.03 .44 13 Perkins 81.0 98 25 60 4 **** **** 5.10 2.18 13El Reno 79.5 97 25 57 4 0 451 2.45 1.17 1 Seminole 80.7 96 25 62 4 0 486 1.77 1.29 19Guthrie 82.0 100 25 62 4 0 526 1.09 .61 8 Shawnee 81.9 100 25 61 4 0 525 1.11 .58 8Kingfisher 81.7 102 25 60 3 **** **** 1.88 1.01 1 Spencer 81.4 99 25 61 3 0 508 1.75 .96 1Marena 80.1 96 25 61 4 0 467 2.49 1.15 21 Stillwater 81.4 99 25 60 4 0 508 1.75 .68 21Minco 79.9 95 25 63 3 0 463 2.33 .72 17 Washington 81.1 99 25 62 3 0 500 1.43 .47 5Marshall 81.4 99 25 61 3 0 508 3.59 1.59 1 Yukon 80.7 98 31 61 3 0 486 1.47 .60 13
EAST CENTRAL Cookson 80.6 99 12 62 4 0 482 3.62 1.67 17 Sallisaw 81.5 98 12 65 6 0 513 3.95 1.15 13Eufaula 82.2 99 12 64 4 0 534 2.35 1.15 21 Stigler 81.9 101 25 64 4 0 523 1.49 .56 5Haskell 80.9 98 12 63 4 0 492 5.70 3.37 21 Stuart 80.9 97 25 65 3 0 494 2.06 1.52 5Hectorville 82.0 98 20 62 4 0 526 1.64 1.40 21 Tahlequah 80.4 98 12 62 6 0 477 1.51 .58 13Holdenville 80.9 97 26 64 4 0 492 2.96 1.58 5 Webbers Falls 82.1 101 12 65 6 0 531 3.74 1.85 13McAlester 80.9 97 13 65 4 0 492 4.96 2.55 5 Westville 79.9 97 12 63 4 0 460 .56 .42 17Okmulgee 81.0 98 25 60 4 0 497 1.88 .73 21
SOUTHWEST Altus 82.1 100 9 60 3 0 531 1.44 1.17 19 Hollis 81.8 104 9 59 3 0 522 4.60 2.43 13Apache 79.5 95 9 60 3 0 449 1.47 .72 13 Mangum 80.9 101 9 56 4 0 493 1.24 .65 1Fort Cobb 79.9 97 9 59 3 0 462 2.62 1.62 13 Medicine Park 81.7 98 9 65 3 0 516 1.06 .32 18Grandfield 83.1 102 13 61 3 0 561 3.47 2.13 19 Tipton 82.6 101 9 60 3 0 545 2.81 1.37 19Hinton 79.4 96 31 60 3 0 447 3.46 1.10 8 Walters 81.2 99 9 64 3 0 503 4.51 2.69 13Hobart 82.0 102 9 58 3 0 527 2.45 1.83 16
SOUTH CENTRAL Ada 80.9 97 31 62 4 0 494 2.70 1.45 5 Lane 81.0 98 12 67 3 0 497 6.30 2.96 15Ardmore 81.6 97 31 65 3 0 514 1.25 .45 17 Madill 81.8 97 12 64 3 0 522 3.42 1.75 17Burneyville 81.6 99 12 61 3 0 514 2.76 1.66 14 Newport 81.5 98 12 65 3 0 511 2.32 1.39 17Byars 81.1 97 25 63 3 0 500 2.00 1.75 5 Pauls Valley 81.4 97 12 64 3 0 508 1.86 1.05 17Centrahoma 81.1 97 12 64 3 0 499 2.11 .63 5 Ringling 81.9 98 31 65 3 0 524 2.98 1.08 5Durant 82.3 100 12 67 6 0 537 2.81 .87 19 Sulphur 80.8 95 31 63 3 0 490 5.02 2.47 17Fittstown 79.7 95 12 64 3 0 456 4.14 1.83 19 Tishomingo 81.2 98 12 65 6 0 503 6.00 4.02 19Ketchum Ranch 82.0 100 31 64 3 0 528 1.09 .36 13 Waurika 82.2 100 31 63 3 0 532 2.34 1.67 1
SOUTHEAST Antlers 80.7 99 13 65 6 0 486 4.33 1.69 19 Mt Herman 80.0 94 25 67 5 0 467 5.11 2.01 17Broken Bow 80.9 97 13 66 5 0 494 5.05 1.92 19 Talihina 82.2 100 12 64 4 0 532 1.80 .69 19Clayton 81.9 101 12 65 3 0 524 3.17 .97 13 Valliant 81.3 99 12 66 2 0 504 7.33 4.12 19Cloudy 80.3 98 12 65 6 0 474 5.50 4.02 19 Wilburton ***** *** *** *** *** **** **** 4.05 3.21 5Hugo 81.6 97 12 68 6 0 514 7.63 3.48 19 Wister 81.0 100 25 65 4 0 497 2.36 .89 5Idabel 81.5 97 13 66 3 0 510 6.98 2.80 19

Copyright © 2021 Board of Regents of the University of Oklahoma. Oklahoma Monthly Climate Summary 7
2021 STATEWIDE PRECIPITATION MONTHLY TOTALS VS. NORMAL
Mon
thly
Pre
cipi
tatio
n (in
ches
)
August 2021 Mesonet Precipitation Comparison
Climate DivisionPrecipitation
(inches)Departure from Normal (inches) Rank since 1895
Wettest on Record (Year)
Driest on Record (Year)
Aug-20 (inches)
Panhandle 1.31 -1.58 21st Driest 5.81 (1917) 0.54 (1936) 2.04
North Central 1.19 -2.25 16th Driest 8.10 (1974) 0.14 (2000) 1.86
Northeast 1.75 -1.90 23rd Driest 8.86 (2019) 0.03 (2000) 2.44
West Central 3.23 0.05 42nd Wettest 6.93 (2017) 0.02 (2000) 1.63
Central 1.99 -1.36 40th Driest 8.18 (1906) 0.02 (2000) 2.21
East Central 2.80 -0.65 58th Driest 10.88 (1915) 0.02 (2000) 4.17
Southwest 2.65 -0.23 50th Wettest 7.38 (1996) 0.00 (2000) 1.62
South Central 3.07 0.23 39th Wettest 8.72 (1906) 0.01 (2000) 3.05
Southeast 4.85 1.55 27th Wettest 9.68 (1915) 0.25 (1936) 6.78
Statewide 2.44 -0.79 51st Driest 6.47 (1915) 0.12 (2000) 2.79
0.00
1.00
2.00
3.00
4.00
5.00
6.00
7.00
JAN FEB MAR APR MAY JUN JUL AUG SEP OCT NOV DEC
Mon
thly
Pre
cipi
tatio
n (in
ches
)
2021 Statewide Precipitation: Monthly Totals vs. Normal
2021 Precipitation
1981-2010 Normal

Copyright © 2021 Board of Regents of the University of Oklahoma. Oklahoma Monthly Climate Summary 8
August 2021 Mesonet Temperature Comparison
Climate DivisionAverage Temp (F)
Departure from Normal (F) Rank since 1895
Hottest on Record (Year)
Coldest on Record (Year) Aug-20 (F)
Panhandle 79.1 1.2 41st Warmest 83.7 (1937) 71.4 (1915) 78.1
North Central 81.5 0.9 48th Warmest 88.2 (1936) 72.9 (1915) 78.3
Northeast 80.6 0.5 59th Warmest 88.8 (1936) 72.7 (1915) 77.7
West Central 80.3 -0.6 57th Coolest 87.9 (2011) 73.6 (1915) 80.4
Central 80.7 -0.7 54th Coolest 88.7 (1936) 74.1 (1915) 79.6
East Central 81.2 0.4 59th Warmest 88.6 (1936) 73.5 (1915) 78.6
Southwest 81.3 -1.4 48th Coolest 91.4 (2011) 76.1 (1915) 82.4
South Central 81.4 -1.1 43rd Coolest 90.8 (2011) 76.1 (1992) 81.4
Southeast 81.1 0.5 51st Warmest 87.5 (2011) 74.2 (1915) 79.2
Statewide 80.8 0.0 62nd Warmest 87.7 (2011) 73.9 (1915) 79.5
Mai
n Te
mpe
ratu
re (d
egre
es F
)
2021 STATEWIDE TEMPERATURE MONTHLY TOTALS VS. NORMAL
30
35
40
45
50
55
60
65
70
75
80
85
90
JAN FEB MAR APR MAY JUN JUL AUG SEP OCT NOV DEC
Mon
thly
Pre
cipi
tatio
n (in
ches
)
2021 Statewide Temperature: Monthly Totals vs. Normal
2021 Temperature
1981-2010 Normal

Copyright © 2021 Board of Regents of the University of Oklahoma. Oklahoma Monthly Climate Summary 9
MESONET EXTREMES FOR AUGUST 2021
Climate Division
High Temp
(F) Day Station
Low Temp
(F) Day Station
High Monthly Rainfall (inches) Station
High Daily
Rainfall (inches) Day Station
Panhandle 109 28th Slapout 54 11th Eva 3.08 Buffalo 1.86 29th Eva
North Central 109 28th Seiling 56 1st Seiling 3.30 May Ranch 2.30 10th May Ranch
Northeast 101 28th Pawnee 54 4th Nowata 5.42 Tulsa 2.59 13th Tulsa
West Central 110 28th Camargo 56 1st Camargo 2.20 Erick 1.29 5th Watonga
Central 106 28th Chickasha 54 19th Bristow 6.34 Yukon 5.29 31st Yukon
East Central 102 28th Holdenville 53 19th Cookson 10.81 Webbers Falls 4.28 7th Webbers Falls
Southwest 110 28th Hollis 56 19th Mangum 2.79 Grandfield 2.07 30th Grandfield
South Central 107 28th Waurika 57 19th Ada 5.62 Centrahoma 2.67 5th Centrahoma
Southeast 99 28th Wilburton 55 4th Wister 11.13 Broken Bow 5.24 26th Broken Bow
Statewide 110 28th Hollis 53 19th Cookson 11.13 Broken Bow 5.29 31st Yukon
Oklahoma Climate Divisions

Copyright © 2021 Board of Regents of the University of Oklahoma. Oklahoma Monthly Climate Summary 10

Copyright © 2021 Board of Regents of the University of Oklahoma. Oklahoma Monthly Climate Summary 11
Oklahoma Climatological Survey is the State Climate Office for Oklahoma
Dr. Kevin Kloesel DirectorDr. Chris Fiebrich Associate Director
EDITOR Gary D. McManus State Climatologist
CONTENT AND LAYOUT ASSISTANTAndrea Dawn Melvin Outreach Coordinator
For more information, contact:Oklahoma Climatological SurveyThe University of Oklahoma120 David L. Boren Blvd., Suite 2900Norman, OK 73072-7305
TEL: 405-325-2541FAX: 405-325-7282E-MAIL: [email protected]: http://climate.ok.gov
OklahomaClimatological Survey
INTERPRETATION INFORMATIONMEAN DAILY TEMPERATURE: Calculated from an average of the daily maximum and minimum temperatures. Daily averages are summed for each day, and then divided by the number of valid data points – typically the number of days in the month. Although this November differ from the “true” daily average, it is consistent with historical methods of observation and comparable to the normals and extremes for stations and regions of the state.
DEGREE DAYS: Degree Days are calculated each day of the month for which there is a temperature report and the mean temperature for the day is less than (Heating Degree Days) or greater than (Cooling Degree Days) 65 degrees. Daily values are summed to arrive at a monthly total. HDD/CDD are qualitative measures of how much heating/cooling was required to maintain a comfortable indoor temperature. Missing observations November result in an artificially high or low value.
ADDITIONAL RESOURCESSUNRISE / SUNSET TABLESU.S. Naval Observatory: http://aa.usno.navy.mil/data
SEVERE STORM REPORTSStorm Prediction Center: http://spc.noaa.gov/climo/
National Centers for Environmental Information:https://www.ncdc.noaa.gov/stormevents/
SEASONAL OUTLOOKSClimate Prediction Center: http://www.cpc.ncep.noaa.gov/products/OUTLOOKS_index.shtml
CLIMATE CALENDARS AND OTHER LOCAL WEATHER AND CLIMATE INFORMATIONOklahoma Climatological Survey:http://climate.mesonet.org or http://climate.ok.gov/