oklahoma state regents for higher education faculty advisory council january 14, 2011
TRANSCRIPT

OKLAHOMA STATE REGENTSFOR HIGHER EDUCATION
Faculty Advisory CouncilJanuary 14, 2011

In The Global Economy of the In The Global Economy of the 2121stst Century, 90 Percent of the Century, 90 Percent of the
Fastest-Growing Jobs Will Fastest-Growing Jobs Will Require a Higher Education.Require a Higher Education.
In The Global Economy of the In The Global Economy of the 2121stst Century, 90 Percent of the Century, 90 Percent of the
Fastest-Growing Jobs Will Fastest-Growing Jobs Will Require a Higher Education.Require a Higher Education.
2

3

Nationally, more than one-quarter (27.9 percent) of adults 25 and older have a bachelor’s degree or more,
compared to Oklahoma at 22.7 percent.
4

State Per Capita Personal Income v. Share of AdultPopulation with Bachelor's Degree or Higher
No state with a low proportion of Bachelor’s
degrees has a high per capita income.
No state with a high proportion of Bachelor’s
degrees has a low per capita income.
States with high proportion of bachelors degrees
States with low proportion of bachelors degrees
Outlier state that has high income and low degree attainment
5
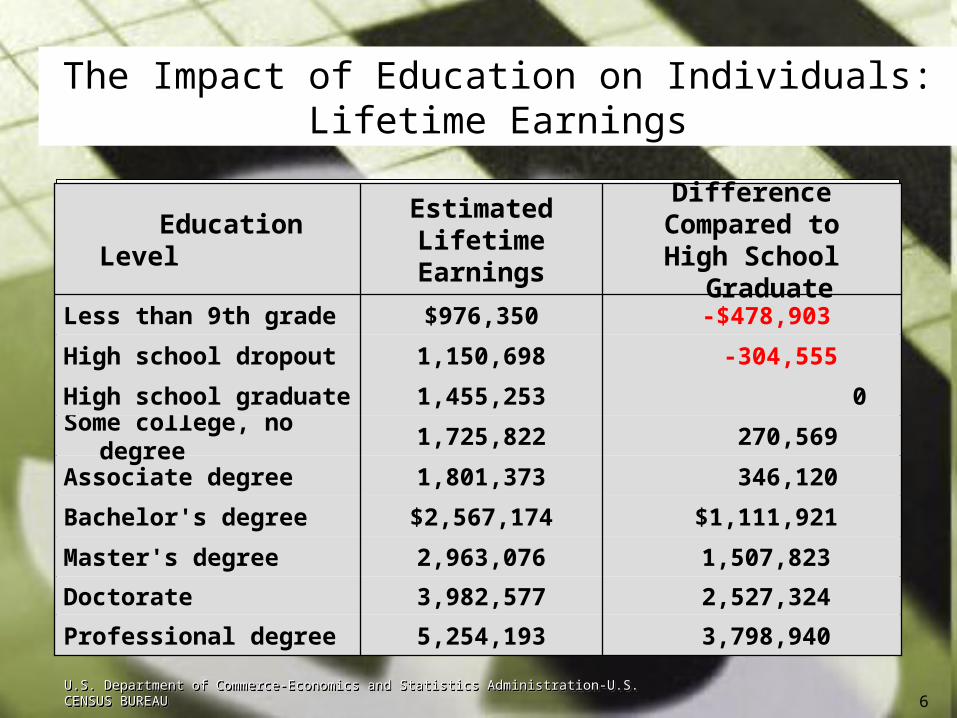
3,798,9405,254,193Professional degree
2,527,3243,982,577Doctorate
1,507,8232,963,076Master's degree
$1,111,921$2,567,174Bachelor's degree
346,1201,801,373Associate degree
270,5691,725,822Some college, no degree
01,455,253High school graduate
-304,5551,150,698High school dropout
-$478,903$976,350Less than 9th grade
DifferenceCompared toHigh School
Graduate
EstimatedLifetimeEarnings
Education Level
The Impact of Education on Individuals:Lifetime Earnings
U.S. Department of Commerce-Economics and Statistics Administration-U.S. CENSUS BUREAUU.S. Department of Commerce-Economics and Statistics Administration-U.S. CENSUS BUREAUU.S. Department of Commerce-Economics and Statistics Administration-U.S. CENSUS BUREAUU.S. Department of Commerce-Economics and Statistics Administration-U.S. CENSUS BUREAU6

7
2011 Legislative Agenda

8
Endowed Chairs Program
2011 Legislative Agenda
• The endowed chairs program is one of the most successful public/private partnerships where private donations are matched dollar for dollar with public funds.
• Dollars are used to help fund faculty and research positions, new programs and lectureships.
• A bond issue was authorized in 2008 to fund $100 million of the current 364 million dollar backlog and in 2010 the legislature and Governor funded the debt service for this $100 million bond issue.

20 Institutions and Branch Campuses Have 712 Accounts Awaiting Funding
Endowed Chair BacklogEndowed Chair Backlog
9
Number ofInstitution AccountsCameron 15ECU 4NSU 3NWOSU 9Langston 1OSU 230OSU-OKM 4OSU-Tulsa 7OSUCHS 22OSU Vet 7OU 154
Number of Institution AccountsOUHSC 180OU Tulsa 44Rogers 1SEOSU 1SWOSU 5TCC 17UCO 3USAO 1WOSC 4
Total Accounts 712

10
2011 Legislative Agenda
• The State Regents, all 25 institutions, and all governing boards believe that there is no scenario where placing guns on campuses will do anything other than create a more dangerous environment for our students and faculty on campus.
• In past three legislative sessions, legislation has been introduced or
discussed that would allow certain students to carry concealed weapons onto college property we have successfully defeated the legislation to date.
• It will continue to be a priority of the system to ensure this legislation is not law.
Concealed Weapons Legislation

2011 Legislative Agenda
• OK Promise is one of the most successful college access scholarship programs in the country.
• There has been legislation introduced in past legislative sessions to change the requirements of the program that would reduce the number of students eligible to participate.
• Changing the requirements of OK Promise would alter the intent of the program, which is to ultimately provide students more access to college which will result in more Oklahoma college graduates.
• We oppose any legislation that would change the program’s focus on access.
11

12
• Oklahoma Promise students average a 3.4 GPA compared to all high school seniors with a 3.0 GPA.
• Ok Promise students score higher on the ACT Test.
• On average 20 percent more Oklahoma’s Promise students enter college directly after the high school graduation when compared to all High School graduates.
• Ok Promise students have a higher persistence rates from freshmen to sophomore.
• Oklahoma’s Promise students complete college degrees at higher rates than non-Oklahoma’s Promise students.a. The six year degree completion rate is 50 percent for Oklahoma’s Promise
students compared to 40 percent for non-Oklahoma’s Promise Students.b. The nine-year degree completion rate is 61 percent for Oklahoma’s Promise students compared to 50 percent for non-Oklahoma’s Promise students
• Oklahoma’s Promise students are even more likely to remain in Oklahoma after graduation when compared to all Oklahoma college graduates.

1,000
3,000
5,000
7,000
9,000
11,000
13,000
15,000
2007-082000-01 2001-02 2002-03 2003-04 2004-05 2005-06 2006-07
1,717 2,0042,982
5,889
9,155
12,101
Number of Oklahoma’s Promise Scholarship
Recipients
As of 10-20-10. Assumes 1% annual increases in OK Promise high school enrollment and 65% completion rate of high school requirements for scholarship
eligibility.
2008-09 2009-10
17,000
19,000
14,670
16,928
18,282
19,409
2010-11
20,900
Projected
2011-12
20,27521,000
13

2011 Legislative Agenda
• Due to the economic downturn and record enrollment increases, our institutions have been stretched to the financial limits and yet the state system has been able to protect our students with limited tuition increases.
• In 2009, all of our 25 institutions froze tuition. • Last year we had very limited tuition increases statewide.• Our two research institutions, OU and OSU continue to be 11th and
12th in the in the Big 12 in regards to tuition and fees. • We support leaving the tuition setting authority with the Oklahoma State
Regents.
Tuition Setting Authority
14

0%
5%
10%
15%
20%
25%
30%
Mis
sis
sip
pi
Ok
lah
om
a
0.4
%
Ge
org
ia
Ari
zon
a
Flo
rid
a
Ore
go
n
Ha
wa
ii
Co
lora
do
Na
tio
nal
Av
erag
e
Ka
ns
as
Te
xas
Ne
bra
ska
25.
6%
23.
7%
15.
8%
15.
5%
14.
5%
9.0
%
6.4
%
5.3
%
4.8
%
4.1
%
Oh
io
Mis
sou
ri
Mar
ylan
d
Ark
an
sas
Iow
a4
.6%
0.9
%
0.5
%
0.3
%
0.0
%
0.0
%
Research InstitutionsPercentage Change in Resident Undergraduate
Tuition and Required Fees2008-09 to 2009-10
Affordability
Source: Washington Higher Education Coordinating Board 2009-10 – Tuition and Fee Rates-National Comparison 15

0%
5%
10%
15%
20%
25%
30%
Flo
rid
a
Mis
sis
sip
pi
Oh
io
0.0
%
Regional UniversitiesPercentage Change in Resident Undergraduate
Tuition and Required Fees2008-09 to 2009-10
AffordabilityG
eo
rgia
Ca
lifo
rnia
Ari
zon
a
Wa
shin
gto
n
Co
lora
do
Na
tio
nal
Av
erag
e
Ka
ns
as
Te
xas
Ne
bra
ska
28.
7%
26.
2%
21.
3%
14.
2%
13.
9%
6.7
%
6. 5
%
4.1
%
6.6
%
4.4
%
Ok
lah
om
a
Mis
sou
ri
Mo
nta
na
Ark
an
sas
2.3
%
1.6
%
1.0
%
0.0
%
0.0
%
13.
1%
Iow
a
Source: Washington Higher Education Coordinating Board 2009-10 – Tuition and Fee Rates-National Comparison 16

0%
5%
10%
15%
20%
25%
30%Community Colleges
Percentage Change in Resident Undergraduate Tuition and Required Fees
2008-09 to 2009-10
AffordabilityG
eo
rgia
Ca
lifo
rnia
Ari
zon
a
Wa
shin
gto
n
Flo
rid
a
Co
lora
do
Na
tio
nal
Av
erag
e
Ka
ns
as
Te
xas
Ne
bra
ska
30.
6%
30.
3%
30%
23.
2%
18.
4%
6.2
%
5.7
%
2.0
%
7.1
%
4.3
%
Mis
sis
sip
pi
Ok
lah
om
a
Ne
w Y
ork
Mis
sou
ri
Wis
con
sin
No
rth
Dak
ota
0.8
%
0.0
%
0.0
%
-0.3
%
-0.4
%
8.8
%
Iow
a5
.3%
0.6
%
0.3
%
0.8
%
Ala
ba
ma
Lo
uis
ian
a
Source: Washington Higher Education Coordinating Board 2009-10 – Tuition and Fee Rates-National Comparison 17
18
Higher Education’s Efficiencies and Reforms

19
$$COST SAVINGSCOST SAVINGSCOST SAVINGSCOST SAVINGS
All Oklahoma institutions of higher education have decreased their need for additional funds for mandatory
operating obligations by cost savings efforts.
A total cost savings of $112.3 million from 2009-12.
• Energy Conservation • Energy Conversion• Changes in Salaries and Benefits• Changes and Elimination of Positions• Reduction in Supplies and IT Expenditures
Source: Oklahoma State Regents for Higher Education
19

20
$$COST SAVINGSCOST SAVINGSCOST SAVINGSCOST SAVINGS
$0 m
$5 m
$10 m
$15 m
$20 m
$25 m
$30 m
$35 m
Faculty and Staff Positions
Supplies Salary and Benefits
Utilities
$112.3 Million Cumulative Savings
Over 4 years
$22.1 m
$32.5 m
$22.5 m $23 m
$3.8 m
$8.4 m
Travel, Periodicals and Other
IT Equipment
Source: Oklahoma State Regents for Higher Education20

21$$
System EfficienciesTotal System Administrative Costs FY92-FY09
FY92 FY94 FY96 FY98 FY00 FY02 FY04 FY06 FY08 FY09
0%
2%
4%
6%
8%
10%
12%11.9%
11.1%
8.2% 8.3%8.1% 8.2%
8.1%7.8%
Syst
em
Adm
in C
ost
s as
a P
erc
ent
of
Tota
l B
udget
14%
9.3%
7.8%
FY10
7.9%
FY11
7.8%
Source: Oklahoma State Regents for Higher Education 21
22$$
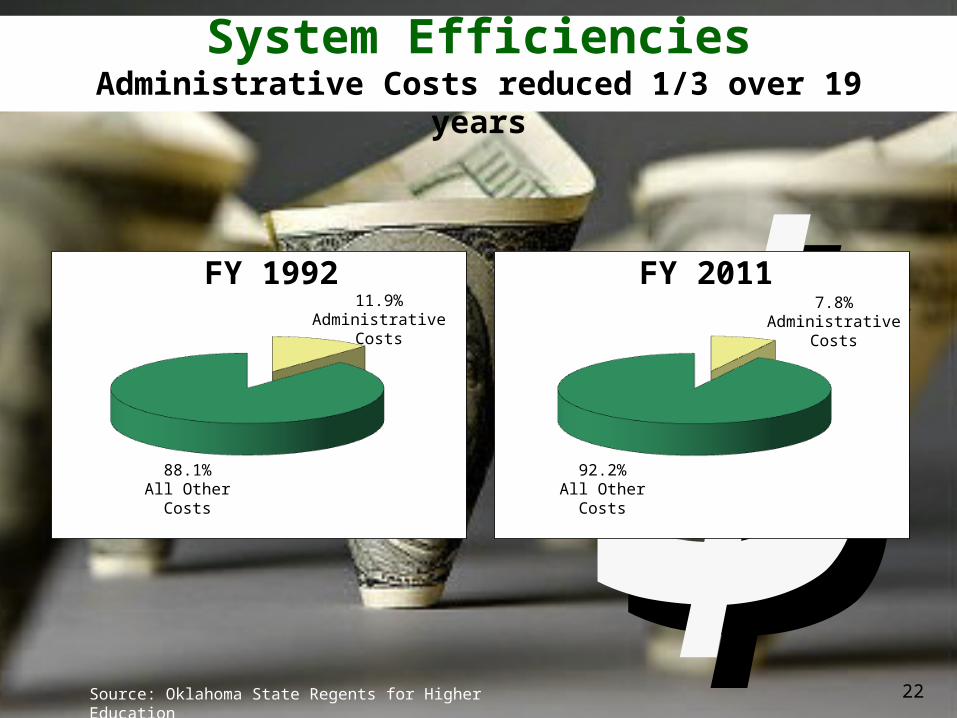
System EfficienciesAdministrative Costs reduced 1/3 over 19 years
Source: Oklahoma State Regents for Higher Education
FY 1992 FY 2011
88.1%All Other Costs
11.9%Administrative Costs
92.2%All Other Costs
7.8%Administrative Costs
22

• Oklahoma’s 25 College and Universities have an active and productive grantsmanship program which contributes to the institutions funding outside the appropriations process.
• In 2010, our institutions reported the receipt of $506.6 million in competitive grants for program development and research.
Source: Oklahoma State Regents for Higher Education
23

Performance Funding
• Performance Funding is designed to financially support the State Regents’ Brain Gain initiative, adding a component to the traditional funding formula and rewarding institutions for performance in graduation rates and retention rates.
• Performance funding has been a key component in driving Oklahoma’s increase in degrees conferred.
• Oklahoma’s Performance Funding initiative is nationally recognized.
• Performance Funding reached over $2.1 million in FY11.
24
1225
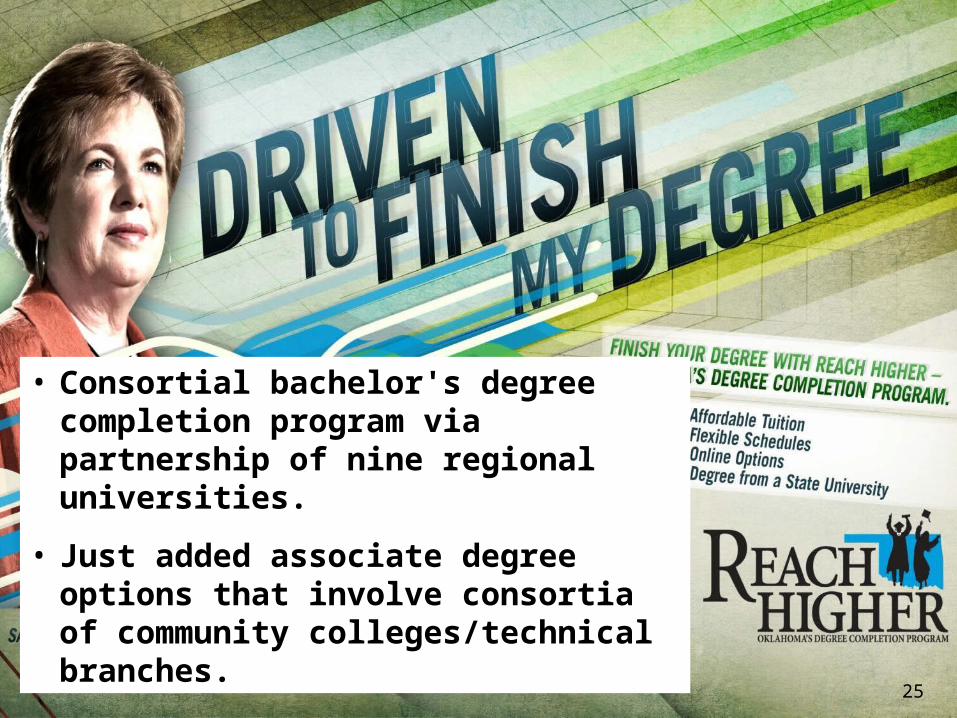
• Consortial bachelor's degree completion program via partnership of nine regional universities.
• Just added associate degree options that involve consortia of community colleges/technical branches.

26
Higher Education’s
2012 Budget RequestEconomic Recovery and
Growth

27
FY’11 Appropriation
FY’11 Appropriation
State Appropriations $943,666,030
ARRA Funds $59,794,986
Total FY’11 Appropriation $1,003,461,016

28
FY’12 Appropriations Request
FY’12 Appropriation Request1. Economic Recovery and Growth
a. Replacement of FY’11 Stimulus Funds $59,794,986
b. Replacement of FY’11 Debt Service Reductionto be used for Institutional Operations $16,500,000
c. Total Funding Need for Operating Obligations $30,938,170
d. Endowed Chair Bond Issue Debt Service $5,600,000
e. Section 13 Offset $618,150
2. Removal of Financial Barriers
a. Concurrent Enrollment $1,500,000
b. Academic Scholars $600,000
3. Office of Accountability $48,014
Total New FY’12 State Funds $115,599,320% Difference from Total FY’11 Appropriation 5.56%
FY’12 Total with Oklahoma’s Promise Allocation ($63.2m) $1,122,465,350

29
Concurrent EnrollmentCONCURRENT ENROLLMENT CREDIT HOURS
2004-05 2005-06 2006-07
10,000
20,000
30,000
40,000
50,000
2007-08 2008-09 2009-10
29,156
39,758
45,690
48,74150,068
56,43860,000
Source: Oklahoma State Regents for Higher Education 29

30
Academic Scholars
• Academic Scholars receive a scholarship to help cover the cost of room, board, tuition, books and incidental fees for up to eight semesters.
• University of Oklahoma is ranked number one in the nation for National Merit Scholars.
• 2,313 students received a National Merit Scholarship from 1998-2008.
• For the 1,672 participants entering into the program between 2001-2003, 78 percent (1,306) received at least a baccalaureate.

31
FY’12 Appropriations Request
Total New FY’12 State Funds $115,599,320
% Difference from Total FY’11 Appropriation 5.56%

322000-01 2001-02 2002-03 2003-04 2004-05 2005-06
Degrees Conferred by Oklahoma Degrees Conferred by Oklahoma Public Colleges and UniversitiesPublic Colleges and Universities
Nu
mb
er o
f A
sso
ciat
e an
d B
ach
elo
r’s
Deg
rees
Co
nfe
rred
2006-07
23,701
Source: 2010 Degrees Conferred Report/UDS Database
18,998
19,488
20,458
21,636
22,786
23,298
23,845
2007-08
24,211
2008-09
27.4%
In 2008-09, State System institutions awarded a total of
24,211 associate and bachelor’s degrees – the most awarded in a
single year in state history
This is 27.4 percent more degrees awarded than in 2000-2001.
327

170,000
Fall 2008
177,385
187,676
160,000
150000
140,000
130,000
120,000Fall 2009
Source: 2009 Fall Preliminary Enrollment Report
References Public Institutions
Enrollment
180,000
190,000
Record Fall Enrollment• Overall Headcount
Increased by 10,291 in Fall 2009
• First Time Freshman increased by 12.3 percent
33
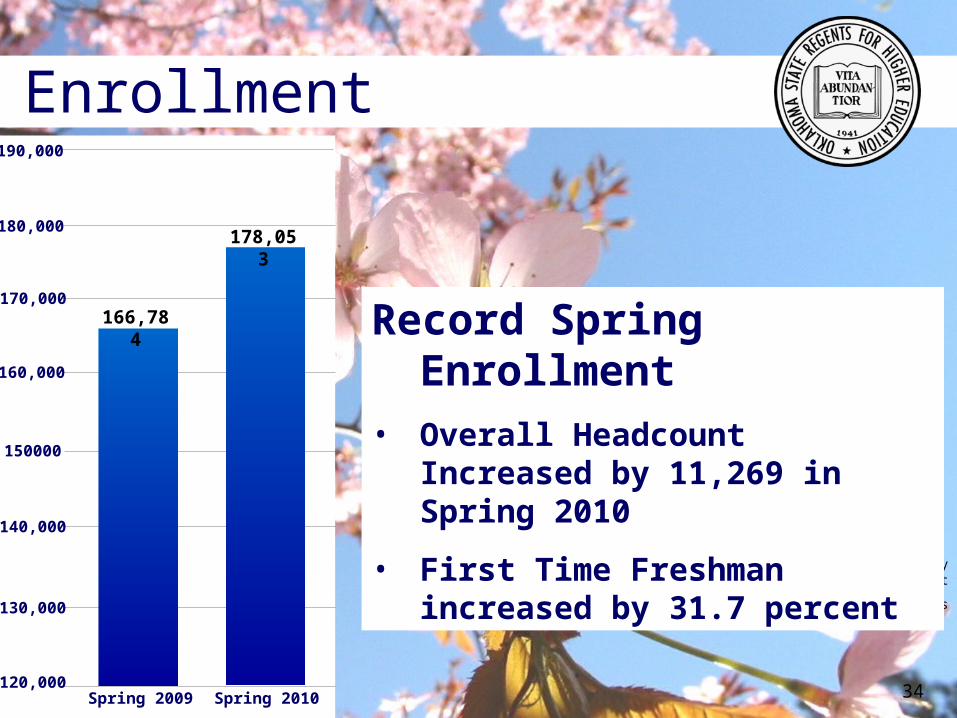
170,000
Spring 2009
166,784
178,053
160,000
150000
140,000
130,000
120,000Spring 2010
Source: 2010 Spring Preliminary Enrollment Report
References Public Institutions
Enrollment
180,000
190,000
Record Spring Enrollment
• Overall Headcount Increased by 11,269 in Spring 2010
• First Time Freshman increased by 31.7 percent
34
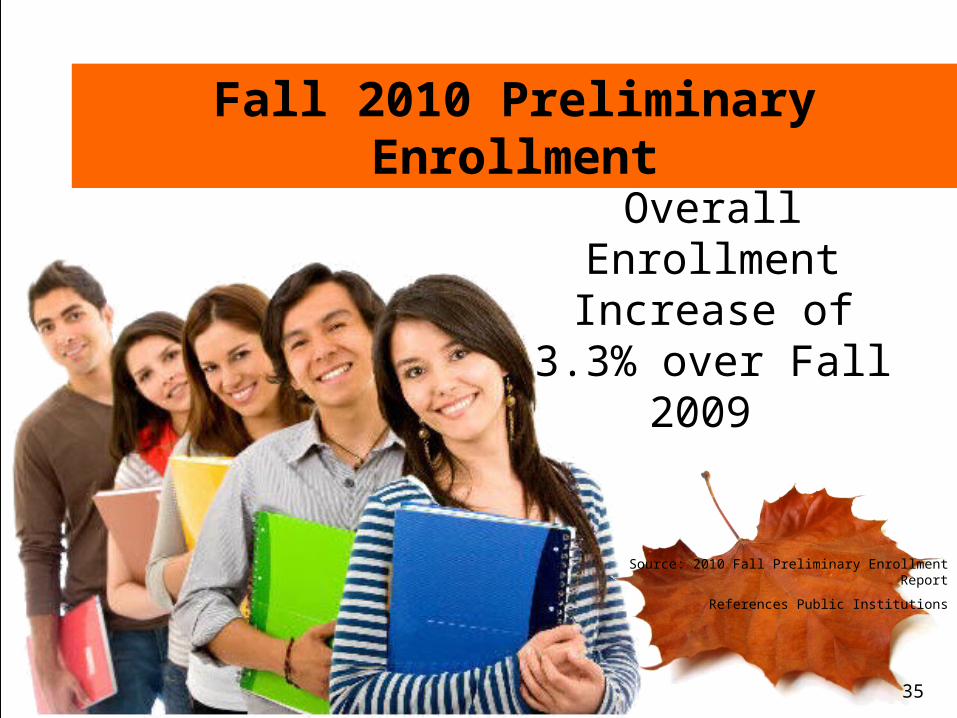
Fall 2010 Preliminary Enrollment
Overall Enrollment
Increase of 3.3% over Fall 2009
Source: 2010 Fall Preliminary Enrollment Report
References Public Institutions
35

OKLAHOMA STATE REGENTSFOR HIGHER EDUCATION
Faculty Advisory CouncilJanuary 14, 2011