oklahoma state university the committee for the … · was expanded from the previous...
TRANSCRIPT
America’s Brightest ORANGE
Oklahoma State University The Committee for the Assessment of General Education
and The Office of University Assessment and Testing
Annual Report, 2016
Committee for the Assessment of General Education (CAGE) Jon Comer, Ph.D., (Chair), Geography
Melanie Bayles, Ph.D., Plant and Soil Sciences Carol Beier, M.S., Nutritional Sciences
John Gelder, Ph.D., Chemistry Carol Johnson, Ph.D., Spears School of Business
Bridget Miller, Ph.D., Applied Health & Educational Psychology Gregory Wilber, Ph.D., Civil & Environmental Engineering
University Assessment & Testing (UAT) Ryan Chung, Ph.D., Director
Kelva Hunger, M.S., Assistant Director, Assessment & Analysis James Knecht, M.S., Assistant Director, Testing & Technology
Lisa D. Cota, M.S., former Assistant Director, Assessment & Analysis Maggie Blankenship, former Graduate Research Assistant, Assessment
Vivek Damodaran, former Graduate Research Assistant, Statistical Analyst http://assessment.okstate.edu/
[email protected] (405) 744-9650
Photovoice Project Committee Sarah Gordon, Ph.D., Assistant Professor, REMS, and Former Director, UAT
Marshall Baker, Ph.D., Assistant Professor, Agricultural Education Denise Blum, Ph.D., Associate Professor, Social Foundations
Precious Elmore-Sanders, Ph.D., Assistant Vice President for Institutional Diversity

General Education Assessment: 2016 2
Contents Executive Summary ...................................................................................................................... 4
Overview ....................................................................................................................................... 6
Introduction ................................................................................................................................ 6
Key Findings, Artifact Analysis ...................................................................................................... 7
Class Rank ............................................................................................................................ 7
GPA ....................................................................................................................................... 7
Academic College .................................................................................................................. 7
Written Artifact Assessment of the Diversity Learning Outcome .................................................. 8
Diversity Artifact Collection ........................................................................................................ 8
Scoring Process and Reliability Estimation ............................................................................... 8
Key Findings, Global Perspectives Inventory ............................................................................. 12
Key Findings, Photovoice Project ............................................................................................... 14
Use of Results and Future Plans ................................................................................................ 15
Appendices ................................................................................................................................. 16
Appendix A1: GPI – Fall 2015 New (First-Year) Student Report ............................................ 16
Appendix A2: GPI – Fall 2016 New (First-Year) Student Report ............................................ 35
Appendix A3: GPI – Fall 2016 General (Fourth-Year) Student Report ................................... 54
Appendix B: Photovoice Report .............................................................................................. 76

General Education Assessment: 2016 3
Tables and Figures Table 1. Fall 2015 New Student (First-Year) GPI Scores ........................................................... 12 Table 2. Fall 2016 New Student (First-Year) GPI Scores ........................................................... 12 Table 3. Fall 2016 Genera (Fourth-Year) GPI Scores ................................................................ 13 Table 4. Collection of Diversity Artifacts ....................................................................................... 8 Table 5. Inter-Rater Reliabilities .................................................................................................... 9 Table 6. Student Demographics Associated with Diversity Artifacts, 2007 – 2016 ..................... 10 Table 7. Diversity Artifact Scores, 2016 ...................................................................................... 11 Figure 1. GPA and Diversity Artifact Score ................................................................................... 7

General Education Assessment: 2016 4
Executive Summary
Following the 2014 joint meeting of the Committee for the Assessment of General Education (CAGE), the General Education Advisory Council (GEAC), and the Assessment and Academic Improvement Council (AAIC), assessment of Diversity as a general education program outcome was expanded from the previous artifact/rubric methodology to the following three-pronged approach: 1) continuation of the assessment of student artifacts now using the Association of American Colleges and Universities’ (AAC&U) Intercultural Knowledge and Competence VALUE Rubric; 2) administration of the Global Perspectives Inventory (GPI) in the fall of 2015 and the fall of 2016; and the facilitation of a student-led Photovoice project by a team of qualitative researchers. Key Findings:
In total, 150 student artifacts were assessed using the AAC&U’s Intercultural Knowledge and Competence VALUE Rubric by two teams of two reviewers. Due to issues with the second team’s inter-rater reliability (IRR), only Team 1’s scores were used (Table 5). This assessment revealed no significant differences between first-year and senior scores, which is a result that is similar to the findings of previous years.
The GPI assesses a global and holistic view of student learning and development and the importance of the campus environment in fostering holistic student development. It also measures how students think, how they view themselves as people with cultural heritage, and how they relate to others from other cultures, backgrounds, and values. Oklahoma State University’s (OSU) scores on this assessment in 2015 and 2016 are comparable with national means across all scales (Tables 1, 2, and 3).
Fifteen students participated in the Photovoice project. They took photos, wrote about them, and discussed in focus groups photos related to their personal experiences with diversity both in and out of the classroom. Six themes emerged from the photograph and focus group data: Course Quality, the OSU Experience, Spaces and Places, Grouping, Responsibility, and Hesitation. Students provided rich data concerning what they learned about diversity during their time as an OSU student. The students described both positive learning experiences and negative experiences connected to diversity as part of this project.
Recommendations:
The use of AAC&U’s Intercultural Knowledge and Competence VALUE Rubric led to a divergence in inter-rater reliabilities (IRRs): one review team had very good IRRs, while the second team had IRRs that were low enough to render their scores unusable in analysis. Diversity IRRs at OSU have historically been poor. Additional faculty exposure to the rubric prior to developing written assignments may improve these IRRs in the future. At the very least, this year’s IRRs support the idea that Diversity, as a general education outcome, should be assessed by more than just written artifacts.
The number of student responses to the Global Perspectives Inventory (GPI) was very low (Tables 1, 2, and 3); results should be interpreted with caution as they may not be representative of OSU’s student population as a whole.
Assessment of general education is a critical aspect of our work to continuously improve our institution. We are fortunate that Oklahoma State University provides substantial resources to
General Education Assessment: 2016 5
assess students’ learning and to consider ways in which learning might be improved. Our challenge moving forward is clear: to make the most of this investment by using these results to make meaningful changes to our programs. Thank you for your time and support of general education assessment. Please let us know if you have any additional questions or comments. Sincerely, Ryan Chung, Ph.D. Director University Assessment and Testing Oklahoma State University August 2017

General Education Assessment: 2016 6
Overview
Introduction General Education at Oklahoma State University (OSU) is intended to:
A. Construct a broad foundation for the student’s specialized course of study, B. Develop the student’s ability to read, observe, and listen with comprehension, C. Enhance the student’s skills in communicating effectively, D. Expand the student’s capacity for critical analysis and problem solving, E. Assist the student in understanding and respecting diversity in people, beliefs, and
societies, and F. Develop the student’s ability to appreciate and function in the human and natural
environment. Full details of the General Education program can be found at: http://academicaffairs.okstate.edu/content/general-education Oklahoma State University has assessed general education for more than 10 years. Three approaches have typically been used to evaluate the general education program: institutional portfolios, review of the general education course database, and college-, department-, and program-level approaches (i.e. exams, surveys, capstone projects, artifact analysis, etc.). This report focuses on OSU’s use of institutional portfolios to assess the general education program. Institutional portfolios provide direct evidence of student achievement of the overall goals of general education. Institutional portfolios are currently in use in three areas that represent the overall goals of the general education program (letters in parentheses map portfolios to the goals listed above):
1. Written Communication (A, B, and C) 2. Critical Thinking (A, D, and F) 3. Diversity (A, E, and F)
Recognizing that these goals cannot be achieved only through the completion of courses with general education designations, student artifacts are collected from courses across campus that reveal students’ achievement in each institutional portfolio area. These student artifacts are then assessed by a panel of OSU faculty members using rubrics, each of which has a different number of categories used in the scoring process. In 2016, for the review of Diversity artifacts, OSU moved from the previously-used rubric developed at the institution to the AAC&U’s Intercultural Knowledge and Competence VALUE Rubric. Artifacts rated with the VALUE rubrics can receive ratings from Benchmark (1) to Capstone (4). Oklahoma State University also expanded the institutional portfolio for Diversity beyond the assessment of student artifacts to include two additional approaches: administration of the Global Perspectives Inventory (GPI) and the facilitation of a student-led Photovoice project by a team of qualitative researchers.

General Education Assessment: 2016 7
Key Findings, Artifact Analysis In the summer of 2016, 150 samples of student writing were evaluated by two teams of raters using the AAC&U Intercultural Knowledge and Competence VALUE Rubric. This VALUE rubric measures on a four-point Likert scale (1–Benchmark, 2 and 3–Milestone, and 4–Capstone). Artifacts from one team were excluded from analysis due to low inter-rater reliability (IRR scores ranging from -0.17 to 0.08). Of the remaining artifacts, 24 were written by first-year students, 8 by sophomores, 24 by juniors, and 17 by seniors. Also, 6 (8.21%) of the artifacts received a score of 1, 33 (45.2%) received a score of 2, 29 (39.72%) received a score of 3, and 5 (6.85%) received a score of 4. Class Rank There was no statistically significant effect of class rank on Diversity artifact score, 2=2.04, p=0.56. GPA A boxplot of the relationship between GPA and diversity artifact score is shown in Figure 1. Figure 1. GPA and Diversity Artifact Score
Results of a logistic regression indicate that for every unit increase in GPA, the odds of moving from one Diversity rubric score to another are multiplied by 0.386. Academic College There was not a statistically significant difference in artifact score based on academic college (2=10.32, p=0.11).

General Education Assessment: 2016 8
Written Artifact Assessment of the Diversity Learning Outcome
Diversity Artifact Collection Artifacts included in the 2016 Diversity portfolio were collected from faculty by direct request from a random sample of general education designated courses as well as from faculty who attended the Provost’s Faculty Development Initiative: Focus on General Education. The courses from which artifacts were sampled are shown in Table 4. Artifacts selected for the Institutional Portfolio were coded, and all identifying information was removed. Demographic data was collected separately from the Office of Institutional Research and Information Management (IRIM). This data was used for statistical analysis only and cannot be used to identify individual students. Student demographic information was not shared with reviewers prior to scoring. Table 1. Collection of Diversity Artifacts
Course Prefix and Number
Course Name
General
Education Designation
(if any)*
Number
of Artifacts
Submitted
Number of Artifacts Included
in Analysis
AGED 4713 International Programs in
Education
I
27
18
ENGL 2413 Introduction to Literature D, H 19 19 GWST 2123 Introduction to Gender Studies D, H 24 11
PSYC 4163.001 Psychology of Prejudice and Discrimination
D
45
15
SOC 1113 Introductory Sociology S 238 10
Total Number of Diversity Artifacts: 353 73**
Note: *I – International Dimension, D – Diversity, H – Humanities, S – Social and Behavioral Sciences **Though 150 artifacts were scored, only 73 were analyzed; 75 artifacts were removed from the analyses due to low inter-rater reliabilities; 2 artifacts were removed from analyses because there was little to no student demographic information available.
Scoring Process and Reliability Estimation All reviewers met for a training session at the beginning of Summer 2016. After reviewing the AAC&U’s Intercultural Knowledge and Competence VALUE Rubric, reviewers reviewed student artifacts collected for diversity assessment from previous years. This training provided raters the opportunity to ask questions and discuss any concerns. Two teams, each composed of two raters, reviewed the 2016 artifacts independently. Each artifact received a score from 1 to 4, with 1 being the lowest possible score, and 4 being the highest possible score. Reviewers also scored the artifacts on four sub-scales: conceptual understanding; values diversity; knowledge of historical context; and sources of understanding, value, and knowledge. After the teams rated the artifacts, the team facilitator reviewed the scores. Artifacts on which the reviewers differed by more than one point were discussed as a group. The facilitator attempted to bring the reviewers to a consensus; if there could not be an

General Education Assessment: 2016 9
agreement, the facilitator scored the artifact in question. Estimates of inter-rater reliability are provided in Table 9. Table 2. Inter-Rater Reliabilities
Team 1 Team 2 Method* Value SE C.I. Value SE C.I
AC1 0.08 0.07 0.00 to 0.22 0.86 0.04 0.76 to 0.95
Kappa -0.13 0.09 -0.30 to 0.05 0.81 0.06 0.68 to 0.92
PI -0.17 0.07 -0.30 to -0.03 0.80 0.06 0.68 to 0.92
BP 0.03 0.07 -0.10 to 0.17 0.85 0.05 0.75 to 0.94
Note: *AC1 – Gwet’s AC1, Kappa – Cohen’s kappa, PI – Scott’s pi, BP – Brenann-Prediger coefficient
There are numerous ways to evaluate the adequacy of reliability estimates. Guidelines proposed by Altman (1991) are provided below:
< .20 = Slight Agreement .21 to .40 = Fair Agreement .41 to .60 = Moderate Agreement .61 to .80 = Good Agreement .81 to 1.00 = Very Good
These guidelines indicate that Team 2 had “Good” to “Very Good” levels of agreement; however, Team 1 had no agreement. Furthermore, there was no pattern to the disagreement—that is, one rater did not score consistently higher than the other rater. Artifacts from the team with poor agreement were not used in statistical analysis. Table 6 below provides a historical overview of demographic characteristics of students whose writing was evaluated during the Diversity assessment process from 2007 to 2016. Table 7 provides Diversity artifact score information for 2016. In 2016, OSU moved from the previously-used institutional rubric to the AAC&U’s Intercultural Knowledge and Competence VALUE Rubric. The VALUE rubric is scored on a 1-4 scale, which is different than the previous rubric scale of 1-5. Therefore, it is not possible to directly compare this year’s scores to previous years.

General Education Assessment: 2016 10
Table 3. Student Demographics Associated with Diversity Artifacts, 2007 – 2016
2007-2013
2016
Combined
# of (% of total)
# of artifacts (% of total)
# of artifacts (% of total)
Class Freshman 45 (9.6%)
24 (32.8%)
69 (12.6%) Sophomore 118 (25.1%) 8 (10.9%) 126 (23.2%) Junior 162 (34.4%) 24 (32.8%) 186 (34.1%) Senior 146 (31.0%) 17 (23.2%) 163 (29.9%) Total N=471 N=73 N=544
College* CAS 181 (38.4%)
27 (36.9%)
208 (38.1%) CASNR 28 (5.9%) 22 (30.1%) 50 (9.1%) SSB 28 (5.9%) 9 (12.3%) 37 (6.7%) COE 100 (20.7%) 4 (5.4%) 104 (19.0%) CEAT 50 (10.6%) 3 (4.10%) 53 (9.7%) COHS 51 (10.8%) 5 (6.8%) 56 (10.2%) UC 35 (7.4%) 3 (4.1%) 38 (6.9%) Total N=473 N=73 N=546
Gender Male 216 (45.9%)
48 (65.7%)
264 (48.5%) Female 255 (54.1%) 25 (34.2%) 284 (51.5%) Total N=471 N=73 N=544
Admit Type Regular (A, AR, L) 288 (59.9%)
49 (67.1%)
337 (60.8%) Alternative Admit (F) 31 (6.4%) 0 (0%) 55 (9.9%) Adult Admit (G) 0 (0%) 0 (0%) 0 (0%) International (J) 5 (1.0%) 0 (0%) 5 (0.9%) Transfer (M, MR) 143 (29.7%) 24 (32.9%) 143 (25.8%)) Other or Blank 14 (2.9%) 0 14 (2.5%) Total N=481 N=73 N=554
ACT <22 115 (31.8%)
32 (43.8%) 147 (33.8%) 22 to 24 108 (29.8%) 10 (13.6%) 118 (27.1%) 25 to 27 67 (18.5%) 11 (15.1%) 78 (17.9%) 28 to 30 42 (11.6%) 16 (21.9%) 58 (13.3%) >30 30 (8.3%) 4 (5.5%) 34 (7.8%) Total N=362 N=73 N=435
OSU GPA
<2.0 28 (5.9%)
2 (2.7%)
30 (5.4%) 2.0 to 2.49 70 (14.9%) 3 (4.1%) 73 (13.1%) 2.50 to 2.99 118 (25.1%) 15 (20.5%) 133 (23.9%) 3.00 to 3.49 126 (26.6%) 19 (26.0%) 145 (26.1%) 3.50 to 4.00 130 (27.6%) 34 (46.5%) 164 (29.6%) Missing 10 (2.1%) 0 (0%) 10 (1.8%) Total N=482 N=73 N=555
Note: The numbers presented in this table represent students for which demographic information was available. Sum totals for each category/column/row vary according to the information available. *CAS – College of Arts and Sciences; CASNR – College of Agricultural Sciences and Natural Resources; SSB – Spears School of Business; COE – College of Education; CEAT – College of Engineering, Architecture and Technology; COHS – College of Human Sciences; UC – University College

General Education Assessment: 2016 11
Table 4. Diversity Artifact Scores, 2016
SCORE n (%)
1 2 3 4 N Overall 6 (8.21%) 33 (45.20%) 29 (39.72)) 5 (6.85%) 73
Class
Freshman
2 (8.33%) 11 (45.83%) 9 (37.5%) 2 (8.33%)
24 Sophomore 1 (12.5%) 3 (37.5%) 3 (37.5%) 1 (12.5%) 8
Junior 1 (4.16%) 10 (41.66%) 11 (45.83%) 2 (8.33%) 24 Senior 2 (11.76%) 9 (52.94%) 6 (35.29%) 0 17
College*
CAS
3 (11.11%) 14 (51.85%) 9 (33.33%) 1 (3.70%)
27 CASNR 0 (0%) 8 (36.36%) 12 (54.54%) 2 (9.09%) 22
SSB 1 (11.11%) 4 (44.44%) 3 (33.33%) 1 (11.11%) 9 COE 0 (0%) 0 2 (50%) 2 (50%) 4 CEAT 2 (66.66%) 1 (33.33%) 0 0 3 COHS 0 (0%) 2 (40%) 3 (60%) 0 5
UC 0 (0%) 2 (66.66%) 0 1 (33.33%) 3
Gender Male
2 (4.16%) 21 (43.75%) 21 (43.75%) 4 (8.33%)
48
Female 4 (16%) 12 (48%) 8 (32%) 1 (4%) 25 Note: *CAS – College of Arts and Sciences; CASNR – College of Agricultural Sciences and Natural Resources; SSB – Spears School of Business; COE – College of Education; CEAT – College of Engineering, Architecture and Technology; COHS – College of Human Sciences; UC – University College

General Education Assessment: 2016 12
Key Findings, Global Perspectives Inventory The Global Perspectives Inventory (GPI) was administered in the fall of 2015 to first-year students, and in the fall of 2016 to first-year and fourth-year students. The original plan was to administer the GPI to first-year and fourth-year students in the fall of 2015 only; due to an error by Iowa State University (distributers of the survey), only the first-year students were surveyed in 2015, so the Inventory was administered a second time in the fall of 2016. The New Student form was administered to first-year students, and the General form was administered to fourth-year students. The GPI comprises three dimensions, each of which contains two scales, all collected on a five-point Likert scale (1-Strongly Disagree to 5-Strongly Agree). Tables 1 through 3 provide comparisons of OSU mean scores to national norms, by scale. The full reports, including student demographic information, are provided in Appendices A1-A3. Table 5. Fall 2015 New Student (First-Year) GPI Scores
Dimension Scale OSU Mean (SD) National Mean (SD) Cognitive Cognitive Knowing 3.50 (0.46) 3.39 (0.51) Cognitive Knowledge 3.58 (0.64) 3.60 (0.61) Intrapersonal Intrapersonal Affect 4.12 (0.61) 4.07 (0.53) Intrapersonal Identity 4.12 (0.48) 4.04 (0.51) Interpersonal Interpersonal Social Responsibility 3.73 (0.64) 3.71 (0.57) Interpersonal Social Interaction 3.30 (0.79) 3.31 (0.71) OSU n = 76
Table 6. Fall 2016 New Student (First-Year) GPI Scores
Dimension Scale OSU Mean (SD) National Mean (SD) Cognitive Cognitive Knowing 3.44 (0.51) 3.39 (0.51) Cognitive Knowledge 3.62 (0.61) 3.60 (0.61) Intrapersonal Intrapersonal Affect 4.07 (0.58) 4.07 (0.53) Intrapersonal Identity 4.03 (0.56) 4.04 (0.51) Interpersonal Interpersonal Social Responsibility 3.70 (0.63) 3.71 (0.57) Interpersonal Social Interaction 3.39 (0.80) 3.31 (0.71) OSU n = 66

General Education Assessment: 2016 13
Table 7. Fall 2016 Genera (Fourth-Year) GPI Scores
Dimension Scale OSU Mean (SD) National Mean (SD) Cognitive Cognitive Knowing 3.65 (0.49) 3.57 (0.55) Cognitive Knowledge 3.64 (0.74) 3.76 (0.59) Intrapersonal Intrapersonal Affect 4.26 (0.47) 4.17 (0.50) Intrapersonal Identity 4.06 (0.54) 4.11 (0.50) Interpersonal Interpersonal Social Responsibility 3.64 (0.62) 3.74 (0.60) Interpersonal Social Interaction 3.42 (0.77) 3.34 (0.75) OSU n = 52
In general, OSU scores are comparable with national means across the scales. The fall 2016 General scores (fourth-year students) were notably lower on the Cognitive Knowledge and Interpersonal Social Responsibility scales.

General Education Assessment: 2016 14
Key Findings, Photovoice Project During the 2015-2016 academic year, a team of faculty and administrators conducted a Photovoice study to assess student learning regarding diversity. Fifteen students provided 55 photos on this topic and met in five separate focus groups to discuss the photos they took along with their personal experiences with diversity in and out of the classroom. Six themes emerged from the photograph and focus group data: Course Quality, the OSU Experience, Spaces and Places, Grouping, Responsibility, and Hesitation. Students provided rich data concerning the things they learned about diversity in and out of the classroom during their time as an OSU student. Students affirmed positive learning experiences as well as some negative experiences connected to diversity both in and out of the classroom. Appendix B Comprises the full Photovoice report.

General Education Assessment: 2016 15
Use of Results and Future Plans There was a joint meeting on March 3, 2017, of the three committees or councils that share primary responsibility for the General Education program: Assessment and Academic Improvement Council (AAIC), General Education Advisory Council (GEAC), and the Committee for the Assessment of General Education (CAGE). The primary purpose of this meeting is to discuss the contents of this annual report specifically, and to also discuss the broader implications and directions of assessment at OSU more generally. Discussion and planning continued to the April 7, 2017 meeting of AAIC, which resulted in the following: Suggestions by the Photovoice researchers
Ensure all instructors of ‘D’ and ‘I’ courses have reviewed the rubric used for
assessment of ‘D’ and ‘I’ courses in order to help provide guidance on the types of assessments that will be most beneficial for university-level assessment of student learning.
Ensure that instructors of these courses have all undergone training. Revise the goals and guidelines of ‘D’ and ‘I’ courses to align them with the university
diversity statement and to create goals and assessments that encourage a consistent experience, such as guaranteeing experiential learning and purposeful interactions. Creating a common writing product (such as creating a personal statement or definition of diversity, or writing about positionality, self-awareness, or exploration of diversity issues) across ‘D’ courses, could be helpful in assuring the effectiveness of these courses and facilitate assessment of what students are learning about diversity issues.
Provide guidelines for the types of assessments that best facilitate learning of the ‘D’ outcomes so that instructors have clear statements for what students should be able to articulate or answer after taking a ‘D’ course. This is vital for helping instructors and students understand the purpose of the course and the types of assignments to give or expect in these courses.

Appendices
Appendix A1: GPI – Fall 2015 New (First-Year) Student Report
General Education Assessment: 2016 16
Oklahoma State
Fall 2015 Report
(New Report Version – Corrected) Global Perspective Inventory New Student Report
(Reproduced) January 2017

General Education Assessment: 2016 17
Introduction
Thank you for participating in the Global Perspective Inventory (GPI). The Research Institute for Studies in
Education (RISE) at Iowa State University would like to express our appreciation for your support, interest, and
participation in the GPI.
The GPI assesses a global and holistic view of student learning and development and the importance of the campus
environment in fostering holistic student development. The GPI measures how students think; view themselves as
people with cultural heritage; and relate to others from other cultures, backgrounds, and values. Your involvement,
along with the involvement of other institutions, allows us to not only provide data for institutional improvement,
but also continue exploration into interventions and strategies that will inform a national conversation on ways to
strengthen global learning. The data in this report allow your campus to make empirically-informed decisions and
improve your students' learning; the research emerging from this project informs good practice for the development
of a global perspective for students.
Along with this report, your institution receives a student dataset that can be used to contribute to understanding how
experiences vary within and across groups, analyzing assets and gaps in curricular and co-curricular offerings,
confirming or challenging existing beliefs about student experience, making decisions about resources and future
areas of work, and enhancing the educational experience of students.
Again, we thank you for your participation in this study, and we encourage your future involvement with the GPI. If
you have any questions, please contact the RISE office at (515) 294-6234 or email ([email protected]).
Sincerely,
Robert D. Reason
Professor of Education
Iowa State University

General Education Assessment: 2016 18
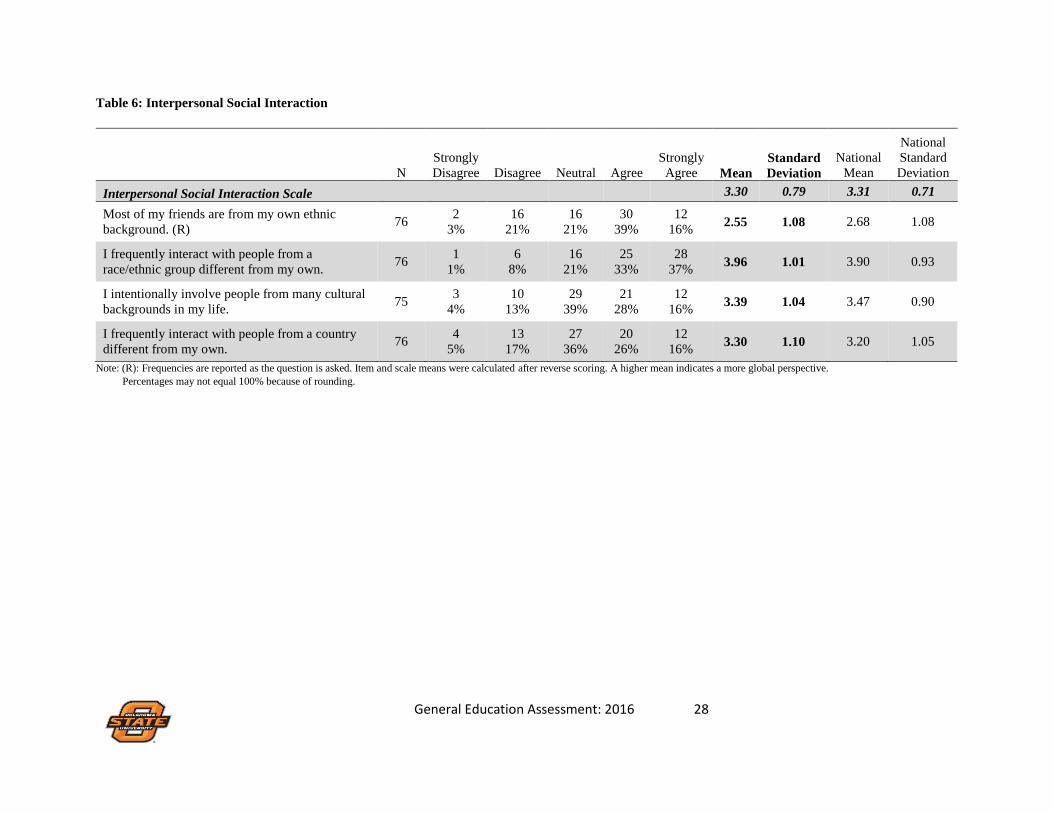
Table of Contents
Respondent Characteristics................................................................................................... ................................... 4
Respondent Characteristics (cont.).......................................................................................................................... 5
Global Perspective Inventory Scales.......................................................................................... ................................. 6
Table 1: Cognitive Knowing............................................................................................................. ....................... 8
Table 2: Cognitive Knowledge............................................................................ .................................................... 9
Table 3: Intrapersonal Affect................................................................................................ ................................. 10
Table 4: Intrapersonal Identity..................................................................................................................... .......... 11
Table 5: Interpersonal Social Responsibility........................................................................ ................................. 12
Table 6: Interpersonal Social Interaction.................................................................................... ........................... 13
Table 7: Items Not Corresponding to a Scale........................................................................................................ 14
New Student Form Questions................................................................................................... ................................. 15
Table 8: High School Course Enrollment....................................................................................... ....................... 16
Table 9: Participation in Planned Events in High School...................................................................................... 17
Table 10: Student Initiated Involvement in High School....................................................................... ............... 18

General Education Assessment: 2016 19
Respondent Characteristics
N Percent
Gender
Male 27 36
Female 46 61
Transgender/Gender nonconforming 2 3
Rather Not Say 0 0
Total 75
Class Year
First Year 73 97
Sophomore 2 3
Junior 0 0
Senior 0 0
Graduate Student 0 0
Total 75
Race
American Indian 6 8
Asian American/Asian 1 1
African-American/Black 2 3
Hispanic/Latino 8 11
Native Hawaiian/Pacific Islander 0 0
White/Caucasian 47 62
Multiracial 12 16
Total 76
American/International Student
American student at an American college/university 70 92
Non-American student at an American college/university 5 7
Other 1 1
Total 76

General Education Assessment: 2016 20
Respondent Characteristics (cont.)
N Percent
Parental Education
Less than high school 4 5
High school graduate 15 20
Some college 11 14
Associate's degree 6 8
Bachelor's degree 21 28
Some graduate school 1 1
Graduate degree (Master's, Doctorate, MD, JD, etc) 17 22
Do not know 1 1
Total 76
Major Category
Agriculture and Natural Resources 7 9
Art and Humanities 3 4
Business 13 17
Communications or Journalism 2 3
Education or Social Work 5 7
Engineering 15 20
Health and Medical Professions 8 11
Physical Sciences, Biological Sciences, or Mathematics 9 12
Social Science 2 3
Other Field 11 15
Total 75
Did you begin college at this institution?
Yes 69 91
No 7 9
Total 76

General Education Assessment: 2016 21
Global Perspective Inventory Scales

General Education Assessment: 2016 22
GPI Scales
The GPI measures global learning across three dimensions: cognitive, intrapersonal, and interpersonal.
Cognitive Dimension. One's knowledge and understanding of what is true and important to know. From a global
perspective taking viewpoint, it includes viewing knowledge and knowing with greater complexity and taking into
account multiple cultural perspectives. Reliance on external authorities to have absolute truth gives way to
commitment in relativism when making commitments within the context of uncertainty.
Knowing Scale. Degree of complexity of one's views of the importance of cultural context in judging what
is important to know and value.
Knowledge Scale. Degree of understanding and awareness of various cultures and their impact on our
global society and level of proficiency in more than one language.
Intrapersonal Dimension. Intrapersonal development focuses on one becoming more aware of and integrating
one's personal values and self-identity into one's personhood. From a global perspective taking viewpoint, it reflects
one's sense of self-direction and purpose in one's life, becoming more self-aware of one's strengths, values, and
personal characteristics and sense of self, and viewing one's development in terms of one's self-identity. It
incorporates different and often conflicting ideas about who one is living in an increasingly multicultural world.
Identity Scale. Level of awareness of one's unique identity and degree of acceptance of one's ethnic, racial,
and gender dimensions of one's identity.
Affect Scale. Level of respect for and acceptance of cultural perspectives different from one's own and
degree of emotional confidence when living in complex situations, which reflects an 'emotional
intelligence' that is important in one's processing encounters with other cultures.
Interpersonal Dimension. Interpersonal development focuses on one willingness to interact with persons with
different social norms and cultural backgrounds, acceptance of others, and being comfortable when relating to
others. From a global perspective taking viewpoint, it includes being able to view others differently and relating to
others in terms of moving from dependency to independence to interdependence, which is considered the most
mature perspective in effectively living in a global society.
Social Responsibility Scale. Level of interdependence and social concern for others.
Social Interaction Scale. Degree of engagement with others who are different from oneself and degree of
cultural sensitivity in living in pluralistic settings.
National Norms. For the purposes of this report, all national norms are calculated using data collected from the GPI
New Student form since 2015 (n = 4017).

General Education Assessment: 2016 23
Table 1: Cognitive Knowing
N
Strongly
Disagree Disagree Neutral Agree
Strongly
Agree Mean
Standard
Deviation
National
Mean
National
Standard
Deviation
Cognitive Knowing Scale 3.50 0.46 3.39 0.51
When I notice cultural differences, my culture
tends to have the better approach. (R) 75
2
3%
14
19%
37
49%
16
21%
6
8% 2.87 0.91 2.91 0.88
Some people have culture and others do not. 76 25
33%
26
34%
13
17%
11
14%
1
1% 3.83 1.09 3.53 1.13
In different setting what is right and wrong is
simple to determine. (R) 76
5
7%
14
18%
20
26%
21
28%
16
21% 2.62 1.20 2.75 1.09
I take into account different perspectives before
drawing conclusions about the world around me. 75
0
0%
1
1%
15
20%
41
55%
18
24% 4.01 0.71 4.01 0.71
I consider different cultural perspectives when
evaluating global problems. 75
0
0%
4
5%
19
25%
37
49%
15
20% 3.84 0.81 3.77 0.79
I rely primarily on authorities to determine what
is true in the world. (R) 76
19
25%
22
29%
26
34%
9
12%
0
0% 3.67 0.99 3.38 0.99
I rarely question what I have been taught about
the world around me. (R) 76
19
25%
27
36%
16
21%
12
16%
2
3% 3.64 1.10 3.41 1.05
Note: (R): Frequencies are reported as the question is asked. Item and scale means were calculated after reverse scoring. A higher mean indicates more global perspective.
Percentages may not equal 100% because of rounding.

General Education Assessment: 2016 24
Table 2: Cognitive Knowledge
N
Strongly
Disagree Disagree Neutral Agree
Strongly
Agree Mean
Standard
Deviation
National
Mean
National
Standard
Deviation
Cognitive Knowledge Scale 3.58 0.64 3.60 0.61
I am informed of current issues that impact
international relations. 76
1
1%
13
17%
21
28%
29
38%
12
16% 3.50 1.00 3.48 0.93
I understand the reasons and causes of conflict
among nations of different cultures. 76
1
1%
12
16%
18
24%
34
45%
11
14% 3.55 0.97 3.64 0.83
I understand how various cultures of this world
interact socially. 76
0
0%
8
11%
28
37%
31
41%
9
12% 3.54 0.84 3.68 0.81
I know how to analyze the basic characteristics of
a culture. 76
1
1%
3
4%
29
38%
38
50%
5
7% 3.57 0.74 3.53 0.79
I can discuss cultural differences from an
informed perspective. 76
2
3%
3
4%
24
32%
30
39%
17
22% 3.75 0.94 3.68 0.84
Note: (R): Frequencies are reported as the question is asked. Item and scale means were calculated after reverse scoring. A higher mean indicates a more global perspective.
Percentages may not equal 100% because of rounding.

General Education Assessment: 2016 25
Table 3: Intrapersonal Affect
N
Strongly
Disagree Disagree Neutral Agree
Strongly
Agree Mean
Standard
Deviation
National
Mean
National
Standard
Deviation
Intrapersonal Affect Scale 4.12 0.61 4.07 0.53
I am sensitive to those who are discriminated
against. 76
1
1%
5
7%
13
17%
28
37%
29
0% 4.04 0.97 4.00 0.80
I do not feel threatened emotionally when
presented with multiple perspectives. 76
4
5%
4
5%
7
9%
35
46%
26
34% 3.99 1.06 3.96 0.80
I am accepting of people with different religious
and spiritual traditions. 76
1
1%
0
0%
8
11%
28
37%
39
51% 4.37 0.78 4.31 0.70
I enjoy when my friends from other cultures teach
me about our cultural differences. 76
0
0%
1
1%
16
21%
28
37%
31
41% 4.17 0.81 4.13 0.74
I am open to people who strive to live lives very
different from my own life style. 75
0
0%
2
3%
16
21%
34
45%
23
31% 4.04 0.80 3.97 0.74
Note: (R): Frequencies are reported as the question is asked. Item and scale means were calculated after reverse scoring. A higher mean indicates a more global perspective.
Percentages may not equal 100% because of rounding.

General Education Assessment: 2016 26
Table 4: Intrapersonal Identity
N
Strongly
Disagree Disagree Neutral Agree
Strongly
Agree Mean
Standard
Deviation
National
Mean
National
Standard
Deviation
Intrapersonal Identity Scale 4.12 0.48 4.04 0.51
I have a definite purpose in my life. 76 0
0%
5
7%
10
13%
28
37%
33
43% 4.17 0.90 4.14 0.85
I can explain my personal values to people who
are different from me. 76
0
0%
0
0%
4
5%
36
47%
36
47% 4.42 0.59 4.20 0.69
I know who I am as a person. 75 0
0%
4
5%
7
9%
39
52%
25
33% 4.13 0.79 4.08 0.80
I am willing to defend my own views when they
differ from others. 76
0
0%
5
7%
11
14%
39
51%
21
28% 4.00 0.83 4.00 0.75
I put my beliefs into action by standing up for my
principles. 76
0
0%
2
3%
15
20%
41
54%
18
24% 3.99 0.74 3.96 0.71
I am developing a meaningful philosophy of life. 76 1
1%
3
4%
17
22%
26
34%
29
38% 4.04 0.94 3.85 0.81
Note: (R): Frequencies are reported as the question is asked. Item and scale means were calculated after reverse scoring. A higher mean indicates a more global perspective.
Percentages may not equal 100% because of rounding.

General Education Assessment: 2016 27
Table 5: Interpersonal Social Responsibility
N
Strongly
Disagree Disagree Neutral Agree
Strongly
Agree Mean
Standard
Deviation
National
Mean
National
Standard
Deviation
Interpersonal Social Responsibility Scale 3.73 0.64 3.71 0.57
I think of my life in terms of giving back to
society. 76
0
0%
5
7%
25
33%
33
43%
13
17% 3.71 0.83 3.67 0.84
I work for the rights of others. 76 0
0%
10
13%
27
36%
23
30%
16
21% 3.59 0.97 3.63 0.80
I put the needs of others about my own personal
wants. 76
1
1%
6
8%
20
26%
30
39%
19
25% 3.79 0.96 3.78 0.84
I consciously behave in terms of making a
difference. 76
1
1%
4
5%
30
39%
25
33%
16
21% 3.67 0.91 3.75 0.74
Volunteering is not an important priority in my
life. (R) 76
25
33%
27
36%
18
24%
4
5%
2
3% 3.91 1.01 3.71 1.02
Note: (R): Frequencies are reported as the question is asked. Item and scale means were calculated after reverse scoring. A higher mean indicates a more global perspective.
Percentages may not equal 100% because of rounding.
General Education Assessment: 2016 28
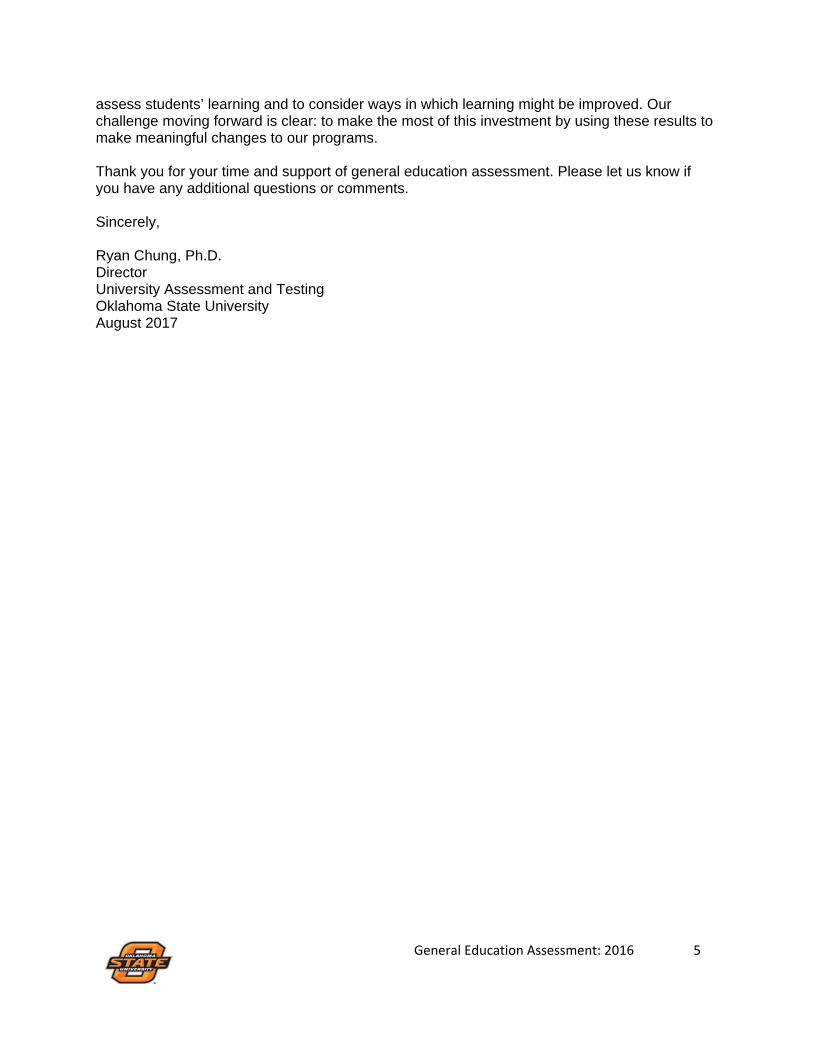
Table 6: Interpersonal Social Interaction
N
Strongly
Disagree Disagree Neutral Agree
Strongly
Agree Mean
Standard
Deviation
National
Mean
National
Standard
Deviation
Interpersonal Social Interaction Scale 3.30 0.79 3.31 0.71
Most of my friends are from my own ethnic
background. (R) 76
2
3%
16
21%
16
21%
30
39%
12
16% 2.55 1.08 2.68 1.08
I frequently interact with people from a
race/ethnic group different from my own. 76
1
1%
6
8%
16
21%
25
33%
28
37% 3.96 1.01 3.90 0.93
I intentionally involve people from many cultural
backgrounds in my life. 75
3
4%
10
13%
29
39%
21
28%
12
16% 3.39 1.04 3.47 0.90
I frequently interact with people from a country
different from my own. 76
4
5%
13
17%
27
36%
20
26%
12
16% 3.30 1.10 3.20 1.05
Note: (R): Frequencies are reported as the question is asked. Item and scale means were calculated after reverse scoring. A higher mean indicates a more global perspective.
Percentages may not equal 100% because of rounding.

General Education Assessment: 2016 29
Table 7: Items Not Corresponding to a Scale
N
Strongly
Disagree Disagree Neutral Agree
Strongly
Agree Mean
Standard
Deviation
National
Mean
National
Standard
Deviation
I feel threatened around people from backgrounds
different from my own. (R) 76
33
43%
29
38%
12
16%
2
3%
0
0% 4.22 0.81 4.10 0.84
I often get out of my comfort zone to better
understand myself. 76
4
5%
12
16%
24
32%
26
34%
10
13% 3.34 1.07 3.34 0.96
I see myself as a global citizen. 76 1
1%
8
11%
29
38%
23
30%
15
20% 3.57 0.97 3.64 0.87
Note: (R): Frequencies are reported as the question is asked. Item and scale means were calculated after reverse scoring. A higher mean indicates a more global perspective.
Percentages may not equal 100% because of rounding.

General Education Assessment: 2016 30
New Student Form Questions

General Education Assessment: 2016 31
Table 8: High School Course Enrollment
In high school, how many courses have you taken in the area listed below?
N 0 1 2 3 4 5+
Multicultural course addressing issues of race, ethnicity, gender, class, religion,
or sexual orientation. 75
37
49%
20
27%
12
16%
5
7%
1
1%
0
0%
Foreign language course. 75 18
24%
7
9%
29
39%
9
12%
9
12%
3
4%
World history course. 75 0
0%
33
44%
25
33%
8
11%
6
8%
3
4%
Service learning course. 74 52
70%
11
15%
7
9%
2
3%
2
3%
0
0%
Course focused on significant global/international issues and problems. 75 34
45%
27
36%
9
12%
4
5%
1
1%
0
0%
Course that included opportunities for intensive dialogue among students from
different backgrounds and beliefs. 75
51
68%
11
15%
8
11%
3
4%
1
1%
1
1%
Note: Percentages may not equal 100% because of rounding.

General Education Assessment: 2016 32
Table 9: Participation in Planned Events in High School
In high school, how often have you participated in the following?
N Never Rarely Sometimes Often
Very
Often Mean
Standard
Deviation
National
Mean
National
Standard
Deviation
Events or activities sponsored by groups
reflecting your own cultural heritage. 68
0
0%
21
31%
14
21%
19
28%
14
21% 2.63 1.32 1.53 1.29
Events or activities sponsored by groups
reflecting a cultural heritage different from your
own.
75 0
0%
31
41%
14
19%
22
29%
8
11% 2.09 1.07 1.25 1.08
Religious or spiritual activities. 62 0
0%
25
40%
9
15%
14
23%
14
23% 2.75 1.52 1.73 1.45
Leadership programs that stress collaboration and
team work. 52
0
0%
5
10%
6
12%
24
46%
17
33% 3.63 1.19 2.42 1.26
Community service activities unrelated to a
course. 51
0
0%
5
10%
4
8%
22
43%
20
39% 3.72 1.17 2.52 1.20
Attended a lecture, workshop, or campus
discussion on international or global issues. 75
0
0%
39
52%
18
24%
14
19%
4
5% 1.77 0.94 0.89 1.07
Note: Percentages may not equal 100% because of rounding.

General Education Assessment: 2016 33
Table 10: Student Initiated Involvement in High School
In high school, how often have you participated in the following?
N Never Rarely Sometimes Often
Very
Often Mean
Standard
Deviation
National
Mean
National
Standard
Deviation
Read a newspaper or news magazine (online or in
print). 57
0
0%
7
12%
11
19%
21
37%
18
32% 3.39 1.26 2.12 1.15
Watched news program on television. 57 0
0%
7
12%
8
14%
18
32%
24
42% 3.51 1.23 2.26 1.10
Followed an international event/crisis (through a
newspaper, social media, or other media sources). 56
0
0%
5
9%
9
16%
15
27%
27
48% 3.61 1.18 2.24 1.15
Discussed current events with other students. 66 0
0%
3
5%
4
6%
23
35%
36
55% 3.59 0.92 2.47 1.03
Interacted with students from a country different
from your own. 66
0
0%
7
11%
23
35%
26
39%
10
15% 2.88 1.14 2.04 1.19
Interacted with students from a race/ethnic group
different from your own. 56
0
0%
6
11%
8
14%
20
36%
22
39% 3.53 1.21 2.70 1.09
Note: Percentages may not equal 100% because of rounding.

General Education Assessment: 2016 34
The Global Perspective Inventory was originally housed at The Global Perspective Institute, Inc., which was
established in 2008 to study and promote global holistic human development among college students. The Global
Perspective Inventory was hosted by Central College in Pella, IA under the direction of Larry Braskamp until 2015
when Iowa State began hosting the GPI.

Appendix A2: GPI – Fall 2016 New (First-Year) Student Report
General Education Assessment: 2016 35
Oklahoma State
Global Perspective Inventory New Student Report
(Sent to 1000 First-Year Students in Fall 2016)
January 2017

General Education Assessment: 2016 36
Introduction
Thank you for participating in the Global Perspective Inventory (GPI). The Research Institute for Studies in
Education (RISE) at Iowa State University would like to express our appreciation for your support, interest, and
participation in the GPI.
The GPI assesses a global and holistic view of student learning and development and the importance of the campus
environment in fostering holistic student development. The GPI measures how students think; view themselves as
people with cultural heritage; and relate to others from other cultures, backgrounds, and values. Your involvement,
along with the involvement of other institutions, allows us to not only provide data for institutional improvement,
but also continue exploration into interventions and strategies that will inform a national conversation on ways to
strengthen global learning. The data in this report allow your campus to make empirically-informed decisions and
improve your students' learning; the research emerging from this project informs good practice for the development
of a global perspective for students.
Along with this report, your institution receives a student dataset that can be used to contribute to understanding how
experiences vary within and across groups, analyzing assets and gaps in curricular and co-curricular offerings,
confirming or challenging existing beliefs about student experience, making decisions about resources and future
areas of work, and enhancing the educational experience of students.
Again, we thank you for your participation in this study, and we encourage your future involvement with the GPI. If
you have any questions, please contact the RISE office at (515) 294-6234 or email ([email protected]).
Sincerely,
Robert D. Reason
Professor of Education
Iowa State University
General Education Assessment: 2016 37
Table of Contents
Respondent Characteristics................................................................................................... ................................... 4
Respondent Characteristics (cont.).......................................................................................................................... 5
Global Perspective Inventory Scales.......................................................................................... ................................. 6
Table 1: Cognitive Knowing................................................................................................................. ................... 8
Table 2: Cognitive Knowledge................................................................................................................................ 9
Table 3: Intrapersonal Affect................................................................................................ ................................. 10
Table 4: Intrapersonal Identity..................................................................................................................... .......... 11
Table 5: Interpersonal Social Responsibility........................................................................ ................................. 12
Table 6: Interpersonal Social Interaction.................................................................................... ........................... 13
Table 7: Items Not Corresponding to a Scale........................................................................................................ 14
New Student Form Questions................................................................................................... ................................. 15
Table 8: High School Course Enrollment......................................................................................... ..................... 16
Table 9: Participation in Planned Events in High School...................................................................................... 17
Table 10: Student Initiated Involvement in High School....................................................................... ............... 18

General Education Assessment: 2016 38
Respondent Characteristics
N Percent
Gender
Male 24 36
Female 42 64
Transgender/Gender nonconforming 0 0
Rather Not Say 0 0
Total 66
Class Year
First Year 65 98
Sophomore 1 2
Junior 0 0
Senior 0 0
Graduate Student 0 0
Total 66
Race
American Indian 3 5
Asian American/Asian 2 3
African-American/Black 0 0
Hispanic/Latino 4 6
Native Hawaiian/Pacific Islander 0 0
White/Caucasian 47 72
Multiracial 9 14
Total 65
American/International Student
American student at an American college/university 62 94
Non-American student at an American college/university 3 5
Other 1 2
Total 66

General Education Assessment: 2016 39
Respondent Characteristics (cont.)
N Percent
Parental Education
Less than high school 1 2
High school graduate 8 12
Some college 8 12
Associate's degree 4 6
Bachelor's degree 22 33
Some graduate school 2 3
Graduate degree (Master's, Doctorate, MD, JD, etc) 20 30
Do not know 1 2
Total 66
Major Category
Agriculture and Natural Resources 7 11
Art and Humanities 6 9
Business 14 21
Communications or Journalism 0 0
Education or Social Work 3 5
Engineering 14 21
Health and Medical Professions 8 12
Physical Sciences, Biological Sciences, or Mathematics 2 3
Social Science 3 5
Other Field 9 14
Total 66
Did you begin college at this institution?
Yes 63 95
No 3 5
Total 66

General Education Assessment: 2016 40
Global Perspective Inventory Scales

General Education Assessment: 2016 41
GPI Scales
The GPI measures global learning across three dimensions: cognitive, intrapersonal, and interpersonal.
Cognitive Dimension. One's knowledge and understanding of what is true and important to know. From a global
perspective taking viewpoint, it includes viewing knowledge and knowing with greater complexity and taking into
account multiple cultural perspectives. Reliance on external authorities to have absolute truth gives way to
commitment in relativism when making commitments within the context of uncertainty.
Knowing Scale. Degree of complexity of one's views of the importance of cultural context in judging what
is important to know and value.
Knowledge Scale. Degree of understanding and awareness of various cultures and their impact on our
global society and level of proficiency in more than one language.
Intrapersonal Dimension. Intrapersonal development focuses on one becoming more aware of and integrating
one's personal values and self-identity into one's personhood. From a global perspective taking viewpoint, it reflects
one's sense of self-direction and purpose in one's life, becoming more self-aware of one's strengths, values, and
personal characteristics and sense of self, and viewing one's development in terms of one's self-identity. It
incorporates different and often conflicting ideas about who one is living in an increasingly multicultural world.
Identity Scale. Level of awareness of one's unique identity and degree of acceptance of one's ethnic, racial,
and gender dimensions of one's identity.
Affect Scale. Level of respect for and acceptance of cultural perspectives different from one's own and
degree of emotional confidence when living in complex situations, which reflects an 'emotional
intelligence' that is important in one's processing encounters with other cultures.
Interpersonal Dimension. Interpersonal development focuses on one willingness to interact with persons with
different social norms and cultural backgrounds, acceptance of others, and being comfortable when relating to
others. From a global perspective taking viewpoint, it includes being able to view others differently and relating to
others in terms of moving from dependency to independence to interdependence, which is considered the most
mature perspective in effectively living in a global society.
Social Responsibility Scale. Level of interdependence and social concern for others.
Social Interaction Scale. Degree of engagement with others who are different from oneself and degree of
cultural sensitivity in living in pluralistic settings.
National Norms. For the purposes of this report, all national norms are calculated using data collected from the GPI
New Student form since 2015 (n = 4017).

General Education Assessment: 2016 42
Table 1: Cognitive Knowing
N
Strongly
Disagree Disagree Neutral Agree
Strongly
Agree Mean
Standard
Deviation
National
Mean
National
Standard
Deviation
Cognitive Knowing Scale 3.44 0.51 3.39 0.51
When I notice cultural differences, my culture
tends to have the better approach. (R) 67
0
0%
12
18%
36
54%
18
27%
1
1% 2.88 0.71 2.91 0.88
Some people have culture and others do not. 67 15
22%
26
39%
14
21%
10
15%
2
3% 3.63 1.08 3.53 1.13
In different setting what is right and wrong is
simple to determine. (R) 66
3
5%
18
27%
16
24%
19
29%
10
15% 2.77 1.15 2.75 1.09
I take into account different perspectives before
drawing conclusions about the world around me. 67
0
0%
3
4%
9
13%
40
60%
15
22% 4.00 0.74 4.01 0.71
I consider different cultural perspectives when
evaluating global problems. 67
0
0%
4
6%
21
31%
30
45%
12
18% 3.75 0.82 3.77 0.79
I rely primarily on authorities to determine what
is true in the world. (R) 67
11
16%
24
36%
20
30%
10
15%
2
3% 3.48 1.04 3.38 0.99
I rarely question what I have been taught about
the world around me. (R) 67
10
15%
29
43%
19
28%
7
10%
2
3% 3.57 0.97 3.41 1.05
Note: (R): Frequencies are reported as the question is asked. Item and scale means were calculated after reverse scoring. A higher mean indicates a more global perspective.
Percentages may not equal 100% because of rounding.

General Education Assessment: 2016 43
Table 2: Cognitive Knowledge
N
Strongly
Disagree Disagree Neutral Agree
Strongly
Agree Mean
Standard
Deviation
National
Mean
National
Standard
Deviation
Cognitive Knowledge Scale 3.62 0.61 3.60 0.61
I am informed of current issues that impact
international relations. 67
0
0%
12
18%
19
28%
27
40%
9
13% 3.49 0.94 3.48 0.93
I understand the reasons and causes of conflict
among nations of different cultures. 67
2
3%
8
12%
14
21%
36
54%
7
10% 3.57 0.94 3.64 0.83
I understand how various cultures of this world
interact socially. 67
0
0%
6
9%
17
25%
36
54%
8
12% 3.69 0.80 3.68 0.81
I know how to analyze the basic characteristics of
a culture. 67
1
1%
3
4%
26
39%
30
45%
7
10% 3.58 0.80 3.53 0.79
I can discuss cultural differences from an
informed perspective. 67
0
0%
4
6%
19
28%
33
49%
11
16% 3.76 0.80 3.68 0.84
Note: (R): Frequencies are reported as the question is asked. Item and scale means were calculated after reverse scoring. A higher mean indicates a more global perspective.
Percentages may not equal 100% because of rounding.

General Education Assessment: 2016 44
Table 3: Intrapersonal Affect
N
Strongly
Disagree Disagree Neutral Agree
Strongly
Agree Mean
Standard
Deviation
National
Mean
National
Standard
Deviation
Intrapersonal Affect Scale 4.07 0.58 4.07 0.53
I am sensitive to those who are discriminated
against. 67
2
3%
2
3%
12
18%
33
49%
18
0% 3.94 0.92 4.00 0.80
I do not feel threatened emotionally when
presented with multiple perspectives. 67
0
0%
3
4%
17
25%
28
42%
19
28% 3.94 0.85 3.96 0.80
I am accepting of people with different religious
and spiritual traditions. 67
0
0%
0
0%
6
9%
27
40%
34
51% 4.42 0.65 4.31 0.70
I enjoy when my friends from other cultures teach
me about our cultural differences. 67
0
0%
1
1%
8
12%
31
46%
27
40% 4.25 0.72 4.13 0.74
I am open to people who strive to live lives very
different from my own life style. 67
0
0%
3
4%
19
28%
33
49%
12
18% 3.81 0.78 3.97 0.74
Note: (R): Frequencies are reported as the question is asked. Item and scale means were calculated after reverse scoring. A higher mean indicates a more global perspective.
Percentages may not equal 100% because of rounding.

General Education Assessment: 2016 45
Table 4: Intrapersonal Identity
N
Strongly
Disagree Disagree Neutral Agree
Strongly
Agree Mean
Standard
Deviation
National
Mean
National
Standard
Deviation
Intrapersonal Identity Scale 4.03 0.56 4.04 0.51
I have a definite purpose in my life. 67 0
0%
7
10%
5
7%
24
36%
31
46% 4.18 0.97 4.14 0.85
I can explain my personal values to people who
are different from me. 67
0
0%
1
1%
4
6%
34
51%
28
42% 4.33 0.66 4.20 0.69
I know who I am as a person. 67 2
3%
3
4%
12
18%
31
46%
19
28% 3.93 0.96 4.08 0.80
I am willing to defend my own views when they
differ from others. 67
0
0%
5
7%
13
19%
28
42%
21
31% 3.97 0.90 4.00 0.75
I put my beliefs into action by standing up for my
principles. 67
1
1%
0
0%
14
21%
36
54%
16
24% 3.99 0.77 3.96 0.71
I am developing a meaningful philosophy of life. 67 0
0%
2
3%
23
34%
29
43%
13
19% 3.79 0.79 3.85 0.81
Note: (R): Frequencies are reported as the question is asked. Item and scale means were calculated after reverse scoring. A higher mean indicates a more global perspective.
Percentages may not equal 100% because of rounding.

General Education Assessment: 2016 46
Table 5: Interpersonal Social Responsibility
N
Strongly
Disagree Disagree Neutral Agree
Strongly
Agree Mean
Standard
Deviation
National
Mean
National
Standard
Deviation
Interpersonal Social Responsibility Scale 3.70 0.63 3.71 0.57
I think of my life in terms of giving back to
society. 67
0
0%
6
9%
26
39%
24
36%
11
16% 3.60 0.87 3.67 0.84
I work for the rights of others. 67 1
1%
3
4%
26
39%
28
42%
9
13% 3.61 0.83 3.63 0.80
I put the needs of others about my own personal
wants. 67
0
0%
4
6%
14
21%
34
51%
15
22% 3.90 0.82 3.78 0.84
I consciously behave in terms of making a
difference. 67
1
1%
5
7%
18
27%
31
46%
12
18% 3.72 0.90 3.75 0.74
Volunteering is not an important priority in my
life. (R) 67
16
24%
29
43%
11
16%
5
7%
6
9% 3.66 1.19 3.71 1.02
Note: (R): Frequencies are reported as the question is asked. Item and scale means were calculated after reverse scoring. A higher mean indicates a more global perspective.
Percentages may not equal 100% because of rounding.

General Education Assessment: 2016 47
Table 6: Interpersonal Social Interaction
N
Strongly
Disagree Disagree Neutral Agree
Strongly
Agree Mean
Standard
Deviation
National
Mean
National
Standard
Deviation
Interpersonal Social Interaction Scale 3.39 0.80 3.31 0.71
Most of my friends are from my own ethnic
background. (R) 67
3
4%
16
24%
15
22%
23
34%
10
15% 2.69 1.13 2.68 1.08
I frequently interact with people from a
race/ethnic group different from my own. 66
0
0%
7
11%
10
15%
25
38%
24
36% 4.00 0.98 3.90 0.93
I intentionally involve people from many cultural
backgrounds in my life. 67
1
1%
9
13%
25
37%
21
31%
11
16% 3.48 0.97 3.47 0.90
I frequently interact with people from a country
different from my own. 67
3
4%
11
16%
21
31%
21
31%
11
16% 3.39 1.09 3.20 1.05
Note: (R): Frequencies are reported as the question is asked. Item and scale means were calculated after reverse scoring. A higher mean indicates a more global perspective.
Percentages may not equal 100% because of rounding.

General Education Assessment: 2016 48
Table 7: Items Not Corresponding to a Scale
N
Strongly
Disagree Disagree Neutral Agree
Strongly
Agree Mean
Standard
Deviation
National
Mean
National
Standard
Deviation
I feel threatened around people from backgrounds
different from my own. (R) 67
23
34%
30
45%
9
13%
2
3%
3
4% 4.01 1.01 4.10 0.84
I often get out of my comfort zone to better
understand myself. 67
1
1%
15
22%
21
31%
22
33%
8
12% 3.31 1.00 3.34 0.96
I see myself as a global citizen. 67 3
4%
6
9%
23
34%
26
39%
9
13% 3.48 0.99 3.64 0.87
Note: (R): Frequencies are reported as the question is asked. Item and scale means were calculated after reverse scoring. A higher mean indicates a more global perspective.
Percentages may not equal 100% because of rounding.

General Education Assessment: 2016 49
New Student Form Questions

General Education Assessment: 2016 50
Table 8: High School Course Enrollment
In high school, how many courses have you taken in the area listed below?
N 0 1 2 3 4 5+
Multicultural course addressing issues of race, ethnicity, gender, class, religion,
or sexual orientation. 65
37
57%
16
25%
9
14%
2
3%
0
0%
1
2%
Foreign language course. 65 8
12%
5
8%
32
49%
11
17%
5
8%
4
6%
World history course. 65 3
5%
24
37%
17
26%
12
18%
7
11%
2
3%
Service learning course. 65 35
54%
20
31%
6
9%
1
2%
2
3%
1
2%
Course focused on significant global/international issues and problems. 65 28
43%
21
32%
13
20%
3
5%
0
0%
0
0%
Course that included opportunities for intensive dialogue among students from
different backgrounds and beliefs. 65
33
51%
15
23%
7
11%
5
8%
3
5%
2
3%
Note: Percentages may not equal 100% because of rounding.

General Education Assessment: 2016 51
Table 9: Participation in Planned Events in High School
In high school, how often have you participated in the following?
N Never Rarely Sometimes Often
Very
Often Mean
Standard
Deviation
National
Mean
National
Standard
Deviation
Events or activities sponsored by groups
reflecting your own cultural heritage. 65
15
23%
12
18%
16
25%
17
26%
5
8% 1.77 1.28 1.53 1.29
Events or activities sponsored by groups
reflecting a cultural heritage different from your
own.
64 22
34%
19
30%
17
27%
5
8%
1
2% 1.13 1.03 1.25 1.08
Religious or spiritual activities. 65 10
15%
11
17%
14
22%
10
15%
20
31% 2.29 1.45 1.73 1.45
Leadership programs that stress collaboration and
team work. 65
5
8%
3
5%
16
25%
15
23%
26
40% 2.83 1.23 2.42 1.26
Community service activities unrelated to a
course. 65
3
5%
6
9%
18
28%
18
28%
20
31% 2.71 1.14 2.52 1.20
Attended a lecture, workshop, or campus
discussion on international or global issues. 65
31
48%
20
31%
11
17%
2
3%
1
2% 0.80 0.94 0.89 1.07
Note: Percentages may not equal 100% because of rounding.
General Education Assessment: 2016 52
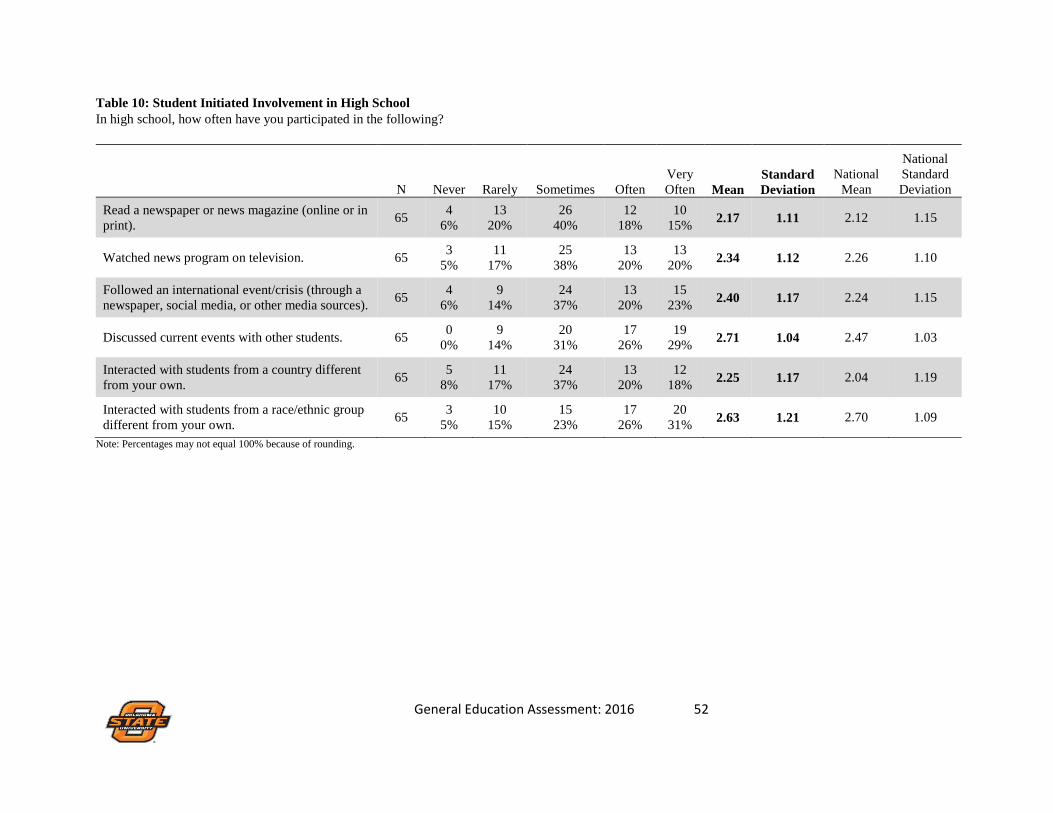
Table 10: Student Initiated Involvement in High School
In high school, how often have you participated in the following?
N Never Rarely Sometimes Often
Very
Often Mean
Standard
Deviation
National
Mean
National
Standard
Deviation
Read a newspaper or news magazine (online or in
print). 65
4
6%
13
20%
26
40%
12
18%
10
15% 2.17 1.11 2.12 1.15
Watched news program on television. 65 3
5%
11
17%
25
38%
13
20%
13
20% 2.34 1.12 2.26 1.10
Followed an international event/crisis (through a
newspaper, social media, or other media sources). 65
4
6%
9
14%
24
37%
13
20%
15
23% 2.40 1.17 2.24 1.15
Discussed current events with other students. 65 0
0%
9
14%
20
31%
17
26%
19
29% 2.71 1.04 2.47 1.03
Interacted with students from a country different
from your own. 65
5
8%
11
17%
24
37%
13
20%
12
18% 2.25 1.17 2.04 1.19
Interacted with students from a race/ethnic group
different from your own. 65
3
5%
10
15%
15
23%
17
26%
20
31% 2.63 1.21 2.70 1.09
Note: Percentages may not equal 100% because of rounding.

General Education Assessment: 2016 53
The Global Perspective Inventory was originally housed at The Global Perspective Institute, Inc., which was
established in 2008 to study and promote global holistic human development among college students. The Global
Perspective Inventory was hosted by Central College in Pella, IA under the direction of Larry Braskamp until 2015
when Iowa State began hosting the GPI.

Appendix A3: GPI – Fall 2016 General (Fourth-Year) Student Report
General Education Assessment: 2016 54
Oklahoma State
Global Perspective Inventory General Form Report
(Sent to 1000 Seniors in Fall 2016)
January 2017

General Education Assessment: 2016 55
Introduction
Thank you for participating in the Global Perspective Inventory (GPI). The Research Institute for Studies in
Education (RISE) at Iowa State University would like to express our appreciation for your support, interest, and
participation in the GPI.
The GPI assesses a global and holistic view of student learning and development and the importance of the campus
environment in fostering holistic student development. The GPI measures how students think; view themselves as
people with cultural heritage; and relate to others from other cultures, backgrounds, and values. Your involvement,
along with the involvement of other institutions, allows us to not only provide data for institutional improvement,
but also continue exploration into interventions and strategies that will inform a national conversation on ways to
strengthen global learning. The data in this report allow your campus to make empirically-informed decisions and
improve your students' learning; the research emerging from this project informs good practice for the development
of a global perspective for students.
Along with this report, your institution receives a student dataset that can be used to contribute to understanding how
experiences vary within and across groups, analyzing assets and gaps in curricular and co-curricular offerings,
confirming or challenging existing beliefs about student experience, making decisions about resources and future
areas of work, and enhancing the educational experience of students.
Again, we thank you for your participation in this study, and we encourage your future involvement with the GPI. If
you have any questions, please contact the RISE office at (515) 294-6234 or email ([email protected]).
Sincerely,
Robert D. Reason
Professor of Education
Iowa State University

General Education Assessment: 2016 56
Table of Contents
Respondent Characteristics........................................................................ .............................................................. 4
Respondent Characteristics (cont.)........................................................................................... ............................... 5
Global Perspective Inventory Scales........................................................................................................................ ... 6
Table 1: Cognitive Knowing.................................................................................................. .................................. 8
Table 2: Cognitive Knowledge................................................................................................. ............................... 9
Table 3: Intrapersonal Affect................................................................................................................................. 10
Table 4: Intrapersonal Identity.............................................................................................. ................................. 11
Table 5: Interpersonal Social Responsibility................................................................................. ........................ 12
Table 6: Interpersonal Social Interaction............................................................................................................... 13
Table 7: Items Not Corresponding to a Scale.................................................................................. ...................... 14
General Form Questions............................................................................................................................................ 15
Table 8: College Course Enrollment........................................................................................... ........................... 16
Table 9: Participation in Planned Events in College.......................................................................... ................... 17
Table 10: Student Initiated Involvement................................................................................................................18
Table 11: Faculty Interactions Outside of Class.............................................................................. ...................... 19
Table 12: Faculty Fostering Multiple Perspectives............................................................................................... 20
Table 13: Community Scale.................................................................................................... .............................. 21

General Education Assessment: 2016 57
Respondent Characteristics
N Percent
Gender
Male 20 38
Female 30 58
Transgender/Gender nonconforming 0 0
Rather Not Say 2 4
Total 52
Class Year
First Year 0 0
Sophomore 0 0
Junior 7 13
Senior 45 87
Graduate Student 0 0
Total 52
Race
American Indian 1 2
Asian American/Asian 4 8
African-American/Black 2 4
Hispanic/Latino 4 8
Native Hawaiian/Pacific Islander 0 0
White/Caucasian 33 63
Multiracial 8 15
Total 52
American/International Student
American student at an American college/university 50 96
Non-American student at an American college/university 2 4
Other 0 0
Total 52
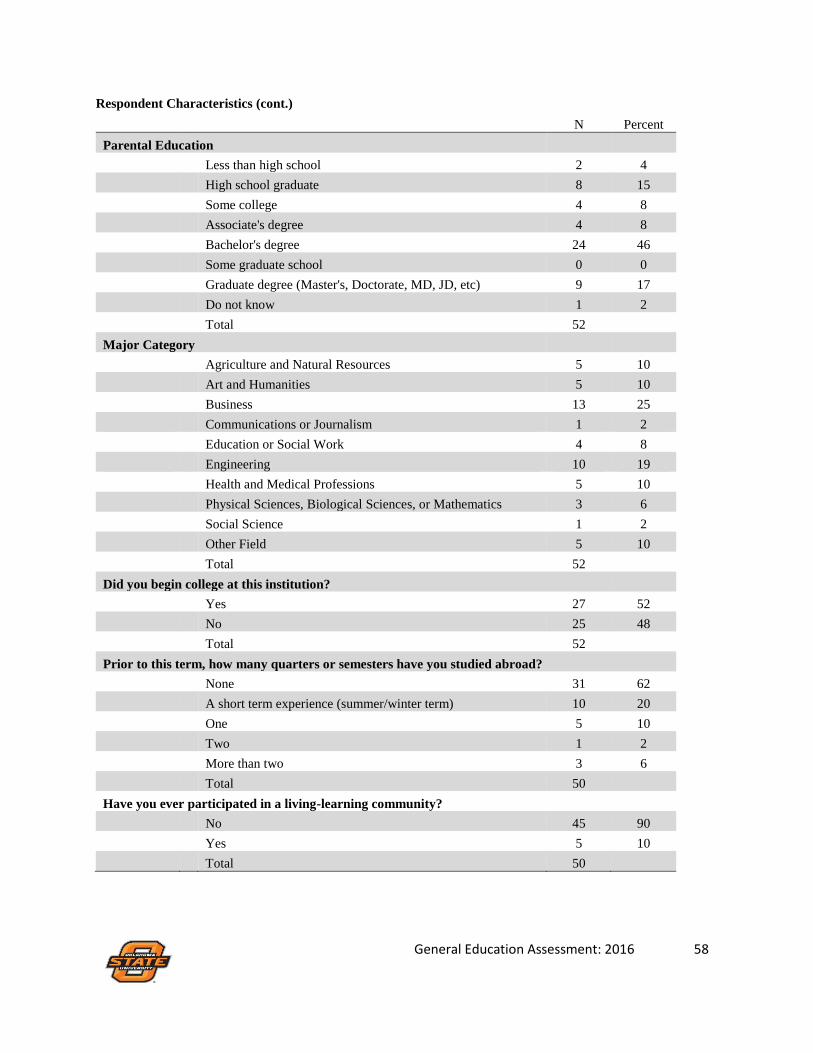
General Education Assessment: 2016 58
Respondent Characteristics (cont.)
N Percent
Parental Education
Less than high school 2 4
High school graduate 8 15
Some college 4 8
Associate's degree 4 8
Bachelor's degree 24 46
Some graduate school 0 0
Graduate degree (Master's, Doctorate, MD, JD, etc) 9 17
Do not know 1 2
Total 52
Major Category
Agriculture and Natural Resources 5 10
Art and Humanities 5 10
Business 13 25
Communications or Journalism 1 2
Education or Social Work 4 8
Engineering 10 19
Health and Medical Professions 5 10
Physical Sciences, Biological Sciences, or Mathematics 3 6
Social Science 1 2
Other Field 5 10
Total 52
Did you begin college at this institution?
Yes 27 52
No 25 48
Total 52
Prior to this term, how many quarters or semesters have you studied abroad?
None 31 62
A short term experience (summer/winter term) 10 20
One 5 10
Two 1 2
More than two 3 6
Total 50
Have you ever participated in a living-learning community?
No 45 90
Yes 5 10
Total 50

General Education Assessment: 2016 59
Global Perspective Inventory Scales

General Education Assessment: 2016 60
GPI Scales
The GPI measures global learning across three dimensions: cognitive, intrapersonal, and interpersonal.
Cognitive Dimension. One's knowledge and understanding of what is true and important to know. From a global
perspective taking viewpoint, it includes viewing knowledge and knowing with greater complexity and taking into
account multiple cultural perspectives. Reliance on external authorities to have absolute truth gives way to
commitment in relativism when making commitments within the context of uncertainty.
Knowing Scale. Degree of complexity of one's views of the importance of cultural context in judging what
is important to know and value.
Knowledge Scale. Degree of understanding and awareness of various cultures and their impact on our
global society and level of proficiency in more than one language.
Intrapersonal Dimension. Intrapersonal development focuses on one becoming more aware of and integrating
one's personal values and self-identity into one's personhood. From a global perspective taking viewpoint, it reflects
one's sense of self-direction and purpose in one's life, becoming more self-aware of one's strengths, values, and
personal characteristics and sense of self, and viewing one's development in terms of one's self-identity. It
incorporates different and often conflicting ideas about who one is living in an increasingly multicultural world.
Identity Scale. Level of awareness of one's unique identity and degree of acceptance of one's ethnic, racial,
and gender dimensions of one's identity.
Affect Scale. Level of respect for and acceptance of cultural perspectives different from one's own and
degree of emotional confidence when living in complex situations, which reflects an 'emotional
intelligence' that is important in one's processing encounters with other cultures.
Interpersonal Dimension. Interpersonal development focuses on one willingness to interact with persons with
different social norms and cultural backgrounds, acceptance of others, and being comfortable when relating to
others. From a global perspective taking viewpoint, it includes being able to view others differently and relating to
others in terms of moving from dependency to independence to interdependence, which is considered the most
mature perspective in effectively living in a global society.
Social Responsibility Scale. Level of interdependence and social concern for others.
Social Interaction Scale. Degree of engagement with others who are different from oneself and degree of
cultural sensitivity in living in pluralistic settings.
National Norms. For the purposes of this report, all national norms are calculated using data collected from the GPI
New Student form since 2015 (n = 3619).

General Education Assessment: 2016 61
Table 1: Cognitive Knowing
N
Strongly
Disagree Disagree Neutral Agree
Strongly
Agree Mean
Standard
Deviation
National
Mean
National
Standard
Deviation
Cognitive Knowing Scale 3.65 0.49 3.57 0.55
When I notice cultural differences, my culture
tends to have the better approach. (R) 52
2
4%
13
25%
28
54%
6
12%
3
6% 3.10 0.87 3.00 0.95
Some people have culture and others do not. 52 20
38%
15
29%
6
12%
9
17%
2
4% 3.81 1.24 3.81 1.15
In different setting what is right and wrong is
simple to determine. (R) 52
2
4%
16
31%
11
21%
16
31%
7
13% 2.81 1.14 2.99 1.14
I take into account different perspectives before
drawing conclusions about the world around me. 52
0
0%
1
2%
7
13%
24
46%
20
38% 4.21 0.75 4.14 0.69
I consider different cultural perspectives when
evaluating global problems. 52
1
2%
2
4%
9
17%
25
48%
15
29% 3.98 0.90 3.97 0.72
I rely primarily on authorities to determine what
is true in the world. (R) 52
11
21%
24
46%
9
17%
7
13%
1
2% 3.71 1.02 3.46 1.03
I rarely question what I have been taught about
the world around me. (R) 51
17
33%
19
37%
11
22%
3
6%
1
2% 3.94 0.99 3.59 1.07
Note: (R): Frequencies are reported as the question is asked. Item and scale means were calculated after reverse scoring. A higher mean indicates a more global perspective.
Percentages may not equal 100% because of rounding.

General Education Assessment: 2016 62
Table 2: Cognitive Knowledge
N
Strongly
Disagree Disagree Neutral Agree
Strongly
Agree Mean
Standard
Deviation
National
Mean
National
Standard
Deviation
Cognitive Knowledge Scale 3.64 0.74 3.76 0.59
I am informed of current issues that impact
international relations. 52
3
6%
11
21%
8
15%
24
46%
6
12% 3.37 1.12 3.66 0.96
I understand the reasons and causes of conflict
among nations of different cultures. 52
0
0%
6
12%
11
21%
28
54%
7
13% 3.69 0.85 3.70 0.85
I understand how various cultures of this world
interact socially. 52
1
2%
5
10%
15
29%
20
38%
11
21% 3.67 0.98 3.79 0.79
I know how to analyze the basic characteristics of
a culture. 52
0
0%
5
10%
18
35%
24
46%
5
10% 3.56 0.80 3.75 0.76
I can discuss cultural differences from an
informed perspective. 51
0
0%
5
10%
6
12%
28
55%
12
24% 3.92 0.87 3.88 0.79
Note: (R): Frequencies are reported as the question is asked. Item and scale means were calculated after reverse scoring. A higher mean indicates a more global perspective.
Percentages may not equal 100% because of rounding.

General Education Assessment: 2016 63
Table 3: Intrapersonal Affect
N
Strongly
Disagree Disagree Neutral Agree
Strongly
Agree Mean
Standard
Deviation
National
Mean
National
Standard
Deviation
Intrapersonal Affect Scale 4.26 0.47 4.17 0.50
I am sensitive to those who are discriminated
against. 52
0
0%
2
4%
10
19%
24
46%
16
0% 4.04 0.82 4.09 0.76
I do not feel threatened emotionally when
presented with multiple perspectives. 52
0
0%
1
2%
5
10%
28
54%
18
35% 4.21 0.70 4.04 0.79
I am accepting of people with different religious
and spiritual traditions. 52
0
0%
0
0%
1
2%
22
42%
29
56% 4.54 0.54 4.35 0.68
I enjoy when my friends from other cultures teach
me about our cultural differences. 52
0
0%
1
2%
3
6%
27
52%
21
40% 4.31 0.67 4.30 0.69
I am open to people who strive to live lives very
different from my own life style. 52
0
0%
0
0%
5
10%
31
60%
16
31% 4.21 0.61 4.06 0.72
Note: (R): Frequencies are reported as the question is asked. Item and scale means were calculated after reverse scoring. A higher mean indicates a more global perspective.
Percentages may not equal 100% because of rounding.

General Education Assessment: 2016 64
Table 4: Intrapersonal Identity
N
Strongly
Disagree Disagree Neutral Agree
Strongly
Agree Mean
Standard
Deviation
National
Mean
National
Standard
Deviation
Intrapersonal Identity Scale 4.06 0.54 4.11 0.50
I have a definite purpose in my life. 52 0
0%
4
8%
9
17%
25
48%
14
27% 3.94 0.87 4.16 0.87
I can explain my personal values to people who
are different from me. 52
0
0%
2
4%
3
6%
30
58%
17
33% 4.19 0.72 4.28 0.64
I know who I am as a person. 52 1
2%
0
0%
8
15%
23
44%
20
38% 4.17 0.83 4.19 0.75
I am willing to defend my own views when they
differ from others. 52
0
0%
1
2%
10
19%
25
48%
16
31% 4.08 0.76 3.98 0.75
I put my beliefs into action by standing up for my
principles. 52
0
0%
4
8%
9
17%
23
44%
16
31% 3.98 0.90 4.01 0.68
I am developing a meaningful philosophy of life. 51 1
2%
0
0%
11
22%
23
45%
16
31% 4.04 0.85 4.03 0.77
Note: (R): Frequencies are reported as the question is asked. Item and scale means were calculated after reverse scoring. A higher mean indicates a more global perspective.
Percentages may not equal 100% because of rounding.
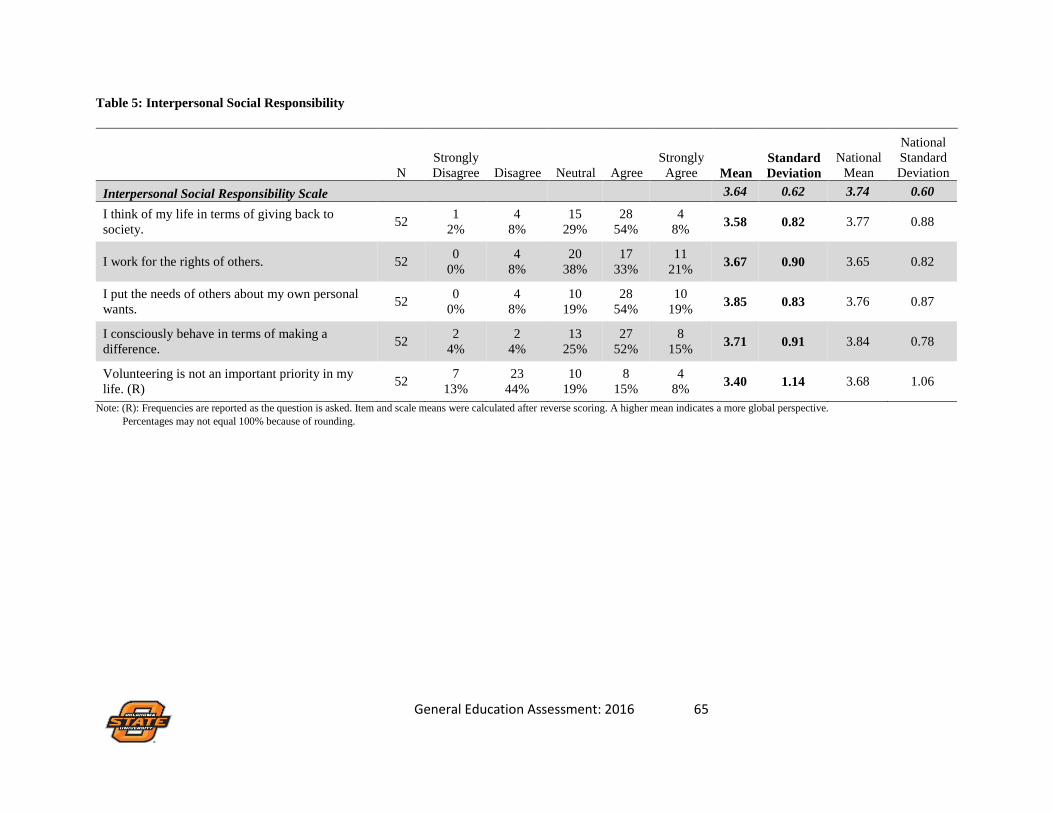
General Education Assessment: 2016 65
Table 5: Interpersonal Social Responsibility
N
Strongly
Disagree Disagree Neutral Agree
Strongly
Agree Mean
Standard
Deviation
National
Mean
National
Standard
Deviation
Interpersonal Social Responsibility Scale 3.64 0.62 3.74 0.60
I think of my life in terms of giving back to
society. 52
1
2%
4
8%
15
29%
28
54%
4
8% 3.58 0.82 3.77 0.88
I work for the rights of others. 52 0
0%
4
8%
20
38%
17
33%
11
21% 3.67 0.90 3.65 0.82
I put the needs of others about my own personal
wants. 52
0
0%
4
8%
10
19%
28
54%
10
19% 3.85 0.83 3.76 0.87
I consciously behave in terms of making a
difference. 52
2
4%
2
4%
13
25%
27
52%
8
15% 3.71 0.91 3.84 0.78
Volunteering is not an important priority in my
life. (R) 52
7
13%
23
44%
10
19%
8
15%
4
8% 3.40 1.14 3.68 1.06
Note: (R): Frequencies are reported as the question is asked. Item and scale means were calculated after reverse scoring. A higher mean indicates a more global perspective.
Percentages may not equal 100% because of rounding.

General Education Assessment: 2016 66
Table 6: Interpersonal Social Interaction
N
Strongly
Disagree Disagree Neutral Agree
Strongly
Agree Mean
Standard
Deviation
National
Mean
National
Standard
Deviation
Interpersonal Social Interaction Scale 3.42 0.77 3.34 0.75
Most of my friends are from my own ethnic
background. (R) 52
5
10%
10
19%
9
17%
22
42%
6
12% 2.73 1.19 2.54 1.11
I frequently interact with people from a
race/ethnic group different from my own. 52
0
0%
3
6%
6
12%
22
42%
21
40% 4.17 0.86 3.90 0.96
I intentionally involve people from many cultural
backgrounds in my life. 52
1
2%
13
25%
16
31%
14
27%
8
15% 3.29 1.07 3.55 0.93
I frequently interact with people from a country
different from my own. 52
1
2%
7
13%
18
35%
18
35%
8
15% 3.48 0.98 3.39 1.08
Note: (R): Frequencies are reported as the question is asked. Item and scale means were calculated after reverse scoring. A higher mean indicates a more global perspective.
Percentages may not equal 100% because of rounding.

General Education Assessment: 2016 67
Table 7: Items Not Corresponding to a Scale
N
Strongly
Disagree Disagree Neutral Agree
Strongly
Agree Mean
Standard
Deviation
National
Mean
National
Standard
Deviation
I feel threatened around people from backgrounds
different from my own. (R) 52
20
38%
22
42%
9
17%
0
0%
1
2% 4.15 0.85 4.09 0.88
I often get out of my comfort zone to better
understand myself. 52
1
2%
10
19%
11
21%
20
38%
10
19% 3.54 1.07 3.51 0.98
I see myself as a global citizen. 52 2
4%
6
12%
12
23%
17
33%
15
29% 3.71 1.13 3.79 0.90
Note: (R): Frequencies are reported as the question is asked. Item and scale means were calculated after reverse scoring. A higher mean indicates a more global perspective.
Percentages may not equal 100% because of rounding.

General Education Assessment: 2016 68
General Form Questions

General Education Assessment: 2016 69
Table 8: College Course Enrollment
Since coming to college, how many courses have you taken in the area listed below?
N 0 1 2 3 4 5+
Multicultural course addressing issues of race, ethnicity, gender, class, religion,
or sexual orientation. 39
15
38%
14
36%
7
18%
1
3%
2
5%
0
0%
Foreign language course. 20 6
30%
5
25%
3
15%
1
5%
5
25%
0
0%
World history course. 39 25
64%
13
33%
1
3%
0
0%
0
0%
0
0%
Service learning course. 18 11
61%
6
33%
0
0%
1
6%
0
0%
0
0%
Course focused on significant global/international issues and problems. 30 21
70%
6
20%
1
3%
1
3%
1
3%
0
0%
Course that included opportunities for intensive dialogue among students from
different backgrounds and beliefs. 24
10
42%
6
25%
2
8%
4
17%
2
8%
0
0%
Note: Percentages may not equal 100% because of rounding.

General Education Assessment: 2016 70
Table 9: Participation in Planned Events in College
Since coming to college, how often have you participated in the following?
N Never Rarely Sometimes Often
Very
Often Mean
Standard
Deviation
National
Mean
National
Standard
Deviation
Events or activities sponsored by groups
reflecting your own cultural heritage. 50
18
36%
14
28%
8
16%
8
16%
2
4% 1.24 1.22 1.59 1.25
Events or activities sponsored by groups
reflecting a cultural heritage different from your
own.
50 14
28%
13
26%
16
32%
3
6%
4
8% 1.40 1.20 1.42 1.09
Religious or spiritual activities. 50 12
24%
7
14%
9
18%
15
30%
7
14% 1.96 1.41 1.55 1.39
Leadership programs that stress collaboration and
team work. 49
13
27%
12
24%
9
18%
10
20%
5
10% 1.63 1.35 2.00 1.34
Community service activities unrelated to a
course. 49
12
24%
8
16%
12
24%
11
22%
6
12% 1.82 1.36 2.03 1.25
Attended a lecture, workshop, or campus
discussion on international or global issues. 50
20
40%
13
26%
14
28%
1
2%
2
4% 1.04 1.07 1.39 1.13
Note: Percentages may not equal 100% because of rounding.

General Education Assessment: 2016 71
Table 10: Student Initiated Involvement
Since coming to college, how often have you participated in the following?
N Never Rarely Sometimes Often
Very
Often Mean
Standard
Deviation
National
Mean
National
Standard
Deviation
Read a newspaper or news magazine (online or in
print). 50
3
6%
9
18%
12
24%
14
28%
12
24% 2.46 1.22 2.34 1.16
Watched news program on television. 50 3
6%
11
22%
13
26%
14
28%
9
18% 2.30 1.18 2.15 1.16
Followed an international event/crisis (through a
newspaper, social media, or other media sources). 50
2
4%
8
16%
12
24%
16
32%
12
24% 2.56 1.15 2.38 1.11
Discussed current events with other students. 50 1
2%
10
20%
14
28%
14
28%
11
22% 2.48 1.11 2.55 1.04
Note: Percentages may not equal 100% because of rounding.

General Education Assessment: 2016 72
Table 11: Faculty Interactions Outside of Class
Since coming to college, how often have you experienced the following with your faculty?
N Never Rarely Sometimes Often
Very
Often Mean
Standard
Deviation
National
Mean
National
Standard
Deviation
Discussed course topics, ideas, or concepts with a
faculty member outside of class. 50
4
8%
21
42%
14
28%
8
16%
3
6% 1.70 1.04 1.99 1.12
Discussed your academic performance with a
faculty member. 50
4
8%
13
26%
14
28%
13
26%
6
12% 2.08 1.16 2.19 1.07
Note: Percentages may not equal 100% because of rounding.

General Education Assessment: 2016 73
Table 12: Faculty Fostering Multiple Perspectives
Since coming to college, how often have you experienced the following with your faculty?
N Never Rarely Sometimes Often
Very
Often Mean
Standard
Deviation
National
Mean
National
Standard
Deviation
The faculty challenge students' views and
perspectives on a topic during class. 49
6
12%
16
33%
17
35%
7
14%
3
6% 1.69 1.06 2.34 1.00
The faculty presented issues and problems in
class from different cultural perspectives. 49
5
10%
13
27%
20
41%
8
16%
3
6% 1.82 1.03 2.23 1.01
Note: Percentages may not equal 100% because of rounding.

General Education Assessment: 2016 74
Table 13: Community Scale
N
Strongly
Disagree Disagree Neutral Agree
Strongly
Agree Mean
Standard
Deviation
National
Mean
National
Standard
Deviation
Community Scale 3.85 0.88 3.96 0.73
I have a strong sense of affiliation with my
college/university. 50
3
6%
4
8%
11
22%
14
28%
18
36% 3.80 1.20 3.88 0.97
I feel that my college/university community
honors diversity and internationalism. 50
1
2%
2
4%
5
10%
29
58%
13
26% 4.02 0.84 3.87 0.95
I understand the mission of my college/university. 50 2
4%
5
10%
13
26%
21
42%
9
18% 3.60 1.03 4.05 0.83
I am both challenged and supported at my
college/university. 50
2
4%
1
2%
9
18%
25
50%
13
26% 3.92 0.94 3.86 0.90
I have been encouraged to develop my strengths
at my college/university. 50
3
6%
0
0%
10
20%
19
38%
18
36% 3.98 1.06 4.11 0.84
I feel I am a part of a close and supportive
community of colleagues and friends. 50
2
4%
5
10%
10
20%
19
38%
14
28% 3.76 1.10 4.00 0.96
Note: (R): Frequencies are reported as the question is asked. Item and scale means were calculated after reverse scoring. A higher mean indicates a more global perspective.
Percentages may not equal 100% because of rounding.

General Education Assessment: 2016 75
The Global Perspective Inventory was originally housed at The Global Perspective Institute, Inc., which was
established in 2008 to study and promote global holistic human development among college students. The Global
Perspective Inventory was hosted by Central College in Pella, IA under the direction of Larry Braskamp until 2015
when Iowa State began hosting the GPI.

Appendix B: Photovoice Report
General Education Assessment: 2016 76
How I See It: Understanding and Experiencing Diversity at OSU (A Photovoice Project)
Office of University Assessment and Testing: Sarah Gordon, Ph.D., Past Director of University Assessment and Testing
Diversity Subcommittee of AAIC:
Marshall Baker, Ph.D., Assistant Professor, Agricultural Education Denise Blum, Ph.D., Associate Professor, Social Foundations
Precious Elmore-Sanders, Ph.D., Assistant Vice President for Institutional Diversity

General Education Assessment: 2016 77
Executive Summary During the 2015-2016 academic year, a team of faculty and administrators conducted a Photovoice study to assess student learning regarding diversity. Fifteen students provided 55 photos on this topic and met in five separate focus groups to discuss the photos they took along with their personal experiences with diversity in and out of the classroom. Key Findings Six themes emerged from the photograph and focus group data: Course Quality, the OSU Experience, Spaces and Places, Grouping, Responsibility, and Hesitation. Students provided rich data about the things they learned about diversity in and out of the classroom during their time as an OSU student. Students affirmed positive learning experiences, as well as some negative experiences both in and out of the classroom. Recommendations The information gained from students in this study will help this university (and potentially others) to understand what and how students are learning with regard to the general education outcome of diversity. Further, findings from this study may help this university develop programs, activities, and resources that will help expand opportunities for students to incorporate diverse experiences into their college career, both in and out of the classroom. Specific suggestions for OSU based on the data in this study include 1) providing instructor/faculty training on how to help those teaching diversity courses create safe spaces, handle controversial issues, provide resources, create helpful and meaningful assignments, and facilitate discussion that does not single anyone out or silence any one perspective; 2) continuing to provide tangible support for underrepresented populations; 3) providing safe spaces and places for all students to allow for authentic conversations about diversity issues; 4) launching a campaign (similar to the https://1is2many.okstate.edu/ effort) that highlights resources for students, faculty, and staff who may face a diversity-related issue or want to engage in further dialogue; and 5) aligning the goals of ‘D’ and ‘I’ courses with the university diversity statement and creating goals that create consistent experiences across courses (such as a common assignment, interaction, or experiential learning project). Assessment of general education is a critical aspect of our work to continuously improve our institution. Our challenge moving forward is clear: to make the most of these findings by using the results to continue with what is working well and to make meaningful changes where they are needed. Sincerely, Marshall Baker, Ph.D., Assistant Professor, Agricultural Education Denise Blum, Ph.D., Associate Professor, Social Foundations Precious Elmore-Sanders, Ph.D., Assistant Vice President for Institutional Diversity Sarah R. Gordon, Ph.D., Assistant Professor, REMS and Past Director, UAT

General Education Assessment: 2016 78
Contents Introduction ................................................................................................................................................. 80 Overview of Photovoice ............................................................................................................................. 80 Sample and Data Collection Procedures ..................................................................................................... 82 Analytic Strategy ........................................................................................................................................ 86 Key Themes and Findings .......................................................................................................................... 88
Course Quality ........................................................................................................................................ 88 The ‘D’ course. ................................................................................................................................... 88 Group work. ........................................................................................................................................ 88 Accuracy of texts and depth of conversation. ..................................................................................... 89 Being singled out in the classroom. .................................................................................................... 91 What helps? ......................................................................................................................................... 92
OSU Experience...................................................................................................................................... 93 A friendly place? ................................................................................................................................. 93 Lack of diversity in the student body. ................................................................................................. 94 Recruitment. ........................................................................................................................................ 95 Supports, groups, and events............................................................................................................... 96
Spaces and Places ................................................................................................................................... 98 Physical brick and mortar places. ....................................................................................................... 98 Emotional/affective spaces. .............................................................................................................. 101
Grouping ............................................................................................................................................... 103 Comfort and “clumping”. .................................................................................................................. 103 Bringing groups together. ................................................................................................................. 105
Responsibility ....................................................................................................................................... 107 University and personal responsibility. ............................................................................................. 107 Placing responsibility on students of color and false ownership. ..................................................... 108 Dual responsibility. ........................................................................................................................... 111
Hesitation .............................................................................................................................................. 112 Fear of offending. .............................................................................................................................. 112 Fear of being singled out and failure to relate. .................................................................................. 114 Uncertainty in handling difficult situations....................................................................................... 115
Use of Results/Suggestions for Use .......................................................................................................... 115 What is Going Well? ............................................................................................................................. 116 Instructor/Faculty Training ................................................................................................................... 118

General Education Assessment: 2016 79
Tangible Support and Serious Action ................................................................................................... 119 Safe Places for Authentic Discussion and Expression .......................................................................... 119 Campaign, Response, and University Culture ...................................................................................... 120 Suggestions for General Education (‘D’ and ‘I’ Courses) .................................................................... 121
Future Plans/Suggestions for Future Iterations of this Assessment Method ............................................. 122 Appendix A ............................................................................................................................................... 128 Appendix B ............................................................................................................................................... 130

General Education Assessment: 2016 80
Introduction
During the discussion at the March 2014 joint meeting of the Council for the Assessment
of General Education (CAGE), the General Education Advisory Council (GEAC), and the
Academic Assessment and Improvement Council (AAIC), council members proposed that
revisions be made to the assessment process for the ‘Diversity’ general education outcome. A
diversity subcommittee was formed to discuss the revisions further and devise a plan for future
assessment. The diversity subcommittee suggested a multidimensional approach to assessing
diversity as a general education outcome: 1) continue the standard practice of collecting written
artifacts and having them assessed by faculty raters; 2) the Global Perspectives Inventory (GPI),
which assesses how students think about their own cultures as well as how they relate to
individuals whose cultures and values are different from their own, should be administered to
first year students and seniors; and 3) a small sample of students (N = ~25) should be invited to
participate in a qualitative assessment process using the Photovoice technique. This report
summarizes the Photovoice project conducted in Spring 2016.
Overview of Photovoice
Photovoice is an arts-based qualitative method usually housed within community-based
participatory action research (CBPR) methodology. As a CBPR methodology, the participants’
knowledge and perspectives are not only acknowledged but they become co-researchers in the
data collection (using photography) and explanation (in group discussion of their photographs).
The key difference between participatory research and conventional methodologies lies in the
location of power in the research process. In Photovoice, the participants control the
photographic process in order to express, reflect, and communicate their everyday lives,
validating their identities or “voices” which are not typically sought on the target issue.

General Education Assessment: 2016 81
Photovoice as a research concept was developed initially by Wang and Burris in the
1990s to enable rural Chinese women to document their everyday health and work realities with
photography (Wang & Burris, 1997). Photovoice is a process by which people can identify,
represent, enhance, and learn about their community through a specific photographic technique.
Photovoice has three main goals: 1) to enable people to document using photography and reflect
their community's strengths and concerns, 2) to promote critical dialogue and knowledge about
important issues through group discussion of photographs, and 3) to reach policymakers and/or
administrators (Wang & Burris, 1997). In this research project, Photovoice was used to assess
OSU students’ learning experiences of diversity on campus. The intention of the research is to
document the strengths and weaknesses of the current campus practices as well as to consider
and improve specific spaces and places that may seem more or less welcoming to students.
According to Wang (1999), several concepts unite the ways in which groups apply the
photovoice technique:
1) Images teach—they contribute to how we see ourselves, how we define and relate to the
world, and what we understand as significant;
2) Images can influence policy and practices—photographs do not influence policy in a linear
way but instead can shape the way we look at the world and ourselves, moving policymakers or
administrators to consider reforms;
3) The community should participate in producing and defining the images that might influence
policy and practices—people merely creating images is not the key to Photovoice; rather, the
process also requires that the community define those images;

General Education Assessment: 2016 82
4) The process requires that influential people serve as an audience—the potential to use
Photovoice to influence policies and practices resides in the exchanges among community
members and stakeholders over the images of interest;
5) Photovoice emphasizes individual and community action—the technique is grounded in the
understanding that policies and practices derived from the integration of local knowledge and
skills within the affected population will contribute to healthier and more effective practices.
Sample and Data Collection Procedures Data was collected for this study in March and April 2016. Participants were selected for
this study using a combination of purposive and convenience sampling. The researchers
originally intended to obtain approximately half the sample (n = ~12) by asking full time staff
who work in the Division of Student Affairs and the Division of Institutional Diversity to refer
students known to them to participate in the study. The other half of participants were to be
gathered through the College of Education SONA system. Several weeks of recruiting on SONA
was not fruitful, resulting in only two participants. Thus, in order to complete the study within
the timeframe of one academic semester, the researchers chose to cease SONA recruitment and
continue word of mouth recruiting through the Division of Institutional Diversity. This
recruiting resulted in a sample of 23 students who agreed to participate in the study. Of those 23,
14 completed the study by submitting photos and participating in focus groups. One additional
student submitted photos but did not attend a focus group. In all, there were six men and nine
women who participated in this study, representing all classifications (first year through senior)
and all but one college at OSU. An overview of the characteristics of the participants in the study
is provided in Table 1.

General Education Assessment: 2016 83
Table 1 Sample Demographics Gender
Male 6 Female 9
Race*
Asian/Asian American 3 African American/Black 6
Hispanic/Latino 2 Arab 1
White 3
Classification First Year 2
Sophomore 3 Junior 3 Senior 7
College
Agricultural Sciences and Natural Resources 4 Arts and Sciences 3
Education 0 Engineering, Architecture, & Technology 3
Human Sciences 2 Spears School of Business 2
University College 1
State of Origin Oklahoma 11
Texas 3 Unknown 1
*Note: Race was self-identified by the participant.
Students who expressed interest in participating in the study attended a workshop to
orient them to Photovoice and the research process for this study. All students who agreed to
participate in the study after the workshop were given a short demographic survey and were
assigned by the researchers to one of five focus groups by the researchers; focus group
assignment was based exclusively on students’ schedule availability. After students were

General Education Assessment: 2016 84
assigned to a focus group, they were enrolled in a community on OSU’s online classroom
(D2L/Brightspace). This allowed them to share photos, captions, and any other information
about the study that they wished with one another for the duration of the project. Groups were
only allowed to view photos, captions, and discussion boards with their own group members (no
one could see other group members’ information/uploads).
Once students were enrolled in the D2L/Brightspace community for this project, they
were given a prompt to use as they took photos for the ‘photo’ portion of this Photovoice project.
The prompt for this study was: Take pictures that represent your experience(s) with diversity
while you have been a student at OSU. Specifically, include photos that represent your
knowledge/understanding of diversity based on a) your OSU coursework (inside the classroom)
and b) your experiences outside the classroom. Take as many photos as you like to answer these
questions. If you take photos of people, a photo release form must be signed by any individuals
in your pictures.
Students were given one week to take original digital photos (using digital cameras, cell
phones, or other photo-taking devices) in response to the Photovoice prompt. After taking the
photos, students were asked to choose no more than 10 of the photos they took, upload them to
the D2L/Brightspace dropbox, and write a short caption for the photograph following an adapted
version of the SHOWED acronym (Wallerstein & Bernstein, 1988). SHOWED (Wallerstein &
Bernstein, 1988) stands for: What do you See here? What's really Happening here? How does
this relate to Our lives (the lives of the community)? Why does this problem or this strength
exist? Does this photograph make you think of anything Else we need to know about? What can
we Do about this? The purpose of this ‘root-cause questioning’ is to identify the problem or the

General Education Assessment: 2016 85
asset, critically discuss the roots of the situation, and develop strategies for changing the
situation. Students also indicated the two photos (one from ‘a’) inside the classroom’ and one
from ‘b’) outside the classroom’ in the prompt) that were most meaningful to them; these two
photos were discussed further during the focus group.
After students uploaded their photos and captions to D2L/Brightspace, each focus group
met at a mutually agreeable time to engage in conversation about their photos and their
experiences with diversity issues since becoming an OSU student. The following instructions
were given to focus group participants:
We have uploaded to a PowerPoint presentation the 2 photos you submitted as the ones
that you wanted to share in the focus group: one photo is about knowledge and
understanding of diversity that you learned in the classroom, and the other photo is about
knowledge and understanding of diversity that you learned outside of the classroom. As
we show you these photos, we would like for the person who submitted the photo to
respond to some questions about the photo, and we would like for you, as a group, after
the person answers the questions about the photo, to comment freely on them. The
following questions will be asked of each person as s/he introduces her/his photo:
When you see your photo, please explain:
a. Why you took this picture.
b. Describe what the picture is about.
c. How it portrays knowledge and understanding of diversity (inside or outside
of the classroom),
d. What strengths, problems, or areas of concern it shows,

General Education Assessment: 2016 86
e. And in what ways this situation could be supported or improved
Two researchers led each focus group. Focus groups were audio recorded and transcribed
verbatim. After completing the focus group session, each student was given a $10 gift card to the
OSU Student Store.
Analytic Strategy
A qualitative coding methodology was employed in order to “study things in their natural
settings, attempting to make sense of or interpret, phenomena in terms of the meanings people
bring to them” (Denzin & Lincoln, 2005, p. 3). Researchers in this study first employed
Saldaña’s (2013) initial coding strategy and later utilized in vivo coding as patterns began to
emerge. In vivo codes are direct quotations pulled from the manuscript to represent a common
theme or pattern. Initial coding allows for the initial digesting and reflecting on the data. As the
researchers read, discussed, and shared, codes began to naturally deduce into subcategories.
Once patterns arose, in vivo codes were utilized to maintain the students’ voice.
In qualitative research, the researchers serve as the research instrument. Thus, it is
important that the bias from each researcher is acknowledged and discussed as a part of this
process to ensure trustworthiness (Tracy, 2010). The research team was comprised of four
individuals: three female researchers and one male researcher. Three of the researchers are
White, and one is Black. One team member serves as the director of University Assessment and
Testing at OSU, and as such, is heavily invested in the investigation of the diversity requirements
and progress. A second researcher is an administrator in the Division of Institutional Diversity.
This individual had personal relationships with a number of the students involved in this study,
and has been heavily involved in issues related to student diversity on the OSU campus. A third
researcher is a faculty member who is well-versed in qualitative methods and the Photovoice
General Education Assessment: 2016 87
technique, and has been actively involved in advocating for and researching issues related to
diversity. The final member of the team is also a faculty member who has conducted research on
diversity in higher education and had personal relationships with students involved in the study.
Though these biases existed, specific processes were in place to reduce the impact of bias and
ensure trustworthiness. Specifically, as suggested by Tracy (2010), rigor, sincerity, resonance,
ethics, and credibility were woven into the methodology.
Researchers initially coded each of the transcripts from the five focus groups
individually. During this coding process, researchers wrote personal memos that cataloged
personal bias, thoughts, reflections, and potential development of patterns. These memos were
used to bring context to the codes during discussion. Each of the personal codes and memos
were collected by a research assistant and catalogued in a database for later use in final theme
development. The initial coding process led to 1,080 individual codes. The research team then
met to negotiate further deduction of the data.
The researchers decided to use a postmodern-influenced approach to triangulation called
“crystallization.” Crystallization offers a framework for conducting qualitative research that
invites researchers to examine relational topics using multiple lenses and a variety of genres. It
complements social science research with artistic representations of data that enables researchers
to render complex, nuanced accounts that serve multiple stakeholder audiences (Ellingson,
2014). In this study, photographs (as an artistic representation of data), together with the focus
group interviews and photograph captions, were used. Through the use of data sources and
memos, multiple accounts of the same story were shared (Tracy, 2010). This process ultimately
led to the identification of six themes comprised of 74 sub-themes (see Appendix A). Upon final

General Education Assessment: 2016 88
theme identification, the research team sought disconfirming evidence to continue to weave
trustworthiness into the analysis.
Key Themes and Findings Course Quality
As students shared their photos and discussed their experiences with diversity on campus,
the theme of “Course Quality” emerged. This theme focused on the content and quality of the
courses students take, and the things that makes students’ experiences in a course positive or
negative. Codes and concepts that helped develop this theme were interactions with
instructors/faculty, course content and assignments, accuracy of perspectives, being singled out
in the classroom, and professor approachability.
The ‘D’ course. During conversations about classes, most participants were aware of the
OSU requirement for undergraduates to take a ‘D’ course. Participants were generally aware of
which ‘D’ course they took, and could reflect specifically on that course. Some participants
found it helpful, noting "...it just had all these tips and ideas and so I thought was really
interesting, and [the content] was something…I would have never thought about on my own"
(FG 4, p. 8, line 263). However, another student said "...when I think of a 'D' course, I think of,
'Sweet. Easy class.' I think of a class I'm not going to have to dedicate myself that much to" (FG
5, p. 3, line 67). Based on the data from this project, it is clear that there are mixed opinions
about the ‘D’ course and its effectiveness.
Group work. When reflecting on ‘D’ courses as well as all courses in general,
participants noted that group work was important to them in terms of helping them learn about
diversity issues. One student described a photograph she took (see Figure B1), saying "…the
General Education Assessment: 2016 89
people in this picture, they were coming together to work on a group project. I took this picture
because I love the interaction between the group" (FG 2, p. 5, line 181). Another student noted
that working together in groups with other students helped him be more aware of other cultures
and people. He said, "…since working in my lab, I've learned a lot about it [Nepalese culture].
And I think that it made me more aware as I'm out and about walking around campus…" (FG 1,
p. 3, line 99). Other students pointed out that they felt group work would be helpful in allowing
students to interact with one another, even if they had not had the opportunity in their courses
yet. One student mentioned, “if maybe they [students] started having more group assignments
where they have to be assigned to different backgrounds, it would be a lot easier” (FG 1, p. 2,
line 75).
Accuracy of texts and depth of conversation. Another topic mentioned by students in
the focus groups was a frustration with accuracy and openness of perspectives shared in course
text books; it is important to note that participants did not always specifically mention this issue
only in relation to ‘D’ courses, though some did. An Arab-American student reflected on her
experience in a ‘D’ class she took:
“...one culture that we talked about was like the Arab American culture, and me, coming
from an Arab background, it was kind of heart-wrenching to hear the things we were
talking about, because it came from a book even though it was totally not accurate...” (FG
4, p. 1, line 34).
She further explanted that there might be "some certain accurate spots, but overall it [the text
book] was…almost watching like the news and like those stereotypes of what we are..." (FG 4, p.
2, line 36). With regard to his own experience in a different class, another student felt that "... a
lot of our voices are shut down and are not voiced into these textbooks" (FG 4, p. 2, line 62).
General Education Assessment: 2016 90
Another student reflected that sometimes it wasn’t only the textbooks that ‘shut down’
conversation. She noted that “in the actual class, when we were discussing it [a diversity issue],
I didn't feel comfortable talking about these issues because my other classmates…didn't seem as
welcoming to the idea of talking about like the real perspective" (FG 4, p. 2, line 69).
Other conversation focused around participants feeling that textbooks were not enough or
fell short in helping facilitate discussions about diversity issues. For example, one participant
said, "...even though these classes are about diversity, we only talk about what's in the book, and
we don’t talk about everything else that's actually real" (FG 4, p. 2, line 41). A similar sentiment
was shared by another participant who noted "...we learned from the books even though there
was that diversity in the classroom, so it was just very based on like theory and not actual like
real..." (FG 4, p. 10, line 357). This idea of learning from one another rather than ‘just’ out of a
book seems to be similar to the previously discussed suggestion of participating in group work.
Participants in this study universally recognized the benefit of interacting with others, noting it
gave them a “different aspect towards this other rather just reading it off of a text book" (FG 4, p.
1, line 28). Another student pointed out that when discussions did happen in class, they were
not, in his opinion, in-depth enough:
“Oftentimes….in classrooms, there is that tendency where diversity is not a prominent
subject, even in the courses of diversity or these aspects that analyses such as these
literature classes that deals with culture and languages across the world—whereas it just
talks about the generic, common circumstances of these certain areas rather than talking
about the issues or the diversity issues that there is in that specific region or in that
particular circumstance” (FG 4, p.1, line 17).

General Education Assessment: 2016 91
Being singled out in the classroom. In addition to frustrations with textbooks and
shallow conversations, participants also discussed experiences of being called on, looked at, or
singled out in the classroom by an instructor/faculty member. For example, one student recalled,
"...he [the instructor/faculty] asked ‘who in here speaks Spanish?’ and like he looked at me
automatically...and it's like yes I'm brown but I'm not fluent in Spanish" (FG 4, p. 8, line 276).
The same student also shared, “I just don't like when I'm called on specifically, especially like
because I'm Mexican...” (FG 4, p. 8, line 272). Another student recalled having watched an
interaction where a student was singled out: “…we were talking about Trump and China and he
called this lady out and he said, and he [the instructor/faculty] was like ‘Well how does China
feel about Trump?’ And um it took me aback….” (FG 3, p. 17, line 576). The same student,
reflecting on her experiences of often being in the only African American/Black person in the
room, also shared that:
“…It's awkward when you sit in class and we do talk about um things that are involving
race, and if you're the race that you're talking about, then everyone will look at you, and
then you become the teacher in the class” (FG 3, p. 18, line 588).
It was clear in these discussions that participants felt that instructors/faculty have a
responsibility to foster a safe and comfortable environment in the classroom, and when it was
uncomfortable (for whatever reason), the instructor/faculty should or could help. Participants
seemed to notice that though not everyone had experienced being ‘singled out,’ sometimes
instructors/faculty were simply unsure or uncomfortable with how to facilitate critical dialogue
about diversity issues. One participant commented,
"...it just felt very awkward whenever he [the instructor] was talking about [diversity
topics] and like kinda the way he came off, like I felt like it shouldn't have been awkward
General Education Assessment: 2016 92
at all, but it was. I felt kind of like we were being, not singled out but, I don’t know, I
think he was just trying to get a conversation going, but I just don’t like when I’m called
on specifically, especially like because I’m Mexican, he was like ‘What do you have to
say about this?’ I don’t know – if I had something to say I would say it” (FG 4, p. 8, line
269).
That same student put it quite succinctly: "...I thought that was kind of the professor's fault for
making me feel uncomfortable when I initially feel like I shouldn't have" (FG 4, p. 8, line 278).
What helps? Finally, while some participants shared unpleasant experiences they had in
class, they also discussed what helps make diversity conversations in the classroom pleasant.
Specifically, they talked about qualities and characteristics of their instructors/faculty that
seemed to facilitate quality discussion and comfortable classroom environments. Participants
gave three clear examples of how they felt this can be done:
1) Using Humor
"I would say just being um like comical. I think like, you know, when he's funny or
when she's funny and kind of like, you know, cracks a joke. It makes you more
comfortable...So it's just being able to relate to your students..." (FG 4, p. 13, line
473).
2) Being Open
"...having a class like that, where it's just open to talk about anything and everything,
is -- because that's the purpose of that class – it’s to talk about race, you know, so no
one's like 'I don't want to talk about it.’ The professor was like he was very open so
he was he did make it comfortable as well” (FG 4, p. 13, line 457).
3) Sharing a Personal Story When Appropriate

General Education Assessment: 2016 93
"I think when professors are comfortable enough to…tell a personal story, that they
want you to know that they can relate to a situation or something you might have
gone through...[my professor shared a personal experience and]...I think that was a
really defining moment in that class, where I like really liked her, and trusted her, and
was comfortable talking to her, so, just made it relatable" (FG 4, p. 13, line 481).
OSU Experience
The OSU Experience is a theme that emerged as a characterization of what it was like to
be a student at OSU. Codes that contributed to this theme included privilege and lack of
diversity, experiential/integrated learning, lack of experiences/opportunities, and recruiting.
A friendly place? Most students had a positive first impression of OSU as a “friendly
place.” However, many participants indicated that sometimes the friendliness seemed only
surface-level and being able to express oneself and be heard was a concern. One female student
of color highlighted that the symbolic nature of diversity seen with the international flags, as well
as brochures and fliers “with a couple of um outlying ethnicities” (FG 3, p. 12, line 372), was
inadequate, if not deceptive or demeaning. She said:
“I feel like there has to be actual power and motivation and action behind those words,
and I don’t know, sometimes I look around and I don’t feel like that’s really fully
expressed by OSU, and I know that the number one thing that people say um about OSU
is that they feel like it’s a very friendly place. I felt like OSU was a very friendly place
when I first came here, and I mean I still do to a certain extent, it’s just that there are a lot
of things that happen, that sometimes students try to express, but um either someone
doesn’t want to take the time to address those things, or they don’t feel like it’s real
enough issue to address those things.” (FG 3, p.12, line 373).

General Education Assessment: 2016 94
Lack of diversity in the student body. The students of color who participated in this
study indicated that the sorely lacking representation of students of color in classes at OSU tends
to make students of color feel “uncomfortable” simply being in the classroom, not to mention
expressing their opinions. As one student of color stated, “inside the classroom [I] never can um
find someone I could maybe relate to or like that really looks like me” (FG 3, p. 1, line 15).
Another participant added:
“Being the only black person most of the time . . . I don’t typically get too phased by it . .
. I’m used to that…If I walk into a room, I can kind of tune everybody out who’s in there,
but if there are people who are like me, I notice them.” (FG 3, p. 3, line 90).
Further, participants noted that not all instructors approach the topic of diversity the same
way, and perhaps do not make the most of teachable moments, entrenching divisions of class and
race. One example was given of a class where students were asked to introduce themselves with
a PowerPoint presentation. A male student of color talks about what the non-minority students
in his class presented: “This is my lake house…this is us on our jet skis.” He mentioned that
another classmate stated, “This is me four years old on our ranch. Um, we don’t stay here right
now, but we still have the ranch. We go back time to time.” “And I’m [the participant] like, I
didn’t show my house” (FG 3, p. 2, line 44). A female student of color in the focus group
interjected, “These are my rollerblades I had since I was three.” (FG 3, p. 2, line 48). The male
student of color next to her added, “This is my back yard with my basketball hoop that’s been
there forever” (FG 3, p. 2, line 49). This focus group conversation highlighted how differences
based on race and class, which many times intersect, can hinder community building and make
students with less resources and less classroom representation feel unwelcome and alienated.

General Education Assessment: 2016 95
Recruitment. Recruitment was another topic addressed in the focus groups. Participants
discussed how the OSU cultural climate inside and outside of the classroom is pivotal in
ensuring future student recruitment. Several students of color referred to OSU as a
“Predominantly White University” (PWI). Although this is indeed prevalent, standard
terminology for institutions like OSU, the White students who participated in this project never
referred to OSU this way. This repeated terminology selection by students of color was an
indication of their institution not fully representing them. As one student commented, “I mean
there’s not like a lot of like African Americans ‘cause I know in some of my classes like I’m the
only one” (FG 2, p. 10, line 321). Students of color commented that they had to step outside of
their “comfort zone” . . . “cause there’s really not many of us” (FG 2, p. 10, line 331).
One student suggested talking to “predominantly black high schools” for recruitment,
citing that “the cost might deter people” and some “think that they can’t [go to college] so they
don’t even try” (FG 2, p.11, line 342). Another female student of color asserted:
“I feel like if we were doing more to actually uplift ethnic students on campus, then we
would probably see a higher percentage of them coming to schools, because we would
see a higher percentage of students actually conveying back to their communities that this
is really an inviting and safe place to be….I came to OSU and things just kind of
changed, not altogether, but there are small instances that happened… and so I can’t like
really go back and be like, ‘Oh yes, this is the best place for you to send your minority
child,’ you know, if things like this occurred to me” (FG 3, p. 18, line 598).
When asked, “what happened?” she proceeded to elaborate about this “small thing:”
“I have two Caucasian roommates, and one day -- this year actually -- we were walking
back um uh to another friend’s house from campus and this um truck of guys pulls up and

General Education Assessment: 2016 96
it’s just me and these two White guys, and this truck of guys pulls up, and they stop and
they just yell out ‘What’s up, you nigger fuckers?’ And it was very…things like this
happen, you know, and it’s very off-putting…” (FG 3, p.18, line 614).
When the researcher asked her how her friends dealt with what happened, she said, “They didn’t
know what to say. We just kinda, we just kinda all stopped for a second and took a breath, and
we just kinda kept walking. And to be honest, we really haven’t talked about it since” (FG 3, p.
19, line 635). While other participants in the focus group were shocked and sympathetic to this
participant, it is clear that this young woman has reason to express her concern about safety and
future recruitment for OSU. Another student echoed concerns about safety, saying:
“When we’re trying to strive to do so much more here on campus – and we’re trying to
strive to be a diverse campus, but if students don’t really feel safe here, if diverse students
don’t feel safe, then how are we doing that, you know?” (FG 3, p. 20, line 650).
Supports, groups, and events. In addition to recruiting, participants reported that
learning about diversity needed to be a more integrated and a more holistic experience while
students are attending OSU. The OSU campus in general was considered to be “welcoming
different diversities” and “welcoming different people no matter what” (FG 2, p. 5, line 133)
with several programs and student services, such as the Office of Multicultural Affairs, Campus
Life, and the Retention Initiative for Student Excellence (RISE) all playing prominent roles in
supporting student success, especially for students of color. One student photographed a plaque
that highlighted the role of the Student Union (see Figure B2) and suggested that the Student
Union plays a strategic role in reinforcing and supporting the message that diversity is welcome
at OSU and should be better utilized in that regard (FG 2, p. 6, line 170).

General Education Assessment: 2016 97
Participants recommended that OSU student organizations should work together
“promoting more diversity events,” providing “more space and learning experiences for people”
(FG 4, p. 4, line 136). They felt that one of the challenges is that those who belong to the
different student organizations “are more open to diversity, so it’d be harder to reach out to
people who aren’t” (FG 4, p. 10, line 345). Participants recommended using these events to
further dialogue in the classroom (FG 4, p. 10, line 347), as well as having students participate in
group work, especially with students from different backgrounds (FG 1, p. 2, line 75; FG 1, p. 5,
line 192), and going outside the classroom to discover and learn about diversity so that students
are exposed to “like get a mixture of like ideas” (FG 2, p. 69, line 188).
Among the programs or organizations most highlighted were RISE and the Big 12
Conference on Black Student Government. Students found RISE very helpful and inclusive of
“many different races” (FG 2, p. 8, line 249). When describing one of her pictures (see Figure
B3), one participant noted that in RISE people work together and “interact in the room like they
help each other” (FG 2, p. 8, line 257) and “like everyone is like accepted” (FG 2, p. 8, line 265).
Additionally, the Big 12 Conference on Black Student Government was credited to bringing both
international and US Black students together, reflecting a large amount of diversity within the
group (FG 3, p. 4, line 116). One participant said, “… we have that sense of community within
our black community” (FG 3, p. 10, line 310). She also noted that the international students also
bond together at the conference because they “came here from far away” (FG 3, p. 10, line 315).
Participants felt that advertising diversity and cultural events could be improved. Even
with bulletin boards, A-frames, and the OSU events calendar, some students reported that they
were uninformed and wished that they had “known about some of these opportunities” (FG 4, p.
5, lines 163 & 176). Participants commented that “the bulletin boards are really cluttered” (FG 4,
General Education Assessment: 2016 98
p. 6, line 218) and the advertisement needs to be dispersed throughout on campus, not just
concentrated around the Student Union, since some students live off campus and the Union is not
frequented by everyone. Participants suggested that event publicity could be reinforced with
professors and advisors emailing their students, and they recommended having an OSU app “that
had all the events” (FG 4, p. 6, line 186).
Spaces and Places
The third theme, Spaces and Places, was chosen to represent 53 different initial codes.
Two sub-themes elucidate key constructs that are central to this theme: (a) physical brick and
mortar places and (b) emotional/affective spaces. Each sub-theme will be addressed individually.
Physical brick and mortar places. Students repeatedly discussed the importance of
buildings, international malls, walkways, study areas, signage, and centralized events as a
catalyst for exposure to experiences in diversity. In discussing a photograph in a focus group
(see Figure B4), one participant said:
“I like this picture [of a walkway on campus] because it’s just where everyone from
different nationalities, cultures and backgrounds, [from] agriculture majors to physics
majors, English majors, are going to the Classroom Building. They’re all just crossing, so
it’s like a highway….so it’s really great in terms of just bring[ing] people together in
terms of showing them different cultures around OSU” (FG 1, p.3, line 111).
This student further explained that international students and various international festivals
frequent the specific area noted in the photograph, which creates a serendipitous “crossroads”
where students are exposed to diversity in their daily routine. Another student, who took a
picture of the international mall (see Figure B5) where flags of various countries are displayed,
shared similar sentiments: “I felt that was interesting because I felt like the college was
General Education Assessment: 2016 99
welcoming different diversities, welcoming different people – no matter what” (FG 2, p. 5, line
132). This same student noted placement of international flags and LGBT signage throughout the
Student Union. It was clear that something as simple as a flag, a sign representing various
groups, or an area meant to bring people together was important to students.
The Student Union, a central hub for students at Oklahoma State University, was often
discussed as a key building for groups to gather. One student said:
“Whether or not [groups of students are] sitting together or conversing together is the fact
that you can go into the Student Union – which we are blessed to have like an amazing
facility as the Student Union here at OSU – so that is what attracts all the students to at
least one area of campus, and then like you said, I think it is just working on what
restaurants, activities, whatever, that you have inside the Union is going to kind of, you
know, stimulate that diversity interaction” (FG 5, p. 3, line 90).
Though this statement demonstrates the importance of a gathering place, it also highlights
the need for more than just a building. Though the physical place was provided, and participants
recognized a diverse student body, they also discussed how the groups do not often intermingle
(as noted in the participant’s statement above).
Students often shared that these spurious interactions were an important part of their
experience at OSU. One participant noted:
“OSU’s really good at creating places where you’re going to have like exchanges with
people, and I don’t know, just walking along side people I think…I learned more on my
own just walking and observing things than I did from enrolling in a diversity course”
(FG 5, p. 12, line 426).
In discussing a plaza on campus, another student shared:

General Education Assessment: 2016 100
“Some things that I’ve been a part of just because I was walking from class to class. It
wasn’t like I saw it on a flier and took the time to be a part of it, but actually on that same
like courtyard there, one time, … there was like a big cookout thing, and it had
showcased all these different foods of different cultures of OSU students…I went over
there [to the International Bazaar] and saw it and like ate it up, and just like that’s really
cool!” (FG 5, p. 14, line 516).
In reference to using the OSU transit system, one student explained:
“[Riding the bus] is a great opportunity for students to kind of have that interaction with
diversity… just sitting on the bus this year, I’ve had conversations, and experiences, and
like kind of observed all kinds of things, whether it’s someone texting next to me in
Chinese … or you know, just overhearing conversations about different like people’s
days” (FG 5, p. 11, line 396).
Though these interactions are not always viewed as key diversity delivery strategies, the
physical places played an important role in bringing the diversity that does exist together.
Though the campus buildings and walkways were important, a number of students shared
that there must be purposeful planning around the physical structures to make the interactions
meaningful. One participant noted:
“I do think that it takes more than just maybe an International Mall with a bunch of
international flags, or maybe just you sending out a couple of brochures to incoming
students with a couple of um outlying ethnicities on them to say we’re a diverse campus,
you know? I feel like there has to be actual power and motivation and action behind
those words, and I don’t know, sometimes I look around and I don’t feel like that’s really
fully expressed by OSU” (FG 3, p. 12, line 370).

General Education Assessment: 2016 101
When reflecting on attending cultural events, the same student also reflected:
“I think that in these moments at these cultural events, it’s always a great time, you learn
so much, and you get to branch out and meet new people, but I just hope that people, like,
I want to stress that I hope people don’t lose sight that there’s a whole world outside of a
cultural event that we should probably try to stay in [touch] with and, you know, harness”
(FG 3, p. 15, line 490).
Emotional/affective spaces. Students also often discussed spaces that were either
emotionally safe or unsafe. The second sub-theme focused on the affective responses to various
spaces on campus. A discussion that typifies this sub-theme involved a student feeling safe and
accepted due to the presence of LGBT signage and affirmation in a space. This student noticed a
LGBT logo on an assistant’s desk that read, “No matter whatever you are, you know, you are
always welcome here. This is a safe zone” (FG 2, p.5, line 134). These types of safe spaces were
repeatedly identified and discussed as important. Edmon Low Library was also discussed as a
safe place. One student explained that the basement was a refuge during tornado warnings, but
seemed to extend that sentiment in describing that it was also a space where she could be
vulnerable, safe, and protected. She said:
“I took that picture [of the Edmon Low Library] – I feel like it just represents a lot of
diversity within itself, in and of itself, because of the fact that like so many people are
welcome in the library…I’m just appreciative of the Edmon Low Library because I think
it’s just so much more than just a library” (FG 3, p. 7, line 207).
Participants also described classrooms as spaces that were both very warm and also
awkward and unsafe. One student shared an example of a professor creating a safe space for
discussions of diversity:
General Education Assessment: 2016 102
“I think when professors are comfortable enough to be, like tell a personal story, that they
want you to know that they can relate to a situation or something that you might have
gone through, like…one of the days we were talking about diversity [my professor] had
told us a story of something that had happened to her and then she opened the floor – she
was like, ‘Has anyone like ever had something happen to them where they experience
something because of their race and culture and stuff like that?’… I remember one boy,
he spoke up, and he kind of told one of his experiences, and then another girl did, and
then I did, and so it was just really neat ‘cause it was kind of like a moment where she
like opened up that door to us to make us feel comfortable, and then that, like throughout
that class period we were just like, ‘Wow, I’m not the only one that that’s happened to!’”
(FG 4, p. 13, line 481).
Though this example is encouraging, other participants described unsafe classroom
spaces. One participant shared that “sometimes the professor in this class, um he will say things
that kind of, well he’ll say racially charged things and then he’ll look at us [minorities] for
affirmation on these things…I cannot let myself do that” (FG 3, p. 17, line 573). In reference to
the fact that typically there are only one or two minority students in a number of classes, several
participants noted they felt singled out in class due to their minority status (see examples in
Course Quality theme above).
Even more alarming, a number of students shared experiences where they felt unsafe
while on the OSU campus. One such example was shared above in the OSU Experience theme,
where a participant described how a group of men shouted racial slurs at her and her friends as
they were walking along a street towards a friend’s house. A different participant shared another
incident that involved a group making monkey noises at a student of color and her friends: “One

General Education Assessment: 2016 103
night I was coming from the store and, you know, I was with a few friends, and this guy, he was
Caucasian of course, but this guy he kept circling us and calling us monkey noises” (FG 2, p. 12,
line 387). The impact of these experiences on students was profound, but support and action was
limited. Students that were violated in this way lost a sense of safety on campus, described a
heightened awareness of issues related to diversity, and often explained that they felt they were
to forgive and move on, rather than seek support.
Finally, students of all racial backgrounds expressed angst in discussing the topic of
diversity. Throughout the focus groups, students were hesitant in naming other ethnic groups
and struggled to use what they perceived to be the correct verbiage. One White student shared
that, “…we are now raised in society where [diversity] is…such a touchy subject, so I think a lot
of people are very even hesitant about like even talking about diversity” (FG 5, p. 13, line 463).
Students expressed a lack of a safe space to have difficult conversations related to diversity.
Grouping
The theme of “grouping” emerged from the data as students photographed groups of
people and discussed similarities and differences in the focus groups. Codes and concepts that
helped develop this theme were comfort, “clumping,” othering, languages, similarities,
differences, segregation, and integration.
Comfort and “clumping.” Participants noticed that people from similar racial, ethnic,
and/or cultural groups tend to hang out together. With regard to his own circle of friends, one
participant noted "...there's a pretty large group that I've interacted with at OSU where I gotta say
those are like me - those individuals come from the same background or I can relate with them
pretty closely..." (FG 5, p. 14, line 479). Another participant pointed out that:

General Education Assessment: 2016 104
“...when we walk through the Student Union, um it’s - you're always like quick to see
different, just like ethnic groups like, but they're like always like all together, so I mean
you have, you know, whatever group that's always sitting in this corner and they're
always conversing together and then there's that group, and they're always you know
sitting in that corner and conversing together..." (FG 5, p. 3, line 78).
Several participants referred to this grouping as “clumping” together, and they also noted
that this clumping was both out of choice (for safety and comfort) and out of requirement
(sometimes making it uncomfortable). With regard to this togetherness as comfort, one
participant commented, "Like even just walking through campus, like you can tell, like they
[students of similar race/ethnicity/culture] just like hang out together, but I think the reason for
that is just is their comfort zone is" (FG 4, p. 10, line 339). While participants recognized that
this clumping or grouping often happened out of comfort, they also noted that at times, being
required to group together could be uncomfortable. For example, one participant said:
“I mean because we all want different, you know, we all have different majors, different
dreams, different, you know, whatever, so you can't just clump in one class and expect us
to just, you know, have different experiences, 'cause we want different things in life..."
(FG 2, p. 11, line 336).
Participants often noted that international students in particular “clumped” together. One
participant said "…oftentimes I find that they [international students] sort of -- everyone kind of
clumps together and kind of has their own study groups…" (FG 1, p. 2, line 49). Participants
seemed to believe that groupings of students may be related to language or some other similarity.
For example, a participant noted:

General Education Assessment: 2016 105
“...when I'm thinking of a diverse group, it's two things come to mind: one their primary
language is something that's not English… You think of international, or just a different
ethnic group to where I mean I cannot carry on a conversation with them, or someone
who is just raised very differently, different socioeconomic or upbringing or whatever...”
(FG 5, p. 14, line 481).
It is important to note that participants often used the language of “othering”—using
terms like they to describe people different than themselves. This “othering” was common
among most participants who discussed grouping or clumping and is demonstrative of yet
another type of grouping (“us” or “me” vs. “them”). Participants did not directly address the
“othering” language, but the researchers found this to be an important aspect of the conversation
to highlight when summarizing how participants described the diverse groups around them.
Bringing groups together. In addition to noticing and discussing how similar groups
spend time together, participants also discussed the diversity on campus and the importance of
bringing groups together. In particular, several participants noted that just being at the same
university brought groups together. For example, while describing her photograph (see Figure
B6), one participant reflected:
"And in this picture I see there are lots of different students, different fashion styles,
obviously we can't tell of course, but there are going to be different majors and people
from different places, different states and cities and even countries, just people with a lot
of different backgrounds and yet here we all are at OSU" (FG 1, p. 3, line 88).
Another student also discussed one of their photos (see Figure B7) by saying it captured
"…many people from different cultures, from different backgrounds, different sex or orientation
you may call it, but we're all clumped in together…" (FG 1, p. 6, line 230).

General Education Assessment: 2016 106
While the university seemed to provide some common ground for diverse groups to
coexist, many participants noted that intentional efforts to bring the diverse groups together was
important. One participant seemed troubled by the grouping or clumping he noticed:
“Like you walk in there [Student Union] and I do notice and I am impressed by the
amount of different cultural background or just races or whatever you see in the Union,
but how are we going to get it to how it's so separated. If you can notice it, then I think
that says it's a problem" (FG 5, p. 3, line 95).
Other participants echoed the importance of helping groups interact. For example, a participant,
after noting the diversity on campus, questioned “...how can we bring diversity together or these
different groups together?" (FG 5, p. 3, line 86). Another participant noted, "There's the locals,
there's the internationals, there's the Greeks, there’s the...so we have that diversity, it's just the
fact that it's not all together is that is the issue for me" (FG 4, p. 9, line 329).
While many participants shared a common belief that bringing diverse groups together
was important, some participants recommended doing this carefully. One student shared, “What
I think is wrong is that OSU puts people who have never been around these other people,
different languages, or people who had never been in that kind of teaching style, it just puts 'em
right in there with 'em’” (FG 5, p. 7, line 234). Clearly, this highlights the need for careful
consideration for when, where, and how diverse groups are brought together so that students feel
comfortable as they learn about people different from themselves and the interaction can be a
more positive experience. Nonetheless, the data clearly shows that students are cognizant of
diversity among the student body, are aware of differences, and notice like groups “clumping”
together. Participants agree that these groups are necessary for nurturing affiliations and
identities, but the intermingling of groups is also important during the college experience. As

General Education Assessment: 2016 107
one participant summed it up, "...although we have very different perspectives, it's about
bringing those perspectives or bringing those people together" (FG 5, p. 3, line 87).
Responsibility
The theme of responsibility developed from discussions regarding accountability for
addressing issues of diversity at OSU. Key words that emerged in this theme were institutional
requirement, shared responsibility, false ownership, dual responsibility, intrinsic motivation, and
student and instructor responsibility.
University and personal responsibility. As mentioned in the Course Quality theme,
most students were aware of the institutional requirement that all undergraduates take a ‘D’
course prior to graduation and thus took responsibility for taking the course. Some participants
spoke positively about the requirement and understood why the institution implemented the
requirement. As one student acknowledged, “it’s because our school is really trying to get
people just well-rounded about different cultures, religion, and just anything” (FG 1, p. 1, line
33). Other students were unaware of the course (see Figure B8) or felt like the D course
requirement did not enhance or build on their level of understanding.
Some students mentioned that they recognized the university’s responsibility to expose
students to diversity issues, while others felt that at least some of the responsibility fell on
students. One participant expressed a desire for more required courses, saying “I took several
other diversity courses…incorporating more diversity classes would really expose other
Oklahoma State students to the diversity that I think is important” (FG 1, p. 4, line 138).
Another participant felt that the responsibility of learning about diversity issues is more up to the
student, saying:
General Education Assessment: 2016 108
“…there’s only so much OSU as like a body can do, you know, because it has to come
from within. So we can shove diversity, you know, in people’s mouths, but they’re not
gonna -- like their mindset isn’t gonna change and that’s what has to change, so I think
that’s the issue right now” (FG 4, p. 4, line 143).
Some participants echoed a similar sentiment regarding instructor responsibility. One of the
follow-up questions that emerged from one focus group asked participants if they thought that
instructors needed to prepare the class for discussions about diversity. Participants suggested
that an instructor can introduce the topic but can also only do so much. A participant responded:
“I think there is only so much a teacher can do. I think it also comes from the actual
students, you know? I think a teacher can say, ‘Ok, we’re going to sit and we’re going to
talk about this issue. We’re going to be open.’ But at the same time, the students have to
feel that urge like have to feel that ‘Yes, this is an issue that we actually do need to talk
about. It’s something that’s important in our lives now’” (FG 4, p. 2, line 71).
Placing responsibility on students of color and false ownership. Several times during
the focus groups, there were discussions that seemed to place some responsibility of teaching
others about diversity on students of color. This sentiment was subtle but clear and consistent.
Almost exclusively, it was students of color who seemed to take responsibility for dealing with
diversity issues, even when the student was him/herself on the receiving end of insensitive or
exclusionary events. When coding this data, the researchers often coded this as ‘false
ownership.’ The false ownership of responsibility for encouraging awareness of diversity issues
occurred in several ways. One example is from a student who was reflecting on what it is like to
be the only African American/Black person in a classroom and how she interacts with other
students. This participant shared:

General Education Assessment: 2016 109
“And with not being very many of us [African Americans] in class, I just say we just
need to step outside of our comfort zone. Um I mean ‘cause there’s really not [emphasis
here] many of us, so I just feel like I don’t know either you step outside your comfort
zone and do what you gotta do or, you know, you just I don’t know be comfortable, sit
back, or whatever the case is” (FG 2, p. 10, line 330).
Another participant also reflected on interaction with others and whose responsibility it was to
reach out and share cultural knowledge and events with others.
“I think that a lot of the cultural events on campus gather the same audience, which is
people who are already emerged into cultural areas, so maybe like somehow the students
that are in charge of these [cultural] organizations should work with like different
organizations like the Greek life or like work with you know, I don’t know, other non-
like very emerged into cultural things I guess, so they can plan events together and the
way both parties go” (FG 4, p. 4, line 139).
In both of these examples, the students of color have expressed responsibility for taking the
initiative to share with or reach out to others (most often, the White majority). There was no
expectation in the students’ reflections that the White students reach out to them.
Another example of false ownership can be found in how students of color responded to
situations and incidents where they were victims of hate or faced difficulty as a result of
someone else’s ignorance. For example, the story that was recounted in the ‘OSU Experience’
theme where a student told about how a truck of ‘guys’ drove by and yelled a racial slur at her
and her friends, she said that no one in her group did anything when the incident happened, and
no one has talked about it since. After she shared that story, one of the other participants in the
focus group (also a student of color), said, “Yeah, if you can talk to your friends about that, I

General Education Assessment: 2016 110
would bring it up again, ‘Remember that time when that happened? How did y’all feel about
that now?’” (FG 3, p. 21, line 703). In this example, the responsibility to bring up the incident
and process what happened seems to fall to the victim. Similarly, a participant reflected on
difficult things that happen and said:
“‘Cause you have to be reminded sometimes we go through things or most or all the time
we go through things, it’s not about us, it’s about helping others, and so you have this
story that could really – it’s unfortunate it happened to you, but you could really use it to
fuel to help others” (FG 3, p. 22, line 713).
In this example, the negative experiences of persons of color can be used to help people
recognize the effects of their behavior on others. While this is a positive sentiment and these
stories may indeed make help others make better decisions with regard to how they treat one
another, the person of color has to experience terrible things in order to help illicit change in
someone else.
One other example of a person of color taking responsibility to right someone else’s
wrong can be found in a participant’s narrative of reading a textbook that, in her opinion,
presented incorrect information about Arabs and Muslims. Being an Arab American Muslim
woman, she reflected on how much this text bothered her:
“But it was just having the idea of them kind of judging you that kind of bothered [me].
But it does get to you. You try to tell yourself it doesn’t, but it does, so but I mean I
would still talk about it but just -- it was one [passage] about like a Muslim woman, [that
said] they usually stay home. It was like the stereotypical ‘Muslim women don’t have
rights’ and I was like ‘really?’ I took a picture of it and posted it on Facebook because it
bothered me so much from the book, but we…did talk about it in class, but it’s just

General Education Assessment: 2016 111
amazing to me how these books that we teach other students with, they [my classmates]
were lucky ‘cause they had me in the class to give my perspective, but think about the
other classes that are just learning it from this book and that book was specifically made
for OSU” (FG 4, p. 9, line 303).
In this example, the participant felt responsible to dispel a stereotype about her culture and
acknowledged that her classmates were fortunate to have her in class to help teach them. While it
is indeed fortunate that others could benefit from her willingness to share and speak up, it should
not have been a students’ responsibility to correct a textbook in this way.
Dual responsibility. It is important to note that while there were several instances where
individuals accepted or assumed responsibility for learning about diversity issues, there were
examples where participants voiced expectations of dual responsibility, where no single person
or entity is responsible for this type of learning. There are hints of shared/dual responsibility in
the ‘University and Personal Responsibility’ section above, where students acknowledged that
the university, instructor, and student can only do so much individually. In discussing dual
responsibility for learning about diversity issues and interacting with others (particularly with
regard to international students), one student pondered:
“…I don’t know if like we as, you know, American born and raised Asian Americans are
taking…enough initiative to step in and help them [international students] out. And I
think the fact that we are Asian, it makes us a little bit more approachable, which is why I
think they [Asian international students] come and that they feel comfortable about
coming to me and asking for help. But, you know, the other people in our classes they
think that maybe if there was some way or if they would like take that initiative to step in
and give a helping hand, and it’s not kind of like our side and maybe international
General Education Assessment: 2016 112
students’ side meeting in the middle to like break that comfort zone on both sides” (FG 1,
p. 2, line 77).
Hesitation
Another major theme that emerged from the Photovoice study was hesitation.
Consistently, throughout the focus groups students were hesitant to talk about issues and unsure
about how to address topics of race, ethnicity, and diversity in general. However, though they
were fearful of saying the wrong thing, they were willing to try to engage in conversations for
this project. As one participant out it, “Just kind of like just talking--talking it out is really
helpful” (FG 1, p. 9, line 304).
Fear of offending. Participants expressed their desire to share personal experiences about
diversity but also shared their hesitancy to share for fear that they might offend someone. In
describing a photograph he took (see Figure B9), one participant said:
“…I’m afraid to express diversity issues probably because I’m scared, or probably
because I might offend someone so I kinda see it as how I’ve grown up at OSU and how
I’m still working on expressing my diversity, so I kind of put this picture here because
the emptiness shows that I still have a lot of stuff that I need to work on to allow people
to be exposed to my culture…” (FG 1, p. 5, line 164).
When reflecting on what he has learned about diversity both at school and during his time in the
US Army, the same student said:
“…I can’t really talk about stuff like that [concerns about diversity issues] without
offending someone because…I can’t explain what it’s like to be African American. I just
can’t…it’s like when people come from war, there some things that we just don’t want to
General Education Assessment: 2016 113
talk about…There are some things I just can’t talk about it so I try not to talk about it a
whole lot” (FG 1, p. 8, line 272).
Participants were also cautious in how they worded their thoughts and opinions during
the focus groups; this was true of students of all backgrounds, races, and ethnicities. They were
sometimes hesitant to share for fear of saying something that might be offensive. One student
said, “…I’m trying to phrase this in a way that doesn’t seem off putting to anyone...” (FG 5, p. 7,
line 227). Another student commented, “I’m trying to think of the right verbiage here” (FG 5, p.
9, line 315). When asked about the hesitancy to name or discuss ethnic groups, one student
reflected:
“I think…we’re now raised in society where that is such like a – it’s definitely okay like
all African Americans -- you know...even right now I’m hesitating even like naming off
these ethnic groups...just because it’s so -- it’s like such a touchy subject so I think a lot
of people are very even hesitant about like even talking about diversity, personally” (FG
5, p. 13, line 463).
The same student shared that she was nervous to participate in the study at first, and she felt she
needed to talk it over with one of the researchers first. She said:
“…all I think about is….how touchy of a subject that might be sometimes, so it was kind
of like okay, I need to go, you know, talk to you as a professor and make sure that I’m
understanding exactly what this is because I don’t want to step on anyone’s toes, or I
don’t want to take the wrong approach to diversity ‘cause I feel like it is something –
especially in like I don’t know if it’s just like how I’ve been raised, but just like just in
culture as general it’s just such like a touchy thing I feel like nowadays…” (FG 5, p. 13,
line 470).

General Education Assessment: 2016 114
During another focus group, one participant commented that the project was “very hard”
for her. She went on to talk about the project being difficult because she didn’t know what was
expected from her. The researchers in the study made every attempt to remind participants that
there were no right or wrong answer, but participants were still noticeably worried that there
were correct and incorrect things to say. One participant requested, “I need to know exactly what
you want, ‘cause this wasn’t hard but it was hard. Because my diversity and my experiences are
different from probably what you all are looking for or what you all have experienced…” (FG 2,
p. 10, line 30). When reflecting on whether or not she wanted to participate in the project,
another participant said, “…I wasn’t like trusting myself of knowing what the correct definition
of diversity was…” (FG 5, p. 13, line 469). In another group, a participant made reference to
political correctness, saying “I see people that are from like maybe the Middle Eastern area, um,
then I see you know of course the majority who are, I don’t know if I should be politically
correct and say White people or Caucasians?” (FG 3, p. 9, line 280).
Fear of being singled out and failure to relate. Students of color noted their hesitancy
to speak up about diverse issues for fear of being singled out or being the spokesperson for their
race (see comments about “becoming the teacher” in the Course Quality theme). Additionally,
they were concerned about not being about to relate to their peers in the classroom because their
experiences and perspectives might be dissimilar. Students of color often agreed or seconded
each other’s statements about being aware that they were the only person of color in class. For
example, one student noted that she could relate to her fellow focus group participant, especially
“…the things he was like saying about not being able to relate to people in the class, um because
of being the only black person most of the time…” (FG 3, p.3, line 89). Further, as mentioned in
the OSU Experience theme, students of color were the only participants in this study to refer to

General Education Assessment: 2016 115
OSU as a “Predominantly White Institution” (PWI). One participant recounted that while in a
class where they were discussing race, “…I actually had a friend um uh say to me…‘Does it
really matter because those things didn’t happen to you?’” (FG 3, p. 18, line 612).
Uncertainty in handling difficult situations. When participants did share personal
experiences in the focus group, they also shared how those situations were handled by those
around them. Most often, the situations were not addressed due to the hesitancy or avoidance of
those who witnessed the incident. Recall from the OSU Experience theme that a student told a
story about how a truck of young men drove by and yelled a racial slur at her and her friends.
She said that no one in her group did anything when the incident happened, and no one has
talked about it since. When the participant shared the story, other focus group participants
expressed concern about the incident and could not understand why her friends were silent and
never addressed the incident. The participant responded:
“We’re all learning from each other. And you know they might not know uh how to
respond to it, but sometimes picking up, well you just don’t talk about it. No! To me
that’s not the answer. But it was an awkward, terrible situation that happened, but I don’t
think that it’s something that -- I would even bring it up” (FG 3, p. 21, line 708).
It was clear that even in these very difficult and clearly racist and traumatizing situations, there is
hesitancy to respond or do something—the lack of knowledge of how to deal with these types of
situations becomes clear. It appears there is recognition that these issues need to be talked about
and addressed, but no one seems sure of how to do this.
Use of Results/Suggestions for Use
The results of this study may be beneficial for colleges and universities, specifically in
the area of assessment and understanding student learning. The information gained from

General Education Assessment: 2016 116
students in this study will help this university (and potentially others) to understand what and
how students are learning with regard to the general education outcome of diversity. Further,
findings from this study may help this university develop programs, activities, and resources that
will help expand opportunities for students to incorporate diverse experiences into their college
career, both inside and outside of the classroom. Understanding what students are (and are not)
learning will allow the university to maintain successful programs/curricula and develop
additional opportunities for students to learn about diversity issues; this will contribute to student
success (academically, professionally, and personally) both in college and beyond. Finally, this
study serves as an important demonstration of OSU’s efforts to understand student experiences,
assess learning outcomes across the undergraduate curriculum, provide necessary data for
internal and external accountability groups, and demonstrate value added. Specific suggestions
for OSU based on the data in this study follow.
What is Going Well?
This project has its beginnings in the conversation from a joint meeting of CAGE, AAIC,
and GEAC in 2014, where attendees noted that they felt that the university’s assessments were
not accurately capturing what students experience and what they are learning about diversity.
The results of this study at least in part support that statement—students are learning about
diversity. We, the researchers, felt it is important to point out what students reported as positive,
as these things should clearly be continued and/or considered as these results are used to refine
the assessment process and make changes to current practice.
First, it is important to note that, at least among the students who participated in this
study, there is a willingness to have critical dialogue about diversity issues. Students
demonstrated empathy for the human experience and an interest in thinking critically about

General Education Assessment: 2016 117
diversity. The participants in this study all belonged to different demographic and social groups,
and they spent time thinking and reflecting about other groups and their perspectives.
Participants acknowledged differences, similarities, inequities, and difference in opportunity.
Further, the students also spent time highlighting programs and spaces that already exist
on campus where they feel safe and learned about diversity. There were many places that
students felt were comfortable (such as the library and the student union), and places where they
felt were physical markers that emphasized a campus commitment to diversity issues (such as the
international mall). Participants also discussed programs that are already in place at OSU, such
as Cultural Night, where they learned about other cultures and people in a safe, positive way.
These places, spaces, and programs are important to students and should be nurtured by
university faculty and staff in order to continue to provide students with important safe places
and experiences. This study also seemed to provide students with an opportunity to safely talk
and discuss their experiences and perceptions. The social climate regarding diversity issues in
our country over the past few years has shown that students want to be heard and want a place to
share, talk, listen, learn, validate—this study was an opportunity to provide that, which is an
important consideration when determining if and how to continue studies such as this one.
Finally, there was recognition among participants that they learned about diversity issues
in D courses, as well as in other courses and experiences across campus. It is clear that
‘diversity’ is not the responsibility of one person or office on campus, nor is it the responsibility
of the university alone, as students in this study acknowledged that there is individual
responsibility in learning about diversity issues. Further, while students reported some negative
experiences in their courses, they also provided some good examples of experiences in classes
where professors are willing to open and give opportunities for discourse about student’s lives
General Education Assessment: 2016 118
and perspectives. Also, at least one participant noted that she learned about diversity in class
even when she did not expect to. Thus, though there are recommendations to follow about how
to improve students’ experiences in courses, it is important to take a moment and celebrate the
fact that students recognize that they must take these classes and learning is taking place for
some students. Based on the results of this study, the courses can be refined but certainly should
remain an important part of the curriculum.
Instructor/Faculty Training
Instructor/faculty training is necessary to help those teaching these courses create safe
spaces, handle controversial issues, provide resources, create helpful and meaningful
assignments, and facilitate discussion that does not single anyone out or silence any one
perspective. The onus is on the instructor/faculty to make the most of the course and build
community in the classroom so that no one feels too “uncomfortable” to share because he or she
is alone in his/her experience. Good pedagogy is important in order to gauge appropriate timing
and sound activities to help shift a student’s mindset to be open to dialogue about sometimes
difficult and/or sensitive issues about difference and privilege.
At OSU, the Provost’s Initiative: Focus on General Education could be a good outlet in
which to help provide this training. Some online trainings could also be developed so that anyone
who wishes to learn more about creating a safe and comfortable classroom space (regardless of
whether they teach an ‘I’ or ‘D’ course) could easily access the training. Such training may be
required for anyone who teaches an ‘I’ or ‘D’ course, and this requirement could be made known
when a person or department applies for ‘I’ or ‘D’ designation for a course.

General Education Assessment: 2016 119
Tangible Support and Serious Action
OSU is described as a friendly place in marketing materials and by our own students, but
this study revealed this is not always the case. Some students feel alienated before classes even
begin [this was demonstrated when some participants made reference to their awareness that they
were attending a Predominately White Institution (PWI)]. Purposefully creating a culture where
underrepresented populations are attracted to OSU and are supported and welcome for the
duration of their time at the university is a must. A start to this would be promoting more of a
‘we’, less of a ‘us vs. them’ attitude and dialogue. This study supports the need to go beyond
symbolic support (e.g., hanging plaques, flying flags, etc.) and take actions that demonstrate
there is power behind the words and gestures that are made with regard to inclusivity and
support. An increased campus-wide effort to provide more programs, tangible support, dialoging
on diversity issues, and redirecting or reprimanding inappropriate actions is needed, rather than
having these efforts occur in “pockets” or in departments whose job it is to promote and handle
diversity issues and diverse students (e.g., Division of Institutional Diversity, the Office of
Multicultural Affairs, the Department of Housing and Residential Life, the International Students
and Scholars Office, etc.).
Safe Places for Authentic Discussion and Expression Providing spaces and places for authentic conversations for all students (‘majority’ and
minority) is critical. As evidenced in this study, students (and others) are reluctant and hesitant
to engage in dialogue that they deem difficult or sensitive; it is vital that spaces are created for
students to have conversations on diversity issues and difficult topics in order to encourage
learning and understanding. Training for how to create safe and comfortable spaces and engage
in meaningful dialogue is crucial, and it must be attended and supported by members from all

General Education Assessment: 2016 120
stakeholder levels (i.e., students, staff, faculty, and administrators). As evidenced by one of the
participants in this study, when influential people (in her case a course instructor) appropriately
share personal narratives and experiences, others are made to feel more comfortable and realize
they are not alone. Providing training for how to share personal narratives and how to handle
those that are shared is vital so that awkwardness is mitigated, over-addressing is minimized, and
conversations are handled well. Discussions about diversity issues and authentic expression
should also be incorporated with stakeholders when they enter the university system—for
students, this could start in orientation seminars, and for faculty, staff, and administrators this can
start when they are selected for hire. This also helps provide an opportunity to demonstrate
action behind statements of inclusivity and acceptance.
Campaign, Response, and University Culture The university has engaged in training for a variety of serious issues that affect college
students and campuses, and this project provides evidence that diversity discussions is another
such issue that needs purposeful attention. A campaign (similar to the
https://1is2many.okstate.edu/ effort) that highlights resources for students, faculty, and staff who
may face a diversity-related issue or want to engage in further dialogue would be beneficial.
Creating a bias response team (similar to BCT) for diversity issues is important for ensuring
concerns and issues are being actively watched for and addressed before they become major
problems would be helpful. Providing bystander training (similar to Cowboy Up!) to help
students, faculty, and staff learn more about how to handle difficult, discriminatory, or racially
charged situations that they may witness helps create a culture of “we” on campus and further
provides an opportunity to demonstrate action behind statements of inclusivity and acceptance,
which helps contribute to a university culture where there is a desire for and appreciation of

General Education Assessment: 2016 121
diversity. Finally, highlighting diverse programming already offered on campus can help
students learn more about the world around them without ever leaving OSU; this can create
experiential learning opportunities that can be beneficial in and out of the classroom.
Suggestions for General Education (‘D’ and ‘I’ Courses) One of the major takeaways from this project is that how a course is taught matters in
terms of what students learn—whether or not a course carried a ‘D’ or ‘I’ course designation
seemed to be of minimal importance compared to the experiences the students had in and out
class that helped facilitate dialogue and critical thinking on a given topic. Open discussions in
class, opportunities for experiential learning, incorporating activities that foster collaboration,
and employing pedagogy and methodology that promote student interaction is critical. Ensuring
all instructors of ‘D’ or ‘I’ courses have reviewed the rubric used for assessment of ‘D’ and ‘I’
courses would be helpful in providing guidance on the types of assignments that will be most
beneficial for university-level assessment of student learning in these courses. Also, ensuring
that instructors of these courses have all undergone training (as mentioned above) is critical in
helping ensure the classroom environment and experience is given important consideration in
these courses.
Further, based on the data from this project, revisiting the goals of ‘D’ and ‘I’ courses
would be beneficial. In particular, aligning the goals of these courses with the university
diversity statement and creating goals and assignments that encourage a consistent experience
(such as guaranteeing experiential learning and purposeful interactions) and common writing
product (such as creating a personal statement/definition of diversity, or writing about
positionality, self-awareness, or exploration of diversity issues) across ‘D’ courses would be
helpful in assuring the effectiveness of these courses and facilitate assessment of what students

General Education Assessment: 2016 122
are learning about diversity issues. Additionally, setting expectations for the types of
assignments that best facilitate learning of the ‘D’ outcomes is critical—having clear statements
for what students should be able to articulate or answer after taking a “D” course (e.g., After
taking a “D” course, students at OSU will be able to….”) is vital for helping instructors and
students understand the purpose of the course and the types of assignments to give/expect in
these courses.
Future Plans/Suggestions for Future Iterations of this Assessment Method
Since we believe this project was worthwhile and worthy of repeating, we (the
assessment team for this project) would like to end this report with recommendations and
suggestions for future iterations of this assessment method. These suggestions and
recommendations are as follows:
• Time commitment: First and foremost, future assessment team members should
know that this type of study is very time intensive but we found it to be very
rewarding and worthwhile.
• Directly involving students in assessment: This assessment method gave students
a chance to voice their experiences and have people in positions of perceived
“power” (i.e., administrators and faculty) take the time to listen to them.
Undertaking this type of assessment project helps give students, especially
students of color, an opportunity to be heard. Involving students directly in
assessment in this way should be continued.
• Sampling/recruitment: Sampling for this study was difficult. In future iterations of
this study, those planning the assessment should spend time developing a strategy

General Education Assessment: 2016 123
to recruit a diverse pool of participants that represent all colleges and student
demographics. We recommend that faculty/staff from each college be involved in
helping recruit participants from each college to ensure adequate representation
and help build rapport. It is of note that for this assessment every student who
participated had some connection to a member of the research team—that is, the
student participants knew at least one researcher through title/position,
participation in events together, as an instructor in class, etc. Also, as with all
studies, more participants than needed should be recruited, as some will drop out
or be unable to participate.
Further, it is of note that we had a very difficult time recruiting White
students to participate in this study. During one of the focus groups, participants
gave us some hints as to why that may be—for example, one White participant
specifically mentioned needing to go talk to someone before agreeing to
participate in order to be sure the participant wasn’t “[stepping] on anyone’s toes”
(FG 5, p. 13, line 473). Based on this and other responses, we (the assessment
team) speculate that some White students perceive their participation in this study
as risky, if not at least too uncomfortable to consider participating. This
recruitment challenge could reflect that critical dialogue about diversity, and the
necessary verbiage to have these dialogues, is still needed so that all students can
feel confident and comfortable in having these discussions. This also seems to
further underscore the theme of Spaces and Places—if there are not safe spaces
for all students to have these conversations, we will never truly know what our

General Education Assessment: 2016 124
students think and what they have (and have not) learned with regard to diversity
issues.
Finally, though we attempted to use SONA as a method to recruit
participants, it is clear that this type of study does not work well on SONA in
terms of recruitment. It is too in depth—over 40 students took the demographic
survey on SONA, but when they were called to schedule their participation in the
larger study (taking photos and participating in focus groups), all but two students
declined.
• Participation incentive: Students who participated in this study received a $10 gift
card to the OSU student store. Given the amount of time this study involved (at
least three hours for each student), a larger incentive would be helpful in both
recruiting more participants and showing respect and appreciation for the time
they invested in their participation.
• Focus groups: The focus groups in this study were somewhat homogenous in
terms of participant demographics; we (the researchers) hoped that this afforded
students’ identity comfort and facilitated a richer discussion. Future assessment
teams should also consider the makeup of the focus groups, as well as consider
what can be learned from more heterogeneous groups.
• Use of Photovoice as an assessment method: Photovoice was a good catalyst for
the discussions necessary for this assessment, as it provided an indirect route
(photo) to “break the ice” and allow for discussions about students’ stories,
experiences, and opinions. The photos also offered a lot of context to the
discussion, but we felt that sometimes the photos also limited the discussion

General Education Assessment: 2016 125
because the discussion was so tied to the photos; we often felt like we were just
getting started in terms of content when the time for each focus group was up.
More time allotted for the focus group might have rendered even more depth.
However, coordinating students’ and researchers’ schedules for these focus
groups would have been further complicated if more time was required. We
wonder what we would have learned if we had conducted semi-structured
interviews instead or in addition to the focus group discussions.
• Timeline of the study: When we conducted this study, we applied for IRB
approval in the fall semester and had students take photos and attend focus groups
in the spring semester. We recommend starting the study earlier so that photo-
taking and focus groups occur in the mid-fall semester. This would allow the
spring semester to be used for data analysis and member checking.
• Member checking: We did not have an opportunity to allow for member checking
in this study due to the time constraints (mentioned above). In future iterations of
this study, we recommend having students read the focus group transcripts and
give them the opportunity to elaborate on or clarify any of their statements. We
also recommend giving the students the opportunity to review the codes the
assessment team ascribed to their statements. Additionally, it would be
interesting to see what codes/themes the participants might come up with on their
own.
• Use of D2L/Brightspace: We used a D2L/Brightspace community to provide
students a safe, secure place to share their photos as they took them. We
recommend using this method again in future iterations of this study.

General Education Assessment: 2016 126

General Education Assessment: 2016 127
References
Denzin, N.K., & Lincoln, Y.S. (Eds.) (2005). The Sage handbook of qualitative research (3rd
ed.). Thousand Oaks, CA: Sage Publications.
Ellingson, L.L. (2014). “The truth must dazzle gradually”: Enriching relationship research using
a crystallization framework. Journal of Social and Personal Relationships, 31(4), 442-
450. doi: 10.1177/0265407514523553
Saldaña, J. (2013). The coding manual for qualitative researchers (2nd ed.). London: Sage
Publications.
Tracy, S. J. (2010). Qualitative quality: Eight “Big-Tent” criteria for excellent qualitative
research. Qualitative Inquiry,16, 837-851. doi:10.1177/1077800410383121
Wang, C. C. (1999). Photovoice: A participatory action research strategy applied to women’s
health. Journal of Women’s Health, 8(2), 185-192.
Wang, C. C. & Burris, M. A. (1997). Photovoice: Concept, methodology, and use for
participatory needs assessment. Health Education Behavior, 24, 369-387.
Wallerstein, N. & Bernstein, E. (1988). Empowerment education: Friere’s ideas adapted to
health education. Health Education Quarterly, 15, 379-394.
doi: 10.1177/109019818801500402

General Education Assessment: 2016 128
Appendix A Table A1 Summary of Final Themes and Sub-Themes 1. Course Quality
• Teacher/faculty • Content • Accurate perspectives • Gained limited knowledge • “Group work” • Classroom teaching and learning • Text choices • Heightened awareness • Theory vs. reality
• “Not what but how” • Being “singled out” (token) • Silencing • Professor approachability • “Checking the box” • Quota • Having to be culturally appropriate • Privilege
2. OSU Experience • Experiential learning and/or integrated
holistic learning • Mandatory D course • Programs – OMA • Campus resources • Need for resources/training • Privilege • “I’m used to it”
• Lack of diversity o Numbers and quotas o Diverse faculty o Recruiting o Lack of
experiences/opportunities • “Not really any of us”
3. Spaces and Places • Physical/brick and mortar
o “Crossroads” o “Highway” o Student Union o Library o Flags o Placards o Area of refuge o International o Veterans’ lounge
• Emotional/affective o “Comfort zones” o Discomfort zones o Safe place
4. Grouping • Homogenous
o Noticed o As comfort
• Greek • “Clumping” • Othering • Color vs. culture – “vertical diversity” • I vs. D • Languages
• Similarities • Differences • Isolation • Assimilation • Rejection • Forced cultural grouping • Segregation • Integration

General Education Assessment: 2016 129
5. Responsibility
• Shared responsibility • False ownership • Dual responsibility
• Intrinsic • Institutional requirement • Student and instructor responsibility
6. Hesitation
• How do we talk about it? • Fearful but willing • Forced discomfort • Anxiety to discuss/offend
• Distrust • Need for resources/training • Attempting to define
Note. The use of quotation marks denotes an in vivo code where the student’s voice was maintained in the naming of the code/category.

General Education Assessment: 2016 130
Appendix B
Selected Participant Photographs
Note: All photo titles were created by the student participants in this study.
Figure B1. Photograph and reflection related to Course Quality theme.
Photo Title: Group Diversity
Student Caption/Reflection Provided for the Photo: I took this picture because I loved the interaction between the group. The picture is all about the mixture of ideas coming together to create one big plan/solution for a group project. I see no problems here – they are smiling, working together, and achieving so much. This picture gives me life because this was more than just a picture. It is a way of life. It could be supported if we widened the range of students connecting in this lounge to establish a solution to their project.

General Education Assessment: 2016 131
Figure B2. Photograph and reflection related to OSU Experience theme.
Photo Title: Role of a College Union
Student Caption/Reflection Provided for the Photo: none provided

General Education Assessment: 2016 132
Figure B3. Photograph and reflection related to OSU Experience theme.
Photo Title: Diversity in RISE
Student Caption/Reflection Provided for the Photo: I was amazed at the variety of students that joined the RISE program. In this picture, students are completing study hours for the RISE Program, which helps students develop strong study habits and work ethic to become future leaders. This picture shows even outside the classroom that students can come together and accomplish goals. I think this could be even bigger if more people were aware of this program because it’s a great way to meet so many different people. In this program everyone is welcome if approved [meets qualifications]. This program could be advertised more by the students already in the program or even have special nights where they go out and welcome new people.

General Education Assessment: 2016 133
Figure B4. Photograph and reflection related to Spaces and Places theme.
Photo Title: untitled
Student Caption/Reflection Provided for the Photo: I have personally experienced multiple incidences of diversity outside of the classroom. To me, this photo displays the many different individuals going about their daily lives. Although many of us share the same core values, differences in our culture, language, and opinion set us apart. Since my time here at Oklahoma State, I’ve been frequently involved with various International Student Organizations. I’ve learned about countries and cultures that I was previously unaware of; I’ve even tried foods and learned to say ‘hello’ in several other languages. On the surface, it would seem that experiencing diversity outside of the classroom is most likely possible specifically at cultural events, such as the annual international food bazaar or the Harvest Moon festivals during the fall. I found that I was immersed in more culture throughout my daily school schedule than while attending these events! For the past year or so, I’ve worked in a research lab on campus with PhD students and lab technicians from different countries. Interacting with them and getting to know them was an extremely enriching experience and I believe that I still hold these experiences with me today. Having been born and raised in Tulsa, Oklahoma, I never imagined that I would attend school with students from Nepal, Malaysia, and Africa! My experiences with internationals whose backgrounds greatly differ from my own have instilled in me a more wholesome mindset. I believe that experiencing diversity for both adults and children, whether it be in the form of academics or culture, promotes humility and encourages tolerance. .
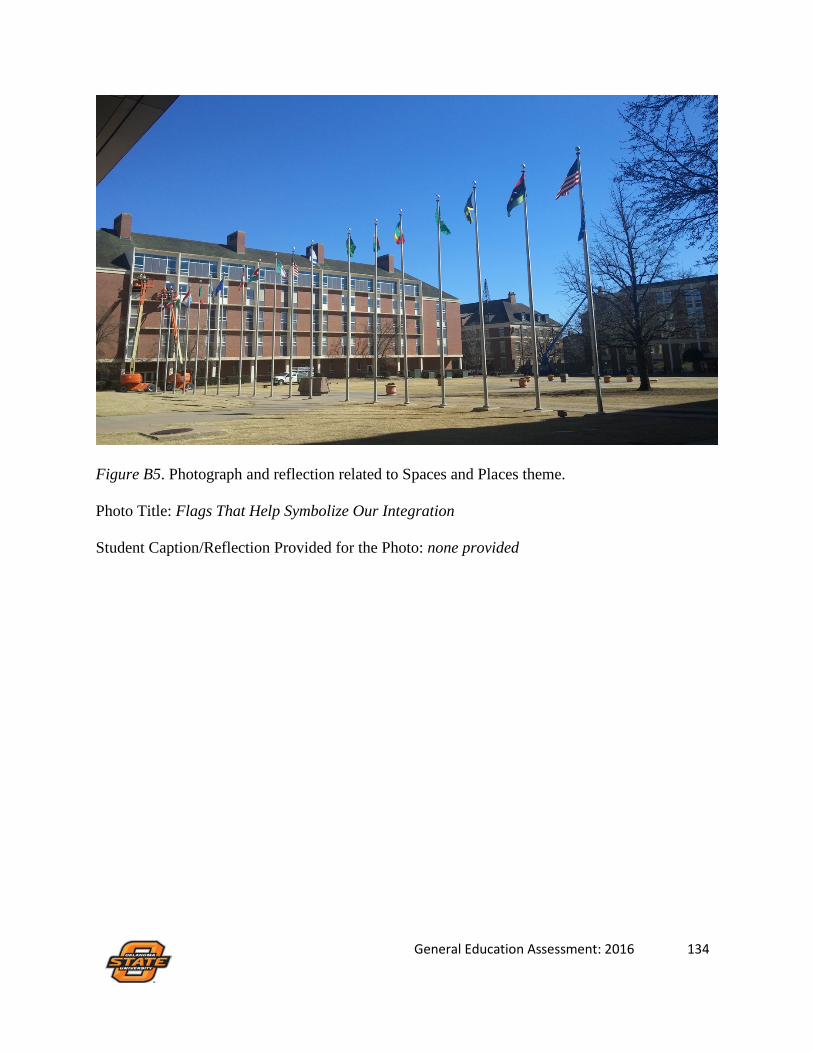
General Education Assessment: 2016 134
Figure B5. Photograph and reflection related to Spaces and Places theme.
Photo Title: Flags That Help Symbolize Our Integration
Student Caption/Reflection Provided for the Photo: none provided

General Education Assessment: 2016 135
Figure B6. Photograph and reflection related to Grouping theme.
Photo Title: untitled
Student Caption/Reflection Provided for the Photo: Some of my most distinct experiences with diversity within the classroom occur in my biochemistry classes. As I have advanced further into classes more so related to my major, the class sizes have decreased and the faces of classmates have become more and more familiar. Although we are all unified through academics, we are nothing but different from one another in our career related endeavors. Some students double as engineers and wish to pursue a career in the biochemical spectra of engineering. Many of the students are studying for the MCAT or GRE to be admitted to medical school or other health care related profession. Others want to continue education and become scientists. The career goals of each individual is different and may set us apart, but I find that it unifies us more than anything. In study groups for exams or homework, each individual is capable of bringing to the table something different and innovative. For example, a mechanism of remembering the names of amino acids or a song to memorize glycolysis have all been taught to me from my colleagues.

General Education Assessment: 2016 136
Figure B7. Photograph and reflection related to Grouping theme (image blurred to protect identities of subjects). Photo Title: Blue
Student Caption/Reflection Provided for the Photo: Diversity is something we all deal with even in the military. We all came from different parts of the world [and promised] we would look for each other’s back no matter who we were or what we are.

General Education Assessment: 2016 137
Figure B8. Photograph and reflection related to Responsibility theme. Photo Title: D-Course Requirement
Student Caption/Reflection Provided for the Photo: This is the photo I chose to represent the diversity found within the classroom setting. It is a picture of a degree sheet. A week ago, while I was chatting with a professor, they had mentioned classes that were to be taken in order to graduate, called “D-Courses”. When they mentioned that phrase, I was at first unaware of what they were talking about. Honestly, I am still a little confused of the actual purpose and definition of a D-course. However, as my conversation with this professor progressed, I soon learned that I needed to take classes that were based on diversity, and thats what these D-cources were. I had never been exposed to this idea of coursework, or even heard of it until this research project. To me this shows a hole within our system somewhere. If we as a university are going to continue to promote the diversity of our campus, then we must make certain that students are being provided the appropriate knowledge about taking courses on diversity.

General Education Assessment: 2016 138
Figure B9. Photograph and reflection related to Hesitation theme. Photo Title: Room
Student Caption/Reflection Provided for the Photo: [This is the] place where I work in school for research. I’m using this piece that sometimes I struggle with expressing myself when it comes to diversity so I surround myself in a room with work. It shows me how we need to have diversity in our classroom or we just feel like an empty room with all the work we do. It shows that we still lack some sort of freedom in terms of expressing. I feel that when I work there I am sometimes just hiding myself. It can be supported by the analogy of diversity and how it promotes a open environment to express oneself and not be subjected to a room not being able to.