ola fopl stats project
TRANSCRIPT

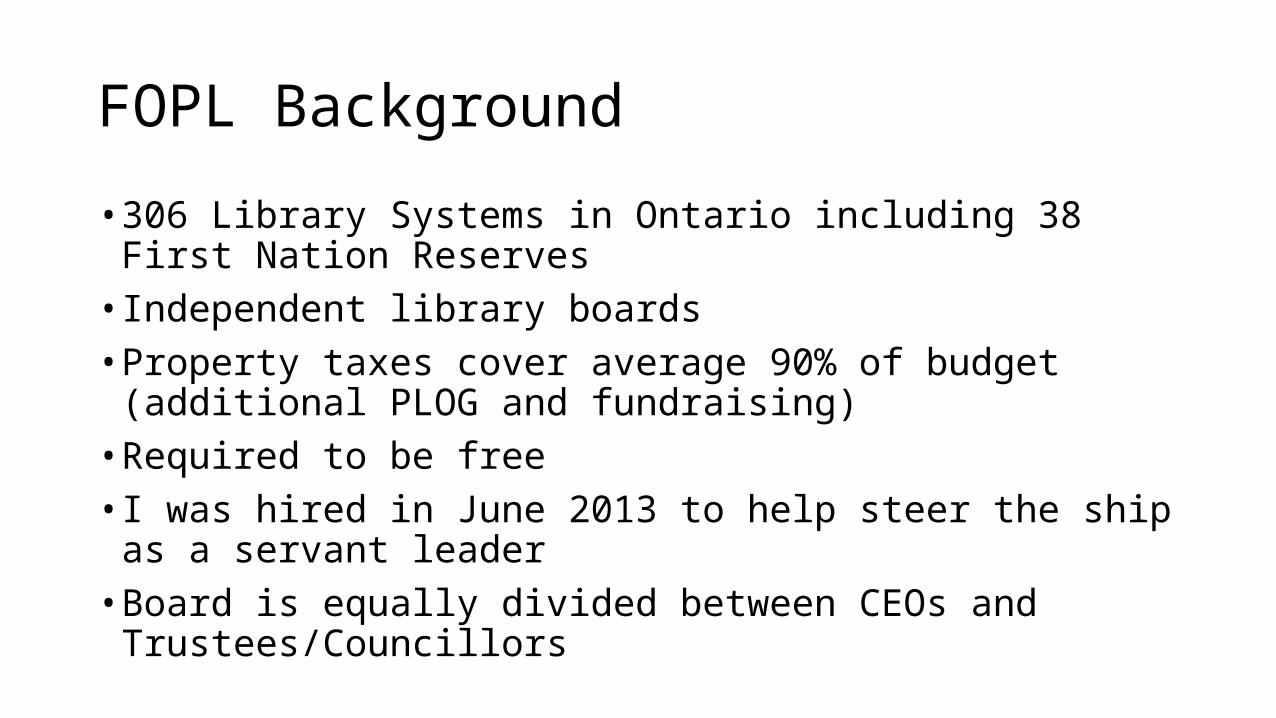
FOPL Background
• 306 Library Systems in Ontario including 38 First Nation Reserves• Independent library boards• Property taxes cover average 90% of budget (additional PLOG and
fundraising)• Required to be free• I was hired in June 2013 to help steer the ship as a servant leader• Board is equally divided between CEOs and Trustees/Councillors
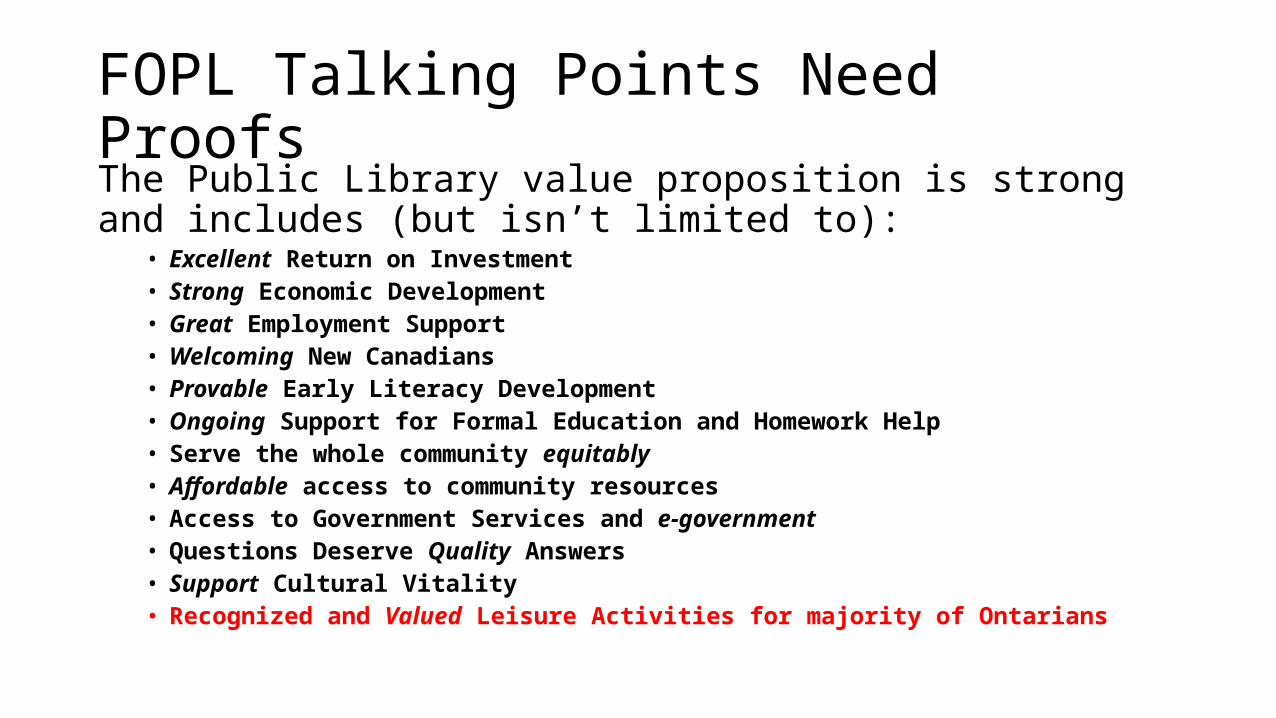
FOPL Talking Points Need ProofsThe Public Library value proposition is strong and includes (but isn’t limited to):
• Excellent Return on Investment• Strong Economic Development• Great Employment Support• Welcoming New Canadians• Provable Early Literacy Development• Ongoing Support for Formal Education and Homework Help• Serve the whole community equitably• Affordable access to community resources• Access to Government Services and e-government• Questions Deserve Quality Answers • Support Cultural Vitality• Recognized and Valued Leisure Activities for majority of Ontarians
4
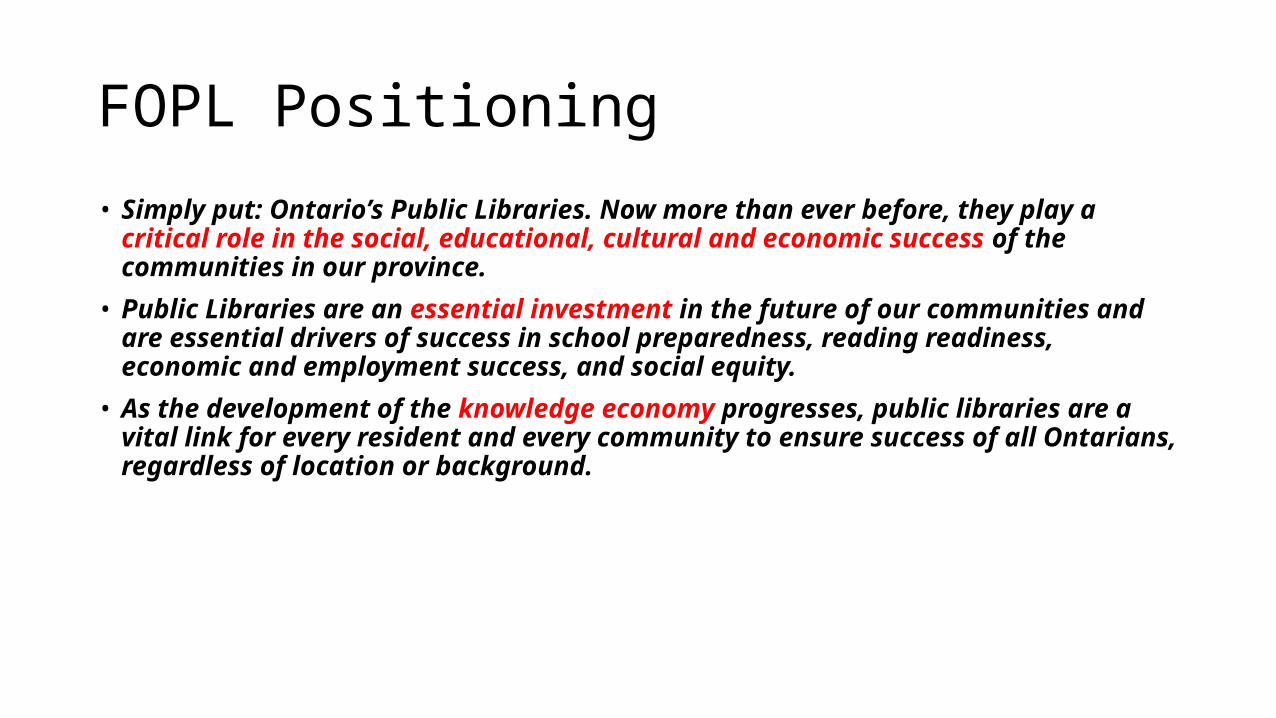
FOPL Positioning• Simply put: Ontario’s Public Libraries. Now more than ever before, they play a critical role in the
social, educational, cultural and economic success of the communities in our province. • Public Libraries are an essential investment in the future of our communities and are essential
drivers of success in school preparedness, reading readiness, economic and employment success, and social equity.
• As the development of the knowledge economy progresses, public libraries are a vital link for every resident and every community to ensure success of all Ontarians, regardless of location or background.
5
Ontario Background
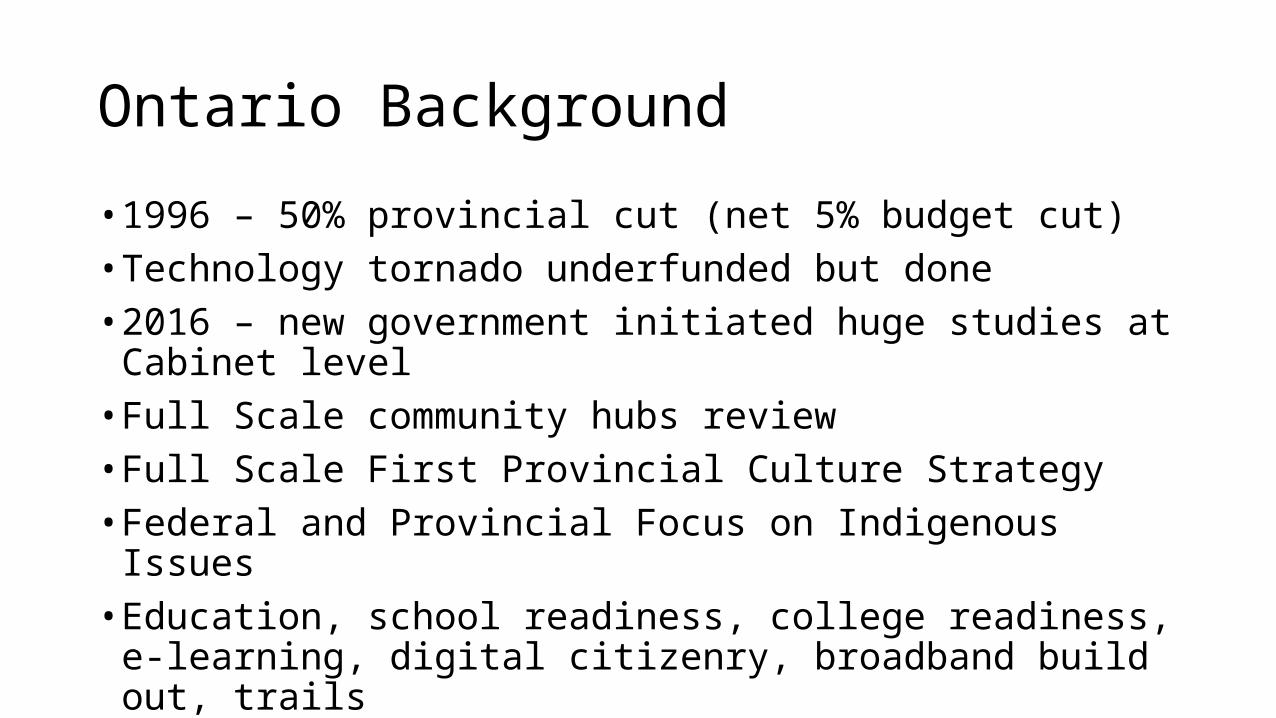
• 1996 – 50% provincial cut (net 5% budget cut)• Technology tornado underfunded but done• 2016 – new government initiated huge studies at Cabinet level• Full Scale community hubs review• Full Scale First Provincial Culture Strategy• Federal and Provincial Focus on Indigenous Issues• Education, school readiness, college readiness, e-learning, digital
citizenry, broadband build out, trails
We didn’t know enough!
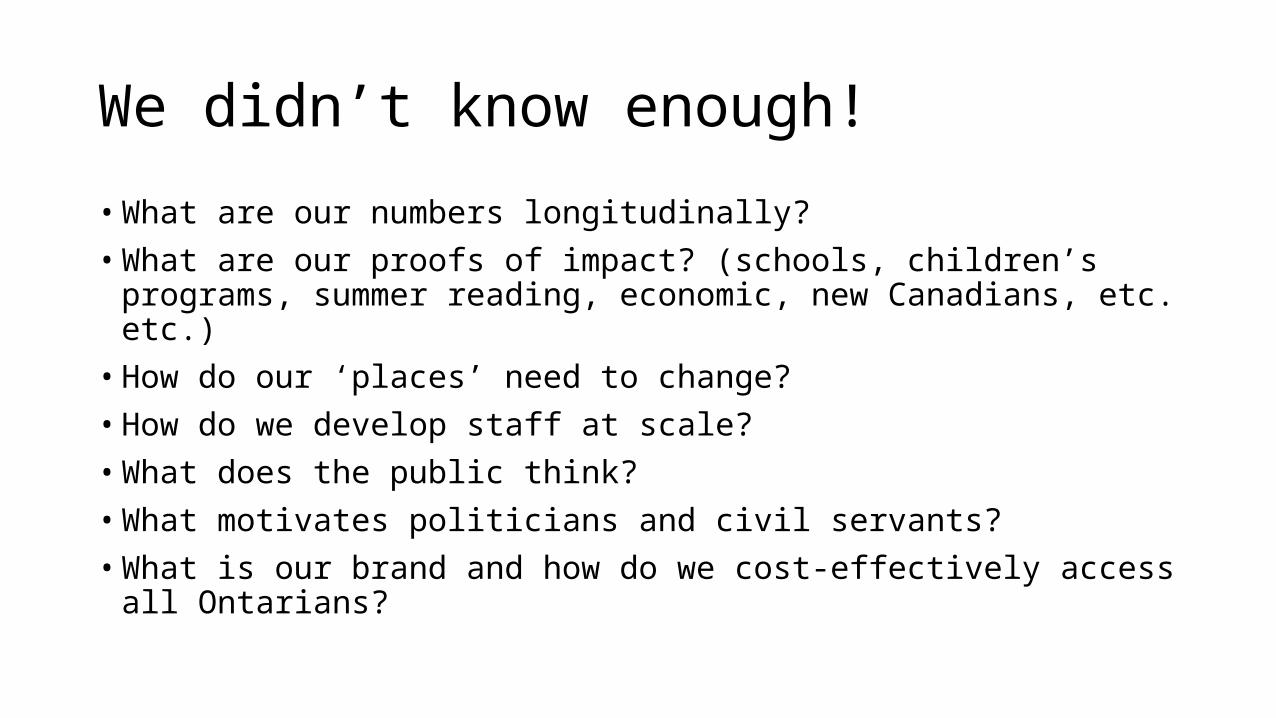
• What are our numbers longitudinally?• What are our proofs of impact? (schools, children’s programs, summer reading,
economic, new Canadians, etc. etc.)• How do our ‘places’ need to change?• How do we develop staff at scale?• What does the public think?• What motivates politicians and civil servants? • What is our brand and how do we cost-effectively access all Ontarians?
7
2017: What Didn’t We Know?
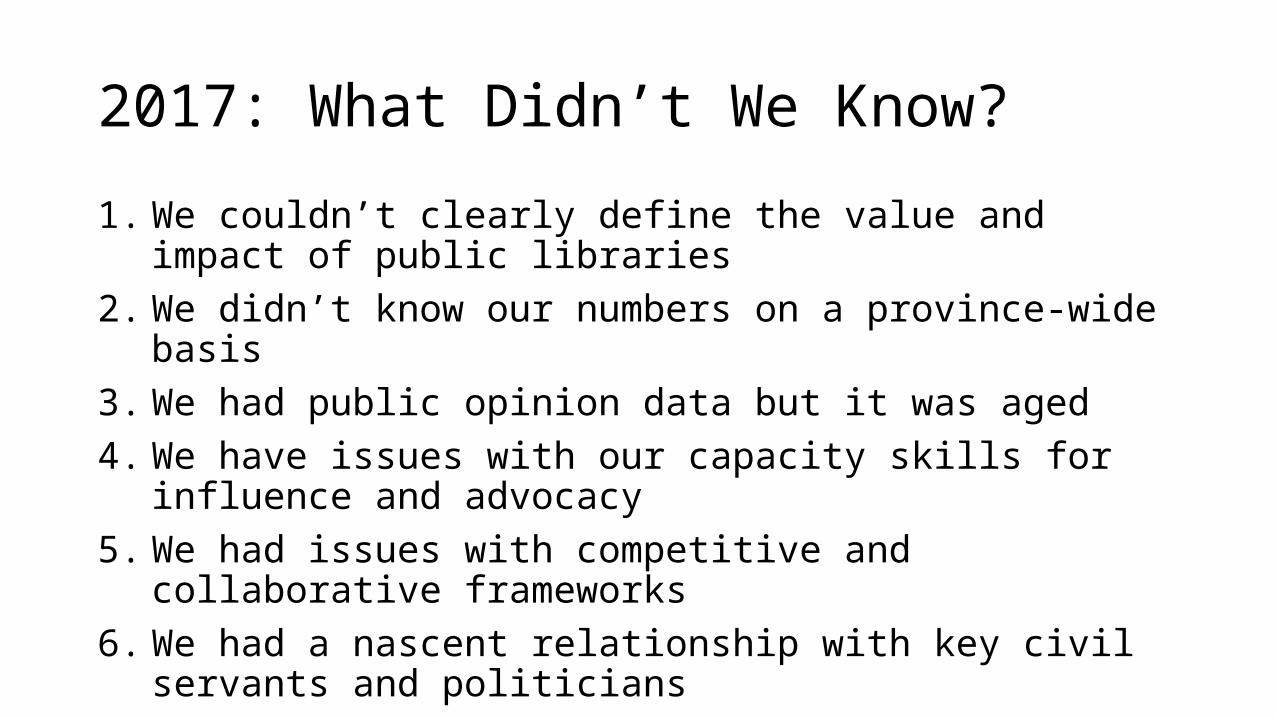
1. We couldn’t clearly define the value and impact of public libraries2. We didn’t know our numbers on a province-wide basis3. We had public opinion data but it was aged4. We have issues with our capacity skills for influence and advocacy5. We had issues with competitive and collaborative frameworks6. We had a nascent relationship with key civil servants and politicians7. Our standard approach had fossilized as events instead of process8. We had an uncoordinated and old-fashioned marketing plan
2017: What Do We Know Now?
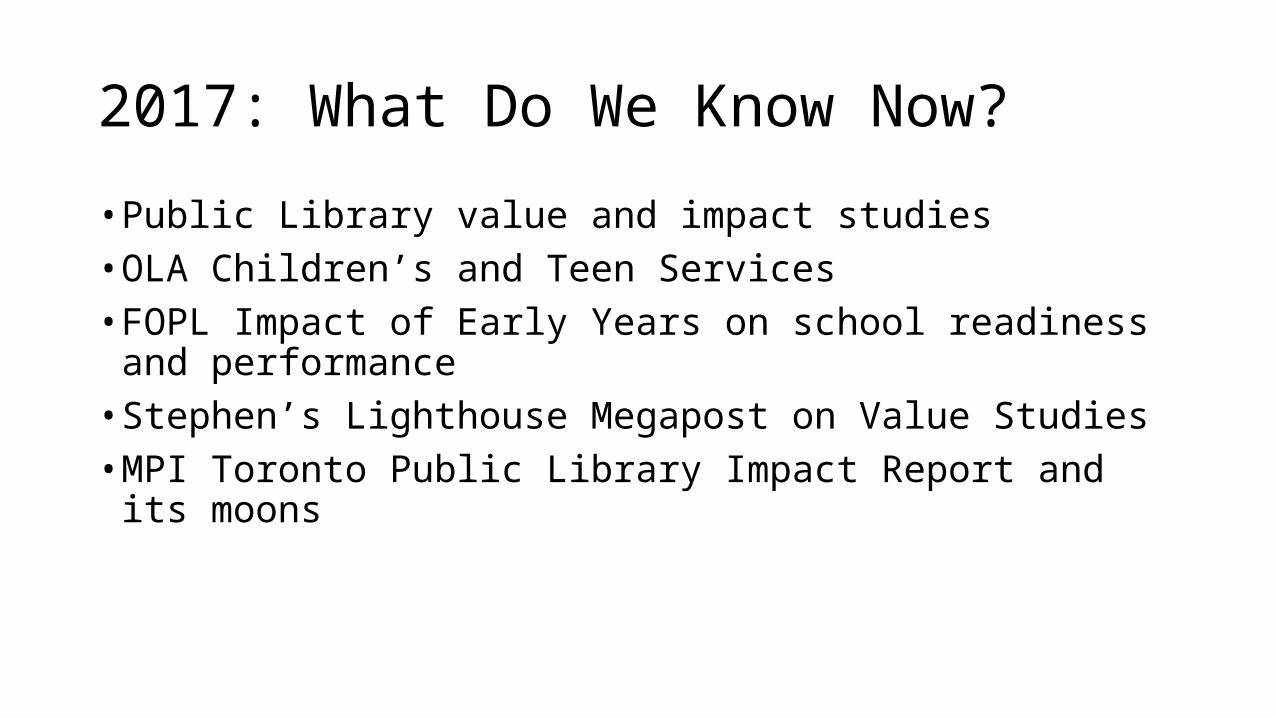
• Public Library value and impact studies• OLA Children’s and Teen Services• FOPL Impact of Early Years on school readiness and performance• Stephen’s Lighthouse Megapost on Value Studies• MPI Toronto Public Library Impact Report and its moons
2017: What Do We Know Now?
Statistics and Measurements• Lobbied for OpenData• 2014, 2015, 2016 Data Report and Library Rankings (first time)• New Measurements Report• Special reports (makerspaces, partnerships, education, social media, etc.)• 3 Stats and Measures Symposia (U of Toronto iSchool partner)• Custom Reports Service• Feb. 2017 New Book• Counting Opinions (summer readings, etc.)• International and Interprovincial Comparisons
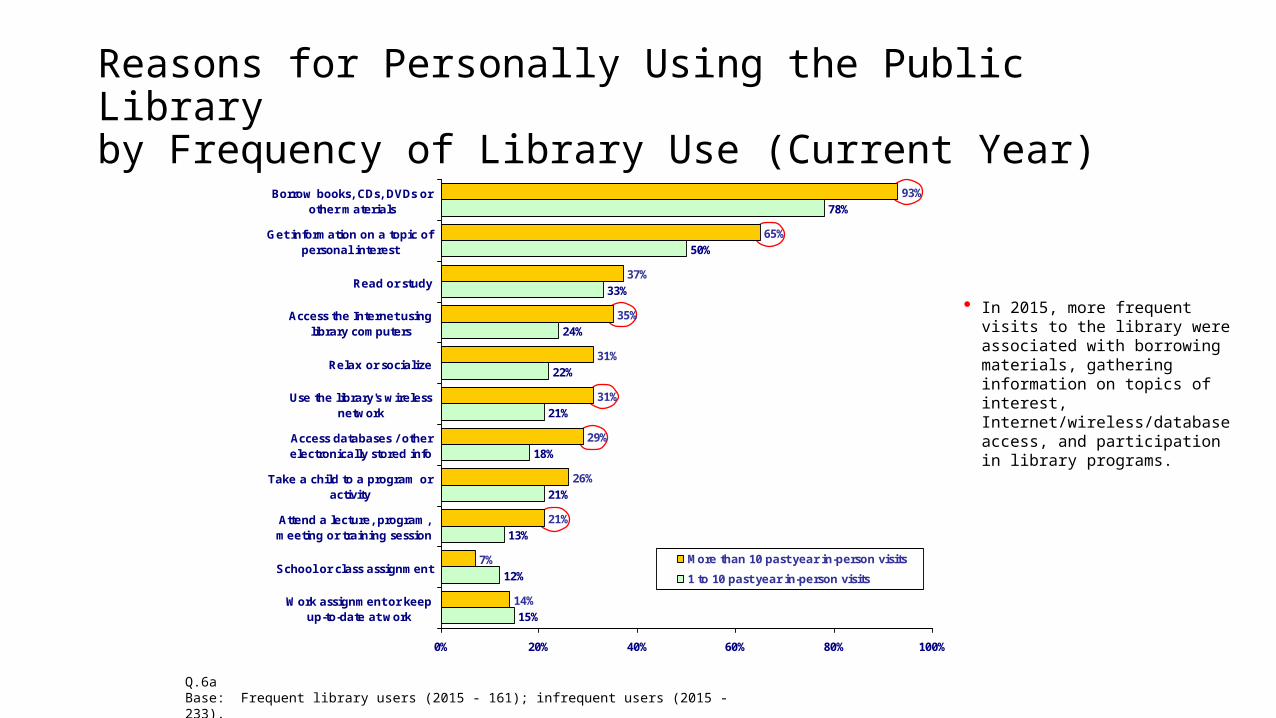
Reasons for Personally Using the Public Libraryby Frequency of Library Use (Current Year)
Q.6aBase: Frequent library users (2015 - 161); infrequent users (2015 - 233).
93%
65%
37%
35%
31%
31%
29%
26%
21%
7%
14%
78%
50%
33%
24%
22%
21%
18%
21%
13%
12%
15%
0% 20% 40% 60% 80% 100%
Borrow books, CDs, DVDs orother materials
Get information on a topic ofpersonal interest
Read or study
Access the Internet usinglibrary computers
Relax or socialize
Use the library's wirelessnetwork
Access databases / otherelectronically stored info
Take a child to a program oractivity
Attend a lecture, program,meeting or training session
School or class assignment
Work assignment or keepup-to-date at work
More than 10 past year in-person visits1 to 10 past year in-person visits
• In 2015, more frequent visits to the library were associated with borrowing materials, gathering information on topics of interest, Internet/wireless/database access, and participation in library programs.
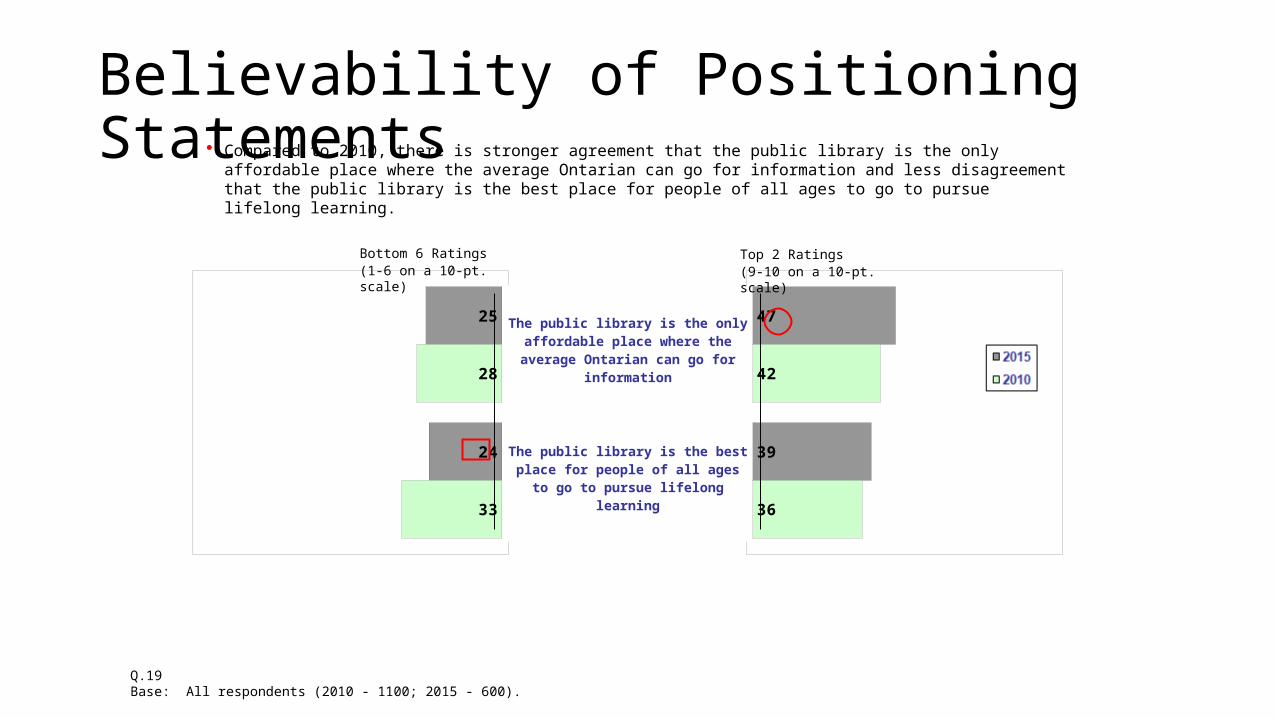
Believability of Positioning Statements
Q.19Base: All respondents (2010 - 1100; 2015 - 600).
• Compared to 2010, there is stronger agreement that the public library is the only affordable place where the average Ontarian can go for information and less disagreement that the public library is the best place for people of all ages to go to pursue lifelong learning.
47
39
42
36
25
24
28
33
The public library is the only affordable place where the average
Ontarian can go for information
The public library is the best place for people of all ages to go to pursue
lifelong learning
Bottom 6 Ratings(1-6 on a 10-pt. scale)
Top 2 Ratings(9-10 on a 10-pt. scale)
19%
15%
15%
16%
10%
12%
12%
9%
9%
7%
36%
35%
35%
29%
33%
27%
26%
26%
24%
24%
55%
50%
49%
44%
44%
39%
38%
35%
33%
31%
Very Likely Somewhat Likely Total
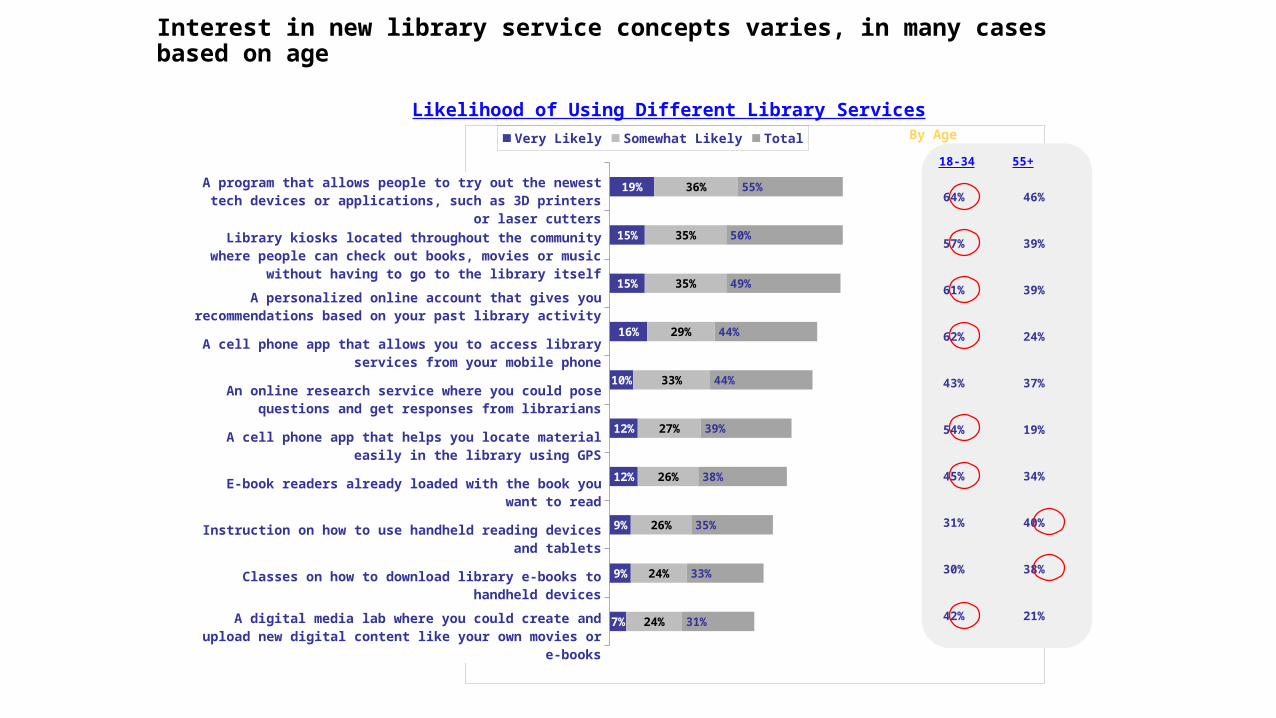
Interest in new library service concepts varies, in many cases based on age
A program that allows people to try out the newest tech devices or applications, such as 3D printers or laser cutters
Library kiosks located throughout the community where people can check out books, movies or music without having to go to
the library itself
A personalized online account that gives you recommendations based on your past library activity
A cell phone app that allows you to access library services from your mobile phone
An online research service where you could pose questions and get responses from librarians
A cell phone app that helps you locate material easily in the library using GPS
E-book readers already loaded with the book you want to read
Instruction on how to use handheld reading devices and tablets
Classes on how to download library e-books to handheld devices
A digital media lab where you could create and upload new digital content like your own movies or e-books
Likelihood of Using Different Library Services
64% 46%
57% 39%
61% 39%
62% 24%
43% 37%
54% 19%
45% 34%
31% 40%
30% 38%
42% 21%
By Age
18-34 55+
2017: What Do We Know Now?
• MarketProbe Canada public opinion poll on the attitudes of Ontarians about public libraries
• Aimed at demographics and changes• Added new services
2017: What Do We Know Now?
• Capacity Building• We have issues with our capacity skills for influence and advocacy• LearnHQ full scale e-learning system province-wide• Education Institute webinar calendar• 10 Part webinar series on influence based on dissertations, research,
personal stories• Symposia
2017: What Do We Know Now?
• We had issues with competitive and collaborative frameworks• Libraries 2020 Summit priority setting• Libraries 2025 Summit priority setting• Quarterly Team Meetings (sometimes monthly)• SOLS, OLS-North, CULC, OLA/OPLA/OLBA, FOPL
2017: What Do We Know Now?
• We improved our relationship with key civil servants and politicians• Too much focus on One Cabinet Minister and One Ministry changed to long
term relationship management focus• Hired Professional lobbying firm on annual contract• Inter-Ministerial summit on Libraries• Opening up relationships with museums, art galleries, Parks & Rec, ORION,
AMO, etc.• Shared efforts on national (CFLA) and Ontario government relations
2017: What Do We Know Now?
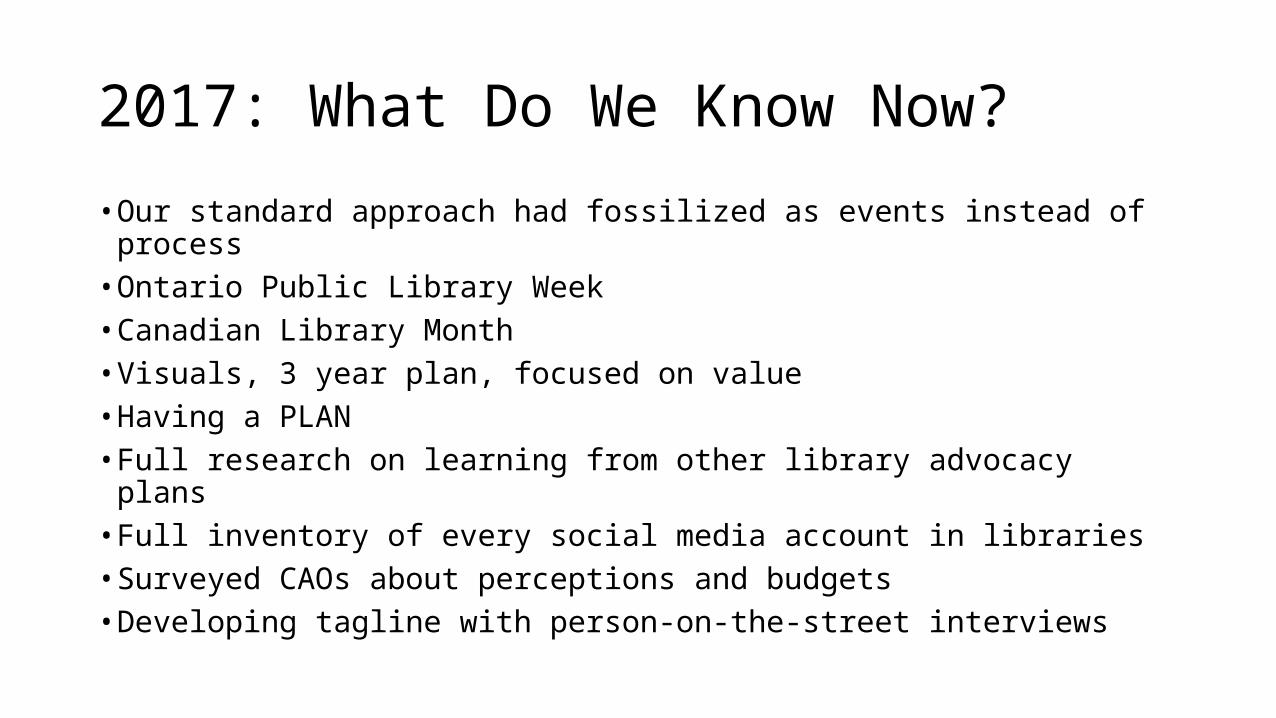
• Our standard approach had fossilized as events instead of process• Ontario Public Library Week• Canadian Library Month• Visuals, 3 year plan, focused on value• Having a PLAN• Full research on learning from other library advocacy plans• Full inventory of every social media account in libraries• Surveyed CAOs about perceptions and budgets• Developing tagline with person-on-the-street interviews
2017: What Do We Know Now?
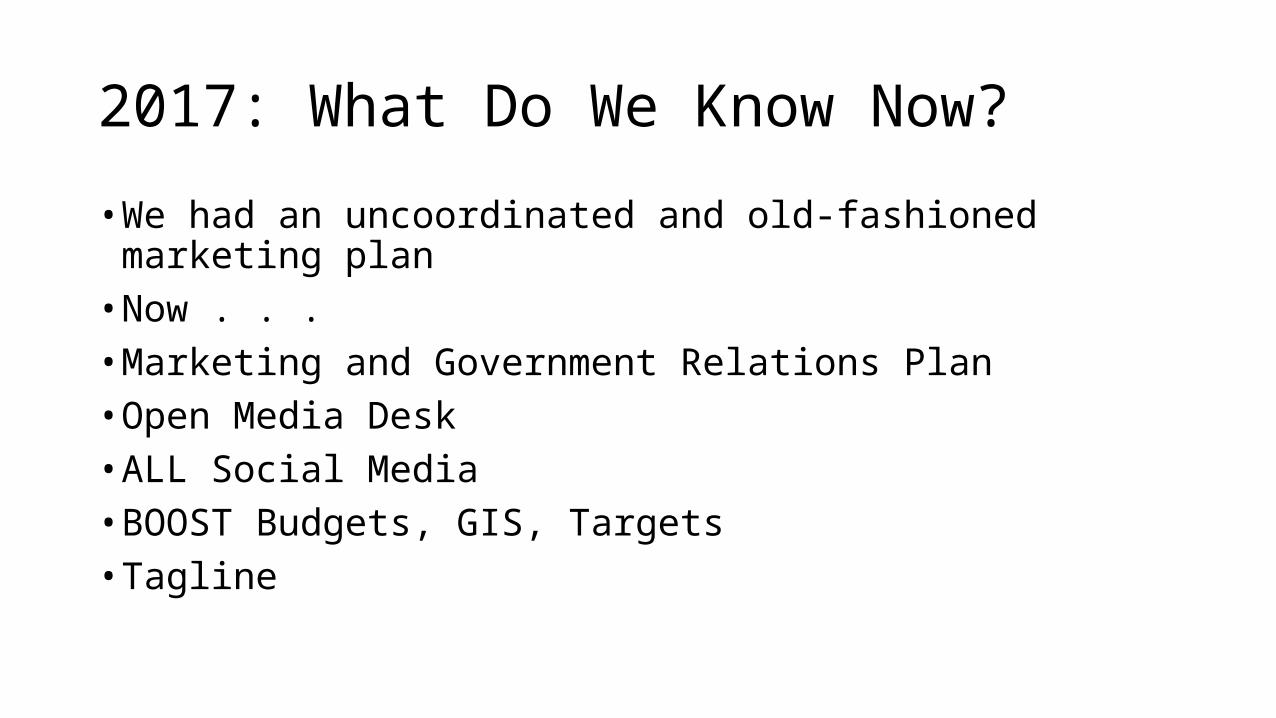
• We had an uncoordinated and old-fashioned marketing plan• Now . . .• Marketing and Government Relations Plan• Open Media Desk• ALL Social Media• BOOST Budgets, GIS, Targets• Tagline
Progress: Marketing and Branding
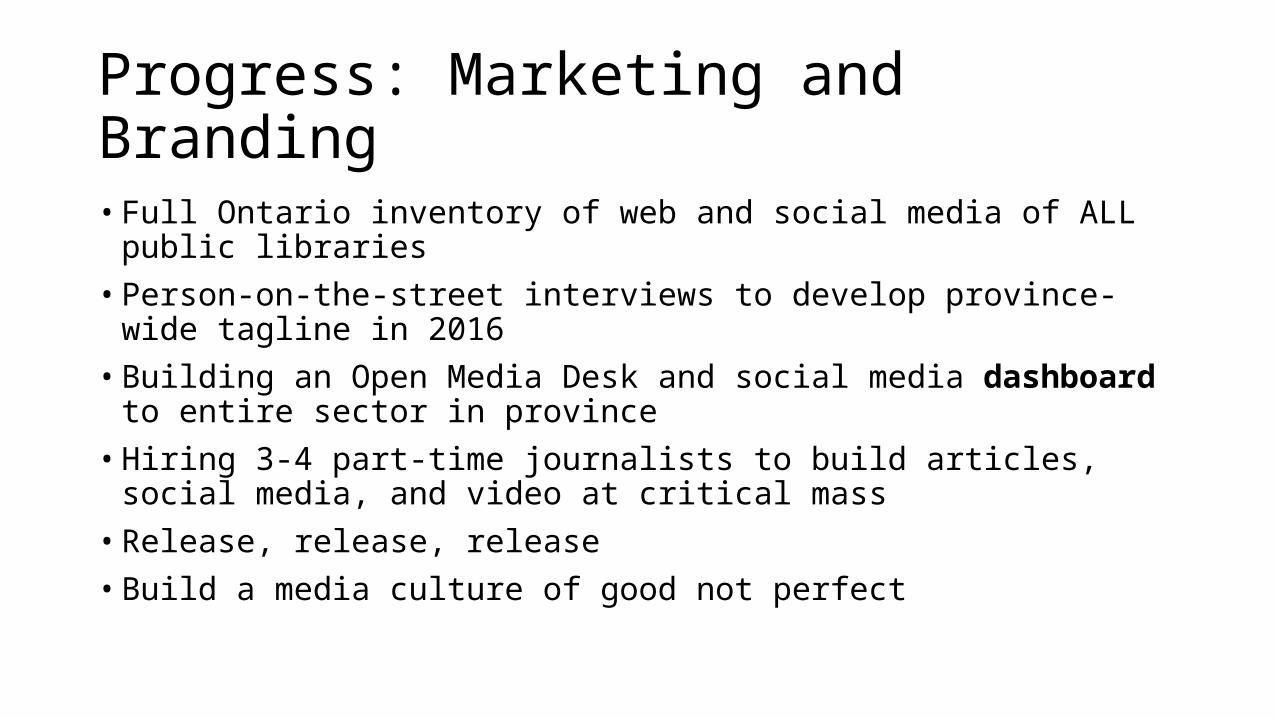
• Full Ontario inventory of web and social media of ALL public libraries • Person-on-the-street interviews to develop province-wide tagline in 2016• Building an Open Media Desk and social media dashboard to entire sector in
province• Hiring 3-4 part-time journalists to build articles, social media, and video at critical
mass• Release, release, release• Build a media culture of good not perfect
20
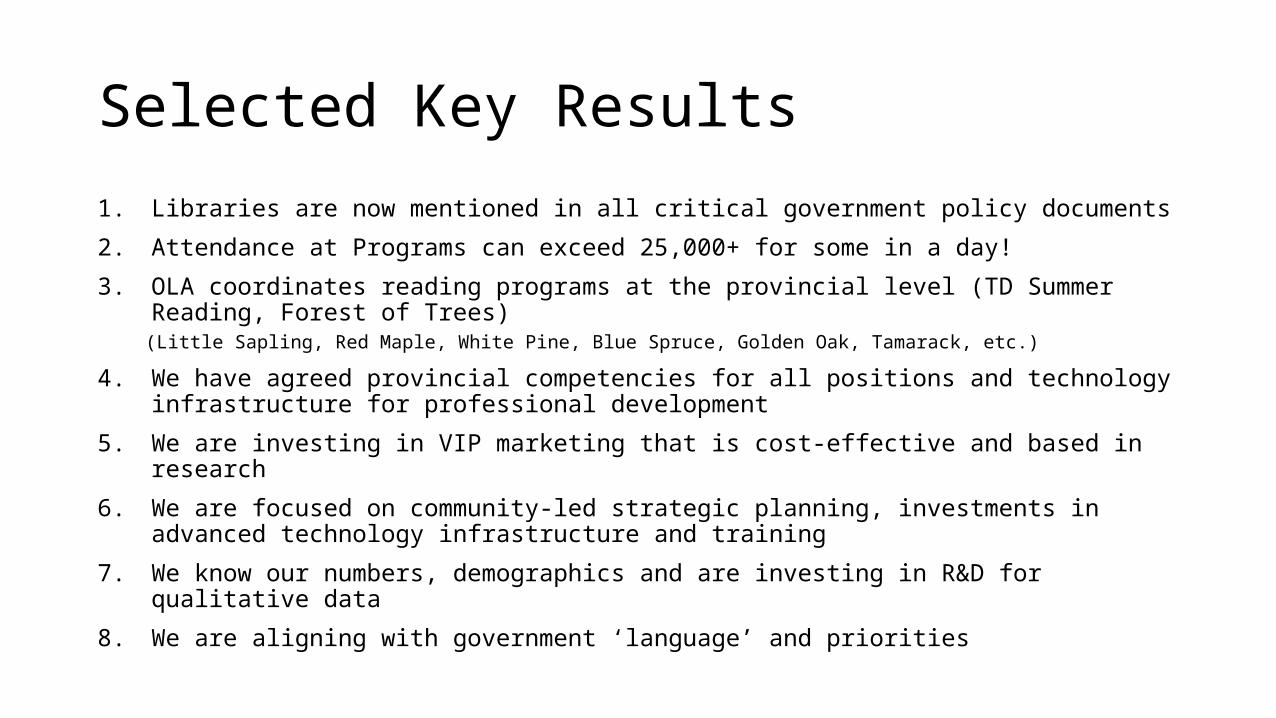
Selected Key Results1. Libraries are now mentioned in all critical government policy documents
2. Attendance at Programs can exceed 25,000+ for some in a day!
3. OLA coordinates reading programs at the provincial level (TD Summer Reading, Forest of Trees)(Little Sapling, Red Maple, White Pine, Blue Spruce, Golden Oak, Tamarack, etc.)
4. We have agreed provincial competencies for all positions and technology infrastructure for professional development
5. We are investing in VIP marketing that is cost-effective and based in research
6. We are focused on community-led strategic planning, investments in advanced technology infrastructure and training
7. We know our numbers, demographics and are investing in R&D for qualitative data
8. We are aligning with government ‘language’ and priorities
21

The Role of Questions

23
What is the real role and value of libraries and librarians?
• Lewis Carroll wrote in Alice in Wonderland that, “If you don’t know where you are going then any road will get you there.”
• Two things help you make the choice to make changes or evolve: your core values and what distinct value you deliver better than anyone else in your role in the context of your environment – whether that’s a community, a social institution, as an individual professional, or as an educator.
Public Libraries in Ontario are huuuuge!
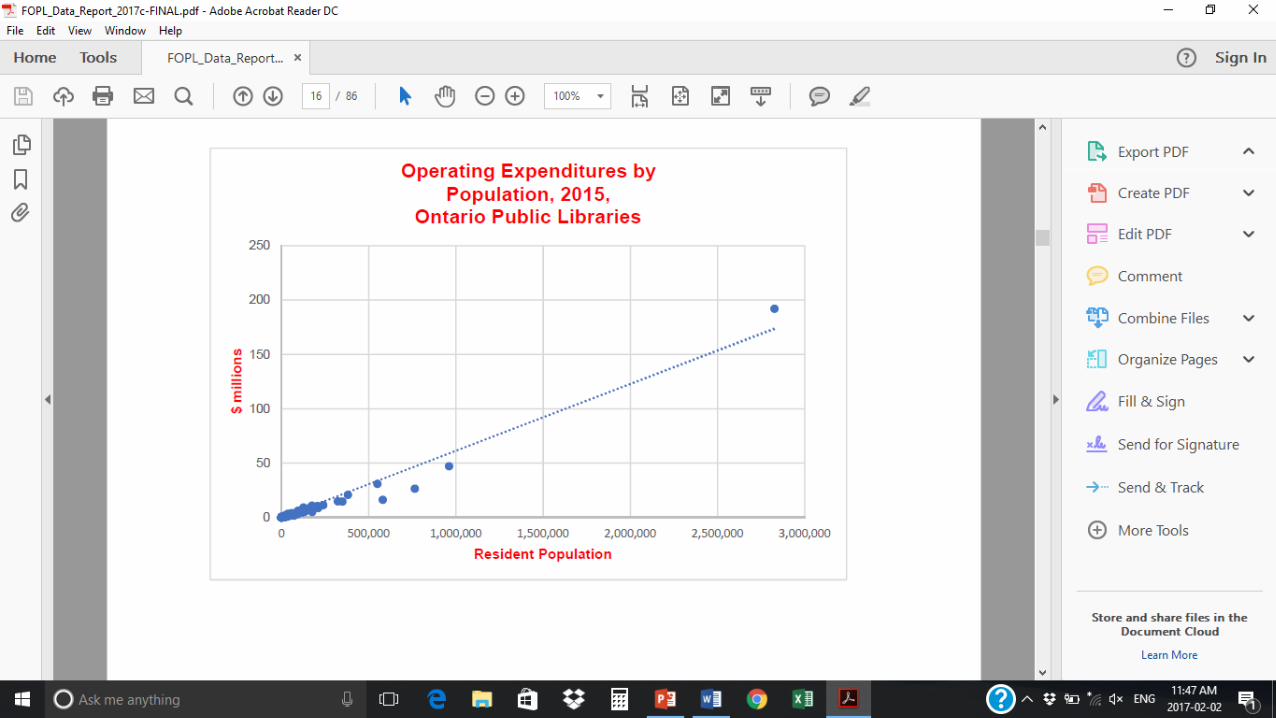
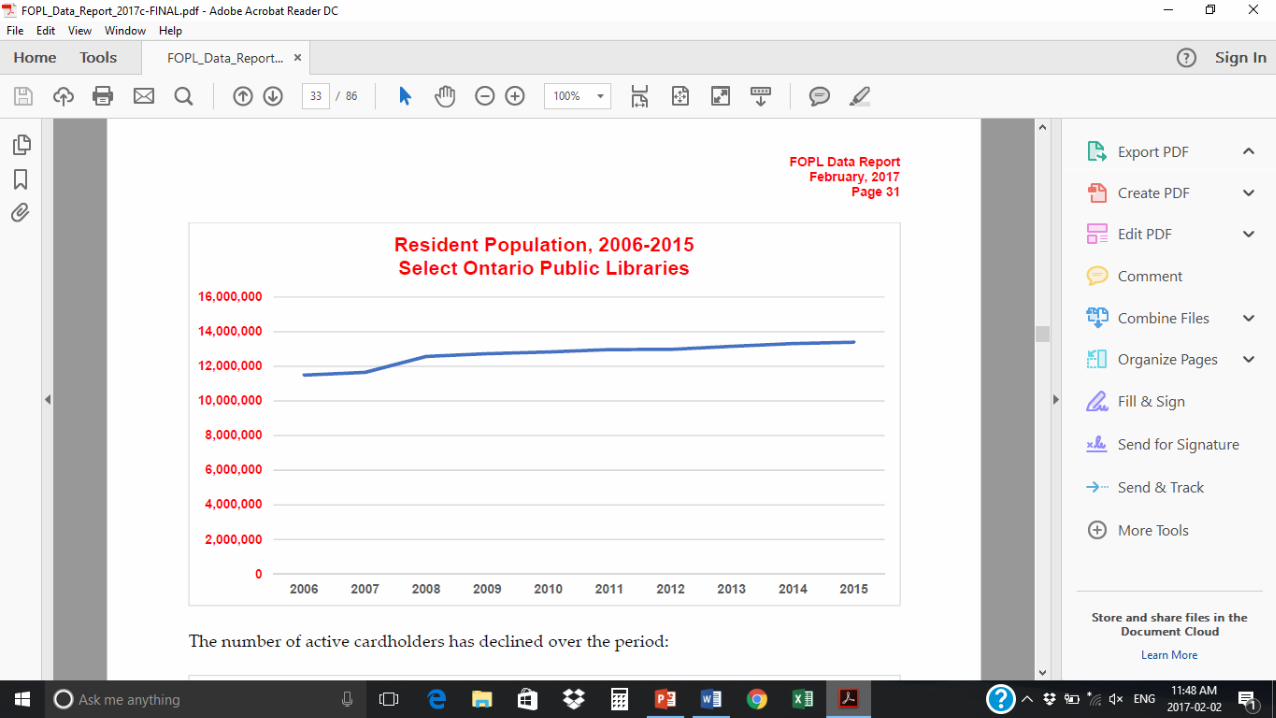
• We’re digging into the 2015 public library data collection, but one ‘bite’ is:
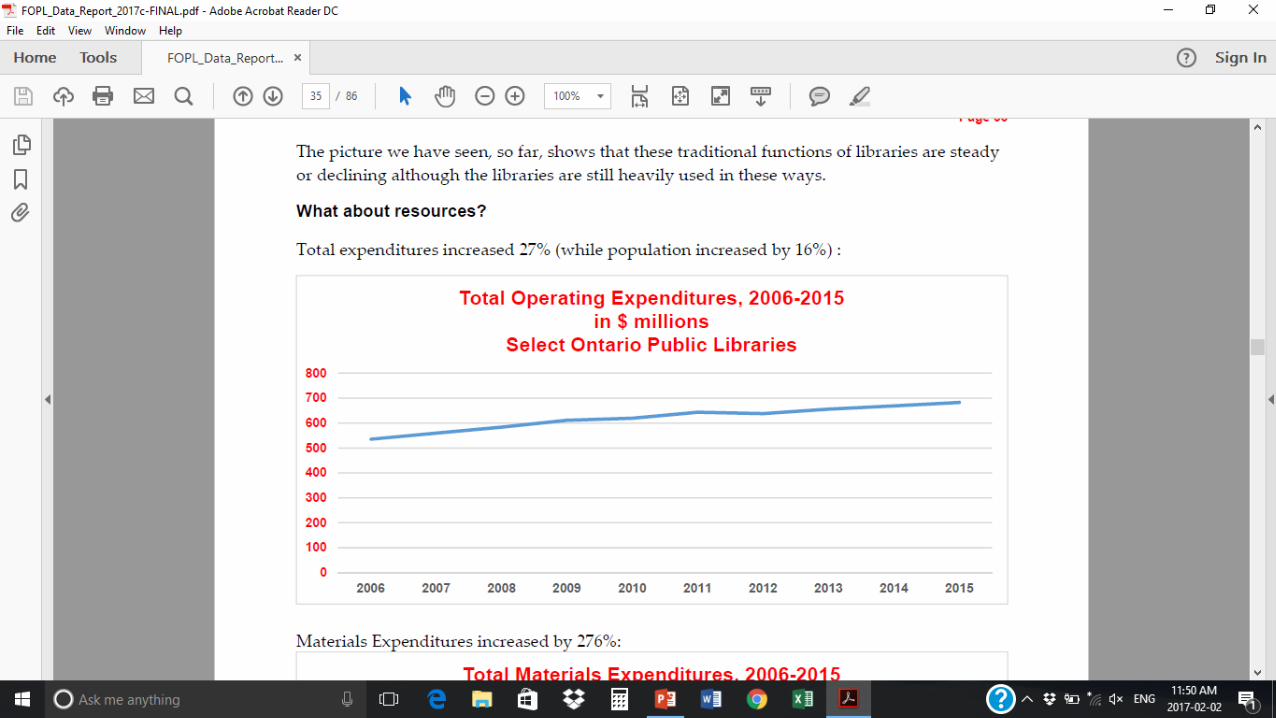
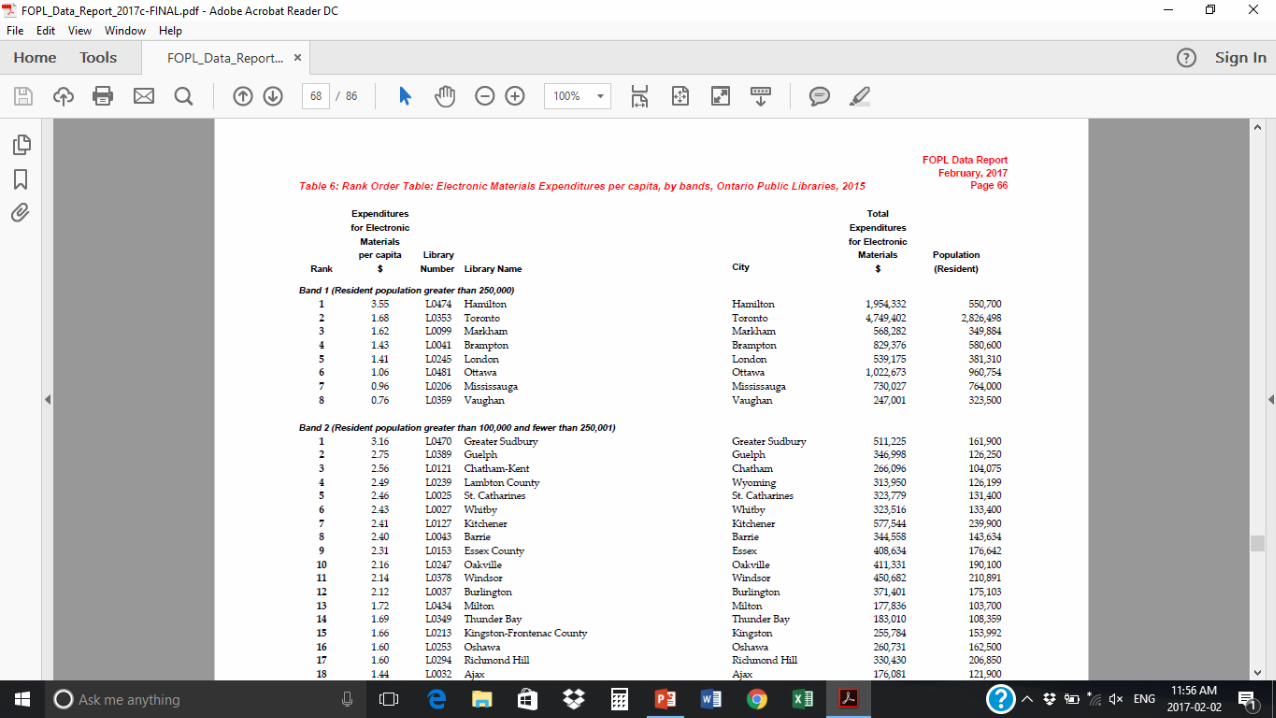
• There were 302 libraries reporting all of the years from 2006-2015.• For that decade:• The Total Operating Expenditures were: $6,197,134,922.
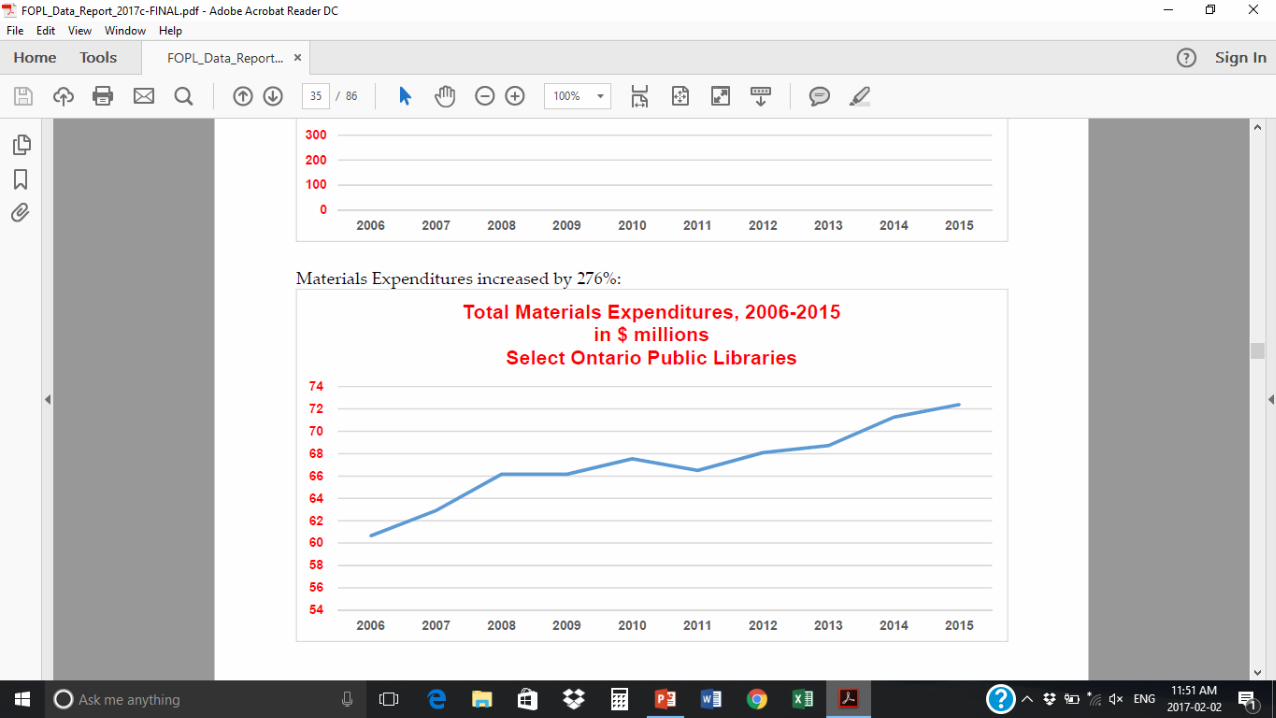
Total General Materials Expenditures were: $538,752,055.The libraries circulated a total of 1,260,217,449 items.
• Yep – that’s 1.2 BILLION!
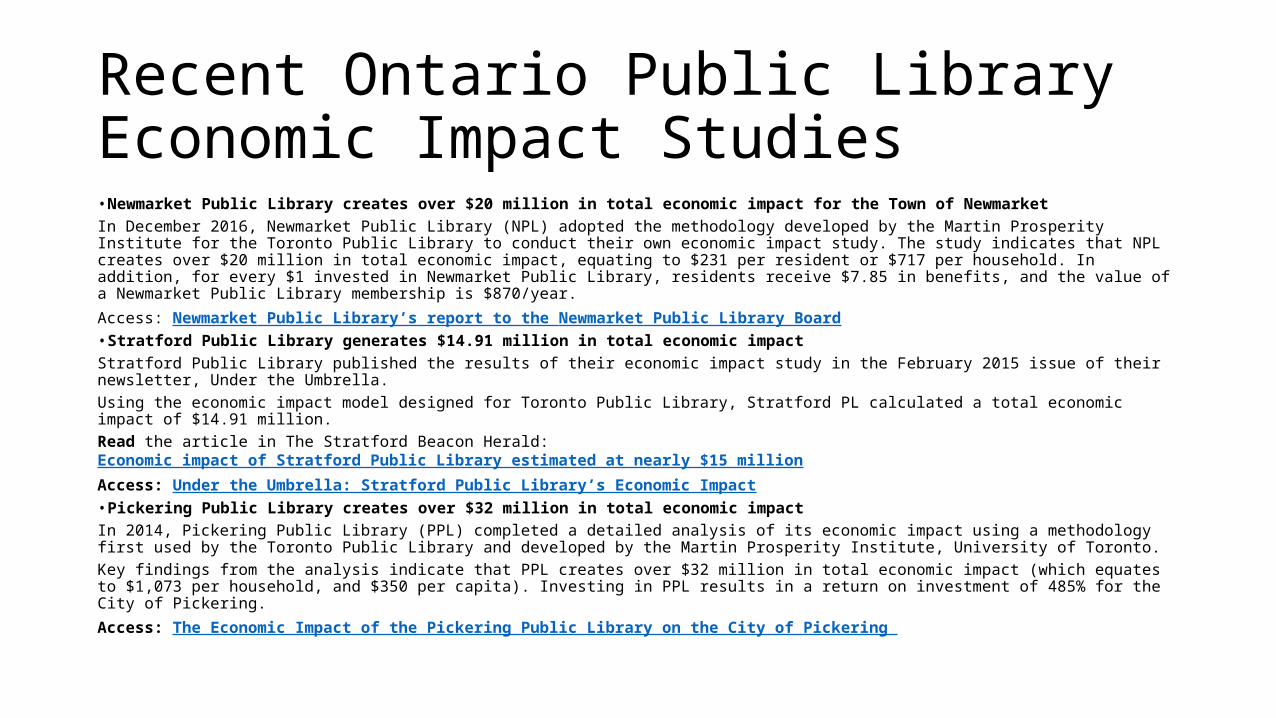
Recent Ontario Public Library Economic Impact Studies• Newmarket Public Library creates over $20 million in total economic impact for the Town of NewmarketIn December 2016, Newmarket Public Library (NPL) adopted the methodology developed by the Martin Prosperity Institute for the Toronto Public Library to conduct their own economic impact study. The study indicates that NPL creates over $20 million in total economic impact, equating to $231 per resident or $717 per household. In addition, for every $1 invested in Newmarket Public Library, residents receive $7.85 in benefits, and the value of a Newmarket Public Library membership is $870/year.Access: Newmarket Public Library’s report to the Newmarket Public Library Board• Stratford Public Library generates $14.91 million in total economic impactStratford Public Library published the results of their economic impact study in the February 2015 issue of their newsletter, Under the Umbrella.Using the economic impact model designed for Toronto Public Library, Stratford PL calculated a total economic impact of $14.91 million.Read the article in The Stratford Beacon Herald: Economic impact of Stratford Public Library estimated at nearly $15 millionAccess: Under the Umbrella: Stratford Public Library’s Economic Impact• Pickering Public Library creates over $32 million in total economic impactIn 2014, Pickering Public Library (PPL) completed a detailed analysis of its economic impact using a methodology first used by the Toronto Public Library and developed by the Martin Prosperity Institute, University of Toronto.Key findings from the analysis indicate that PPL creates over $32 million in total economic impact (which equates to $1,073 per household, and $350 per capita). Investing in PPL results in a return on investment of 485% for the City of Pickering.Access: The Economic Impact of the Pickering Public Library on the City of Pickering
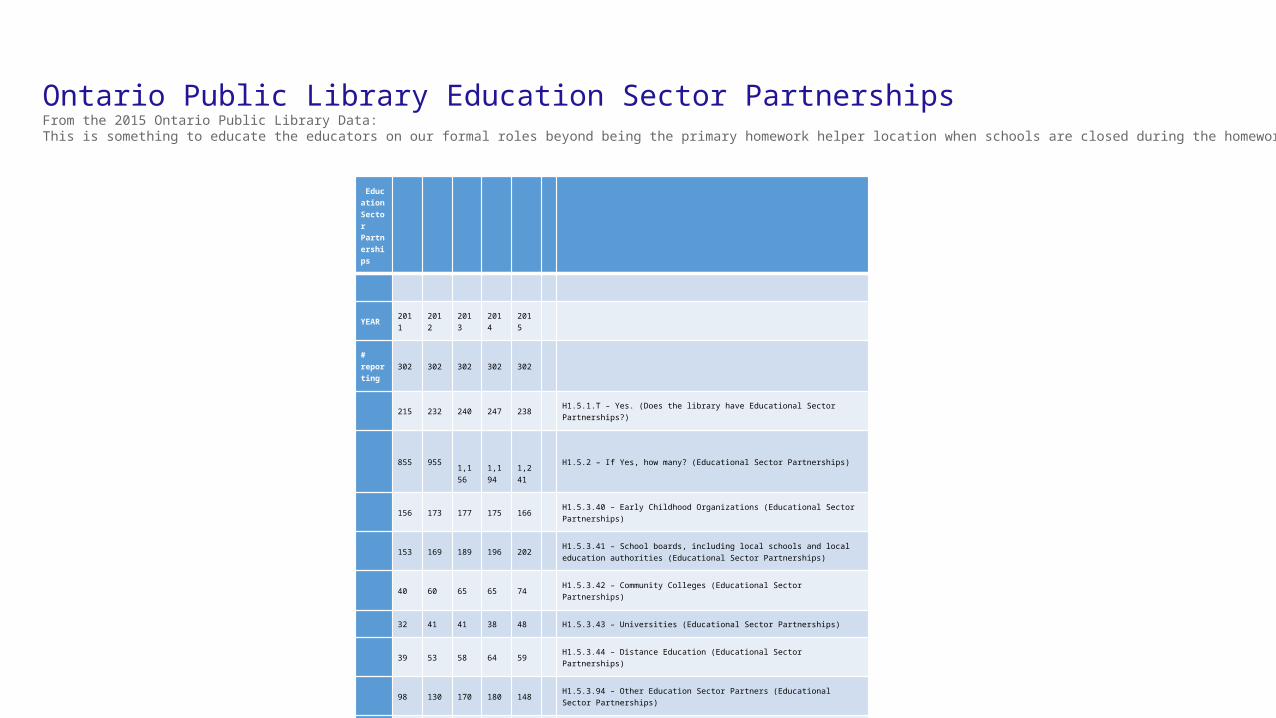
Education Sector Partnerships
YEAR 2011 2012 2013 2014 2015
# reporting
302 302 302 302 302
215 232 240 247 238 H1.5.1.T – Yes. (Does the library have Educational Sector Partnerships?)
855 955 1,156
1,194
1,241 H1.5.2 – If Yes, how many? (Educational Sector Partnerships)
156 173 177 175 166 H1.5.3.40 – Early Childhood Organizations (Educational Sector Partnerships)
153 169 189 196 202 H1.5.3.41 – School boards, including local schools and local education authorities (Educational Sector Partnerships)
40 60 65 65 74 H1.5.3.42 – Community Colleges (Educational Sector Partnerships)
32 41 41 38 48 H1.5.3.43 – Universities (Educational Sector Partnerships)
39 53 58 64 59 H1.5.3.44 – Distance Education (Educational Sector Partnerships)
98 130 170 180 148 H1.5.3.94 – Other Education Sector Partners (Educational Sector Partnerships)
71.2 76.8 79.5 81.8 78.8 % of libraries with Educational Sector Partnerships
Ontario Public Library Education Sector PartnershipsFrom the 2015 Ontario Public Library Data:This is something to educate the educators on our formal roles beyond being the primary homework helper location when schools are closed during the homework hours!
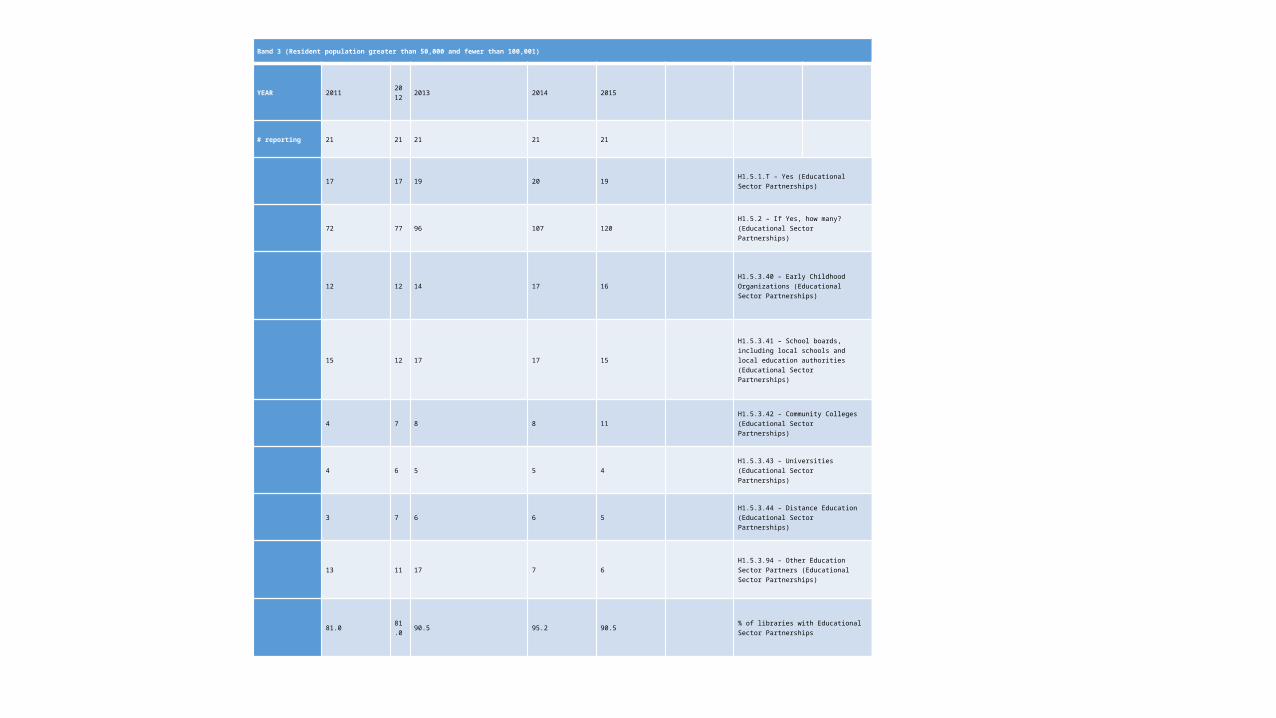
Band 3 (Resident population greater than 50,000 and fewer than 100,001)
YEAR 2011 2012 2013 2014 2015
# reporting 21 21 21 21 21
17 17 19 20 19 H1.5.1.T – Yes (Educational Sector Partnerships)
72 77 96 107 120 H1.5.2 – If Yes, how many? (Educational Sector Partnerships)
12 12 14 17 16 H1.5.3.40 – Early Childhood Organizations (Educational Sector Partnerships)
15 12 17 17 15H1.5.3.41 – School boards, including local schools and local education authorities (Educational Sector Partnerships)
4 7 8 8 11 H1.5.3.42 – Community Colleges (Educational Sector Partnerships)
4 6 5 5 4 H1.5.3.43 – Universities (Educational Sector Partnerships)
3 7 6 6 5 H1.5.3.44 – Distance Education (Educational Sector Partnerships)
13 11 17 7 6 H1.5.3.94 – Other Education Sector Partners (Educational Sector Partnerships)
81.0 81.0 90.5 95.2 90.5 % of libraries with Educational Sector
Partnerships
Streaming Media: Interesting Numbers from the 2015 Ontario Data Collection• And further digging into the recently released statistics from the 2015 Ontario Data
Collection.• We expect to have a FOPL updated summary report in February!• But here’s some fun (at least for me as executive director!) numbers about streaming
media in Ontario Public Libraries as of 2015:• This is data from approximately 306 library systems in Ontario.• Does your library offer streaming services?• • Streaming media is the format that is playing havoc in the broadcast (TV, Music,
Performances, etc.) industries. It’s great to see so many libraries building the path to the post-VHS, post-Beta, post-cassettes, post-8-track, post-Vinyl, post-CDROM, post-DVD world
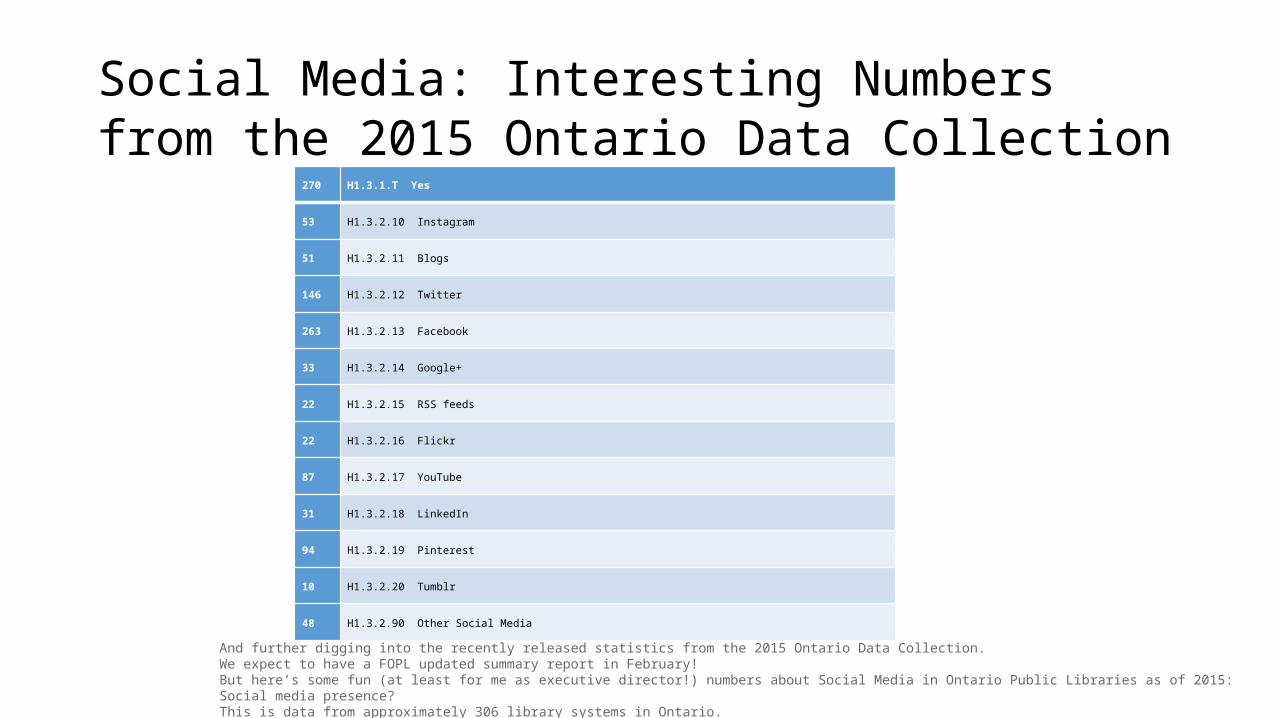
Social Media: Interesting Numbers from the 2015 Ontario Data Collection
270 H1.3.1.T Yes
53 H1.3.2.10 Instagram
51 H1.3.2.11 Blogs
146 H1.3.2.12 Twitter
263 H1.3.2.13 Facebook
33 H1.3.2.14 Google+
22 H1.3.2.15 RSS feeds
22 H1.3.2.16 Flickr
87 H1.3.2.17 YouTube
31 H1.3.2.18 LinkedIn
94 H1.3.2.19 Pinterest
10 H1.3.2.20 Tumblr
48 H1.3.2.90 Other Social Media
And further digging into the recently released statistics from the 2015 Ontario Data Collection.We expect to have a FOPL updated summary report in February!But here’s some fun (at least for me as executive director!) numbers about Social Media in Ontario Public Libraries as of 2015:Social media presence?This is data from approximately 306 library systems in Ontario.
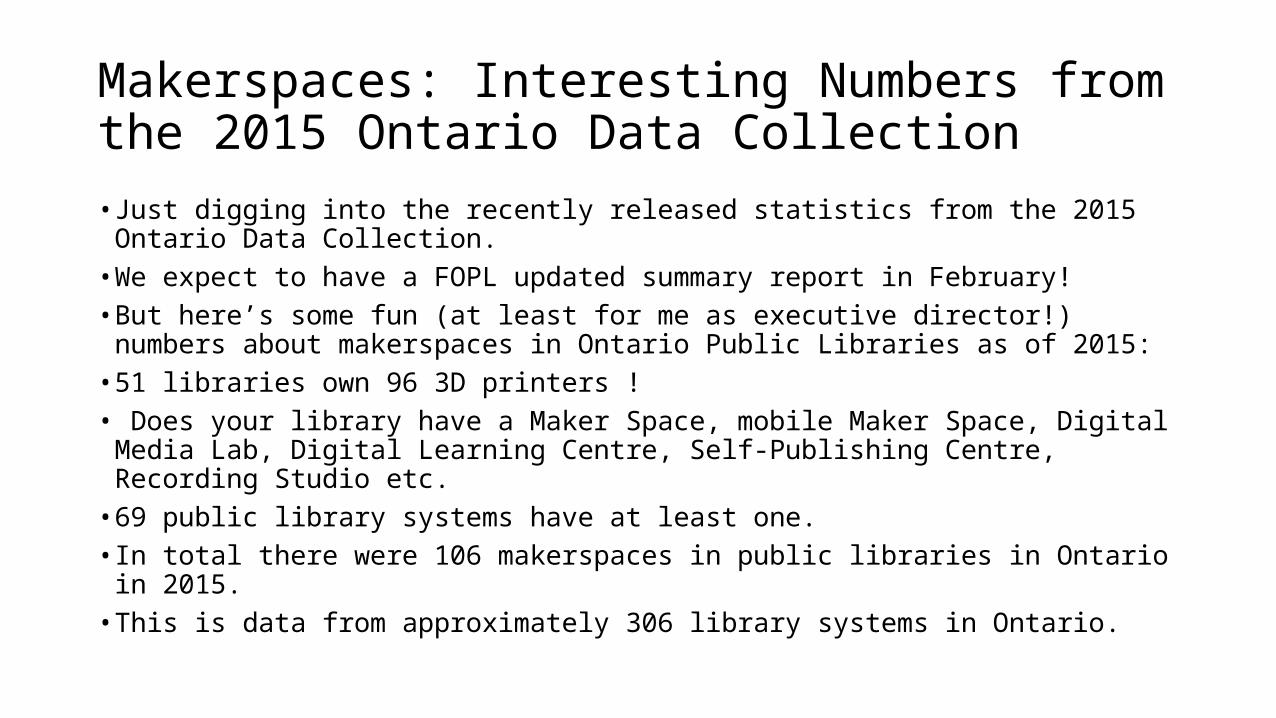
Makerspaces: Interesting Numbers from the 2015 Ontario Data Collection• Just digging into the recently released statistics from the 2015 Ontario Data
Collection.• We expect to have a FOPL updated summary report in February!• But here’s some fun (at least for me as executive director!) numbers about
makerspaces in Ontario Public Libraries as of 2015:• 51 libraries own 96 3D printers !• Does your library have a Maker Space, mobile Maker Space, Digital Media Lab,
Digital Learning Centre, Self-Publishing Centre, Recording Studio etc.• 69 public library systems have at least one.• In total there were 106 makerspaces in public libraries in Ontario in 2015. • This is data from approximately 306 library systems in Ontario.
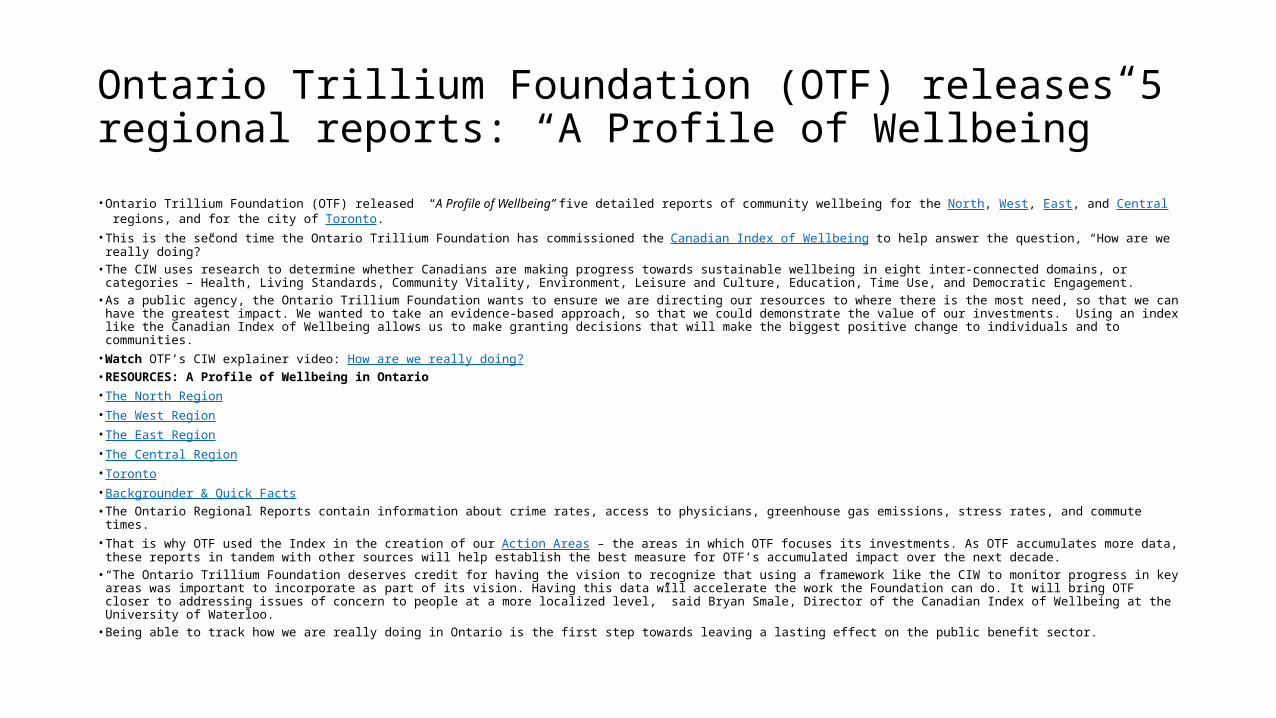
Ontario Trillium Foundation (OTF) releases 5 regional reports: “A Profile of Wellbeing”• Ontario Trillium Foundation (OTF) released “A Profile of Wellbeing” five detailed reports of community wellbeing for the North, West, East, and Central regions, and for the city of
Toronto.• This is the second time the Ontario Trillium Foundation has commissioned the Canadian Index of Wellbeing to help answer the question, “How are we really doing?”• The CIW uses research to determine whether Canadians are making progress towards sustainable wellbeing in eight inter-connected domains, or categories – Health, Living
Standards, Community Vitality, Environment, Leisure and Culture, Education, Time Use, and Democratic Engagement.• As a public agency, the Ontario Trillium Foundation wants to ensure we are directing our resources to where there is the most need, so that we can have the greatest impact. We
wanted to take an evidence-based approach, so that we could demonstrate the value of our investments. Using an index like the Canadian Index of Wellbeing allows us to make granting decisions that will make the biggest positive change to individuals and to communities.
• Watch OTF’s CIW explainer video: How are we really doing?• RESOURCES: A Profile of Wellbeing in Ontario• The North Region• The West Region• The East Region• The Central Region• Toronto• Backgrounder & Quick Facts• The Ontario Regional Reports contain information about crime rates, access to physicians, greenhouse gas emissions, stress rates, and commute times.• That is why OTF used the Index in the creation of our Action Areas – the areas in which OTF focuses its investments. As OTF accumulates more data, these reports in tandem with
other sources will help establish the best measure for OTF’s accumulated impact over the next decade.• “The Ontario Trillium Foundation deserves credit for having the vision to recognize that using a framework like the CIW to monitor progress in key areas was important to
incorporate as part of its vision. Having this data will accelerate the work the Foundation can do. It will bring OTF closer to addressing issues of concern to people at a more localized level,” said Bryan Smale, Director of the Canadian Index of Wellbeing at the University of Waterloo.
• Being able to track how we are really doing in Ontario is the first step towards leaving a lasting effect on the public benefit sector.
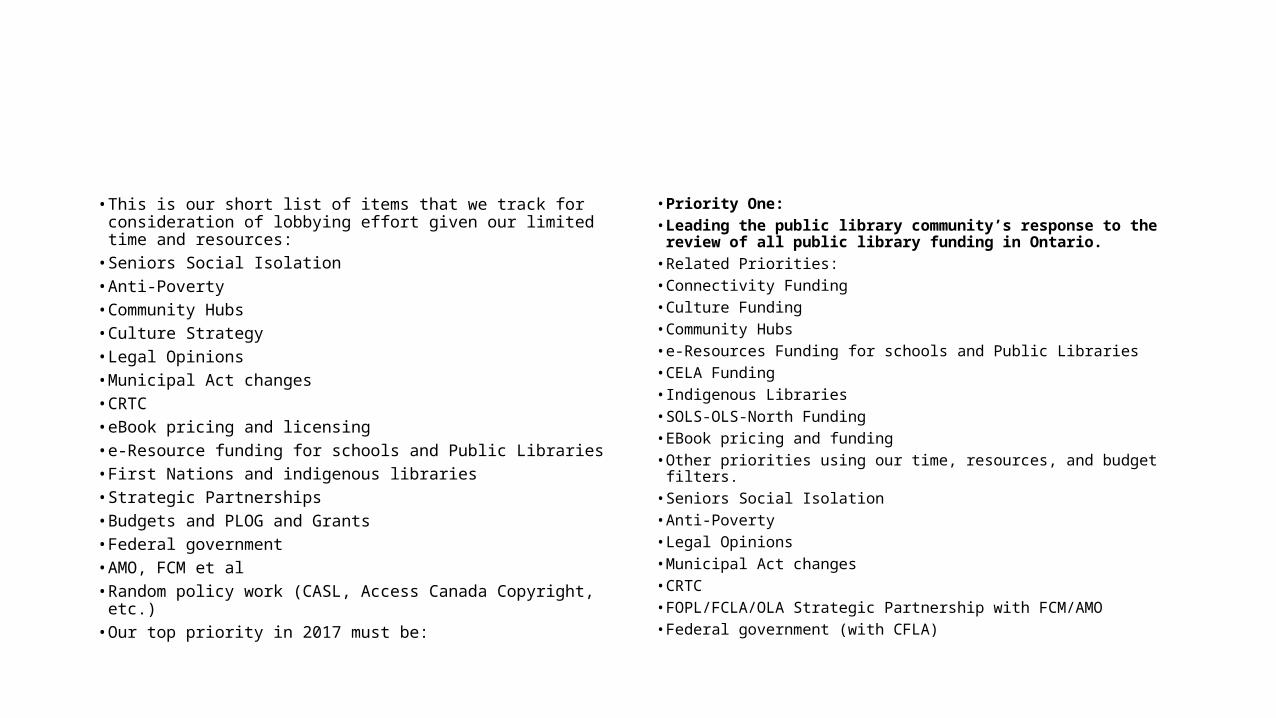
• This is our short list of items that we track for consideration of lobbying effort given our limited time and resources:
• Seniors Social Isolation• Anti-Poverty• Community Hubs• Culture Strategy• Legal Opinions• Municipal Act changes• CRTC• eBook pricing and licensing• e-Resource funding for schools and Public Libraries• First Nations and indigenous libraries• Strategic Partnerships• Budgets and PLOG and Grants• Federal government• AMO, FCM et al• Random policy work (CASL, Access Canada Copyright, etc.)• Our top priority in 2017 must be:
• Priority One:• Leading the public library community’s response to the review of all public
library funding in Ontario.• Related Priorities:• Connectivity Funding• Culture Funding• Community Hubs• e-Resources Funding for schools and Public Libraries• CELA Funding• Indigenous Libraries• SOLS-OLS-North Funding• EBook pricing and funding• Other priorities using our time, resources, and budget filters.• Seniors Social Isolation• Anti-Poverty• Legal Opinions• Municipal Act changes• CRTC• FOPL/FCLA/OLA Strategic Partnership with FCM/AMO• Federal government (with CFLA)

FOPL Custom Peer Reports
• $500-$750• Choose you own peers and influencers• 15 Systems done so far• Just call me or e-mail [email protected]


Deer in headlamps slide here.

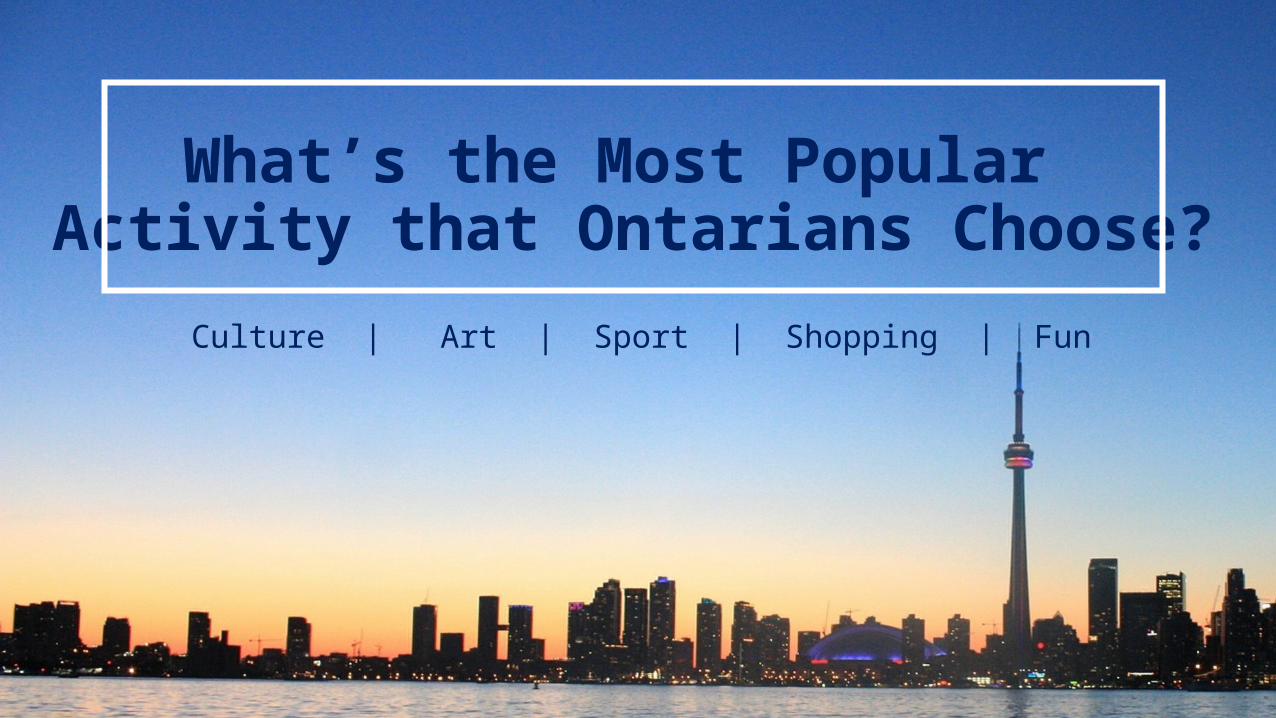
What’s the Most Popular Activity that Ontarians Choose?
Culture | Art | Sport | Shopping | Fun
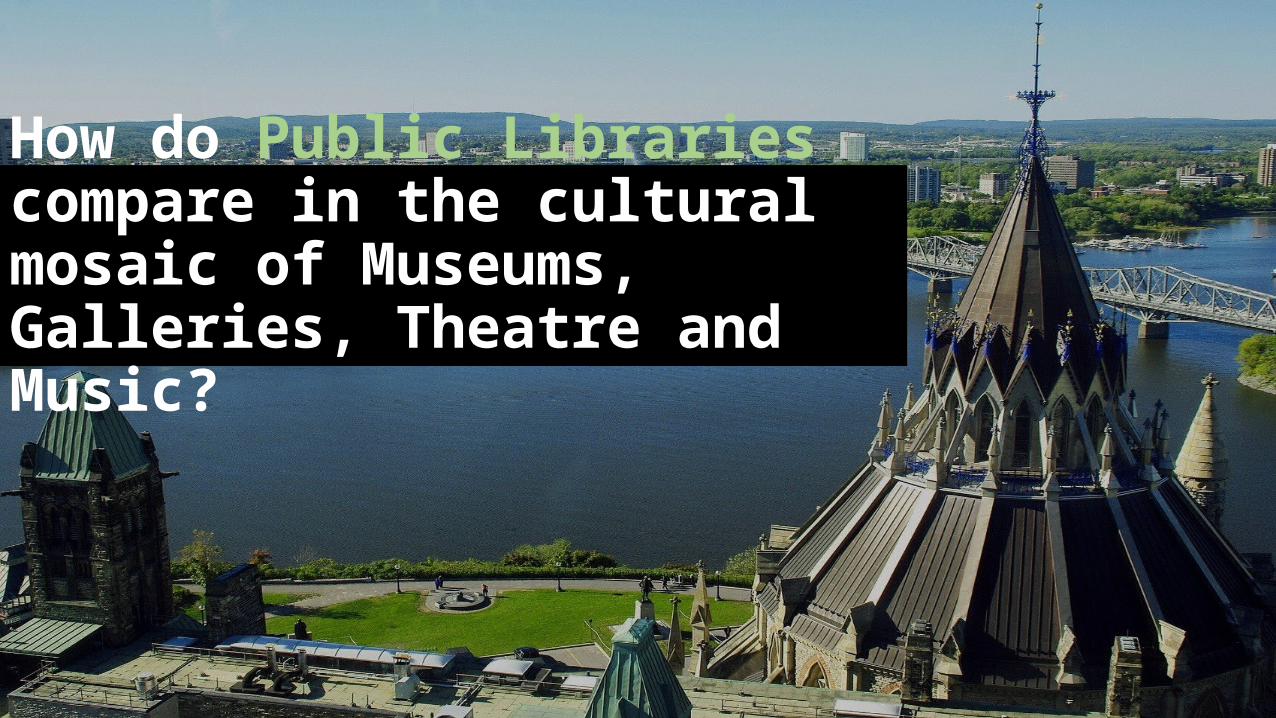
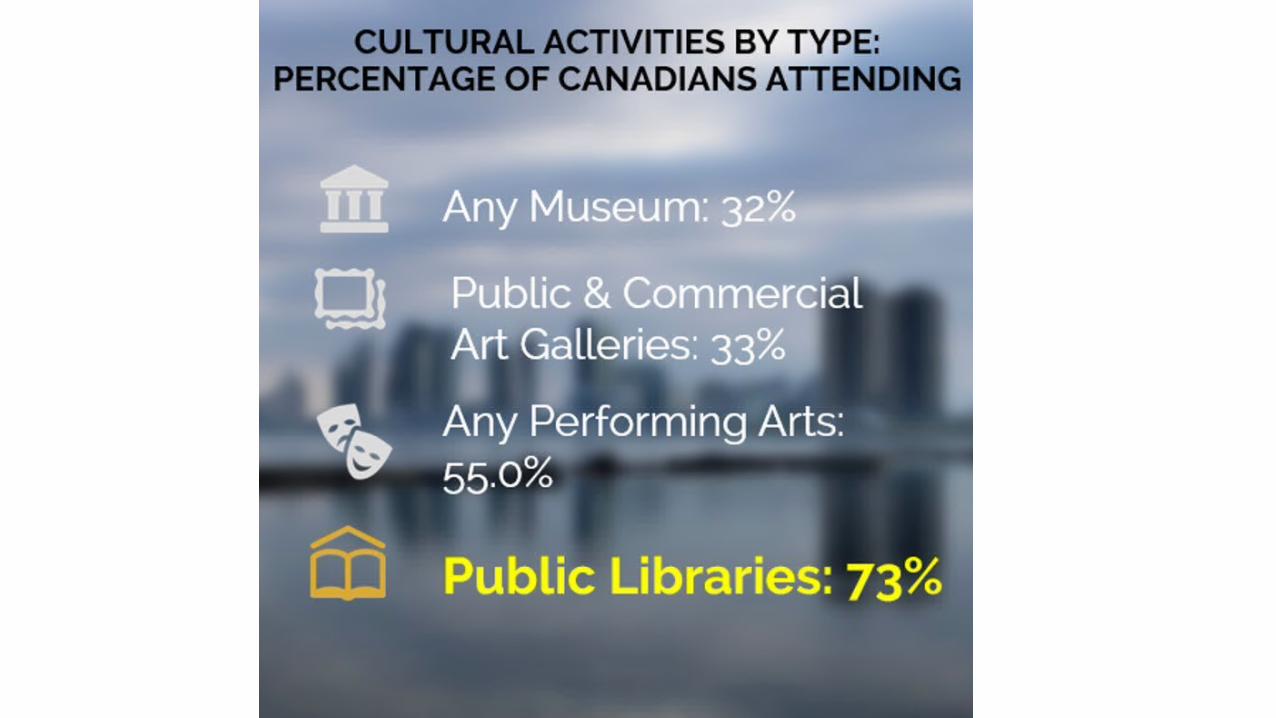
How do Public Libraries compare in the cultural mosaic of Museums, Galleries, Theatre and Music?
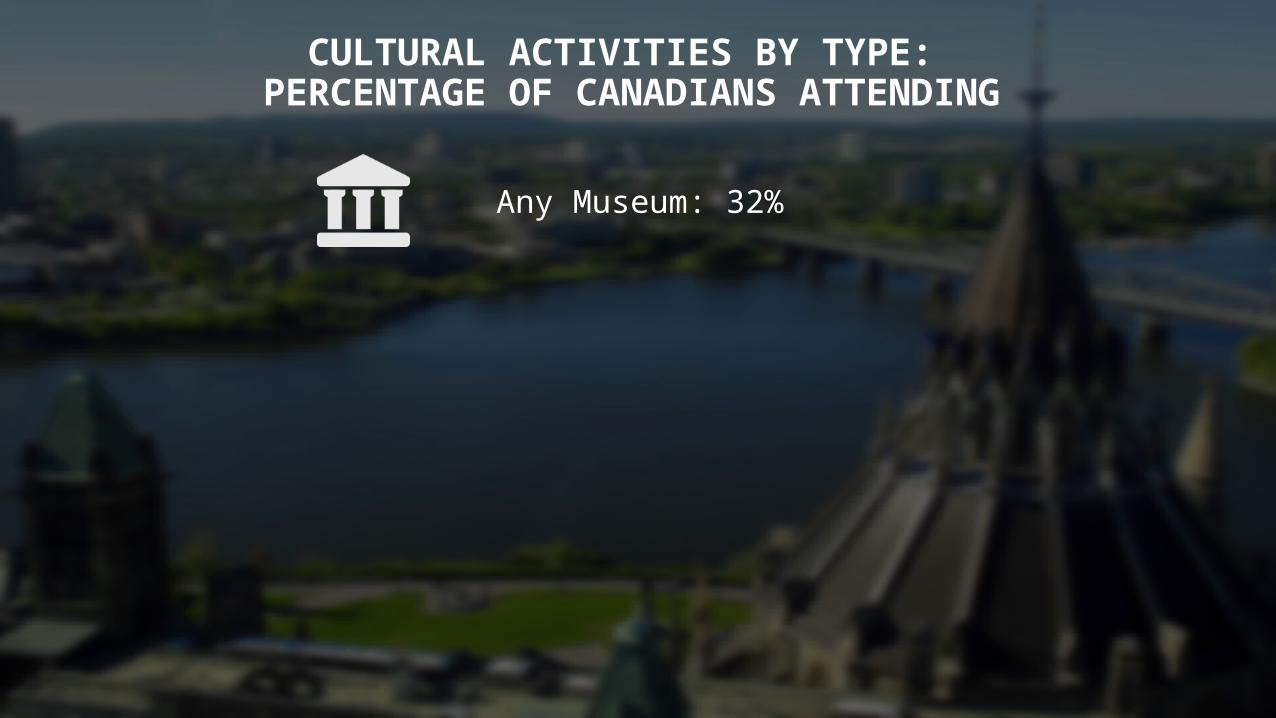
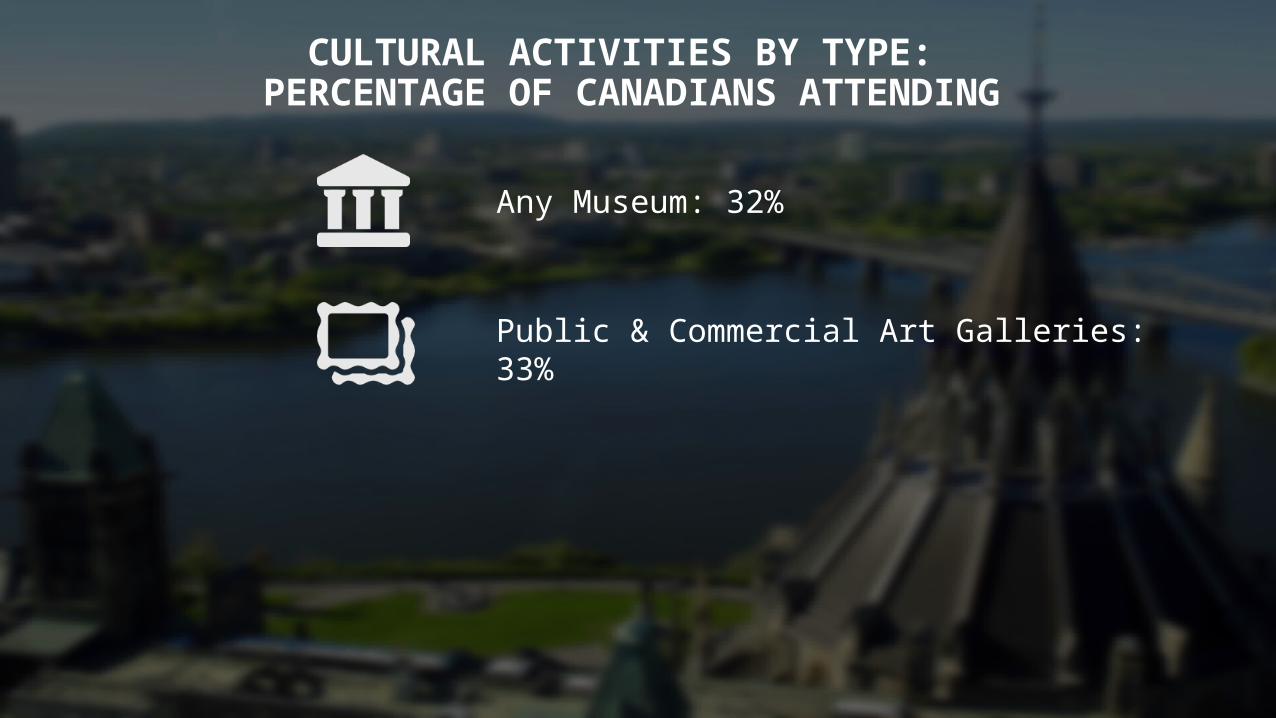
CULTURAL ACTIVITIES BY TYPE: PERCENTAGE OF CANADIANS ATTENDING
Any Museum: 32%
CULTURAL ACTIVITIES BY TYPE: PERCENTAGE OF CANADIANS ATTENDING
Any Museum: 32%
Public & Commercial Art Galleries: 33%
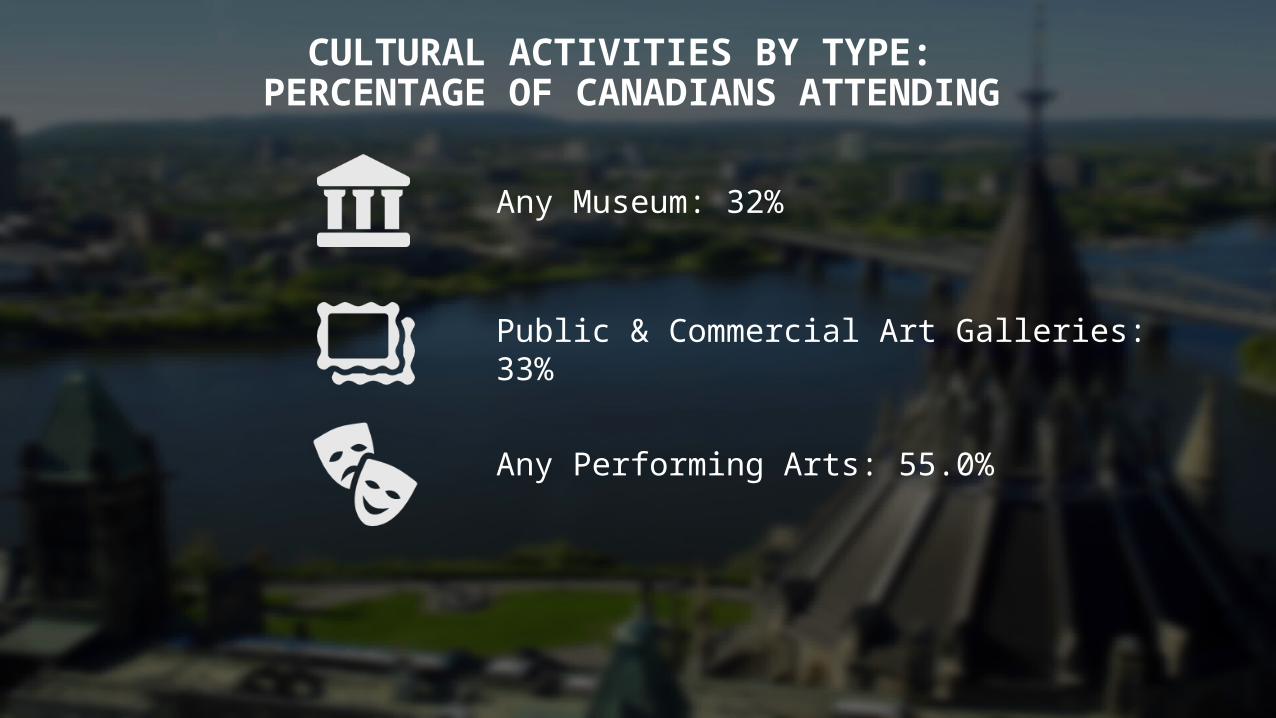
CULTURAL ACTIVITIES BY TYPE: PERCENTAGE OF CANADIANS ATTENDING
Any Museum: 32%
Public & Commercial Art Galleries: 33%
Any Performing Arts: 55.0%
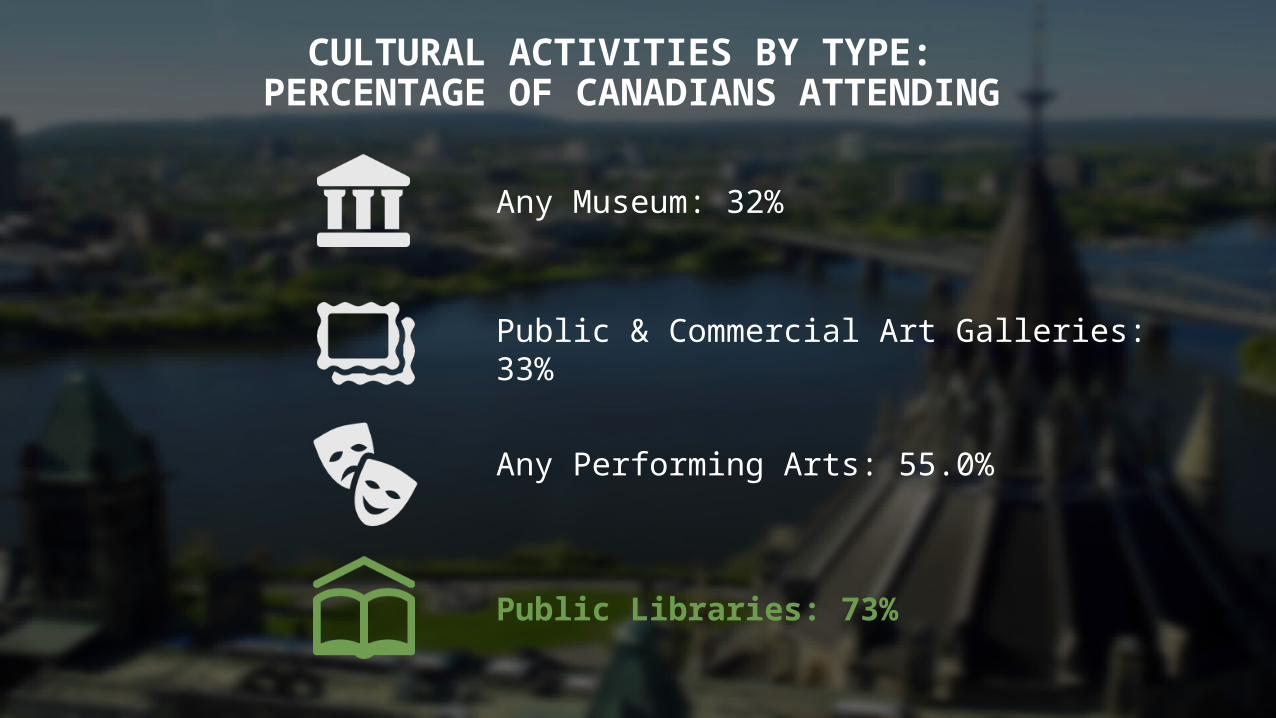
CULTURAL ACTIVITIES BY TYPE: PERCENTAGE OF CANADIANS ATTENDING
Any Museum: 32%
Public & Commercial Art Galleries: 33%
Any Performing Arts: 55.0%
Public Libraries: 73%
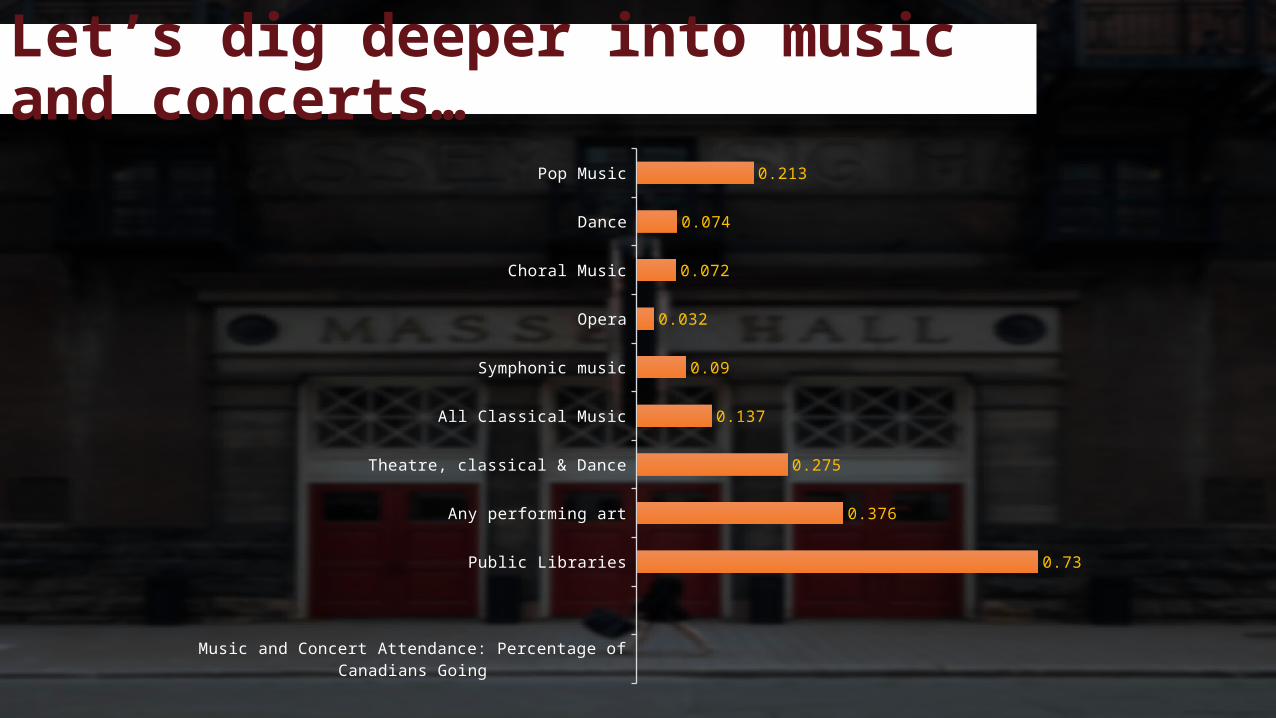
Let’s dig deeper into music and concerts…
Let’s dig deeper into music and concerts…
Music and Concert Attendance: Percentage of Canadians Going
Public Libraries
Any performing art
Theatre, classical & Dance
All Classical Music
Symphonic music
Opera
Choral Music
Dance
Pop Music
0.73
0.376
0.275
0.137
0.09
0.032
0.072
0.074
0.213
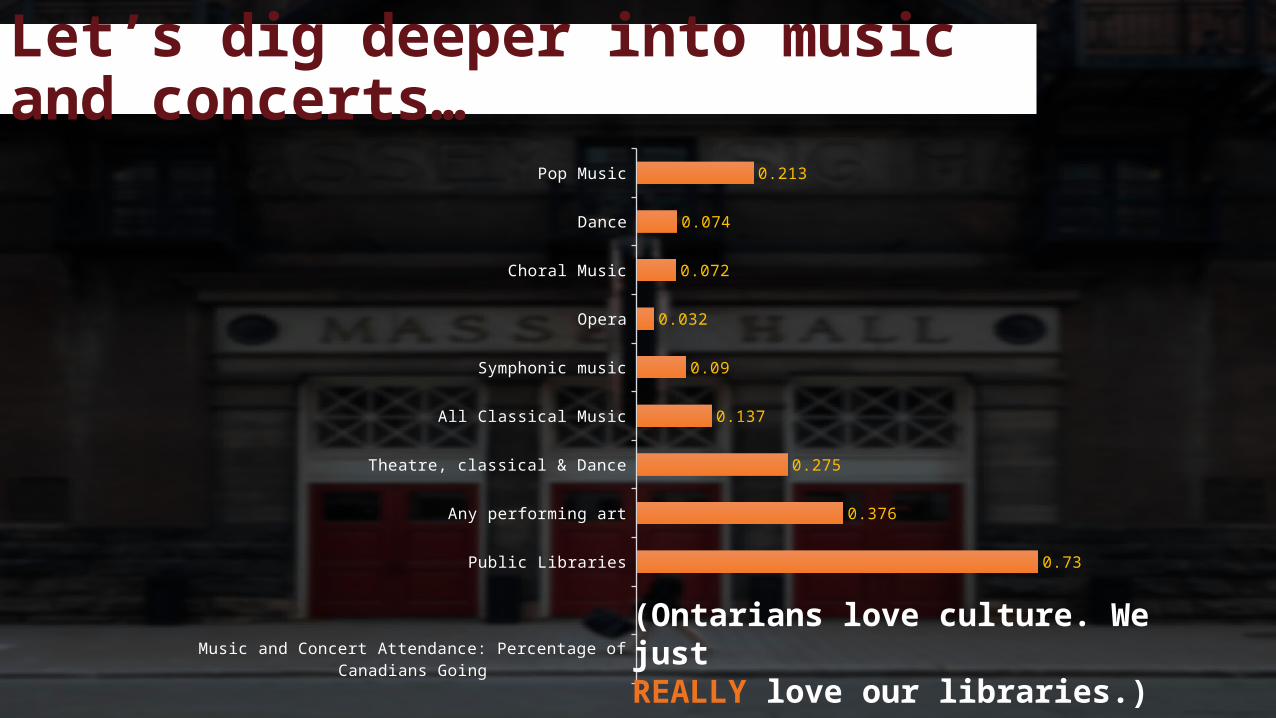
Let’s dig deeper into music and concerts…
Music and Concert Attendance: Percentage of Canadians Going
Public Libraries
Any performing art
Theatre, classical & Dance
All Classical Music
Symphonic music
Opera
Choral Music
Dance
Pop Music
0.73
0.376
0.275
0.137
0.09
0.032
0.072
0.074
0.213
(Ontarians love culture. We justREALLY love our libraries.)

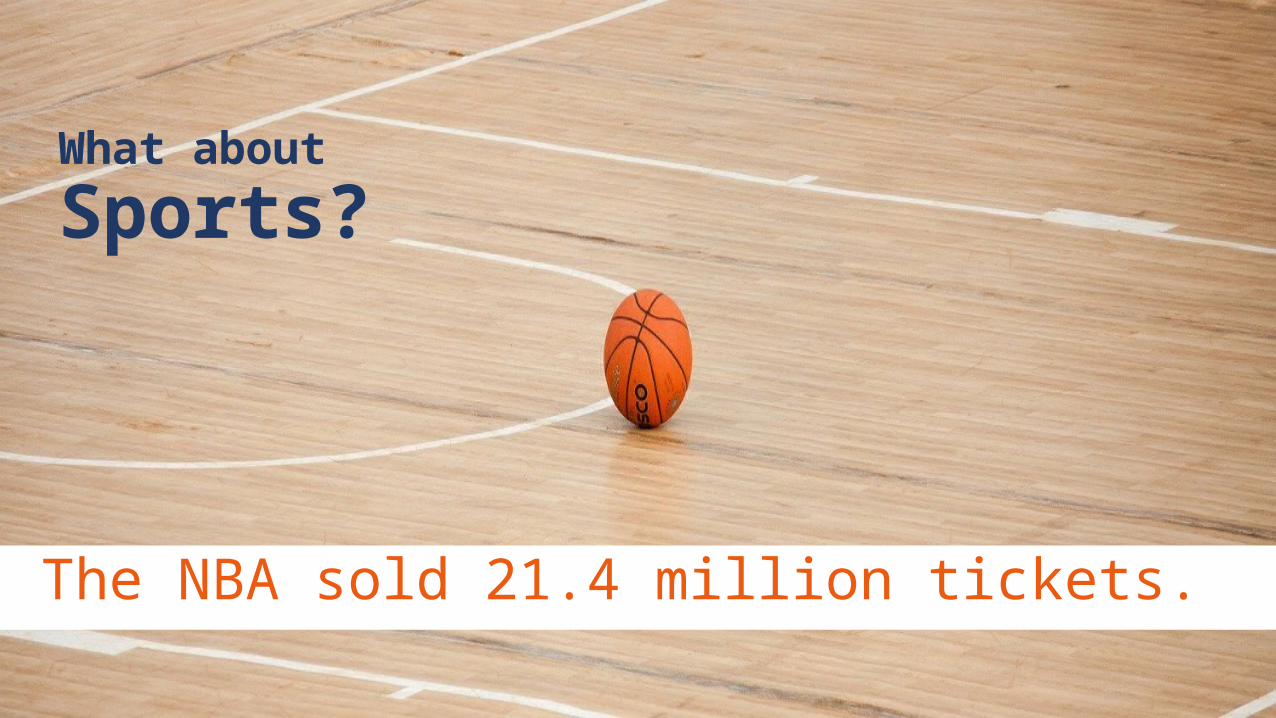
What about
Sports?

What about
Sports?
The NHL sold 21.6 million tickets.
What about
Sports?
The NBA sold 21.4 million tickets.
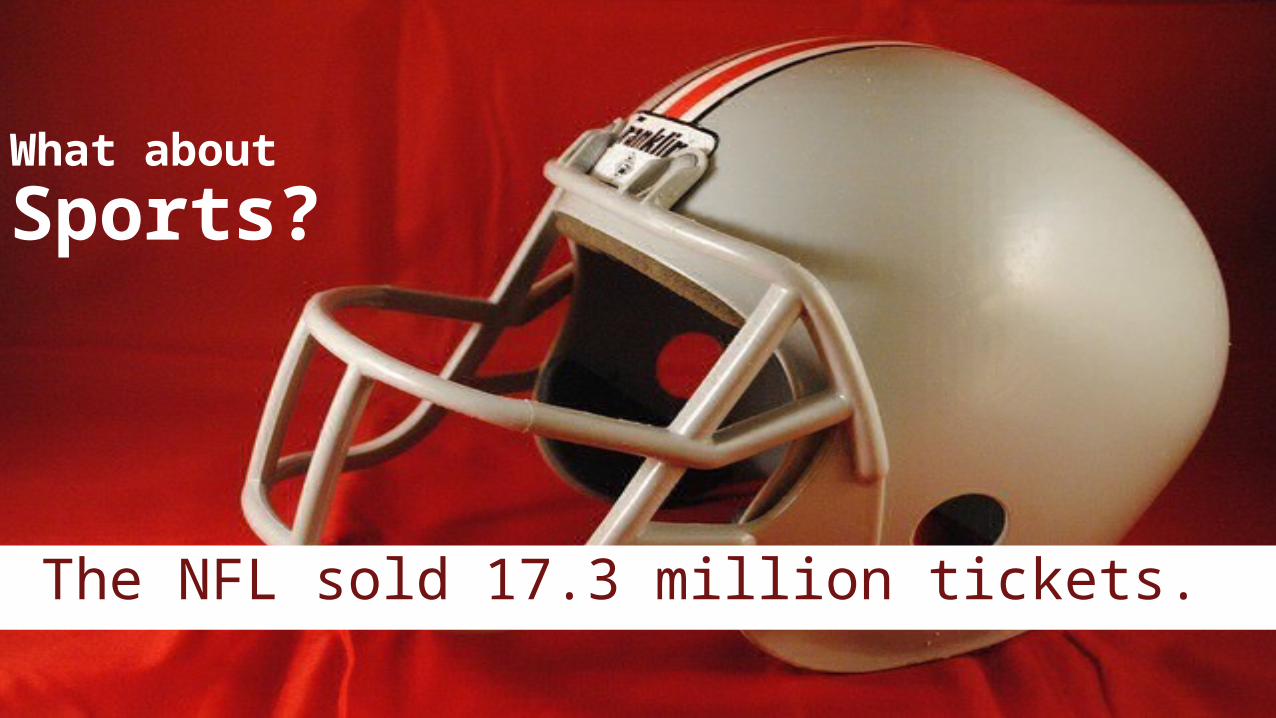
What about
Sports?
The NFL sold 17.3 million tickets.

What about
Sports?
Major League Baseball sold 73.7 million tickets

How do Libraries compare?
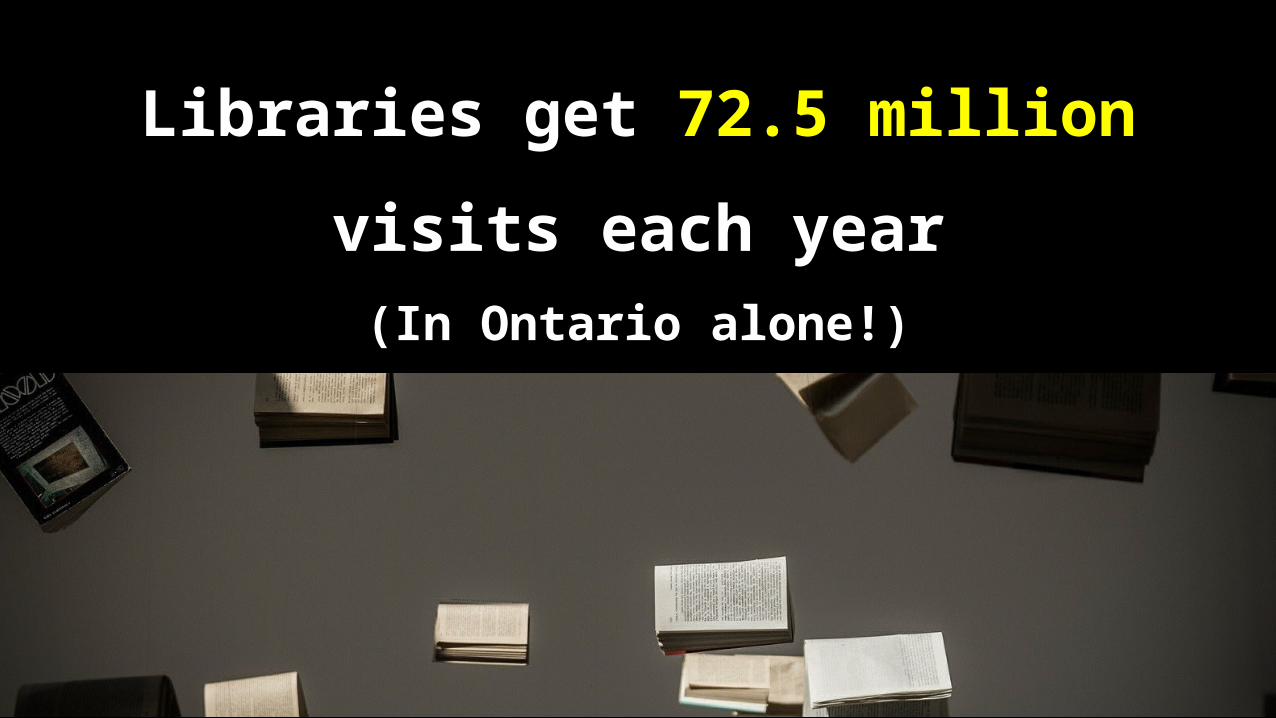
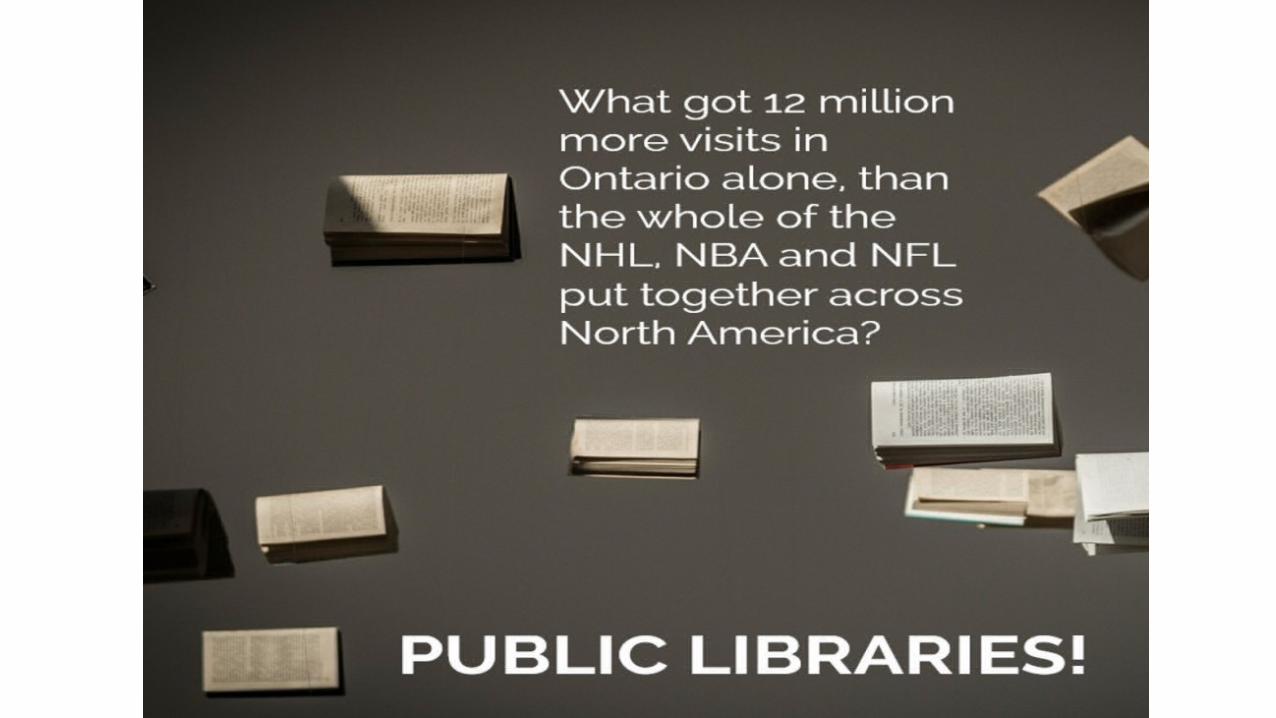
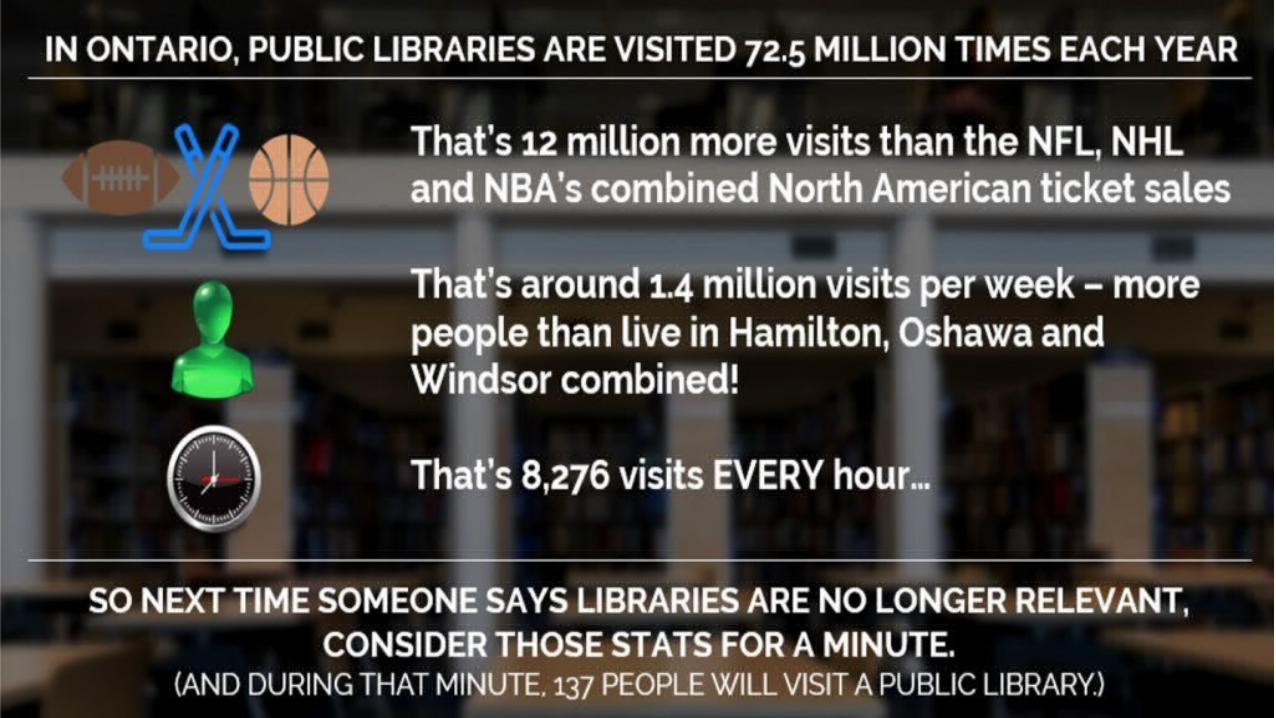
Libraries get 72.5 million visits each year(In Ontario alone!)

That’s 12 million more than the NHL, NFL and NBA combined…

Or to put it another way…
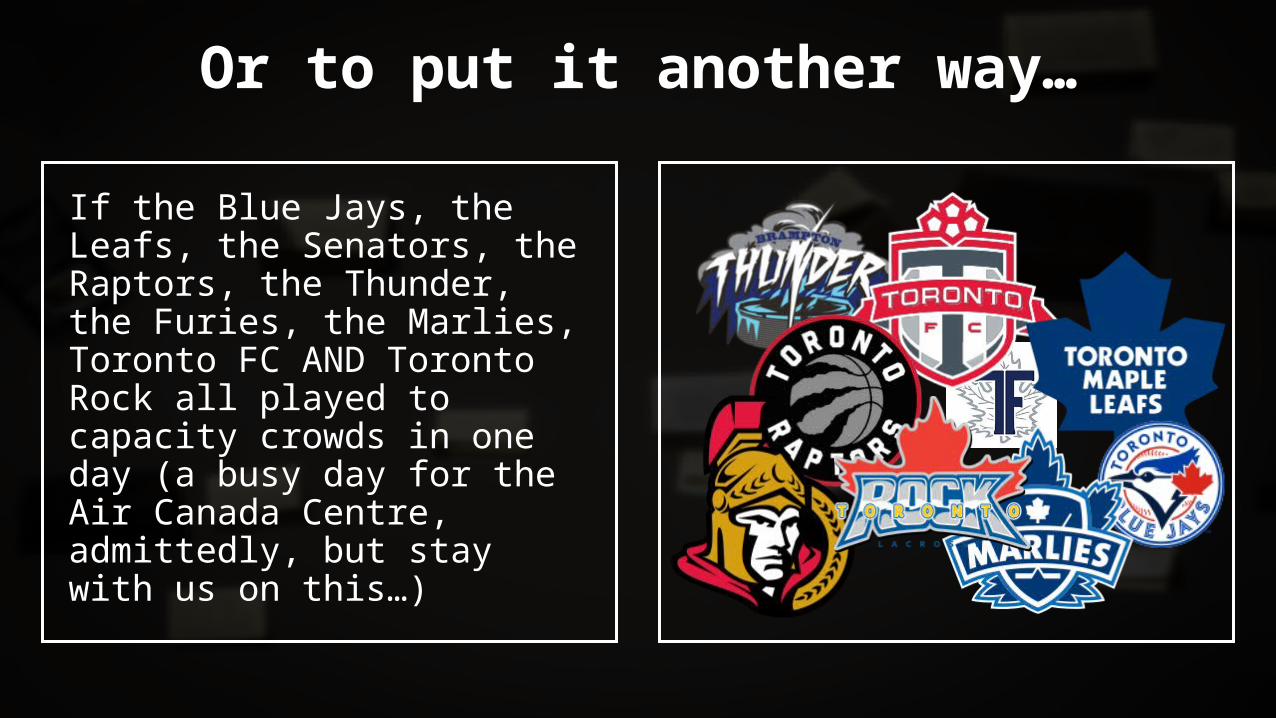
Or to put it another way…
If the Blue Jays, the Leafs, the Senators, the Raptors, the Thunder, the Furies, the Marlies, Toronto FC AND Toronto Rock all played to capacity crowds in one day (a busy day for the Air Canada Centre, admittedly, but stay with us on this…)
Or to put it another way…
They’d still see around 25,000 fewer people than Ontarian libraries get on every single day of the year.
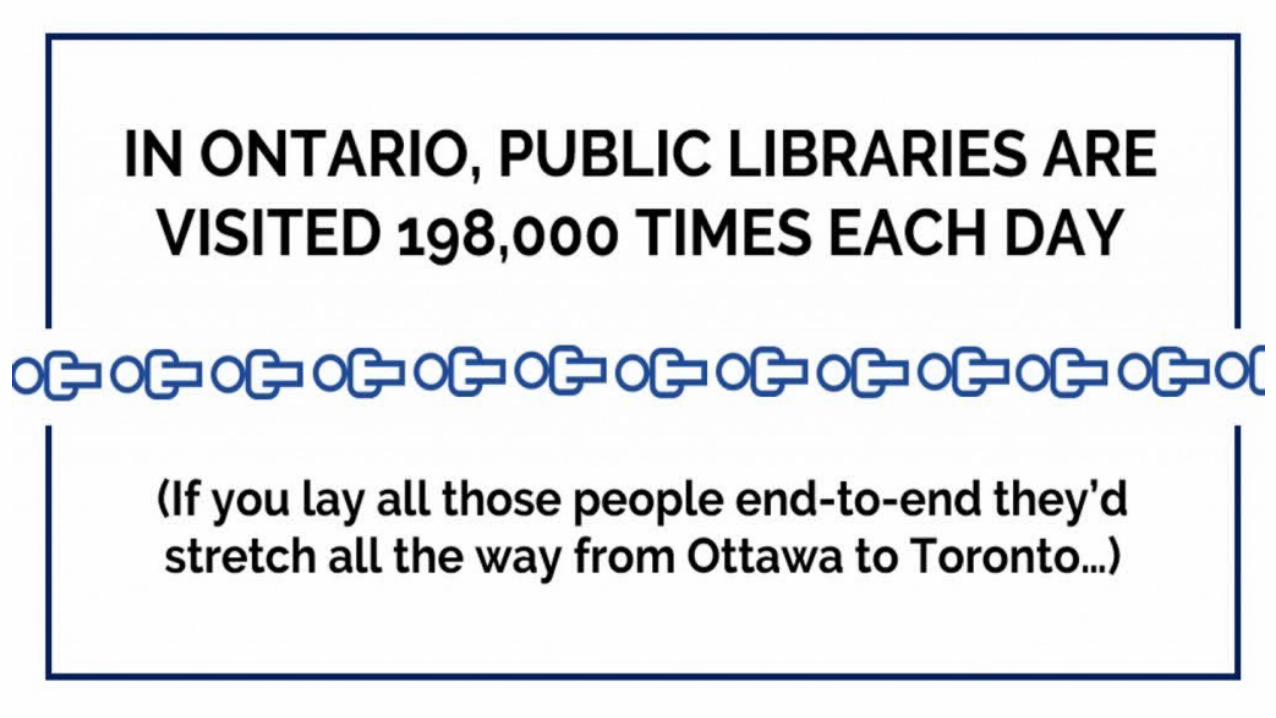
That’s right – on average, libraries in the province get 198,000 visits a day, every day.

What about Tourists? We see a lot of those.

Nope. ALL of Canada had 16 million foreigntourists. That’s less than a quarter of the number who visit their public library in Ontario alone.

How about shopping?
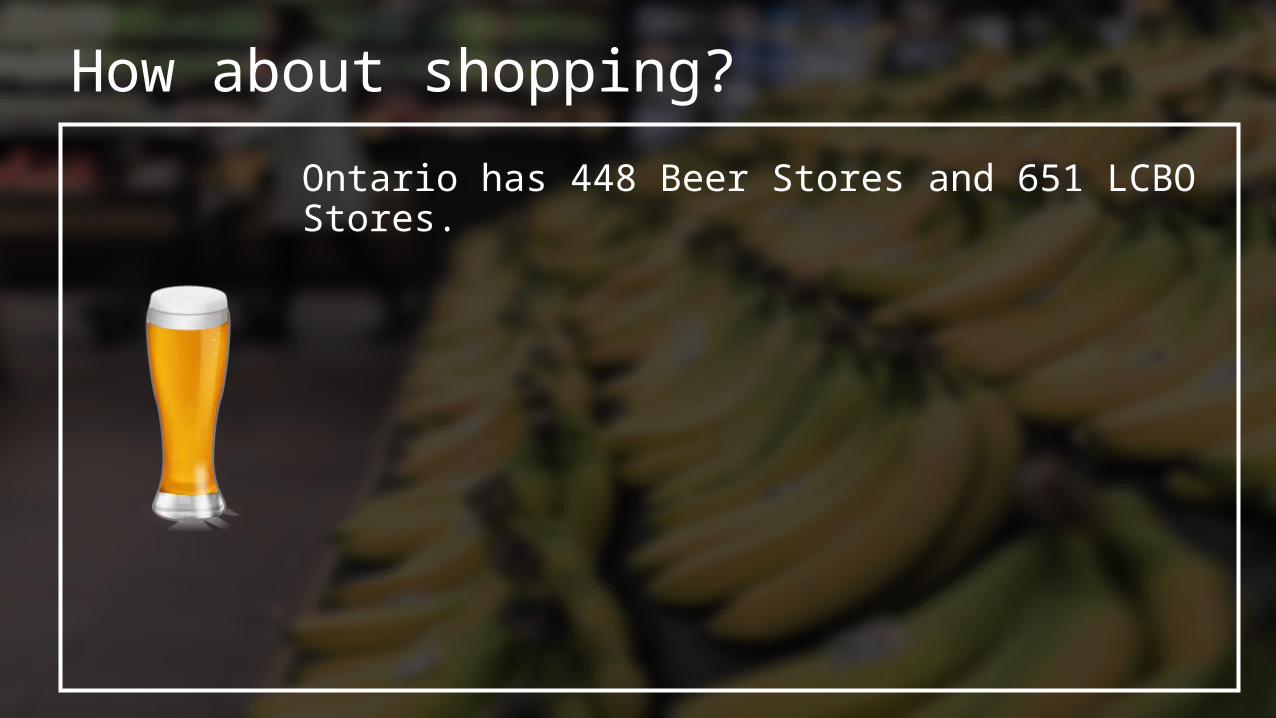
How about shopping?
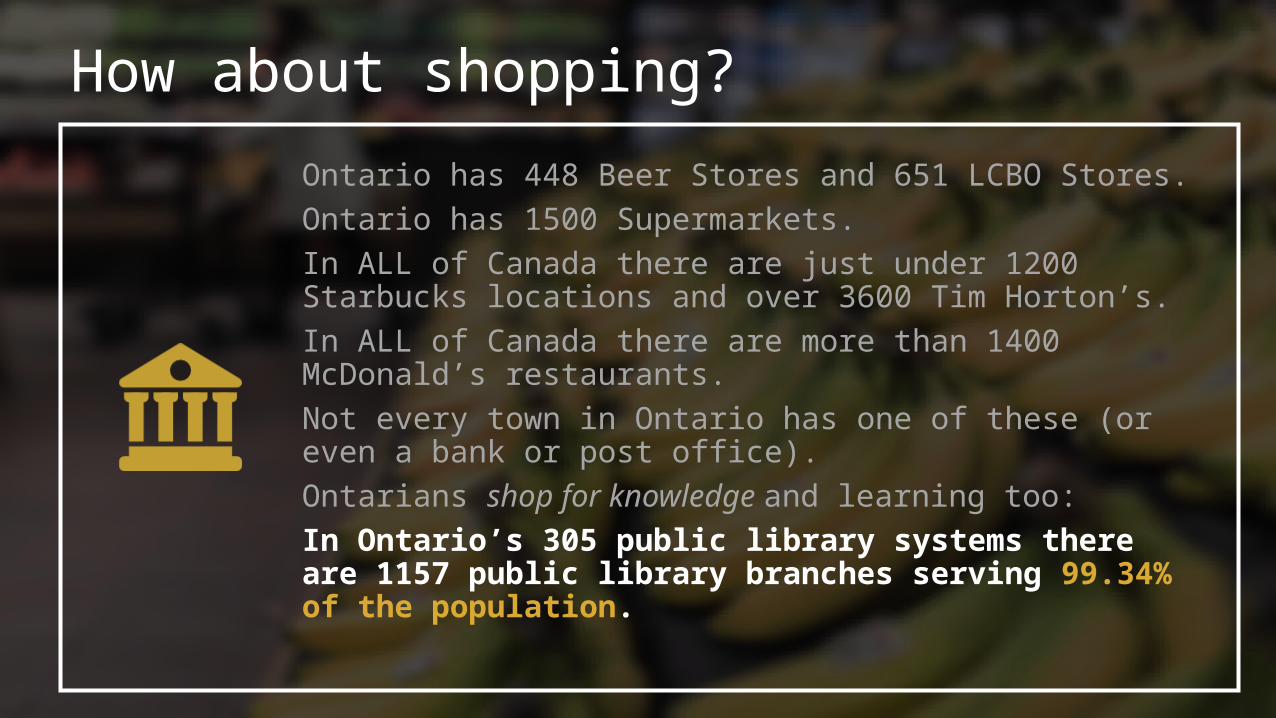
Ontario has 448 Beer Stores and 651 LCBO Stores.
How about shopping?
Ontario has 448 Beer Stores and 651 LCBO Stores.Ontario has 1500 Supermarkets.
How about shopping?
Ontario has 448 Beer Stores and 651 LCBO Stores.Ontario has 1500 Supermarkets.In ALL of Canada there are just under 1200 Starbucks locations and over 3600 Tim Horton’s.
How about shopping?
Ontario has 448 Beer Stores and 651 LCBO Stores.Ontario has 1500 Supermarkets.In ALL of Canada there are just under 1200 Starbucks locations and over 3600 Tim Horton’s.In ALL of Canada there are more than 1400 McDonald’s restaurants.
How about shopping?
Ontario has 448 Beer Stores and 651 LCBO Stores.Ontario has 1500 Supermarkets.In ALL of Canada there are just under 1200 Starbucks locations and over 3600 Tim Horton’s.In ALL of Canada there are more than 1400 McDonald’s restaurants.Not every town in Ontario has one of these (or even a bank or post office).
How about shopping?
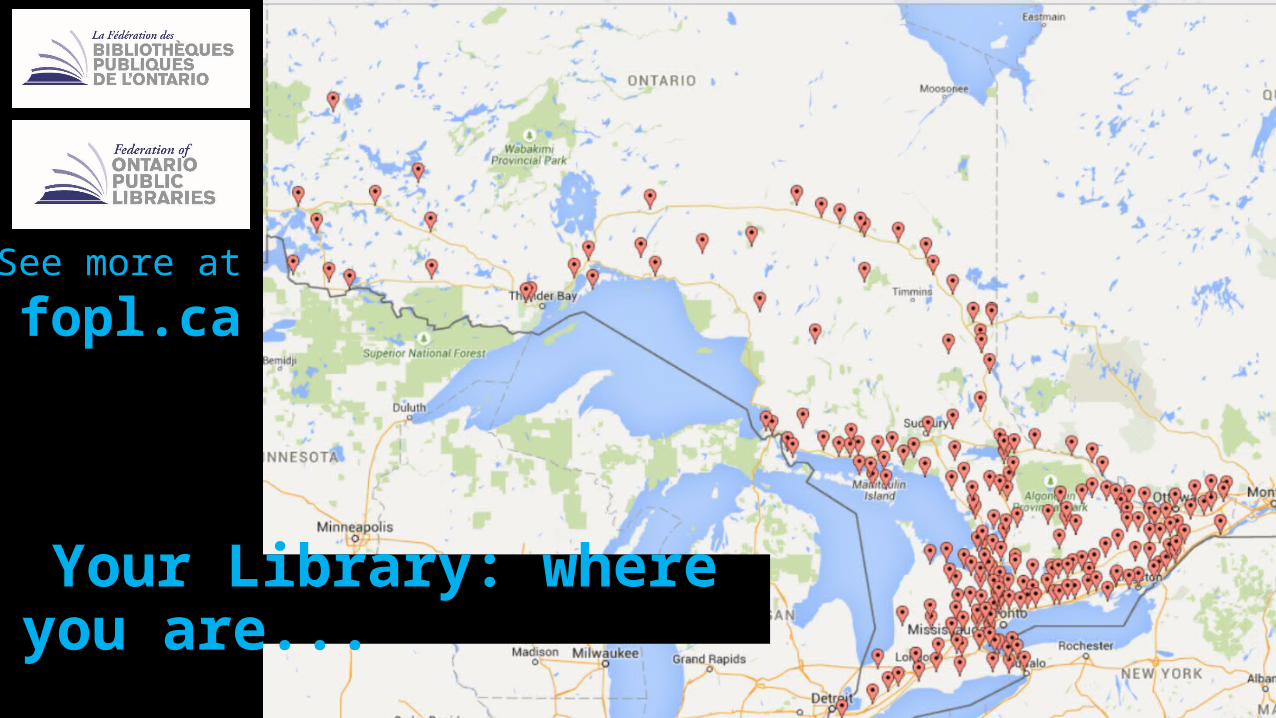
Ontario has 448 Beer Stores and 651 LCBO Stores.Ontario has 1500 Supermarkets.In ALL of Canada there are just under 1200 Starbucks locations and over 3600 Tim Horton’s.In ALL of Canada there are more than 1400 McDonald’s restaurants.Not every town in Ontario has one of these (or even a bank or post office).Ontarians shop for knowledge and learning too:In Ontario’s 305 public library systems there are 1157 public library branches serving 99.34% of the population.

Maybe people go to the Hospital more?

Maybe people go to the Hospital more?
Nope. Happily, more than 10 times more people go to the public library than Emergency!
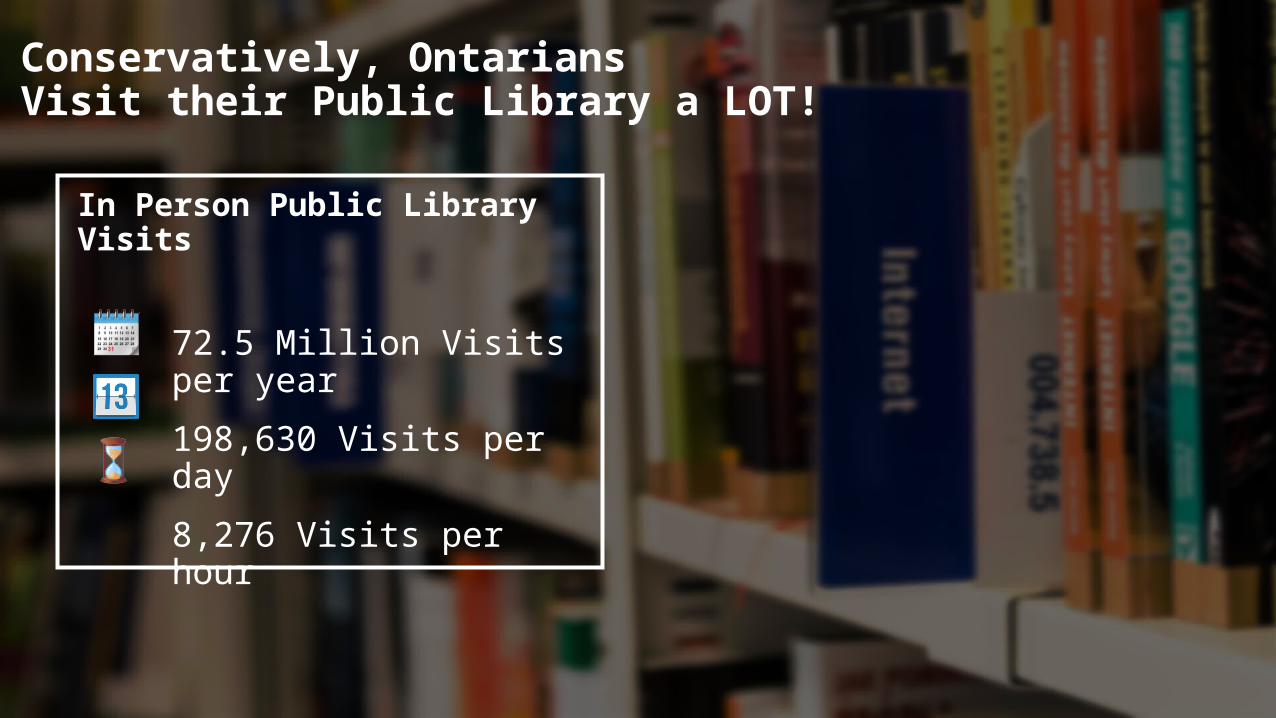
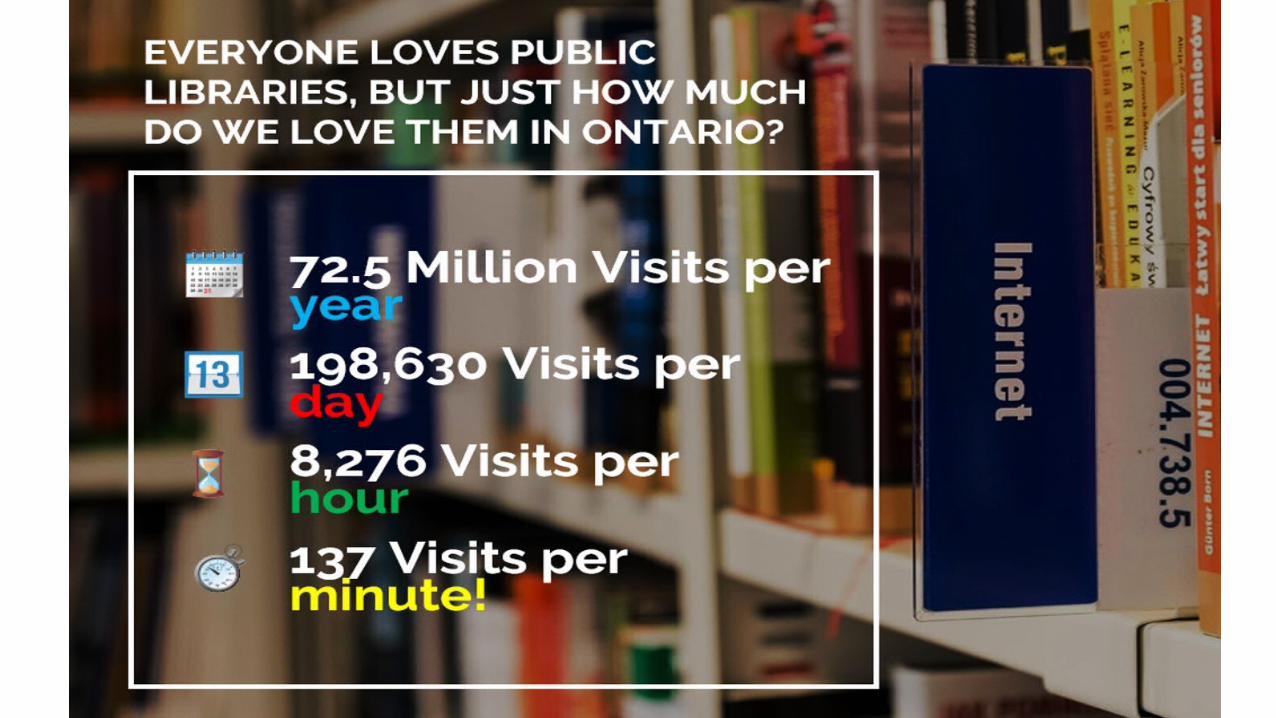
Conservatively, Ontarians Visit their Public Library a LOT!
In Person Public Library Visits
72.5 Million Visits per year
198,630 Visits per day
8,276 Visits per hour
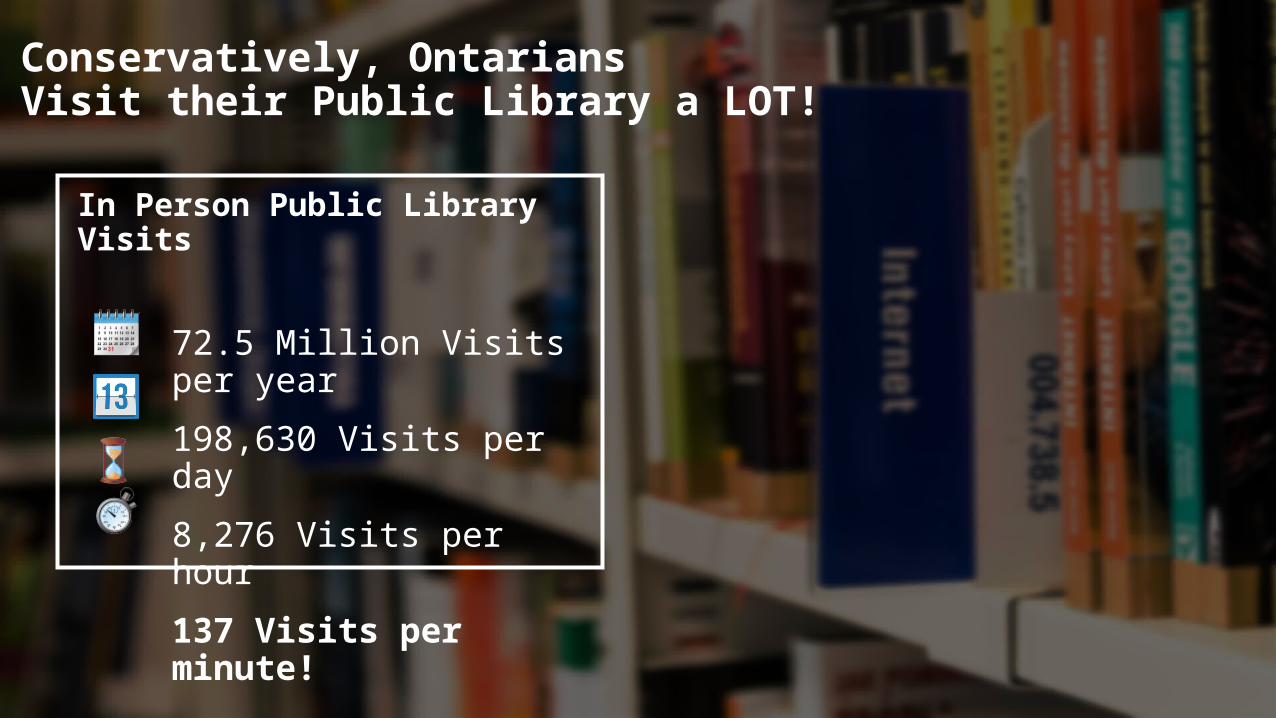
Conservatively, Ontarians Visit their Public Library a LOT!
In Person Public Library Visits
72.5 Million Visits per year
198,630 Visits per day
8,276 Visits per hour
137 Visits per minute!
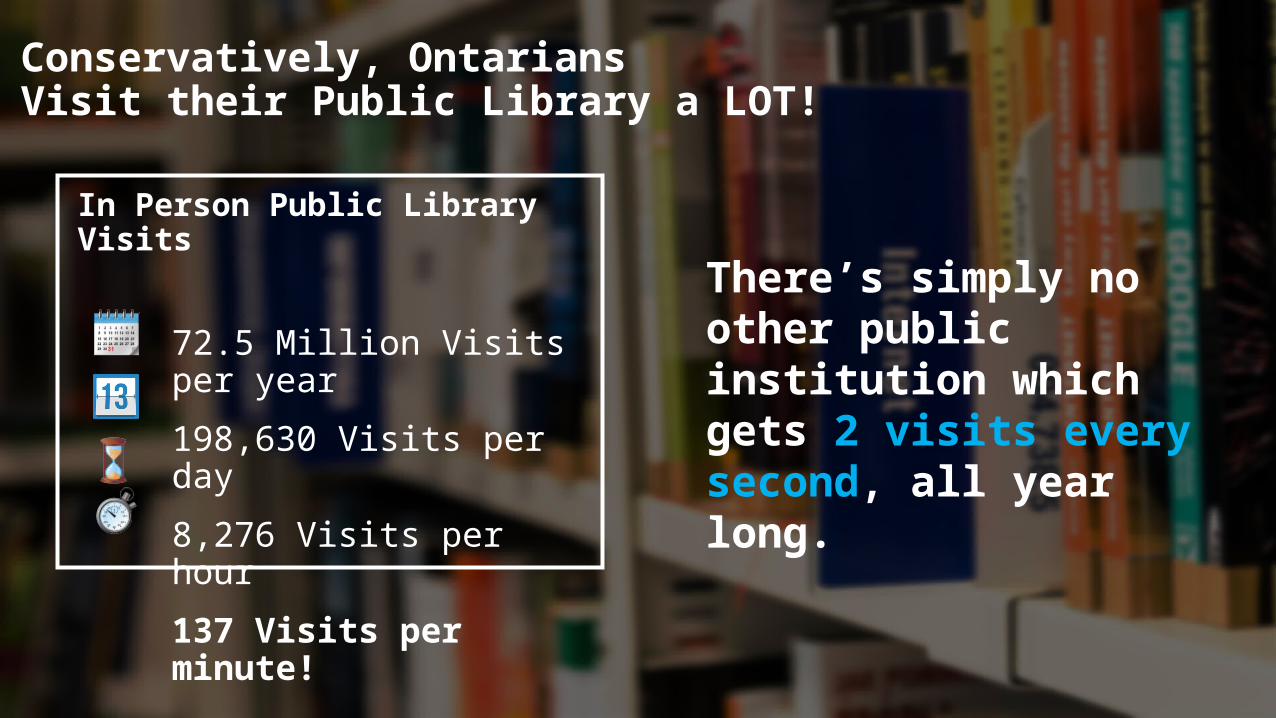
Conservatively, Ontarians Visit their Public Library a LOT!
In Person Public Library Visits
72.5 Million Visits per year
198,630 Visits per day
8,276 Visits per hour
137 Visits per minute!
There’s simply no other public institution which gets 2 visits every second, all year long.
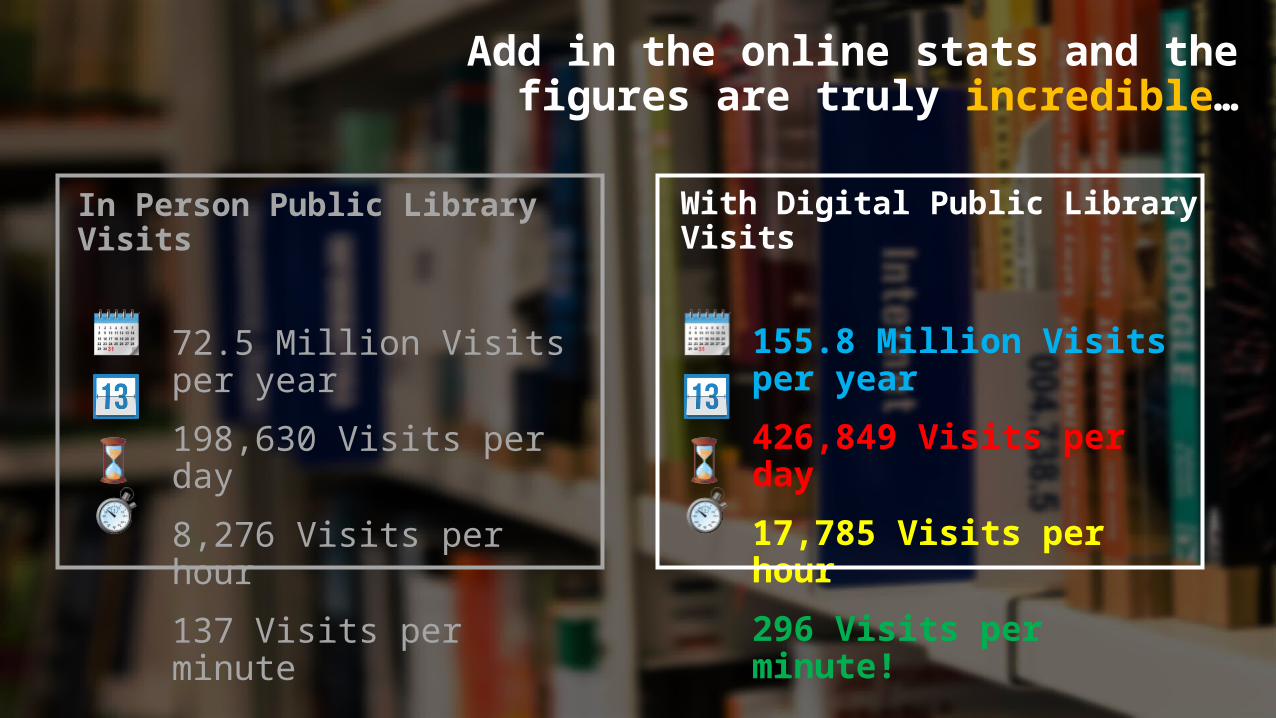
Add in the online stats and the figures are truly incredible…
In Person Public Library Visits
72.5 Million Visits per year
198,630 Visits per day
8,276 Visits per hour
137 Visits per minute
With Digital Public Library Visits
155.8 Million Visits per year
426,849 Visits per day
17,785 Visits per hour
296 Visits per minute!
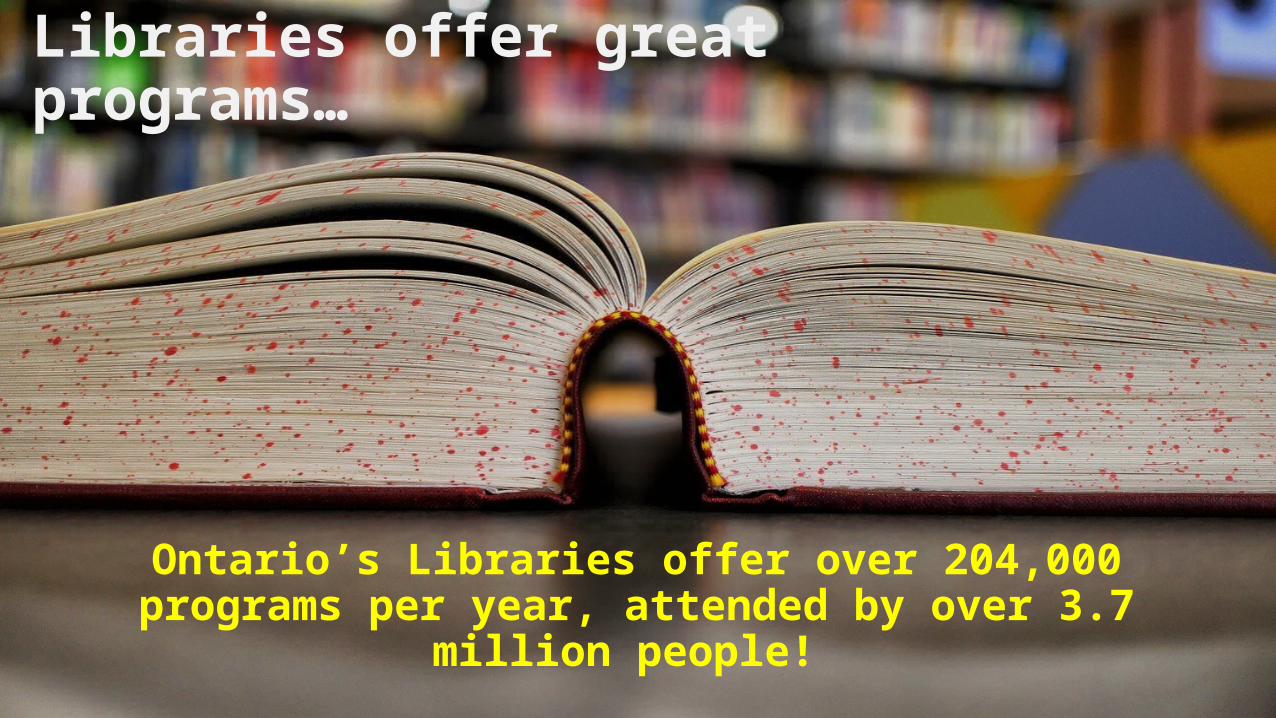
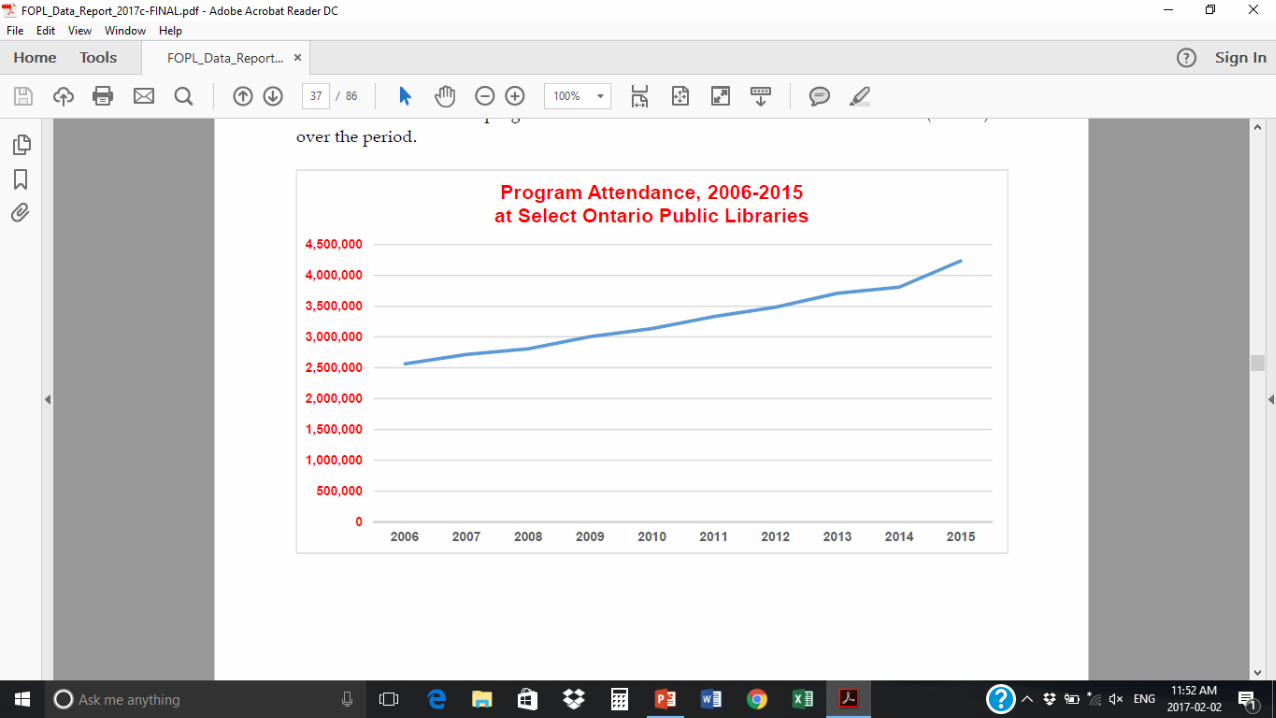
Libraries offer great programs…
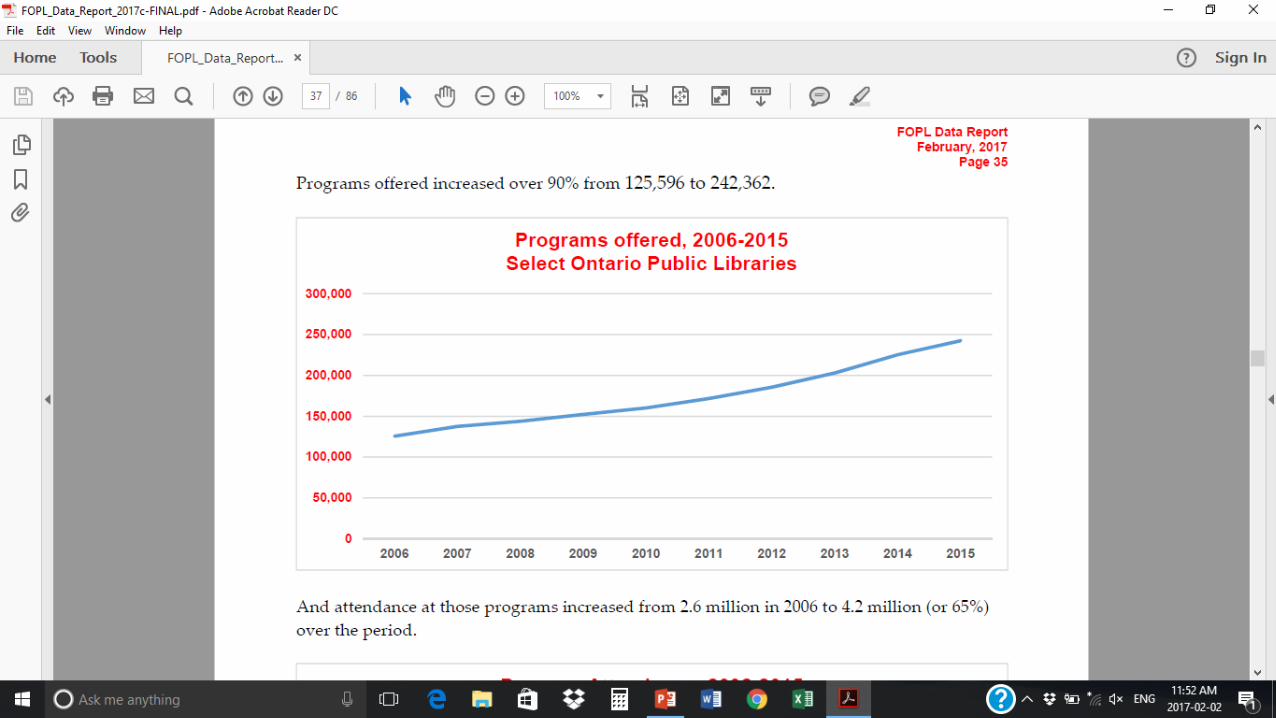
Ontario’s Libraries offer over 204,000 programs per year, attended by over 3.7 million people!
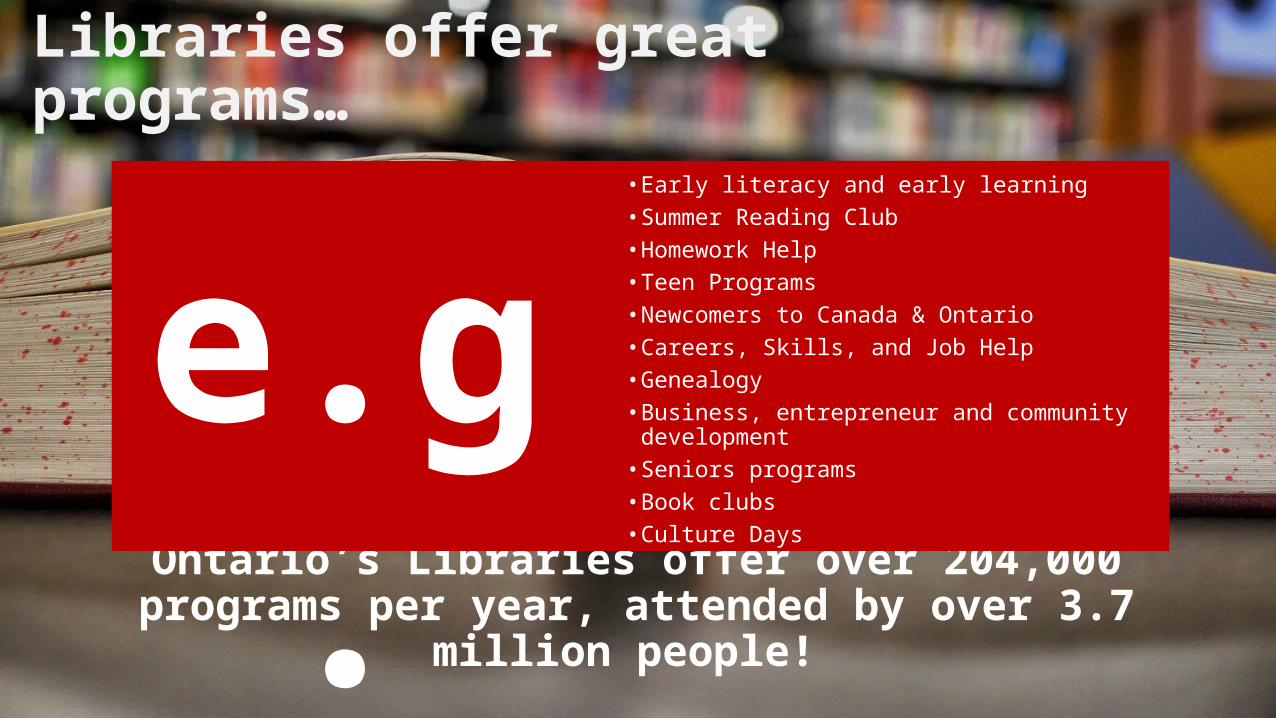
Libraries offer great programs…
Ontario’s Libraries offer over 204,000 programs per year, attended by over 3.7 million people!
• Early literacy and early learning• Summer Reading Club• Homework Help• Teen Programs• Newcomers to Canada & Ontario• Careers, Skills, and Job Help• Genealogy• Business, entrepreneur and community development• Seniors programs• Book clubs• Culture Days
e.g.
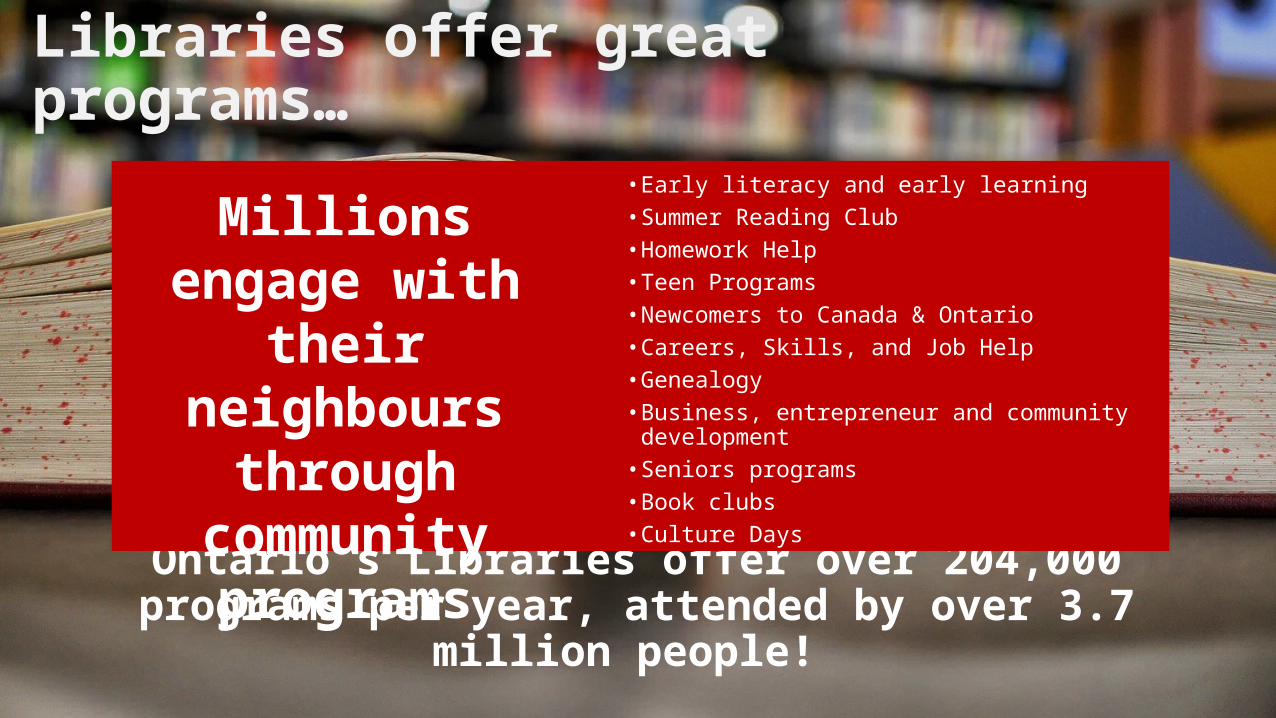
Libraries offer great programs…
Ontario’s Libraries offer over 204,000 programs per year, attended by over 3.7 million people!
• Early literacy and early learning• Summer Reading Club• Homework Help• Teen Programs• Newcomers to Canada & Ontario• Careers, Skills, and Job Help• Genealogy• Business, entrepreneur and community development• Seniors programs• Book clubs• Culture Days
Millions engage with their
neighbours through community programs

Ontarians love their culture
and sports (and that’s great!)

But they love and visit their public
libraries more.
And Ontario’s Libraries are so much more than just culture and recreation!
• Excellent Return on Investment• Strong Economic Development and Impact• Great Employment Support• Welcoming New Canadians• Provable Early Literacy Development• Ongoing Lifelong Support for Formal Education and Homework Help• Serving the whole community equitably• Affordable access to community resources• Access to Government Services and e-government• Questions Deserve Quality Answers • Support Cultural Vitality• AND Recognized and Valued Leisure Activities for majority of
Ontarians
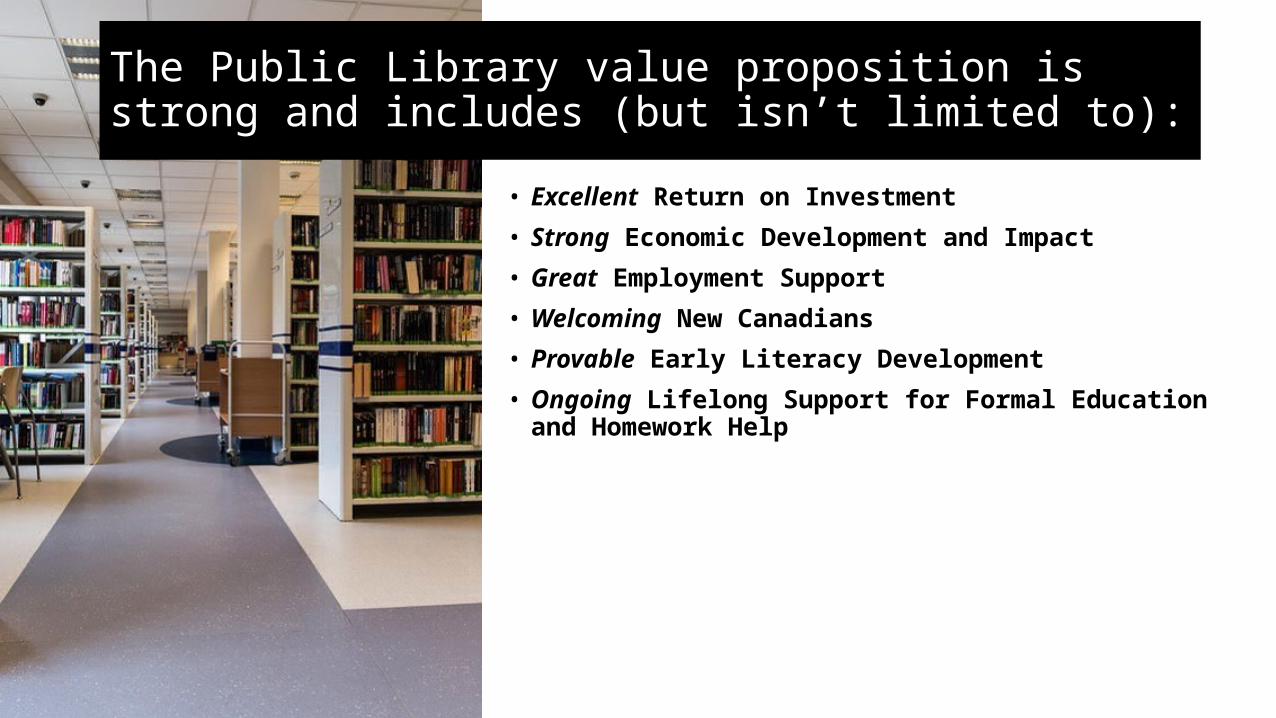
The Public Library value proposition is strong and includes (but isn’t limited to):
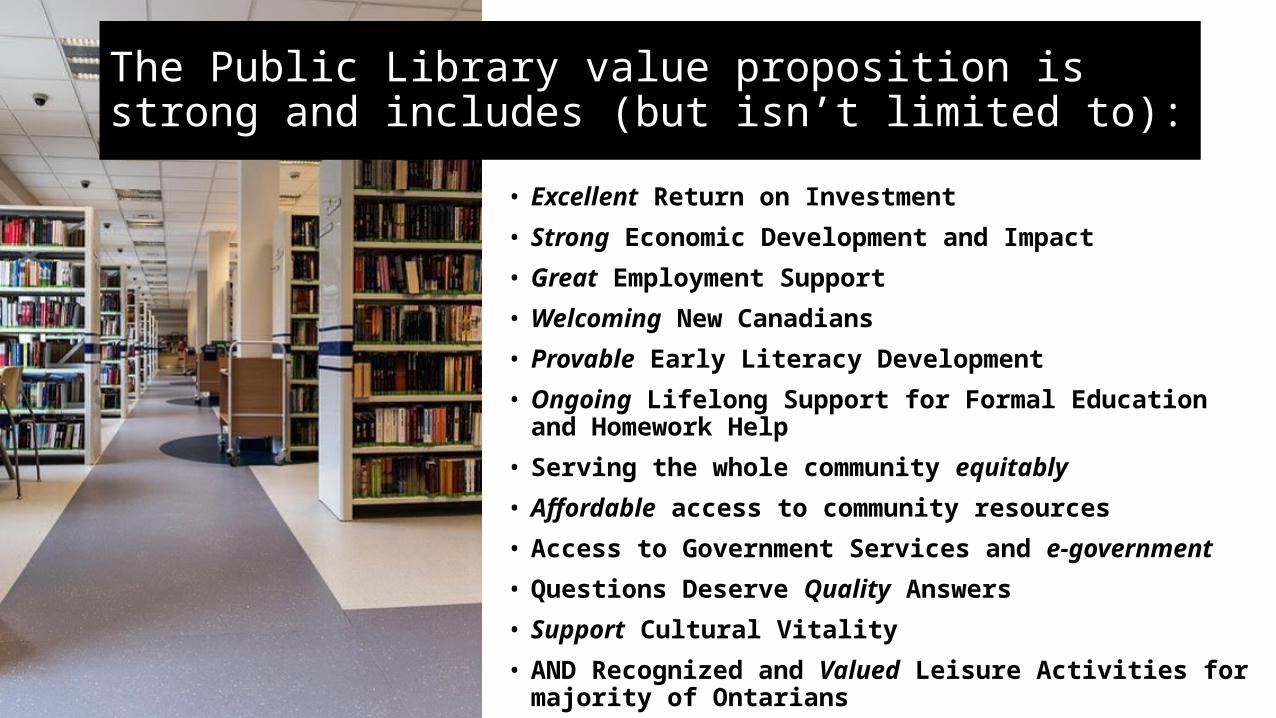
• Excellent Return on Investment• Strong Economic Development and Impact• Great Employment Support• Welcoming New Canadians• Provable Early Literacy Development• Ongoing Lifelong Support for Formal Education and Homework Help• Serving the whole community equitably• Affordable access to community resources• Access to Government Services and e-government• Questions Deserve Quality Answers • Support Cultural Vitality• AND Recognized and Valued Leisure Activities for majority of
Ontarians
The Public Library value proposition is strong and includes (but isn’t limited to):
Ontario’s Public Libraries
Simply put: Now more than ever before, Ontario’s Public Libraries play a critical role in
the social, educational, cultural and economic success of the communities in our province.
Ontario’s Public Libraries
Public Libraries are an essential investment in the future of our communities and are essential
drivers of success in school preparedness, reading
readiness, economic and employment success, and
social equity.
Ontario’s Public Libraries
As the development of the knowledge economy
progresses, public libraries are a vital link for every resident
and every community to ensure success of all
Ontarians, regardless of location or background.
YOUR Public Library
We support your goals for learning, recreation, culture and
arts, creativity, family, making, and engaging with your community.
And we love reading too.
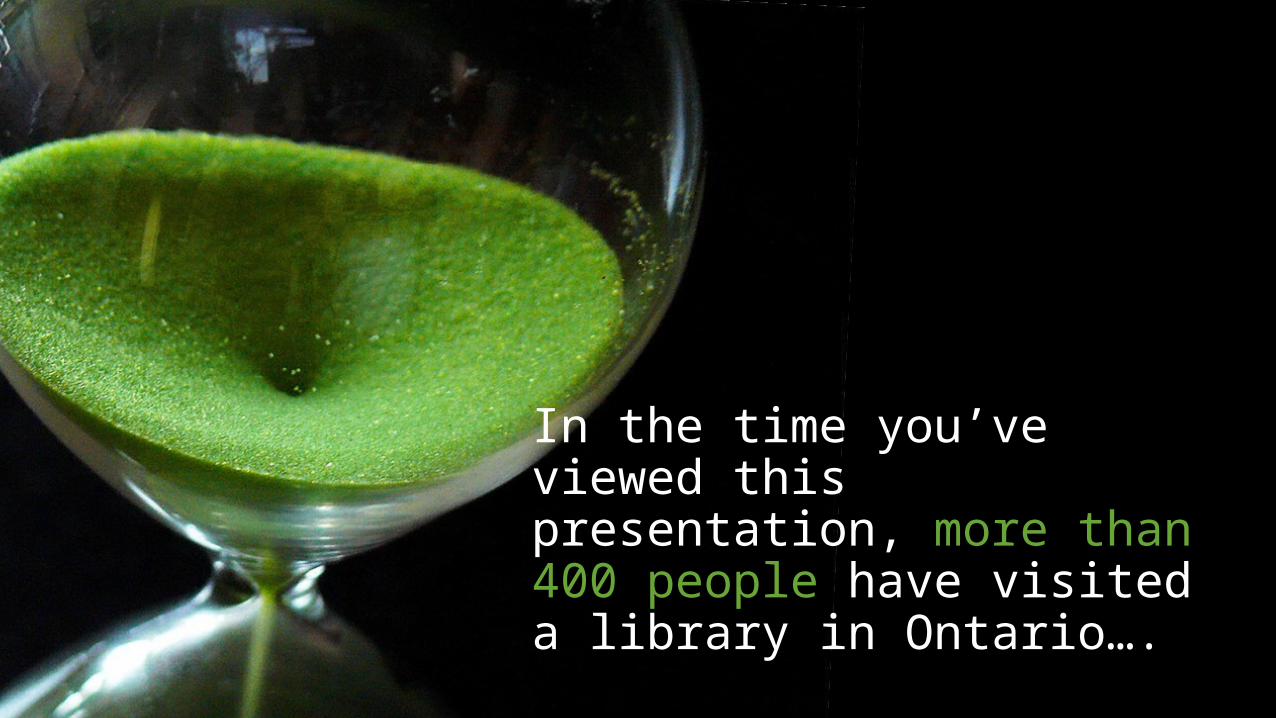
In the time you’ve viewed this presentation, more than 400 people have visited a library in Ontario….
Data Sources• http://www.mtc.gov.on.ca/en/libraries/statistics2013/Summary_and_Comparison_Report_
2013.pdf• http://www.culturalhrc.ca/announcements/2014/PR2014-09-10-e.php?gclid=CKfckba8jcgCF
YsYHwodiZgGVg• https://stats.cfldb.ca• http://www.statcan.gc.ca/pub/87f0003x/2013001/t033-eng.htm• http://www.arts.on.ca/AssetFactory.aspx?did=415• http://www.mtc.gov.on.ca/en/publications/Ontario_Major_Festivals_and_Events_Attraction
.pdf• http://www.slideshare.net/stephenabram1/market-probe-fopl-webinar-20151708animated• http://www.slideshare.net/stephenabram1/fopl-webinar-august1420154
All data is the latest publicly available and figures have been rounded
Contact: [email protected]

Image Sources
1st set of icons by Icons8 – see these and more athttps://icons8.com/download-huge-windows8-set/#/web
Otherwise all images in this presentation are free of copyrights and licensed under Creative Commons CC0 – they were sourced via Unsplash and Pixabay.

Social Media InfographicsThese can be used on any library’s web presences – Facebook, Twitter,
Tumblr, Pinterest, Instagram, and so many more.

And we have video too!Visit FOPL.ca or Stephen’s Lighthouse for Prezi, PowToon, YouTube or Sway videos and automated slide shows.


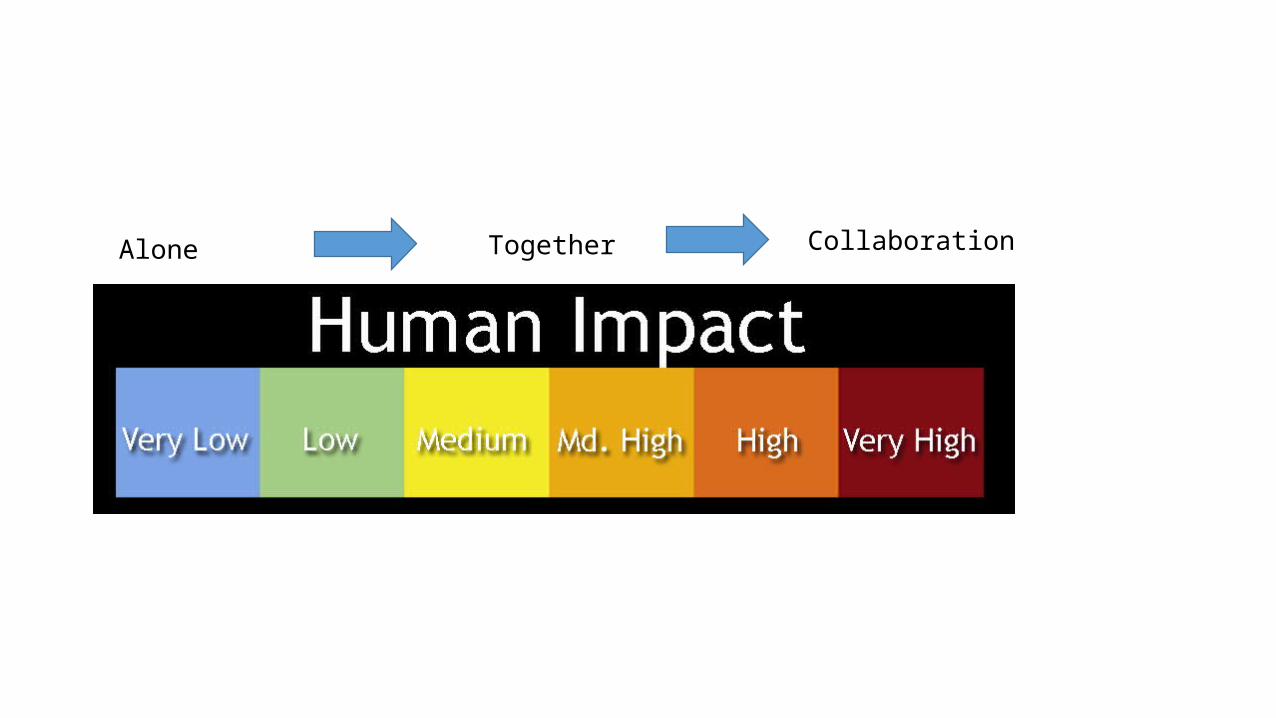
Alone Together Collaboration
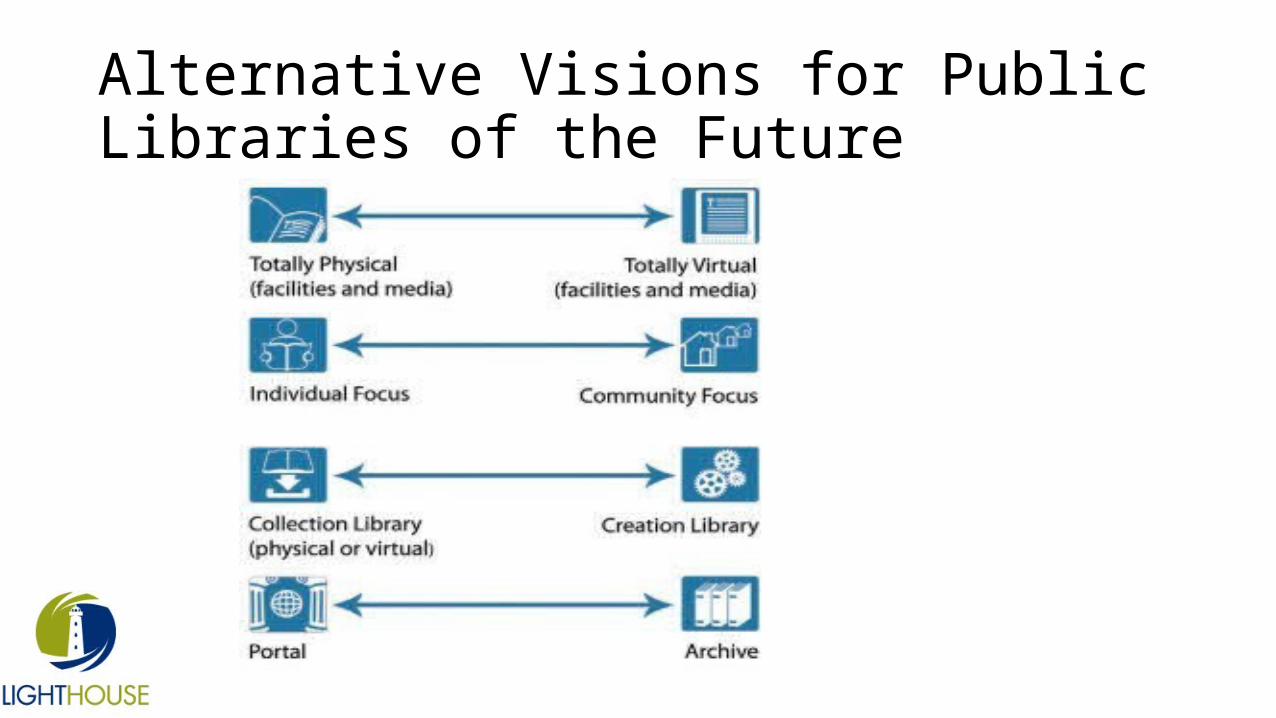
Alternative Visions for Public Libraries of the Future

SmellyYellowLiquid
OrSex
Appeal?
The Complex Value Proposition


Accept that change is an attitude

The power of answers

Don’t study things to death.

Stephen Abram, MLS, FSLAConsultant, Lighthouse Partners
CEO, Federation of Ontario Public LibrariesCel: 416-669-4855
[email protected]’s Lighthouse Blog
http://stephenslighthouse.comFacebook, Pinterest, Tumblr: Stephen Abram
LinkedIn / Plaxo: Stephen AbramTwitter: @sabram
SlideShare: StephenAbram1