old foods and new consumers in mexico, under economic reforms · old foods and new consumers in...
TRANSCRIPT
Documento de Trabajo Nº 4 Serie Estudios Rurales
Old Foods and New Consumers in Mexico, Under Economic Reforms
Antonio Yunez-Naude
Programa Cohesión Territorial para el Desarrollo
Noviembre 2013
DOCUMENTOS DE TRABAJO RIMISP
Old Foods and New Consumers in Mexico,
Under Economic Reforms
Este documento es el resultado del programa Cohesión Territorial para el Desarrollo, coordinado por Rimisp – Centro Latinoamericano para el Desarrollo Rural. Se autoriza la reproducción parcial o total y la difusión del documento sin fines de lucro y sujeta a que se cite la fuente. This document is a product of the Territorial Cohesion for Development Program, coordinated by Rimisp – Latin American Center for Rural Development. We authorize the non-for-profit partial or full reproduction and dissemination of this document, subject to the source being properly acknowledged. Cita / Citation: Yunez-Naude, A. 2013. “Old Foods and New Consumers in Mexico, Under Economic Reforms”. Documento de Trabajo N°4 Serie Estudios Rurales. Programa Cohesión Territorial para el Desarrollo. Rimisp, Santiago, Chile. Paper prepared for the Plenary Session: “The changing agrarian structure in Africa: lessons from South America”. 4th International Conference of the African Association of Agricultural Economists, Hammamet, Tunisia. I wish to acknowledge the financial support of Canada´s International Development Centre (IDRC) thorough the Latin American Centre for rural Development (RIMISP), and of the Flora and William Hewlett Foundation, as well as the support in data gathering I received from Arturo I. Cisneros and the editorial revision of Peri Fletcher.
1 Antonio Yunez-Naude Programa Cohesión Territorial para el Desarrollo Rimisp – Centro Latinoamericano para el Desarrollo Rural
La serie Documentos de Trabajo es una publicación de Rimisp – Centro Latinoamericano para el Desarrollo Rural –, que divulga trabajos de investigación, de carácter preliminar, realizados por profesionales de esta institución. Su objetivo es aportar al debate de tópicos que apoyen el desarrollo rural latinoamericano. Tanto el contenido de los Documentos de Trabajo, como también los análisis y conclusiones que de ellos se deriven, son de exclusiva responsabilidad de su(s) autor(es).
Documentos de Trabajo de Rimisp WorkingPapers of Rimisp
Chile: Huelén 10, piso 6, Providencia. Santiago, Chile · Código
Postal 7500617 · Teléfono: +56-2-22364557· Fax: +56-2-22364558 Ecuador: Pasaje Guayas E3-130 (esquina Amazonas), edificio Pastor, primer piso. Quito, Ecuador · Teléfonos: +59-3-2-2273870 · 2273991 México: Yosemite 13 Colonia Nápoles Delegación Benito Juárez, México, Distrito Federal · Tel/Fax +52-55-50966592
2 Antonio Yunez-Naude Programa Cohesión Territorial para el Desarrollo Rimisp – Centro Latinoamericano para el Desarrollo Rural
Old Foods and New Consumers in Mexico, Under Economic Reforms
Antonio Yunez-Naude
ABSTRACT
The main objective of this paper is to evaluate the performance of agricultural
and food production in Mexico during the reforms and NAFTA and the
consequences of this performance and of food trade liberalization on food
security, consumption patterns and food poverty.
The paper is divided into 6 parts. Part 2 assesses major agricultural reforms,
trade liberalization under NAFTA and their expected impacts, as well as new
policies that accompanied the reforms. In Part 3 major trends in agricultural
production and trade, farm size and yields during the last decades are
discussed. Part 4 evaluates the performance of Mexico in terms of food
consumption, food security, obesity and poverty. Part 5 utilizes these analyses
to reflect on the lessons the Mexican experience can offer to other countries at
earlier stages of developing. Part 6 provides several concluding remarks.
Keywords: Foods, New Consumers, Economic Reforms, Mexico,
Poverty, Food Security.
3 Antonio Yunez-Naude Programa Cohesión Territorial para el Desarrollo Rimisp – Centro Latinoamericano para el Desarrollo Rural
ÍNDICE
1. INTRODUCTION ............................................................................................ 1
2. ECONOMIC REFORMS ................................................................................. 2
3. TRENDS IN AGRICULTURAL PRODUCTION, TRADE, AND FARM SIZE ... 5
Production and Trade ..................................................................................... 5
Farm size production and yields ................................................................... 10
4. FOOD CONSUMPTION, DOOS SECURITY AND PROVERTY .................. 15
5. LESSONS FROM MEXICO .......................................................................... 24
6. CONCLUSIONS ........................................................................................... 28
7. REFERENCES ............................................................................................. 30
1 Antonio Yunez-Naude Programa Cohesión Territorial para el Desarrollo Rimisp – Centro Latinoamericano para el Desarrollo Rural
1. INTRODUCTION
In the 1980s, the Mexican government instituted wide-raging market-oriented
policies. With respect to the food, agriculture and rural sectors, the reforms
ranged from constitutional changes to enhance private property rights in rural
“communal” lands to the elimination of price supports granted to farmers
producing staple crops. Policy changes included agricultural trade liberalization:
in 1985 Mexico joined the General Agreement on Trade and Tariffs (GATT),
and in January 1994 the implementation of the North American Free Trade
Agreement (NAFTA) began. At the same time to these economic reforms,
transitional agricultural policies were being implemented and acomprehensive
social program to alleviate rural poverty wasinitiated.
The main objective of this paper is to evaluate the performance of agricultural
and food production in Mexico during the reforms and NAFTA and the
consequences of this performance and of food trade liberalization on food
security, consumption patterns and food poverty.
The paper is divided into 6 parts. Part 2 assesses major agricultural reforms,
trade liberalization under NAFTA and their expected impacts, as well as new
policies that accompanied the reforms. In Part 3 major trends in agricultural
production and trade, farm size and yields during the last decades are
discussed. Part 4 evaluates the performance of Mexico in terms of food
consumption, food security, obesity and poverty. Part 5 utilizes these analyses
to reflect on the lessons the Mexican experience can offer to other countries at
earlier stages of developing. Part 6 provides several concluding remarks.
2 Antonio Yunez-Naude Programa Cohesión Territorial para el Desarrollo Rimisp – Centro Latinoamericano para el Desarrollo Rural
2. ECONOMIC REFORMS
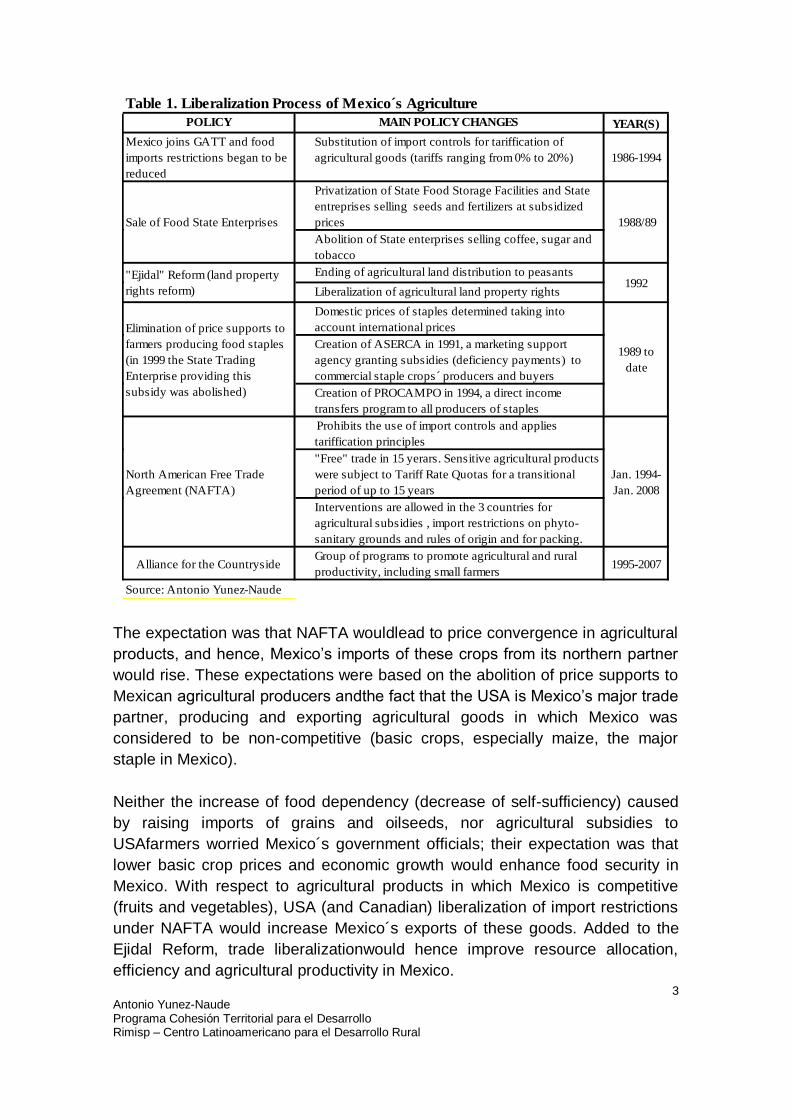
In Mexico, economic policy reforms began in the early 1980s. Its agricultural
sector was included in the policy reforms in the late 1980s. Agricultural reforms
deepened during the first half of the 1990s in order to prepare the sector for the
North American Free Trade Agreement (NAFTA) with Canada and the United
States of America (USA). This agreement began to be implemented in January
1991. In the mid-1980s, government support prices to farmers producing what
we call basic crops (barley, beans, maize, rice, sorghum, wheat, and oilseeds)
were abolished, as well as subsidies for agricultural inputs and for credit. In
addition, the banking system was re-privatised, public infrastructure to support
the marketing of basic crops was sold or abolished and the Constitutional Article
related to land property rights was reformed (Table 1; see also Yunez-Naude,
2003). In addition to these economic reforms, a land or ejidalreform was
initiated to promote individual property rights to ejidatarios (those peasants who
benefited from the process of rural land distribution and re-distribution
implemented after the Mexican Revolution of 1910 from the 1930s to1991).
3 Antonio Yunez-Naude Programa Cohesión Territorial para el Desarrollo Rimisp – Centro Latinoamericano para el Desarrollo Rural
POLICY MAIN POLICY CHANGES YEAR(S)
Mexico joins GATT and food
imports restrictions began to be
reduced
Substitution of import controls for tariffication of
agricultural goods (tariffs ranging from 0% to 20%) 1986-1994
Privatization of State Food Storage Facilities and State
entreprises selling seeds and fertilizers at subsidized
prices
Abolition of State enterprises selling coffee, sugar and
tobacco
Ending of agricultural land distribution to peasants
Liberalization of agricultural land property rights
Domestic prices of staples determined taking into
account international prices
Creation of ASERCA in 1991, a marketing support
agency granting subsidies (deficiency payments) to
commercial staple crops´ producers and buyers
Creation of PROCAMPO in 1994, a direct income
transfers program to all producers of staples
Prohibits the use of import controls and applies
tariffication principles
"Free" trade in 15 yerars. Sensitive agricultural products
were subject to Tariff Rate Quotas for a transitional
period of up to 15 years
Interventions are allowed in the 3 countries for
agricultural subsidies , import restrictions on phyto-
sanitary grounds and rules of origin and for packing.
Alliance for the CountrysideGroup of programs to promote agricultural and rural
productivity, including small farmers1995-2007
Source: Antonio Yunez-Naude
North American Free Trade
Agreement (NAFTA)
Jan. 1994-
Jan. 2008
Table 1. Liberalization Process of Mexico´s Agriculture
Sale of Food State Enterprises 1988/89
"Ejidal" Reform (land property
rights reform)1992
Elimination of price supports to
farmers producing food staples
(in 1999 the State Trading
Enterprise providing this
subsidy was abolished)
1989 to
date
The expectation was that NAFTA wouldlead to price convergence in agricultural
products, and hence, Mexico’s imports of these crops from its northern partner
would rise. These expectations were based on the abolition of price supports to
Mexican agricultural producers andthe fact that the USA is Mexico’s major trade
partner, producing and exporting agricultural goods in which Mexico was
considered to be non-competitive (basic crops, especially maize, the major
staple in Mexico).
Neither the increase of food dependency (decrease of self-sufficiency) caused
by raising imports of grains and oilseeds, nor agricultural subsidies to
USAfarmers worried Mexico´s government officials; their expectation was that
lower basic crop prices and economic growth would enhance food security in
Mexico. With respect to agricultural products in which Mexico is competitive
(fruits and vegetables), USA (and Canadian) liberalization of import restrictions
under NAFTA would increase Mexico´s exports of these goods. Added to the
Ejidal Reform, trade liberalizationwould hence improve resource allocation,
efficiency and agricultural productivity in Mexico.
4 Antonio Yunez-Naude Programa Cohesión Territorial para el Desarrollo Rimisp – Centro Latinoamericano para el Desarrollo Rural
The general official expectation was, hence, that with economic
liberalizationand reforms in the rural sector, the average size of agricultural
plots would increase, as well as agricultural productivity, access to private
credit, and investment. Food security would be ensured fromcheap imports and
from income growth of Mexicans.
Along with economic liberalization, domestic ‘transitional’ policies were
implemented with the creation of Support Services for Agricultural Marketing
(ASERCA is its Spanish acronym), a government institution that provides
subsidies to commercial producers and buyers of basic crops, and through
Procampo´s direct income transfers to practically all farmers producing these
crops before NAFTA began to be implemented (Procampo is hence a
decoupled program of pure income transfers). “Alliance for the Countryside”
was the third major program the Mexican government implemented from 1995
to 2007. It consisted of government supports to enhance rural productivity
(Table 1).
In addition, the State created specific public policies and institutions aimed at
reducing rural poverty—and, implicitly, increasing food access to the poor. In
the early 1990 the Ministry for Social Development was created and in 1997 a
program for Rural Education, Health and Nutrition (now called Oportunidades)
began to be implemented. Oportunidades is a worldwide known conditional
cash-transfer program aimed at reducing extreme income poverty, raising
health standards of the poor and promoting human capital formation.
In 2002 the Law for the Sustainable Development for the Rural Sector (LDRS,
Spanish acronym) was created. Amongst other purposes, this Law includes the
promotion of food security in Mexico, translated in practice by increasing public
expenditure in the rural sector. However, it was not until 2005/6 that food
security purposes began its implementation in a more concrete manner by the
strategy called Special Program for Food Security (PESA, Spanish acronym).
5 Antonio Yunez-Naude Programa Cohesión Territorial para el Desarrollo Rimisp – Centro Latinoamericano para el Desarrollo Rural
3. TRENDS IN AGRICULTURAL PRODUCTION, TRADE, AND
FARM SIZE
This section evaluatesMexico’s performance during the reforms and NAFTA by
reviewing the trends in agricultural production, food trade, food consumption
and expenditure and poverty.
Production and Trade
Since the 1980s, the performance of agriculture production has been modest.
Processed food and beverage production has performed better, mainly due to
the rise of beer production during this period (Table 2).
Field crop production has remained the major component of agricultural Gross
Domestic Product (GDP) since the 1980s, followed by livestock, fisheries and
forestry: in late 2000 field crop production accounted for 62% of agricultural
GDP, livestock for 30% and fisheries and hunting for the remaining 8%. Maize
continues to be the major single crop produced in Mexico.Taking into account
the expected impacts of reforms and NAFTA, it is surprising that the production
of maize has continuously increased. In addition to maize –but to a lower
extent–, other grains remain as major crops produced in Mexico (the exception
is rice), whereas the oilseed share of fieldcrop’s production has decreased
sharply. Fresh fruits and vegetables have experienced ups and downs during
the studied periods; however their share of fieldcrop production has remained
between 20 percent and 17 percent for fruits and between 12 percent and 14
percent for vegetables. The volumes of production of major meats and live
animals have experienced positive rates of growth during the reforms and
NAFTA. However, poultry is the only component that experienced noticeably
high rates of growth during the period (details in Yunez-Naude(2013).
6 Antonio Yunez-Naude Programa Cohesión Territorial para el Desarrollo Rimisp – Centro Latinoamericano para el Desarrollo Rural
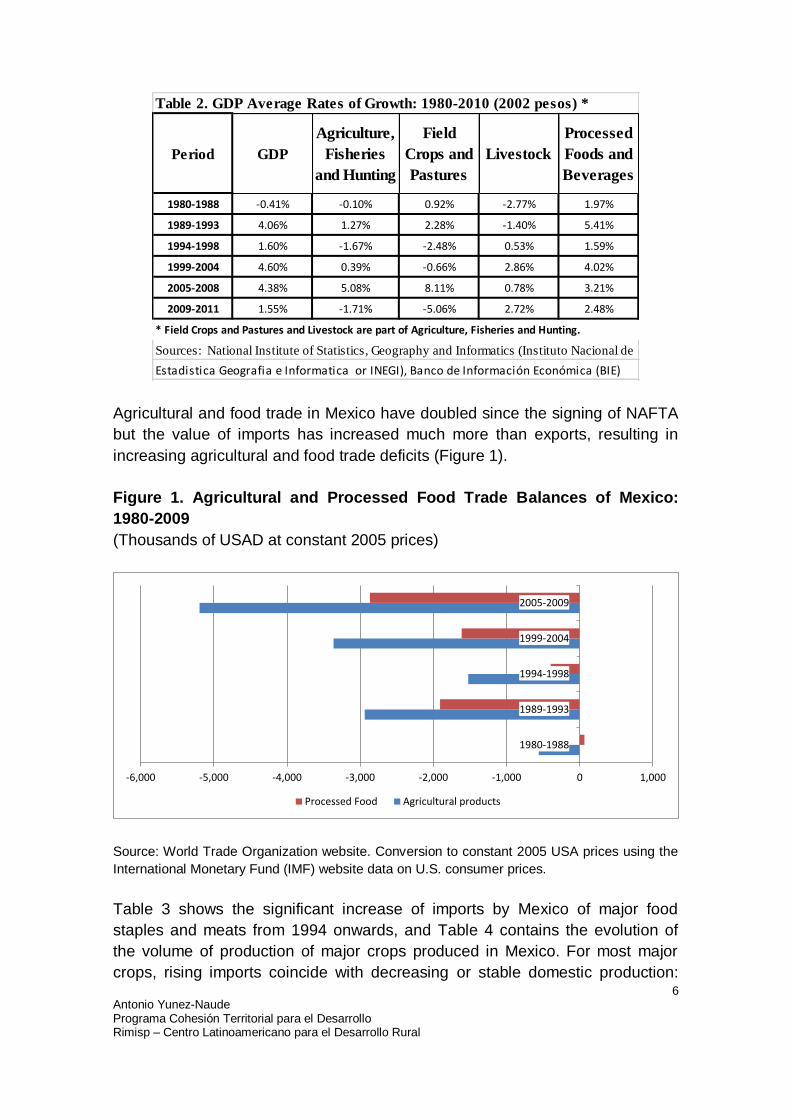
Table 2. GDP Average Rates of Growth: 1980-2010 (2002 pesos) *
Period GDP
Agriculture,
Fisheries
and Hunting
Field
Crops and
Pastures
Livestock
Processed
Foods and
Beverages
1980-1988 -0.41% -0.10% 0.92% -2.77% 1.97%
1989-1993 4.06% 1.27% 2.28% -1.40% 5.41%
1994-1998 1.60% -1.67% -2.48% 0.53% 1.59%
1999-2004 4.60% 0.39% -0.66% 2.86% 4.02%
2005-2008 4.38% 5.08% 8.11% 0.78% 3.21%
2009-2011 1.55% -1.71% -5.06% 2.72% 2.48%
* Field Crops and Pastures and Livestock are part of Agriculture, Fisheries and Hunting.
Sources: National Institute of Statistics, Geography and Informatics (Instituto Nacional de
Estadistica Geografia e Informatica or INEGI), Banco de Información Económica (BIE)
Agricultural and food trade in Mexico have doubled since the signing of NAFTA
but the value of imports has increased much more than exports, resulting in
increasing agricultural and food trade deficits (Figure 1).
Figure 1. Agricultural and Processed Food Trade Balances of Mexico:
1980-2009
(Thousands of USAD at constant 2005 prices)
-6,000 -5,000 -4,000 -3,000 -2,000 -1,000 0 1,000
1980-1988
1989-1993
1994-1998
1999-2004
2005-2009
Processed Food Agricultural products
Source: World Trade Organization website. Conversion to constant 2005 USA prices using the
International Monetary Fund (IMF) website data on U.S. consumer prices.
Table 3 shows the significant increase of imports by Mexico of major food
staples and meats from 1994 onwards, and Table 4 contains the evolution of
the volume of production of major crops produced in Mexico. For most major
crops, rising imports coincide with decreasing or stable domestic production:
7 Antonio Yunez-Naude Programa Cohesión Territorial para el Desarrollo Rimisp – Centro Latinoamericano para el Desarrollo Rural
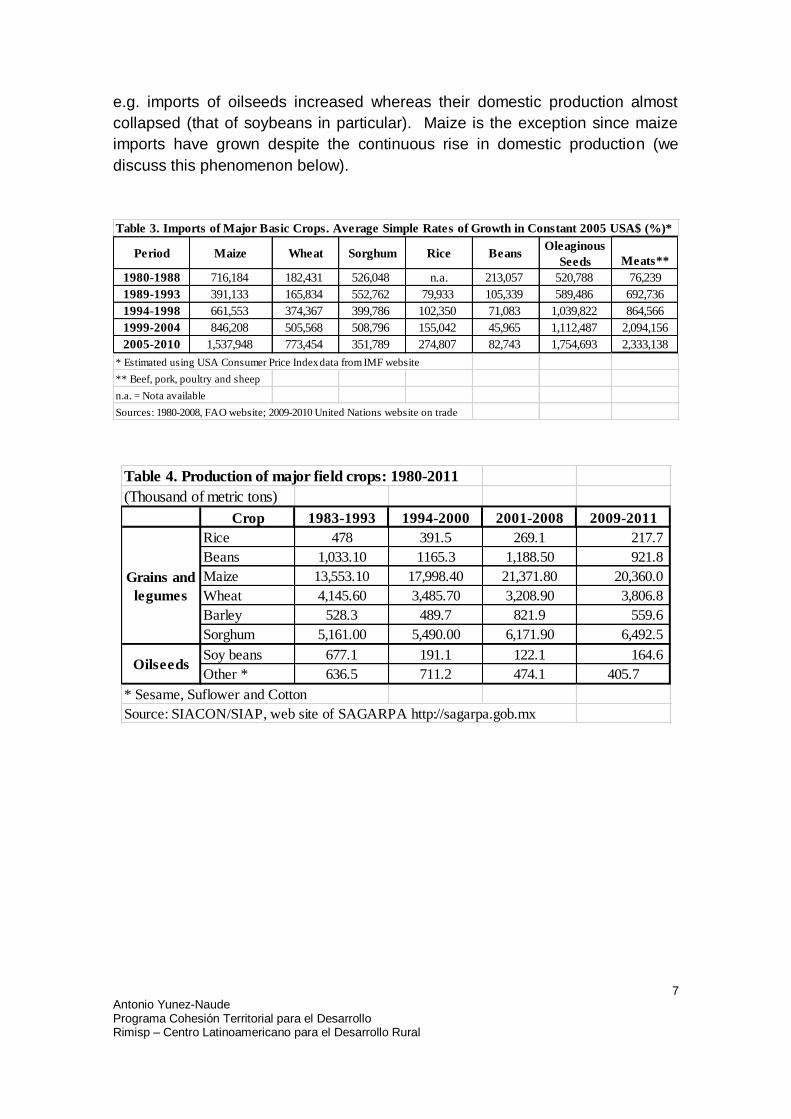
e.g. imports of oilseeds increased whereas their domestic production almost
collapsed (that of soybeans in particular). Maize is the exception since maize
imports have grown despite the continuous rise in domestic production (we
discuss this phenomenon below).
Table 3. Imports of Major Basic Crops. Average Simple Rates of Growth in Constant 2005 USA$ (%)*
Period Maize Wheat Sorghum Rice BeansOleaginous
Seeds Meats**
1980-1988 716,184 182,431 526,048 n.a. 213,057 520,788 76,239
1989-1993 391,133 165,834 552,762 79,933 105,339 589,486 692,736
1994-1998 661,553 374,367 399,786 102,350 71,083 1,039,822 864,566
1999-2004 846,208 505,568 508,796 155,042 45,965 1,112,487 2,094,156
2005-2010 1,537,948 773,454 351,789 274,807 82,743 1,754,693 2,333,138
* Estimated using USA Consumer Price Index data from IMF website
** Beef, pork, poultry and sheep
n.a. = Nota available
Sources: 1980-2008, FAO website; 2009-2010 United Nations website on trade
Table 4. Production of major field crops: 1980-2011
(Thousand of metric tons)
Crop 1983-1993 1994-2000 2001-2008 2009-2011
Rice 478 391.5 269.1 217.7
Beans 1,033.10 1165.3 1,188.50 921.8
Maize 13,553.10 17,998.40 21,371.80 20,360.0
Wheat 4,145.60 3,485.70 3,208.90 3,806.8
Barley 528.3 489.7 821.9 559.6
Sorghum 5,161.00 5,490.00 6,171.90 6,492.5
Soy beans 677.1 191.1 122.1 164.6
Other * 636.5 711.2 474.1 405.7
* Sesame, Suflower and Cotton
Source: SIACON/SIAP, web site of SAGARPA http://sagarpa.gob.mx
Grains and
legumes
Oilseeds
8 Antonio Yunez-Naude Programa Cohesión Territorial para el Desarrollo Rimisp – Centro Latinoamericano para el Desarrollo Rural
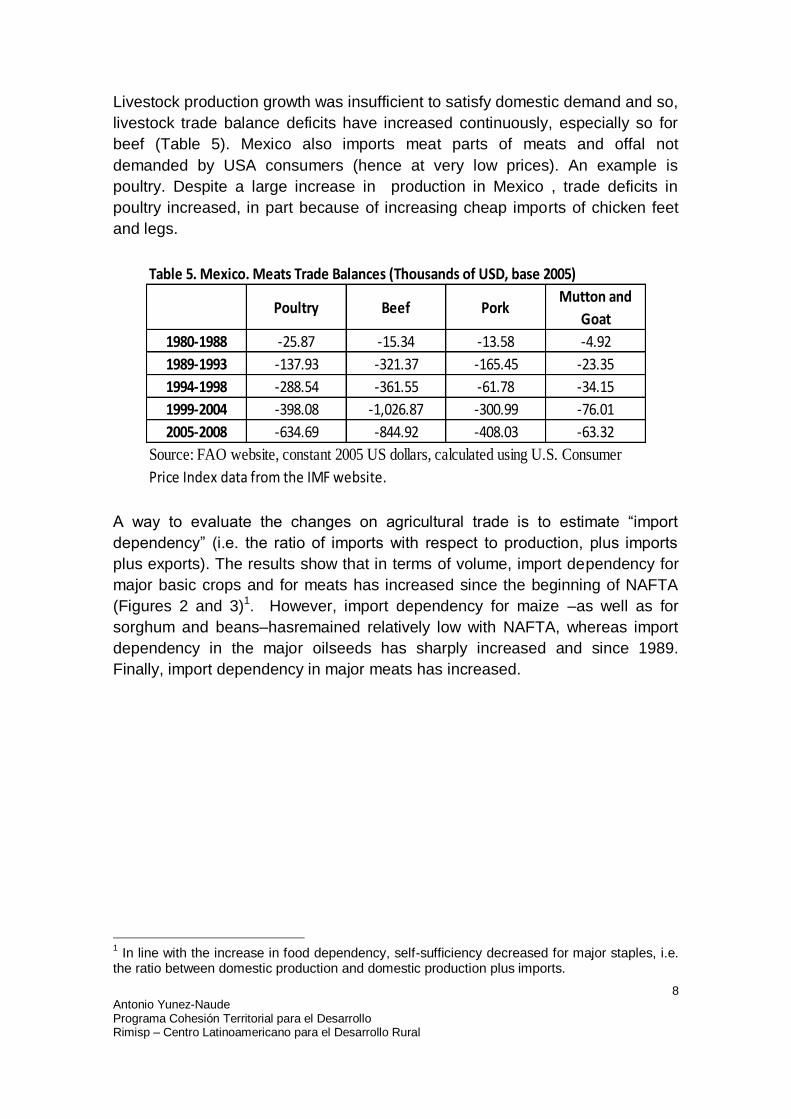
Livestock production growth was insufficient to satisfy domestic demand and so,
livestock trade balance deficits have increased continuously, especially so for
beef (Table 5). Mexico also imports meat parts of meats and offal not
demanded by USA consumers (hence at very low prices). An example is
poultry. Despite a large increase in production in Mexico , trade deficits in
poultry increased, in part because of increasing cheap imports of chicken feet
and legs.
Table 5. Mexico. Meats Trade Balances (Thousands of USD, base 2005)
Poultry Beef PorkMutton and
Goat
1980-1988 -25.87 -15.34 -13.58 -4.92
1989-1993 -137.93 -321.37 -165.45 -23.35
1994-1998 -288.54 -361.55 -61.78 -34.15
1999-2004 -398.08 -1,026.87 -300.99 -76.01
2005-2008 -634.69 -844.92 -408.03 -63.32
Source: FAO website, constant 2005 US dollars, calculated using U.S. Consumer
Price Index data from the IMF website.
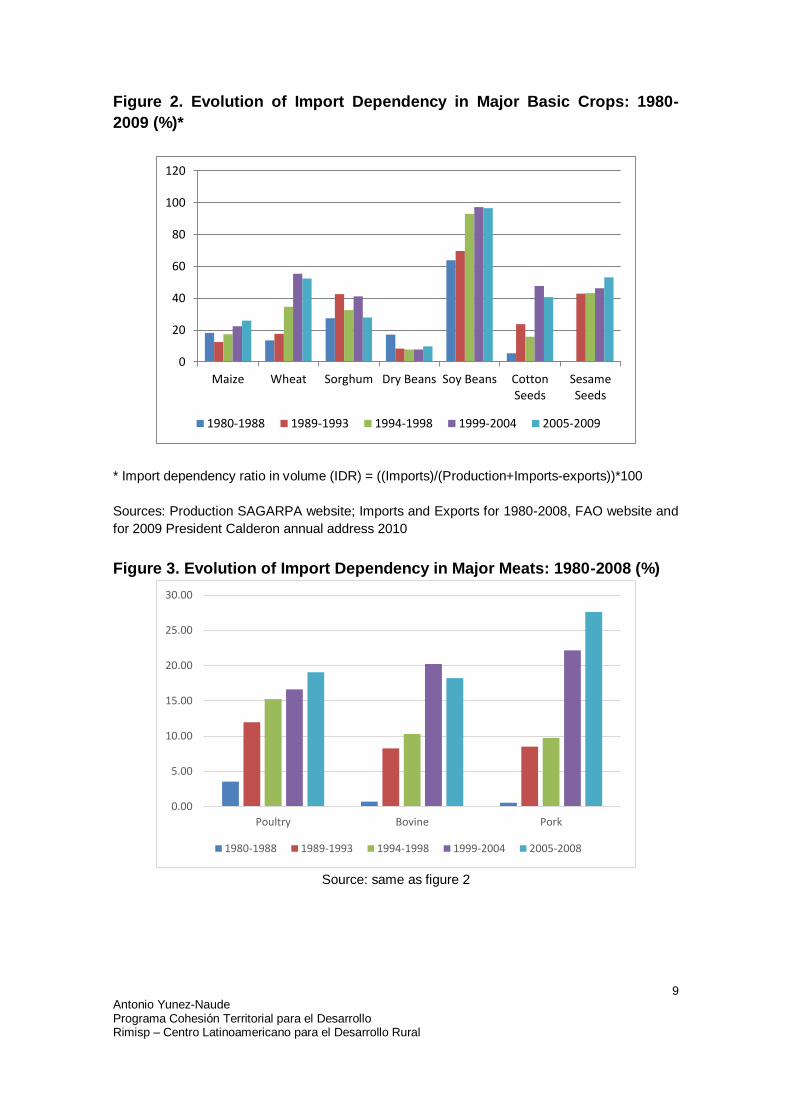
A way to evaluate the changes on agricultural trade is to estimate “import
dependency” (i.e. the ratio of imports with respect to production, plus imports
plus exports). The results show that in terms of volume, import dependency for
major basic crops and for meats has increased since the beginning of NAFTA
(Figures 2 and 3)1. However, import dependency for maize –as well as for
sorghum and beans–hasremained relatively low with NAFTA, whereas import
dependency in the major oilseeds has sharply increased and since 1989.
Finally, import dependency in major meats has increased.
1 In line with the increase in food dependency, self-sufficiency decreased for major staples, i.e.
the ratio between domestic production and domestic production plus imports.
9 Antonio Yunez-Naude Programa Cohesión Territorial para el Desarrollo Rimisp – Centro Latinoamericano para el Desarrollo Rural
Figure 2. Evolution of Import Dependency in Major Basic Crops: 1980-
2009 (%)*
0
20
40
60
80
100
120
Maize Wheat Sorghum Dry Beans Soy Beans CottonSeeds
SesameSeeds
1980-1988 1989-1993 1994-1998 1999-2004 2005-2009
* Import dependency ratio in volume (IDR) = ((Imports)/(Production+Imports-exports))*100
Sources: Production SAGARPA website; Imports and Exports for 1980-2008, FAO website and
for 2009 President Calderon annual address 2010
Figure 3. Evolution of Import Dependency in Major Meats: 1980-2008 (%)
0.00
5.00
10.00
15.00
20.00
25.00
30.00
Poultry Bovine Pork
1980-1988 1989-1993 1994-1998 1999-2004 2005-2008
Source: same as figure 2
10 Antonio Yunez-Naude Programa Cohesión Territorial para el Desarrollo Rimisp – Centro Latinoamericano para el Desarrollo Rural
Farm size production and yields
Data from the Agricultural Censuses of 1991 and 2007 (AGC) provide
information to describe the structure and evolution of agriculture by the sizes of
“farms” (“agricultural production units” in INEGI’s terms).2
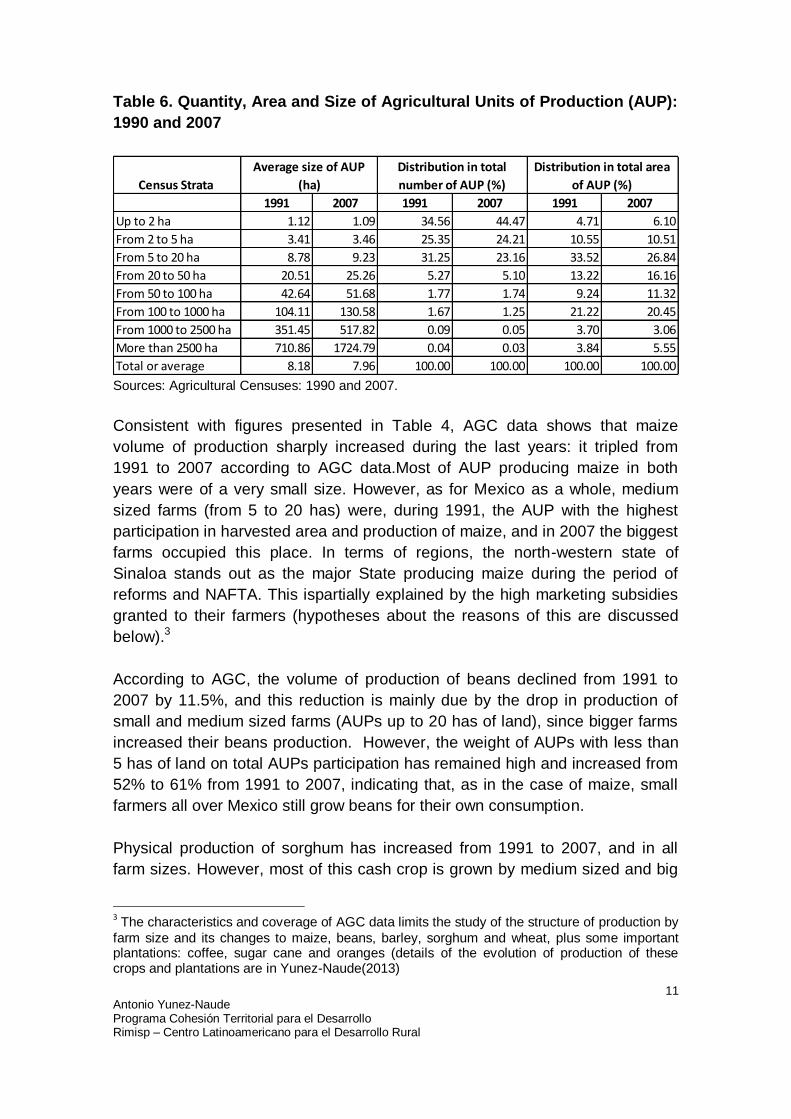
From 1991 to 2007 the number of agricultural units of production (AUP)
decreased by 1.2 percent. Given that the area covered by these AUP
experienced a greater reduction (-3.9%), the average size of Mexico´s AUP
declined from 8.18 to 7.96 hectares during the period. Average farm size
decreased slightly for plots of less than 2 hectares, remained practically
unchanged for plots between 2 and 5 hectares, and increased for the remaining
plots (first two columns of Table 6).
Table 6 also indicates the level of heterogeneity in Mexico´s agrarian structure.
For example, the number of small AUP (up to 5 hectares of land) accounted for
almost 60 percent of total AUP in 1991 and for 68 percent of total AUP in 2007,
but represent less than 16 percent of total area in both years. By contrast, large
AUP (more than 50 hectares) constitute just over 3 percent of total AUP, but
cover around 40 percent of total hectares.
To the above findings, there is evidence that the average size of ejidal plots
decreased from 8.5 to 7.5 from 1991 to 2007 (Robles, 2010). Thus, contrary to
expectations about the effects of economic liberalization and the Land/Ejidal
Reform, fragmentation has increased: the number of minifundia (small
landholdings) has not decreased and private property rights of former ejidal
lands for agricultural production have not increased. (Garfias, 2010).
2 Agricultural Units of Production are the set of land holdings with or without agricultural or
forestry production in rural areas or with agricultural and forestry production in urban areas, which are located in the same county or municipality, and under the same administration.
11 Antonio Yunez-Naude Programa Cohesión Territorial para el Desarrollo Rimisp – Centro Latinoamericano para el Desarrollo Rural
Table 6. Quantity, Area and Size of Agricultural Units of Production (AUP):
1990 and 2007
Census Strata
1991 2007 1991 2007 1991 2007
Up to 2 ha 1.12 1.09 34.56 44.47 4.71 6.10
From 2 to 5 ha 3.41 3.46 25.35 24.21 10.55 10.51
From 5 to 20 ha 8.78 9.23 31.25 23.16 33.52 26.84
From 20 to 50 ha 20.51 25.26 5.27 5.10 13.22 16.16
From 50 to 100 ha 42.64 51.68 1.77 1.74 9.24 11.32
From 100 to 1000 ha 104.11 130.58 1.67 1.25 21.22 20.45
From 1000 to 2500 ha 351.45 517.82 0.09 0.05 3.70 3.06
More than 2500 ha 710.86 1724.79 0.04 0.03 3.84 5.55
Total or average 8.18 7.96 100.00 100.00 100.00 100.00
Average size of AUP
(ha)
Distribution in total
number of AUP (%)
Distribution in total area
of AUP (%)
Sources: Agricultural Censuses: 1990 and 2007.
Consistent with figures presented in Table 4, AGC data shows that maize
volume of production sharply increased during the last years: it tripled from
1991 to 2007 according to AGC data.Most of AUP producing maize in both
years were of a very small size. However, as for Mexico as a whole, medium
sized farms (from 5 to 20 has) were, during 1991, the AUP with the highest
participation in harvested area and production of maize, and in 2007 the biggest
farms occupied this place. In terms of regions, the north-western state of
Sinaloa stands out as the major State producing maize during the period of
reforms and NAFTA. This ispartially explained by the high marketing subsidies
granted to their farmers (hypotheses about the reasons of this are discussed
below).3
According to AGC, the volume of production of beans declined from 1991 to
2007 by 11.5%, and this reduction is mainly due by the drop in production of
small and medium sized farms (AUPs up to 20 has of land), since bigger farms
increased their beans production. However, the weight of AUPs with less than
5 has of land on total AUPs participation has remained high and increased from
52% to 61% from 1991 to 2007, indicating that, as in the case of maize, small
farmers all over Mexico still grow beans for their own consumption.
Physical production of sorghum has increased from 1991 to 2007, and in all
farm sizes. However, most of this cash crop is grown by medium sized and big
3 The characteristics and coverage of AGC data limits the study of the structure of production by
farm size and its changes to maize, beans, barley, sorghum and wheat, plus some important plantations: coffee, sugar cane and oranges (details of the evolution of production of these crops and plantations are in Yunez-Naude(2013)
12 Antonio Yunez-Naude Programa Cohesión Territorial para el Desarrollo Rimisp – Centro Latinoamericano para el Desarrollo Rural
farmers, and the weight of the latter on total sorghum production sharply
increased during the period (we suspect that part of this change is explained by
commercialization subsidies granted to big farmers, especially in the
northeastern state of Tamaulipas, see below).
From 1991 to 2007 the volume of production of barley almost doubled, and this
increase is explained by the rise of its production amongst all farm sizes. The
dynamics of barley production in Mexico during the last decades could be
largely explained by the boom in Mexico’s production (and exports) of beer.
According to AGC data, the volume of production of wheat slightly increased
from 1991 to 2007 (4%). Almost all of its production comes from medium and
bigger farmers. However, the weight on total volume of wheat production of
medium sized farms (from 5 to 20 has) declined during the period (from 33% to
19%), whereas the contribution of bigger farms increased from 55% to 75%.
These changes are based on the decline of wheat production in medium-size
farms (-46%) and the rise of production in bigger ones (41%); most of the later
located in the northern state of Sonora. As for maize and sorghum, the
increase in the production of wheat by bigger farmers in the north could be
partially explained by government subsidies granted to them, particularly so for
those located in northern Mexico (Sumner and Balagtas, 2007).
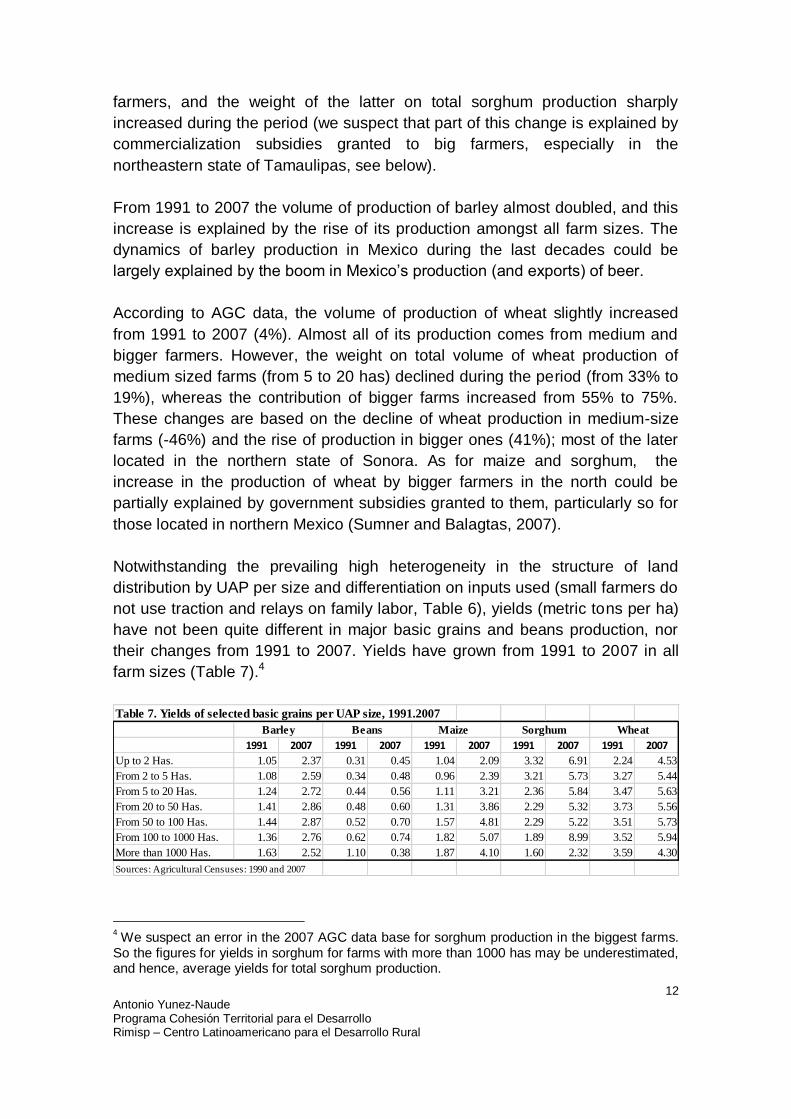
Notwithstanding the prevailing high heterogeneity in the structure of land
distribution by UAP per size and differentiation on inputs used (small farmers do
not use traction and relays on family labor, Table 6), yields (metric tons per ha)
have not been quite different in major basic grains and beans production, nor
their changes from 1991 to 2007. Yields have grown from 1991 to 2007 in all
farm sizes (Table 7).4
Table 7. Yields of selected basic grains per UAP size, 1991.2007
1991 2007 1991 2007 1991 2007 1991 2007 1991 2007
Up to 2 Has. 1.05 2.37 0.31 0.45 1.04 2.09 3.32 6.91 2.24 4.53
From 2 to 5 Has. 1.08 2.59 0.34 0.48 0.96 2.39 3.21 5.73 3.27 5.44
From 5 to 20 Has. 1.24 2.72 0.44 0.56 1.11 3.21 2.36 5.84 3.47 5.63
From 20 to 50 Has. 1.41 2.86 0.48 0.60 1.31 3.86 2.29 5.32 3.73 5.56
From 50 to 100 Has. 1.44 2.87 0.52 0.70 1.57 4.81 2.29 5.22 3.51 5.73
From 100 to 1000 Has. 1.36 2.76 0.62 0.74 1.82 5.07 1.89 8.99 3.52 5.94
More than 1000 Has. 1.63 2.52 1.10 0.38 1.87 4.10 1.60 2.32 3.59 4.30
Sources: Agricultural Censuses: 1990 and 2007
Barley Beans Maize Sorghum Wheat
4 We suspect an error in the 2007 AGC data base for sorghum production in the biggest farms.
So the figures for yields in sorghum for farms with more than 1000 has may be underestimated, and hence, average yields for total sorghum production.
13 Antonio Yunez-Naude Programa Cohesión Territorial para el Desarrollo Rimisp – Centro Latinoamericano para el Desarrollo Rural
Like beans and basic grains, coffee, sugar cane and oranges are produced in
all farm sizes and for the market in some specific regions of Mexico.5 The study
of the evolution of these three plantations from 1991 to 2007shows that
production and yields in small and medium-sized plots have increased from
1991 to 2007 (Ibid.).
To understand the evolution of agricultural production in Mexico during the last
30 years one must consider the heterogeneity of agricultural production in
combination with the structure of markets and policy interventions.
Based on this framework, and on the character of the evolution of the
agriculture of Mexico and agricultural policies I propose two general
hypotheses. 1) Domestic reforms and NAFTA directly affected commercial
farmers producing non-competitive crops, but some of them were protected
from USA competition by governmental supports; and 2) small-sized producers
have maintained or even increased their production of food staples (maize in
particular) because of the nature of their decision-making, which is explained
by the transaction costs they face.
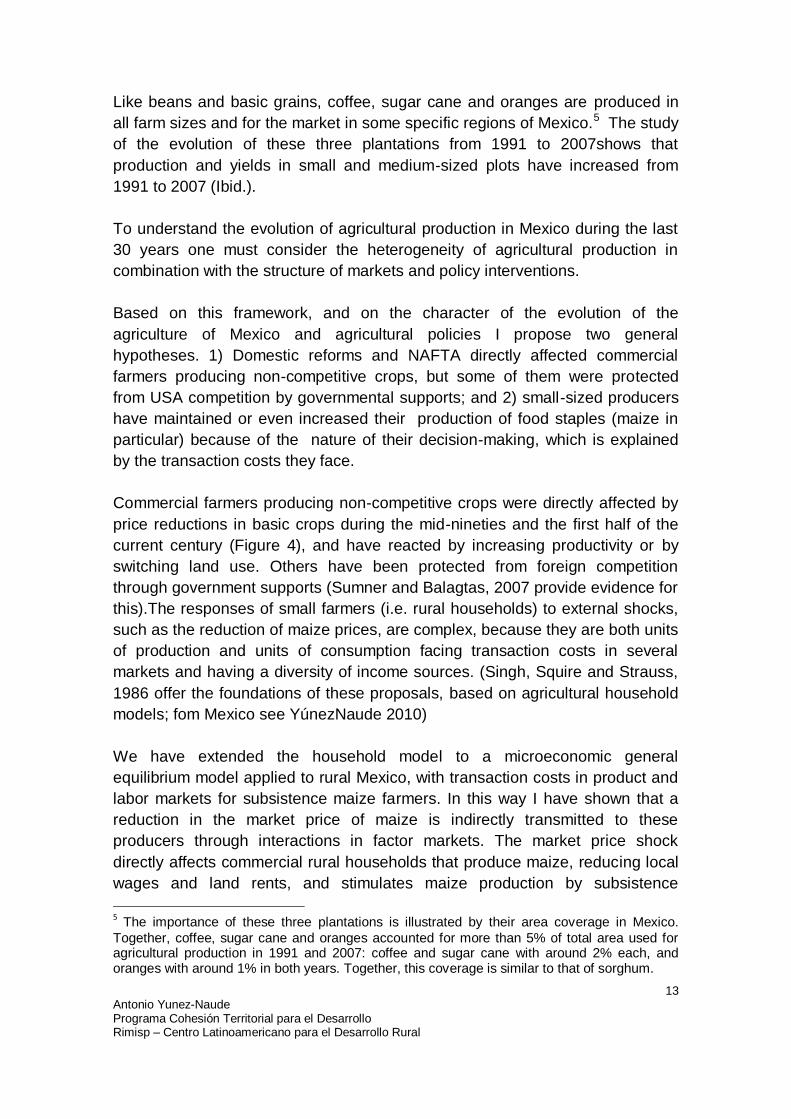
Commercial farmers producing non-competitive crops were directly affected by
price reductions in basic crops during the mid-nineties and the first half of the
current century (Figure 4), and have reacted by increasing productivity or by
switching land use. Others have been protected from foreign competition
through government supports (Sumner and Balagtas, 2007 provide evidence for
this).The responses of small farmers (i.e. rural households) to external shocks,
such as the reduction of maize prices, are complex, because they are both units
of production and units of consumption facing transaction costs in several
markets and having a diversity of income sources. (Singh, Squire and Strauss,
1986 offer the foundations of these proposals, based on agricultural household
models; fom Mexico see YúnezNaude 2010)
We have extended the household model to a microeconomic general
equilibrium model applied to rural Mexico, with transaction costs in product and
labor markets for subsistence maize farmers. In this way I have shown that a
reduction in the market price of maize is indirectly transmitted to these
producers through interactions in factor markets. The market price shock
directly affects commercial rural households that produce maize, reducing local
wages and land rents, and stimulates maize production by subsistence
5 The importance of these three plantations is illustrated by their area coverage in Mexico.
Together, coffee, sugar cane and oranges accounted for more than 5% of total area used for agricultural production in 1991 and 2007: coffee and sugar cane with around 2% each, and oranges with around 1% in both years. Together, this coverage is similar to that of sorghum.
14 Antonio Yunez-Naude Programa Cohesión Territorial para el Desarrollo Rimisp – Centro Latinoamericano para el Desarrollo Rural
households. We propose that this reaction by subsistence farmers to the
observed reduction of maize market prices explains why small-scale maize
production in Mexico has not declined (see, for example, Dyer, Taylor and
Yunez-Naude (2005), Dyer, Boucher and Taylor (2006), and below).
Figure 4. Mexico. Producers' Price of Selected Grains (base 2002=100).
0
1,000
2,000
3,000
4,000
5,000
6,000
19
80
19
82
19
84
19
86
19
88
19
90
19
92
19
94
19
96
19
98
20
00
20
02
20
04
20
06
20
08
Barley
Maize
Sorghum
Wheat
Source: SAGARPA-SIACON website, deflated using Bank of Mexico consumer price index.
The results of Sumner and Balagtas and of Taylor and associates, together with
the tendencies described above on production and yields by small farmers,
allow us to propose the following assertions: Notwithstanding economic reforms
and trade liberalization, production of maize by small farmers has prevailed in
Mexico. Furthermore, small farms production of competitive cash agricultural
goods –such as sugar cane and oranges—is viable. Finally, these indications
show that medium sized farmers have been capable to face the challenges of
reforms and trade liberalization.
15 Antonio Yunez-Naude Programa Cohesión Territorial para el Desarrollo Rimisp – Centro Latinoamericano para el Desarrollo Rural
4. FOOD CONSUMPTION, DOOS SECURITY AND PROVERTY
The United Nations’ Food and Agriculture Organization (FAO) considers that
food security exists when all people, at all times, have physical and economic
access to sufficient safe and nutritious food to meet their dietary needs and food
preferences for a healthy and active life. Food security has four dimensions:
availability, access, utilization and stability. No data exist to evaluate the trends
of these four dimensions in Mexico. However, there is data on consumption and
expenditure on foods.
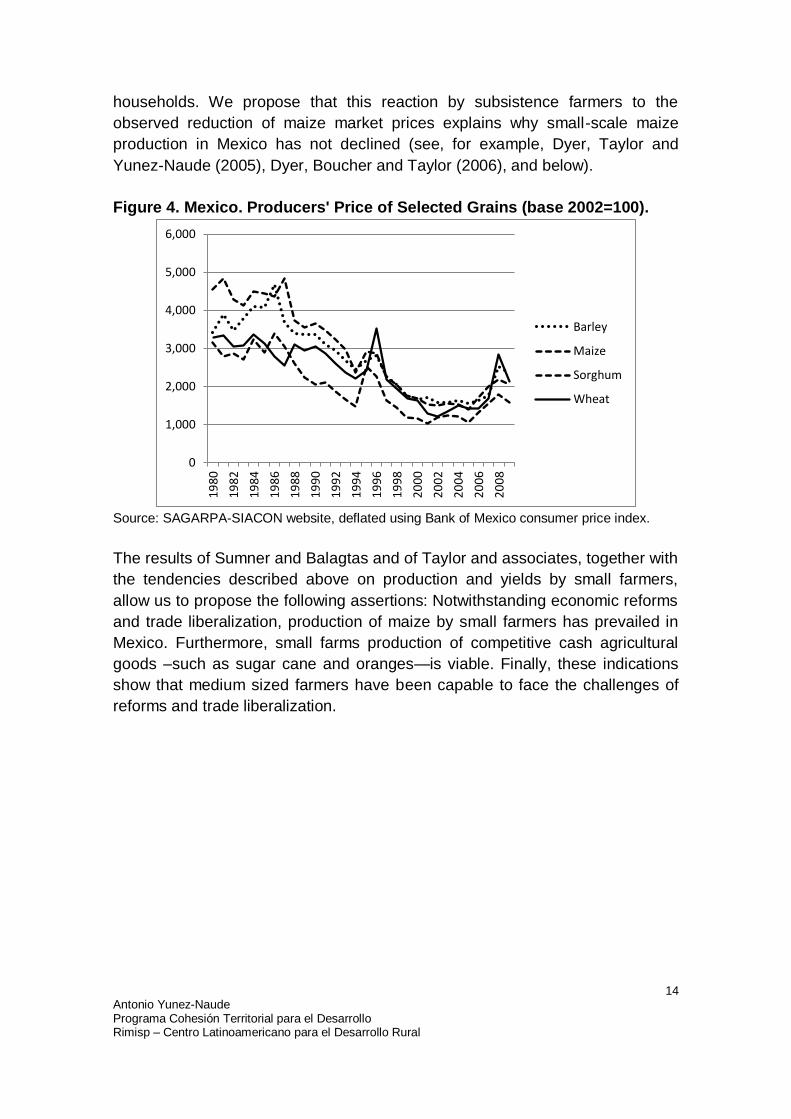
Trends in per capita consumption of food staples in Mexico indicate that, in
general, food security has not worsened during NAFTA. In particular, available
official data indicate that per capita consumption of maize, soy beans, and of all
major meats has increased during NAFTA (per capita consumption of wheat
experienced no major change, Table 8). In terms of domestic production and
trade, these figuressuggest the following: The rise of per capita consumption of
maize was sustained by domestic production and imports; consumption of
wheat is based on domestic production and import, whereas increases in
consumption of soy beans is based on imports. The rise of meat per capita
consumption is based on both, domestic production and imports, although the
share of these two sources differs: domestic production and trade balances in
meats indicate that the increase in beef consumption is more dependent on
imports.
Table 8. Per Capita Consumption of Selected Basic Crops and Major Meats: 1980-2009 (Kg.)
Maize Wheat Sorghum Beans
Soy
Beans Poultry Bovine Pork
1980-1985 224.2 64.7 109.9 17.4 22.2 7.0 14.4 17.8
1990-1995 225.8 48.6 86.7 16.3 22.0 12.9 14.9 10.0
2000-2005 236.7 59.6 96.9 9.2 39.5 25.6 18.0 12.9
2006-2007 287.3 59.3 77.0 12.2 35.8 29.6 18.5 13.6
2008-2009 * 283.7 50.7 78.3 11.1 33.6 30.3 18.8 14.3
* Figures for meats are for 2008
Sources: Population,1985-2009 Banco de México and 2010 INEGI 2010 Poulation Census; production
SAGARPA website; Imports and Exports FAO website
It is worth noticing that per capita consumption of wheat decreased
considerably during 2008-2009, as well as consumption of maize and soy
beans. These decreasescoincide with the rise in international food prices in
2006-2007.
16 Antonio Yunez-Naude Programa Cohesión Territorial para el Desarrollo Rimisp – Centro Latinoamericano para el Desarrollo Rural
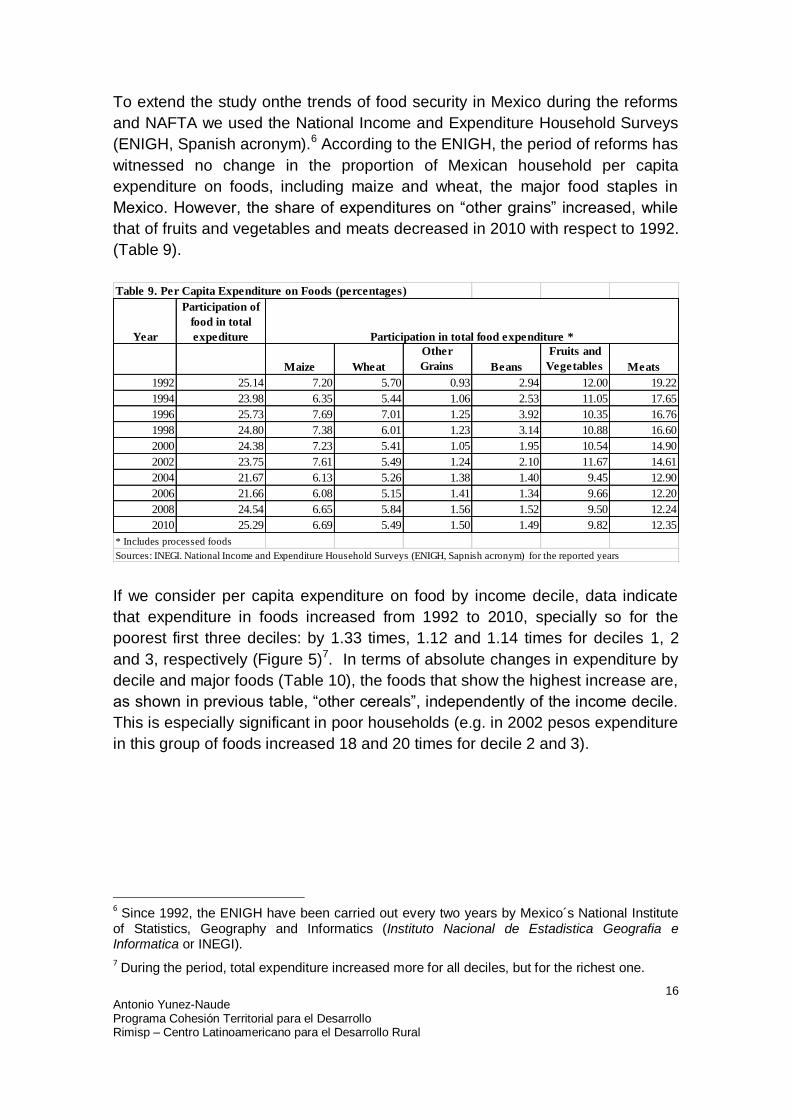
To extend the study onthe trends of food security in Mexico during the reforms
and NAFTA we used the National Income and Expenditure Household Surveys
(ENIGH, Spanish acronym).6 According to the ENIGH, the period of reforms has
witnessed no change in the proportion of Mexican household per capita
expenditure on foods, including maize and wheat, the major food staples in
Mexico. However, the share of expenditures on “other grains” increased, while
that of fruits and vegetables and meats decreased in 2010 with respect to 1992.
(Table 9).
Table 9. Per Capita Expenditure on Foods (percentages)
Year
Participation of
food in total
expediture
Maize Wheat
Other
Grains Beans
Fruits and
Vegetables Meats
1992 25.14 7.20 5.70 0.93 2.94 12.00 19.22
1994 23.98 6.35 5.44 1.06 2.53 11.05 17.65
1996 25.73 7.69 7.01 1.25 3.92 10.35 16.76
1998 24.80 7.38 6.01 1.23 3.14 10.88 16.60
2000 24.38 7.23 5.41 1.05 1.95 10.54 14.90
2002 23.75 7.61 5.49 1.24 2.10 11.67 14.61
2004 21.67 6.13 5.26 1.38 1.40 9.45 12.90
2006 21.66 6.08 5.15 1.41 1.34 9.66 12.20
2008 24.54 6.65 5.84 1.56 1.52 9.50 12.24
2010 25.29 6.69 5.49 1.50 1.49 9.82 12.35
* Includes processed foods
Sources: INEGI. National Income and Expenditure Household Surveys (ENIGH, Sapnish acronym) for the reported years
Participation in total food expenditure *
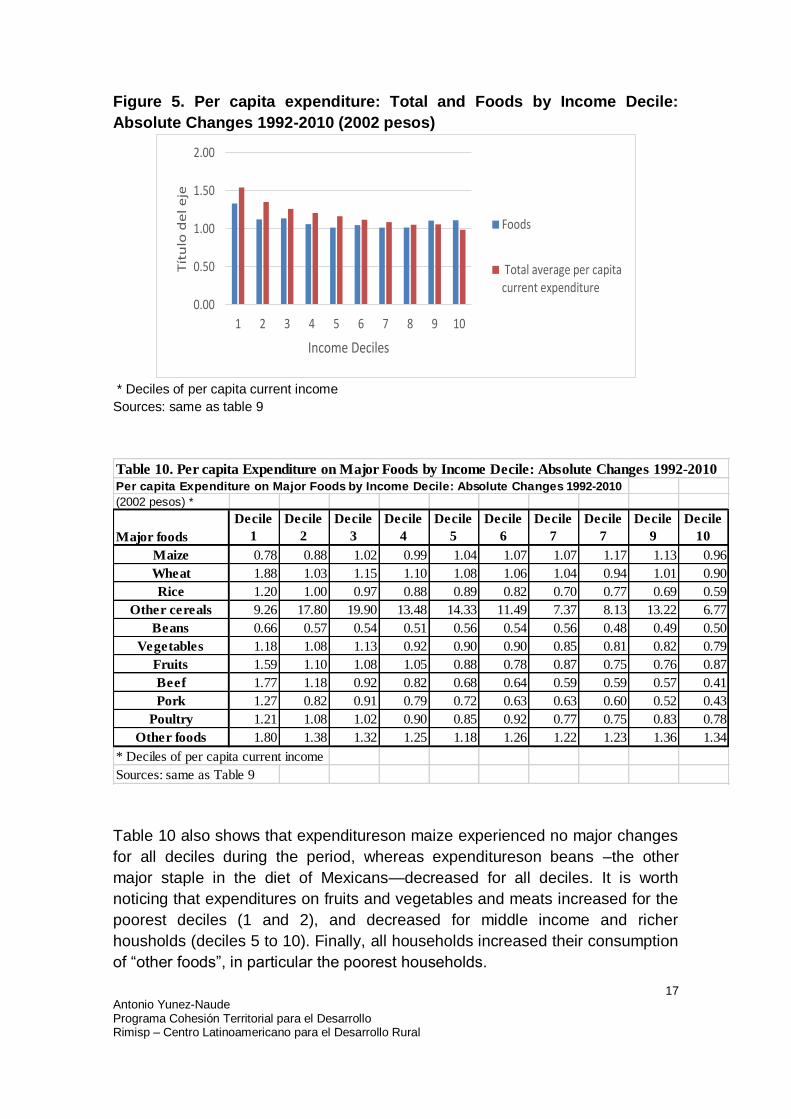
If we consider per capita expenditure on food by income decile, data indicate
that expenditure in foods increased from 1992 to 2010, specially so for the
poorest first three deciles: by 1.33 times, 1.12 and 1.14 times for deciles 1, 2
and 3, respectively (Figure 5)7. In terms of absolute changes in expenditure by
decile and major foods (Table 10), the foods that show the highest increase are,
as shown in previous table, “other cereals”, independently of the income decile.
This is especially significant in poor households (e.g. in 2002 pesos expenditure
in this group of foods increased 18 and 20 times for decile 2 and 3).
6 Since 1992, the ENIGH have been carried out every two years by Mexico´s National Institute of Statistics, Geography and Informatics (Instituto Nacional de Estadistica Geografia e Informatica or INEGI).
7 During the period, total expenditure increased more for all deciles, but for the richest one.
17 Antonio Yunez-Naude Programa Cohesión Territorial para el Desarrollo Rimisp – Centro Latinoamericano para el Desarrollo Rural
Figure 5. Per capita expenditure: Total and Foods by Income Decile:
Absolute Changes 1992-2010 (2002 pesos)
0.00
0.50
1.00
1.50
2.00
1 2 3 4 5 6 7 8 9 10
Tít
ulo
de
l e
je
Income Deciles
Foods
Total average per capitacurrent expenditure
* Deciles of per capita current income
Sources: same as table 9
Table 10. Per capita Expenditure on Major Foods by Income Decile: Absolute Changes 1992-2010
Per capita Expenditure on Major Foods by Income Decile: Absolute Changes 1992-2010
(2002 pesos) *
Major foods
Decile
1
Decile
2
Decile
3
Decile
4
Decile
5
Decile
6
Decile
7
Decile
7
Decile
9
Decile
10
Maize 0.78 0.88 1.02 0.99 1.04 1.07 1.07 1.17 1.13 0.96
Wheat 1.88 1.03 1.15 1.10 1.08 1.06 1.04 0.94 1.01 0.90
Rice 1.20 1.00 0.97 0.88 0.89 0.82 0.70 0.77 0.69 0.59
Other cereals 9.26 17.80 19.90 13.48 14.33 11.49 7.37 8.13 13.22 6.77
Beans 0.66 0.57 0.54 0.51 0.56 0.54 0.56 0.48 0.49 0.50
Vegetables 1.18 1.08 1.13 0.92 0.90 0.90 0.85 0.81 0.82 0.79
Fruits 1.59 1.10 1.08 1.05 0.88 0.78 0.87 0.75 0.76 0.87
Beef 1.77 1.18 0.92 0.82 0.68 0.64 0.59 0.59 0.57 0.41
Pork 1.27 0.82 0.91 0.79 0.72 0.63 0.63 0.60 0.52 0.43
Poultry 1.21 1.08 1.02 0.90 0.85 0.92 0.77 0.75 0.83 0.78
Other foods 1.80 1.38 1.32 1.25 1.18 1.26 1.22 1.23 1.36 1.34
* Deciles of per capita current income
Sources: same as Table 9
Table 10 also shows that expenditureson maize experienced no major changes
for all deciles during the period, whereas expenditureson beans –the other
major staple in the diet of Mexicans—decreased for all deciles. It is worth
noticing that expenditures on fruits and vegetables and meats increased for the
poorest deciles (1 and 2), and decreased for middle income and richer
housholds (deciles 5 to 10). Finally, all households increased their consumption
of “other foods”, in particular the poorest households.
18 Antonio Yunez-Naude Programa Cohesión Territorial para el Desarrollo Rimisp – Centro Latinoamericano para el Desarrollo Rural
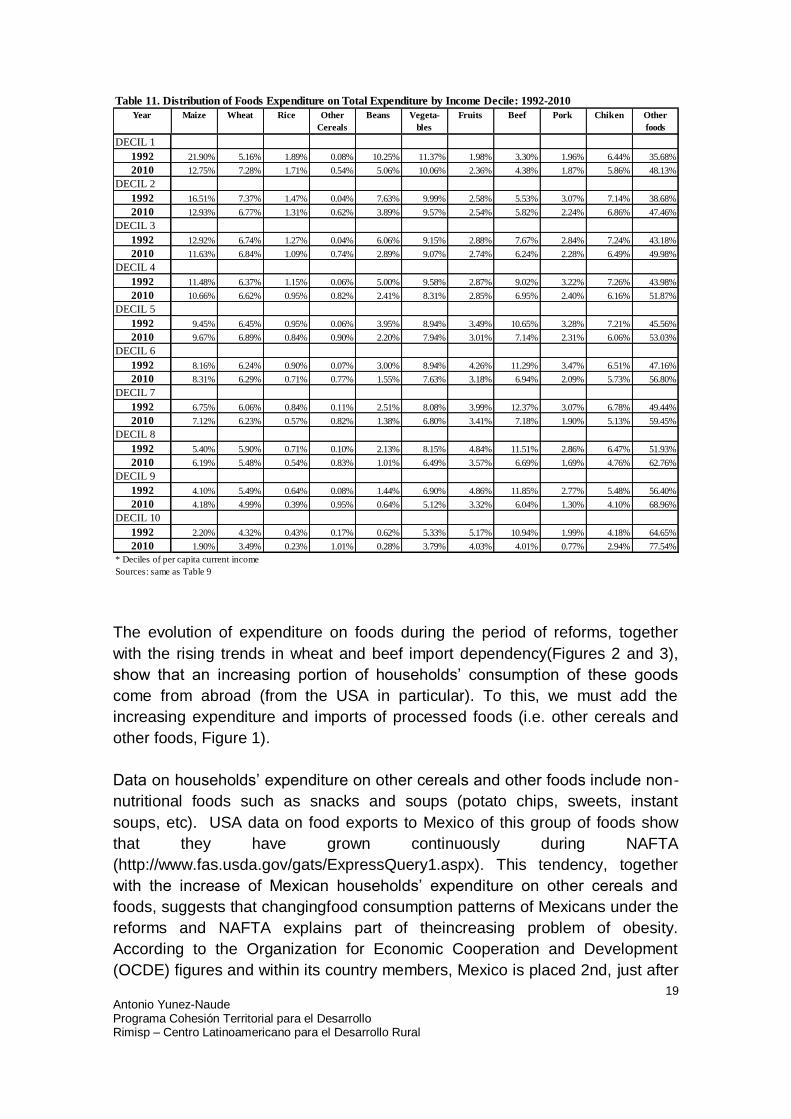
To complete ouraccount of changes in consumption, I estimated the
modifications in 1992 and 2010 in the proportion of households´ total budget
spent on foods by decileand group of foods, distinguishing major single staples
Table 11indicates that in 1992 and 2010 maize was the major staple for poor
households (deciles 1 to 3), whereas beef increased with household income.
However, the weight of maize decreased in 2010 for the poorest households
(deciles 1 and 2) and remained practically unchanged for the remaining
household groups. During this period, expenditures on wheat remained
practically the same for all households with theexception of the poorest (decile
1), whereas expenditure on rice and beans declined in all households.
Expenditures on “other cereals” grew for all households, although they
remained proportionally low in 2010. Expenditures in vegetables and fruits
slightly declined in all household groups, the exception being households in
decile 1.
As for household’sshareof expenditureson meat, beef expenditures for the
poorest household (1 and 2) and declined for the remaining households,
whereas expenditure on pork and poultry declined for all households. Finally,
the share of “other foods” in the food budget of all households grew
considerably, between 6.8 points (decile 3) and 12.89 points (decile 10). The
poorest households increased their expenditure in other foods by 12.45 points).
The above trends indicate that Oportunidades (the program for poverty
alleviation that includes income transfers for food support to poor mothers), has
contributed to rising food expenditure of these households. In addition, since
the 1990s middle and upper income households have satisfied their food
consumption needs. Consumption of “non-traditional” foods increased in all
households, including processed and junk food.
19 Antonio Yunez-Naude Programa Cohesión Territorial para el Desarrollo Rimisp – Centro Latinoamericano para el Desarrollo Rural
Table 11. Distribution of Foods Expenditure on Total Expenditure by Income Decile: 1992-2010
Year Maize Wheat Rice Other
Cereals
Beans Vegeta-
bles
Fruits Beef Pork Chiken Other
foods
DECIL 1
1992 21.90% 5.16% 1.89% 0.08% 10.25% 11.37% 1.98% 3.30% 1.96% 6.44% 35.68%
2010 12.75% 7.28% 1.71% 0.54% 5.06% 10.06% 2.36% 4.38% 1.87% 5.86% 48.13%
DECIL 2
1992 16.51% 7.37% 1.47% 0.04% 7.63% 9.99% 2.58% 5.53% 3.07% 7.14% 38.68%
2010 12.93% 6.77% 1.31% 0.62% 3.89% 9.57% 2.54% 5.82% 2.24% 6.86% 47.46%
DECIL 3
1992 12.92% 6.74% 1.27% 0.04% 6.06% 9.15% 2.88% 7.67% 2.84% 7.24% 43.18%
2010 11.63% 6.84% 1.09% 0.74% 2.89% 9.07% 2.74% 6.24% 2.28% 6.49% 49.98%
DECIL 4
1992 11.48% 6.37% 1.15% 0.06% 5.00% 9.58% 2.87% 9.02% 3.22% 7.26% 43.98%
2010 10.66% 6.62% 0.95% 0.82% 2.41% 8.31% 2.85% 6.95% 2.40% 6.16% 51.87%
DECIL 5
1992 9.45% 6.45% 0.95% 0.06% 3.95% 8.94% 3.49% 10.65% 3.28% 7.21% 45.56%
2010 9.67% 6.89% 0.84% 0.90% 2.20% 7.94% 3.01% 7.14% 2.31% 6.06% 53.03%
DECIL 6
1992 8.16% 6.24% 0.90% 0.07% 3.00% 8.94% 4.26% 11.29% 3.47% 6.51% 47.16%
2010 8.31% 6.29% 0.71% 0.77% 1.55% 7.63% 3.18% 6.94% 2.09% 5.73% 56.80%
DECIL 7
1992 6.75% 6.06% 0.84% 0.11% 2.51% 8.08% 3.99% 12.37% 3.07% 6.78% 49.44%
2010 7.12% 6.23% 0.57% 0.82% 1.38% 6.80% 3.41% 7.18% 1.90% 5.13% 59.45%
DECIL 8
1992 5.40% 5.90% 0.71% 0.10% 2.13% 8.15% 4.84% 11.51% 2.86% 6.47% 51.93%
2010 6.19% 5.48% 0.54% 0.83% 1.01% 6.49% 3.57% 6.69% 1.69% 4.76% 62.76%
DECIL 9
1992 4.10% 5.49% 0.64% 0.08% 1.44% 6.90% 4.86% 11.85% 2.77% 5.48% 56.40%
2010 4.18% 4.99% 0.39% 0.95% 0.64% 5.12% 3.32% 6.04% 1.30% 4.10% 68.96%
DECIL 10
1992 2.20% 4.32% 0.43% 0.17% 0.62% 5.33% 5.17% 10.94% 1.99% 4.18% 64.65%
2010 1.90% 3.49% 0.23% 1.01% 0.28% 3.79% 4.03% 4.01% 0.77% 2.94% 77.54%
* Deciles of per capita current income
Sources: same as Table 9
The evolution of expenditure on foods during the period of reforms, together
with the rising trends in wheat and beef import dependency(Figures 2 and 3),
show that an increasing portion of households’ consumption of these goods
come from abroad (from the USA in particular). To this, we must add the
increasing expenditure and imports of processed foods (i.e. other cereals and
other foods, Figure 1).
Data on households’ expenditure on other cereals and other foods include non-
nutritional foods such as snacks and soups (potato chips, sweets, instant
soups, etc). USA data on food exports to Mexico of this group of foods show
that they have grown continuously during NAFTA
(http://www.fas.usda.gov/gats/ExpressQuery1.aspx). This tendency, together
with the increase of Mexican households’ expenditure on other cereals and
foods, suggests that changingfood consumption patterns of Mexicans under the
reforms and NAFTA explains part of theincreasing problem of obesity.
According to the Organization for Economic Cooperation and Development
(OCDE) figures and within its country members, Mexico is placed 2nd, just after
20 Antonio Yunez-Naude Programa Cohesión Territorial para el Desarrollo Rimisp – Centro Latinoamericano para el Desarrollo Rural
the USA, in terms of adult obesity and 4thwith respect to child obesity
(http://www.oecd.org/). The question of obesity urgently requires study in the
context of economic liberalization and industrial organization.
Our study of the evolution of consumption patterns of the Mexican population
during the last three decades also distinguishesfood consumption in urban and
rural populations (i.e. people living in localities with more than 2,500 people and
in localities with less than this figure, respectively).
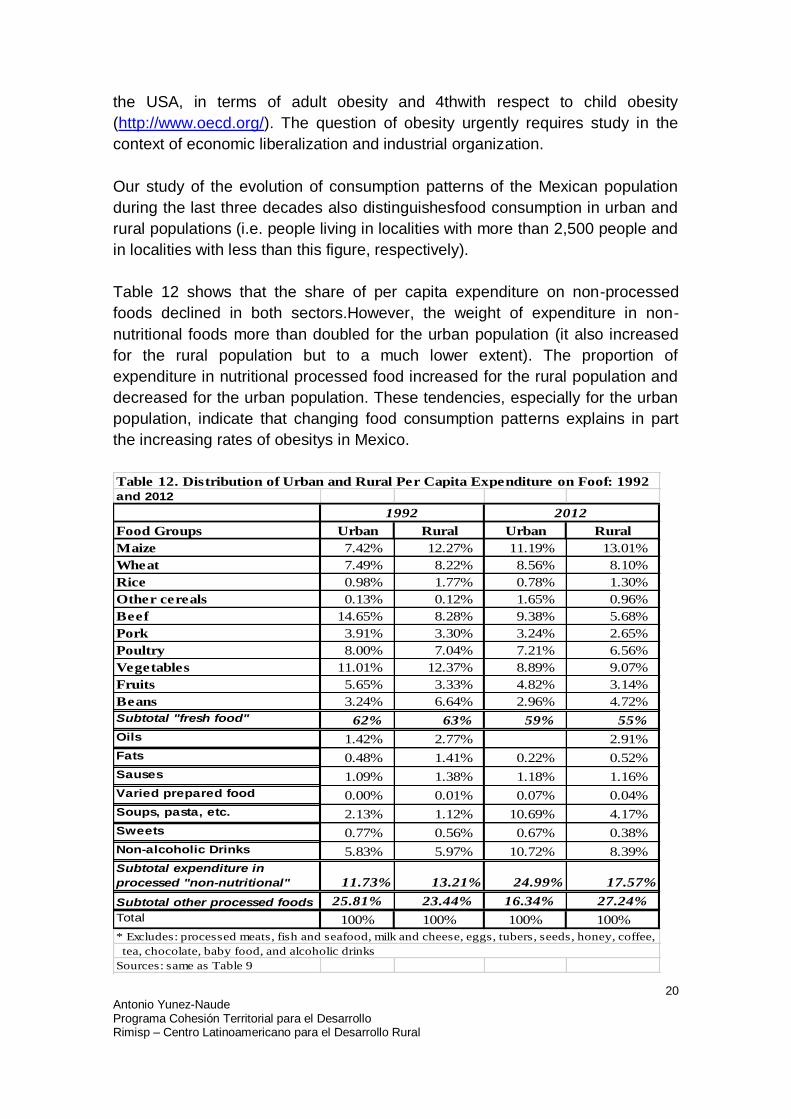
Table 12 shows that the share of per capita expenditure on non-processed
foods declined in both sectors.However, the weight of expenditure in non-
nutritional foods more than doubled for the urban population (it also increased
for the rural population but to a much lower extent). The proportion of
expenditure in nutritional processed food increased for the rural population and
decreased for the urban population. These tendencies, especially for the urban
population, indicate that changing food consumption patterns explains in part
the increasing rates of obesitys in Mexico.
Table 12. Distribution of Urban and Rural Per Capita Expenditure on Foof: 1992
and 2012
Food Groups Urban Rural Urban Rural
Maize 7.42% 12.27% 11.19% 13.01%
Wheat 7.49% 8.22% 8.56% 8.10%
Rice 0.98% 1.77% 0.78% 1.30%
Other cereals 0.13% 0.12% 1.65% 0.96%
Beef 14.65% 8.28% 9.38% 5.68%
Pork 3.91% 3.30% 3.24% 2.65%
Poultry 8.00% 7.04% 7.21% 6.56%
Vegetables 11.01% 12.37% 8.89% 9.07%
Fruits 5.65% 3.33% 4.82% 3.14%
Beans 3.24% 6.64% 2.96% 4.72%
Subtotal "fresh food" 62% 63% 59% 55%
Oils 1.42% 2.77% 2.91%
Fats 0.48% 1.41% 0.22% 0.52%
Sauses 1.09% 1.38% 1.18% 1.16%
Varied prepared food 0.00% 0.01% 0.07% 0.04%
Soups, pasta, etc. 2.13% 1.12% 10.69% 4.17%
Sweets 0.77% 0.56% 0.67% 0.38%
Non-alcoholic Drinks 5.83% 5.97% 10.72% 8.39%
Subtotal expenditure in
processed "non-nutritional"
foods *
11.73% 13.21% 24.99% 17.57%
Subtotal other processed foods 25.81% 23.44% 16.34% 27.24%
Total 100% 100% 100% 100%
Sources: same as Table 9
20121992
* Excludes: processed meats, fish and seafood, milk and cheese, eggs, tubers, seeds, honey, coffee,
tea, chocolate, baby food, and alcoholic drinks
21 Antonio Yunez-Naude Programa Cohesión Territorial para el Desarrollo Rimisp – Centro Latinoamericano para el Desarrollo Rural
The determinants of obesity in Mexico require empirical research. Some
suggested hypotheses are the following: 1) Increased access to non-nutritional
food under economic liberalization and trade (e.g. according to Foreign
Agricultural Service (FAS) from the US Department of Agriculture (USDA), from
1992 to 2012 the value of imports of instant soups and snacks grew almost 11
times (FAS/USD quoted website); 2) until recently, no state regulations were
implemented on food nutritional value and quality standards; and 3) in Mexico,
no Value Added Tax is applied to any type of foodyet.
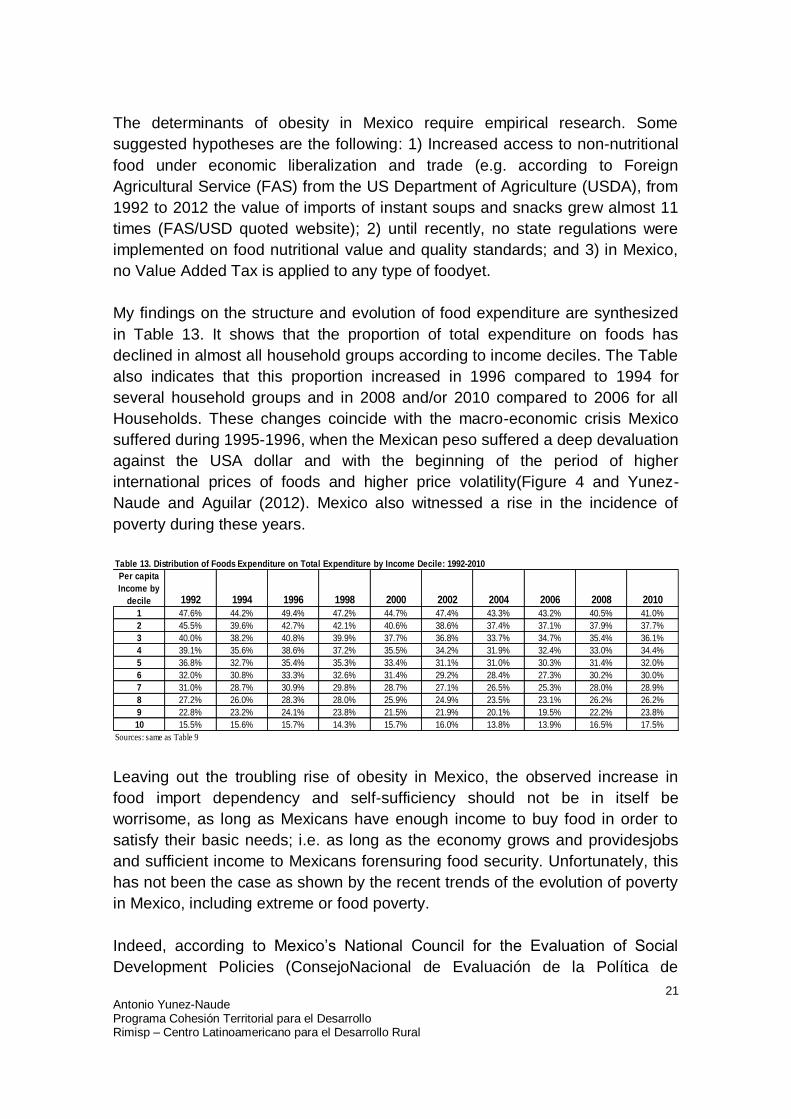
My findings on the structure and evolution of food expenditure are synthesized
in Table 13. It shows that the proportion of total expenditure on foods has
declined in almost all household groups according to income deciles. The Table
also indicates that this proportion increased in 1996 compared to 1994 for
several household groups and in 2008 and/or 2010 compared to 2006 for all
Households. These changes coincide with the macro-economic crisis Mexico
suffered during 1995-1996, when the Mexican peso suffered a deep devaluation
against the USA dollar and with the beginning of the period of higher
international prices of foods and higher price volatility(Figure 4 and Yunez-
Naude and Aguilar (2012). Mexico also witnessed a rise in the incidence of
poverty during these years.
Table 13. Distribution of Foods Expenditure on Total Expenditure by Income Decile: 1992-2010
Per capita
Income by
decile 1992 1994 1996 1998 2000 2002 2004 2006 2008 2010
1 47.6% 44.2% 49.4% 47.2% 44.7% 47.4% 43.3% 43.2% 40.5% 41.0%
2 45.5% 39.6% 42.7% 42.1% 40.6% 38.6% 37.4% 37.1% 37.9% 37.7%
3 40.0% 38.2% 40.8% 39.9% 37.7% 36.8% 33.7% 34.7% 35.4% 36.1%
4 39.1% 35.6% 38.6% 37.2% 35.5% 34.2% 31.9% 32.4% 33.0% 34.4%
5 36.8% 32.7% 35.4% 35.3% 33.4% 31.1% 31.0% 30.3% 31.4% 32.0%
6 32.0% 30.8% 33.3% 32.6% 31.4% 29.2% 28.4% 27.3% 30.2% 30.0%
7 31.0% 28.7% 30.9% 29.8% 28.7% 27.1% 26.5% 25.3% 28.0% 28.9%
8 27.2% 26.0% 28.3% 28.0% 25.9% 24.9% 23.5% 23.1% 26.2% 26.2%
9 22.8% 23.2% 24.1% 23.8% 21.5% 21.9% 20.1% 19.5% 22.2% 23.8%
10 15.5% 15.6% 15.7% 14.3% 15.7% 16.0% 13.8% 13.9% 16.5% 17.5%
Sources: same as Table 9
Leaving out the troubling rise of obesity in Mexico, the observed increase in
food import dependency and self-sufficiency should not be in itself be
worrisome, as long as Mexicans have enough income to buy food in order to
satisfy their basic needs; i.e. as long as the economy grows and providesjobs
and sufficient income to Mexicans forensuring food security. Unfortunately, this
has not been the case as shown by the recent trends of the evolution of poverty
in Mexico, including extreme or food poverty.
Indeed, according to Mexico’s National Council for the Evaluation of Social
Development Policies (ConsejoNacional de Evaluación de la Política de
22 Antonio Yunez-Naude Programa Cohesión Territorial para el Desarrollo Rimisp – Centro Latinoamericano para el Desarrollo Rural
Desarrollo Social or CONEVAL), extreme poverty increased in 2008 and has
remained high during the last years. This comes after a period of more than 10
years of income poverty reduction while the Mexican economy recovered from
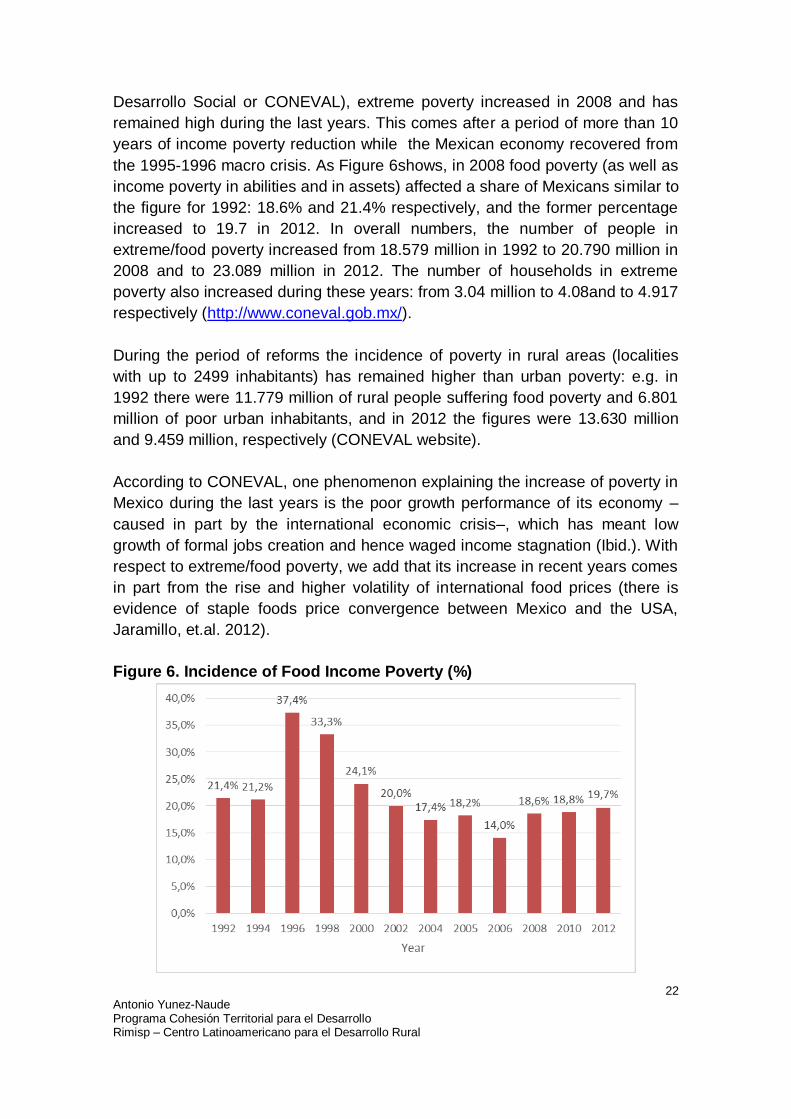
the 1995-1996 macro crisis. As Figure 6shows, in 2008 food poverty (as well as
income poverty in abilities and in assets) affected a share of Mexicans similar to
the figure for 1992: 18.6% and 21.4% respectively, and the former percentage
increased to 19.7 in 2012. In overall numbers, the number of people in
extreme/food poverty increased from 18.579 million in 1992 to 20.790 million in
2008 and to 23.089 million in 2012. The number of households in extreme
poverty also increased during these years: from 3.04 million to 4.08and to 4.917
respectively (http://www.coneval.gob.mx/).
During the period of reforms the incidence of poverty in rural areas (localities
with up to 2499 inhabitants) has remained higher than urban poverty: e.g. in
1992 there were 11.779 million of rural people suffering food poverty and 6.801
million of poor urban inhabitants, and in 2012 the figures were 13.630 million
and 9.459 million, respectively (CONEVAL website).
According to CONEVAL, one phenomenon explaining the increase of poverty in
Mexico during the last years is the poor growth performance of its economy –
caused in part by the international economic crisis–, which has meant low
growth of formal jobs creation and hence waged income stagnation (Ibid.). With
respect to extreme/food poverty, we add that its increase in recent years comes
in part from the rise and higher volatility of international food prices (there is
evidence of staple foods price convergence between Mexico and the USA,
Jaramillo, et.al. 2012).
Figure 6. Incidence of Food Income Poverty (%)
23 Antonio Yunez-Naude Programa Cohesión Territorial para el Desarrollo Rimisp – Centro Latinoamericano para el Desarrollo Rural
It is important to note that according to CONEVAL estimations, rural food
poverty decreased from 2008 to 2012, whereas urban extreme poverty
increased: by -0.9 and by 2.2 respectively. While the drop in extreme rural
poverty was not statistically significant, in urban poverty it was significant. This
suggests that rural population is relatively less vulnerable to food price shocks
than urban population.
24 Antonio Yunez-Naude Programa Cohesión Territorial para el Desarrollo Rimisp – Centro Latinoamericano para el Desarrollo Rural
5. LESSONS FROM MEXICO
After more than 20 years of market-oriented reforms and trade liberalization,
Mexico´s economic and social performance has been disappointing (the
exception is the attainment, since the end of the nineties, of macroeconomic
stability, Lustig(2010).In addition to poor growth performance and lack of
sustained poverty alleviation, the economy of Mexico continues to be a highly
unequal. For example, the income Gini coefficient in Mexico was 0.53 in 1992
and decreased to just 0.50 in 2008 and to 0.47 in 2010 (CONEVAL´s website).
Mexico is increasingly dependent on the USA economy and its economic
cycles: the USA share in Mexico´s total and agricultural trade has increased, up
to more than 80 percent in staples and processed foods. In principle, food
dependency may not be a threat to food security; however, the experience of
Mexico of low income growth and high inequality is troublingespecially in the
context of climate change, and increasing international food prices and/or their
volatility,
Asdiscussed in Part 2, the Mexican governmentrecognized the situation in the
beginning of last decade, but the agricultural and rural policy changes
implemented to enhance food production and security failed, as demonstrated
by the figures on the increasing extreme or foodpoverty incidences during the
last years, coupled by the rise in food expenditures for all income groups. To
the above we must add the inefficacy and inefficiency of public interventions in
agriculture since the increase in public spending during the first twelve years of
the XXI Century did not translate intoincreasing food production.
Three features of contemporaryagricultural and rural policies of Mexico stand
out: the high public budget directed to these two sectors, the unequal
distribution of benefits, and the emphasis on the provision of private, rather than
public, goods, including the lack of sufficient public investment in research,
development and technology transfer to agriculture (R&D). However, and
notwithstanding the last two features, production in small farms survives.
According to FAO estimates, Mexico stands out as the Latin American country
with the strongest agricultural orientation in public spending (this measure is
based on the ratio of agricultural GDP to agricultural public expenditures and
dividing it by the ratio of total GDP to total public expenditure, Scott, 2006). The
high public expenditure on Mexican agriculture contrasts with the overall poor
performance of the sector, explained in part by the multiplicity of agricultural
25 Antonio Yunez-Naude Programa Cohesión Territorial para el Desarrollo Rimisp – Centro Latinoamericano para el Desarrollo Rural
programs, their inefficiency, inequity, and bias in favor of private goods (Taylor,
Yunez and Gonzalez 2007, and Berdegueet. al. 2013).
Mexico’s agricultural policies have been highly regressive. Even the Rural
Development Program of Alliance (Table 1), directed towards marginalized rural
regions where poor and small farmers are located, is regressive. Inequity in
government agricultural programs negatively affects farmers not receiving
subsidies, especially medium size and small producers (Scott, 2010 and see
Sumner and Balagtas’ (2007) study of the effects of ASERCA deficiency
payment program IngresoObjetivo).
Contemporary public spending in rural Mexico has an emphasis on the
provision of private benefits and not public goods. Taylor, Yunez and Gonzalez
(2007) estimate that in 2005, around 30% of the total public budget to
agriculture and the rural sectorwas channeled into providing private goods. In
addition, productive public subsidies to agriculture benefit commercial big
farmers. This public policy bias potentially jeopardizes the survival of small-
scale farms producing staples and other foods.
The continuation of agricultural production on small farms during Mexico’s
economic liberalization process, as well as small rural farmers’ relatively high
productivity and efficiency in producing basic crops(Taylor andYunez (2010),
suggest a potential for small farms to increase their contribution to food
production in Mexico. For this to happen, the Mexican state needs to overcome
major challenges in reforming agricultural and rural policies so as to include
small farms, and to adopt a long-run view by investing in the provision of public
goods andencouraging decentralization in public policies for agriculture and
rural development.
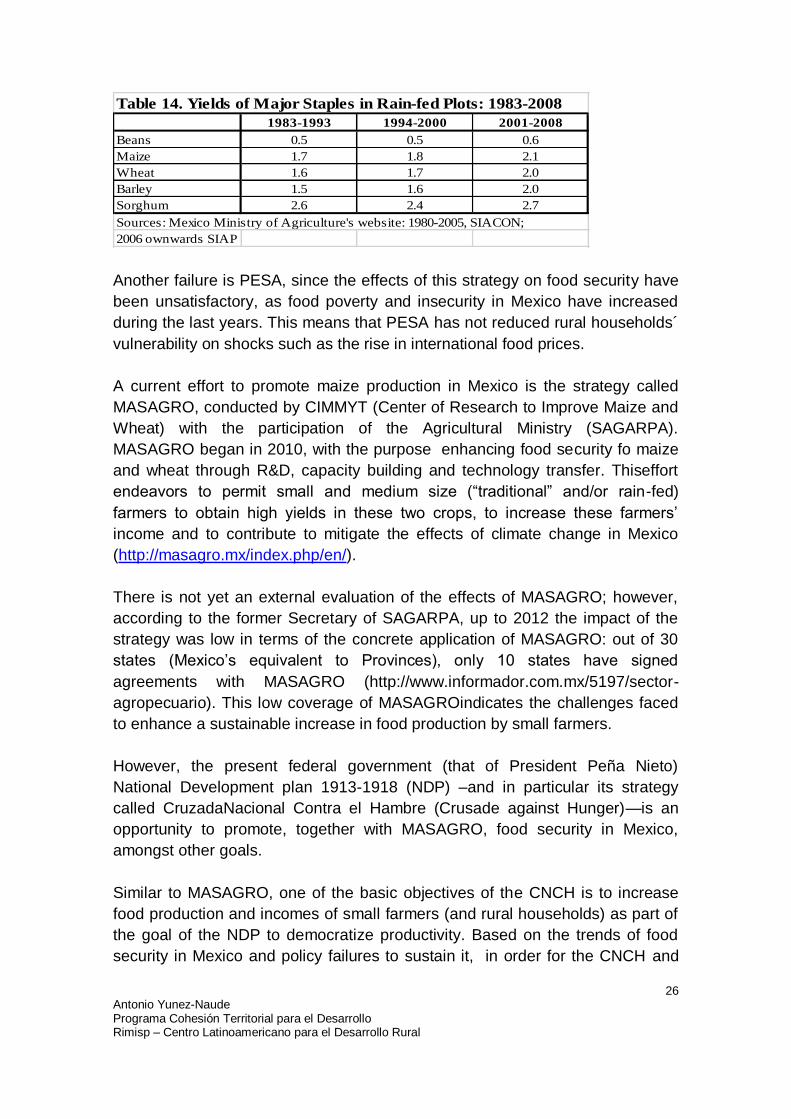
An example of the Mexican government failure to provide public goods is the
modest effectof Fundaciones Produce (part of Alliance for the Countryside) a
public scheme to improve, amongst others, agriculturalproductivity of small rain-
fed farmers through the transfer of modern technologies. Figures in Table 14
illustrates this: it shows the meager impacts of Fundaciones Produce on yields
in basic staples produced under rain-fed conditions (a summary of the findings
of Eduardo Trigo´sevaluation of R&D policies in the agriculture of Mexico is in
Taylor, et. al.(2007).
26 Antonio Yunez-Naude Programa Cohesión Territorial para el Desarrollo Rimisp – Centro Latinoamericano para el Desarrollo Rural
Table 14. Yields of Major Staples in Rain-fed Plots: 1983-2008
1983-1993 1994-2000 2001-2008
Beans 0.5 0.5 0.6
Maize 1.7 1.8 2.1
Wheat 1.6 1.7 2.0
Barley 1.5 1.6 2.0
Sorghum 2.6 2.4 2.7
Sources: Mexico Ministry of Agriculture's website: 1980-2005, SIACON;
2006 ownwards SIAP
Another failure is PESA, since the effects of this strategy on food security have
been unsatisfactory, as food poverty and insecurity in Mexico have increased
during the last years. This means that PESA has not reduced rural households´
vulnerability on shocks such as the rise in international food prices.
A current effort to promote maize production in Mexico is the strategy called
MASAGRO, conducted by CIMMYT (Center of Research to Improve Maize and
Wheat) with the participation of the Agricultural Ministry (SAGARPA).
MASAGRO began in 2010, with the purpose enhancing food security fo maize
and wheat through R&D, capacity building and technology transfer. Thiseffort
endeavors to permit small and medium size (“traditional” and/or rain-fed)
farmers to obtain high yields in these two crops, to increase these farmers’
income and to contribute to mitigate the effects of climate change in Mexico
(http://masagro.mx/index.php/en/).
There is not yet an external evaluation of the effects of MASAGRO; however,
according to the former Secretary of SAGARPA, up to 2012 the impact of the
strategy was low in terms of the concrete application of MASAGRO: out of 30
states (Mexico’s equivalent to Provinces), only 10 states have signed
agreements with MASAGRO (http://www.informador.com.mx/5197/sector-
agropecuario). This low coverage of MASAGROindicates the challenges faced
to enhance a sustainable increase in food production by small farmers.
However, the present federal government (that of President Peña Nieto)
National Development plan 1913-1918 (NDP) –and in particular its strategy
called CruzadaNacional Contra el Hambre (Crusade against Hunger)—is an
opportunity to promote, together with MASAGRO, food security in Mexico,
amongst other goals.
Similar to MASAGRO, one of the basic objectives of the CNCH is to increase
food production and incomes of small farmers (and rural households) as part of
the goal of the NDP to democratize productivity. Based on the trends of food
security in Mexico and policy failures to sustain it, in order for the CNCH and
27 Antonio Yunez-Naude Programa Cohesión Territorial para el Desarrollo Rimisp – Centro Latinoamericano para el Desarrollo Rural
NPD to accomplish these objectives it is imperative to transform public policies
in the agriculture and the rural sectors. In particular, the Mexican
governmentmust link social policies to productive policies in the rural economy
within a framework of coordination between ministries in charge of them and
between the three levels of government (federal, state and municipal/county).
These actions must include the participation of small producers and/or rural
food producing households in specific policy design and implementation.. The
rural households must be included in order to articulate policies with the specific
requirements and demands of these actors (details in Berdegue, J. et. al, 2013).
This approach, i.e. from top to bottom, will resolve, at least partially, the
question of which producers have a productive potential.
Food security policies must emphasizethe provision of public goods, and must
not, as before, rely almost exclusively on income transfers to individuals. In
particularthe investment in infrastructure and communications and R&D must be
emphasized, as well asthe promotion of rural organizations at the production,
storage, marketing and financial levels. All of the above must be undertaken
with a territorial perspective in order to connect the economy of rural localities
with nearby urban centers (see RIMISP publications on “functional
territories”).http://www.rimisp.org/publicaciones-documentos/)
There is another lesson that can be learned from the experience of Mexico. The
evaluations of public social and agricultural policies carried out by CONEVAL
during the last years are now a major reference for understanding the evolution
of poverty in Mexico. It has been possible to do these estimations thanks to the
data of ENHIIGH and other official surveys. CONEVAL, together with the
Ministry of Finance, are also responsible to seek external and independent
experts to evaluate the design and results of social and agricultural government
programs. Unfortunately, rigorous empirical impact analyses such as those
based in quasi-experimental approaches are scarce. For agricultural programs,
lack of impact evaluation is mainly due to the insufficient official data on their
potential and actual beneficiaries. This requirement will be fulfilled by a survey
representative of rural producers that CONEVAL plans to implement before the
end of this year.
28 Antonio Yunez-Naude Programa Cohesión Territorial para el Desarrollo Rimisp – Centro Latinoamericano para el Desarrollo Rural
6. CONCLUSIONS
In Mexico, government interventions in agriculture radically changed during the
beginning of the 1990s in the process of economic reforms and free trade
negotiations under NAFTA: from direct interventions through a State Food
Enterprise, price supports and food import controls to “transition” policies and
freer agricultural trade. The Ministry for Social Development was created in
conjunction with the reforms and with it a tacit separation between social and
productive policies in the rural sector. With the exception of PROCAMPO –the
direct income transfers to farmers producing food staples—agricultural
subsidies focused on commercial farmers, most of them big ones located in the
northern arid regions of the country.
Agricultural policies during the nineties were intended to be transitory, to help
farmers to prepare for the competition of their USA counterparts (the process of
full agricultural liberalization under NAFTA ended in December 2007). However
and up to the present (i.e. the first year of Peña Nieto as President of Mexico
and Congress), these policies remain. There are, however, reasons to expect
that some policy changes will be adopted, at least in relation to the current
administration Crusade against Poverty.
The apparent perpetuation of agricultural policies of the past is associated with
the maintenance and/or creation of powerful interest groups which are
beneficiaries of government subsidies; this is other lesson the Mexican
experience can offer.
NAFTA is not necessarily to blame for the present conditionof the agricultural
sector and the continuation of poverty in this sector.I propose that the
unsatisfactory performance of agriculture is a consequence of the extreme view
adopted by the Mexican State that to recur to the markets is the best policy
optionto attain economic development. For agriculture, this view was present in
the expectation that freer markets and trade would assure a more efficient use
of resources, as well as food security. In industry, this viewpoint explains the
disappearance of an industrial policy, and hence, it is not surprising that in
Mexico there is no policy regarding dietary phenomena.Instead, we have
witnessed the rise in the consumption of non-nutritional foods produced in
Mexico and abroad.
In addition to this, there was no serious state effort to invest in and promote
R&D, and in particular to promote, adapt and transfer it to small and medium
29 Antonio Yunez-Naude Programa Cohesión Territorial para el Desarrollo Rimisp – Centro Latinoamericano para el Desarrollo Rural
size farmers (large farmers in the North have the option to adapt new
technologies developed abroad, and more specifically, in the USA).
As discussed in this paper, there are signs that the current administration is
aware of the challenges Mexico faces to create effective and efficient
agricultural and rural policies to attain food security. Diagnoses of public policy
failures are available, as well as concrete proposals “to reform the reforms”;
what is required is the political will of powerful groups to put them into practice.
We hope that the current administration implements the required policy
changes, and with this Mexico could offer positive lessons to other countries in
earlier stages of development.
30 Antonio Yunez-Naude Programa Cohesión Territorial para el Desarrollo Rimisp – Centro Latinoamericano para el Desarrollo Rural
7. REFERENCES
Berdegue, J., et. al. 2013. “Propuesta de un Programa Articulador para Reducir
la Pobreza y Aumentar la Producción de Alimentos y el Ingreso de los
Campesinos y Pequeños Productores Agrícolas,” Mexico.
Dyer, G., J.E Taylor & S. Boucher. 2006. “Subsistence response to market
shocks”. American Journal of Agricultural Economics 88(2):279-291.
Dyer, G., J.E. Taylor & A. Yunez-Naude. 2005. “Disaggregated rural economy-
wide models for policy analysis”. World Development, 33(10): 1671-1688.
Filipsky and Taylor (forthcoming), “A Simulation Impact Evaluation of Rural
Income Transfers in Malawi and Ghana”. Journal of DevelopmentEffectiveness.
Garfias, Ek, F. (2010), “Derechos de propiedad y cambio institucional en el
campo mexicano”, B.A. Thesis, InstitutoTecnológico Autónomo de Mexico
(ITAM).
Jaramillo, J. L. A. Yunez-Naude and V. Serrano.(2012). “Spatial North American
Agri-Food Market Integration: The Case of Maize, Sorghum and Wheat” Paper
presented at the 28thInternational Conference of Agricultural Economists,
ICAE, Brazil.
Lustig, N. (2012). Macroeconomía. El Colegio de Mexico,.Also
athttp://colmex.mx
Robles, H., 2010, “Una visión de largo plazo: comparativo resultados del VII Y
VIII Censo Agrícola Ganadero 1991-2007”, in Fox, J, and L.Haight (Eds.),
Subsidios para la desigualdad: las políticas públicas del maíz en México a partir
del libre comercio, Woodrow Wilson International Center forScholars, pp. 185-
193.
Scott, J. (2006). “Pobreza rural y políticas públicas,” Paperpresented at
theSeminar“Desarrollo Rural y el Sector Agroalimentario,” Mexico City, March.
_____ (2010), “Subsidios Agrícolas en México: ¿quién gana, y cuánto?” in Fox
J. y L. Haight (coordinadores), Subsidios para la desigualdad. Las políticas
públicas del maíz en México a partir del libre comercio, Washington D. C.,
31 Antonio Yunez-Naude Programa Cohesión Territorial para el Desarrollo Rimisp – Centro Latinoamericano para el Desarrollo Rural
Woodrow Wilson International Center forScholars& Centro de Investigación y
Docencia Económicas (CIDE), pp. 73-127.
Singh, I., L. Squire & J. Strauss, eds. 1986. Agricultural household models—
extensions, applications and policy. Baltimore, The Johns Hopkins University
Press.
Sumner, D.A. & J.V. Balagtas. 2007. “Economic analysis of the IngresoObjetivo
program in Mexico”. Final Reportforthe Project Políticas y gasto público federal
en el sector rural en Mexico. Inter-American Development Bank (IDB), Aug.
13th: 1-55.
Taylor, J.E. Yunez-Naude and González.(2007). Final ExecutiveReport,
“Estudios sobre Políticas Públicas para el Sector Rural en México”.DB and
Mexico Ministry of Finance.
Taylor, J.E. and Yunez-Naude (2010). “Assessing the Efficiency of Mexican
Smallholders and Drivers of Structural Change in Mexican Agriculture in Recent
Decades,” Report to FAO, 2010.
Yunez-Naude, A. 2003. “The Dismantling of CONASUPO, a Mexican State
Trader in Agriculture”.TheWorldEconomy, 26(1K): 97-122.
___ 2010. “Las políticas públicas dirigidas al sector rural: el carácter de las
reformas para el cambio estructural.”In A. Yunez, ed. Economía rural, El
Colegio de Mexico, 23-62. Also a thttp://colmex.mx
____ and P. Aguilar (2012). “Análisis sectorial para una economía verde (Mx-
GESS)”, Final Report, Proyect MX-GESS, IDB, National Institute of Ecology and
United Nations Program for the Environment. Nov.