oldham in profile
TRANSCRIPT

Oldham in Profile
Business Intelligence Service
April 2019
Page 2 of 58 Oldham in Profile v2.0 January 2019
About Oldham in Profile
Oldham in Profile is intended as a comprehensive but easy-to-read overview of several key
aspects of Oldham. You are welcome to copy sections into other documents, or quote from
it. Please acknowledge sources wherever possible.
Oldham in Profile was revised throughout in 2017, with subsequent smaller updates. This
revision updates the Population, Health, Housing, and Education sections. More recent data
has been incorporated, and the accompanying text has been amended, too.
We intend to update each section on an annual or biannual basis dependent on the
availability of data and the priority of chapters. We will also seek to add further chapters in
the future as time, resources and data become available.
Page 3 of 58 Oldham in Profile v2.0 January 2019
Index
History of Oldham 4
Population 6
Ethnicity 8
Age Structure
Deprivation
12
14
Economy 16
Business in Oldham 17
Employment 19
Skills 22
Income 23
Transport Connectivity 24
Health & Well-being 25
Life Expectancy 26
Children’s & Young People’s Health 27
Adults Health & Lifestyle 32
Older People’s Health & Lifestyle 36
Housing 37
Housing Stock 38
Overcrowding 39
Housing Tenure 41
House Prices & Future Market 43
Fuel Poverty 46
Education 47
Education Provision in Oldham 48
Overview and Ofsted Judgements 49
Early Years and Key Stage 1 50
Key Stage 2 51
Key Stage 4 52
16-18 Study 54
Attainment Gaps 55
Attendance & Exclusions 57
Credits, Version Log, Update Schedule 58
Page 4 of 58 Oldham in Profile v2.0 January 2019
History of Oldham
Oldham has been occupied from the Neolithic period onwards, through the Bronze and Iron
ages. Prehistorically, there exist significant fossil deposits in the area signifying that
Glodwick Lows was, 300 million years ago, the site of a tropical freshwater lake and swamp
forest.1
Oldham’s recorded history most likely begins with the Roman colonisation of the North of
England and the building of roads through the area leading to the Roman fort at Castleshaw.
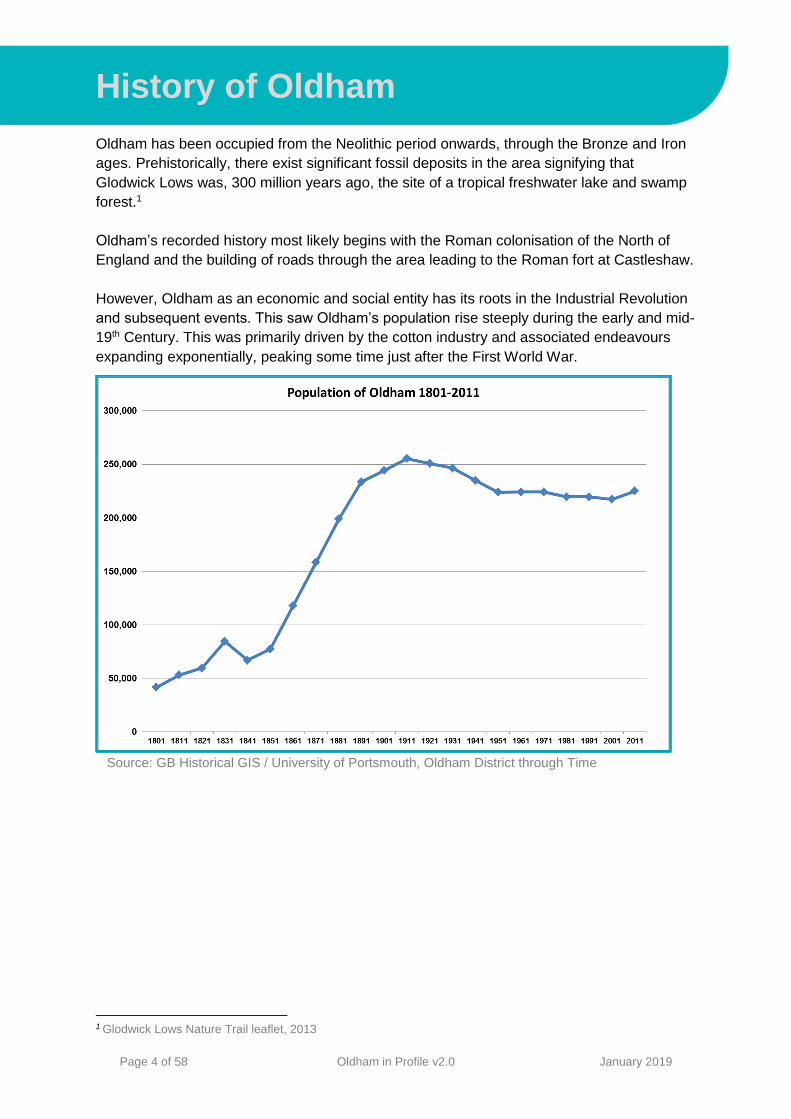
However, Oldham as an economic and social entity has its roots in the Industrial Revolution
and subsequent events. This saw Oldham’s population rise steeply during the early and mid-
19th Century. This was primarily driven by the cotton industry and associated endeavours
expanding exponentially, peaking some time just after the First World War.
Source: GB Historical GIS / University of Portsmouth, Oldham District through Time
1 Glodwick Lows Nature Trail leaflet, 2013
Page 5 of 58 Oldham in Profile v2.0 January 2019
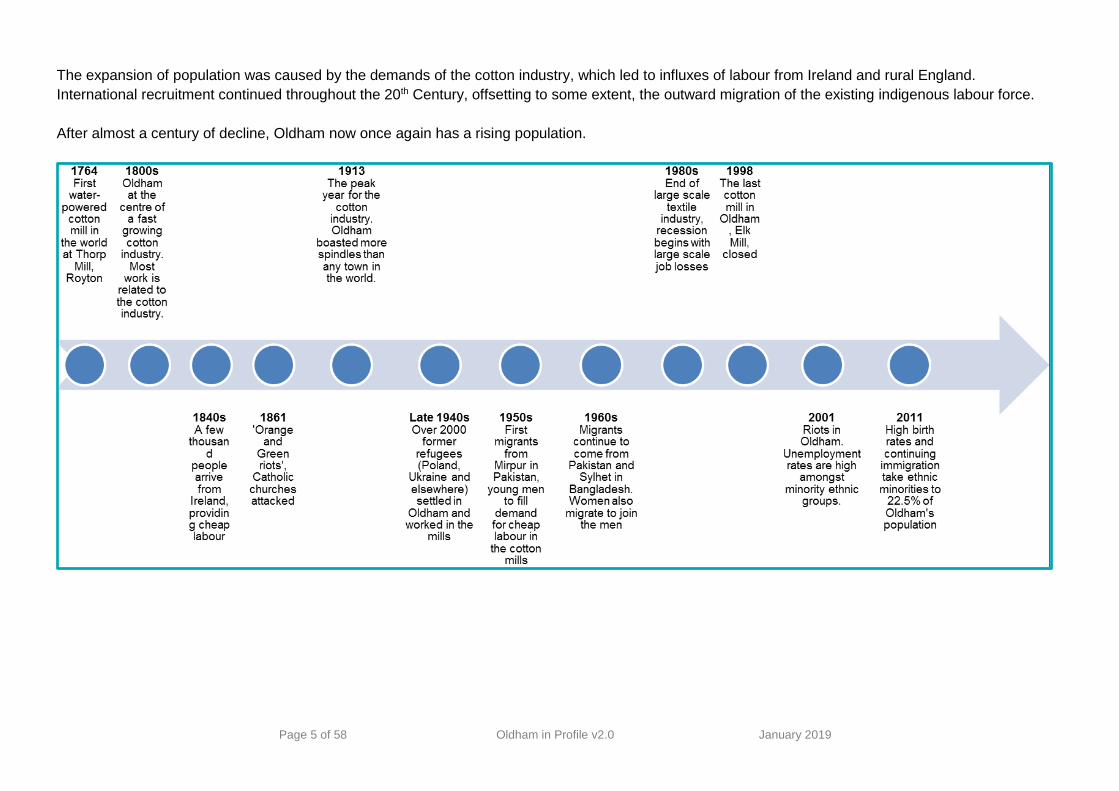
The expansion of population was caused by the demands of the cotton industry, which led to influxes of labour from Ireland and rural England.
International recruitment continued throughout the 20th Century, offsetting to some extent, the outward migration of the existing indigenous labour force.
After almost a century of decline, Oldham now once again has a rising population.
Page 6 of 58 Oldham in Profile v2.0 January 2019
Population
Overview
As of mid-2017, Oldham’s population is 233,759, making it the seventh largest borough in
Greater Manchester.
Oldham has a higher proportion (22.5%) of non-white Black and Minority Ethnic (BME)
residents than in Greater Manchester (16.3%), the North West (9.8%), and England (14.6%).
This proportion has increased from 13.5% in 20012. The ethnic composition in Oldham
currently stands at 77.5% White, 10.1% Pakistani, 7.3% Bangladeshi and 5.1% ‘other’.
Oldham has a high proportion (22.5%) of residents aged under 16 and proportionally fewer
(15.7%) aged 65 and over. The overall structure of the population has shifted downwards
due to the growth in Oldham’s Pakistani and Bangladeshi communities, which have younger
age profiles.
According to the ONS, Oldham’s population is projected to reach 255,200 by 2041 – a 9.2%
increase from the 2017 population. This increase will come as a result of improving life
expectancy, and the continued growth of Oldham’s Pakistani and Bangladeshi communities.
Higher fertility rates within these communities, along with some internal and international
migration, will be key determinants in the town’s future population growth.
2 *The latest official ethnicity figures are from 2011 census
Challenges and Opportunities
Population Growth – Increases in Oldham’s population will in turn increase
demand for universal services. However, it will also bring opportunities for
economies of scale, as well as higher funding.
Working Age Shrinkage – Due to Oldham’s changing age profile, increases in the
proportion (yet relatively steady number) of people of working age may impact on
labour supply and GVA.
Older People Growth – it is expected that the number of older people in Oldham’s
population will grow by 40% within the next 24 years. This will bring major challenges
for adult social care and health provision.
Increased Diversity – Changes in Oldham’s ethnic composition are likely to affect
patterns of residence within Oldham. There may be an increased need to support
community relations, particularly within neighbourhoods where ethnic compositions
are shifting rapidly.

Page 7 of 58 Oldham in Profile v2.0 January 2019
Oldham’s Population
As of mid-2017 Oldham’s population was 233,759, with 115,143 males (49.3%) and 118,616
females (50.7%) (ONS: Mid-Year Estimates 2017). Oldham is currently the seventh largest
local authority in Greater Manchester (previously fifth in 2001). Between 2001 and 2017
Oldham’s population increased by 7% from 218,537 to 233,759. This is a smaller than the
increases seen across Greater Manchester (11.2%) and England (12.5%).
Population Changes across Greater Manchester
2001 Population
(Thousands)
2017 Population
(Thousands)
Percentage
Increase
Manchester 423 546 29.0%
Wigan 301 325 7.7%
Stockport 285 291 2.3%
Bolton 261 285 9.0%
Salford 217 251 15.8%
Trafford 210 235 12.0%
Oldham 219 234 7.0%
Tameside 213 224 5.2%
Rochdale 206 218 5.8%
Bury 181 190 5.0%
Greater Manchester 2,516 2,799 11.2%
England 49,450 55,619 12.5%
Source: ONS 2017 Mid-Year Estimates and Census 2001
Oldham’s population remained static between 2001 and 2003 but since then has increased
year on year. Improved life expectancy has influenced this but the main growth factor is the
increase in Oldham’s South Asian groups due to higher birth rates, and both internal and
international migration.
Source: ONS Mid-Year Estimates 2001-2017
210
215
220
225
230
235
2001 2002 2003 2004 2005 2006 2007 2008 2009 2010 2011 2012 2013 2014 2015 2016 2017
Po
pu
lati
on
(Th
ou
san
ds)
Population of Oldham (Thousands)
Page 8 of 58 Oldham in Profile v2.0 January 2019
Population by Ethnic Group
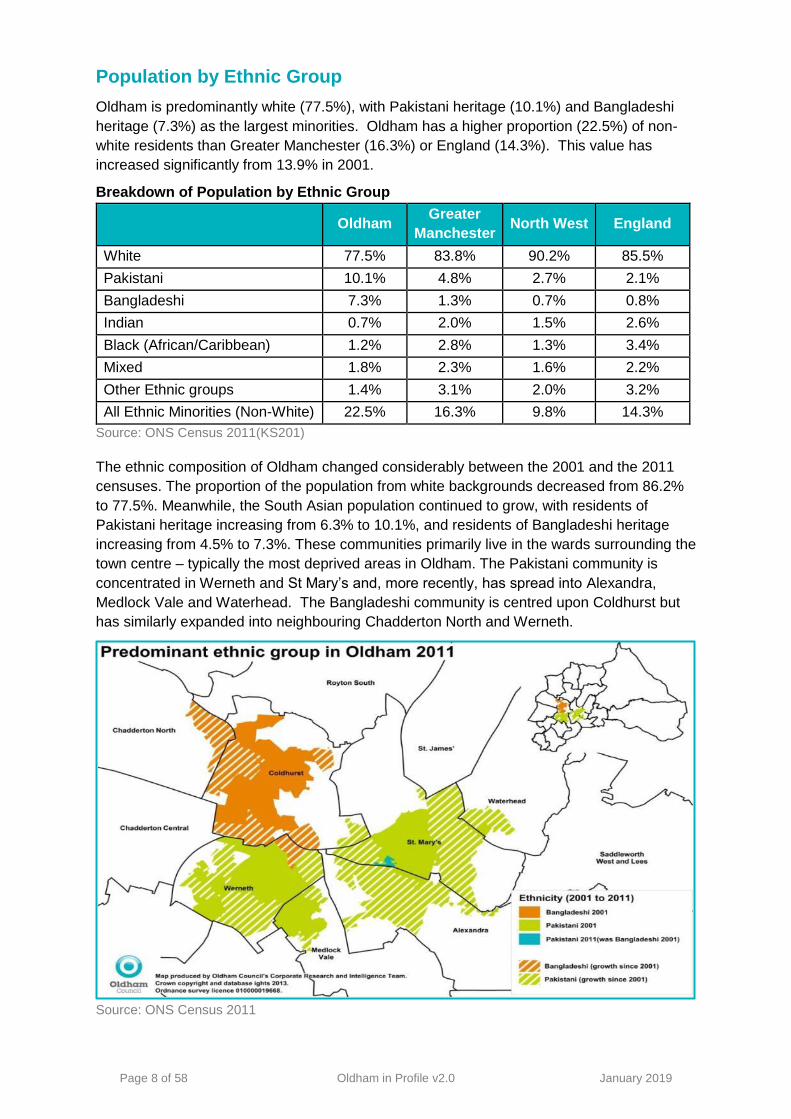
Oldham is predominantly white (77.5%), with Pakistani heritage (10.1%) and Bangladeshi
heritage (7.3%) as the largest minorities. Oldham has a higher proportion (22.5%) of non-
white residents than Greater Manchester (16.3%) or England (14.3%). This value has
increased significantly from 13.9% in 2001.
Breakdown of Population by Ethnic Group
Oldham Greater
Manchester North West England
White 77.5% 83.8% 90.2% 85.5%
Pakistani 10.1% 4.8% 2.7% 2.1%
Bangladeshi 7.3% 1.3% 0.7% 0.8%
Indian 0.7% 2.0% 1.5% 2.6%
Black (African/Caribbean) 1.2% 2.8% 1.3% 3.4%
Mixed 1.8% 2.3% 1.6% 2.2%
Other Ethnic groups 1.4% 3.1% 2.0% 3.2%
All Ethnic Minorities (Non-White) 22.5% 16.3% 9.8% 14.3%
Source: ONS Census 2011(KS201)
The ethnic composition of Oldham changed considerably between the 2001 and the 2011
censuses. The proportion of the population from white backgrounds decreased from 86.2%
to 77.5%. Meanwhile, the South Asian population continued to grow, with residents of
Pakistani heritage increasing from 6.3% to 10.1%, and residents of Bangladeshi heritage
increasing from 4.5% to 7.3%. These communities primarily live in the wards surrounding the
town centre – typically the most deprived areas in Oldham. The Pakistani community is
concentrated in Werneth and St Mary’s and, more recently, has spread into Alexandra,
Medlock Vale and Waterhead. The Bangladeshi community is centred upon Coldhurst but
has similarly expanded into neighbouring Chadderton North and Werneth.
Source: ONS Census 2011

Page 9 of 58 Oldham in Profile v2.0 January 2019
Changes in Ethnic Composition since 2011
The most recent official data on the ethnicity of Oldham’s residents was published in 2011,
but additional localised projections/estimates produced by the Business Intelligence Service
have been used alongside these to examine changes over the past five years.3
These estimates suggest that since 2011 Oldham has become more diverse in terms of
ethnic composition. There has been further growth in the Pakistani and Bangladeshi
communities, in addition to some growth in the white ‘other’ category – a group primarily
made up of Polish and Romanian heritage communities.
Recent Population Change by Ethnic Group
2011 2012 2013 2014 2015 2016 % Change
Since 2011
White British & Irish 171,439 170,261 169,579 169,182 167,731 166,230 -3.0%
White Other 2,887 3,703 4,811 6,037 7,040 7,896 +173.5%
Pakistani 22,686 23,709 24,575 25,394 26,539 27,581 +21.6%
Bangladeshi 16,315 16,943 17,550 18,177 18,989 19,765 +21.1%
Source: Produced by Oldham Council’s Business Intelligence Service, June 2017
Population Pyramids
Oldham Overview
Oldham’s age structure is younger than the England and Wales average. There are higher-
than-average levels of children – especially younger children – and lower than average
numbers of over 75s. This is mainly due to the large South Asian communities, who have a
younger age profile than the white population. This topology suggests that the population of
Oldham will continue to grow, although this will also be dependent on migration patterns.
Source: ONS Census 2011
3 Oldham Ethnic Group Population Estimates, June 2017
Page 10 of 58 Oldham in Profile v2.0 January 2019
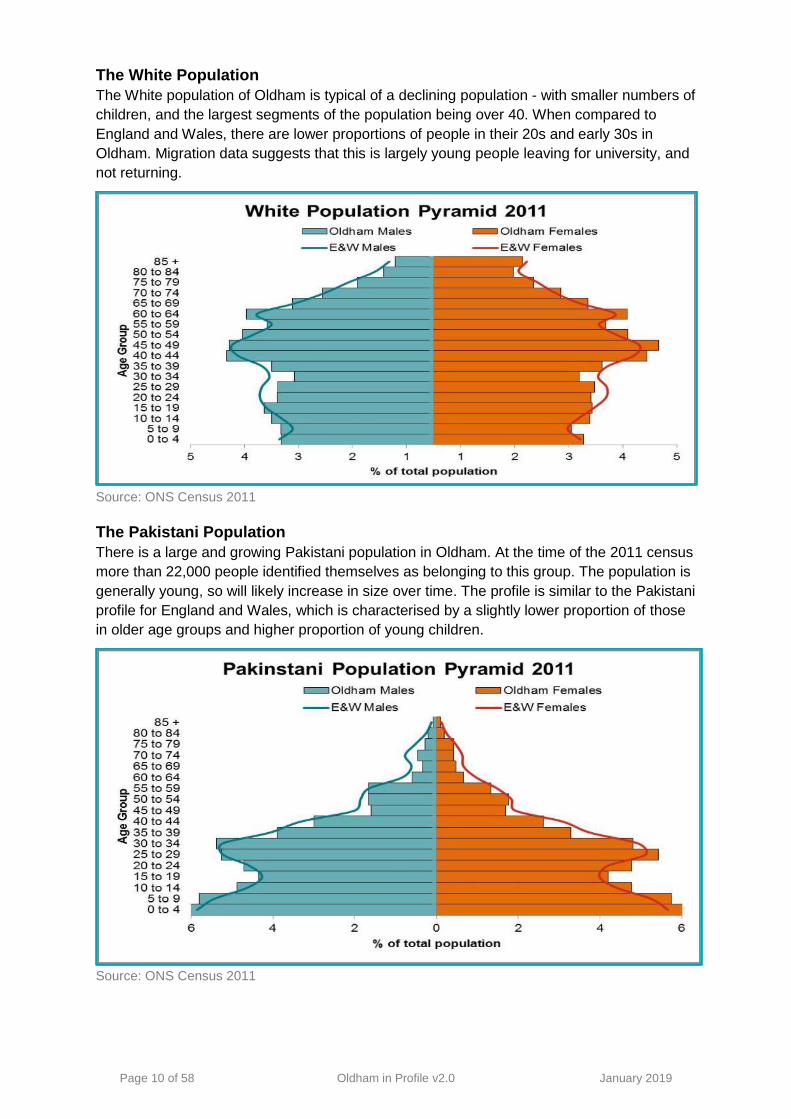
The White Population
The White population of Oldham is typical of a declining population - with smaller numbers of
children, and the largest segments of the population being over 40. When compared to
England and Wales, there are lower proportions of people in their 20s and early 30s in
Oldham. Migration data suggests that this is largely young people leaving for university, and
not returning.
Source: ONS Census 2011
The Pakistani Population
There is a large and growing Pakistani population in Oldham. At the time of the 2011 census
more than 22,000 people identified themselves as belonging to this group. The population is
generally young, so will likely increase in size over time. The profile is similar to the Pakistani
profile for England and Wales, which is characterised by a slightly lower proportion of those
in older age groups and higher proportion of young children.
Source: ONS Census 2011

Page 11 of 58 Oldham in Profile v2.0 January 2019
The Bangladeshi Population
Over 16,000 people identified as Bangladeshi in the 2011 census. The distribution below
shows a heavy weighting in the younger age groups, and this remains true even when
compared with England and Wales’ Bangladeshi profile.
There are notably fewer males than females in Oldham in their 20s and early 30s, which
stands in contrast to figures for England and Wales as a whole.
Source: ONS Census 2011

Page 12 of 58 Oldham in Profile v2.0 January 2019
Age Structure
The age structure of Oldham is relatively youthful with a high proportion of residents aged
under 16 (22.6%) and fewer residents aged over 65 (15.8%). This is compared to the
England averages of 19.1% and 17.9% respectively. Since 2001, the population across
England has aged, with more people aged over 65 and fewer under 16s. This change has
certainly been influenced by an increase in the average life expectancy; however the pattern
is somewhat different across Oldham.
Source: ONS Mid-Year Estimates 2017 and Census 2011
While there is a larger proportion of over 65’s, the proportion of under 16’s has remained
similar. This can be attributed to the growth in Oldham’s Pakistani and Bangladeshi
communities which have a much more youthful age profile and can be seen in the population
pyramids above.
23.0%
22.4%
22.7%
20.0%
19.9%
20.4%
20.2%
18.9%
19.1%
62.7%
62.9%
61.4%
64.1%
65.5%
63.8%
64.0%
64.8%
62.8%
14.3%
14.7%
15.9%
15.8%
14.6%
15.8%
15.9%
16.3%
18.0%
0% 10% 20% 30% 40% 50% 60% 70% 80% 90% 100%
Oldham 2001
Oldham 2011
Oldham 2017
Greater Manchester 2001
Greater Manchester 2011
Greater Manchester 2017
England 2001
England 2011
England 2017
Broad Age Bands
Aged 0 to 15 Aged 16 to 64 Aged 65+

Page 13 of 58 Oldham in Profile v2.0 January 2019
Population Projections
ONS estimates that Oldham’s population will reach 255,200 by 2041. An increase of 9.2%
from the 2017 population4.
Source: ONS Mid-Year Estimates 2017, ONS SNPP 2017, Oldham Council Projections 2016
High birth rates within the Pakistani and Bangladeshi communities, along with internal and
international migration will be major influences in Oldham’s population growth. Meanwhile,
the rise in life expectancy can be attributed to improvements in public health, nutrition, and
medicine. The table below shows that by official figures the proportion of over-65s is set to
rise by 42.0% over the next 17 years.
Population Forecasts by Age Group
Age Band 2017 2025 2033 2041 % Increase
2017-2041
0-14 49,900 51,200 50,000 50,300 0.80%
15-64 146,300 150,200 150,900 152,600 4.31%
65+ 37,300 41,700 48,300 52,400 40.48%
Overall 233,700 242,900 249,200 255,200 9.20%
Source: ONS Sub-National Population Projections
Over the next 24 years, the population of Oldham is expected to increase by 9.2%. The
number of people aged 65+ is expected to increase by 40.48%. However, it is important to
note that ONS’s Mid-Year Estimates and Sub-National Population Projections suffer from a
time-lag in publication, and are not well-equipped to deal with changing immigration patterns.
Concerns have been raised that these figures ignore the town’s young age profile, recent
migration patterns, and NINo registrations. These factors may result in an underestimate of
Oldham’s future population5. The first chart on this page therefore also includes Oldham
council constructed projections, which start with higher growth assumptions.
4 ONS 2016 based Sub-National Population Projections, released 2018 5 Oldham Council’s response to the consultation on 2012-based SNPP for England, February 2014.
200
210
220
230
240
250
260
270
280
20
01
20
03
20
05
20
07
20
09
20
11
20
13
20
15
20
17
20
19
20
21
20
23
20
25
20
27
20
29
20
31
20
33
20
35
20
37
20
39
20
41
Po
pu
lati
on
(Th
ou
san
ds)
Oldham's Population - Estimates and Projections
ONS Mid Year Estimates ONS Population Projections
Oldham Council Projections 2016

Page 14 of 58 Oldham in Profile v2.0 January 2019
Deprivation
Indices of Multiple Deprivations
Levels of deprivation across the borough are generally ranked among the highest in the
country. Relative to other authorities, Oldham’s levels of deprivation have maintained a
steady downward trend since 2004, according to the Indices of Multiple Deprivation. Despite
this, Oldham has managed to maintain its position in terms of employment. 2018 figures are
expected to be released in the summer of 2019.
Historical IMD Scores for Oldham
Domain 2015 Rank
(of 326 LAs)
2010 Rank
(of 326 LAs)
2007 Rank
(of 354 LAs)
2004 Rank
(of 354 LAs)
IMD Score 34 37 42 43
Income Scale 44 44 39 48
Employment Scale 45 48 49 44
Concentration 28 25 23 26
Extent 29 30 34 36
Source: ONS, Department for Communities & Local Government, English Indices of Deprivation
Additional Indices
Additional measures were introduced in 2010 and have been broken down to Local Authority
level for 2015. We have been able to retrospectively calculate comparative ranks for 2010.
Additional IMD Scores for Oldham
Domain 2015 Rank
(of 327 LAs)
2010 Rank
(of 327 LAs)
LSOA’s in bottom 10% nationally 27 32
Income Deprivation Affecting Children Index (IDACI) score 47 50
Income Deprivation Affecting Older People (IDAOPI) score 52 42
Income score 30 34
Employment score 28 32
Education, Skills and Training score 34 30
Health Deprivation and Disability score 31 49
Crime score 51 74
Barriers to Housing and Services score 315 298
Living Environment Score 129 48
Source: ONS, Department for Communities & Local Government, English indices of deprivation
The borough’s ‘Living Environment’ and ‘Barriers to Housing & Services’ scores have both
shown improvements since 2010 with the latter representing an excellent level of provision
for vulnerable people within Oldham.
Other scores are in line with the town’s overall IMD rank and have shown only marginal
gains or losses relative to other authorities over the past five years. Comparatively, Oldham
appears to include a high proportion of heavily-deprived areas as well as many with poor
employment and low income levels.

Page 15 of 58 Oldham in Profile v2.0 January 2019
Areas of High Deprivation
Source: ONS, Department for Communities & Local Government, English indices of deprivation 2015
Oldham currently has four areas within the borough which are among the top 1% of the
nation’s most deprived areas. The majority of these areas are centred in and around the
town centre, particularly within the wards of St Mary’s, Coldhurst and Alexandra. Only the
wards of Crompton, Saddleworth North and Saddleworth South do not contain any areas
that fall within the nation’s top 20% most deprived.

Page 16 of 58 Oldham in Profile v2.0 January 2019
Economy
Overview
Oldham’s economy was historically built upon manufacturing, chiefly within textiles and
mechanical engineering. Like many other former industrial towns across the UK, Oldham’s
economy experienced large scale deindustrialisation and as a result has undergone
significant economic restructuring.
Oldham is currently home to around 6,240 businesses6 employing roughly 81,000 people7.
Oldham’s business base is primarily made up of small- or medium-size enterprises (fewer
than 50 and 250 employees respectively), and over time has become more reliant on public
sector employment, particularly within the Local Authority and NHS which together provide
more than 20% of jobs in the district. Oldham’s economy still remains over-dependent upon
relatively low-skilled and low-wage enterprise. Over the last decade, new jobs have been
created, but the majority of these have been low value service or health occupations.
The arrival of Metrolink has significantly improved transport connectivity within the borough.
It has increased the appeal of Oldham to skilled and higher-earning commuters and has
linked residents in many areas historically poorly-served by public transport with
employment, retail and leisure destinations throughout the conurbation.
6 Source: ONS – Inter Departmental Business Register 2016 7 Source: ONS – Business Register and Employment Survey 2015
Challenges and Opportunities
Attract New Businesses – Improving business survival rates alongside
increased start-up rates is a key requirement in increasing private sector
employment in Oldham, offsetting the dominance of public sector
employment.
Improve Skills Base – Oldham has historically had a weak skills base – a
legacy of generations of manual employment. This has made it difficult for
Oldham to attract the inward investment that it is looking for to improve its own
economic base and act as a labour market for the rest of Greater Manchester.
Increased Wages – Oldham has traditionally had low wage levels in terms of
residents and work place earning potential (as measured by median weekly
wage levels).This is likely a reflection on the industry mix within Oldham and
the relative skill levels of the local workforce.
Increased Public Transport Connectivity – Transport connectivity has
improved across Oldham since the arrival of Metrolink. However, some areas
remain isolated in terms of regular, reliable public transportation, limiting some
communities economically and socially.
Page 17 of 58 Oldham in Profile v2.0 January 2019
Businesses in Oldham
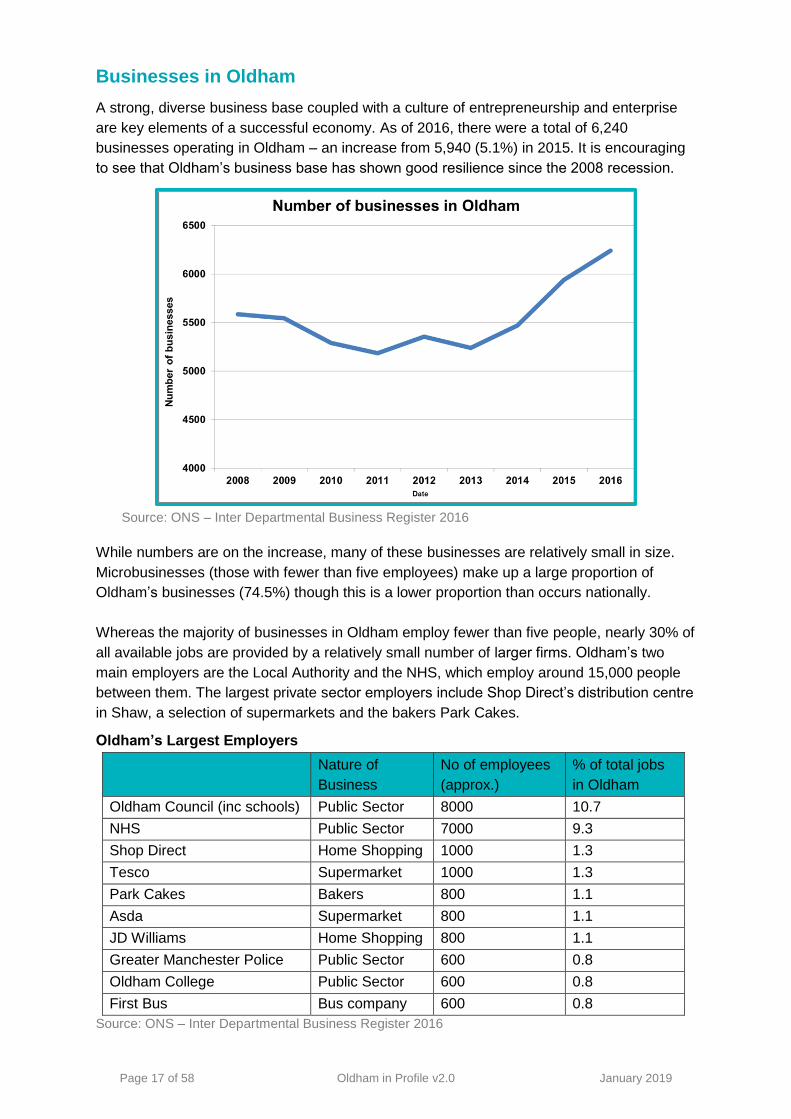
A strong, diverse business base coupled with a culture of entrepreneurship and enterprise
are key elements of a successful economy. As of 2016, there were a total of 6,240
businesses operating in Oldham – an increase from 5,940 (5.1%) in 2015. It is encouraging
to see that Oldham’s business base has shown good resilience since the 2008 recession.
Source: ONS – Inter Departmental Business Register 2016
While numbers are on the increase, many of these businesses are relatively small in size.
Microbusinesses (those with fewer than five employees) make up a large proportion of
Oldham’s businesses (74.5%) though this is a lower proportion than occurs nationally.
Whereas the majority of businesses in Oldham employ fewer than five people, nearly 30% of
all available jobs are provided by a relatively small number of larger firms. Oldham’s two
main employers are the Local Authority and the NHS, which employ around 15,000 people
between them. The largest private sector employers include Shop Direct’s distribution centre
in Shaw, a selection of supermarkets and the bakers Park Cakes.
Oldham’s Largest Employers
Nature of
Business
No of employees
(approx.)
% of total jobs
in Oldham
Oldham Council (inc schools) Public Sector 8000 10.7
NHS Public Sector 7000 9.3
Shop Direct Home Shopping 1000 1.3
Tesco Supermarket 1000 1.3
Park Cakes Bakers 800 1.1
Asda Supermarket 800 1.1
JD Williams Home Shopping 800 1.1
Greater Manchester Police Public Sector 600 0.8
Oldham College Public Sector 600 0.8
First Bus Bus company 600 0.8
Source: ONS – Inter Departmental Business Register 2016
Page 18 of 58 Oldham in Profile v2.0 January 2019
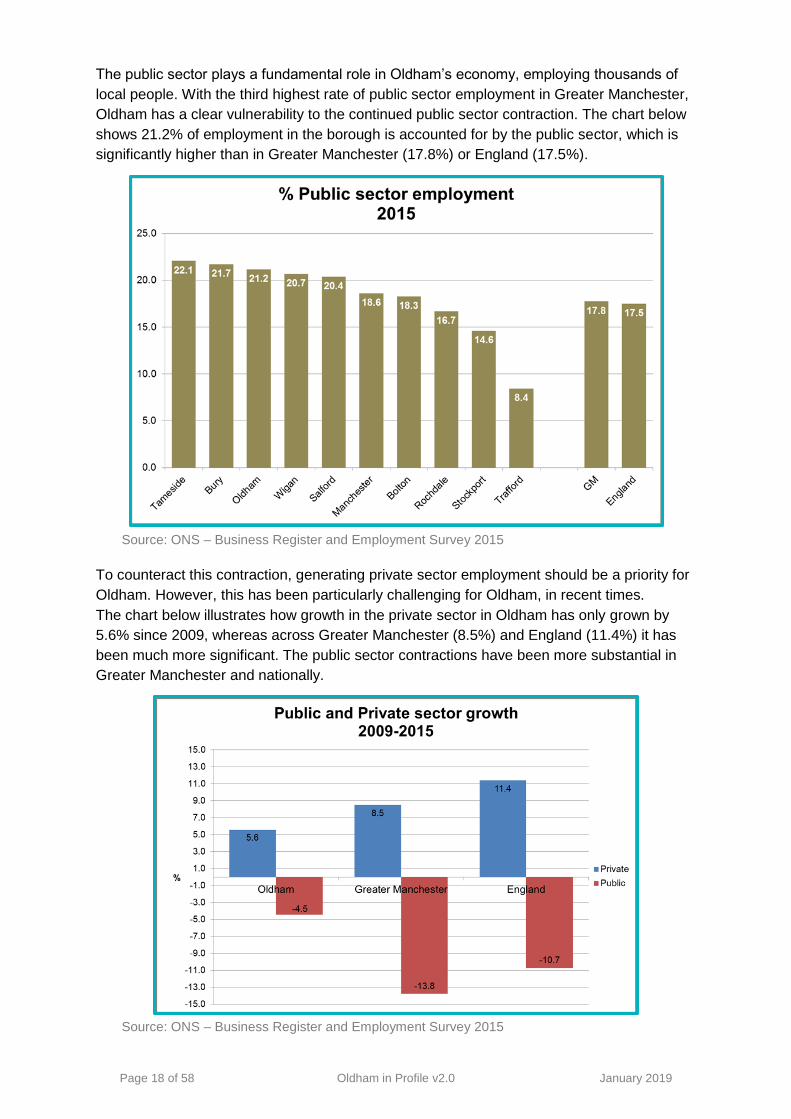
The public sector plays a fundamental role in Oldham’s economy, employing thousands of
local people. With the third highest rate of public sector employment in Greater Manchester,
Oldham has a clear vulnerability to the continued public sector contraction. The chart below
shows 21.2% of employment in the borough is accounted for by the public sector, which is
significantly higher than in Greater Manchester (17.8%) or England (17.5%).
Source: ONS – Business Register and Employment Survey 2015
To counteract this contraction, generating private sector employment should be a priority for
Oldham. However, this has been particularly challenging for Oldham, in recent times.
The chart below illustrates how growth in the private sector in Oldham has only grown by
5.6% since 2009, whereas across Greater Manchester (8.5%) and England (11.4%) it has
been much more significant. The public sector contractions have been more substantial in
Greater Manchester and nationally.
Source: ONS – Business Register and Employment Survey 2015
Page 19 of 58 Oldham in Profile v2.0 January 2019
Employment
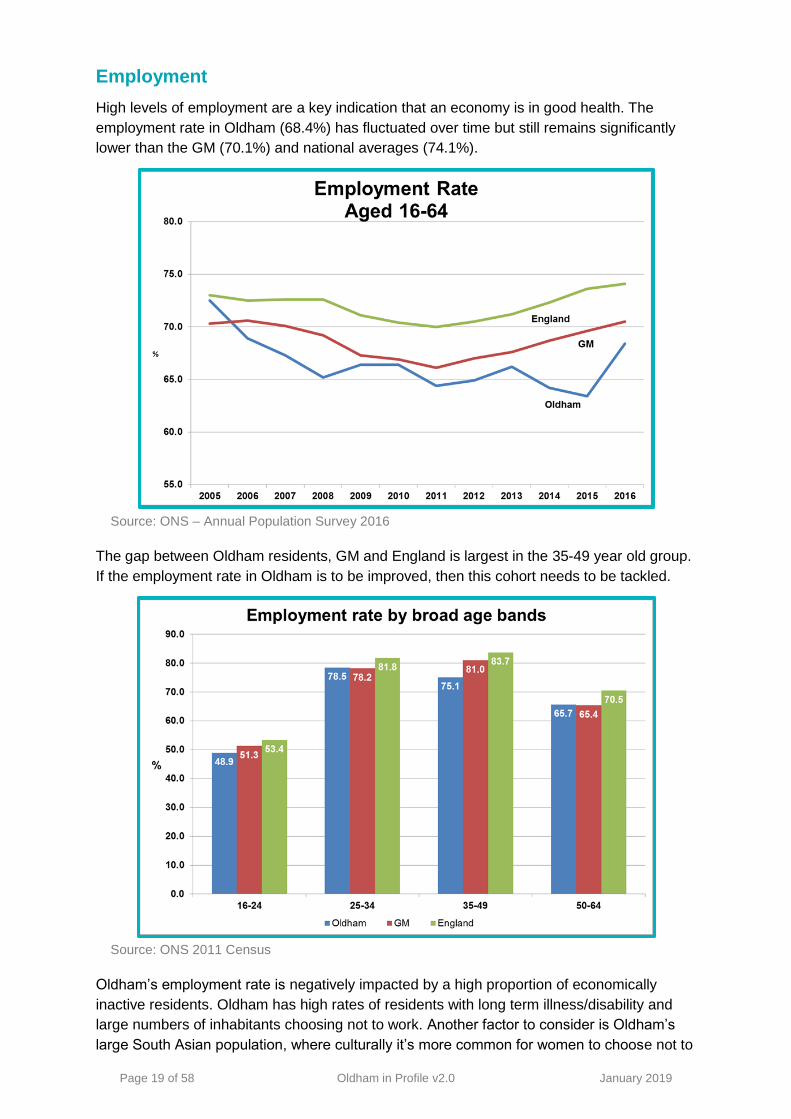
High levels of employment are a key indication that an economy is in good health. The
employment rate in Oldham (68.4%) has fluctuated over time but still remains significantly
lower than the GM (70.1%) and national averages (74.1%).
Source: ONS – Annual Population Survey 2016
The gap between Oldham residents, GM and England is largest in the 35-49 year old group.
If the employment rate in Oldham is to be improved, then this cohort needs to be tackled.
Source: ONS 2011 Census
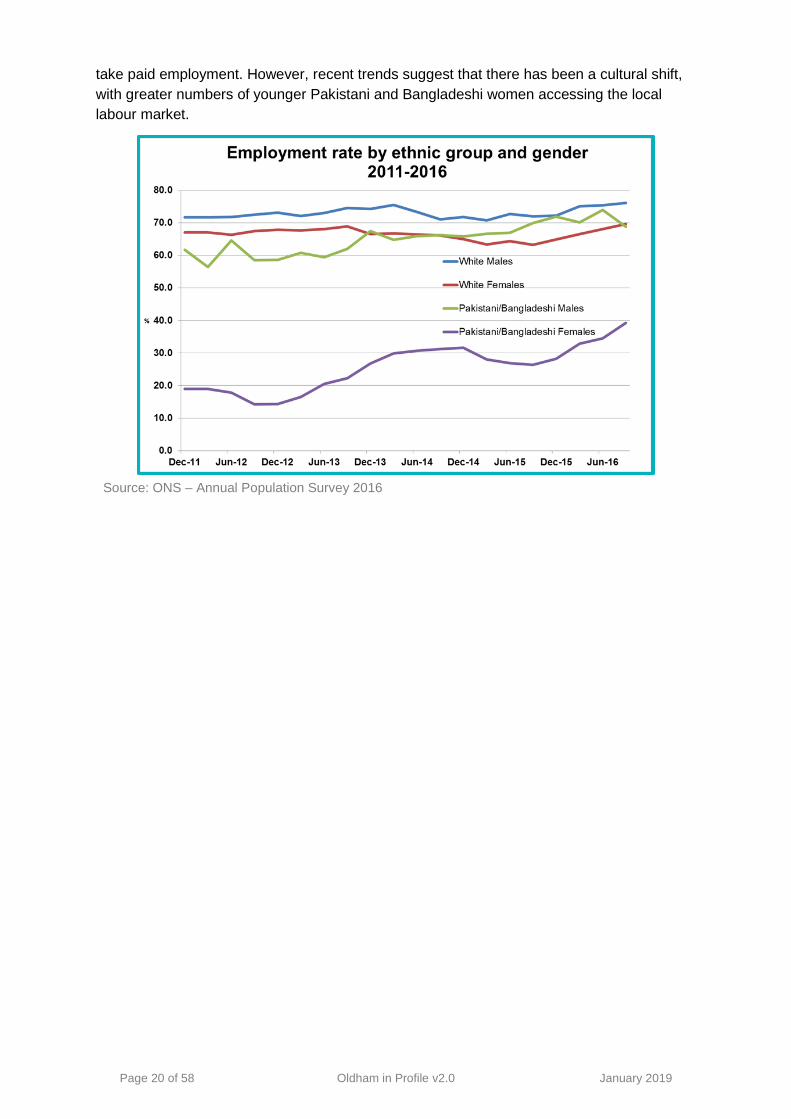
Oldham’s employment rate is negatively impacted by a high proportion of economically
inactive residents. Oldham has high rates of residents with long term illness/disability and
large numbers of inhabitants choosing not to work. Another factor to consider is Oldham’s
large South Asian population, where culturally it’s more common for women to choose not to
Page 20 of 58 Oldham in Profile v2.0 January 2019
take paid employment. However, recent trends suggest that there has been a cultural shift,
with greater numbers of younger Pakistani and Bangladeshi women accessing the local
labour market.
Source: ONS – Annual Population Survey 2016
Page 21 of 58 Oldham in Profile v2.0 January 2019
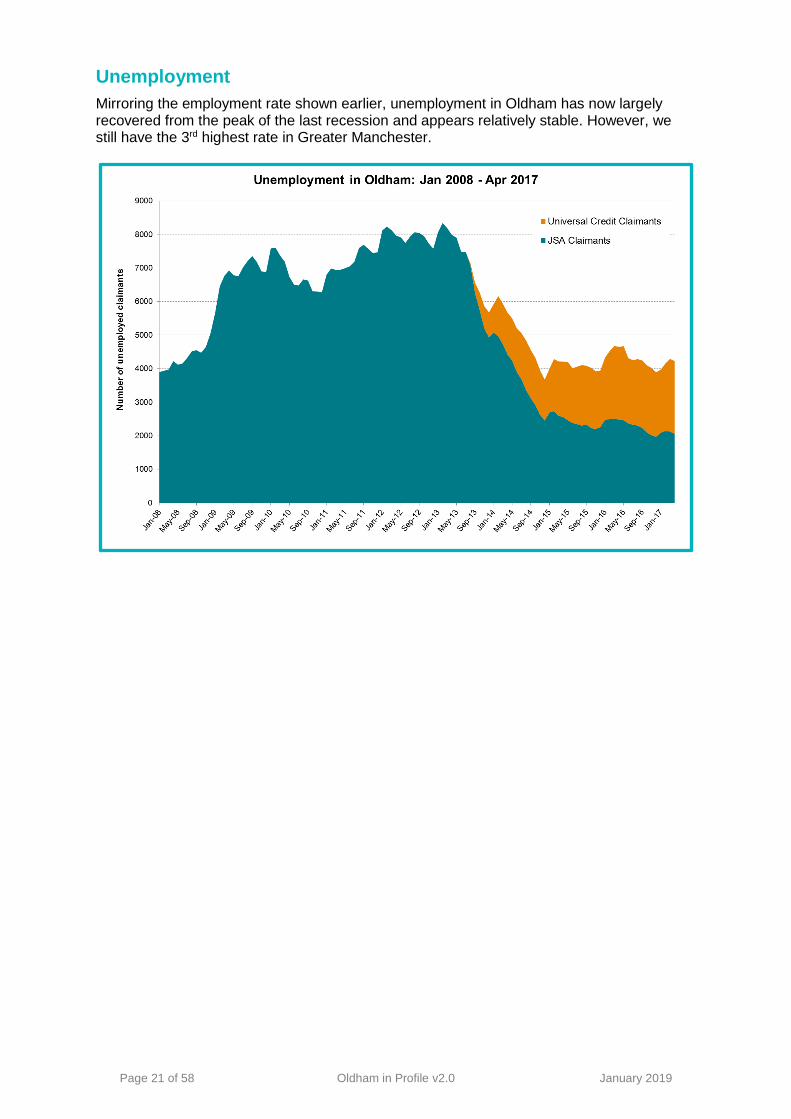
Unemployment
Mirroring the employment rate shown earlier, unemployment in Oldham has now largely recovered from the peak of the last recession and appears relatively stable. However, we still have the 3rd highest rate in Greater Manchester.
Page 22 of 58 Oldham in Profile v2.0 January 2019
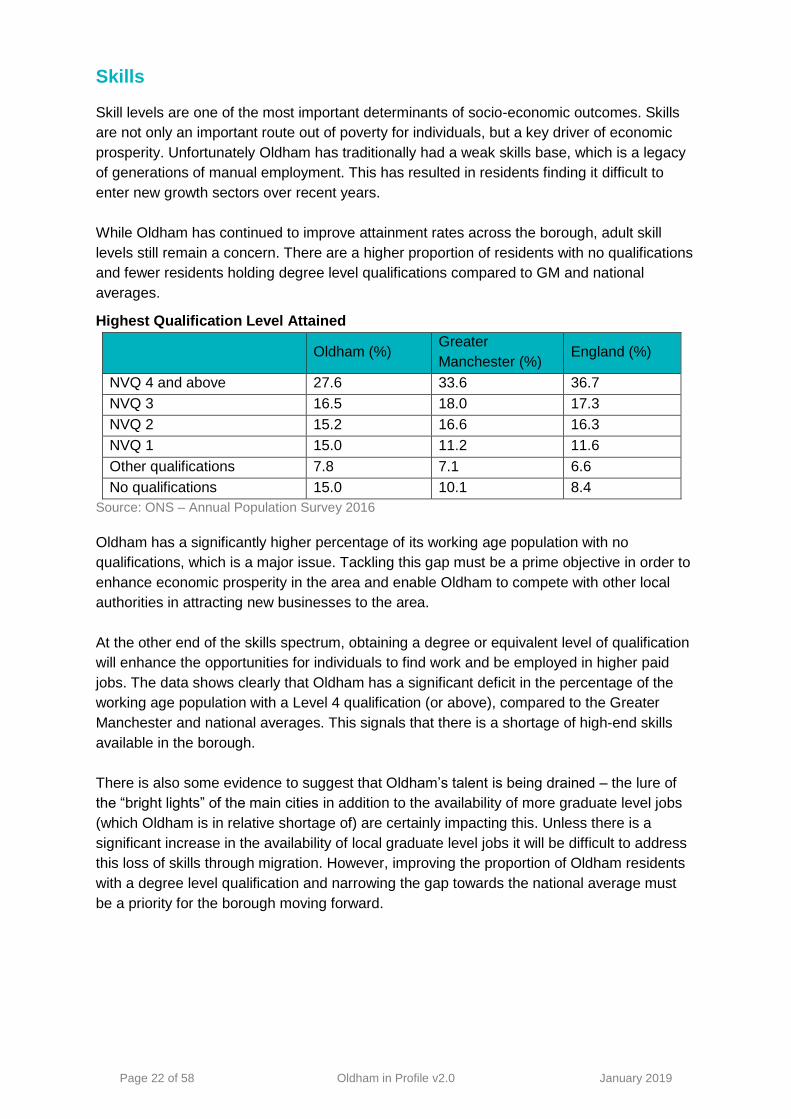
Skills Skill levels are one of the most important determinants of socio-economic outcomes. Skills
are not only an important route out of poverty for individuals, but a key driver of economic
prosperity. Unfortunately Oldham has traditionally had a weak skills base, which is a legacy
of generations of manual employment. This has resulted in residents finding it difficult to
enter new growth sectors over recent years.
While Oldham has continued to improve attainment rates across the borough, adult skill
levels still remain a concern. There are a higher proportion of residents with no qualifications
and fewer residents holding degree level qualifications compared to GM and national
averages.
Highest Qualification Level Attained
Oldham (%)
Greater
Manchester (%) England (%)
NVQ 4 and above 27.6 33.6 36.7
NVQ 3 16.5 18.0 17.3
NVQ 2 15.2 16.6 16.3
NVQ 1 15.0 11.2 11.6
Other qualifications 7.8 7.1 6.6
No qualifications 15.0 10.1 8.4
Source: ONS – Annual Population Survey 2016
Oldham has a significantly higher percentage of its working age population with no
qualifications, which is a major issue. Tackling this gap must be a prime objective in order to
enhance economic prosperity in the area and enable Oldham to compete with other local
authorities in attracting new businesses to the area.
At the other end of the skills spectrum, obtaining a degree or equivalent level of qualification
will enhance the opportunities for individuals to find work and be employed in higher paid
jobs. The data shows clearly that Oldham has a significant deficit in the percentage of the
working age population with a Level 4 qualification (or above), compared to the Greater
Manchester and national averages. This signals that there is a shortage of high-end skills
available in the borough.
There is also some evidence to suggest that Oldham’s talent is being drained – the lure of
the “bright lights” of the main cities in addition to the availability of more graduate level jobs
(which Oldham is in relative shortage of) are certainly impacting this. Unless there is a
significant increase in the availability of local graduate level jobs it will be difficult to address
this loss of skills through migration. However, improving the proportion of Oldham residents
with a degree level qualification and narrowing the gap towards the national average must
be a priority for the borough moving forward.
Page 23 of 58 Oldham in Profile v2.0 January 2019
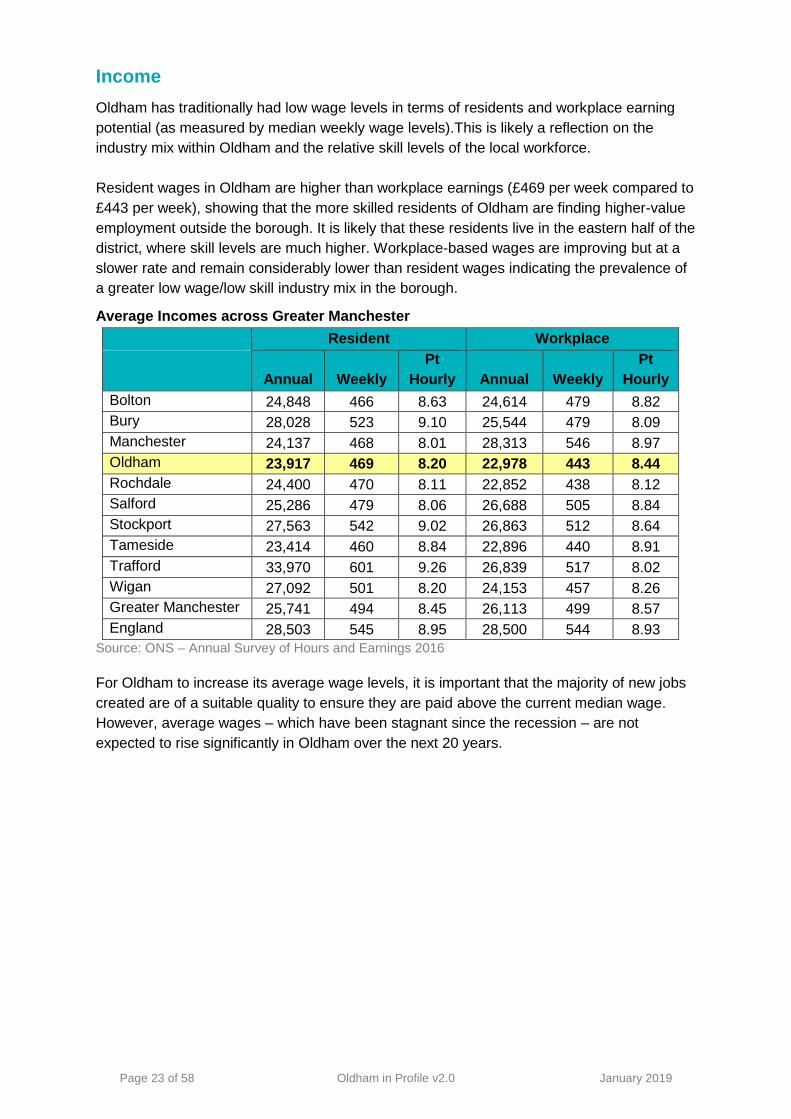
Income
Oldham has traditionally had low wage levels in terms of residents and workplace earning
potential (as measured by median weekly wage levels).This is likely a reflection on the
industry mix within Oldham and the relative skill levels of the local workforce.
Resident wages in Oldham are higher than workplace earnings (£469 per week compared to
£443 per week), showing that the more skilled residents of Oldham are finding higher-value
employment outside the borough. It is likely that these residents live in the eastern half of the
district, where skill levels are much higher. Workplace-based wages are improving but at a
slower rate and remain considerably lower than resident wages indicating the prevalence of
a greater low wage/low skill industry mix in the borough.
Average Incomes across Greater Manchester
Resident Workplace
Annual Weekly
Pt
Hourly Annual Weekly
Pt
Hourly
Bolton 24,848 466 8.63 24,614 479 8.82
Bury 28,028 523 9.10 25,544 479 8.09
Manchester 24,137 468 8.01 28,313 546 8.97
Oldham 23,917 469 8.20 22,978 443 8.44
Rochdale 24,400 470 8.11 22,852 438 8.12
Salford 25,286 479 8.06 26,688 505 8.84
Stockport 27,563 542 9.02 26,863 512 8.64
Tameside 23,414 460 8.84 22,896 440 8.91
Trafford 33,970 601 9.26 26,839 517 8.02
Wigan 27,092 501 8.20 24,153 457 8.26
Greater Manchester 25,741 494 8.45 26,113 499 8.57
England 28,503 545 8.95 28,500 544 8.93
Source: ONS – Annual Survey of Hours and Earnings 2016
For Oldham to increase its average wage levels, it is important that the majority of new jobs
created are of a suitable quality to ensure they are paid above the current median wage.
However, average wages – which have been stagnant since the recession – are not
expected to rise significantly in Oldham over the next 20 years.

Page 24 of 58 Oldham in Profile v2.0 January 2019
Transport Connectivity
High-quality transport and digital connectivity infrastructure are essential for successful,
sustainable economic growth in Oldham. The arrival of the Metrolink has greatly improved
connectivity with Manchester, Rochdale and beyond. However, some areas (eg Sholver,
Diggle) are still socially/economically isolated for those without cars, and some areas of
potential employment (eg Stakehill) are still difficult to reach for those without work.
Metrolink has increased the appeal of the borough to skilled and higher-earning commuters
and links residents in areas historically poorly-served by public transport with employment,
retail and leisure destinations. The number of passengers who start or finish their journey in
Oldham has climbed since the line opened in January 2013 despite seasonal factors.

Page 25 of 58 Oldham in Profile v2.0 January 2019
Health & Well-being
Overview In general, Oldham’s residents have worse health than England’s average: life expectancy in
Oldham is more than two years less than England as a whole. There are strong links
between deprivation and poor health, and high levels of deprivation in the borough have a
significant impact on health outcomes.
There are also significant social inequalities within Oldham. As an example, 40% of the
people living in Coldhurst belong to an income-deprived household - this is only around 5%
in Saddleworth South. This leads to health inequalities. Indeed, the difference in life
expectancy between the most and the least deprived wards is over 7 years. Reducing social
inequality within the borough is therefore a key priority in improving the Oldham’s Health.
Between 2011-2013 and 2014-2016, life expectancy continued to increase in the North West
and England, as it has done for many years. However, during this period, life expectancy fell
for both Males and Females in Oldham (by 0.5 years for males, and 0.71 years for females).
Challenges and Opportunities
Best Start in Life - Giving every child the best start in life, through accessible
services which are designed to reduce health inequalities, is a key challenge and
priority within Oldham. Oldham’s breastfeeding rate at 6-8 weeks remains below
the England average, with wide variations in rates across Oldham wards. The
highest rate is in Saddleworth South, and the lowest rate is in Royton North.
Immunisation rates are good, but the proportion of children that are school-ready
is far lower than it should be.
Oral Health - Oldham’s rate of tooth decay in children aged five has improved
markedly in recent years, but is still behind the national average. Tooth decay
can result in additional problems such as: pain, sleep loss, time off school and,
in some cases, dental treatment requiring general anaesthetic.
Smoking - Adult smoking rates in Oldham are high overall – and slightly above
the national average. Again, this includes significant variations between areas.
Rates of smoking amongst young people, however, are relatively low, and
linking with “Best Start in Life” and the “GM Making Smoking History”
programme, this may represent an opportunity for positive change.
Healthy Weight - The percentage of overweight children in year 6 classes (10-11
years) in Oldham is generally higher than the national average. In adults, physical
activity levels and the percentage of the population eating the recommended five
portions of fruit and veg a day, is broadly lower than national. The proportion of
adults of excess weight is higher than national, and there is an increasing rate of
diabetes. There are opportunities in place to improve participation in physical
activity and healthy eating in Oldham - through access to parks and greenspaces,
the Growing Oldham and Feeding Ambition programmes, the GM Moving Plan
and Daily Mile, and Sport England’s LDP scheme.
Page 26 of 58 Oldham in Profile v2.0 January 2019
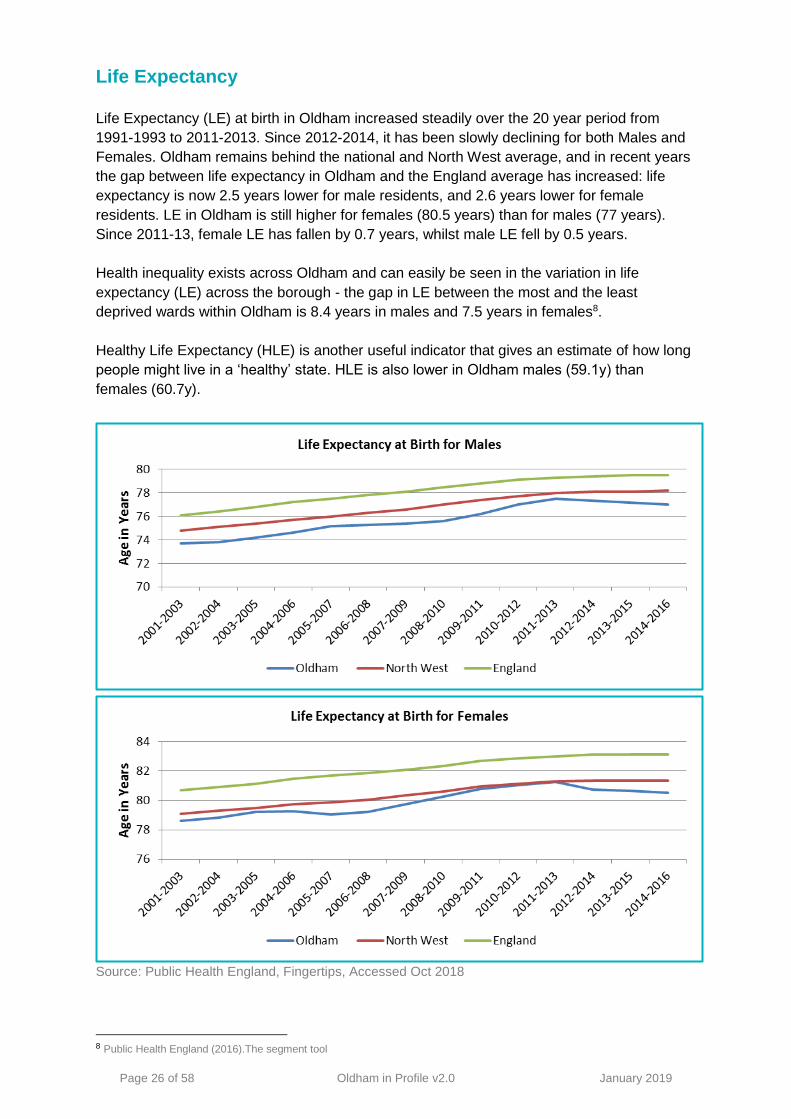
Life Expectancy
Life Expectancy (LE) at birth in Oldham increased steadily over the 20 year period from
1991-1993 to 2011-2013. Since 2012-2014, it has been slowly declining for both Males and
Females. Oldham remains behind the national and North West average, and in recent years
the gap between life expectancy in Oldham and the England average has increased: life
expectancy is now 2.5 years lower for male residents, and 2.6 years lower for female
residents. LE in Oldham is still higher for females (80.5 years) than for males (77 years).
Since 2011-13, female LE has fallen by 0.7 years, whilst male LE fell by 0.5 years.
Health inequality exists across Oldham and can easily be seen in the variation in life
expectancy (LE) across the borough - the gap in LE between the most and the least
deprived wards within Oldham is 8.4 years in males and 7.5 years in females8.
Healthy Life Expectancy (HLE) is another useful indicator that gives an estimate of how long
people might live in a ‘healthy’ state. HLE is also lower in Oldham males (59.1y) than
females (60.7y).
Source: Public Health England, Fingertips, Accessed Oct 2018
8 Public Health England (2016).The segment tool

Page 27 of 58 Oldham in Profile v2.0 January 2019
Children and Young People’s Health & Lifestyle
Oldham lags behind national averages on a number of health indicators, including
breastfeeding, dental decay, and hospital admissions for asthma and injuries. There is a
strong link between these issues and deprivation. Child poverty in Oldham affects 21.6%
of the borough’s children – well above the England average of 16.8%. This rate varies
drastically across Oldham’s Wards. Using the After Housing Costs measure, Coldhurst has
62.1% of children living in poverty. This is just 8.2% in Saddleworth South9.
Rates of infant mortality (under 1 year old) are higher than national levels (6.2 per 1,000 for
Oldham, 3.9 per 1,000 for England). This varies considerably within the borough, with the
rate in Werneth being significantly higher than the Oldham average. Childhood mortality (0-
17 years) in Oldham is also appreciably higher than the England and Manchester averages.
There is a general improvement in the rate of immunisations, with better-than-national rates
for two-year-olds receiving their first MMR vaccine, as well as immunisations for Diphtheria,
Polio, and Meningitis C. School readiness is low: In 2016/17, 36.3% of reception age
children had not achieved a good level of development, compared to 29.3% nationally.
Oldham performs well regarding young homelessness. However, this figure only reflects
young people formally accepted as homeless, and offered a home. Research by Centre
Point10 suggests that nationally, this figure should be higher due to the “Hidden Homeless”.
Source: Public Health England, Fingertips, Accessed Oct 2018
Breastfeeding
Breastfeeding in Oldham is currently significantly below the national average. 2016/17
figures show 66.6% of mothers breastfeed at initiation (compared to 74.5% nationally)11.
Oldham’s breastfeeding rate at 6-8 weeks remains below the England average. The data for
2017/18 for Oldham shows that 38.4% of mothers are breastfeeding at 6-8 weeks, compared
to 44.4% for England. There is a wide variation in breastfeeding rates across Oldham wards
in 2017/18. Only Werneth, Saddleworth North, Coldhurst, and Saddleworth South have rates
higher than the national average. At 60%, Saddleworth South has over triple the rate of
9 http://www.endchildpoverty.org.uk 8 https://centrepoint.org.uk/youth-homelessness/ 9 PHE Health Profiles

Page 28 of 58 Oldham in Profile v2.0 January 2019
Royton North, which has a rate of just 18.8%12. Rates are broadly higher in wards with less
deprivation and/or high South Asian populations, in line with national trends.
Obesity
Obesity is measured in Reception and Year 6. Oldham broadly tracks national rates in both.
Recent figures13 show that rates of obesity in Oldham’s most obese wards is almost double
that of Oldham’s least obese wards. In reception, Saddleworth South has the lowest rate in
2016/7 with 6.9%, whilst Hollinwood has the highest with 12.1%. In Year 6, Saddleworth
South again has the lowest with 14.9%, whilst Coldhurst has the highest with 25.7%.
Source: Public Health England, Fingertips, Accessed Oct 2018
Tooth Decay
Historically, Oldham has a disproportionately high level of five year olds with teeth that are
Decayed, Missing or with Fillings. This has dropped from 51% in 2014/15, to 35% in 2016/7.
This takes Oldham from the worst in Greater Manchester in 2014/15, to the 4th best in
2016/17. The highest rates of dental decay in 5 year olds were seen in Hollinwood (83%)
and St James' (73%). Only Saddleworth North (18%) and Saddleworth South (19%) had
rates of dental decay lower than England’s average. Generally, as deprivation increases,
rates of tooth decay also increase - within both Oldham and England.
12 Bridgewater Community Healthcare NHS Trust 11 https://reports.esd.org.uk/table

Page 29 of 58 Oldham in Profile v2.0 January 2019
Hospital Admissions due to Injuries in Children
Source: Public Health England, Fingertips, Accessed Oct 2018
This figure is consistently higher than the national average, with Oldham having the second
highest rate of hospital admissions caused by unintentional and deliberate injuries in children
aged 0-4 years in the country (16/17 data) (PHE Fingertips indicator 2.07i).
Mental Health and Wellbeing
According to the Mental Health Foundation, nearly one in ten children and young people
aged 5-16 years are affected by a mental health problem. Oldham is estimated to have a
prevalence of 10%. However, emergency admission rates for intentional self-harm in
Oldham are average or better than average for all measures across all ages.14
Sexual Health and Teenage Pregnancy
Oldham has higher than national average rates of chlamydia screening and HPV vaccination
in young people. Regarding new STI diagnoses, Oldham has less than the national average.
Teenage conception rates (per 1000) have declined between 1998 and 2016 from 46.6 to
18.8 at a national level, and from 66.1 to 26.9 in Oldham. However, the rate rose in Oldham
in 2016, and is now above that of our statistical neighbours
Source: Public Health England, Fingertips, Accessed Oct 2018
14 https://fingertips.phe.org.uk/profile/health-profiles/data#page/0/gid/1938132696/pat/6/par/E12000002/ati/102/are/E08000004
Page 30 of 58 Oldham in Profile v2.0 January 2019
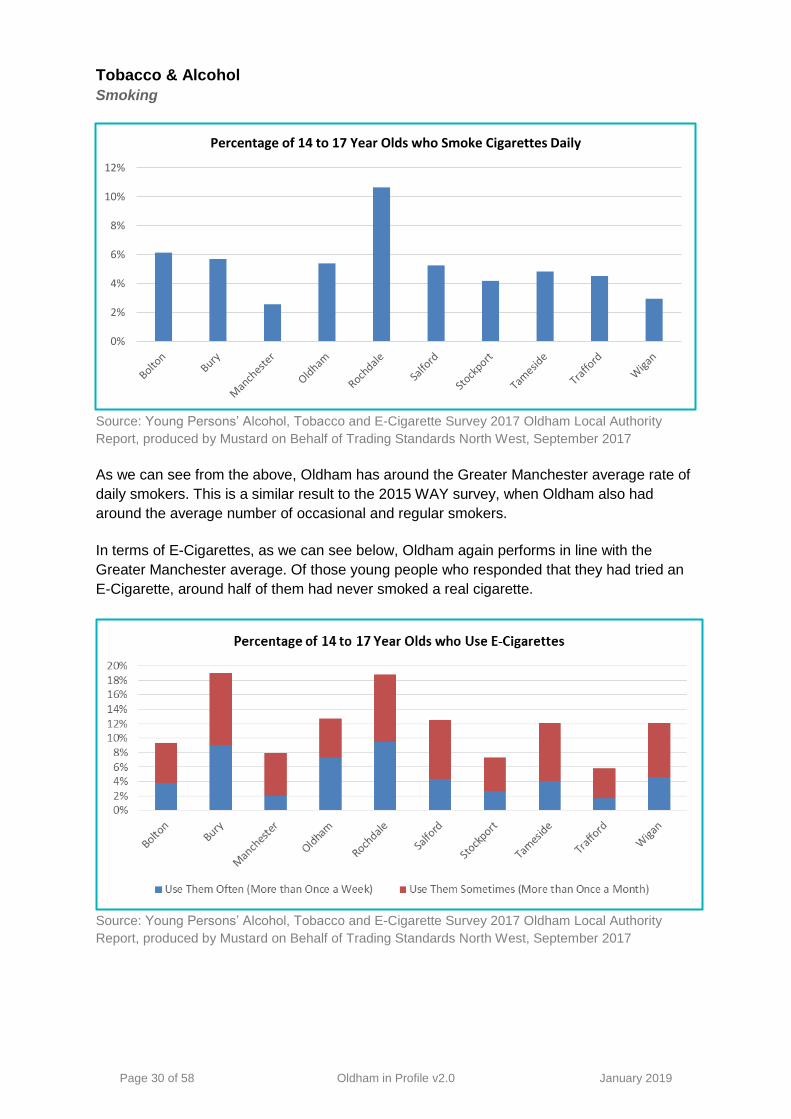
Tobacco & Alcohol
Smoking
Source: Young Persons’ Alcohol, Tobacco and E-Cigarette Survey 2017 Oldham Local Authority
Report, produced by Mustard on Behalf of Trading Standards North West, September 2017
As we can see from the above, Oldham has around the Greater Manchester average rate of
daily smokers. This is a similar result to the 2015 WAY survey, when Oldham also had
around the average number of occasional and regular smokers.
In terms of E-Cigarettes, as we can see below, Oldham again performs in line with the
Greater Manchester average. Of those young people who responded that they had tried an
E-Cigarette, around half of them had never smoked a real cigarette.
Source: Young Persons’ Alcohol, Tobacco and E-Cigarette Survey 2017 Oldham Local Authority
Report, produced by Mustard on Behalf of Trading Standards North West, September 2017
0%
2%
4%
6%
8%
10%
12%
Percentage of 14 to 17 Year Olds who Smoke Cigarettes Daily
Page 31 of 58 Oldham in Profile v2.0 January 2019
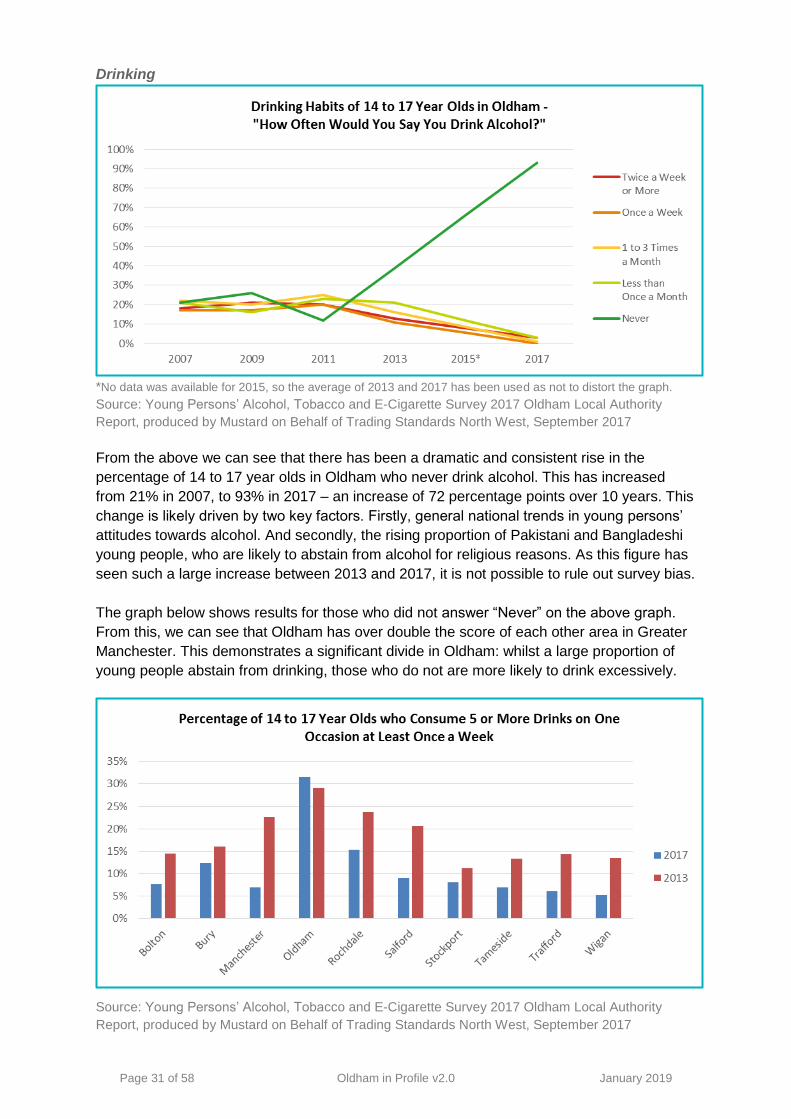
Drinking
*No data was available for 2015, so the average of 2013 and 2017 has been used as not to distort the graph.
Source: Young Persons’ Alcohol, Tobacco and E-Cigarette Survey 2017 Oldham Local Authority
Report, produced by Mustard on Behalf of Trading Standards North West, September 2017
From the above we can see that there has been a dramatic and consistent rise in the
percentage of 14 to 17 year olds in Oldham who never drink alcohol. This has increased
from 21% in 2007, to 93% in 2017 – an increase of 72 percentage points over 10 years. This
change is likely driven by two key factors. Firstly, general national trends in young persons’
attitudes towards alcohol. And secondly, the rising proportion of Pakistani and Bangladeshi
young people, who are likely to abstain from alcohol for religious reasons. As this figure has
seen such a large increase between 2013 and 2017, it is not possible to rule out survey bias.
The graph below shows results for those who did not answer “Never” on the above graph.
From this, we can see that Oldham has over double the score of each other area in Greater
Manchester. This demonstrates a significant divide in Oldham: whilst a large proportion of
young people abstain from drinking, those who do not are more likely to drink excessively.
Source: Young Persons’ Alcohol, Tobacco and E-Cigarette Survey 2017 Oldham Local Authority
Report, produced by Mustard on Behalf of Trading Standards North West, September 2017
Page 32 of 58 Oldham in Profile v2.0 January 2019
Adults’ Health & Lifestyle
Oldham faces a number of significant health challenges and performance is currently below
the national average in a number of health indicators. Deprivation is particularly strongly
associated with poor health outcomes.
Lifestyle Factors
Obesity
An estimate for the percentage of adults classified as obese or overweight in Oldham in
2016/17 (66.4%)15 suggests that we performed worse than the national average for the
same time period (61.3%). This means that Oldham is ranked 4th worst in Greater
Manchester.
Participation in Physical Activity
Sport England’s Active Lives survey records the number of adults achieving various levels of
exercise. The number of “Active” adults (those achieving at least 150 minutes of physical
activity per week) in Oldham is 56.6% for 2017/18. This is lower than the England average of
62.3%16. Oldham also has a higher proportion of “Inactive” adults (those achieving less than
30 mins exercise per week), with 30.0% in Oldham comparing to 25.2% nationally.
Average Consumption of Fruits and Vegetables
According to Public Health England, Oldham’s residents eat fewer daily portions of fruits
(2.53) and vegetables (2.41) than the national average (2.65, and 2.7, respectively).
Alcohol
Oldham had significantly more admission episodes for alcohol-related conditions (Broad
definition) (2,535) and alcohol specific conditions (722) per 100,000 DSR, than national
levels (2,185 and 563 respectively), in 2017. Oldham also had higher alcohol related
mortality (56.3) and alcohol specific mortality (15.9) than England (46.0 and 10.4
respectively), in 2016.
Tobacco
Smoking remains the leading cause of preventable deaths, attributed to almost 80,000
deaths in Great Britain in 2013. In 2017 16.6% of adults in Oldham smoked, significantly
higher than the England average of 14.9%17.
Smoking in pregnancy is on a downward trend in Oldham, but rates have remained
consistently higher than nationally. In 2016/17, 13.3% of women in Oldham smoked at the
time of delivery, more than the England average of 10.7%. Across Oldham wards, rates
varied between Hollinwood at 35.2% and Saddleworth South at 1.9%. Alexandra,
Hollinwood, and St James’ all had rates significantly higher than the Oldham average.
Substance Misuse
In 2015 to 2017, for number of deaths related to drug misuse (by age-standardised mortality
rate), Oldham had a rate of 7.0. This compares to Greater Manchester Average of 6.0 and
an English average of 4.3.11
15 https://fingertips.phe.org.uk/search/obesity#page/0/gid/1/pat/6/par/E12000002/ati/102/are/E08000004 16 https://www.sportengland.org/media/13563/active-lives-adult-may-17-18-report.pdf
17 https://fingertips.phe.org.uk/search/smoking#page/0/gid/1/pat/6/par/E12000002/ati/102/are/E08000004 11https://www.ons.gov.uk/peoplepopulationandcommunity/birthsdeathsandmarriages/deaths/datasets/drugmisusedeathsbylocalauthority
Page 33 of 58 Oldham in Profile v2.0 January 2019
Diseases and Poor Health in Adults
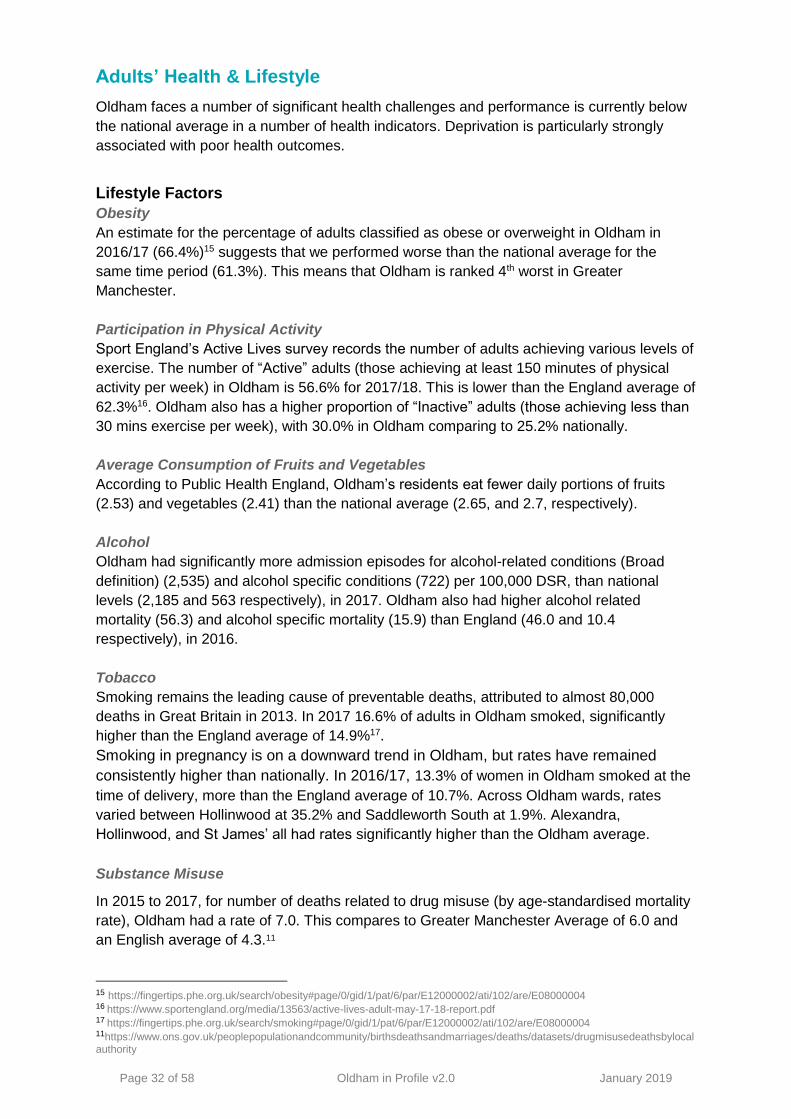
Cancer - Incidence, Mortality, Screening
Cancer mortality is slowly decreasing, but is higher than national and regional averages,
which appear to be decreasing at a faster rate since 2011 - 2013. Oldham’s rate is the 2nd
highest across Greater Manchester, behind Manchester.
Source: Public Health England, Fingertips, Accessed Oct 2018
New cancer cases in Oldham (660 per 100,000 pop) were higher than national average
(614), and cancer mortality (321 per 100,000) was similarly higher (285) (all 2011-15).
Breast, prostate, cervical, and bowel cancer have similar incidence to national, but despite
this, mortality for prostate cancer is slightly lower than national. Lung cancer has a higher
incidence and a higher mortality rate than national.
Cancer type Oldham Incidence Rate
per 100,000 (England)
Oldham Mortality Rate
per 100,000 (England)
Lung 116 (80) 87 (61)
Breast 172 (169) 37 (35)
Prostate 189 (181) 47 (49)
Cervical 11 (10) 3 (3)
Bowel 73 (73) 30 (28)
Source: Local Cancer Intelligence England, 2015
Cancer Screening
Cancer screening rates in Oldham are marginally lower than national average, but there are
wide variations and inequalities in screening uptake across different parts of the borough.
Screening Oldham England
Breast Screening in 2017
(Percentage of females 50-70 screened in the last 3y) 72% 75%
Bowel Screening in 2017
(Persons 60-69 screened in the last 30 months) 57% 59%
Cervical Screening in 2017
(Women aged 25-64 screened in the last 5y) 71% 72%
Source: Public Health England, Fingertips, Accessed Oct 2018

Page 34 of 58 Oldham in Profile v2.0 January 2019
Coronary Heart Disease: Prevalence, Admissions, Mortality and Prevention
The prevalence of Coronary Heart Disease (CHD) in Oldham in 2016/17 was 3.2%, the
same as the national average. CHD mortality rates for all persons have generally been on a
downward trend in the last 13 years. In Oldham, the rate has decreased from 184.4 per
100,000 DSR in 2002 – 2004, to 107.9 in 2014 – 2016. However, the rate has been on the
rise since 2012 – 2014, since the historic low in 2011 – 2013 of 96.7. The rate in 2014 - 2016
was the joint 2nd highest across Greater Manchester. This rise in mortality rates seems to
mirror the decline in life expectancy for residents of Oldham, and could be contributing to the
increasing inequality between life expectancy in Oldham, and the national average.
(Source: PHE 2016 Segmenting life expectancy gaps by cause of death: Oldham)
Source: Public Health England, Fingertips, Accessed Oct 2018
Diabetes Prevalence
The proportion of people on GP registers in Oldham with a diagnosis of diabetes has been
slowly increasing for the last 5 years. Data from 2016/17 revealed a prevalence of 8.1%,
higher than national average of 6.7%, and the North West average of 7.1%.
Mental Health and Well-Being
In 2016/17, mixed anxiety and depression was the most common mental health disorder in
Britain. Oldham’s rate of 16.7% was higher than the North West rate of 15.8%, and the
England rate of 13.7%.
The occurrence of severe mental illness (a diagnosis of schizophrenia, bipolar affective
disorder and other psychoses) in Oldham is significantly higher than the national average
(0.99% in Oldham compared to 0.92% nationally). The prevalence of people of all ages in
Oldham with dementia is 0.8%, and with depression is 10.4%. This is broadly stable over
time, and in line with national rates. 18
18 https://fingertips.phe.org.uk/profile-group/mental-health
Page 35 of 58 Oldham in Profile v2.0 January 2019
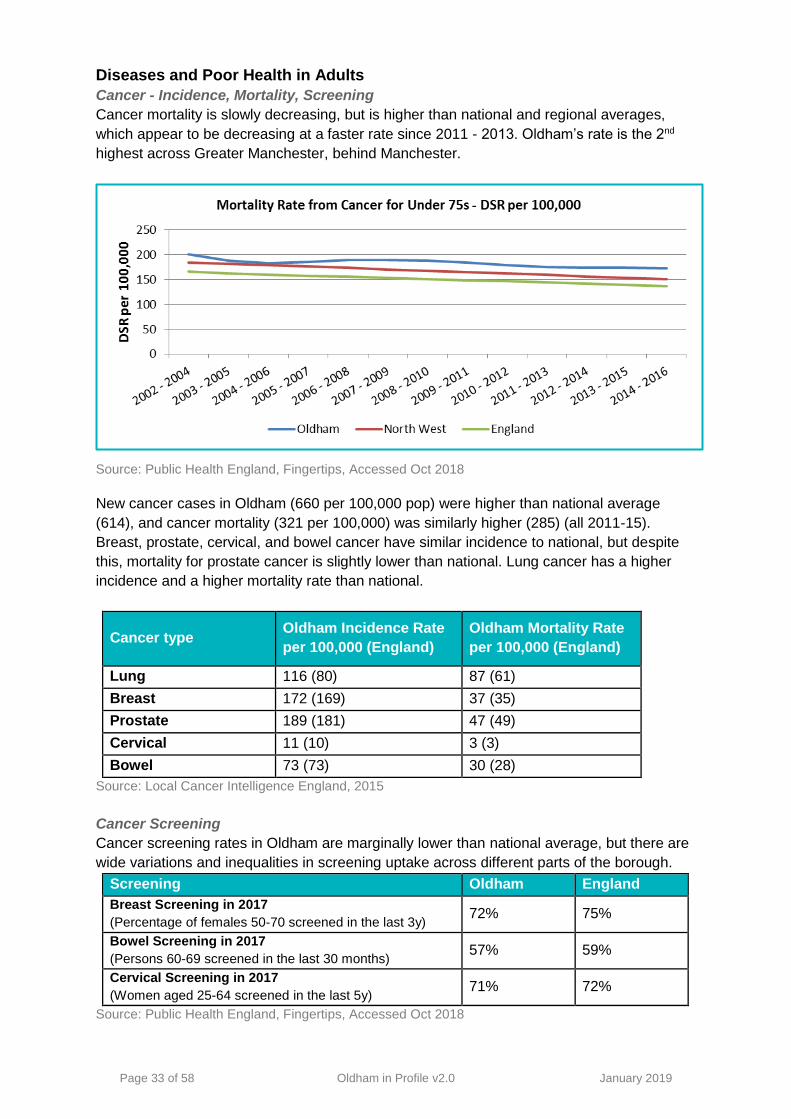
Well-Being
In 2011, the government commissioned an annual survey on the well-being of the British
public. Four questions relating to the domains: life satisfaction, feeling worthwhile, happiness
and anxiety were asked across a cross section of the population with participants scoring on
a scale from ‘0’ to ‘10’ for each of the domains. Participants giving a higher score for Life
Satisfaction, Worthwhile, and Happiness, have a greater sense of well-being. Those giving a
lower score for Anxiety are less anxious. On the graph below, the anxiety scores have been
subtracted from 10, so that a higher score is better, as to coincide with the other measures.
Source: ONS well-being survey 2017/18, 2018
Life Satisfaction
“Overall, how satisfied are you with your life nowadays?” Oldham residents had a mean score of 7.55 – below the UK average and the second lowest
in the region with only Manchester scoring lower (7.42). Oldham’s mean score is generally
similar to UK’s average, though it consistently remains slightly lower.
Feeling Worthwhile
“Overall, to what extent do you feel the things you do in your life are worthwhile?”
Oldham respondents scored 7.82, indicating a high level of fulfilment. This placed Oldham
well ahead of Manchester (7.69) but somewhat behind top-ranking Wigan (8.05). Oldham
remains below the UK average in this measure.
Happiness
“Overall, how happy did you feel yesterday?” Oldham sits third from bottom in the region when comparing scores for happiness, with only
Bolton and Salford receiving a lower mark. Oldham’s average score was 7.41, and this
implies a ‘high’ level of happiness. Over time, Oldham has shadowed the UK average’s
modest increase in levels of happiness.
Anxiety
“Overall, how anxious did you feel yesterday?”
Oldham’s anxiety score (2.71) places it second in the region, with only Wigan performing
better (2.70). Oldham has made rapid progress in this measure from 2014/15, when the
average score was 3.15.
Page 36 of 58 Oldham in Profile v2.0 January 2019
Older People’s Health
Flu Vaccinations in 65+
Flu vaccines can prevent illness and hospital admissions among the elderly. Uptake in
Oldham (2017/18 74.2%) has been slightly below national target of 75%, but has surpassed
the national average (72.6%).
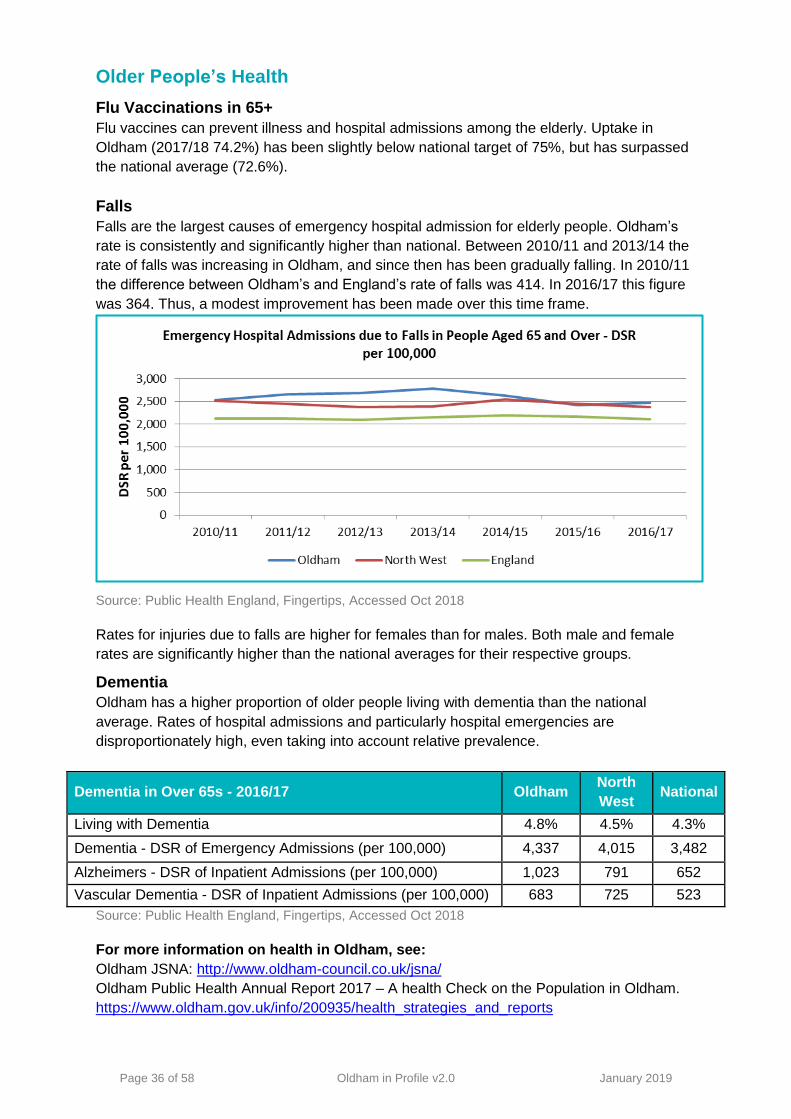
Falls
Falls are the largest causes of emergency hospital admission for elderly people. Oldham’s
rate is consistently and significantly higher than national. Between 2010/11 and 2013/14 the
rate of falls was increasing in Oldham, and since then has been gradually falling. In 2010/11
the difference between Oldham’s and England’s rate of falls was 414. In 2016/17 this figure
was 364. Thus, a modest improvement has been made over this time frame.
Source: Public Health England, Fingertips, Accessed Oct 2018
Rates for injuries due to falls are higher for females than for males. Both male and female
rates are significantly higher than the national averages for their respective groups.
Dementia
Oldham has a higher proportion of older people living with dementia than the national
average. Rates of hospital admissions and particularly hospital emergencies are
disproportionately high, even taking into account relative prevalence.
Dementia in Over 65s - 2016/17 Oldham North
West National
Living with Dementia 4.8% 4.5% 4.3%
Dementia - DSR of Emergency Admissions (per 100,000) 4,337 4,015 3,482
Alzheimers - DSR of Inpatient Admissions (per 100,000) 1,023 791 652
Vascular Dementia - DSR of Inpatient Admissions (per 100,000) 683 725 523
Source: Public Health England, Fingertips, Accessed Oct 2018
For more information on health in Oldham, see:
Oldham JSNA: http://www.oldham-council.co.uk/jsna/
Oldham Public Health Annual Report 2017 – A health Check on the Population in Oldham.
https://www.oldham.gov.uk/info/200935/health_strategies_and_reports
Page 37 of 58 Oldham in Profile v2.0 January 2019
Housing
Overview
As of September 2016, Oldham has 96,132 households. 93,001 (96.7%) of these are
occupied, while 3,131 lie vacant. The borough has an unbalanced housing market, with a
low proportion of detached properties, and a very high proportion of terraced homes – the
highest in Greater Manchester. Oldham has a need for larger family accommodation
highlighted by the issues around over-crowding, particularly in South Asian communities.
This demand is expected to intensify as time passes.
Housing tenure varies considerably across the borough, with high concentrations of social
housing in the more deprived communities. The private rented sector has expanded very
quickly across Oldham, as well as nationally, due to house prices rising more quickly than
earnings, and a dramatic fall in the number of homes being rented out by local authorities.
While house prices remain low compared to Greater Manchester, regional, and national
levels, they still remain unaffordable for many due to low wages and deposits required.
Rising energy prices and energy-inefficient housing also means a high portion of households
in Oldham are in fuel poverty.
In an attempt to address housing shortages and other infrastructural challenges, several
Greater Manchester councils have joined to form the Greater Manchester Spatial Framework
(GMSF). This scheme sets out to ensure the supply of high-quality building plots for homes
and businesses well into the future; ensuring land is used effectively – though at the cost of
a portion of Manchester’s Green Belt. The GMSF aims to allow around 13,500 new houses
to be built in Oldham by 2035 on sites such as Broadbent Moss and Beal Valley.
Challenges and Opportunities
Overcrowding – due to the abundance of terraced and smaller properties
and a growing (South Asian) population, there are significant issues regarding
overcrowding – particularly in Coldhurst, Werneth and St Mary’s.
Affordability – Even though Oldham has some of the lowest house prices in
the region, getting on the housing ladder for many is still out of reach due to
low wages and current deposit requirements.
Population Growth/Aging Population – Growth in Oldham’s population will
increase demand for all tenures of housing, particularly large affordable family
housing and supported accommodation.
Devolution Agreement – There is a new £300m fund for housing – enough
for an extra 15,000 new homes over the next 10 years across Greater
Manchester. Additionally, the GMSF plans for portions of Oldham to be
renovated and additional new homes built over the next 20 years, with both
greenfield and brownfield land being made available for development.
Page 38 of 58 Oldham in Profile v2.0 January 2019
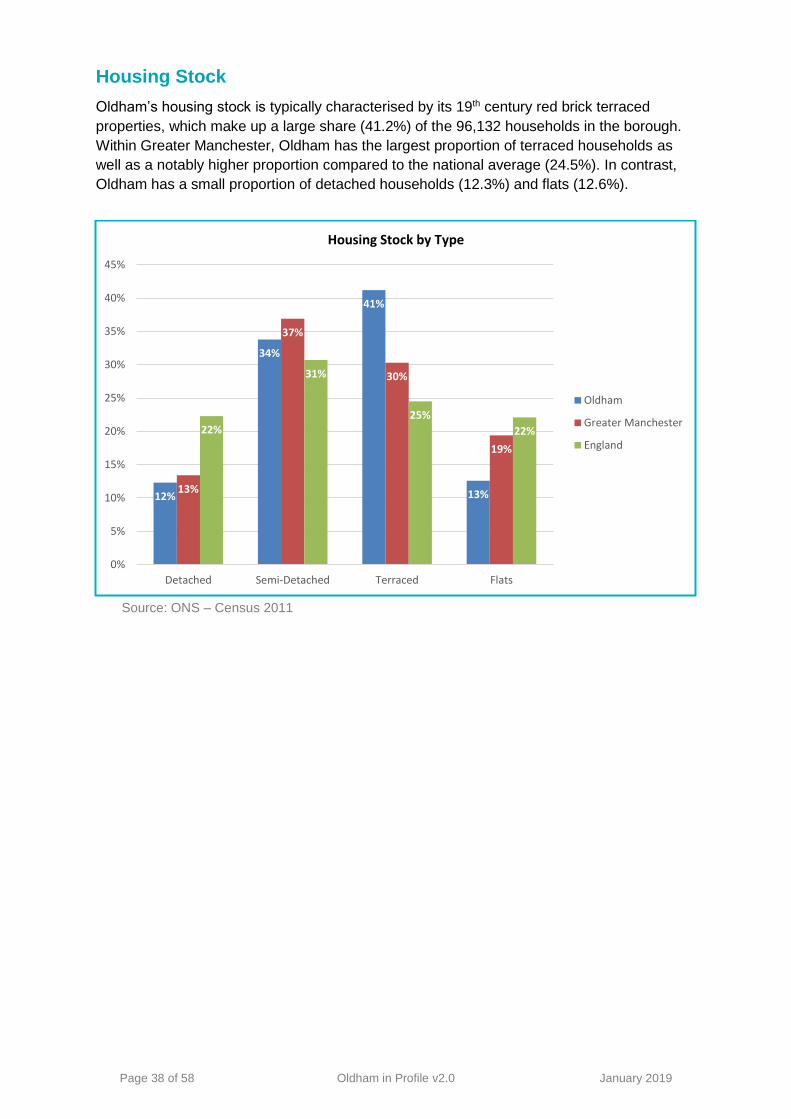
Housing Stock
Oldham’s housing stock is typically characterised by its 19th century red brick terraced
properties, which make up a large share (41.2%) of the 96,132 households in the borough.
Within Greater Manchester, Oldham has the largest proportion of terraced households as
well as a notably higher proportion compared to the national average (24.5%). In contrast,
Oldham has a small proportion of detached households (12.3%) and flats (12.6%).
Source: ONS – Census 2011
12%
34%
41%
13%13%
37%
30%
19%
22%
31%
25%
22%
0%
5%
10%
15%
20%
25%
30%
35%
40%
45%
Detached Semi-Detached Terraced Flats
Housing Stock by Type
Oldham
Greater Manchester
England
Page 39 of 58 Oldham in Profile v2.0 January 2019
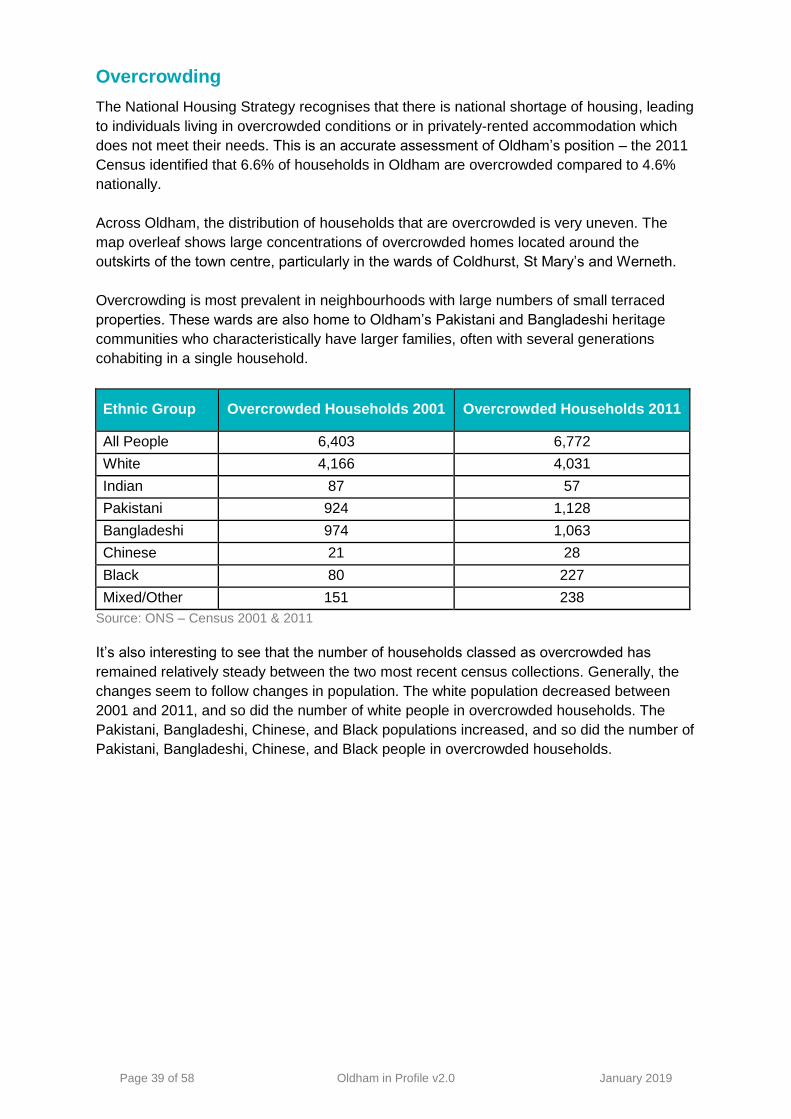
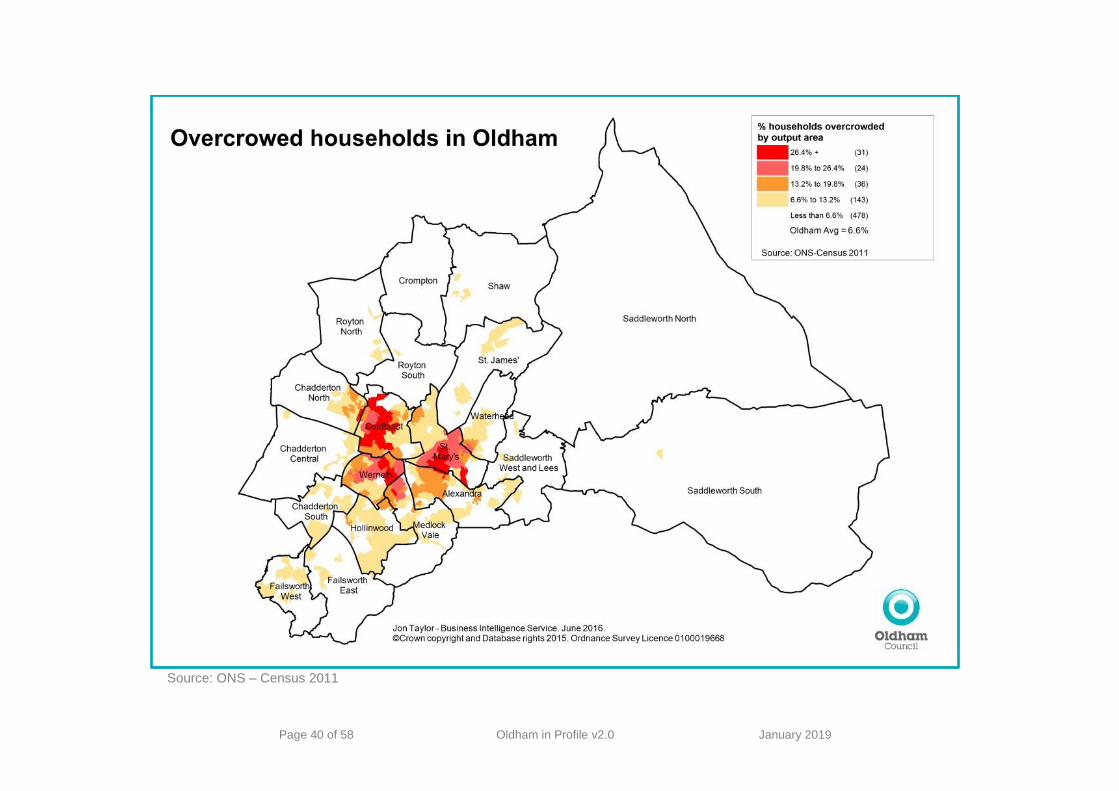
Overcrowding
The National Housing Strategy recognises that there is national shortage of housing, leading
to individuals living in overcrowded conditions or in privately-rented accommodation which
does not meet their needs. This is an accurate assessment of Oldham’s position – the 2011
Census identified that 6.6% of households in Oldham are overcrowded compared to 4.6%
nationally.
Across Oldham, the distribution of households that are overcrowded is very uneven. The
map overleaf shows large concentrations of overcrowded homes located around the
outskirts of the town centre, particularly in the wards of Coldhurst, St Mary’s and Werneth.
Overcrowding is most prevalent in neighbourhoods with large numbers of small terraced
properties. These wards are also home to Oldham’s Pakistani and Bangladeshi heritage
communities who characteristically have larger families, often with several generations
cohabiting in a single household.
Ethnic Group Overcrowded Households 2001 Overcrowded Households 2011
All People 6,403 6,772
White 4,166 4,031
Indian 87 57
Pakistani 924 1,128
Bangladeshi 974 1,063
Chinese 21 28
Black 80 227
Mixed/Other 151 238
Source: ONS – Census 2001 & 2011
It’s also interesting to see that the number of households classed as overcrowded has
remained relatively steady between the two most recent census collections. Generally, the
changes seem to follow changes in population. The white population decreased between
2001 and 2011, and so did the number of white people in overcrowded households. The
Pakistani, Bangladeshi, Chinese, and Black populations increased, and so did the number of
Pakistani, Bangladeshi, Chinese, and Black people in overcrowded households.
Page 40 of 58 Oldham in Profile v2.0 January 2019
Source: ONS – Census 2011
Page 41 of 58 Oldham in Profile v2.0 January 2019
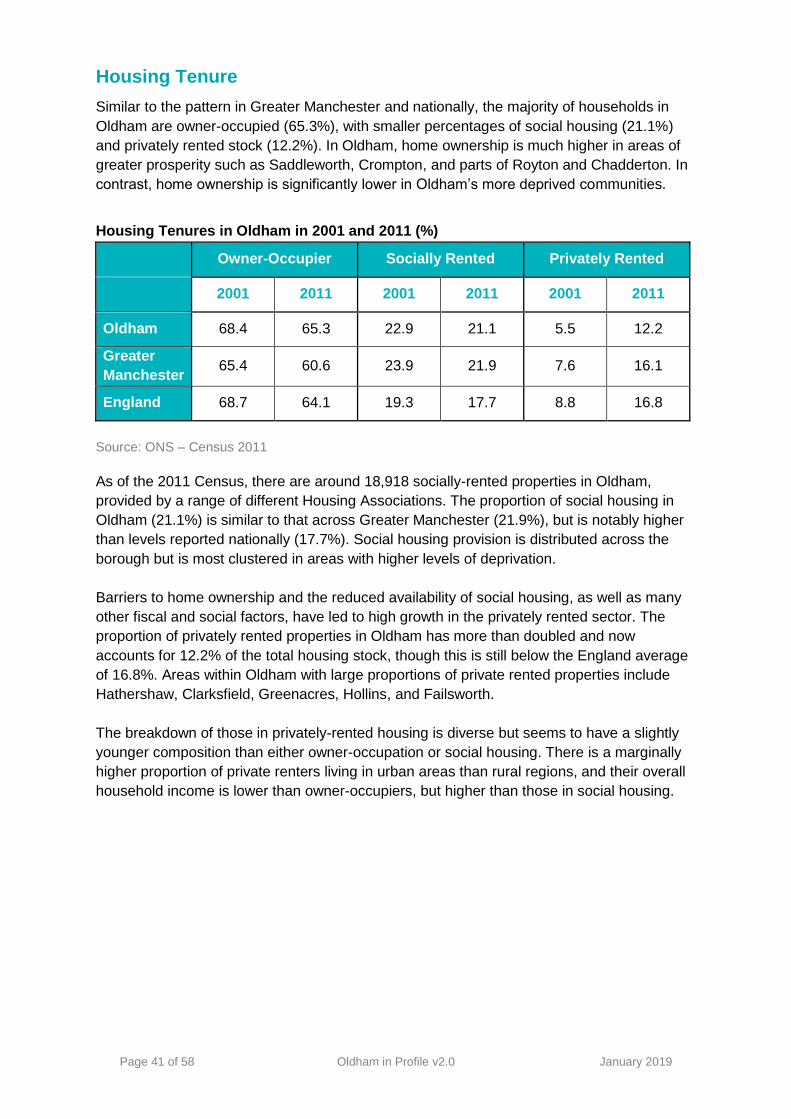
Housing Tenure
Similar to the pattern in Greater Manchester and nationally, the majority of households in
Oldham are owner-occupied (65.3%), with smaller percentages of social housing (21.1%)
and privately rented stock (12.2%). In Oldham, home ownership is much higher in areas of
greater prosperity such as Saddleworth, Crompton, and parts of Royton and Chadderton. In
contrast, home ownership is significantly lower in Oldham’s more deprived communities.
Housing Tenures in Oldham in 2001 and 2011 (%)
Owner-Occupier Socially Rented Privately Rented
2001 2011 2001 2011 2001 2011
Oldham 68.4 65.3 22.9 21.1 5.5 12.2
Greater
Manchester 65.4 60.6 23.9 21.9 7.6 16.1
England 68.7 64.1 19.3 17.7 8.8 16.8
Source: ONS – Census 2011
As of the 2011 Census, there are around 18,918 socially-rented properties in Oldham,
provided by a range of different Housing Associations. The proportion of social housing in
Oldham (21.1%) is similar to that across Greater Manchester (21.9%), but is notably higher
than levels reported nationally (17.7%). Social housing provision is distributed across the
borough but is most clustered in areas with higher levels of deprivation.
Barriers to home ownership and the reduced availability of social housing, as well as many
other fiscal and social factors, have led to high growth in the privately rented sector. The
proportion of privately rented properties in Oldham has more than doubled and now
accounts for 12.2% of the total housing stock, though this is still below the England average
of 16.8%. Areas within Oldham with large proportions of private rented properties include
Hathershaw, Clarksfield, Greenacres, Hollins, and Failsworth.
The breakdown of those in privately-rented housing is diverse but seems to have a slightly
younger composition than either owner-occupation or social housing. There is a marginally
higher proportion of private renters living in urban areas than rural regions, and their overall
household income is lower than owner-occupiers, but higher than those in social housing.

Page 42 of 58 Oldham in Profile v2.0 January 2019
Source: OHIP 2016
Page 43 of 58 Oldham in Profile v2.0 January 2019
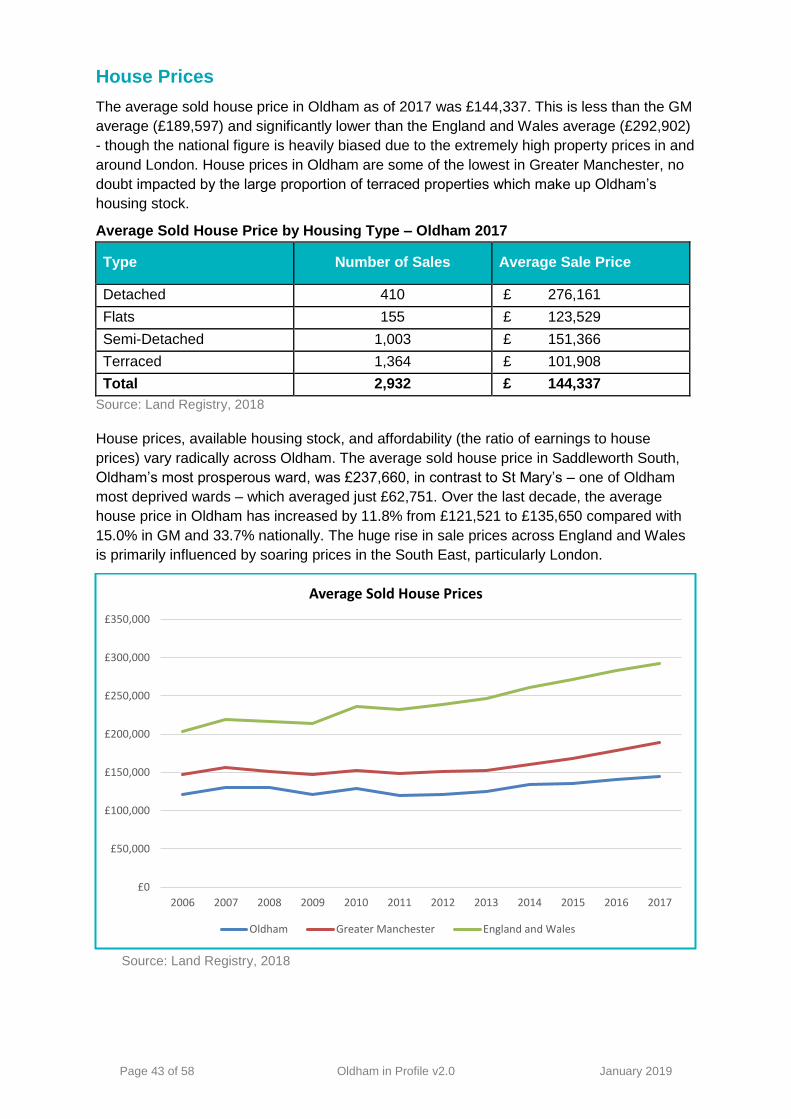
House Prices
The average sold house price in Oldham as of 2017 was £144,337. This is less than the GM
average (£189,597) and significantly lower than the England and Wales average (£292,902)
- though the national figure is heavily biased due to the extremely high property prices in and
around London. House prices in Oldham are some of the lowest in Greater Manchester, no
doubt impacted by the large proportion of terraced properties which make up Oldham’s
housing stock.
Average Sold House Price by Housing Type – Oldham 2017
Type Number of Sales Average Sale Price
Detached 410 £ 276,161
Flats 155 £ 123,529
Semi-Detached 1,003 £ 151,366
Terraced 1,364 £ 101,908
Total 2,932 £ 144,337
Source: Land Registry, 2018
House prices, available housing stock, and affordability (the ratio of earnings to house
prices) vary radically across Oldham. The average sold house price in Saddleworth South,
Oldham’s most prosperous ward, was £237,660, in contrast to St Mary’s – one of Oldham
most deprived wards – which averaged just £62,751. Over the last decade, the average
house price in Oldham has increased by 11.8% from £121,521 to £135,650 compared with
15.0% in GM and 33.7% nationally. The huge rise in sale prices across England and Wales
is primarily influenced by soaring prices in the South East, particularly London.
Source: Land Registry, 2018
£0
£50,000
£100,000
£150,000
£200,000
£250,000
£300,000
£350,000
2006 2007 2008 2009 2010 2011 2012 2013 2014 2015 2016 2017
Average Sold House Prices
Oldham Greater Manchester England and Wales

Page 44 of 58 Oldham in Profile v2.0 January 2019
The combination of increasing house prices and static income levels has compounded the
issues surrounding housing affordability. Affordability ratios (measuring income against
house prices) are highlighted below and show that the most affordable housing in the region
can be found in Oldham, along with Wigan, Tameside, Salford, Rochdale and Bolton. While
house prices in Oldham may be lower when compared to Greater Manchester, they still
remain unaffordable to many of the borough’s residents due to low wages and high deposit
requirements. The least affordable homes in Greater Manchester are found in Trafford,
where house prices are almost nine times greater than annual earnings.
Average Household Income, House Prices and Affordability Ratios for Greater
Manchester Authorities (2017) (Lower Affordability Ratio is Better)
District Median Annual
Earnings (2017)
Median House
Price 2017
Affordability
Ratio
Bolton £24,078 £126,000 5.2
Bury £24,104 £157,000 6.5
Manchester £29,889 £160,000 5.4
Oldham £22,858 £126,950 5.6
Rochdale £22,595 £127,000 5.6
Salford £28,042 £157,998 5.6
Stockport £27,113 £205,000 7.6
Tameside £24,357 £135,000 5.5
Trafford £27,728 £248,000 8.9
Wigan £24,334 £129,995 5.3
Greater Manchester £25,510 £157,294 6.17
Source: ONS, 2018
0
1
2
3
4
5
6
7
8
1997 1998 1999 2000 2001 2002 2003 2004 2005 2006 2007 2008 2009 2010 2011 2012 2013 2014 2015 2016 2017
Affordability Ratio -Ratio of Median House Price to Median Annual Income
Oldham North West England

Page 45 of 58 Oldham in Profile v2.0 January 2019
Oldham’s Future Housing Market
As already documented, there is plenty of evidence to suggest that a clear disparity exists
between housing supply and demand in Oldham. This is partly due to affordability relevant to
income, issues around over-crowding and the over-proliferation of terraced and smaller
properties, as well as the borough’s ageing population.
However, future housing demand in Oldham is expected to intensify as population
projections suggest a rise in the number of inhabitants, which agrees with the ever-
increasing life expectancy of the current residents. This will further increase the demand for
all tenures of housing, particularly large affordable family housing and supported
accommodation.

Page 46 of 58 Oldham in Profile v2.0 January 2019
Fuel Poverty
Due to rising energy prices, energy inefficient housing and low incomes, a significant portion
of households in Oldham are in fuel poverty. This is also the case both in the wider region
and nationally. As of 2013, there were 9,806 households in Oldham (10.7%) classed as fuel
poor, marginally higher than the England average (10.4%).
Living in a cold home can have serious health implications, particularly for the old, very
young, and for people with disabilities - it can even play a role in premature deaths. A
household is considered to be fuel poor if it has higher than typical energy costs and would
be left with a disposable income below the poverty line if the required money was spent in
order to meet those costs.
Fuel poverty is closely associated with low income, and is most common among those who
live in privately rented accommodation. The map below highlights areas of significant fuel
poverty within Oldham. It is clear that the wards with higher levels of deprivation, generally
surrounding the town centre, have the greatest levels of fuel poverty. For example, in parts
of Coldhurst, the proportion of households which are fuel poor is in excess of 25%. The
Warm Homes Oldham programme continues to address fuel poverty with the aim of
improving outcomes in other areas simultaneously.
Source: DECC 2016
Page 47 of 58 Oldham in Profile v2.0 January 2019
Education
Overview
Oldham has a rich variety of schools, and a thriving community with signs of improving
performance across many educational indicators. However, like many communities in the
North West, Oldham also has pockets of deprivation where young people don’t reach
national levels of attainment; economic deprivation and language barriers are causal factors.
Supported by the DfE funded Opportunity Area programme, Oldham is providing additional
support to disadvantaged students, with an emphasis on improving early years performance.
Historically, primary schools in Oldham perform well in Ofsted inspections. There is still a 7%
gap with national average, but the local authority is working in close partnership with schools
to reach the aspirational target of all schools being at least good by 2020. Secondary
schools are converging on statistical neighbour and national averages for both attainment 8
and progress 8 scores. However, there are behaviour issues, and attainment gaps are worse
than national levels for Pakistani, Bangladeshi, and EAL students.
Key stage 5 performance continues to improve. There is a need to increase the number of
higher level qualifications at FE level, but Oldham has higher than expected proportions of
young people gaining level 3 qualifications. This demonstrates the inclusivity and
opportunities which Oldham fosters.
Early signs from new approaches to addressing high levels of absences and exclusions are
that they are having an impact, and this should influence outcomes over time.
Challenges and Opportunities
Deprivation – can impact on attainment and life chances, and is a difficult
obstacle to overcome - even for excellent schools. Oldham’s significant
deprivation levels and the low skills base of parents, are both reasons the DfE has
invested in the borough as an Opportunity Area.
Language and Ethnicity – Children who speak English is an additional language
may have lower than expected levels of speech, language, and communication in
early years and key stage 1, but generally demonstrate improvement by key stage
2. Ethnicity may also influences results. Whilst ethnicity gaps have somewhat
closed over time, challenges such as the high number of international students
requiring school and community integration, and students joining schools part way
through the school year, still remain. However, these are challenges in which
Oldham has some best practice.
Secondary Education – Key stage 4 performance has improved slowly year on
year but remains below national average. The changes to the curriculum in 2018
impacted on attainment across the borough, though this was replicated across
most of the North West.
Page 48 of 58 Oldham in Profile v2.0 January 2019
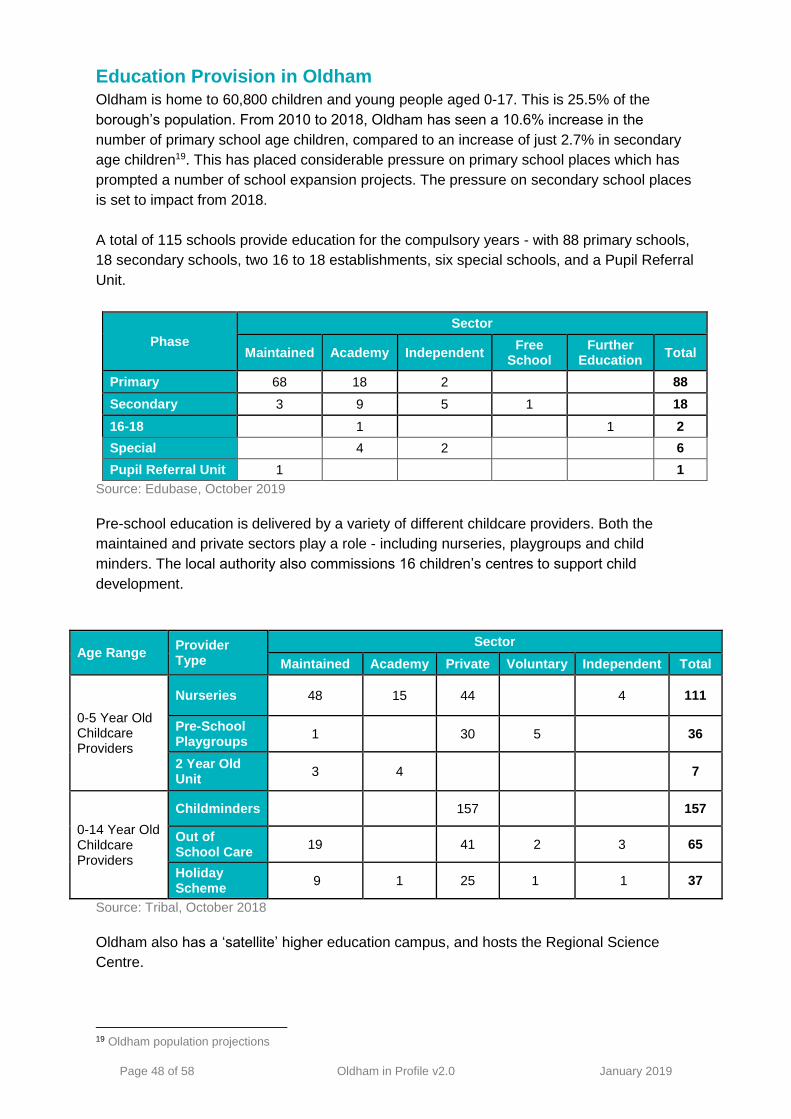
Education Provision in Oldham Oldham is home to 60,800 children and young people aged 0-17. This is 25.5% of the
borough’s population. From 2010 to 2018, Oldham has seen a 10.6% increase in the
number of primary school age children, compared to an increase of just 2.7% in secondary
age children19. This has placed considerable pressure on primary school places which has
prompted a number of school expansion projects. The pressure on secondary school places
is set to impact from 2018.
A total of 115 schools provide education for the compulsory years - with 88 primary schools,
18 secondary schools, two 16 to 18 establishments, six special schools, and a Pupil Referral
Unit.
Phase
Sector
Maintained Academy Independent Free
School Further
Education Total
Primary 68 18 2 88
Secondary 3 9 5 1 18
16-18 1 1 2
Special 4 2 6
Pupil Referral Unit 1 1
Source: Edubase, October 2019
Pre-school education is delivered by a variety of different childcare providers. Both the
maintained and private sectors play a role - including nurseries, playgroups and child
minders. The local authority also commissions 16 children’s centres to support child
development.
Age Range Provider Type
Sector
Maintained Academy Private Voluntary Independent Total
0-5 Year Old Childcare Providers
Nurseries 48 15 44 4 111
Pre-School Playgroups
1 30 5 36
2 Year Old Unit
3 4 7
0-14 Year Old Childcare Providers
Childminders 157 157
Out of School Care
19 41 2 3 65
Holiday Scheme
9 1 25 1 1 37
Source: Tribal, October 2018
Oldham also has a ‘satellite’ higher education campus, and hosts the Regional Science
Centre.
19 Oldham population projections
Page 49 of 58 Oldham in Profile v2.0 January 2019
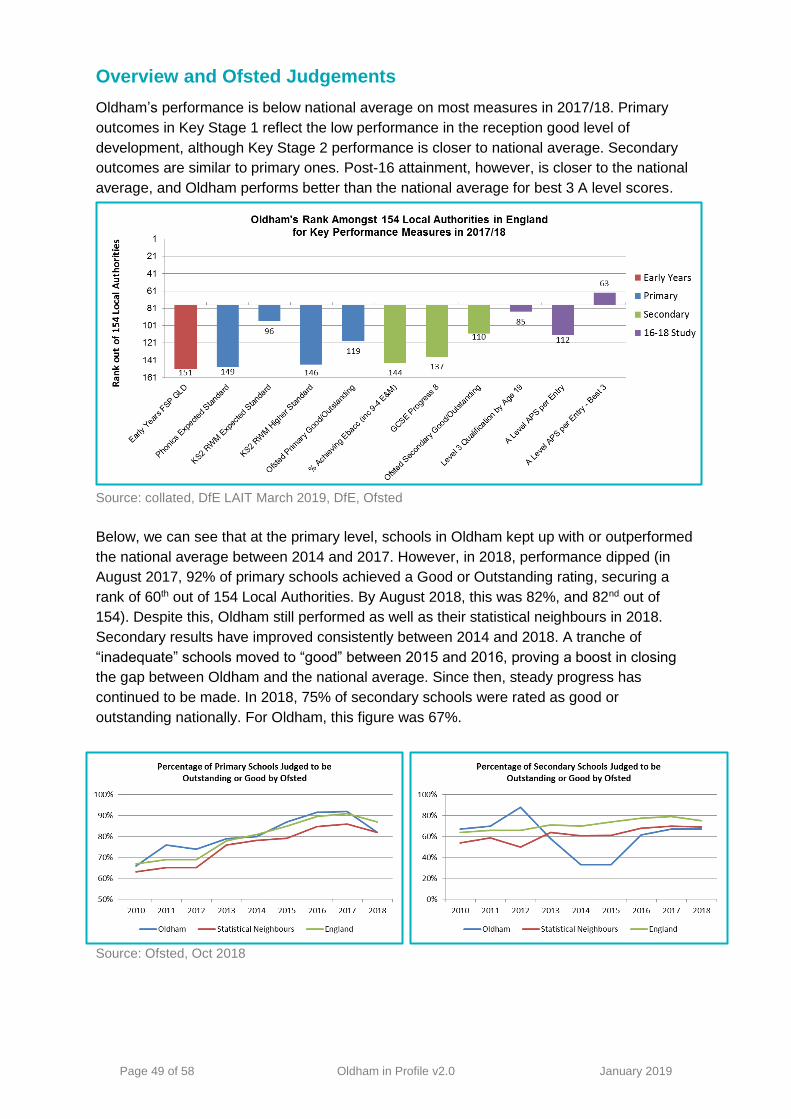
Overview and Ofsted Judgements
Oldham’s performance is below national average on most measures in 2017/18. Primary
outcomes in Key Stage 1 reflect the low performance in the reception good level of
development, although Key Stage 2 performance is closer to national average. Secondary
outcomes are similar to primary ones. Post-16 attainment, however, is closer to the national
average, and Oldham performs better than the national average for best 3 A level scores.
Source: collated, DfE LAIT March 2019, DfE, Ofsted
Below, we can see that at the primary level, schools in Oldham kept up with or outperformed
the national average between 2014 and 2017. However, in 2018, performance dipped (in
August 2017, 92% of primary schools achieved a Good or Outstanding rating, securing a
rank of 60th out of 154 Local Authorities. By August 2018, this was 82%, and 82nd out of
154). Despite this, Oldham still performed as well as their statistical neighbours in 2018.
Secondary results have improved consistently between 2014 and 2018. A tranche of
“inadequate” schools moved to “good” between 2015 and 2016, proving a boost in closing
the gap between Oldham and the national average. Since then, steady progress has
continued to be made. In 2018, 75% of secondary schools were rated as good or
outstanding nationally. For Oldham, this figure was 67%.
Source: Ofsted, Oct 2018
Page 50 of 58 Oldham in Profile v2.0 January 2019
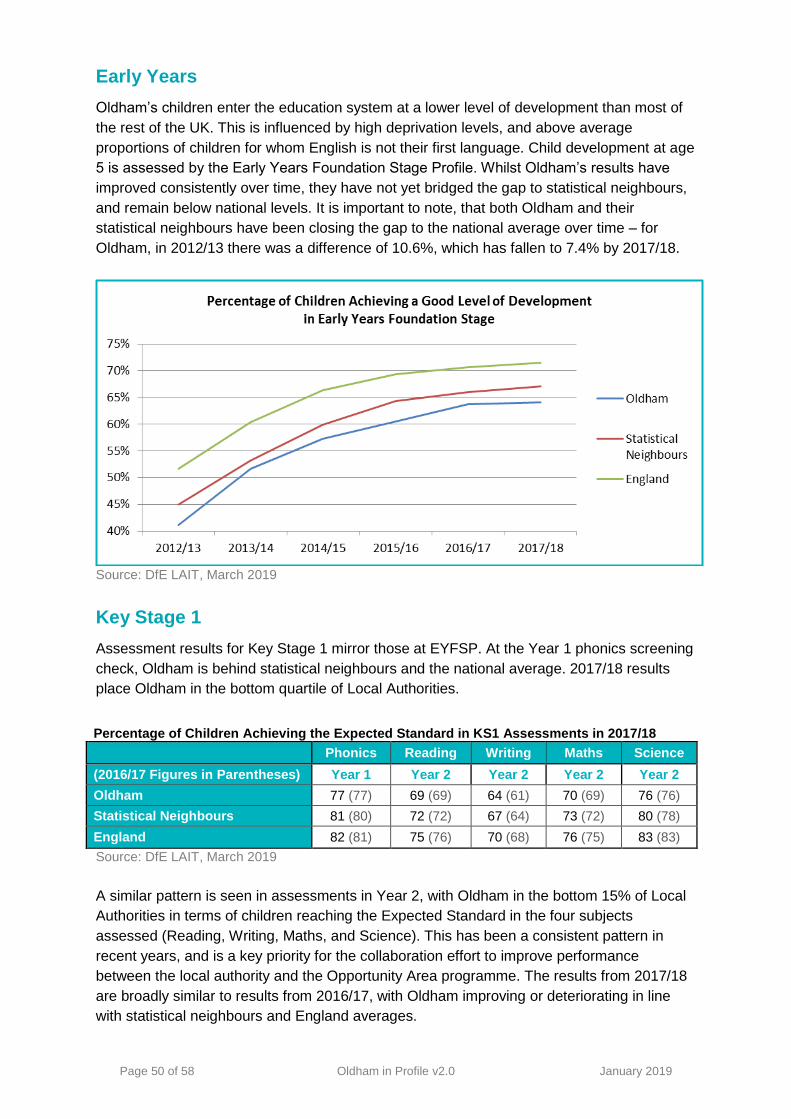
Early Years
Oldham’s children enter the education system at a lower level of development than most of
the rest of the UK. This is influenced by high deprivation levels, and above average
proportions of children for whom English is not their first language. Child development at age
5 is assessed by the Early Years Foundation Stage Profile. Whilst Oldham’s results have
improved consistently over time, they have not yet bridged the gap to statistical neighbours,
and remain below national levels. It is important to note, that both Oldham and their
statistical neighbours have been closing the gap to the national average over time – for
Oldham, in 2012/13 there was a difference of 10.6%, which has fallen to 7.4% by 2017/18.
Source: DfE LAIT, March 2019
Key Stage 1
Assessment results for Key Stage 1 mirror those at EYFSP. At the Year 1 phonics screening
check, Oldham is behind statistical neighbours and the national average. 2017/18 results
place Oldham in the bottom quartile of Local Authorities.
Percentage of Children Achieving the Expected Standard in KS1 Assessments in 2017/18
Phonics Reading Writing Maths Science
(2016/17 Figures in Parentheses) Year 1 Year 2 Year 2 Year 2 Year 2
Oldham 77 (77) 69 (69) 64 (61) 70 (69) 76 (76)
Statistical Neighbours 81 (80) 72 (72) 67 (64) 73 (72) 80 (78)
England 82 (81) 75 (76) 70 (68) 76 (75) 83 (83)
Source: DfE LAIT, March 2019
A similar pattern is seen in assessments in Year 2, with Oldham in the bottom 15% of Local
Authorities in terms of children reaching the Expected Standard in the four subjects
assessed (Reading, Writing, Maths, and Science). This has been a consistent pattern in
recent years, and is a key priority for the collaboration effort to improve performance
between the local authority and the Opportunity Area programme. The results from 2017/18
are broadly similar to results from 2016/17, with Oldham improving or deteriorating in line
with statistical neighbours and England averages.
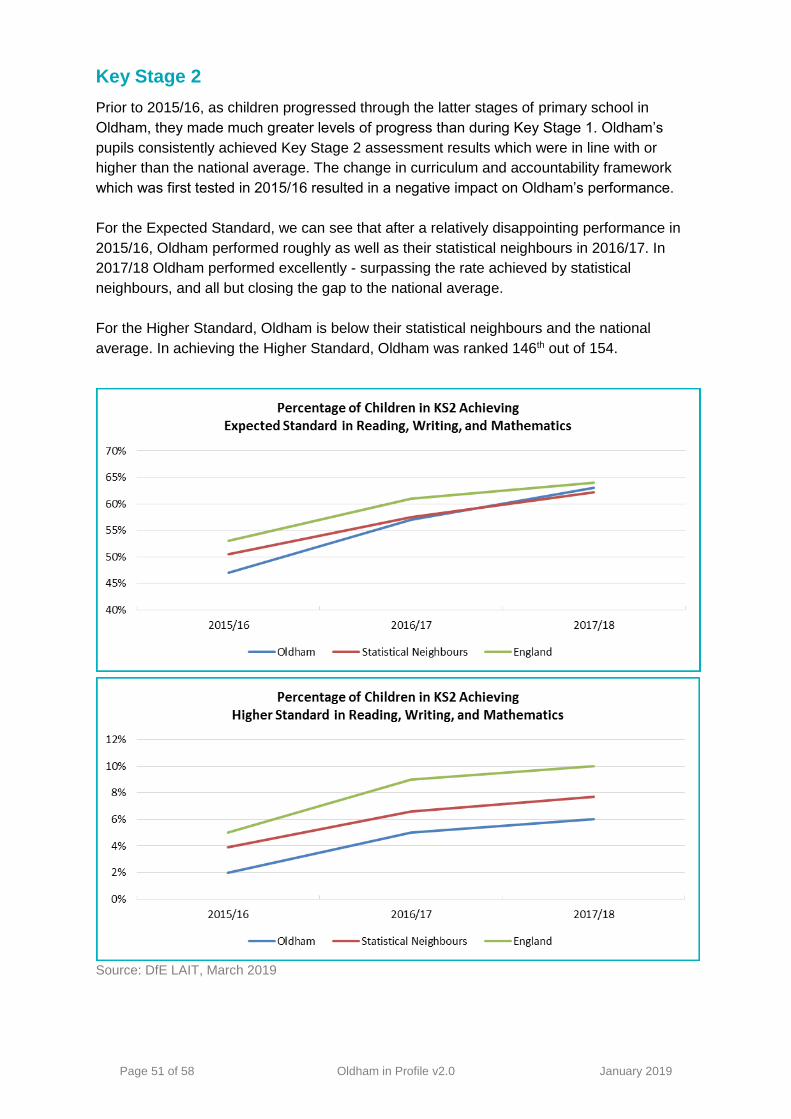
Page 51 of 58 Oldham in Profile v2.0 January 2019
Key Stage 2
Prior to 2015/16, as children progressed through the latter stages of primary school in
Oldham, they made much greater levels of progress than during Key Stage 1. Oldham’s
pupils consistently achieved Key Stage 2 assessment results which were in line with or
higher than the national average. The change in curriculum and accountability framework
which was first tested in 2015/16 resulted in a negative impact on Oldham’s performance.
For the Expected Standard, we can see that after a relatively disappointing performance in
2015/16, Oldham performed roughly as well as their statistical neighbours in 2016/17. In
2017/18 Oldham performed excellently - surpassing the rate achieved by statistical
neighbours, and all but closing the gap to the national average.
For the Higher Standard, Oldham is below their statistical neighbours and the national
average. In achieving the Higher Standard, Oldham was ranked 146th out of 154.
Source: DfE LAIT, March 2019
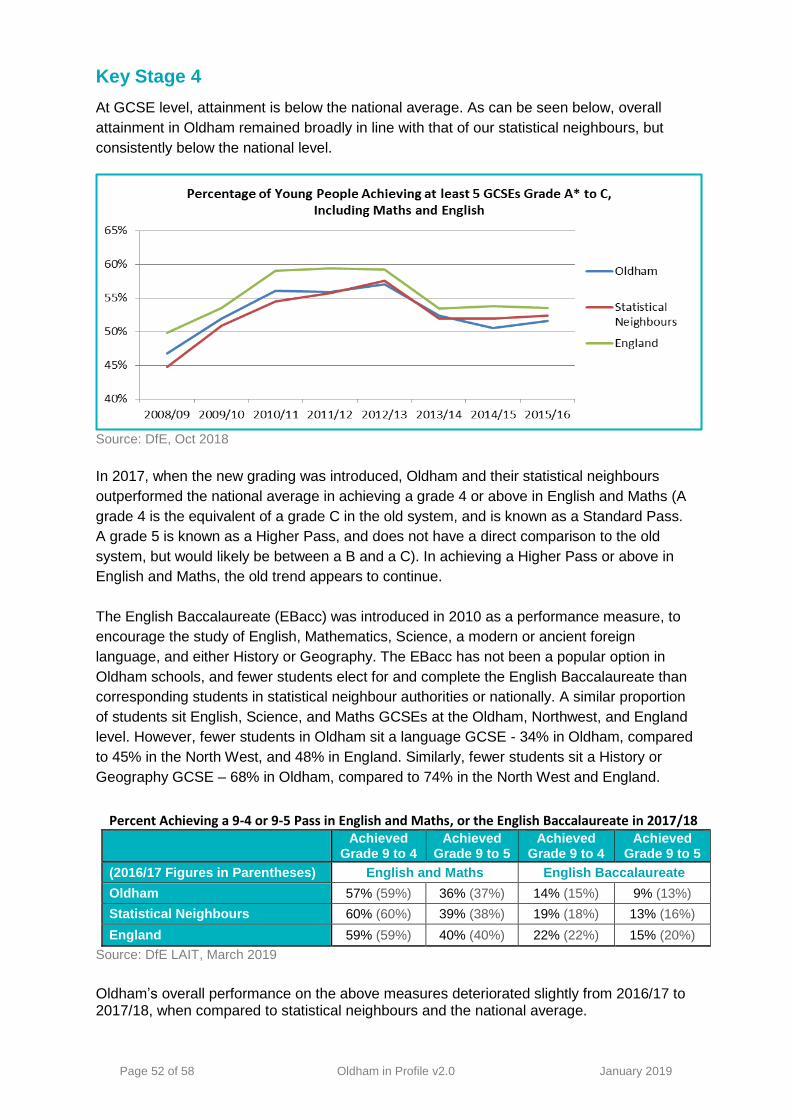
Page 52 of 58 Oldham in Profile v2.0 January 2019
Key Stage 4
At GCSE level, attainment is below the national average. As can be seen below, overall
attainment in Oldham remained broadly in line with that of our statistical neighbours, but
consistently below the national level.
Source: DfE, Oct 2018
In 2017, when the new grading was introduced, Oldham and their statistical neighbours
outperformed the national average in achieving a grade 4 or above in English and Maths (A
grade 4 is the equivalent of a grade C in the old system, and is known as a Standard Pass.
A grade 5 is known as a Higher Pass, and does not have a direct comparison to the old
system, but would likely be between a B and a C). In achieving a Higher Pass or above in
English and Maths, the old trend appears to continue.
The English Baccalaureate (EBacc) was introduced in 2010 as a performance measure, to
encourage the study of English, Mathematics, Science, a modern or ancient foreign
language, and either History or Geography. The EBacc has not been a popular option in
Oldham schools, and fewer students elect for and complete the English Baccalaureate than
corresponding students in statistical neighbour authorities or nationally. A similar proportion
of students sit English, Science, and Maths GCSEs at the Oldham, Northwest, and England
level. However, fewer students in Oldham sit a language GCSE - 34% in Oldham, compared
to 45% in the North West, and 48% in England. Similarly, fewer students sit a History or
Geography GCSE – 68% in Oldham, compared to 74% in the North West and England.
Percent Achieving a 9-4 or 9-5 Pass in English and Maths, or the English Baccalaureate in 2017/18
Achieved
Grade 9 to 4 Achieved
Grade 9 to 5 Achieved
Grade 9 to 4 Achieved
Grade 9 to 5
(2016/17 Figures in Parentheses) English and Maths English Baccalaureate
Oldham 57% (59%) 36% (37%) 14% (15%) 9% (13%)
Statistical Neighbours 60% (60%) 39% (38%) 19% (18%) 13% (16%)
England 59% (59%) 40% (40%) 22% (22%) 15% (20%)
Source: DfE LAIT, March 2019
Oldham’s overall performance on the above measures deteriorated slightly from 2016/17 to 2017/18, when compared to statistical neighbours and the national average.
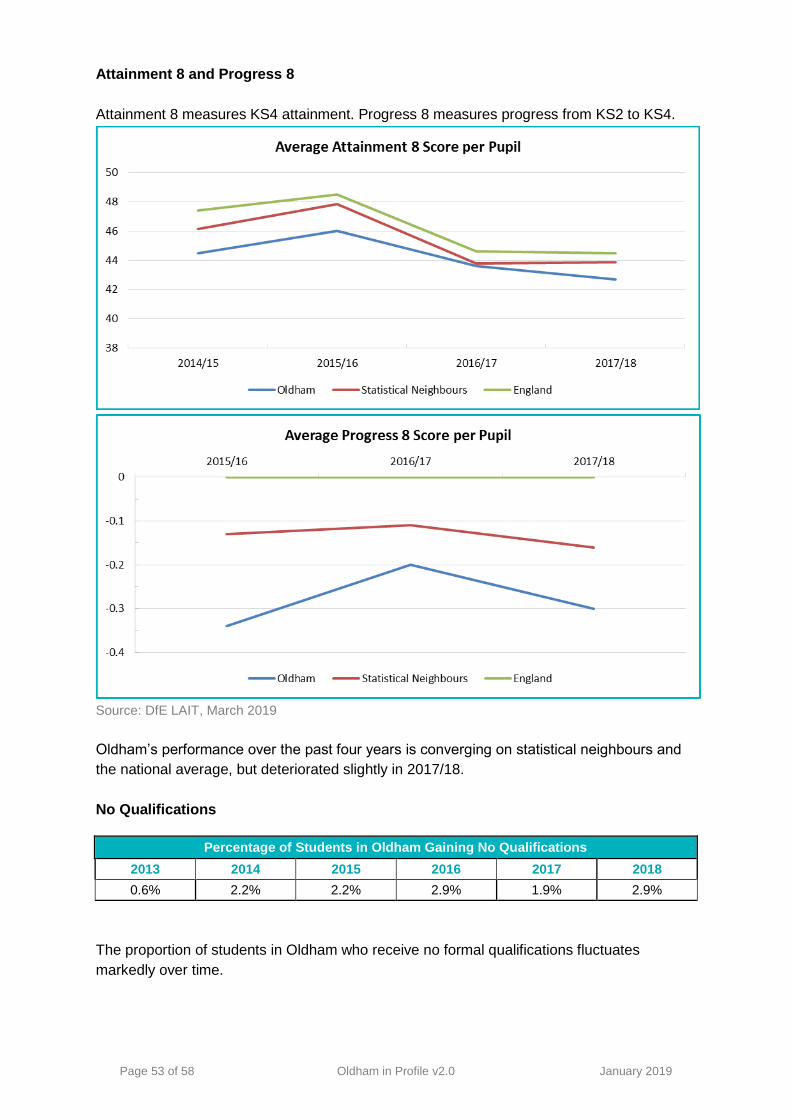
Page 53 of 58 Oldham in Profile v2.0 January 2019
Attainment 8 and Progress 8
Attainment 8 measures KS4 attainment. Progress 8 measures progress from KS2 to KS4.
Source: DfE LAIT, March 2019
Oldham’s performance over the past four years is converging on statistical neighbours and
the national average, but deteriorated slightly in 2017/18.
No Qualifications
The proportion of students in Oldham who receive no formal qualifications fluctuates
markedly over time.
Percentage of Students in Oldham Gaining No Qualifications
2013 2014 2015 2016 2017 2018
0.6% 2.2% 2.2% 2.9% 1.9% 2.9%
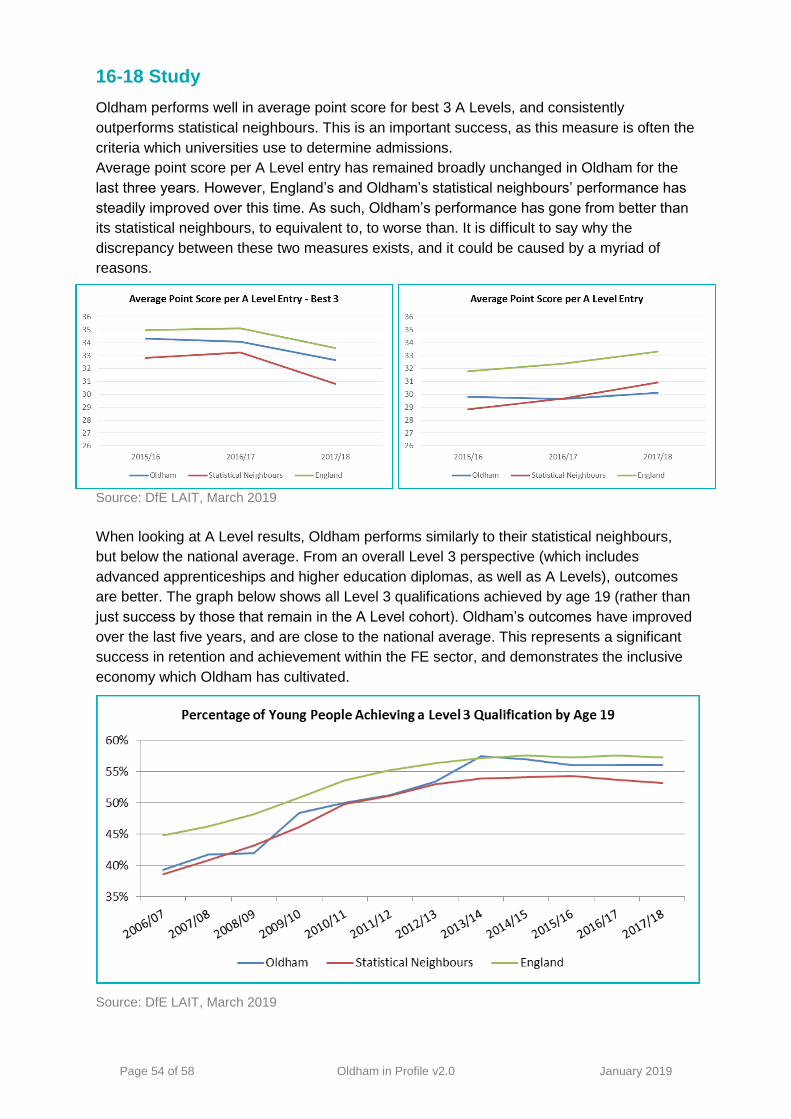
Page 54 of 58 Oldham in Profile v2.0 January 2019
16-18 Study
Oldham performs well in average point score for best 3 A Levels, and consistently
outperforms statistical neighbours. This is an important success, as this measure is often the
criteria which universities use to determine admissions.
Average point score per A Level entry has remained broadly unchanged in Oldham for the
last three years. However, England’s and Oldham’s statistical neighbours’ performance has
steadily improved over this time. As such, Oldham’s performance has gone from better than
its statistical neighbours, to equivalent to, to worse than. It is difficult to say why the
discrepancy between these two measures exists, and it could be caused by a myriad of
reasons.
Source: DfE LAIT, March 2019
When looking at A Level results, Oldham performs similarly to their statistical neighbours,
but below the national average. From an overall Level 3 perspective (which includes
advanced apprenticeships and higher education diplomas, as well as A Levels), outcomes
are better. The graph below shows all Level 3 qualifications achieved by age 19 (rather than
just success by those that remain in the A Level cohort). Oldham’s outcomes have improved
over the last five years, and are close to the national average. This represents a significant
success in retention and achievement within the FE sector, and demonstrates the inclusive
economy which Oldham has cultivated.
Source: DfE LAIT, March 2019
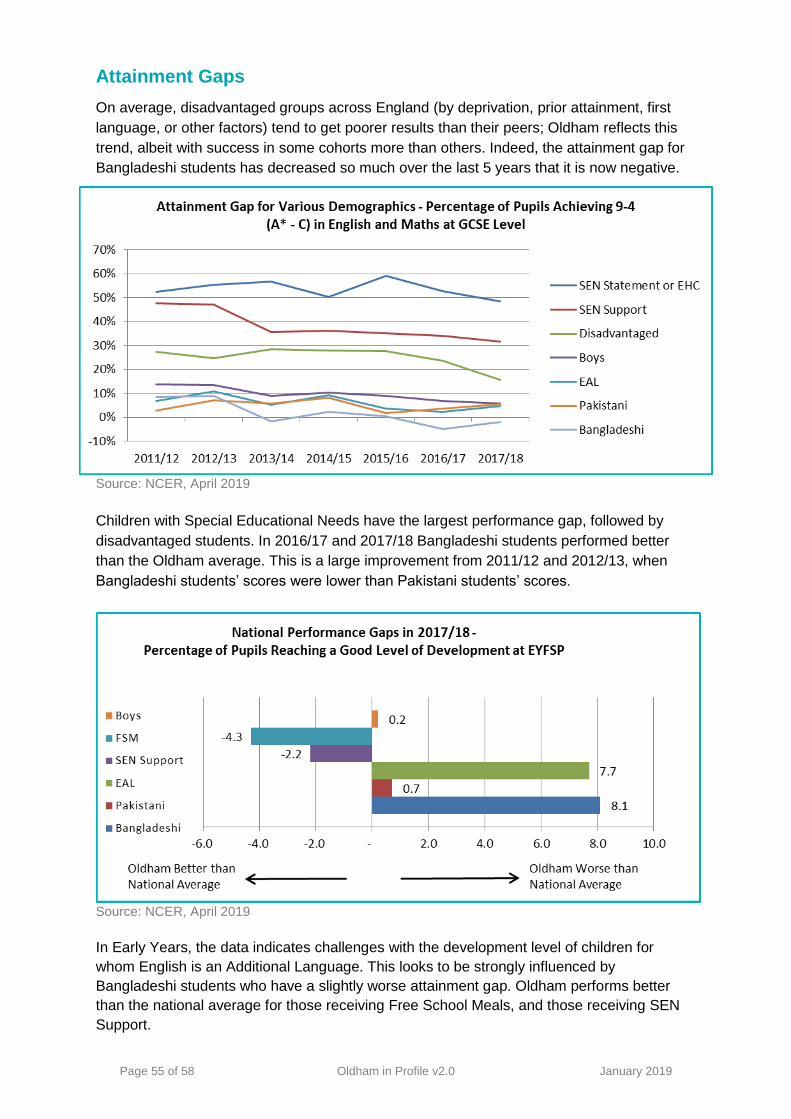
Page 55 of 58 Oldham in Profile v2.0 January 2019
Attainment Gaps
On average, disadvantaged groups across England (by deprivation, prior attainment, first
language, or other factors) tend to get poorer results than their peers; Oldham reflects this
trend, albeit with success in some cohorts more than others. Indeed, the attainment gap for
Bangladeshi students has decreased so much over the last 5 years that it is now negative.
Source: NCER, April 2019
Children with Special Educational Needs have the largest performance gap, followed by
disadvantaged students. In 2016/17 and 2017/18 Bangladeshi students performed better
than the Oldham average. This is a large improvement from 2011/12 and 2012/13, when
Bangladeshi students’ scores were lower than Pakistani students’ scores.
Source: NCER, April 2019
In Early Years, the data indicates challenges with the development level of children for
whom English is an Additional Language. This looks to be strongly influenced by
Bangladeshi students who have a slightly worse attainment gap. Oldham performs better
than the national average for those receiving Free School Meals, and those receiving SEN
Support.
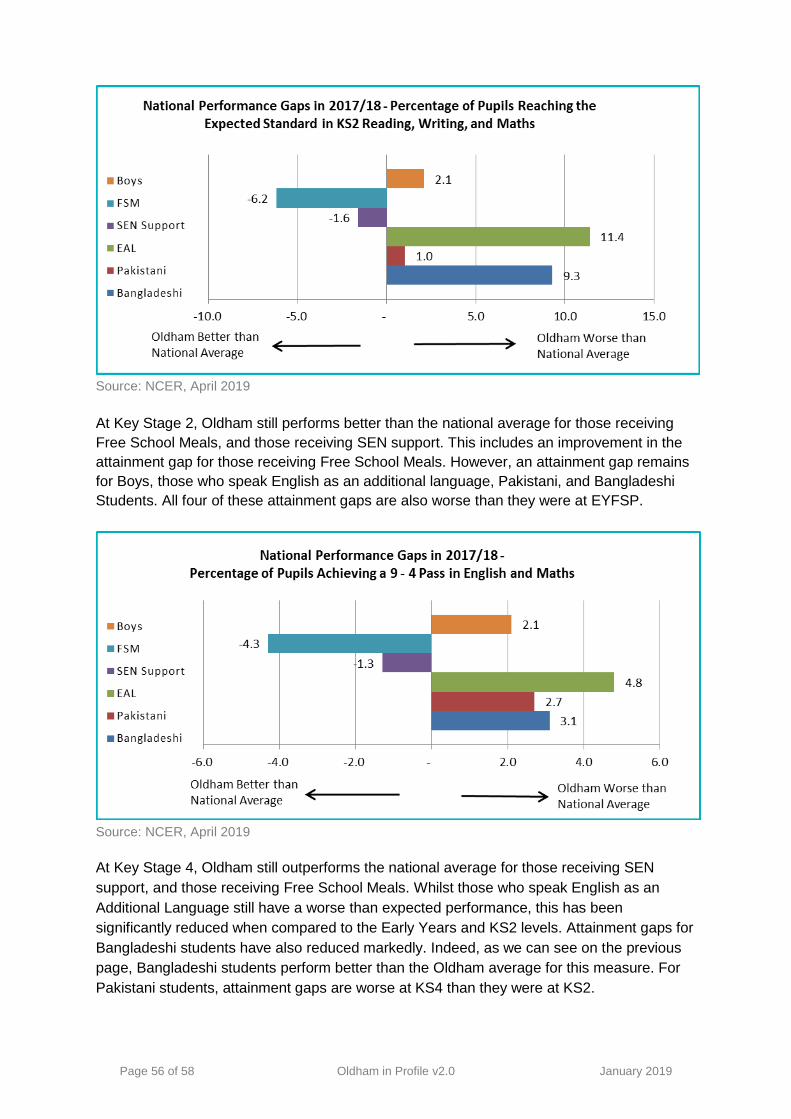
Page 56 of 58 Oldham in Profile v2.0 January 2019
Source: NCER, April 2019
At Key Stage 2, Oldham still performs better than the national average for those receiving
Free School Meals, and those receiving SEN support. This includes an improvement in the
attainment gap for those receiving Free School Meals. However, an attainment gap remains
for Boys, those who speak English as an additional language, Pakistani, and Bangladeshi
Students. All four of these attainment gaps are also worse than they were at EYFSP.
Source: NCER, April 2019
At Key Stage 4, Oldham still outperforms the national average for those receiving SEN
support, and those receiving Free School Meals. Whilst those who speak English as an
Additional Language still have a worse than expected performance, this has been
significantly reduced when compared to the Early Years and KS2 levels. Attainment gaps for
Bangladeshi students have also reduced markedly. Indeed, as we can see on the previous
page, Bangladeshi students perform better than the Oldham average for this measure. For
Pakistani students, attainment gaps are worse at KS4 than they were at KS2.
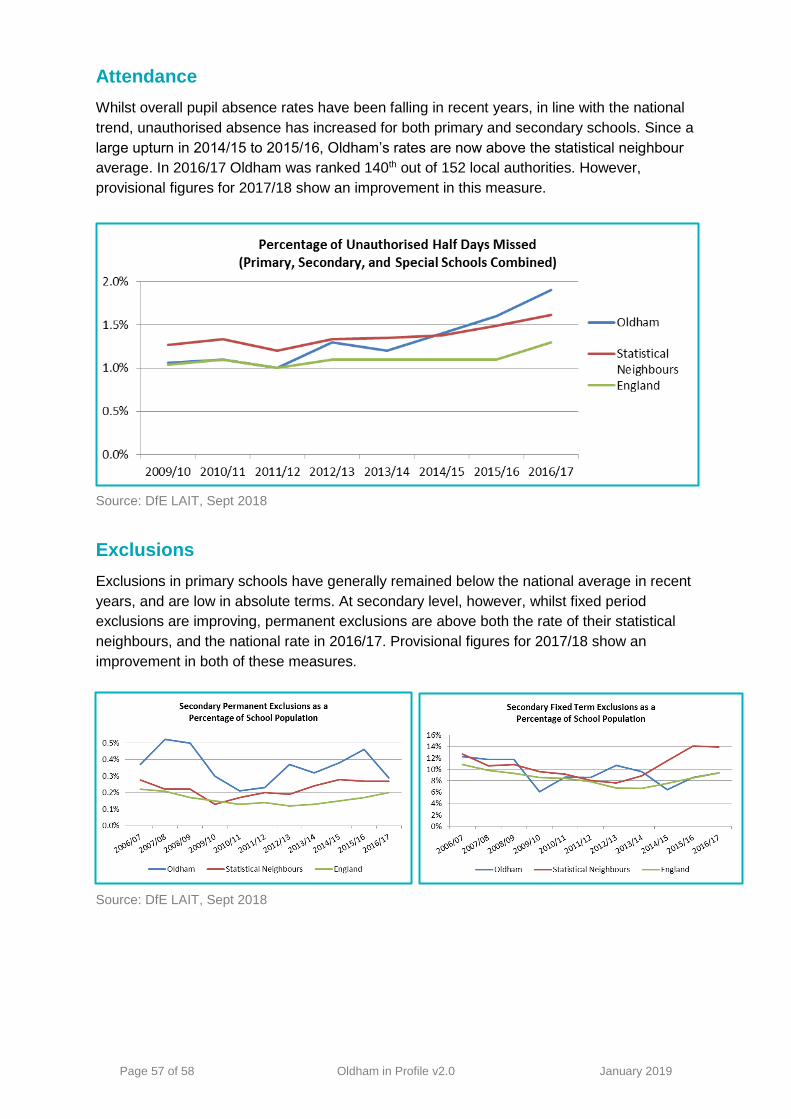
Page 57 of 58 Oldham in Profile v2.0 January 2019
Attendance
Whilst overall pupil absence rates have been falling in recent years, in line with the national
trend, unauthorised absence has increased for both primary and secondary schools. Since a
large upturn in 2014/15 to 2015/16, Oldham’s rates are now above the statistical neighbour
average. In 2016/17 Oldham was ranked 140th out of 152 local authorities. However,
provisional figures for 2017/18 show an improvement in this measure.
Source: DfE LAIT, Sept 2018
Exclusions
Exclusions in primary schools have generally remained below the national average in recent
years, and are low in absolute terms. At secondary level, however, whilst fixed period
exclusions are improving, permanent exclusions are above both the rate of their statistical
neighbours, and the national rate in 2016/17. Provisional figures for 2017/18 show an
improvement in both of these measures.
Source: DfE LAIT, Sept 2018

Page 58 of 58 Oldham in Profile v2.0 January 2019
Credits, Version Log, and Updates
Credits
Oldham in Profile is the work of many hands, including but perhaps not limited to:
Version Log
Version Changes Date By
1.0 First version for internal release, then external release. June 2017 MB
1.2 Updated Oldham’s Population to reflect 2016 Mid-Year
Estimates. Minor format changes (MB). Feb 2018 RE
2.0 Updated data and text for Population, Education, Health, and
Housing. Jan 2019 LR
2.1 Compressed graphics slightly for smaller file size. Feb 2019 MB
2.2 Updated Education section with new figures and text. April 2019 LR
Update and Addition Schedule
Future dates are aspirational only.
Chapter/Section Last amended Expected next amend
History of Oldham May 2017 N/A
Oldham’s Population Jan 2019 Autumn 2019
Oldham’s Economy May 2017 Autumn 2019
Oldham’s Health Jan 2019 Autumn 2019
Education and Skills April 2019 March 2020
Housing Jan 2019 Summer 2019
Environment and Countryside Not yet available Winter 2019
Co-operation and Community Not yet available 2020
Crime Not yet available Winter 2019
Chris Buglass
Martin Burroughs
Roy Egginton
Dan Hodgson
Joan Olajide
John Pritchard
Laurence Rafferty
Haydn Roberts
Jon Taylor
Emily Tunney