oligomeric amyloid-beta as a potential biomarker for ... · ii dedication to seshadri swamigal,...
TRANSCRIPT
Oligomeric amyloid-beta as a potential biomarker for Alzheimer's disease
by
Lalitha Venkataraman
A Thesis Presented in Partial Fulfillment
of the Requirements for the Degree
Master of Science
Approved July 2013 by the
Graduate Supervisory Committee:
Michael Sierks, Chair
Kaushal Rege
Christine Pauken
ARIZONA STATE UNIVERSITY
August 2013
i
ABSTRACT
Alzheimer's Disease (AD) is a progressive neurodegenerative disease accounting for 50-
80% of dementia cases in the country. This disease is characterized by the deposition of
extracellular plaques occurring in regions of the brain important for cognitive function. A primary
component of these plaques is the amyloid-beta (Aβ) protein. While a natively unfolded protein,
Aβ can misfold and aggregate generating a variety of different species including numerous
different soluble oligomeric species some of which are precursors to the neurofibrillary plaques.
Various of the soluble aβ oligomeric species have been shown to be toxic to cells and
their presence may correlate with progression of AD. Current treatment options target the
dementia symptoms, but there is no effective cure or alternative to delay the progression of the
disease once it occurs. Aβ aggregates show up many years before symptoms develop, so
detection of various Aβ aggregate species has great promise as an early biomarker for AD.
Therefore reagents that can selectively identify key early oligomeric Aβ species have value both
as potential diagnostics for early detection of AD and as well as therapeutics that selectively
target only the toxic Aβ aggregate species.
Earlier work in the lab includes development of several different single chain antibody
fragments (scFvs) against different oligomeric Aβ species. This includes isolation of C6 scFv
against human AD brain derived oligomeric Aβ (Kasturirangan et al., 2013). This thesis furthers
research in this direction by improving the yields and investigating the specificity of modified C6
scFv as a diagnostic for AD. It is motivated by experiments reporting low yields of the C6 scFv.
We also used the C6T scFv to characterize the variation in concentration of this particular
oligomeric Aβ species with age in a triple transgenic AD mouse model. We also show that C6T
can be used to differentiate between post-mortem human AD, Parkinson's disease (PD) and
healthy human brain samples. These results indicate that C6T has potential value as a diagnostic
tool for early detection of AD.

ii
DEDICATION
To Seshadri Swamigal, whose grace has helped me complete this project successfully and
my parents - for their love and support.

iii
ACKNOWLEDGMENTS
I would like to place on record my heartfelt thanks to my advisor, Dr. Michael Sierks for
his constant support and guidance through the past years. He has always been a constant source of
inspiration and has guided me through the last few years to complete my Masters. I would like to
say thanks for all the opportunities he provided me while working in his laboratory, which
include numerous research projects and attending conferences. I would also like to thank Dr.
Kaushal Rege and Dr. Christine Pauken for agreeing to serve on my thesis committee.
I would like to thank Dr. Sharareh Emmadi and Philip Schulz who were very helpful and
instrumental in the completion of this project. I would also like to thank Dr. Stephanie Williams
for helping me out with the ELISA protocol discussed in the characterization studies. My
colleagues and lab mates Dr. Wei Xin, Dr. Patrick Yang, Huilai, Taylor, Jessica, and Vick have
played an important role in making the lab a fun place to work in. I not only had fun but learnt a
lot from each and every one of you.
Last but not the least, I would like to thank my parents who have been very supportive
through the years and have always believed in and encouraged me to pursue my dreams. I would
also like to thank my brother, my role model, for being a constant source of inspiration and for
urging me to always aim high. Thanks for being there for me. Last but not the least, I would like
to thank my roommates for making me feel at 'home' away from home. Couldn't have done it
without your support!
iv
TABLE OF CONTENTS
Page
LIST OF TABLES .............................................................................................................................. vi i
LIST OF FIGURES ............................................................................................................................ viii
CHAPTER
1 INTRODUCTION ........................................................................................................... 1
1.1 Alzheimer's Disease .............................................................................................. 1
1.2 Neuropathology and biochemical changes ..................... .....................................2
1.2.1 Plaques.............................................................................................3
1.2.2 Neurofibrillary Tangles (NFT).........................................................4
1.2.3 Braak staging....................................................................................4
1.3 AD Genetics......................................................................................................5
1.3.1 Apolipoprotein-E (APOE)................................................................5
1.3.2 Presinilin-1 and Presinilin-2.............................................................6
1.3.3 Amyloid precursor protein (APP).....................................................6
1.4 AD Pathogenesis...............................................................................................7
1.4.1 Cholinergic hypothesis.....................................................................7
1.4.2 Tau hypothesis..................................................................................8
1.4.3 Amyloid hypothesis..........................................................................8
1.5 Role of Aβ in AD............................................................................................10
1.6 Oligomeric Aβ-potential biomarker................................................................10
1.7 Targeting oligomeric Aβ.................................................................................12
1.8 scFv based therapeutics..................................................................................13
1.9 Research Objectives........................................................................................14
v
2 FRAMESHIFT CORRECTION .................................................................................... 15
2.1 Introduction.... ..................................................................................................... 15
2.2 Experimental procedure ................................................................................. .....16
2.2.1 Plasmid isolation.............................................................................16
2.2.2 Restriction digestion.......................................................................16
2.2.3 Dialysis tubing method...................................................................17
2.2.4 Polymerase chain reaction..............................................................17
2.2.5 Ligation Reaction............................................................................18
2.2.6 Competent cell preparation and transformation.............................18
2.2.7 Expression and purification of scFv...............................................19
2.2.8 C6 and C6T comparison.................................................................19
2.2.9 C6T phage production....................................................................20
2.2.9.1 Phage titer.......................................................................20
2.3 Results and Discussion...................................................................................20
2.3.1 Plasmid isolation and digestion......................................................20
2.3.2 Frameshift correction......................................................................21
2.3.3 C6 vs. C6T Western blot................................................................23
2.3.4 C6T phage production....................................................................24
3 TISSUE CULTURE AND CHARACTERIZATION STUDIES ................................. 25
3.1 Introduction ......................................................................................................... 25
3.2 Experimental procedure ...................................................................................... 26
3.2.1 7PA2 and CHO dot blot..................................................................26
3.2.1.1 7PA2 and CHO cell line maintenance............................26
3.2.1.2 Preparation of synthetic Aβ............................................27
3.2.1.3 7PA2 and CHO dot blot..................................................27
vi
3.2.2 AFM sample preparation................................................................28
3.2.3 C6T-Aβ co-incubation....................................................................28
3.2.4 Mouse tissue dot blot......................................................................28
3.2.5 C6T sandwich ELISA.....................................................................29
3.2.5.1 C6T scFv capture............................................................30
3.2.5.2 H1V2 phage biotinylation..............................................31
3.2.5.3 ELISA Mice sample preparation....................................31
3.2.5.4 ELISA Human sample preparation.................................32
3.2.5.5 ELISA protocol...............................................................32
3.3 Results and Discussion...................................................................................32
3.3.1 7PA2 and CHO dot blot assay........................................................32
3.3.2 AFM Imaging.................................................................................34
3.3.3 Aβ-C6T co-incubation....................................................................35
3.3.4 Mouse tissue dot blot......................................................................37
3.3.5 C6T Sandwich ELISA....................................................................38
3.3.5.1 C6T scFv capture ELISA...............................................38
3.3.5.2 H1V2 phage biotinylation.............................................39
3.3.5.3 Mouse ELISA.................................................................40
3.3.5.4 Human ELISA................................................................41
4 CONCLUSION .......................................................................................................... ...43
Summary ................................................................................................................... 43
Future work ............................................................................................................... 44
REFERENCES ................................................................................................................................... 45
vii
LIST OF TABLES
Table Page
2.1 Restriction digestion of C6T.......................................................................... ...............16
2.2 PCR reaction setup........................................................................................................ 17
2.3 Corrected C6T DNA sequence..................................................................................... 22
3.1 BCA assay-mice samples for dot blot.......................................................................29
3.2 BCA assay-mice samples for ELISA........................................................................31
3.3 C6T scFv on ELISA..................................................................................................38
3.4 H1V2 phage biotinylation.........................................................................................39
3.5 ELISA mice sample analysis....................................................................................40
3.6 ELISA human sample analysis.................................................................................42
viii
LIST OF FIGURES
Figure Page
1.1 Plaques and NFTs in Alzheimer's brain ........................................................................ 1
1.2 Healthy vs. Alzheimer's brain ....................................................................................... 3
1.3 Braak stages ................................................................................................................... 5
1.4 APP processing...........................................................................................................9
1.5 Amyloid cascade hypothesis.....................................................................................11
1.6 Aggregation of Aβ....................................................................................................12
1.7 scFv representation...................................................................................................13
2.1 C6 frameshift mutation.............................................................................................15
2.2 Ni bead scFv extraction............................................................................................19
2.3 Cut C6 plasmid on 2% agarose gel...........................................................................21
2.4 C6T scFv production.................................................................................................23
2.5 C6 vs. C6T production..............................................................................................24
3.1 Atomic force microscopy (AFM) principle..............................................................26
3.2 C6T Sandwich ELISA..............................................................................................30
3.3 7PA2 and CHO dot blot with 6E10 primary.............................................................33
3.4 7PA2 and CHO dot blot with C6T scFv...................................................................34
3.5 AFM images of 7PA2 and CHO with C6T phage....................................................35
3.6 C6T-Aβ co-incubation..............................................................................................36
3.7 Mouse dot blot..........................................................................................................37
3.8 ImageJ analysis of mouse dot blot............................................................................37
3.9 C6T ELISA with mice samples................................................................................41
1
Chapter 1
INTRODUCTION
1.1 Alzheimer's disease:
Alzheimer's disease (AD) is a progressive neurodegenerative disease accounting for 50-80% of
dementia cases and is the 6th leading cause of death in the country (“Alzheimer’s disease,” n.d.).
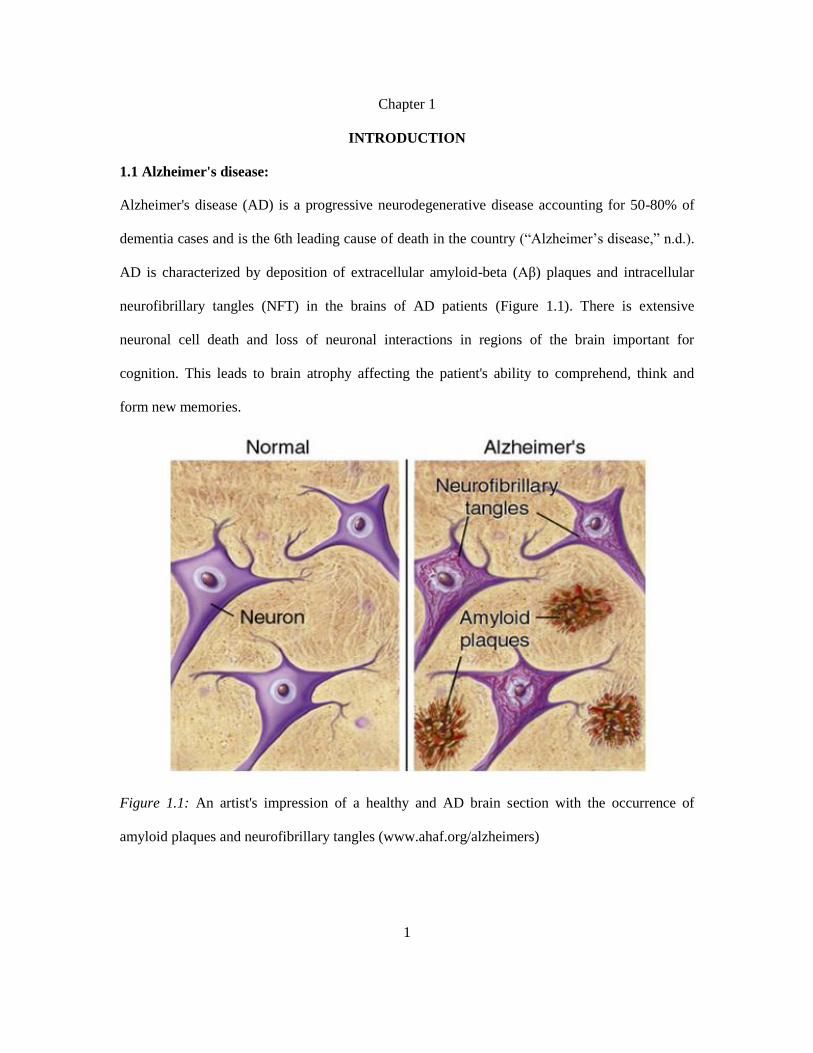
AD is characterized by deposition of extracellular amyloid-beta (Aβ) plaques and intracellular
neurofibrillary tangles (NFT) in the brains of AD patients (Figure 1.1). There is extensive
neuronal cell death and loss of neuronal interactions in regions of the brain important for
cognition. This leads to brain atrophy affecting the patient's ability to comprehend, think and
form new memories.
Figure 1.1: An artist's impression of a healthy and AD brain section with the occurrence of
amyloid plaques and neurofibrillary tangles (www.ahaf.org/alzheimers)
2
Current drugs try to improve the general condition of the patients by treating their behavioral and
cognitive symptoms. Drugs like Donepezil and Rivastigmine are cholinesterase inhibitors and are
commonly prescribed to treat cognitive deficits (Bond et al., 2012). Memantine is another drug
commonly prescribed that regulates glutamate, a chemical messenger involved in memory and
learning. Although these drugs can't reverse disease progression, they help reduce the symptoms
and stabilize the condition over a small period of time. Unfortunately, there is no effective
therapy to cure or slow down the progression of the disease once it occurs.
AD not only affects patients but also takes its toll on immediate family, friends and caregivers. As
the disease progresses, significant demands are placed on care givers, resulting in increased
stress, physical exhaustion and emotional drain. Caregivers of patients with AD and other
dementias face additional health care costs of their own. These factors stress the importance of
understanding the underlying mechanism of AD to design better treatment options.
1.2 Neuropathology and biochemical changes:
Although AD has characteristic clinical features which include memory loss and behavioral
changes like depression and irritability, a neuropathological examination of the diseased brain is
required for a definitive diagnosis to distinguish it from other dementias. Microscopic changes in
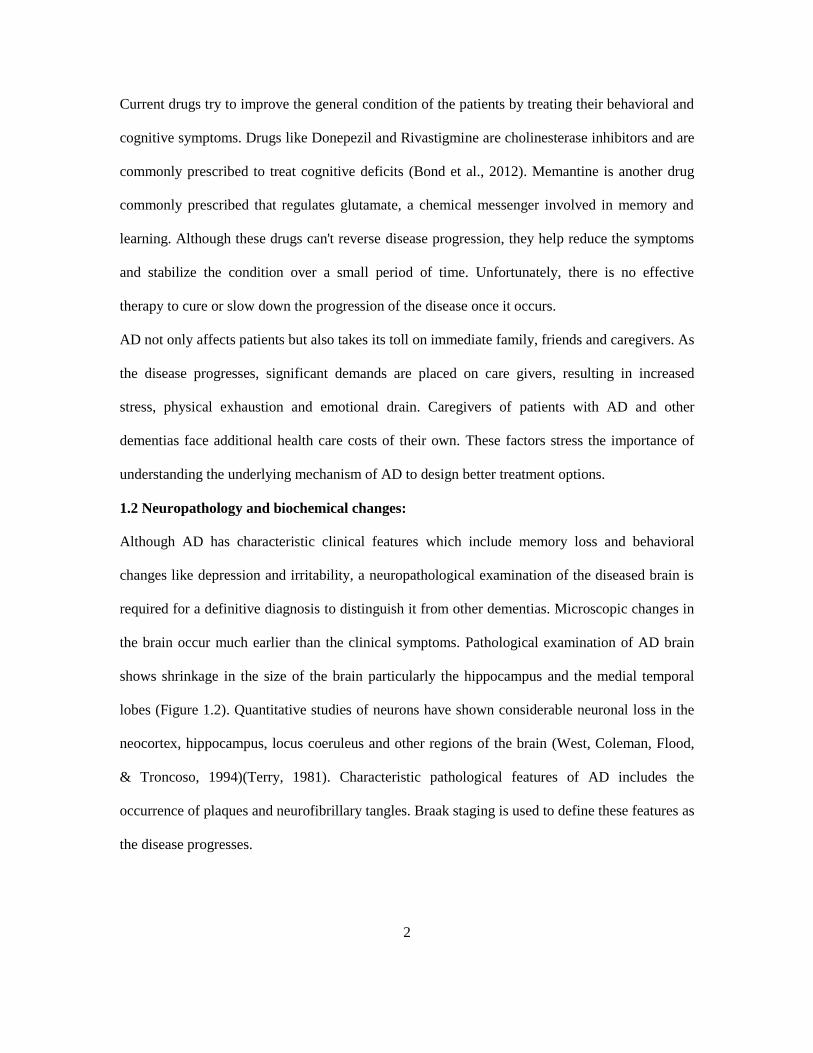
the brain occur much earlier than the clinical symptoms. Pathological examination of AD brain
shows shrinkage in the size of the brain particularly the hippocampus and the medial temporal
lobes (Figure 1.2). Quantitative studies of neurons have shown considerable neuronal loss in the
neocortex, hippocampus, locus coeruleus and other regions of the brain (West, Coleman, Flood,
& Troncoso, 1994)(Terry, 1981). Characteristic pathological features of AD includes the
occurrence of plaques and neurofibrillary tangles. Braak staging is used to define these features as
the disease progresses.
3
Figure 1.2: Shrinkage of cerebral cortex and hippocampus associated with AD compared to
healthy brain (www.nia.nih.gov/alzheimers).
1.2.1 Plaques. Extensive amyloid plaques are a characteristic feature of AD and vary in
size between 5-200mm. Previous studies have shown that the amyloid plaque core from AD brain
is similar to the amyloid found in Down's syndrome patients (Masters, Multhaup, Simms,
Martins, & Beyreuther, 1985). It was also shown that amyloid in these plaques is actually cleaved
from a larger precursor protein called the amyloid precursor protein (Weidemann et al., 1989).
Plaques have an amyloid core with aggregates forming β pleated sheets. They can be classified as
neuritic plaques, plaques surrounded by degenerate neurites, and diffuse plaques based on
4
differences in their structure. The diffuse plaques do not take up congo red stain and have Aβ (1-
42) as its main component which is similar to Down's syndrome. An anti-Aβ antibody can be
used to visualize the different plaques in immunocytochemistry. The neuritic plaques on the other
hand, have a defined central core structure which take up the stain. Its main component is a
shorter Aβ (1-40). Diffuse plaques are found commonly in the cerebellum while both diffuse and
neuritic plaques occur together in other regions of the brain (Joachim, Morris, & Selkoe, 1989).
The exact nature of plaque formation is not clear. It could be due to irregular processing of APP,
or improper metabolization of Aβ which disrupts its clearance in the brain and causes its
accumulation. Even though amyloid plaques occur in the process of normal aging and in other
neurodegenrative diseases, its occurrence in AD is relatively high which makes it one of the
defining features of AD (Tomlinson, Blessed, & Roth, 1997)(Perry et al., 1978).
1.2.2 Neurofibrillary tangles (NFT). Neurofibrillary tangles are intraneuronal structures
whose primary component is hyperphosphorylated tau (Iy, Wu, Smith, Grundke-iqbal, & Y,
1998). It is one of the key features of AD following plaque formation. Tau is a microtubule
associated protein helping in microtubule formation and stabilization. However in AD, the
hyperphosphorylated tau can no longer bind to the microtubules and start clumping together (Lee
et al., 2005). This, eventually, leads to the formation of NFT. The size of the NFTs depends on
the neuron size with some of the largest typically found in the locus coeruleus. Neuropil threads
are linear structures consisting of dendrites of neurons with NFT (Islands, 1986).They can be
easily visualized using thioflavin or silver staining.
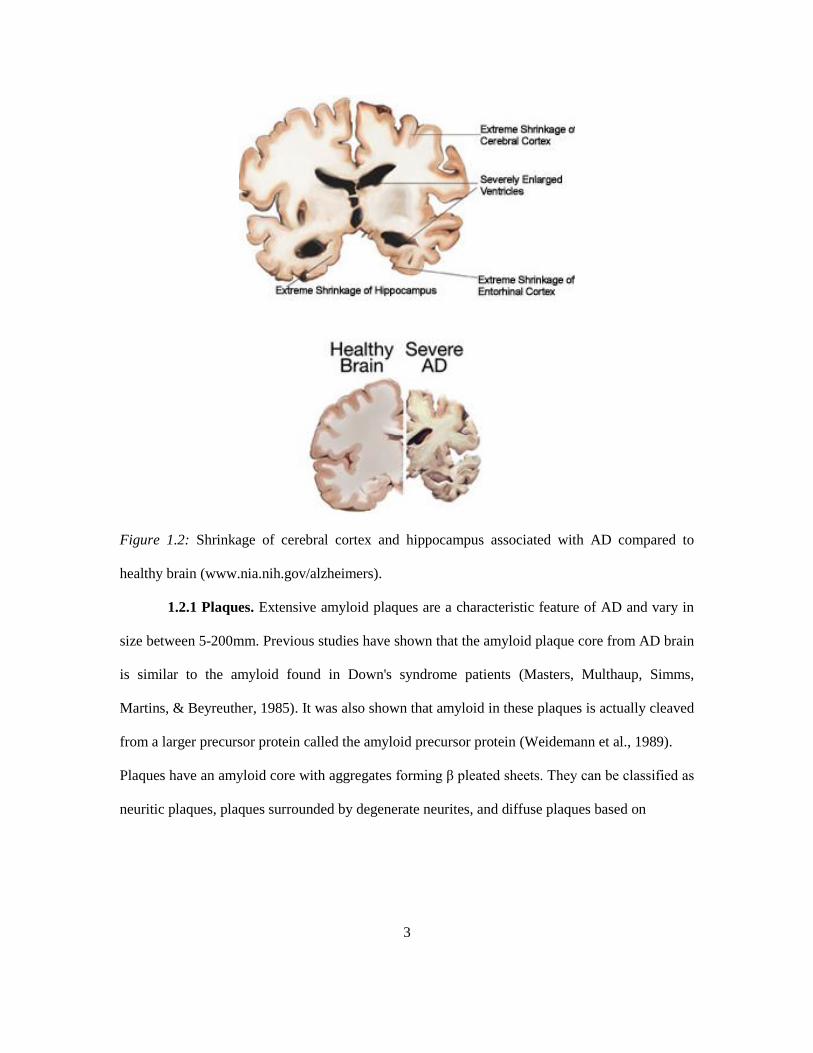
1.2.3 Braak staging. Braak staging is a technique used to describe the number of tau
tangles present in the brain by defining six different stages as shown in Figure 1.3 (Braak &
Braak, 1991).
5
Figure 1.3: Braak stages of tau tangle formation in AD. (Adapted from
www.nia.nih.gov/alzheimers).
Stage I and II is characterized by the presence of hyperphosphorylated tau in the transentorhinal
region with the occurrence of a few tangles between the cortex and hippocampus. There are no
obvious signs of memory impairment with minor mood and personality changes.
There is extensive neuronal cell death in the hippocampus in stages III and IV with tangles
beginning to form in the neocortex of the brain. Patients in these stages are diagnosed with
dementia and experience hallucinations accompanied by changes in behavior such as frequent
irritability, anger and a loss of self-awareness. Patients in stage V and VI are classified with
severe dementia. They have trouble taking care of themselves and require constant supervision
for day-to-day activities.
1.3 AD Genetics:
The onset of AD is largely sporadic with certain mutations and environmental factors playing a
crucial role. 0.1% of the cases, on the other hand, are familial and lead to early onset of familial
Alzheimer's Disease (FAD) (Blennow, De Leon, & Zetterberg, 2006). Studying the genetics
involved in AD helps us understand risk factors involved. Mutations in APP, presenilin-1 and
presenilin-2 (PS1 and PS2) are associated with FAD while the APOE gene has been implicated in
genetic linkage studies for late onset Alzheimer's (Ganzer et al., 2003).
1.3.1 Apolipoprotein-E (APOE). Genetic linkage studies have shown APOE to be a
major risk factor in the late onset, sporadic form of AD (Ganzer et al., 2003)(Schmechel et al.,
6
1993). The APOE gene is located on chromosome 19q13.2, and codes for a protein (317 residues
long) responsible for binding, internalization and catabolism of lipoprotein particles. APOE is
synthesized by glial cells in the brain and has three common isoforms: APOE2, APOE3 and
APOE4. Studies have shown that APOE interacts with Aβ by catalyzing its breakdown both
within and outside the cell (Wisniewski, Frangione, 1992). The E4 allele however is not as
effective as the rest in this process. This makes individuals carrying the APOE4 allele more
susceptible to AD (Jiang et al., 2008).
1.3.2 Presenilin-1 and Presenilin-2. The PS1 gene is located on chromosome 14q24.2
and PS2 is located on chromosome 1q42.13. These genes have been shown to be associated with
FAD (St George-Hyslop, 1995)(Levy-lahad et al., 2013). PS2 encodes a 448 amino acid
polypeptide that has a 67% homology with PS1. Both of these have distinct but overlapping γ-
secretase activity which is involved APP processing (Kopcho et al., 2003). It has been shown that
presenilin forms the catalytic core of the γ-secretase that interacts with APP (Schroeter et al.,
2003).
Studies have shown that mutations in the PS1 leads to an increased Aβ-42 to Aβ-40 ratio
resulting in occurrence of AD in the 26-60years age group (Gustafson et al., 1998)(Jonghe et al.,
1999) while mutations in PS2 lead to onset of AD in the 40-75 year age group. About 130
mutations in PS1 have been identified with FAD compared to PS2, which is not as common.
1.3.3 Amyloid precursor protein (APP). APP gene is located on chromosome 21q21.2
and codes for an integral membrane protein expressed in most tissues. It has seven known
alternate transcripts of which APP695 is expressed in neurons while APP770 transcript is
expressed in other tissues. The exact role of APP is not clear although it has been implicated in
7
synpase formation and neural plasticity (Priller et al., 2006)(Turner, O’Connor, Tate, & Abraham,
2003).
Mutations in APP have been associated with FAD (Owen & Hardy, 1991). β and γ-secretase
enzymes are responsible for the cleavage of APP resulting in toxic Aβ species. Most of the
mutations in APP occur near the β-secretase site, which results in an overall increase in the toxic
Aβ species without a change in the Aβ40/Aβ42 ratio. However mutations in the γ-secretase site
leads to an increase in the Aβ40/Aβ42 ratio (Citron & Oltersdorf, 1992)(De Strooper & Annaert,
2000). Understanding the genetic component of AD helps in understanding the transmission and
the risk factors associated with it. However a systematic, multi-pronged approach is required to
understand its etiology.
1.4 AD pathogenesis:
There are three major hypotheses that try to explain the hallmarks of AD and the underlying
disease mechanism. They are the cholinergic hypothesis, amyloid hypothesis and the tau
hypothesis.
1.4.1 Cholinergic hypothesis. Cholinergic is one of the oldest hypotheses proposed for
AD. The cholinergic hypothesis states that AD is caused by the reduced synthesis of the
neurotransmitter acetylcholine. Here, the loss of cholinergic neurons and associated factors relate
better with preclinical symptoms like memory loss (P. Davies & Maloney, 1976)(Bartus, Dean,
Beer, & Lippa, 1982). Although there is Aβ accumulation in the brains of AD leading to senile
plaques, neuronal loss and changes in neurotransmitter levels correlate better with disease
progression. Studies show that while cholinergic, seratonergic and glutamatergic deficits exist,
other catecholamine, GABAergic and somatostatin neurons remain unaffected in moderate AD
(Fracis & Bowen, 1993)(P. H. Davies, Stewart, Lancranjan, Sheppard, & Stewart, 1998).
8
The initial medications for Alzheimer's, based on this hypothesis was to preserve the
neurotransmitter acetylcholine by inhibiting the acetylcholinesterases. Although these drugs treat
only the symptoms of the disease and can't reverse the condition, they provide temporary relief
from memory loss symptoms. It is possible that the acetylcholine deficiencies observed might be
a result of widespread brain tissue damage.
1.4.2 Tau hypothesis. There are two proteins that misfold and aggregate in AD: Aβ and
the tau protein leading to the formation of plaques and tangles. The tau hypothesis states that the
neurotoxicity in AD brains is due to the occurrence of hyperphosphorylated tau. The
hyperphosphorylated tau aggregates to form paired helical filaments (PHF), twisted ribbons and
straight filaments (SF) (Iy et al., 1998)(Lee et al., 2005). This results in microtubule dissociation
which affects the internal transport network of the neuron eventually leading to neuronal loss
(Alonso, Zaidi, Grundke-Iqbal, & Iqbal, 1994). Although Aβ formation is thought to play a role
in tau hyper-phosphorylation (Zheng, Bastianetto, Mennicken, Ma, & Kar, 2002) their exact
relationship and role in AD is not clear.
1.4.3 Amyloid hypothesis. A major component of the neuritic plaques in AD is the Aβ
protein which was isolated and sequenced followed by the isolation and sequencing of APP from
which it is generated(Glenner & Wong, 1984)(Masters et al., 1985). According to the amyloid
hypothesis, the formation of Aβ peptide and its aggregation is responsible for the AD pathology.
9
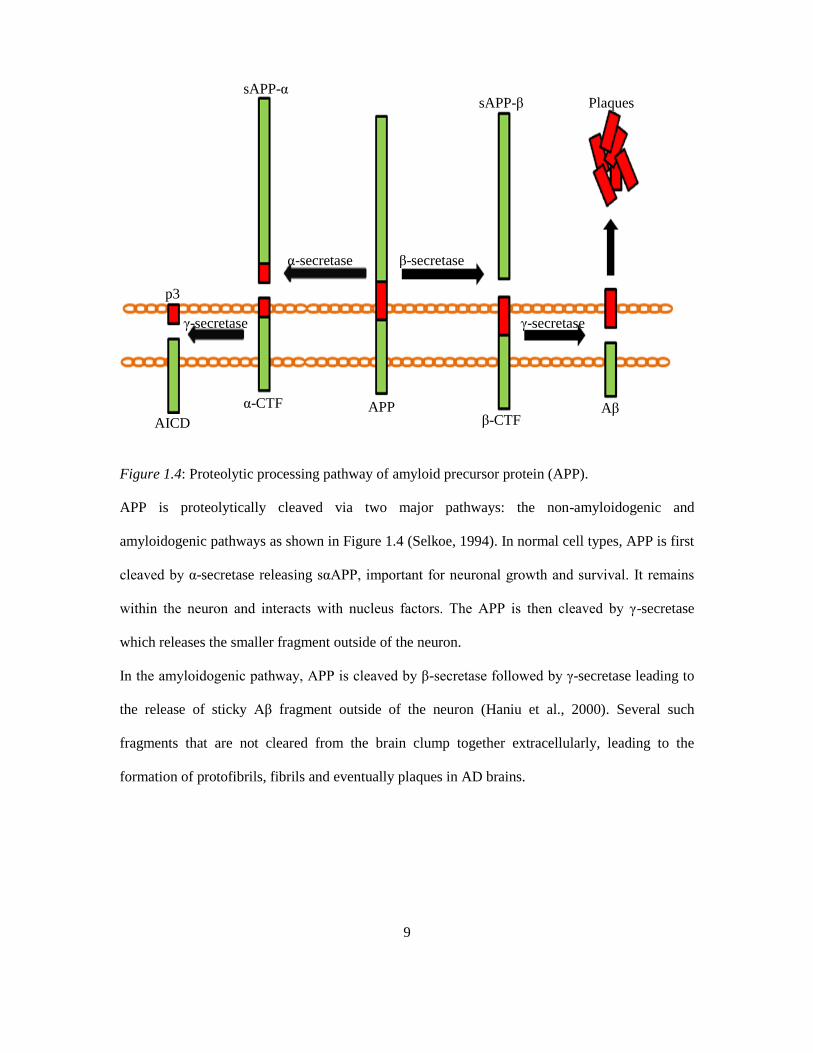
Figure 1.4: Proteolytic processing pathway of amyloid precursor protein (APP).
APP is proteolytically cleaved via two major pathways: the non-amyloidogenic and
amyloidogenic pathways as shown in Figure 1.4 (Selkoe, 1994). In normal cell types, APP is first
cleaved by α-secretase releasing sαAPP, important for neuronal growth and survival. It remains
within the neuron and interacts with nucleus factors. The APP is then cleaved by γ-secretase
which releases the smaller fragment outside of the neuron.
In the amyloidogenic pathway, APP is cleaved by β-secretase followed by γ-secretase leading to
the release of sticky Aβ fragment outside of the neuron (Haniu et al., 2000). Several such
fragments that are not cleared from the brain clump together extracellularly, leading to the
formation of protofibrils, fibrils and eventually plaques in AD brains.
APP
α-secretase β-secretase
sAPP-α sAPP-β
γ-secretase γ-secretase
Aβ
Plaques
AICD
p3
β-CTF
α-CTF
10
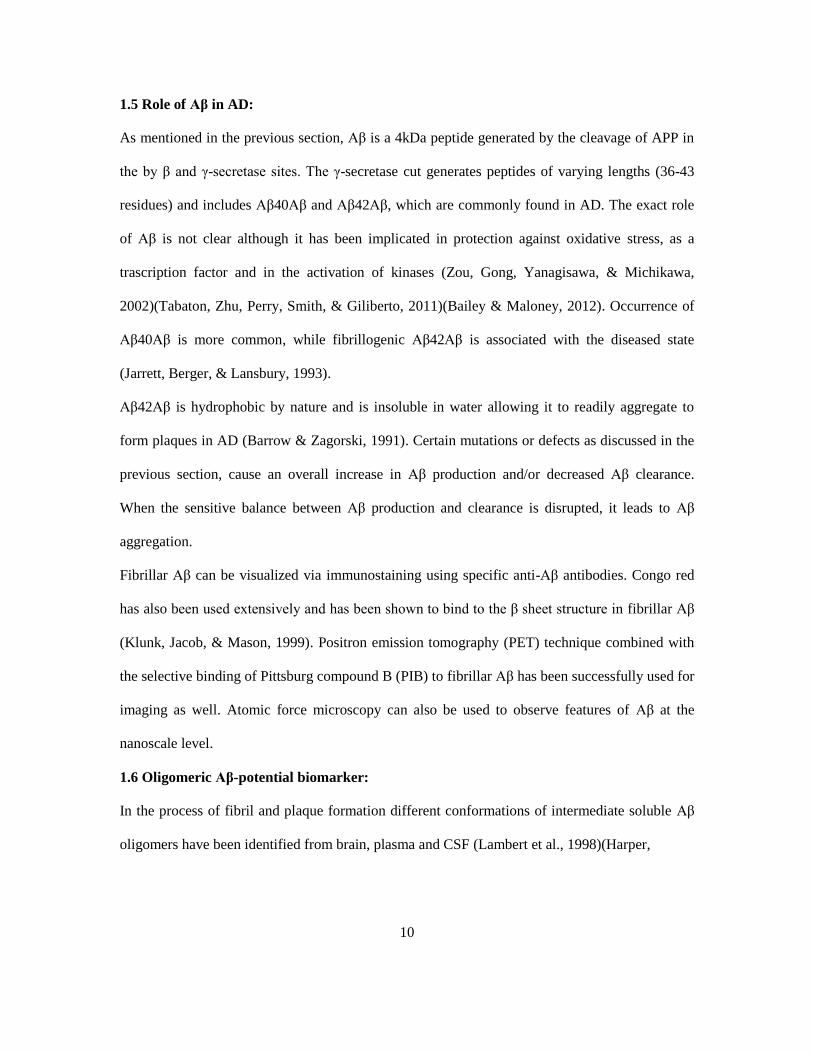
1.5 Role of Aβ in AD:
As mentioned in the previous section, Aβ is a 4kDa peptide generated by the cleavage of APP in
the by β and γ-secretase sites. The γ-secretase cut generates peptides of varying lengths (36-43
residues) and includes Aβ40Aβ and Aβ42Aβ, which are commonly found in AD. The exact role
of Aβ is not clear although it has been implicated in protection against oxidative stress, as a
trascription factor and in the activation of kinases (Zou, Gong, Yanagisawa, & Michikawa,
2002)(Tabaton, Zhu, Perry, Smith, & Giliberto, 2011)(Bailey & Maloney, 2012). Occurrence of
Aβ40Aβ is more common, while fibrillogenic Aβ42Aβ is associated with the diseased state
(Jarrett, Berger, & Lansbury, 1993).
Aβ42Aβ is hydrophobic by nature and is insoluble in water allowing it to readily aggregate to
form plaques in AD (Barrow & Zagorski, 1991). Certain mutations or defects as discussed in the
previous section, cause an overall increase in Aβ production and/or decreased Aβ clearance.
When the sensitive balance between Aβ production and clearance is disrupted, it leads to Aβ
aggregation.
Fibrillar Aβ can be visualized via immunostaining using specific anti-Aβ antibodies. Congo red
has also been used extensively and has been shown to bind to the β sheet structure in fibrillar Aβ
(Klunk, Jacob, & Mason, 1999). Positron emission tomography (PET) technique combined with
the selective binding of Pittsburg compound B (PIB) to fibrillar Aβ has been successfully used for
imaging as well. Atomic force microscopy can also be used to observe features of Aβ at the
nanoscale level.
1.6 Oligomeric Aβ-potential biomarker:
In the process of fibril and plaque formation different conformations of intermediate soluble Aβ
oligomers have been identified from brain, plasma and CSF (Lambert et al., 1998)(Harper,
11
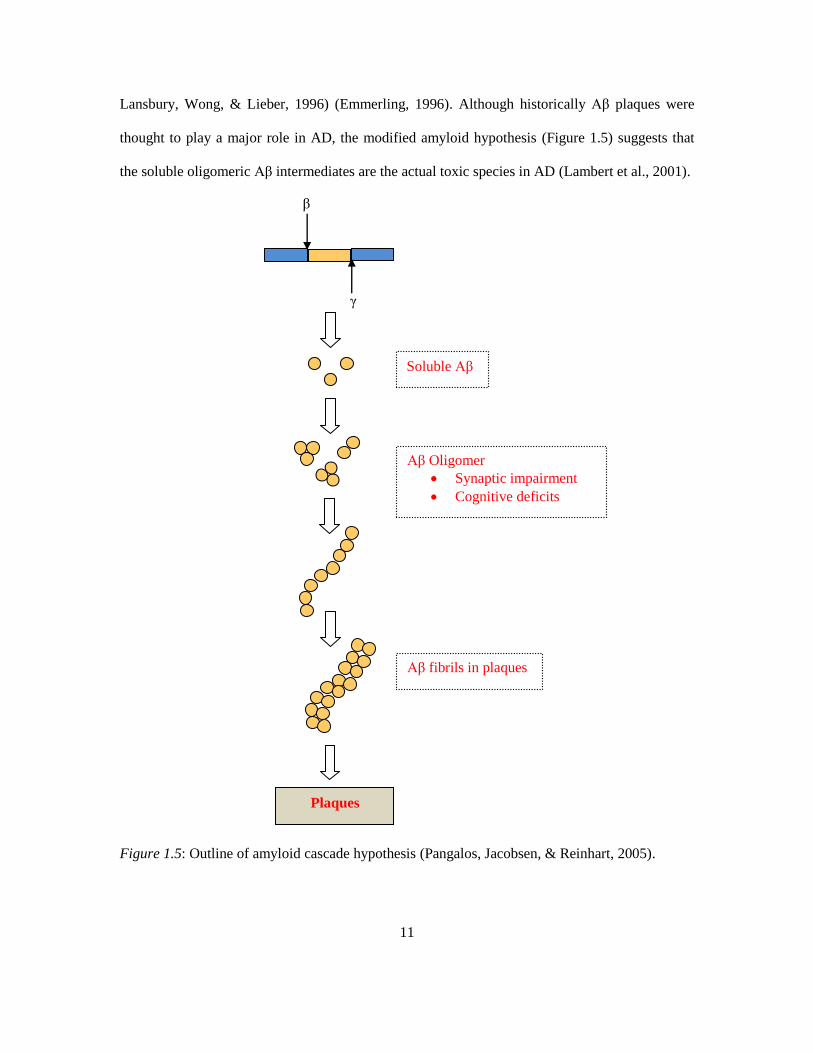
Lansbury, Wong, & Lieber, 1996) (Emmerling, 1996). Although historically Aβ plaques were
thought to play a major role in AD, the modified amyloid hypothesis (Figure 1.5) suggests that
the soluble oligomeric Aβ intermediates are the actual toxic species in AD (Lambert et al., 2001).
Figure 1.5: Outline of amyloid cascade hypothesis (Pangalos, Jacobsen, & Reinhart, 2005).
γ
β
Plaques
Soluble Aβ
Aβ Oligomer
Synaptic impairment
Cognitive deficits
Aβ fibrils in plaques
12
These oligomers have been shown to be synapto-toxic leading to disruption of synaptic plasticity
(Shankar et al., 2009). Studies have also shown that these species correlate better with neuronal
loss and deficits in memory compared to plaque deposits (Francisco, Jolla, Pharmaceuticals, &
San, 1999)(Näslund et al., 2013).
Studies show that different oligomers permeabilize cell membranes, assemble into lipid bilayers
(Bucciantini et al., 2002) and localize in lipid rafts, regions rich in cholesterol and
glycosphingolipids (Simons & Toomre, 2000). Aβ largely resides in lipid rafts in the brain
(Morishima-kawashima & Ihara, 1998) and it is possible that these lipid rafts provide the right
environment for the oligomerization of Aβ.
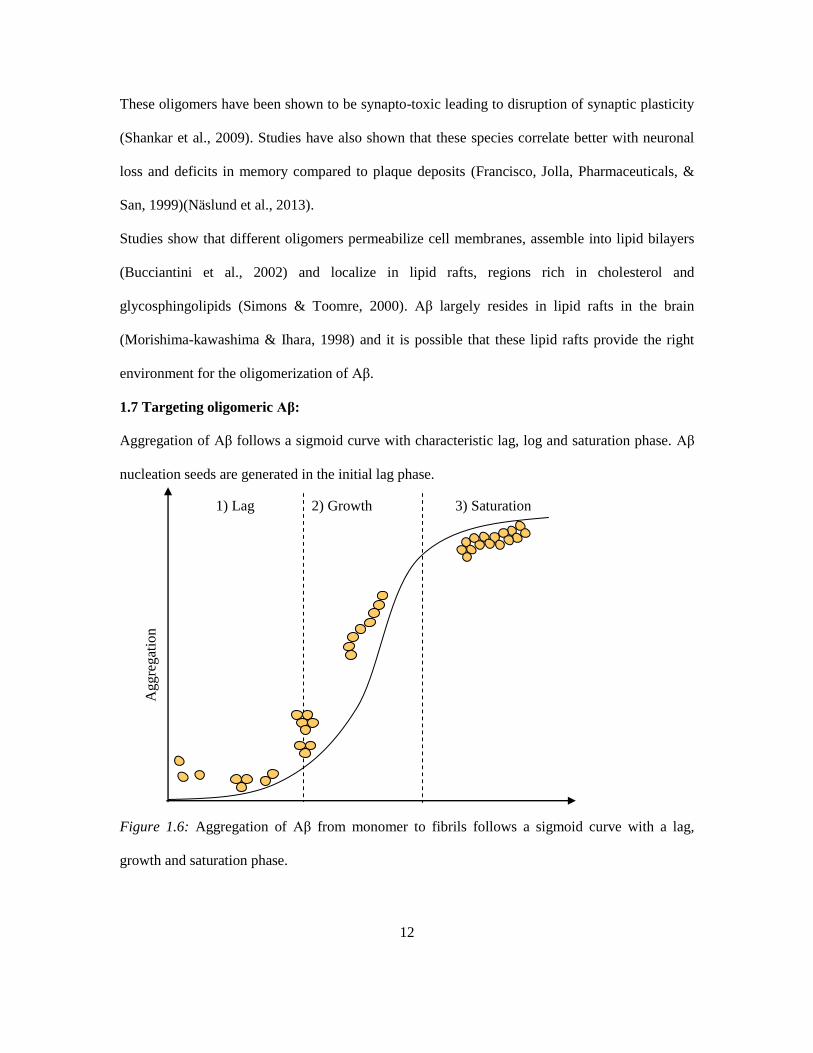
1.7 Targeting oligomeric Aβ:
Aggregation of Aβ follows a sigmoid curve with characteristic lag, log and saturation phase. Aβ
nucleation seeds are generated in the initial lag phase.
Figure 1.6: Aggregation of Aβ from monomer to fibrils follows a sigmoid curve with a lag,
growth and saturation phase.
1) Lag 2) Growth 3) Saturation
Aggre
gat
ion
13
This is followed by the elongation step where oligomeric Aβ further aggregate to form fibrils.
However there are some oligomers that might be off the pathway and don't lead to fibril
formation. Studies show that oligomeric Aβ are the synapto-toxic species in AD pathogenesis and
are potential targets for developing therapeutics. Compounds like cholyl amide PPI-368 and PPI-
3019 have shown to delay Aβ nucleation in-vitro (Wolfe, Esler, & Das, 2002). Although
immunization with aggregated Aβ delayed its deposition and cleared away existing Aβ in mice
(Schenk et al., 1999)(Bard et al., 2000), side effects like meningoencephalitis were experienced in
the human trial (Delrieu, Ousset, Caillaud, & Vellas, 2012). Despite the recent Aβ immunization
trials in humans, targeting oligomeric Aβ holds considerable promise.
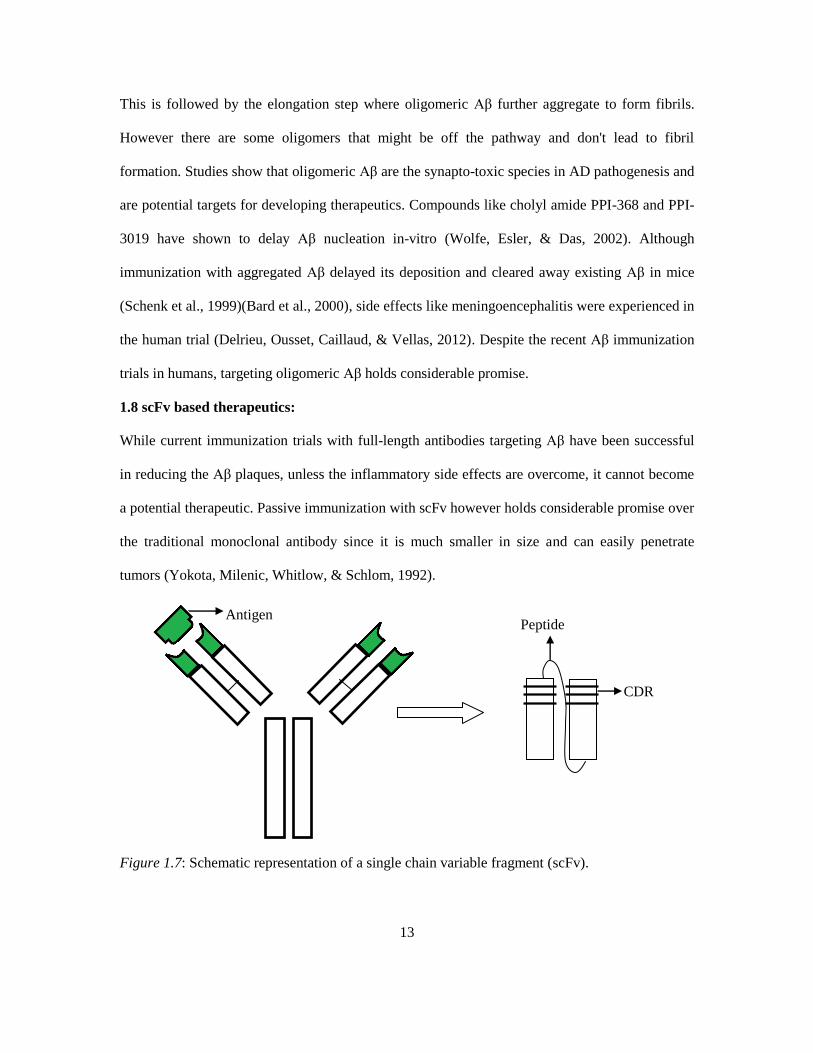
1.8 scFv based therapeutics:
While current immunization trials with full-length antibodies targeting Aβ have been successful
in reducing the Aβ plaques, unless the inflammatory side effects are overcome, it cannot become
a potential therapeutic. Passive immunization with scFv however holds considerable promise over
the traditional monoclonal antibody since it is much smaller in size and can easily penetrate
tumors (Yokota, Milenic, Whitlow, & Schlom, 1992).
Figure 1.7: Schematic representation of a single chain variable fragment (scFv).
Peptide
linker
CDR
Antigen
14
In other words, the scFv retains the antigen binding domains of its parent antibody while its small
size allows easier tissue penetration. scFv uptake by the kidney is usually low and its rapid
clearance from blood make it a favorable reagent for use in therapeutics (Kim et al., 2002).
Phage display scFv has several other advantages over using a full-length antibody. They can be
rapidly produced in E. coli, yeast and a variety of other hosts and can be manipulated with great
ease to therapeutic needs. They are potential interventional agents and have been used in a
number of diseases like cancer (Arafat, Gomez-Navarro, & Xiang, 2002). Therefore diagnostic
and therapeutic strategies involving scFv hold great promise for AD.
1.9 Research Objectives:
As discussed above, there is need for an anti-oligomeric Aβ for diagnostic and therapeutic
purposes in AD. With these motivations in mind, this thesis presents characterization of an anti-
oligomeric C6 scFv, isolated against human brain derived oligomeric Aβ Kasturirangan et al.,
(2013).
The research objectives include:
1) Identifying and rectifying the cause for low scFv yields: frameshift mutation.
2) Characterizing the fixed C6'T' clone using 7PA2 cell line over expressing Aβ oligomers.
3) C6T as a diagnostic tool: Characterizing AD mouse and human post-mortem tissue
samples.
This thesis consists of four parts, where chapter 2 deals with the occurrence of frameshift
mutation in the C6 sequence and its correction. Chapter 3 presents detailed characterization
studies of the fixed C6T clone with homogenized AD mice and human brain tissue samples.
Chapter 4 provides an overall summary of the work and recommended future directions.
15
Chapter 2
FRAMESHIFT CORRECTION
2.1 Introduction:
Antibodies with high affinity and specificity are great tools for diagnostics and therapeutics.
Hybridoma technology is a long and laborious process that involves antigen specific
immunization before a monoclonal antibody (mAb) can be obtained. The Sheets library, on the
other hand, utilizes phage display technology to express human scFv on the phage coat protein.
The scFv expressed consists of the VH and VL antigen binding domains connected by a peptide
linker chain. The library has a concentration of 1012
pfu/mL which can be efficiently used to
isolate scFv's against specific antigens (Dierich et al., 1998).
Previous work in our lab includes isolation of C6 scFv from the Sheets library against natural
brain-derived Aβ oligomers from Sheets library. Kasturirangan et al,. performed several rounds of
negative panning to get rid of the non-specific binders followed by a positive round against
natural brain-derived Aβ oligomers to isolate the C6 clone. C6 scFv produced had issues with
expression and protein was obtained in only low quantities.
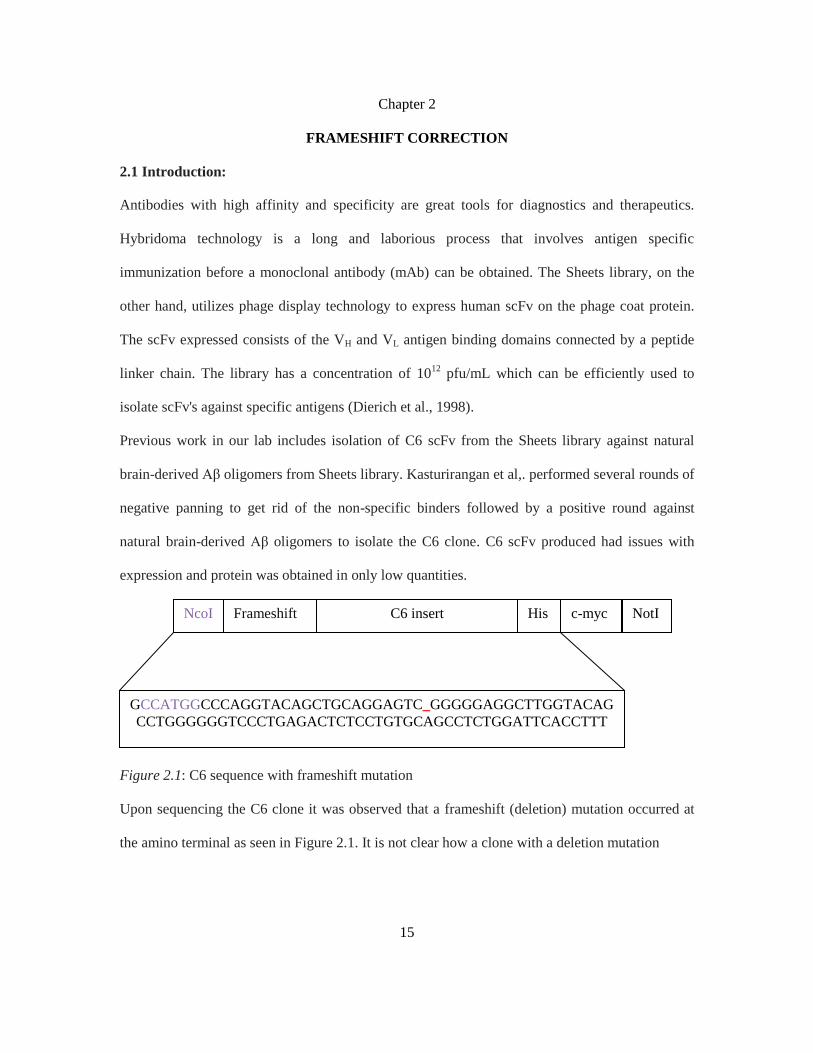
Figure 2.1: C6 sequence with frameshift mutation
Upon sequencing the C6 clone it was observed that a frameshift (deletion) mutation occurred at
the amino terminal as seen in Figure 2.1. It is not clear how a clone with a deletion mutation
NcoI C6 insert His c-myc NotI Frameshift
GCCATGGCCCAGGTACAGCTGCAGGAGTC_GGGGGAGGCTTGGTACAG
CCTGGGGGGTCCCTGAGACTCTCCTGTGCAGCCTCTGGATTCACCTTT
16
produces scFv. There are two possibilities: 1) A ribosomal frameshift further down the sequence
complements the initial deletion mutation allowing the sequence to be read correctly, 2) The
occurrence of a translational frameshift where the frame in which the ribosome reads the
sequence is altered. Here we describe how the frameshift mutation was corrected using specific
PCR primers, designed to insert the missing nucleotide and increase scFv production.
2.2 Experimental procedure:
2.2.1 Plasmid isolation. The C6 scFv is in the pIT2 vector plasmid, the most common
plasmid vector used for expression purposes in the host E. coli strain HB2151. 5mL of C6
culture was grown overnight in the 37°C shaker and the plasmid was isolated using a plasmid
mini-prep kit (Qiagen, Valencia, CA).
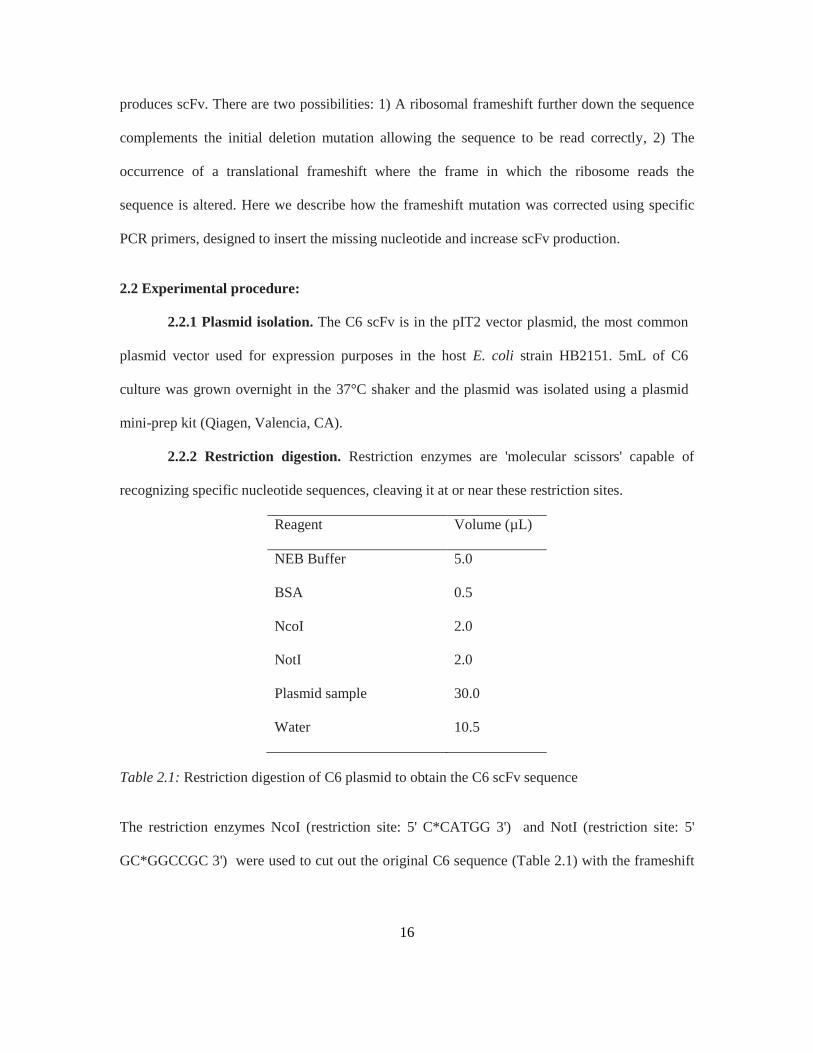
2.2.2 Restriction digestion. Restriction enzymes are 'molecular scissors' capable of
recognizing specific nucleotide sequences, cleaving it at or near these restriction sites.
Reagent Volume (µL)
NEB Buffer 5.0
BSA 0.5
NcoI 2.0
NotI 2.0
Plasmid sample 30.0
Water 10.5
Table 2.1: Restriction digestion of C6 plasmid to obtain the C6 scFv sequence
The restriction enzymes NcoI (restriction site: 5' C*CATGG 3') and NotI (restriction site: 5'
GC*GGCCGC 3') were used to cut out the original C6 sequence (Table 2.1) with the frameshift
17
mutation and His tag out of the pIT2 plasmid. The digestion reaction was verified by running the
samples on a 2% agarose gel.
2.2.3 Dialysis tubing method. The bands from the gel were cut and frozen at -20°C. The
frozen gel slices were then placed into a dialysis tubing with 200-400µL of 1X TAE buffer. The
gel slice with the bands were then placed parallel to the electrodes in an electrophoretic tank and
a voltage of 100V/cm was applied for 10 min. The buffer was removed from the dialysis tube and
phenol-chloroform extraction was performed on it. The yields on it were in the range of a few
ng/µL. Traditional spin columns from gel extraction kit (Qiagen, Valencia) was also used to
extract the cut plasmid from the gel slices.
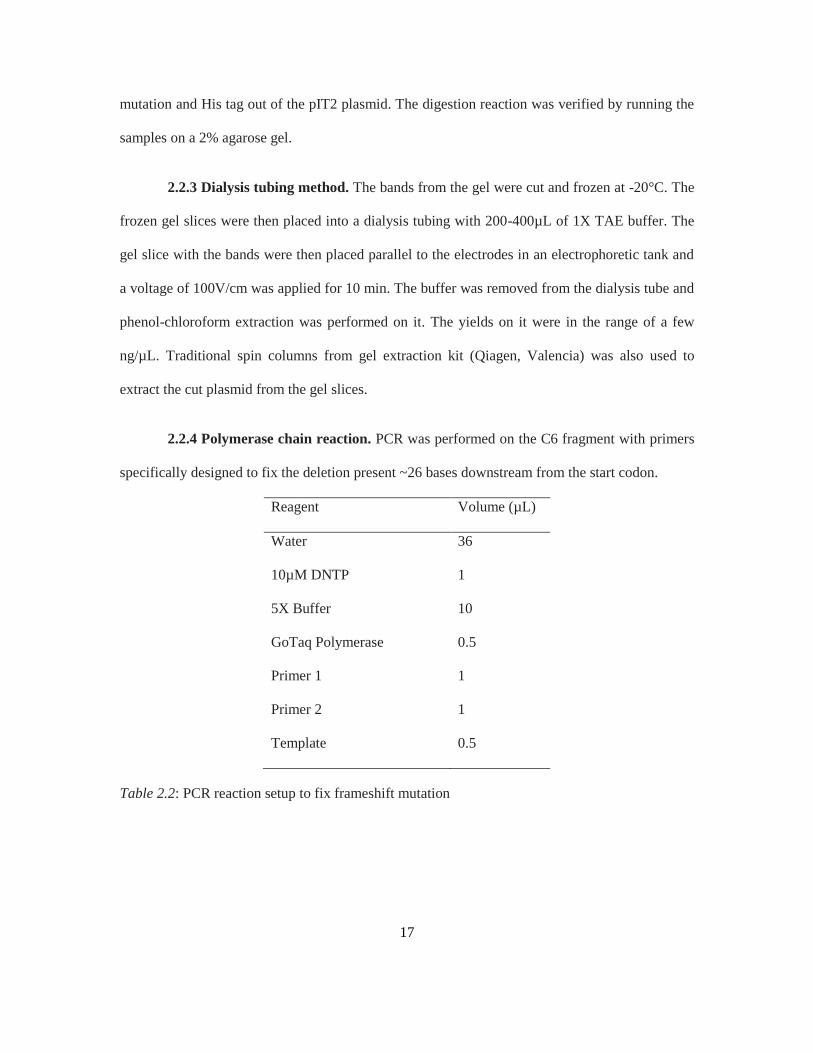
2.2.4 Polymerase chain reaction. PCR was performed on the C6 fragment with primers
specifically designed to fix the deletion present ~26 bases downstream from the start codon.
Reagent Volume (µL)
Water 36
10µM DNTP 1
5X Buffer 10
GoTaq Polymerase 0.5
Primer 1 1
Primer 2 1
Template 0.5
Table 2.2: PCR reaction setup to fix frameshift mutation
18
The primers were designed to insert the missing 'T' nucleotide. The primers are about 48
nucleotides long and the forward primer allows the addition of the missing nucleotide that puts
the sequence back in frame.
5’-GCCGGCCATGGCCCAGGTACAGCTGCAGGAGTCTGGGGGAGG CTTGGT-3’
5’-CCCGTGATGGTGATGATGATGTGCGGCCGCACGTTTGATCTCCAG -3’
The above primers were used to carry out the PCR reaction in the thermocycler (Table 2.2). After
the PCR reaction was complete, the PCR products were run on 2% agarose gel to verify the
molecular size of the products.
2.2.5 Ligation Reaction. The C6 PCR fragment was allowed to ligate with the cut pIT2
plasmid in an insert to vector ratio of 3:1, 10:1 and 20:1 to have a higher chance of incorporation
of the insert into the plasmid. Calf intestinal protease (CIP) was used during the ligation process
to prevent the plasmid from re-ligating at the cut sites. CIP works by catalyzing the removal of
phosphate groups from the 5' end of the DNA sequence. Ligation reaction was carried out at 37°C
overnight.
2.2.6 Competent cell preparation and transformation. Competent HB2151 cells were
prepared and 100µL of these cells were used for transformation. The ligated plasmid (with C6
PCR insert) was added to the competent cells. Cut pIT2 plasmid (without insert) and pLB
plasmid were used as a negative and positive control respectively. The tubes were placed in a
water bath at 42°C for 2 min and then placed on ice for 2 min before the addition of 800µL of LB
media. The tubes were then incubated in the 37°C shaker for 1 hour. 100µL of cells were plated
onto LBA plates and left at 37°C overnight. Colonies were picked out of the plates the next day
and re-streaked. Plasmid was isolated from the re-streaked colonies and sequence verified.
19
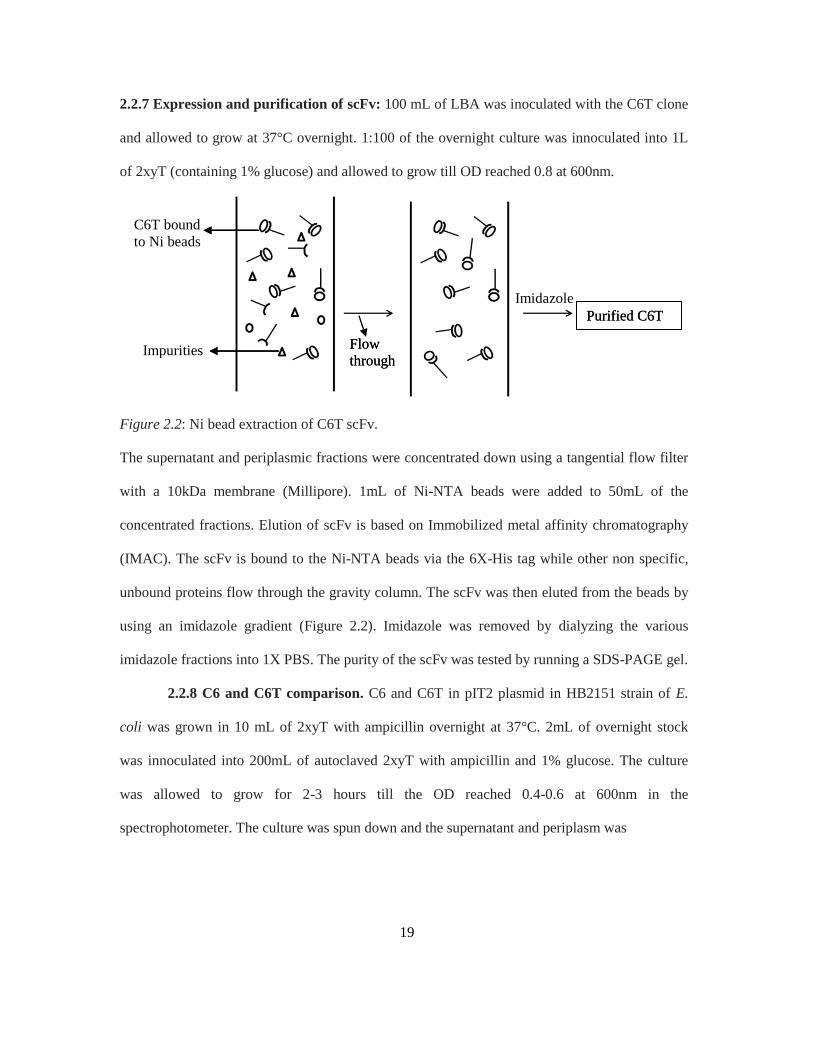
2.2.7 Expression and purification of scFv: 100 mL of LBA was inoculated with the C6T clone
and allowed to grow at 37°C overnight. 1:100 of the overnight culture was innoculated into 1L
of 2xyT (containing 1% glucose) and allowed to grow till OD reached 0.8 at 600nm.
Figure 2.2: Ni bead extraction of C6T scFv.
The supernatant and periplasmic fractions were concentrated down using a tangential flow filter
with a 10kDa membrane (Millipore). 1mL of Ni-NTA beads were added to 50mL of the
concentrated fractions. Elution of scFv is based on Immobilized metal affinity chromatography
(IMAC). The scFv is bound to the Ni-NTA beads via the 6X-His tag while other non specific,
unbound proteins flow through the gravity column. The scFv was then eluted from the beads by
using an imidazole gradient (Figure 2.2). Imidazole was removed by dialyzing the various
imidazole fractions into 1X PBS. The purity of the scFv was tested by running a SDS-PAGE gel.
2.2.8 C6 and C6T comparison. C6 and C6T in pIT2 plasmid in HB2151 strain of E.
coli was grown in 10 mL of 2xyT with ampicillin overnight at 37°C. 2mL of overnight stock
was innoculated into 200mL of autoclaved 2xyT with ampicillin and 1% glucose. The culture
was allowed to grow for 2-3 hours till the OD reached 0.4-0.6 at 600nm in the
spectrophotometer. The culture was spun down and the supernatant and periplasm was
Flow
through
Purified C6T
C6T bound
to Ni beads
Impurities
Purified C6T
Flow
through
Imidazole
20
concentrated down using a 10kDa membrane (Millipore). Ni beads were used to extract scFv
using an imidazole gradient. scFv was purified by dialyzing these fractions in 1X PBS. These
fractions were run on SDS-PAGE gel and western blot was analyzed.
2.2.9 C6T phage production. The pIT2 plasmid from the fixed C6T clone was
transformed into competent E. coli TG1 strain used for making phage. 1L of the culture was
grown and the supernatant was treated with polyethylene glycol (PEG) and NaCl. PEG absorbs
water and causes the phage to aggregate and precipitate as a pellet. The pellet was re-suspended
in PBS and spun down to remove the cell debris. Phage in the supernatant was aliquoted.
2.2.9.1 Phage titer. TG1 cells were grown in LB till they reached an OD of 0.4-0.6 at
600nm. TG1 was also grown in LBA media as a control to check for contamination. Different
aliquots of the phage stock were made ranging from 10-2
, 10-4
, 10-6
...10-12. 10µL of different
phage dilutions were added to 200µL of TG1 cells and allowed to infect at 37°C for 30 min. The
cells were plated on LB plates along with control TG1 cells on LB and LBA plates. The phage
concentration can be calculated as follows:
Concentration (pfu/mL) = (Number of colonies/Volume of phage) * 103µL/1mL * Dilution
factor
Number of colonies on the plate were counted and the stock phage concentration was
determined using the above calculation.
2.3 Results and Discussion:
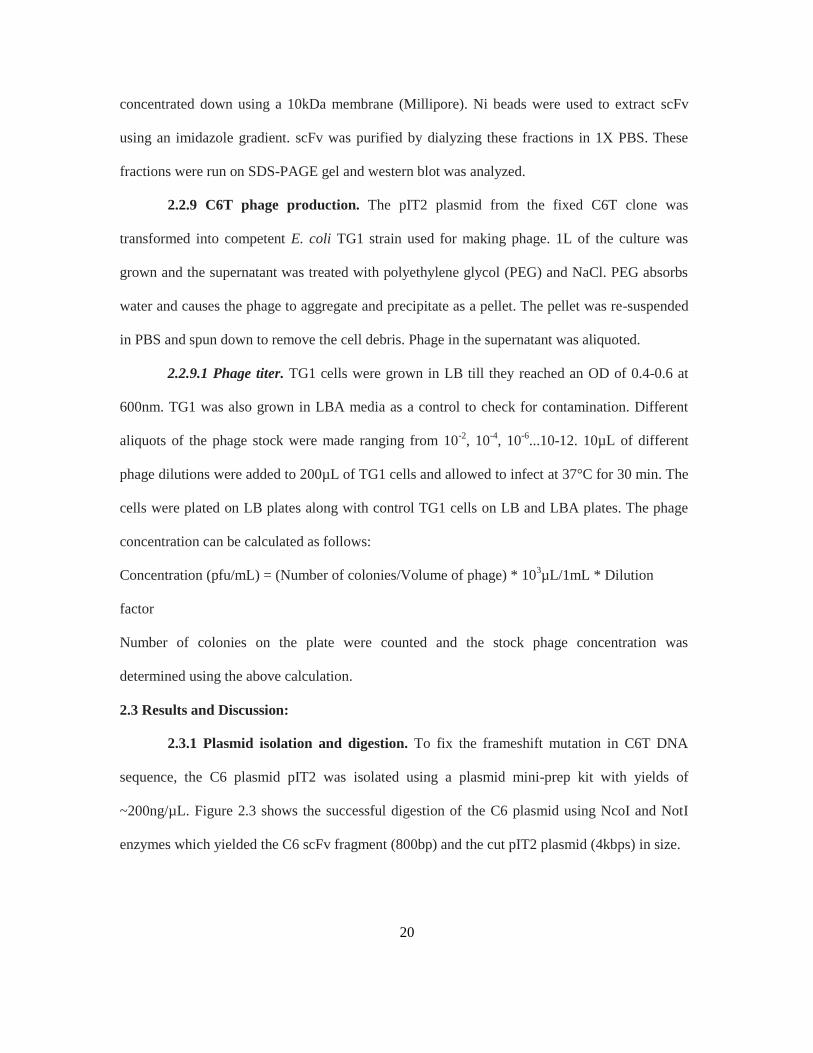
2.3.1 Plasmid isolation and digestion. To fix the frameshift mutation in C6T DNA
sequence, the C6 plasmid pIT2 was isolated using a plasmid mini-prep kit with yields of
~200ng/µL. Figure 2.3 shows the successful digestion of the C6 plasmid using NcoI and NotI
enzymes which yielded the C6 scFv fragment (800bp) and the cut pIT2 plasmid (4kbps) in size.
21
Figure 2.3: 2% agarose gel; lane 1 and 2: cut pIT2 plasmid without insert (~4 kbps), lane 3 and 4:
cut C6 fragment (~800bp).
The samples were run on a 2% agarose gel to verify the digestion of the plasmid. The bands
corresponding to C6 were cut from the gel and DNA was extracted using a gel extraction kit.
2.3.2 Frameshift correction. On analyzing the C6 sequence, we observed a missing 'T'
nucleotide ~26 bases downstream of the start codon. We performed a PCR reaction with primers
designed specifically to insert the missing 'T' nucleotide in the C6 sequence. The primers anneal
to the template DNA sequence in the annealing step of PCR and Taq polymerase starts adding
nucleotides complementary to the template DNA strand in the 5'to 3' direction. To check if PCR
worked on the C6 sequence, a 2% agarose gel was run. A gel extraction and PCR reaction
cleanup (Qiagen, Valencia) was performed on the PCR products to remove excess primers, Taq
polymerase and other salts in the reaction mixture.
cut pIT2 plasmid
cut C6 fragment
22
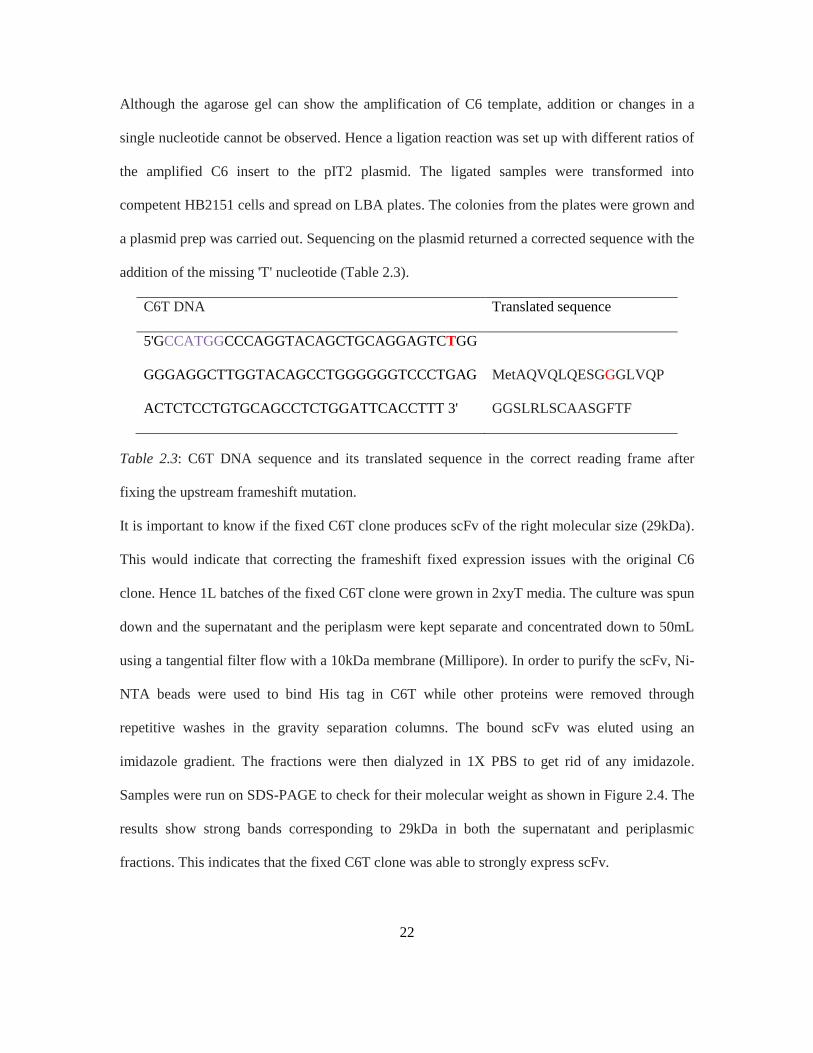
Although the agarose gel can show the amplification of C6 template, addition or changes in a
single nucleotide cannot be observed. Hence a ligation reaction was set up with different ratios of
the amplified C6 insert to the pIT2 plasmid. The ligated samples were transformed into
competent HB2151 cells and spread on LBA plates. The colonies from the plates were grown and
a plasmid prep was carried out. Sequencing on the plasmid returned a corrected sequence with the
addition of the missing 'T' nucleotide (Table 2.3).
C6T DNA Translated sequence
5'GCCATGGCCCAGGTACAGCTGCAGGAGTCTGG
GGGAGGCTTGGTACAGCCTGGGGGGTCCCTGAG
ACTCTCCTGTGCAGCCTCTGGATTCACCTTT 3'
MetAQVQLQESGGGLVQP
GGSLRLSCAASGFTF
Table 2.3: C6T DNA sequence and its translated sequence in the correct reading frame after
fixing the upstream frameshift mutation.
It is important to know if the fixed C6T clone produces scFv of the right molecular size (29kDa).
This would indicate that correcting the frameshift fixed expression issues with the original C6
clone. Hence 1L batches of the fixed C6T clone were grown in 2xyT media. The culture was spun
down and the supernatant and the periplasm were kept separate and concentrated down to 50mL
using a tangential filter flow with a 10kDa membrane (Millipore). In order to purify the scFv, Ni-
NTA beads were used to bind His tag in C6T while other proteins were removed through
repetitive washes in the gravity separation columns. The bound scFv was eluted using an
imidazole gradient. The fractions were then dialyzed in 1X PBS to get rid of any imidazole.
Samples were run on SDS-PAGE to check for their molecular weight as shown in Figure 2.4. The
results show strong bands corresponding to 29kDa in both the supernatant and periplasmic
fractions. This indicates that the fixed C6T clone was able to strongly express scFv.
23
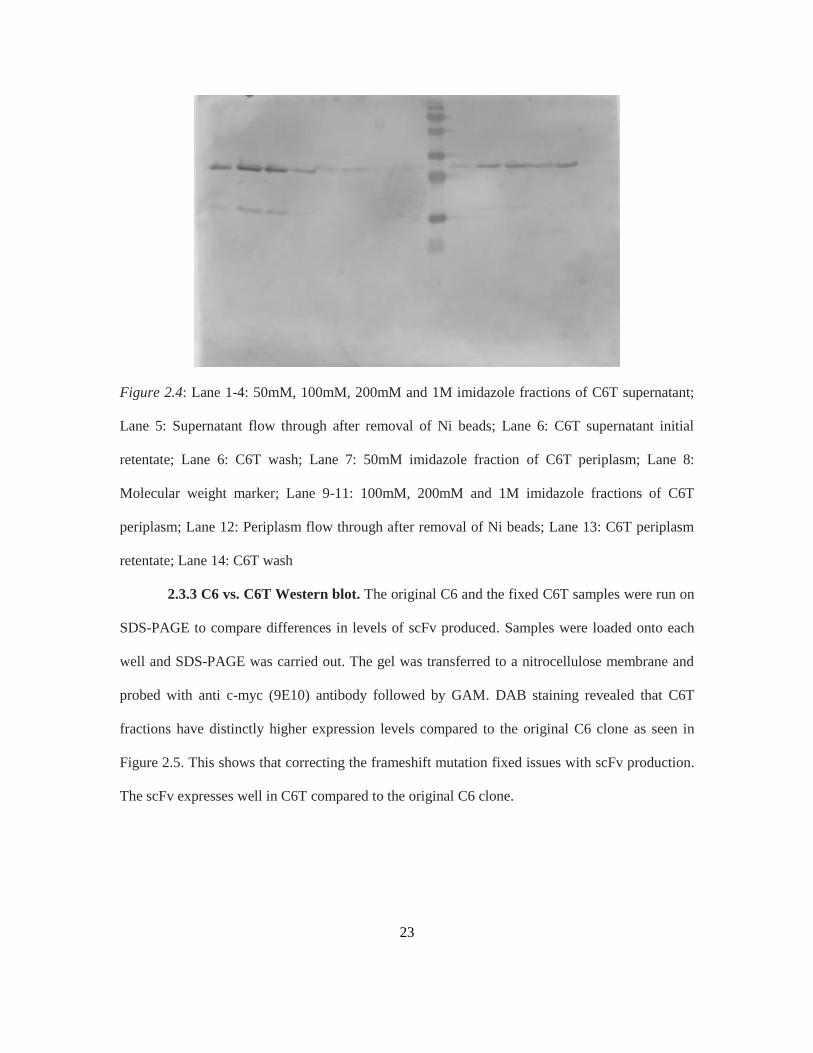
Figure 2.4: Lane 1-4: 50mM, 100mM, 200mM and 1M imidazole fractions of C6T supernatant;
Lane 5: Supernatant flow through after removal of Ni beads; Lane 6: C6T supernatant initial
retentate; Lane 6: C6T wash; Lane 7: 50mM imidazole fraction of C6T periplasm; Lane 8:
Molecular weight marker; Lane 9-11: 100mM, 200mM and 1M imidazole fractions of C6T
periplasm; Lane 12: Periplasm flow through after removal of Ni beads; Lane 13: C6T periplasm
retentate; Lane 14: C6T wash
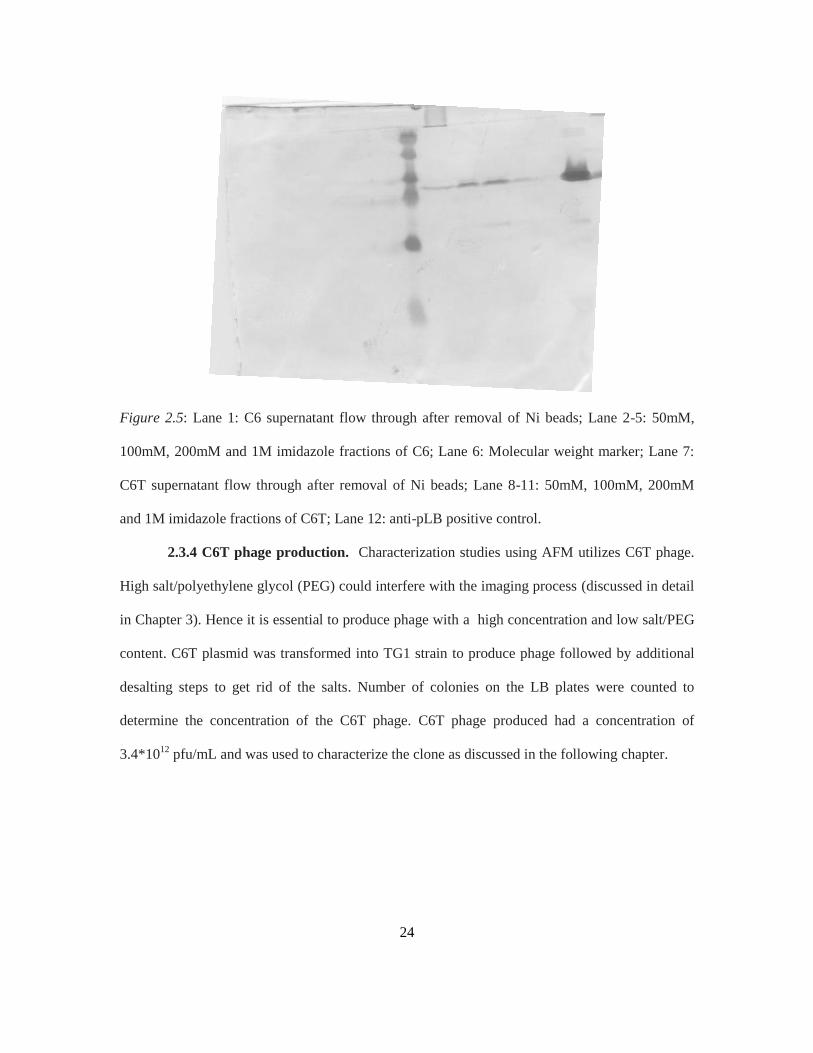
2.3.3 C6 vs. C6T Western blot. The original C6 and the fixed C6T samples were run on
SDS-PAGE to compare differences in levels of scFv produced. Samples were loaded onto each
well and SDS-PAGE was carried out. The gel was transferred to a nitrocellulose membrane and
probed with anti c-myc (9E10) antibody followed by GAM. DAB staining revealed that C6T
fractions have distinctly higher expression levels compared to the original C6 clone as seen in
Figure 2.5. This shows that correcting the frameshift mutation fixed issues with scFv production.
The scFv expresses well in C6T compared to the original C6 clone.
24
Figure 2.5: Lane 1: C6 supernatant flow through after removal of Ni beads; Lane 2-5: 50mM,
100mM, 200mM and 1M imidazole fractions of C6; Lane 6: Molecular weight marker; Lane 7:
C6T supernatant flow through after removal of Ni beads; Lane 8-11: 50mM, 100mM, 200mM
and 1M imidazole fractions of C6T; Lane 12: anti-pLB positive control.
2.3.4 C6T phage production. Characterization studies using AFM utilizes C6T phage.
High salt/polyethylene glycol (PEG) could interfere with the imaging process (discussed in detail
in Chapter 3). Hence it is essential to produce phage with a high concentration and low salt/PEG
content. C6T plasmid was transformed into TG1 strain to produce phage followed by additional
desalting steps to get rid of the salts. Number of colonies on the LB plates were counted to
determine the concentration of the C6T phage. C6T phage produced had a concentration of
3.4*1012
pfu/mL and was used to characterize the clone as discussed in the following chapter.
25
Chapter 3
TISSUE CULTURE AND CHARACTERIZATION STUDIES
3.1 Introduction:
Once the sequence of the C6T clone was corrected, we could obtain enough protein to
characterize presence of the oligomeric Aβ target in different tissue samples. Amyloid precursor
protein (APP) is an integral membrane protein, whose exact function is unknown, though it has
been shown to have a role in synaptic formation, repair and neural plasticity (Walsh et al., 2007).
Consecutive cleavage of APP by beta-site amyloid precursor protein cleaving enzyme-1 (BACE-
1) and γ-secretase results in the generation of Aβ while α-secretase cleavage of APP hydrolyzes
the protein in what would be the middle of the Aβ peptide, precluding its formation.C6T clone
obtained from the Sheets library was selected against brain derived oligomeric Aβ. In order to test
the specificity of the C6T clone, an in-vitro cell line model, 7PA2, was used. 7PA2 is a Chinese
hamster ovarian (CHO) cell line that over expresses mutant human amyloid precursor protein
(APP) generating excess Aβ, a fraction of which forms an SDS-stable oligomeric Aβ species. Aβ
Atomic force microscopy (AFM), western and dot blots were used to characterize whether the
C6T clone could react selectively with the SDS stable oligomeric Aβ produced by 7PA2 cells.
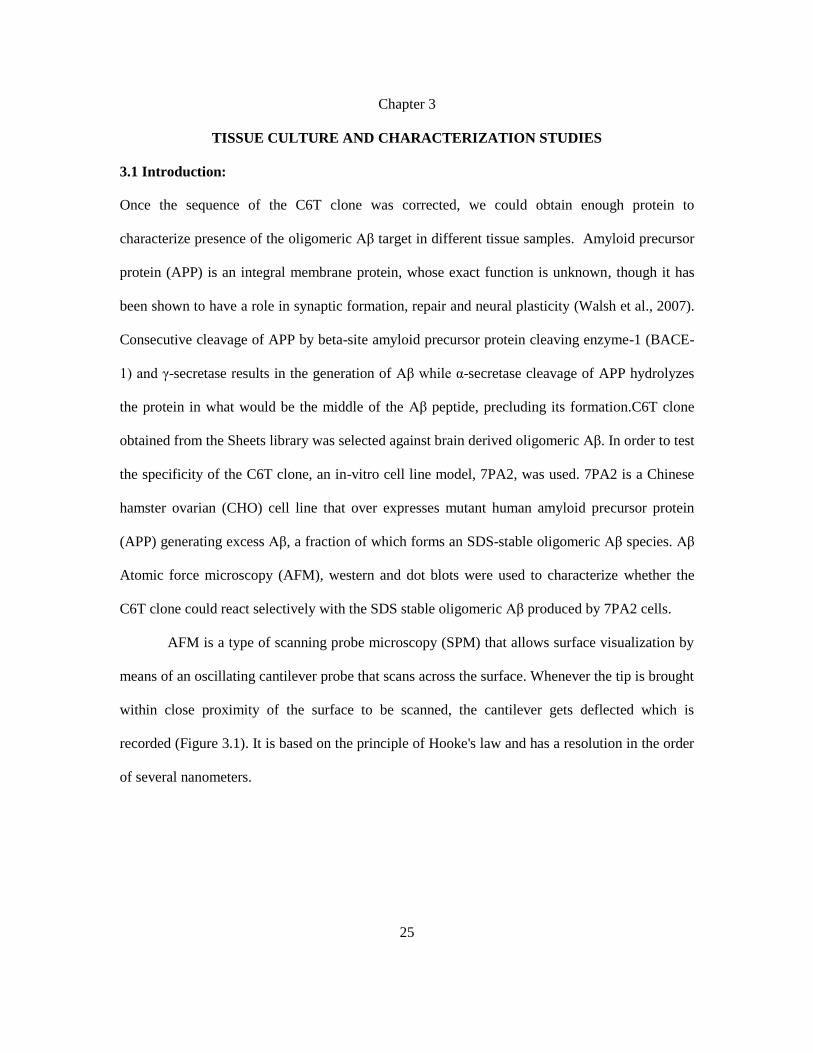
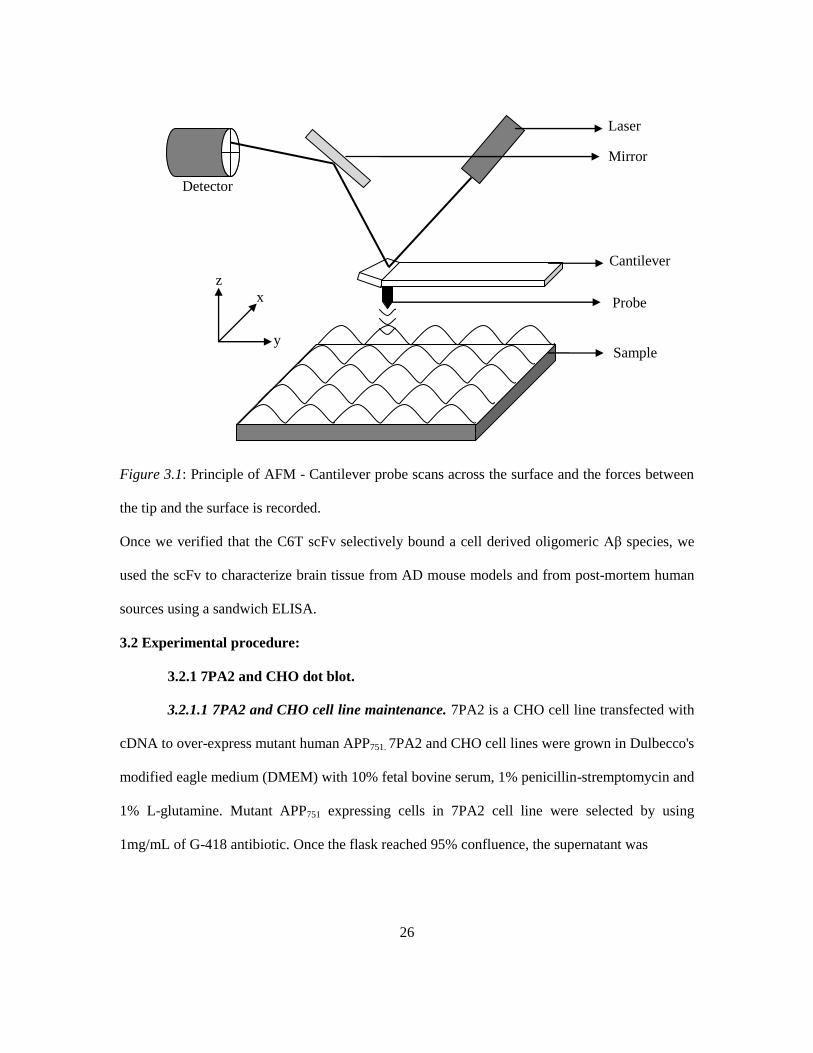
AFM is a type of scanning probe microscopy (SPM) that allows surface visualization by
means of an oscillating cantilever probe that scans across the surface. Whenever the tip is brought
within close proximity of the surface to be scanned, the cantilever gets deflected which is
recorded (Figure 3.1). It is based on the principle of Hooke's law and has a resolution in the order
of several nanometers.
26
Figure 3.1: Principle of AFM - Cantilever probe scans across the surface and the forces between
the tip and the surface is recorded.
Once we verified that the C6T scFv selectively bound a cell derived oligomeric Aβ species, we
used the scFv to characterize brain tissue from AD mouse models and from post-mortem human
sources using a sandwich ELISA.
3.2 Experimental procedure:
3.2.1 7PA2 and CHO dot blot.
3.2.1.1 7PA2 and CHO cell line maintenance. 7PA2 is a CHO cell line transfected with
cDNA to over-express mutant human APP751. 7PA2 and CHO cell lines were grown in Dulbecco's
modified eagle medium (DMEM) with 10% fetal bovine serum, 1% penicillin-stremptomycin and
1% L-glutamine. Mutant APP751 expressing cells in 7PA2 cell line were selected by using
1mg/mL of G-418 antibiotic. Once the flask reached 95% confluence, the supernatant was
Detector
x
y
z
Cantilever
Probe
Laser
Mirror
Sample
27
collected and frozen for 24 hours at -80°C. The sample was then freeze dried and the pellet was
rediluted in 1mL of sterile 1X PBS. The cells were lysed using lysis buffer with 1% triton-X and
protease inhibitor. The lysed cells were centrifuged at 900rpm for 5 minutes and the cell debris
was discarded while lysate was kept frozen at -80°C.
3.2.1.2 Preparation of synthetic Aβ. Aβ40 was synthesized and purified by HPLC,
lyophilized and stored as its Trifluoroacetate salt at -20oC. The lyophilized powder was
solubilized in 1,1,1,3,3,3-hexafluoro-2-propanol (HFIP) at a concentration of 1 mg/mL to avoid
aggregates. Prior to use, a 200μL aliquot was air dried and the pellet was re-suspended in
dimethyl-sulfoxide (DMSO). Aβ in DMSO was diluted to final concentration of 50µM in Tris-
HCl buffer for the dot blot assay and co-incubation studies discussed later.
3.2.1.3 Dot blot assay for cell derived oligomeric Aβ . The 7PA2 and CHO supernatant
was spotted on a nitrocellulose membrane blot. Media blank and synthetic Aβ diluted in Tris HCl
buffer were used as negative and positive control respectively. The blot was air dried before 2%
milk incubation for 2 hours at RT. The blot was allowed to incubate in anti-Aβ (6E10) antibody
for 2 hours at RT. It was then transferred to freshly made 1:1000 dilution of goat anti-mouse
(GAM) secondary antibody for 1hour at RT. The blot was rinsed thrice with 1X PBS after every
step to get rid of all the non-specific binding and reduce the background noise. DAB substrate
was added to the blot and developed.
A duplicate blot with 7PA2 and CHO supernatant and media were spotted onto the nitrocellulose
membrane along with anti-pLB as positive control. The blot was air dried and incubated in 2%
milk for 2 hours at RT. It was then transferred to 1:1000 dilution of an anti-c-myc antibody
(9E10) followed by 1:2000 dilution of GAM. The blot was developed using DAB.
28
3.2.2 AFM sample preparation. Circular mica discs were used to prepare samples for
AFM imaging. Different dilutions of the 7PA2 and CHO supernatant were prepared and 10µL
were deposited on the mica disc. The sample was allowed to incubate for 10 minutes at RT and
washed with water to get rid of the unbound protein in the sample. This was followed by
deposition of 10µL of C6T phage deposition. The phage was allowed to incubate on the mica disc
for 10 minutes at RT followed by stringent washing with PBS-0.1% tween and water to get rid of
the unbound phage. Excess water was removed and the sample was air dried for 10 minutes and
20 and 5 micron images were obtained.
3.2.3 C6T-Aβ co-incubation. 50µM of synthetic Aβ as prepared previously was
incubated at 37°C with and without C6T scFv of 5µM concentration. Aliquots of 100µL were
prepared and were removed at various time intervals of 0, 1 and 4 days from the incubator. 25µL
of the samples were loaded onto a 10% tris-tricene gel and allowed to separate. One of the gels
were stained using 0.1% Coomassie brilliant blue dye and the other was used to transfer the
separated bands onto a 0.2µm nitrocellulose blot. The gel was de-stained in de-staining solution
and scanned into the system. The western blot was incubated with 2% milk for 2 hours on a
shaker at RT followed by incubation with 1:1000 dilution of anti-Aβ antibody (6E10) for 2 hours
at RT. The blot was then incubated with 1:2000 dilution of GAM and finally stained with DAB
substrate.
3.2.4 Mouse tissue dot blot. We used the C6T scFv to characterize brain tissue taken
from different ages of a triple transgenic AD mouse line (3x-TG) which has mutant presenilin,
APP and tau transgenes resulting in over-expression of both Aβ and tau (Oddo et al., 2003).
29
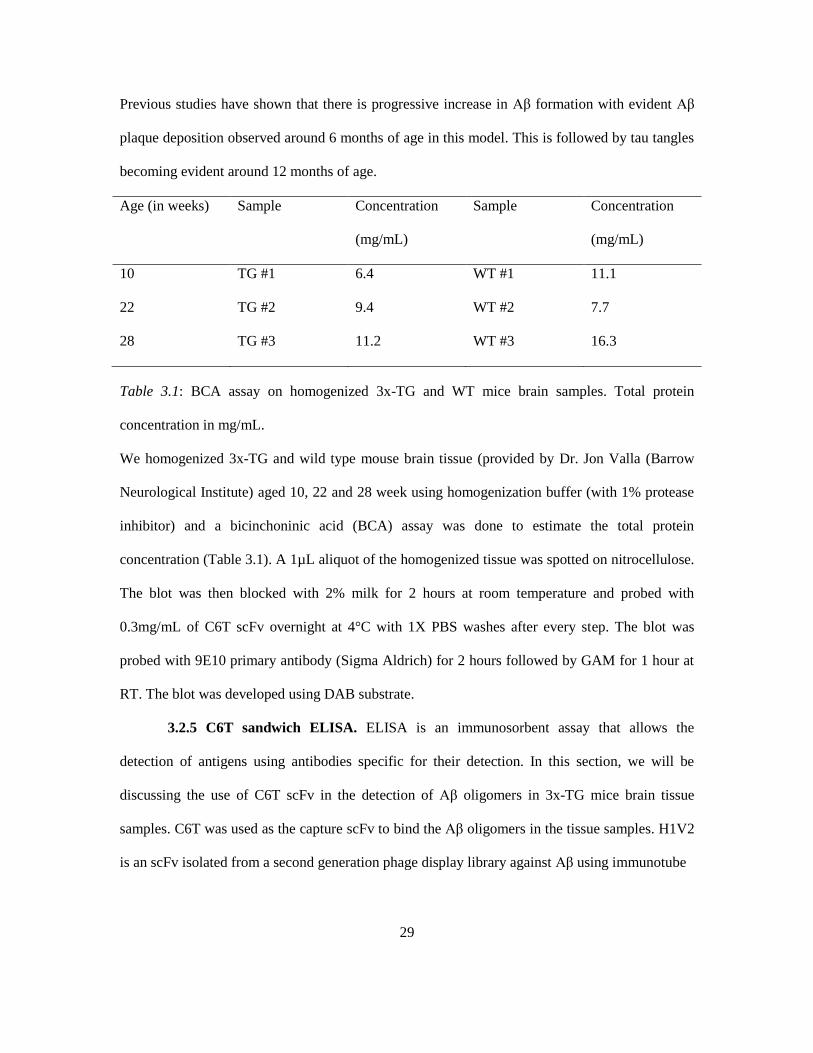
Previous studies have shown that there is progressive increase in Aβ formation with evident Aβ
plaque deposition observed around 6 months of age in this model. This is followed by tau tangles
becoming evident around 12 months of age.
Age (in weeks) Sample Concentration
(mg/mL)
Sample Concentration
(mg/mL)
10 TG #1 6.4 WT #1 11.1
22 TG #2 9.4 WT #2 7.7
28 TG #3 11.2 WT #3 16.3
Table 3.1: BCA assay on homogenized 3x-TG and WT mice brain samples. Total protein
concentration in mg/mL.
We homogenized 3x-TG and wild type mouse brain tissue (provided by Dr. Jon Valla (Barrow
Neurological Institute) aged 10, 22 and 28 week using homogenization buffer (with 1% protease
inhibitor) and a bicinchoninic acid (BCA) assay was done to estimate the total protein
concentration (Table 3.1). A 1µL aliquot of the homogenized tissue was spotted on nitrocellulose.
The blot was then blocked with 2% milk for 2 hours at room temperature and probed with
0.3mg/mL of C6T scFv overnight at 4°C with 1X PBS washes after every step. The blot was
probed with 9E10 primary antibody (Sigma Aldrich) for 2 hours followed by GAM for 1 hour at
RT. The blot was developed using DAB substrate.
3.2.5 C6T sandwich ELISA. ELISA is an immunosorbent assay that allows the
detection of antigens using antibodies specific for their detection. In this section, we will be
discussing the use of C6T scFv in the detection of Aβ oligomers in 3x-TG mice brain tissue
samples. C6T was used as the capture scFv to bind the Aβ oligomers in the tissue samples. H1V2
is an scFv isolated from a second generation phage display library against Aβ using immunotube
30
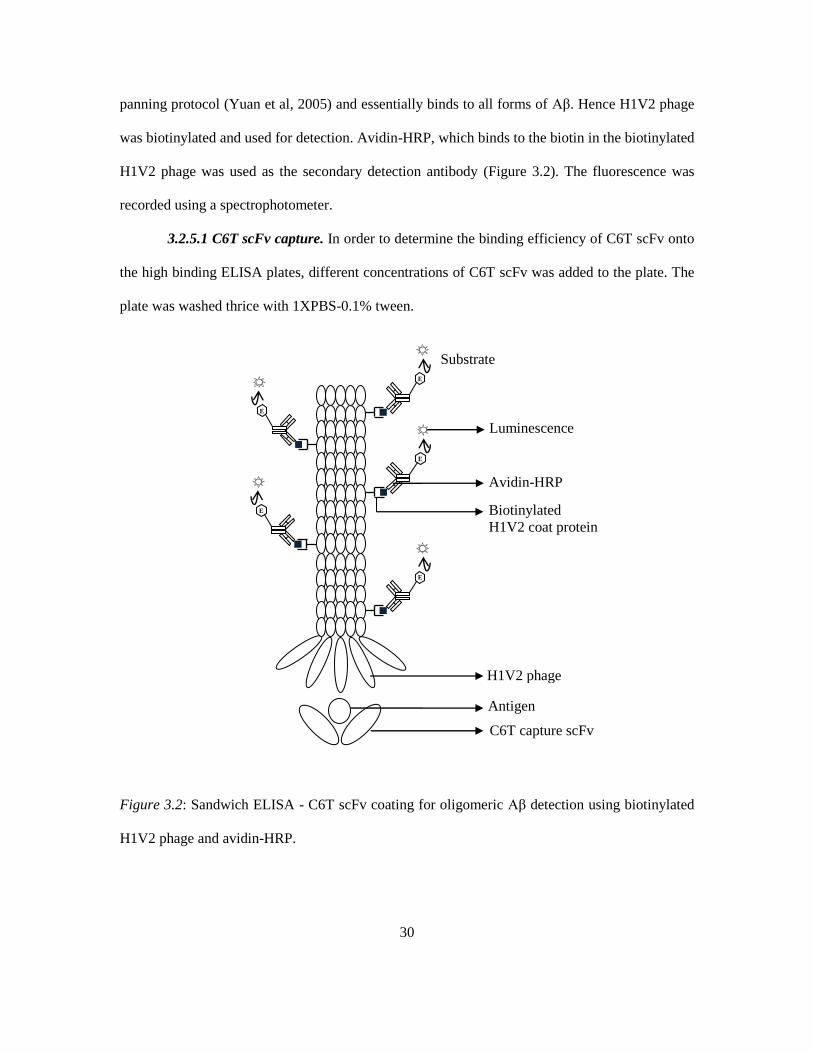
panning protocol (Yuan et al, 2005) and essentially binds to all forms of Aβ. Hence H1V2 phage
was biotinylated and used for detection. Avidin-HRP, which binds to the biotin in the biotinylated
H1V2 phage was used as the secondary detection antibody (Figure 3.2). The fluorescence was
recorded using a spectrophotometer.
3.2.5.1 C6T scFv capture. In order to determine the binding efficiency of C6T scFv onto
the high binding ELISA plates, different concentrations of C6T scFv was added to the plate. The
plate was washed thrice with 1XPBS-0.1% tween.
Figure 3.2: Sandwich ELISA - C6T scFv coating for oligomeric Aβ detection using biotinylated
H1V2 phage and avidin-HRP.
C6T capture scFv
Antigen
Biotinylated
H1V2 coat protein
H1V2 phage
Avidin-HRP
Substrate
Luminescence
E
E
E
E
E
31
BCA was carried out and a concentration of 0.3mg/mL of scFv was observed to saturate the plate.
Hence 0.3mg/mL of C6T scFv was used as coating for the ELISA assay.
3.2.5.2 H1V2 phage biotinylation. H1V2 phage, like mentioned earlier has the ability to
bind to different forms of Aβ. Thus H1V2 phage having a concentration of 1012
pfu/mL was
biotinylated with 20mM and 100mM biotin and passed through a desalting column to remove
excess biotin. Biotinylation was verified by depositing different dilutions of the 20mM and
100mM biotinylated H1V2 phage onto ELISA plate. This was followed by blocking the plate
with 2% milk for 2 hours at 37°C. After rinsing the plate, fluorescent substrate was added to the
wells and read in spectrophotometer.
3.2.5.3 ELISA mice sample preparation. 3x-TG mice brain samples from Dr. Travis
Dunkley (Tgen) and wild type samples aged 5, 9 and 13 months were tested in the ELISA.
Age (in months) Sample Concentration
(mg/mL)
Sample Concentration
(mg/mL)
5 TG #5-1 4.4 WT #5-1 19
5 TG #5-2 7.5 WT #5-2 11.9
9 TG #22 2.4 WT #9-1 12.8
9 TG #23 6.4 WT #9-2 13.1
9 TG #24 4.3 WT #9-3 17.2
13 TG #29 10.2 WT #13-1 16.9
13 TG #30 6.3 WT #13-2 17.2
13 TG #36 13 WT #13-2 19.6
Table 3.2: BCA analysis of total protein concentration in mg/mL on homogenized 3x-TG and WT
mice brain samples.
32
There were 2 samples in the 5 month group and 3 samples each in the 9 and 13 months with age
matched controls. These samples were homogenized using homogenization buffer with 1:100
dilution of 100mM phenylmethylsulfonyl fluoride (PMSF) protease inhibitor. A BCA assay on
the homogenized tissue yielded total protein values as shown in Table 3.2.
3.2.5.4 ELISA Human AD-ND sample preparation. Human brain tissue homogenized
samples were obtained from Mayo Clinic, Florida. There were 6 AD, 9 Parkinson's disease (PD)
and 5 non-demented (ND) samples that were tested on sandwich ELISA.
3.2.5.5 ELISA protocol. In the sandwich ELISA assay, 100µL of C6T scFv of 0.3mg/mL
was coated onto high binding ELISA plates and allowed to incubate for 1-2 hours at 37°C. The
plate was washed thrice with 1X PBS-0.1%tween after every step to get rid of any non-specific
binding to reduce any background noise. The plate was loaded with 200µL of 2% milk for 2
hours at 37°C for blocking the wells. After rinsing the plate, 100µL of 200µg/mL of
homogenized (mice/human) sample was incubated for 1 hour at 37°C. This is followed by the
addition of 100µL of biotinylated H1V2 phage (20mM). The plate was allowed to incubate at
37°C for one hour and washed 4 times to get rid of any non-specific phage binding. 1:2000
dilution of avidin-HRP was added to the plate and incubated for 1 hour at 37°C. Fluorescent
substrate was added in the final step and readings were recorded every 15 minutes in the
spectrophotometer.
3.3 Results and Discussion:
3.3.1 7PA2 and CHO dot blot assay. 7PA2 is a CHO cell line that over expresses
mutant APP and Aβ oligomers. In order to characterize C6T and test its specificity to in-vitro
generated Aβ oligomers, 7PA2 and CHO cell line supernatant was tested with C6T. Concentrated
supernatant from 7PA2 and CHO cell lines were spotted on nitrocellulose and probed with 6E10,
33
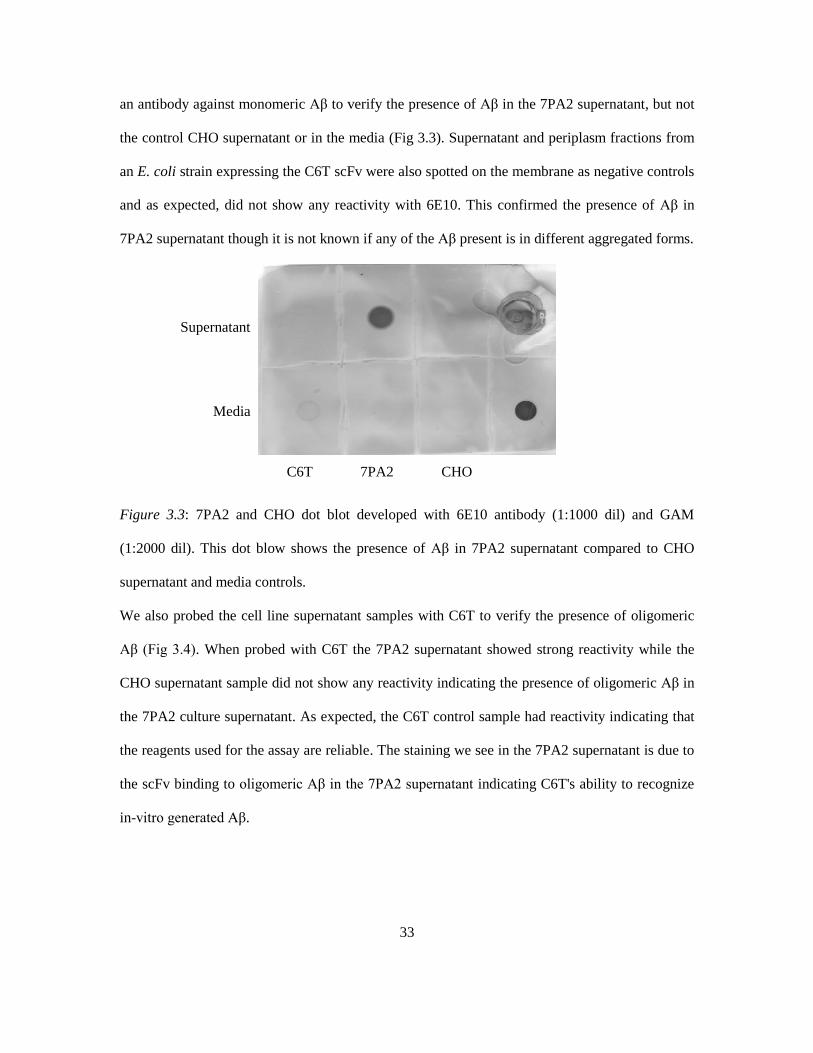
an antibody against monomeric Aβ to verify the presence of Aβ in the 7PA2 supernatant, but not
the control CHO supernatant or in the media (Fig 3.3). Supernatant and periplasm fractions from
an E. coli strain expressing the C6T scFv were also spotted on the membrane as negative controls
and as expected, did not show any reactivity with 6E10. This confirmed the presence of Aβ in
7PA2 supernatant though it is not known if any of the Aβ present is in different aggregated forms.
Figure 3.3: 7PA2 and CHO dot blot developed with 6E10 antibody (1:1000 dil) and GAM
(1:2000 dil). This dot blow shows the presence of Aβ in 7PA2 supernatant compared to CHO
supernatant and media controls.
We also probed the cell line supernatant samples with C6T to verify the presence of oligomeric
Aβ (Fig 3.4). When probed with C6T the 7PA2 supernatant showed strong reactivity while the
CHO supernatant sample did not show any reactivity indicating the presence of oligomeric Aβ in
the 7PA2 culture supernatant. As expected, the C6T control sample had reactivity indicating that
the reagents used for the assay are reliable. The staining we see in the 7PA2 supernatant is due to
the scFv binding to oligomeric Aβ in the 7PA2 supernatant indicating C6T's ability to recognize
in-vitro generated Aβ.
C6T 7PA2 CHO
Supernatant
Media
34
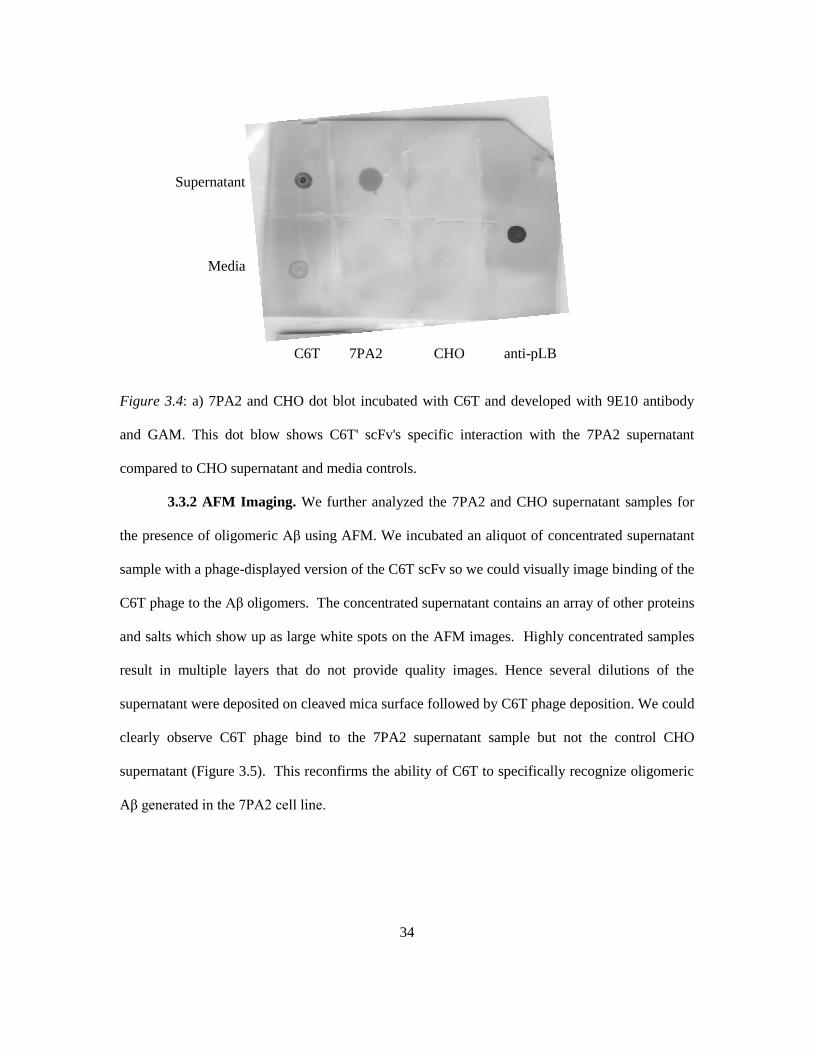
Figure 3.4: a) 7PA2 and CHO dot blot incubated with C6T and developed with 9E10 antibody
and GAM. This dot blow shows C6T' scFv's specific interaction with the 7PA2 supernatant
compared to CHO supernatant and media controls.
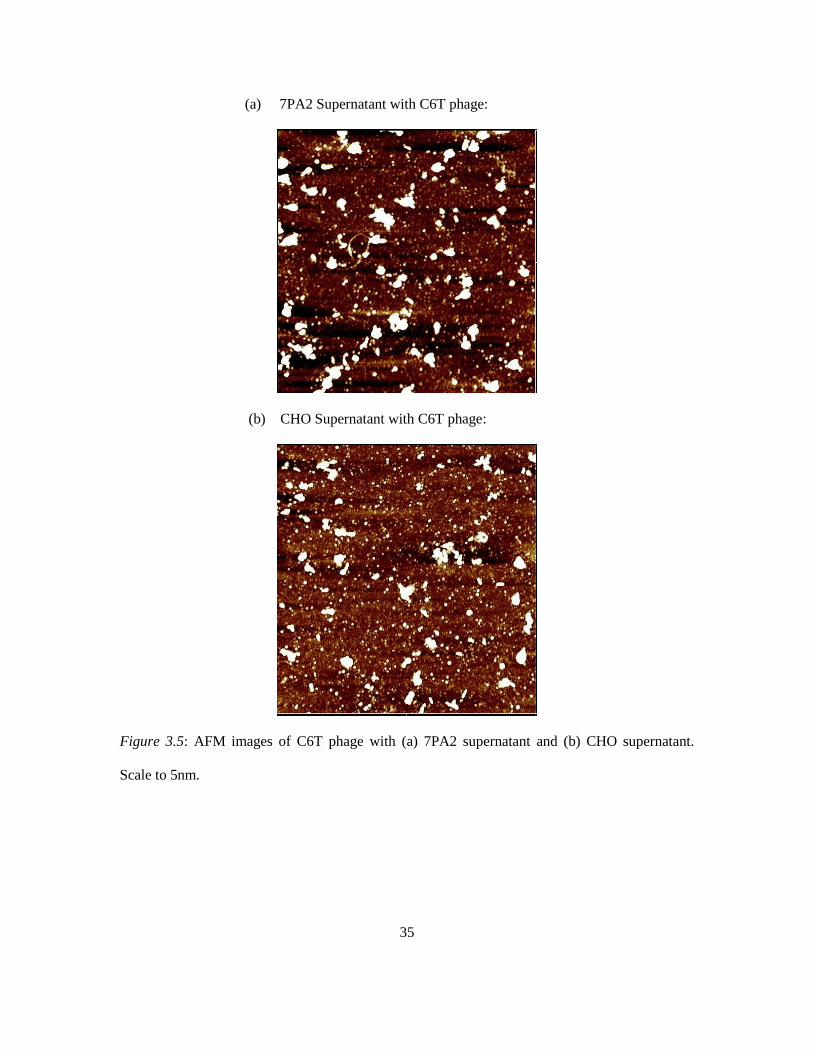
3.3.2 AFM Imaging. We further analyzed the 7PA2 and CHO supernatant samples for
the presence of oligomeric Aβ using AFM. We incubated an aliquot of concentrated supernatant
sample with a phage-displayed version of the C6T scFv so we could visually image binding of the
C6T phage to the Aβ oligomers. The concentrated supernatant contains an array of other proteins
and salts which show up as large white spots on the AFM images. Highly concentrated samples
result in multiple layers that do not provide quality images. Hence several dilutions of the
supernatant were deposited on cleaved mica surface followed by C6T phage deposition. We could
clearly observe C6T phage bind to the 7PA2 supernatant sample but not the control CHO
supernatant (Figure 3.5). This reconfirms the ability of C6T to specifically recognize oligomeric
Aβ generated in the 7PA2 cell line.
C6T 7PA2 CHO anti-pLB
Supernatant
Media
35
(a) 7PA2 Supernatant with C6T phage:
(b) CHO Supernatant with C6T phage:
Figure 3.5: AFM images of C6T phage with (a) 7PA2 supernatant and (b) CHO supernatant.
Scale to 5nm.
36
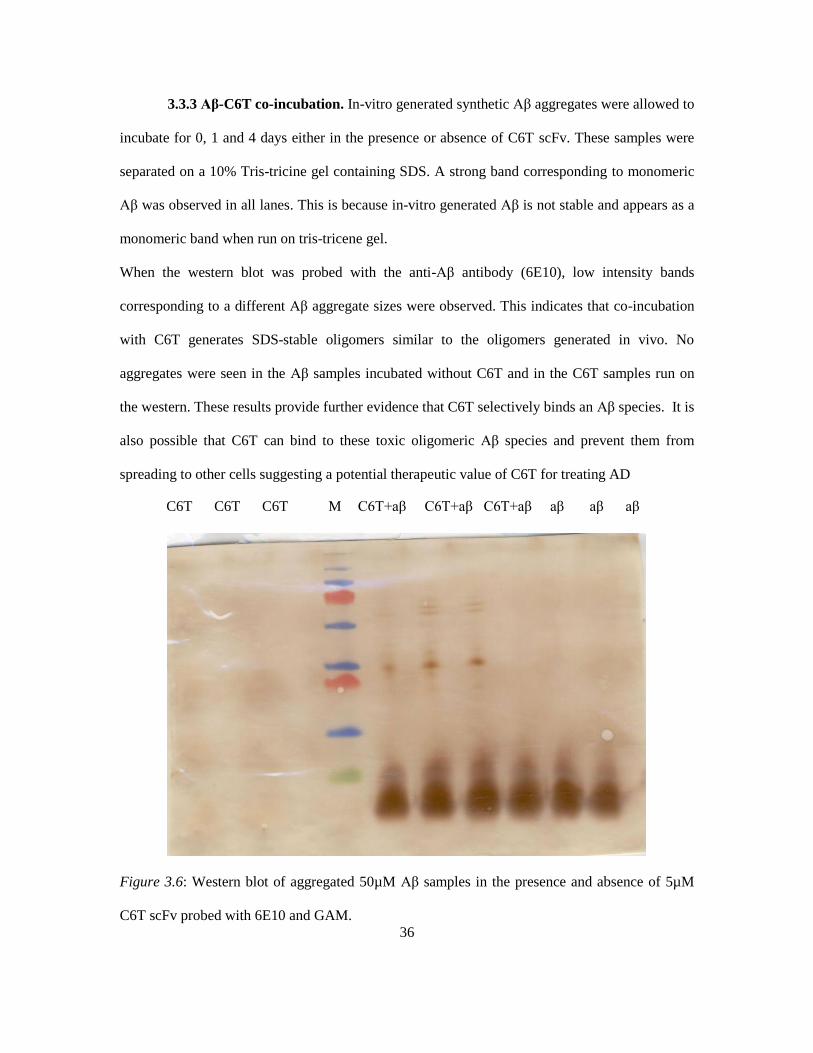
3.3.3 Aβ-C6T co-incubation. In-vitro generated synthetic Aβ aggregates were allowed to
incubate for 0, 1 and 4 days either in the presence or absence of C6T scFv. These samples were
separated on a 10% Tris-tricine gel containing SDS. A strong band corresponding to monomeric
Aβ was observed in all lanes. This is because in-vitro generated Aβ is not stable and appears as a
monomeric band when run on tris-tricene gel.
When the western blot was probed with the anti-Aβ antibody (6E10), low intensity bands
corresponding to a different Aβ aggregate sizes were observed. This indicates that co-incubation
with C6T generates SDS-stable oligomers similar to the oligomers generated in vivo. No
aggregates were seen in the Aβ samples incubated without C6T and in the C6T samples run on
the western. These results provide further evidence that C6T selectively binds an Aβ species. It is
also possible that C6T can bind to these toxic oligomeric Aβ species and prevent them from
spreading to other cells suggesting a potential therapeutic value of C6T for treating AD
Figure 3.6: Western blot of aggregated 50µM Aβ samples in the presence and absence of 5µM
C6T scFv probed with 6E10 and GAM.
C6T C6T C6T M C6T+aβ C6T+aβ C6T+aβ aβ aβ aβ
37
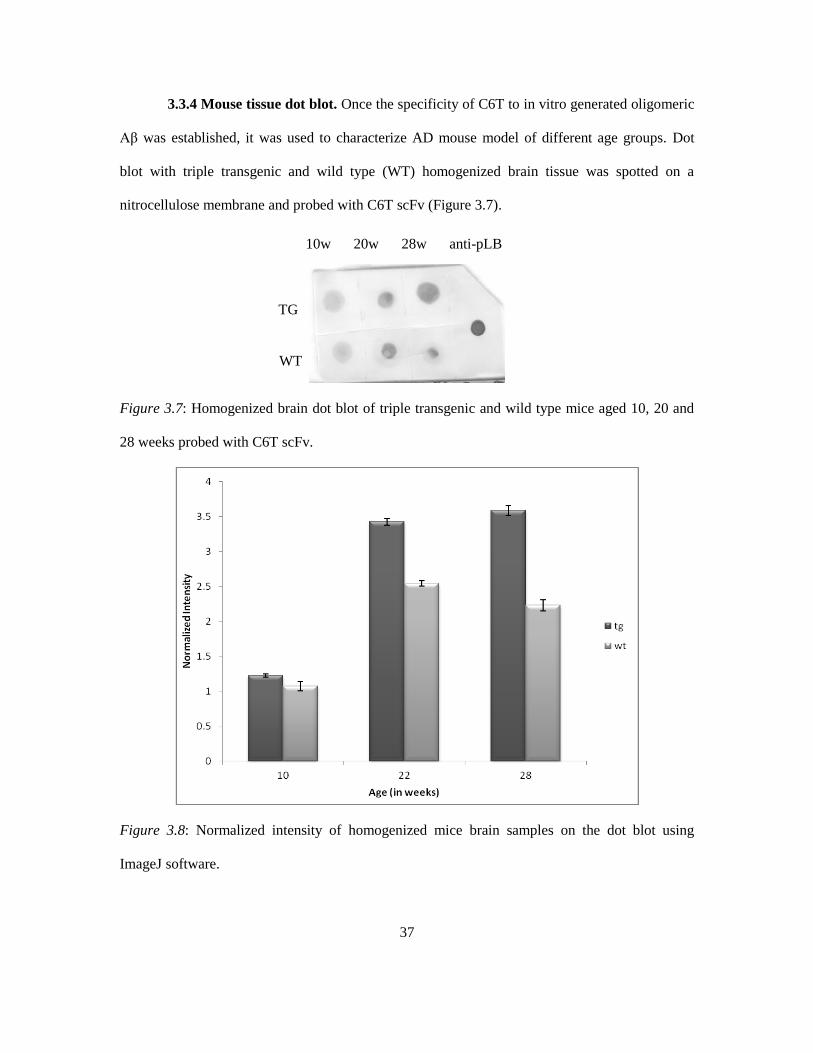
3.3.4 Mouse tissue dot blot. Once the specificity of C6T to in vitro generated oligomeric
Aβ was established, it was used to characterize AD mouse model of different age groups. Dot
blot with triple transgenic and wild type (WT) homogenized brain tissue was spotted on a
nitrocellulose membrane and probed with C6T scFv (Figure 3.7).
Figure 3.7: Homogenized brain dot blot of triple transgenic and wild type mice aged 10, 20 and
28 weeks probed with C6T scFv.
Figure 3.8: Normalized intensity of homogenized mice brain samples on the dot blot using
ImageJ software.
10w 20w 28w anti-pLB
TG
WT
38
It can be noted that from Figure 3.8 that the C6T scFv was able to distinguish between the 3x-TG
and WT samples especially in the 20 week (P<0.0048) and 28 week (P<0.0016) age groups. This
indicates that the C6T clone is capable of detecting Aβ oligomers much earlier than other
reagents that detect the presence of Aβ plaques in the brain of these mice.
3.3.5 C6T Sandwich ELISA
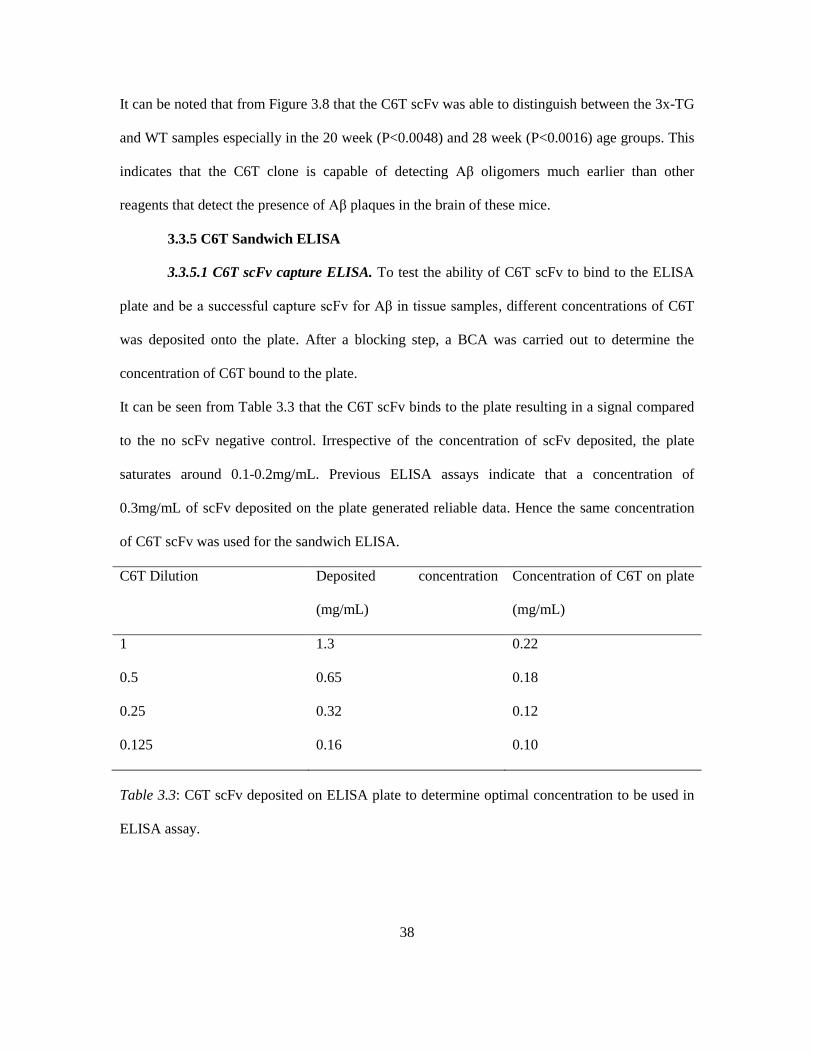
3.3.5.1 C6T scFv capture ELISA. To test the ability of C6T scFv to bind to the ELISA
plate and be a successful capture scFv for Aβ in tissue samples, different concentrations of C6T
was deposited onto the plate. After a blocking step, a BCA was carried out to determine the
concentration of C6T bound to the plate.
It can be seen from Table 3.3 that the C6T scFv binds to the plate resulting in a signal compared
to the no scFv negative control. Irrespective of the concentration of scFv deposited, the plate
saturates around 0.1-0.2mg/mL. Previous ELISA assays indicate that a concentration of
0.3mg/mL of scFv deposited on the plate generated reliable data. Hence the same concentration
of C6T scFv was used for the sandwich ELISA.
C6T Dilution Deposited concentration
(mg/mL)
Concentration of C6T on plate
(mg/mL)
1 1.3 0.22
0.5 0.65 0.18
0.25 0.32 0.12
0.125 0.16 0.10
Table 3.3: C6T scFv deposited on ELISA plate to determine optimal concentration to be used in
ELISA assay.
39
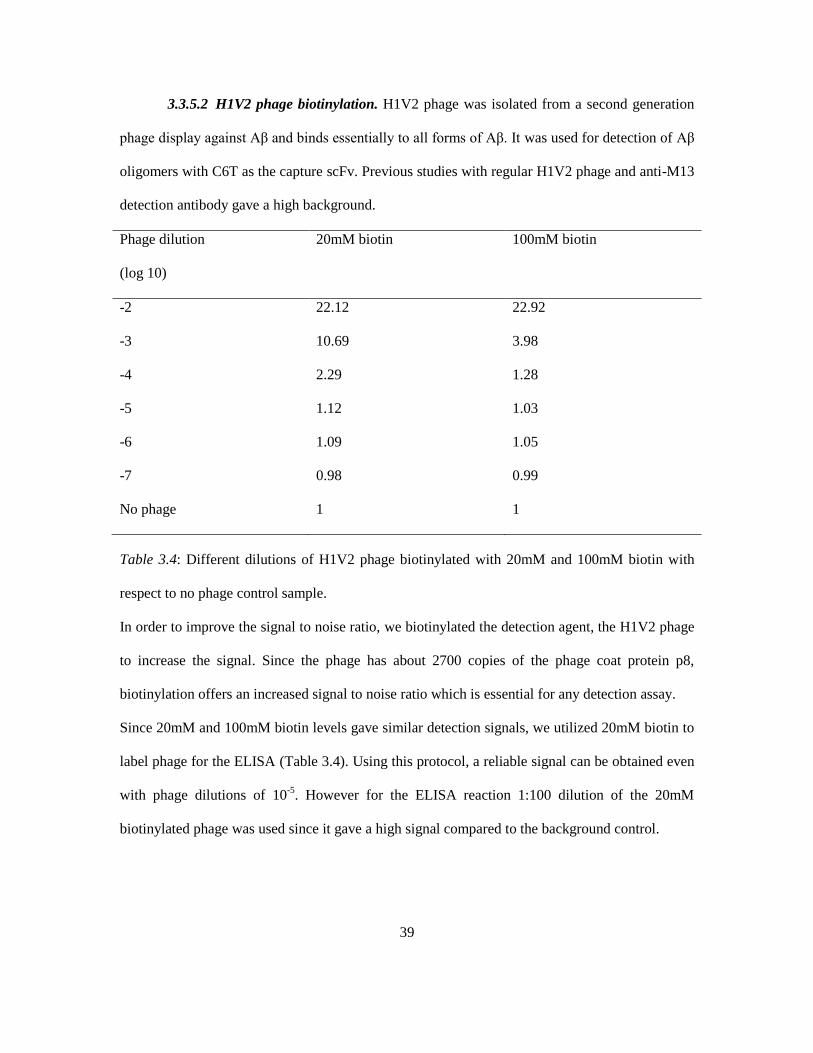
3.3.5.2 H1V2 phage biotinylation. H1V2 phage was isolated from a second generation
phage display against Aβ and binds essentially to all forms of Aβ. It was used for detection of Aβ
oligomers with C6T as the capture scFv. Previous studies with regular H1V2 phage and anti-M13
detection antibody gave a high background.
Phage dilution
(log 10)
20mM biotin 100mM biotin
-2 22.12 22.92
-3 10.69 3.98
-4 2.29 1.28
-5 1.12 1.03
-6 1.09 1.05
-7 0.98 0.99
No phage 1 1
Table 3.4: Different dilutions of H1V2 phage biotinylated with 20mM and 100mM biotin with
respect to no phage control sample.
In order to improve the signal to noise ratio, we biotinylated the detection agent, the H1V2 phage
to increase the signal. Since the phage has about 2700 copies of the phage coat protein p8,
biotinylation offers an increased signal to noise ratio which is essential for any detection assay.
Since 20mM and 100mM biotin levels gave similar detection signals, we utilized 20mM biotin to
label phage for the ELISA (Table 3.4). Using this protocol, a reliable signal can be obtained even
with phage dilutions of 10-5
. However for the ELISA reaction 1:100 dilution of the 20mM
biotinylated phage was used since it gave a high signal compared to the background control.
40
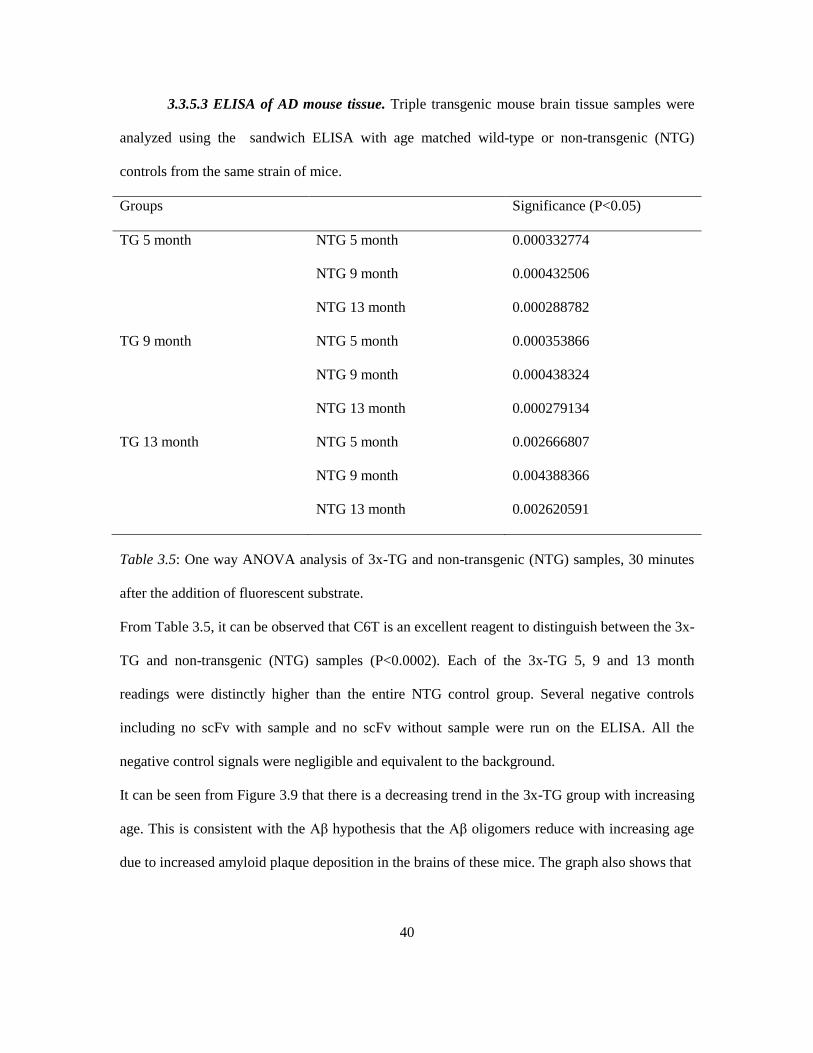
3.3.5.3 ELISA of AD mouse tissue. Triple transgenic mouse brain tissue samples were
analyzed using the sandwich ELISA with age matched wild-type or non-transgenic (NTG)
controls from the same strain of mice.
Groups Significance (P<0.05)
TG 5 month NTG 5 month 0.000332774
NTG 9 month 0.000432506
NTG 13 month 0.000288782
TG 9 month NTG 5 month 0.000353866
NTG 9 month 0.000438324
NTG 13 month 0.000279134
TG 13 month NTG 5 month 0.002666807
NTG 9 month 0.004388366
NTG 13 month 0.002620591
Table 3.5: One way ANOVA analysis of 3x-TG and non-transgenic (NTG) samples, 30 minutes
after the addition of fluorescent substrate.
From Table 3.5, it can be observed that C6T is an excellent reagent to distinguish between the 3x-
TG and non-transgenic (NTG) samples (P<0.0002). Each of the 3x-TG 5, 9 and 13 month
readings were distinctly higher than the entire NTG control group. Several negative controls
including no scFv with sample and no scFv without sample were run on the ELISA. All the
negative control signals were negligible and equivalent to the background.
It can be seen from Figure 3.9 that there is a decreasing trend in the 3x-TG group with increasing
age. This is consistent with the Aβ hypothesis that the Aβ oligomers reduce with increasing age
due to increased amyloid plaque deposition in the brains of these mice. The graph also shows that
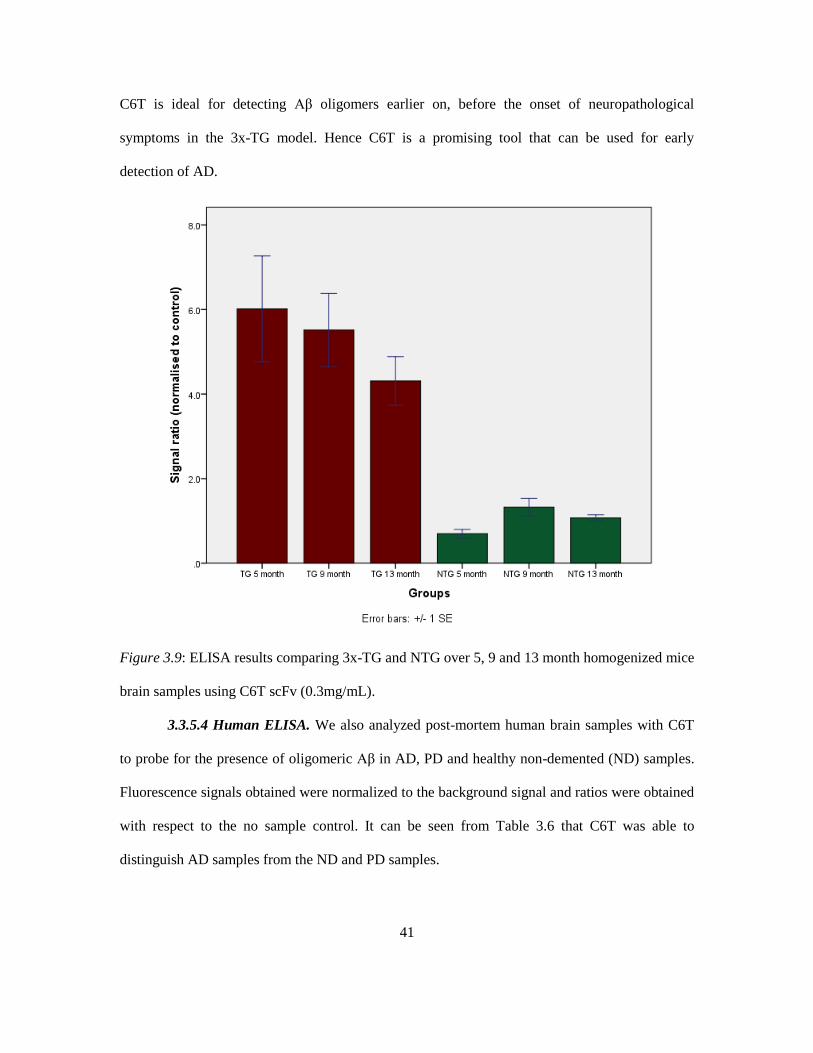
41
C6T is ideal for detecting Aβ oligomers earlier on, before the onset of neuropathological
symptoms in the 3x-TG model. Hence C6T is a promising tool that can be used for early
detection of AD.
Figure 3.9: ELISA results comparing 3x-TG and NTG over 5, 9 and 13 month homogenized mice
brain samples using C6T scFv (0.3mg/mL).
3.3.5.4 Human ELISA. We also analyzed post-mortem human brain samples with C6T
to probe for the presence of oligomeric Aβ in AD, PD and healthy non-demented (ND) samples.
Fluorescence signals obtained were normalized to the background signal and ratios were obtained
with respect to the no sample control. It can be seen from Table 3.6 that C6T was able to
distinguish AD samples from the ND and PD samples.
42
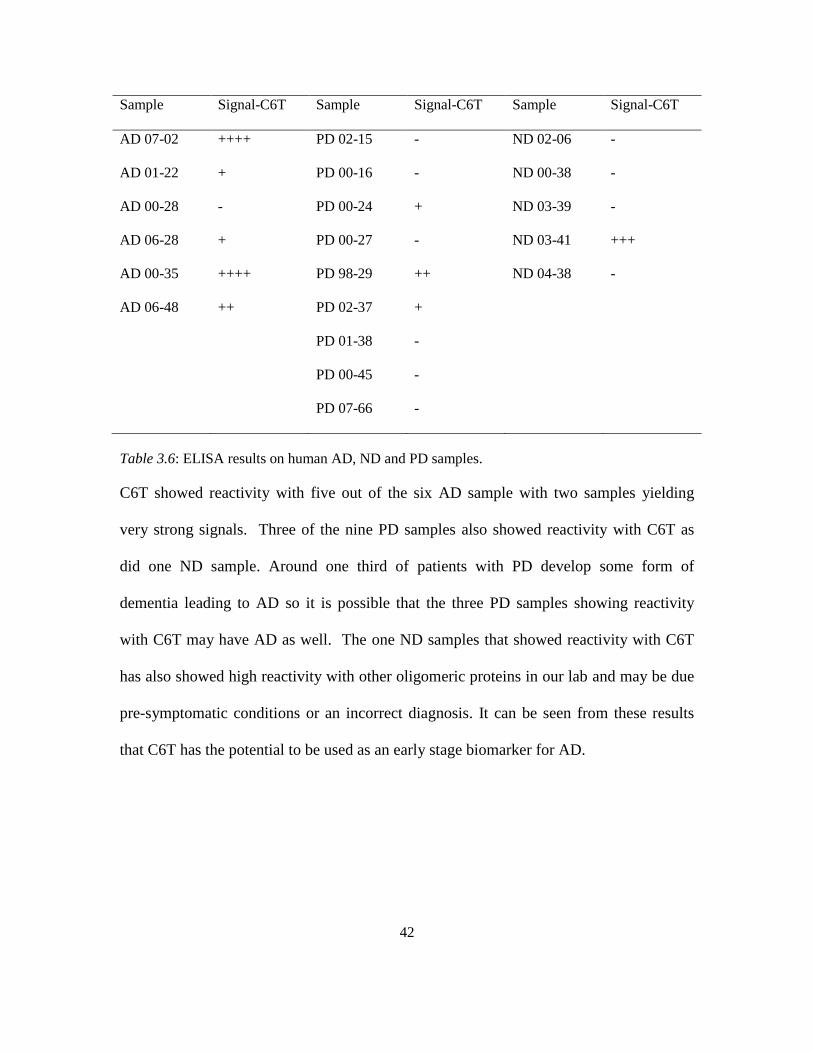
Sample Signal-C6T Sample Signal-C6T Sample Signal-C6T
AD 07-02 ++++ PD 02-15 - ND 02-06 -
AD 01-22 + PD 00-16 - ND 00-38 -
AD 00-28 - PD 00-24 + ND 03-39 -
AD 06-28 + PD 00-27 - ND 03-41 +++
AD 00-35 ++++ PD 98-29 ++ ND 04-38 -
AD 06-48 ++ PD 02-37 +
PD 01-38 -
PD 00-45 -
PD 07-66 -
Table 3.6: ELISA results on human AD, ND and PD samples.
C6T showed reactivity with five out of the six AD sample with two samples yielding
very strong signals. Three of the nine PD samples also showed reactivity with C6T as
did one ND sample. Around one third of patients with PD develop some form of
dementia leading to AD so it is possible that the three PD samples showing reactivity
with C6T may have AD as well. The one ND samples that showed reactivity with C6T
has also showed high reactivity with other oligomeric proteins in our lab and may be due
pre-symptomatic conditions or an incorrect diagnosis. It can be seen from these results
that C6T has the potential to be used as an early stage biomarker for AD.
43
Chapter 4
CONCLUSION
4.1 Summary:
Alzheimer's Disease (AD) is a progressive neurodegenerative disease characterized by the
deposition of extracellular plaques and neurofibrillary tangles. A primary component of these
plaques is the amyloid-beta (Aβ) protein. It exists as soluble oligomeric Aβ, a synapto-toxic
species correlating with disease progression in AD (Lesné et al., 2006)(Mclean et al., 1999).
Current treatment options like cholinesterase inhibitors provide temporary relief to the memory
loss symptoms observed in AD. Recent studies have shown that it takes 12-15 years for a
cognitively normal person to deposit considerable Aβ resulting in cognitive impairment
(Villemagne et al., 2013 and Jack et al., 2013). Thus using an anti-oligomeric Aβ scFv within this
timeframe will serve as a valuable diagnostic and therapeutic tool.
C6T scFv was isolated from a phage display library against human brain derived oligomeric Aβ
(Kasturirangan et al., 2013). The frameshift mutation upstream of the sequence was corrected
using specific PCR primers to insert the missing nucleotide. The corrected C6T clone showed
increased production compared to the old C6. Specificity of the C6T clone was verified using
7PA2 cell line that over expresses mutant APP and Aβ oligomers with CHO as a control.
Triple transgenic AD mice that over express mutant APP and Aβ oligomers and wild type mice of
different age groups, were characterized using C6T. A series of dot blots, and ELISAs showed
that the C6T was able to distinguish the transgenic AD mice samples from WT. C6T was also
able to differentiate between AD, PD and healthy human post-mortem samples using sandwich
ELISA. These characterization studies show that C6T has the potential to be used as a diagnostic
tool for early detection of AD. We intend to use our array of scFvs (against different forms of Aβ)
on these AD samples to determine disease progression as well as distinguish it from healthy, non-
demented samples.
44
4.2 Future work:
Based on the results discussed in this thesis, future work includes:
1. Co-localization studies: To study how C6T interacts with oligomeric Aβ in 7PA2 cells
and to visualize its extracellular co-localization by fluorescently labeling both C6T scFv
and oligomeric Aβ.
2. Toxicity study of C6T clone: In order to characterize C6T better, a lactate dehydrogenase
assay (LDH) can be carried out on SHY-5Y cells. Aggregated Aβ either with or without
the C6T scFv can be added to measure the cytotoxicity.
3. Construction of bi-specific diabodies: C6T scFv can be attached in tandem to another
proteolytic scFv to generate a diabody that will target specific forms of oligomeric Aβ
and clear them.
4. Targeting scFv to the brain: Once the C6T clone is completely characterized, several
methods like viral vector delivery, peptide tags can be used to test its ability to cross the
blood-brain-barrier in an appropriate model. However extensive studies need to be
carried out prior to testing.
45
REFERENCES
Alonso, a C., Zaidi, T., Grundke-Iqbal, I., & Iqbal, K. (1994). Role of abnormally phosphorylated
tau in the breakdown of microtubules in Alzheimer disease. Proceedings of the National
Academy of Sciences of the United States of America, 91(12), 5562–6. Retrieved from
http://www.pubmedcentral.nih.gov/articlerender.fcgi?artid=44036&tool=pmcentrez&render
type=abstract
Alzheimer’s disease. (n.d.). Retrieved from www.alz.org/alzheimers
Arafat, W., Gomez-Navarro, J., & Xiang, J. (2002). Effective single chain antibody (scFv)
concentrations in vivo via adenoviral vector mediated expression of secreted scFv.
Bailey, J., & Maloney, B. (2012). Functional activity of the novel Alzheimer’s amyloid β peptide
interacting domain in the APP and BACE1 promoter sequences and implications in
activating apoptotic genes and in Amyloidogenesis, 488, 13–22.
doi:10.1016/j.gene.2011.06.017.FUNCTIONAL
Bard, F., Cannon, C., Barbour, R., Burke, R. L., Games, D., Grajeda, H., Guido, T., et al. (2000).
Peripherally administered antibodies against amyloid beta-peptide enter the central nervous
system and reduce pathology in a mouse model of Alzheimer disease. Nature medicine,
6(8), 916–9. doi:10.1038/78682
Barrow, C. J., & Zagorski, M. G. (1991). Solution structures of beta peptide and its constituent
fragments: relation to amyloid deposition. Science (New York, N.Y.), 253(5016), 179–82.
Retrieved from http://www.ncbi.nlm.nih.gov/pubmed/1853202
Bartus, R. T., Dean, R. L., Beer, B., & Lippa, a S. (1982). The cholinergic hypothesis of geriatric
memory dysfunction. Science (New York, N.Y.), 217(4558), 408–14. Retrieved from
http://www.ncbi.nlm.nih.gov/pubmed/7046051
Blennow, K., De Leon, M. J., & Zetterberg, H. (2006). Alzheimer’s disease. Lancet, 368(9533),
387–403. doi:10.1016/S0140-6736(06)69113-7
Bond, M., Rogers, G., Peters, J., Anderson, R., Hoyle, M., Miners, A., Moxham, T., et al. (2012).
memantine for the treatment of Alzheimer ’ s disease ( review of Technology Appraisal No .
111 ): a systematic review and economic model, 16(21).
Braak, H., & Braak, E. (1991). Acta H ’ pathologica Neuropathological stageing of Alzheimer-
related changes, 239–259.
Bucciantini, M., Giannoni, E., Chiti, F., Baroni, F., Formigli, L., Zurdo, J., Taddei, N., et al.
(2002). Inherent toxicity of aggregates implies a common mechanism for protein misfolding
diseases. Nature, 416(6880), 507–11. doi:10.1038/416507a
Citron, M., & Oltersdorf, T. (1992). Mutation of the beta-amyloid precursor protein in familial
Alzheimer’s disease increases beta-protein production. Letters to Nature, 360, 672–674.
46
Davies, P. H., Stewart, S. E., Lancranjan, L., Sheppard, M. C., & Stewart, P. M. (1998). Long-
term therapy with long-acting octreotide (Sandostatin-LAR) for the management of
acromegaly. Clinical endocrinology, 48(3), 311–6. Retrieved from
http://www.ncbi.nlm.nih.gov/pubmed/9578821
Davies, P., & Maloney, A. (1976). Selective loss of central cholinergic neurons in Alzheimer’s
disease. The Lancet, 34(134), 1403. doi:10.1049/sqj.1963.0057
De Strooper, B., & Annaert, W. (2000). Proteolytic processing and cell biological functions of the
amyloid precursor protein. Journal of cell science, 113 ( Pt 1, 1857–70. Retrieved from
http://www.ncbi.nlm.nih.gov/pubmed/10806097
Delrieu, J., Ousset, P. J., Caillaud, C., & Vellas, B. (2012). “Clinical trials in Alzheimer”s
disease’: immunotherapy approaches. Journal of neurochemistry, 120 Suppl , 186–93.
doi:10.1111/j.1471-4159.2011.07458.x
Dierich, A., Sairam, M. R., Mo-, L., Fimia, G. M., Gansmuller, A., Lemeur, M., Sheets, M. D., et
al. (1998). Efficient construction of a large nonimmune phage antibody library : The
production of high-affinity human single-chain antibodies to protein antigens. Cell Biology,
95(22), 6157–62.
Emmerling, M. R. (1996). Water-soluble Abeta(N-40, N-42) Oligomers in Normal and Alzheimer
Disease Brains. Journal of Biological Chemistry, 271(8), 4077–4081.
doi:10.1074/jbc.271.8.4077
Fracis, P., & Bowen, D. (1993). Soluble beta-amyloid precursor protein and pyramidal neuron
loss. The Lancet, 341, 431. doi:10.2460/ajvr.74.7.948
Francisco, S., Jolla, L., Pharmaceuticals, E., & San, S. (1999). Plaque-independent disruption of
neural circuits in Alzheimer ’ s disease mouse models. Neurobiology, 96(March), 3228–
3233.
Ganzer, S., Arlt, S., Schoder, V., Buhmann, C., Mandelkow, E.-M., Finckh, U., Beisiegel, U., et
al. (2003). CSF-tau, CSF-Abeta1-42, ApoE-genotype and clinical parameters in the
diagnosis of Alzheimer’s disease: combination of CSF-tau and MMSE yields highest
sensitivity and specificity. Journal of neural transmission (Vienna, Austria : 1996), 110(10),
1149–60. doi:10.1007/s00702-003-0017-7
Glenner, G., & Wong, W. (1984). Alzheimer’s disease and Down's syndrome of a unique
cerebrovascular amyloid fibril protein. Biochemical and Biophysical research
Communications, 122(3), 1131–1135.
Gustafson, L., Brun, A., Englund, E., Hagnell, O., Nilsson, K., Stensmyr, M., Öhlin, A.-K., et al.
(1998). A 50-year perspective of a family with chromosome-14-linked Alzheimer’s disease.
Human Genetics, 102(3), 253–257. doi:10.1007/s004390050688
Haniu, M., Denis, P., Young, Y., Mendiaz, E. a, Fuller, J., Hui, J. O., Bennett, B. D., et al. (2000).
Characterization of Alzheimer’s beta -secretase protein BACE. A pepsin family member
47
with unusual properties. The Journal of biological chemistry, 275(28), 21099–106.
doi:10.1074/jbc.M002095200
Harper, J. D., Lansbury, P. T., Wong, S., & Lieber, M. (1996). Observation of metastable force
microscopy Abeta amyloid protofibrils by atomic force microscopy. Chemistry and Biology,
4(2), 119–25.
Islands, S. (1986). AND IN ALZHEIMER ’ S DISEASE : A THIRD LOCATION OF PAIRED
HELICAL FILAMENTS OUTSIDE OF NEUROFIBRILLARY TANGLES AND, 65, 351–
355.
Iy, J. W., Wu, Q., Smith, A., Grundke-iqbal, I., & Y, K. I. (1998). d is phosphorylated by GSK-3
at several sites found in Alzheimer disease and its biological activity markedly inhibited
only after it is prephosphorylated by A-kinase. FEBS Letters, 436, 28–34.
Jarrett, J. T., Berger, E. P., & Lansbury, P. T. (1993). The carboxy terminus of the .beta. amyloid
protein is critical for the seeding of amyloid formation: Implications for the pathogenesis of
Alzheimer’s disease. Biochemistry, 32(18), 4693–4697. doi:10.1021/bi00069a001
Jiang, Q., Lee, C. Y. D., Mandrekar, S., Wilkinson, B., Zelcer, N., Mann, K., Lamb, B., et al.
(2008). ApoE promotes the proteolytic degradation of Aβ, 58(5), 681–693.
Joachim, C. L., Morris, J. H., & Selkoe, D. J. (1989). Diffuse Senile Plaques Occur Commonly in
the Cerebellum in Alzheimer ’ s Disease, 135(2), 309–319.
Jonghe, C. De, Cruts, M., Rogaeva, E. A., Tysoe, C., Singleton, A., Vanderstichele, H.,
Meschino, W., et al. (1999). Aberrant splicing in the presenilin-1 intron 4 mutation causes
presenile Alzheimer ’ s disease by increased Aβ β 42 secretion, 8(8), 1529–1540.
Kasturirangan, S., Reasoner, T., Schulz, P., Boddapati, S., Emadi, S., Valla, J., & Sierks, M.
(2013). ISOLATION AND CHARACTERIZATION OF A NANOBODY THAT
SELECTIVELY BINDS BRAIN DERIVED OLIGOMERIC BETA AMYLOID. Biotech
Progress, 29(2), 463–471. doi:10.1002/btpr.1698
Kim, M., Jeong, H.-J., Kao, C.-H. K., Yao, Z., Paik, D. S., Pie, J. E., Kobayashi, H., et al. (2002).
Improved renal clearance and tumor targeting of 99mTc-labeled anti-Tac monoclonal
antibody Fab by chemical modifications. Nuclear medicine and biology, 29(2), 139–46.
Retrieved from http://www.ncbi.nlm.nih.gov/pubmed/11823118
Klunk, W. E., Jacob, R. F., & Mason, R. P. (1999). Quantifying Amyloid β -Peptide ( Aβ )
Aggregation Using the Congo Red-Aβ ( CR – Aβ ) Spectrophotometric Assay, 76, 66–76.
Kopcho, L. M., Ma, J., Marcinkeviciene, J., Lai, Z., Witmer, M. R., Cheng, J., Yanchunas, J., et
al. (2003). Comparative studies of active site-ligand interactions among various
recombinant constructs of human beta-amyloid precursor protein cleaving enzyme. Archives
of biochemistry and biophysics, 410(2), 307–16. Retrieved from
http://www.ncbi.nlm.nih.gov/pubmed/12573291
48
Lambert, M. P., Barlow, a K., Chromy, B. a, Edwards, C., Freed, R., Liosatos, M., Morgan, T. E.,
et al. (1998). Diffusible, nonfibrillar ligands derived from Abeta1-42 are potent central
nervous system neurotoxins. Proceedings of the National Academy of Sciences of the United
States of America, 95(11), 6448–53. Retrieved from
http://www.pubmedcentral.nih.gov/articlerender.fcgi?artid=27787&tool=pmcentrez&render
type=abstract
Lambert, M. P., Viola, K. L., Chromy, B. a, Chang, L., Morgan, T. E., Yu, J., Venton, D. L., et al.
(2001). Vaccination with soluble Abeta oligomers generates toxicity-neutralizing
antibodies. Journal of neurochemistry, 79(3), 595–605. Retrieved from
http://www.ncbi.nlm.nih.gov/pubmed/11701763
Lee, H.-G., Perry, G., Moreira, P. I., Garrett, M. R., Liu, Q., Zhu, X., Takeda, A., et al. (2005).
Tau phosphorylation in Alzheimer’s disease: pathogen or protector? Trends in molecular
medicine, 11(4), 164–9. doi:10.1016/j.molmed.2005.02.008
Lesné, S., Koh, M. T., Kotilinek, L., Kayed, R., Glabe, C. G., Yang, A., Gallagher, M., et al.
(2006). A specific amyloid-beta protein assembly in the brain impairs memory. Nature,
440(7082), 352–7. doi:10.1038/nature04533
Levy-lahad, A. E., Wijsman, E. M., Nemens, E., Anderson, L., Katrina, A., Goddard, B., Weber,
J. L., et al. (2013). A Familial Alzheimer ’ s Disease Locus on Chromosome I, 269(5226),
970–973.
Masters, C. L., Multhaup, G., Simms, G., Martins, R. N., & Beyreuther, K. (1985). Neuronal
origin of a cerebral amyloid : neurofibriliary tangles of Alzheimer ’ s disease contain the
same protein as the amyloid of plaque cores and blood vessels, 4(11), 2757–2763.
Mclean, C. A., Cherny, R. A., Fraser, F. W., Fuller, S. J., Smith, M. J., Beyreuther, K., Bush, A.
I., et al. (1999). Soluble Pool of β Amyloid as a Determinant of Severity of
Neurodegeneration in Alzheimer ’ s Disease, 860–866.
Morishima-kawashima, M., & Ihara, Y. (1998). The Presence of Amyloid -Protein in the
Detergent-Insoluble Membrane Compartment of Human Neuroblastoma Cells.
Biochemistry, 37(44).
Näslund, J., Haroutunian, V., Mohs, R., Davis, K. L., Davies, P., Greengard, P., & Buxbaum, J.
D. (2013). Correlation between elevated levels of amyloid beta-peptide in the brain and
cognitive decline. JAMA : the journal of the American Medical Association, 283(12), 1571–
7. Retrieved from http://www.ncbi.nlm.nih.gov/pubmed/10735393
Oddo, S., Caccamo, A., Shepherd, J. D., Murphy, M. P., Golde, T. E., Kayed, R., Metherate, R.,
et al. (2003). Triple-Transgenic Model of Alzheimer ’ s Disease with Plaques and Tangles :
Intracellular A  and Synaptic Dysfunction, 39, 409–421.
Owen, M., & Hardy, J. (1991). Segregation of a missense mutation in the amyloid precursor
protein gene with familial Alzheimer’s disease. Letters to Nature, 349, 704–706.
49
Pangalos, M. N., Jacobsen, S. J., & Reinhart, P. H. (2005). Disease modifying strategies for the
treatment of Alzheimer’s disease targeted at modulating levels of the beta-amyloid peptide.
Biochemical Society transactions, 33(Pt 4), 553–8. doi:10.1042/BST0330553
Perry, E. K., Tomlinson, B. E., Blessed, G., Bergmann, K., Gibson, P. H., & Perry, R. H. (1978).
Correlation of cholinergic abnormalities with senile plaques and mental test scores in senile
dementia. British medical journal, 2(6150), 1457–9. Retrieved from
http://www.pubmedcentral.nih.gov/articlerender.fcgi?artid=1608703&tool=pmcentrez&ren
dertype=abstract
Priller, C., Bauer, T., Mitteregger, G., Krebs, B., Kretzschmar, H. a, & Herms, J. (2006). Synapse
formation and function is modulated by the amyloid precursor protein. The Journal of
neuroscience : the official journal of the Society for Neuroscience, 26(27), 7212–21.
doi:10.1523/JNEUROSCI.1450-06.2006
Schenk, D., Barbour, R., Dunn, W., Gordon, G., Grajeda, H., Guido, T., Hu, K., et al. (1999).
Immunization with amyloid-beta attenuates Alzheimer-disease-like pathology in the PDAPP
mouse. Nature, 400(6740), 173–7. doi:10.1038/22124
Schmechel, D. E., Saunders, a M., Strittmatter, W. J., Crain, B. J., Hulette, C. M., Joo, S. H.,
Pericak-Vance, M. a, et al. (1993). Increased amyloid beta-peptide deposition in cerebral
cortex as a consequence of apolipoprotein E genotype in late-onset Alzheimer disease.
Proceedings of the National Academy of Sciences of the United States of America, 90(20),
9649–53. Retrieved from
http://www.pubmedcentral.nih.gov/articlerender.fcgi?artid=47627&tool=pmcentrez&render
type=abstract
Schroeter, E. H., Ilagan, M. X. G., Brunkan, A. L., Hecimovic, S., Li, Y., Xu, M., Lewis, H. D.,
et al. (2003). A presenilin dimer at the core of the gamma-secretase enzyme: insights from
parallel analysis of Notch 1 and APP proteolysis. Proceedings of the National Academy of
Sciences of the United States of America, 100(22), 13075–80. doi:10.1073/pnas.1735338100
Selkoe, D. J. (1994). Amyloid β-protein precursor: new clues to the genesis of Alzheimer’s
disease. Current Opinion in Neurobiology, 4(5), 708–716. doi:10.1016/0959-
4388(94)90014-0
Shankar, G. M., Li, S., Mehta, T. H., Garcia-munoz, A., Nina, E., Smith, I., Brett, F. M., et al.
(2009). Amyloid β-Protein dimers isolated directly from Alzheimer brains impair synaptic
plasticity and memory. Nat med, 14(8), 837–842. doi:10.1038/nm1782.Amyloid
Simons, K., & Toomre, D. (2000). Lipid rafts and signal transduction. Nature reviews. Molecular
cell biology, 1(1), 31–9. doi:10.1038/35036052
St George-Hyslop. (1995). Familial Alzheimer’s disease in kindreds with missense mutations in a
gene on chromosome 1 related to the Alzheimer's disease type 3 gene.
Tabaton, M., Zhu, X., Perry, G., Smith, M. A., & Giliberto, L. (2011). Signaling Effect of Aβ42
on the processing of AβPP, 221(1), 18–25. doi:10.1016/j.expneurol.2009.09.002.Signaling
50
Terry. (1981). Immunocytochemical Studies Neurofibrillary. Studies, Immunocytochemical.
Tomlinson, B. E., Blessed, G., & Roth, M. (1997). Observations on the Brains of Demented Old
People . Observations on the Brains of Non-Demented Old People . B . E . Tomlinson , G .
Blessed and M . Roth , Journal of, 12, 785–790.
Turner, P. R., O’Connor, K., Tate, W. P., & Abraham, W. C. (2003). Roles of amyloid precursor
protein and its fragments in regulating neural activity, plasticity and memory. Progress in
Neurobiology (Vol. 70, pp. 1–32). doi:10.1016/S0301-0082(03)00089-3
Walsh, D. M., Minogue, a M., Sala Frigerio, C., Fadeeva, J. V, Wasco, W., & Selkoe, D. J.
(2007). The APP family of proteins: similarities and differences. Biochemical Society
transactions, 35(Pt 2), 416–20. doi:10.1042/BST0350416
Weidemann, A., Kiinig, G., Bunke, D., Fischer, P., Salbaum, J. M., Masterst, C. L., &
Beyreuther, K. (1989). Identification , Biogenesis , and Localization Precursors of
Alzheimer ’ s Disease A4 Amyloid Protein, 57, 115–126.
West, M. ., Coleman, P. ., Flood, D. ., & Troncoso, J. . (1994). Differences in the pattern of
hippocampal neuronal loss in normal ageing and Alzheimer’s disease. The Lancet,
344(8925), 769–772. doi:10.1016/S0140-6736(94)92338-8
Wolfe, M. S., Esler, W. P., & Das, C. (2002). Continuing strategies for inhibiting Alzheimer’s
gamma-secretase. Journal of molecular neuroscience : MN, 19(1-2), 83–7.
doi:10.1007/s12031-002-0015-5
Yokota, T., Milenic, D. E., Whitlow, M., & Schlom, J. (1992). Rapid Tumor Penetration of a
Single-Chain Fv and Comparison with Other Immunoglobulin Forms Rapid Tumor
Penetration of a Single-Chain Fv and Comparison with Other Immunoglobulin Forms.
Cancer Research, 3402–3408.
Zheng, W.-H., Bastianetto, S., Mennicken, F., Ma, W., & Kar, S. (2002). Amyloid beta peptide
induces tau phosphorylation and loss of cholinergic neurons in rat primary septal cultures.
Neuroscience, 115(1), 201–11. Retrieved from
http://www.ncbi.nlm.nih.gov/pubmed/12401334
Zou, K., Gong, J.-S., Yanagisawa, K., & Michikawa, M. (2002). A novel function of monomeric
amyloid beta-protein serving as an antioxidant molecule against metal-induced oxidative
damage. The Journal of neuroscience : the official journal of the Society for Neuroscience,
22(12), 4833–41. Retrieved from http://www.ncbi.nlm.nih.gov/pubmed/12077180
50