olstein all cap value fund olstein strategic opportunities ... · 6 portfolio review at june 30,...
TRANSCRIPT

Olstein All Cap Value Fund
Olstein Strategic Opportunities Fund
The Olstein Funds
A N N U A L R E P O R T
J U N E 3 0 , 2 0 1 8

O L S T E I N A L L C A P V A L U E F U N D
2
CON T EN T S
3 Olstein All Cap Value Fund
29 Olstein Strategic Opportunities Fund
55 Combined Notes to Financial Statements
66 Report of Independent Registered Public Accounting Firm
67 Additional Information

The accompanying notes are an integral part of these financial statements.
O L S T E I N A L L C A P V A L U E F U N D
O L S T E I N A L L C A P VA LU E F UND
4 Letter to Shareholders
13 Expense Example
15 Schedule of Investments
22 Statement of Assets and Liabilities
24 Statement of Operations
25 Statements of Changes in Net Assets
26 Financial Highlights
O L S T E I N A L L C A P V A L U E F U N D
3

4
O L S T E I N A L L C A P VA LU E F UNDLetter to Shareholders
D E A R F E L L O W S H A R E H O L D E R S :
For the fiscal year ended June 30, 2018, Class C and Adviser Class shares ofthe Olstein All Cap Value Fund appreciated 5.57% and 6.66%, respectively.1During the same twelve month period, the Russell 3000® Value Indexappreciated 7.25% and the Russell 3000® Index appreciated 14.78%.
M A R K E T O U T L O O K
Over the course of the Fund’s fiscal year, U.S. equity markets continued toclimb, with the S&P 500® Index gaining 14.37% during the twelve monthsended June 30, 2018. Accelerated economic growth and increased corporateprofits continued to drive equity market returns during the fiscal year. Whilewe believe that continued job growth, a mildly expansionary tax plan,improved business confidence and favorable consumer sentiment, suggestfurther economic momentum and earnings growth during the second half of2018, we are keeping a wary eye on the investment dollar dominance of thenew economy so called “hyper growth” stocks responsible for a majority of themarkets’ appreciation over the last few years. As value investors, we believethat the narrow range of growth companies attracting investor money andresponsible for a significant portion of the S&P 500 Index performance overthe past few years characterized by the so called “FANG” stocks (Facebook,Amazon, Netflix and Google), is creating large pockets of undervaluation inmore stabilized and mature free cash flow generating companies. The
O L S T E I N A L L C A P V A L U E F U N D
1 The performance data quoted represents past performance and does notguarantee future results. The Olstein All Cap Value Fund’s Class C averageannual return for the one-year, five-year, and ten-year periods ended 6/30/18,assuming reinvestment of dividends and capital gain distributions and deductionof the Olstein All Cap Value Fund’s maximum CDSC of 1% during the one-year period, was 4.58%, 8.86%, and 8.01%, respectively. Per the Fund’sprospectus dated 10/31/17, the expense ratio for the Olstein All Cap Value FundClass C was 2.27%. Performance and expense ratios for other share classes willvary due to differences in sales charge structure and class expenses. Theinvestment return and principal value of an investment will fluctuate so that aninvestor’s shares, when redeemed, may be worth more or less than their originalcost. Current performance may be lower or higher than performance quoted. Toobtain performance data current to the most recent month end, please go to ourwebsite at www.olsteinfunds.com.

5
O L S T E I N A L L C A P V A L U E F U N D
continued investor focus on a limited number of mega capitalization socialmedia, internet, and technology companies has created what we believe arefavorable opportunities for the Fund to buy good companies at bargain prices.Investor focus on chasing momentum “FANG”-like stocks has enabled theFund to purchase securities in more mature companies, consistently producingstabilized and/or growing free cash flow. We are finding these opportunities inbroad segments of the equity market in which normalized and/or growing freecash flow is, in our opinion, not being properly valued as a result of thebifurcated momentum market, temporary problems affecting the individualcompanies or just plain misperception. We are hopeful that our valuations ofthese deep value stocks will be properly recognized by the equity market, andthat while we wait, each company’s free cash flow generation will producecontinued shareholder value creation in the form of stock buybacks, dividends,and/or strategic acquisitions.
O U R S T R A T E G Y
We believe it is important to weather market conditions and shifts ininvestor-driven momentum by favoring the equities of financially strongcompanies with stable or growing free cash flow that are run bymanagements that have a demonstrated history of deploying cash to thebenefit of shareholders. Periodic spikes in market volatility during thecourse of the Fund’s fiscal year created many individual opportunities thatoffered the potential for above-average capital appreciation. Our quest forvalue is guided by two considerations: (1) a company’s ability to generatesustainable future free cash flow; and (2) securities prices that allow us to buygood companies, with solid balance sheets, and profitable protected businessmodels, at what we believe are very advantageous prices. Our focus is toestimate a company’s prospects of generating future free cash flow and thento wait for an opportunity to buy these companies at a discount to ourassessment of their values, as a result of what we believe are temporary issuesclouding long-term values.
The Fund’s current portfolio consists of companies that we believe have asustainable competitive advantage, discernible balance sheet strength, amanagement team that emphasizes decisions based on cost of capitalcalculations and deploys free cash flow to create shareholder value. Weremain focused on individual companies, their operations and prospects formaintaining or growing sustainable free cash flow which we believe is notbeing properly valued by the equity market. Paying the right price andbelieving investor sentiment should change in the near future motivated byunexpected rising free cash flow has been the long-term discipline of theFund and a primary driver of the investment results over the past 23 years.

6
P O R T F O L I O R E V I E W
At June 30, 2018, the Olstein All Cap Value Fund’s portfolio consisted of 98holdings with an average weighted market capitalization of $95.73 billion.During the fiscal year, the Fund initiated positions in twenty-one companiesand strategically added to positions in twelve companies. Over the sametime period, the Fund eliminated its holdings in twenty companies andstrategically decreased its holdings in another twenty-three companies.
Positions initiated during the last twelve months include: Casey’s GeneralStores Inc., Chevron Corporation, CommScope Holding Company, DelphiTechnologies, DowDuPont Inc., Dunkin Brands Group, Eastman ChemicalCompany, Eaton Corporation, Gardner Denver Holdings, Generac Holdings,Goldman Sachs Group, Henry Schein Inc., Kimberly-Clark Corporation,Kulicke & Soffa Industries, Lam Research Corporation, Omnicom GroupInc., Parker-Hannifin Corporation, Sealed Air Corporation, WalgreensBoots Alliance Inc., Wells Fargo & Company, and Willis Towers Watson.
Positions eliminated during the past twelve months include: Bed Bath &Beyond Inc., Big Lots Inc., Charles River Laboratories, ConvergysCorporation, General Electric Company, Harley-Davidson Inc., Hill-RomHoldings Inc., IPG Photonics, Janus Henderson Group, Mattel Inc., NikeInc., Patterson Companies Inc., S&P Global Inc., ServiceMaster GlobalHoldings, Scripps Networks Interactive, Twenty-First Century Fox, Inc., VFCorporation, VWR Corp., Winnebago Industries, and Zoetis Inc.
Our Leaders
Leading performers for the twelve-month reporting period ended June 30,2018, include: Mastercard Inc., Intuitive Surgical, Keysight Technologies,Intel Corporation, and Winnebago Industries. At the close of the fiscal yearthe Fund continued to maintain positions in Mastercard, Intuitive Surgical,Keysight Technologies, and Intel Corporation. The Fund sold its position inWinnebago Industries as it reached its valuation in a relatively short periodof time. The Fund built a position in Winnebago in June 2017 at an averageprice of $29.04 per share. As the company’s stock reached our valuationlevel, the Fund liquidated its position by the end of November 2017 withinan average sale price of $48.47 per share. Over an unusually short holdingperiod of just over five months, the Fund’s holding in Winnebago Industriesappreciated approximately 67%.
Our Laggards
Laggards during the twelve-month reporting period include: PattersonCompanies, Newell Brands, Mattel Inc., Goodyear Tire & Rubber Company,
O L S T E I N A L L C A P V A L U E F U N D

7
O L S T E I N A L L C A P V A L U E F U N D
and Owens-Illinois. At the close of the fiscal year the Fund maintainedpositions in Newell Brands, Goodyear Tire & Rubber, and Owens-Illinois.We liquidated the Fund’s holding in Mattel when we determined that thecompany’s turnaround strategy would take longer than our original thesisanticipated and that the company’s woes were amplified by the bankruptcy ofToys-R-Us, one of its largest distribution partners. Similarly, the Fundliquidated its position in Patterson Companies due to poor execution of theirturnaround/restructuring strategy and ongoing challenges within the marketfor consumable dental products and supplies.
A Note on the Proposed New Lower Cost Operating Structure of The Olstein Funds
By the time you read this letter you will have received a Proxy Statementand Notice of Special Joint Meeting of Shareholders scheduled forSeptember 12, 2018. The meeting is for shareholders of the Olstein All CapValue Fund and the Olstein Strategic Opportunities Fund to vote on aproposal to reorganize our two mutual funds, on a tax-free basis, into alower-cost investment company operating structure with no change inmanagement or investment objectives. Shareholders of each Olstein fundhave been asked to vote on a proposal to reorganize their fund into acorresponding newly created Olstein mutual fund within Managed PortfolioSeries, a registered investment company operated by the Olstein Funds’current service provider, U.S. Bancorp Fund Services, LLC. Each newOlstein fund within Managed Portfolio Series has been created specifically tocontinue the operation of the corresponding Olstein Fund withoutinterruption, has the same fund name and share class ticker symbols, retainsOlstein Capital Management as investment manager, is managed accordingto the same investment objective and investment philosophy, and will carryforward the fund’s financial and performance history. The proposedadministrative change provides continuity of service and support for thefunds and shareholders while providing cost savings and efficienciesassociated with being part of a larger investment company.
The Olstein Funds Board of Trustees believes that the proposedreorganization of each Olstein fund into the corresponding acquiring fund isin the best interests of shareholders and, for the reasons described in theProxy Statement/Prospectus previously sent to you, recommends that youvote “FOR” the proposed reorganization. Regardless of your account size, weneed your vote! To avoid delay and additional expense, and to assure thatyour shares are represented, please vote as promptly as possible, either byInternet through the website listed in the proxy voting instructions; byTelephone using the toll-free number listed in the proxy voting instructions;

8
or by Mail with the proxy card(s) sent to you. We expect the new funds willbegin operations on or around September 14, 2018, following a favorablevote at the upcoming Shareholder Meeting on September 12, 2018.
F I N A L T H O U G H T S
We are continuing to practice our investment discipline (ignoringtemptations to chase the latest investment fad) which emphasizesunderstanding a business, its potential to generate sustainable free cash flowand ultimately its value. After identifying companies that meet our well-defined investment criteria, we then attempt to take advantage of what webelieve are short-term disappointments or temporary market conditionsproducing downward price movements and allowing us to buy suchcompanies at what we believe are advantageous prices. We believe thatpaying the right price increases the chances for a successful investmentoutcome. We are currently finding many companies that we believe areundervalued because their future free cash flow generation potential is beingimproperly valued by the market.
We value your trust and remind you that our money is invested alongsideyours as we work hard to accomplish the Fund’s objective of long-termcapital appreciation. We look forward to writing to you again at the close ofthe year.
Sincerely,
Robert A. Olstein Eric HeymanChairman and Chief Investment Officer Co-Portfolio Manager
O L S T E I N A L L C A P V A L U E F U N D

9
O L S T E I N A L L C A P V A L U E F U N D
9/21/95 $10,0009/30/95 10,010
12/31/95 10,2613/31/96 10,8826/30/96 11,4629/30/96 11,713
12/31/96 12,7603/31/97 13,3276/30/97 14,6029/30/97 17,250
12/31/97 17,2053/31/98 19,8516/30/98 18,4689/30/98 15,499
12/31/98 19,7883/31/99 20,7176/30/99 25,3659/30/99 23,675
12/31/99 26,6923/31/00 28,1706/30/00 28,8999/30/00 30,596
12/31/00 30,1423/31/01 30,2076/30/01 36,1929/30/01 28,213
12/31/01 35,3403/31/02 38,2596/30/02 33,7979/30/02 25,870
12/31/02 28,5283/31/03 26,2266/30/03 31,4489/30/03 33,797
12/31/03 38,8533/31/04 40,8706/30/04 41,2979/30/04 39,043
12/31/04 43,1463/31/05 42,6406/30/05 42,3029/30/05 43,749
12/31/05 44,3503/31/06 46,5666/30/06 44,2419/30/06 46,836
12/31/06 50,755
3/31/07 51,8636/30/07 55,5369/30/07 53,029
12/31/07 49,0123/31/08 42,4476/30/08 40,1899/30/08 38,452
12/31/08 27,5453/31/09 24,7676/30/09 30,1029/30/09 35,648
12/31/09 37,7413/31/10 40,3926/30/10 35,7889/30/10 39,695
12/31/10 43,8453/31/11 45,2766/30/11 45,3109/30/11 37,497
12/31/11 41,9623/31/12 48,5196/30/12 45,5559/30/12 47,159
12/31/12 48,3803/31/13 54,2756/30/13 56,7869/30/13 60,379
12/31/13 65,9953/31/14 66,8676/30/14 69,1349/30/14 69,413
12/31/14 75,9133/31/15 77,2906/30/15 75,5259/30/15 66,631
12/31/15 68,6943/31/16 70,2206/30/16 68,8599/30/16 73,312
12/31/16 76,6123/31/17 80,3726/30/17 82,2329/30/17 82,438
12/31/17 87,5613/31/18 86,6836/30/18 86,815
Details:The performance data quoted represents past performance and does not guaranteefuture results. The Olstein All Cap Value Fund’s Class C average annual return forthe one-year, five-year, and ten-year periods ended 6/30/18, assuming reinvestment
The following chart illustrates the growth, on a quarterly basis, of a hypo-thetical $10,000 investment made in the Olstein All Cap Value Fund’s ClassC share at the Olstein All Cap Value Fund’s inception date of September 21,1995 (with dividends and capital gain distributions reinvested but no deduc-tion of taxes on reinvested distributions—see important disclosures below):
Value of Shares Owned, Value of Shares Owned,If Initial Investment If Initial Investment
Date was $10,000 Date was $10,000_____________________________ _____________________________

10
O L S T E I N A L L C A P V A L U E F U N D
of dividends and capital gain distributions and deduction of the Olstein All CapValue Fund’s maximum CDSC of 1% during the one-year period, was 4.58%,8.86%, and 8.01%, respectively. Per the Fund’s prospectus dated 10/31/17, theexpense ratio for the Olstein All Cap Value Fund Class C was 2.27%. Performanceand expense ratios for other share classes will vary due to differences in sales chargestructure and class expenses. The investment return and principal value of an invest-ment will fluctuate so that an investor’s shares, when redeemed, may be worth moreor less than their original cost. Current performance may be lower or higher than per-formance quoted. To obtain performance data current to the most recent month end,please go to our website at www.olsteinfunds.com.The above represents opinion, and is not intended to be a forecast of future events, aguarantee of future results, or investment advice. The references to securities are notbuy or sell recommendations, but are intended to be descriptive examples of the Fund’sinvestment philosophy and are subject to change. Do not make investments based onthe securities referenced. A full schedule of fund holdings as of 6/30/18 is contained inthis report, and is subject to change. This information should be preceded or accompa-nied by a current prospectus, which contains more complete information, includinginvestment objectives, risks, charges and expenses of the Olstein Funds and should beread carefully before investing. A current prospectus may be obtained by calling(800) 799-2113 or visiting the Olstein Funds’ website at www.olsteinfunds.com.The Olstein Funds follow a value-oriented investment approach. However, a par-ticular value stock may not increase in price as the Investment Manager anticipatesand may actually decline in price if other investors fail to recognize the stock’s valueor if a catalyst that the Investment Manager believes will increase the price of thestock does not occur or does not affect the price of the stock in the manner or to thedegree that the Investment Manager anticipated. Also, the Investment Manager’scalculation of a stock’s private market value involves estimates of future cash flowwhich may prove to be incorrect and, therefore, could result in sales of the stock atprices lower than the Fund’s original purchase price. There is no assurance that theFund will achieve its investment objective.The Russell 3000 Index® is an unmanaged index that seeks to represent the broadU.S. equity universe accounting for approximately 98% of the U.S. market capi-talization. The Russell 3000 Value Index® measures the performance of the broadvalue segment of U.S. equity value universe. It includes those Russell 3000® com-panies with lower price-to-book ratios and lower forecasted growth values. TheRussell 3000 Value Index® is constructed to provide a comprehensive and unbiasedbarometer of the broad value market. The S&P 500 Index is an unmanaged indexcreated by Standard & Poor’s Corporation that includes a representative sample of500 leading companies in leading industries of the U.S. economy. While not aFund benchmark, the S&P 500 Index is considered to represent the U.S. stockmarket performance in general. Past performance does not guarantee futureresults. Index returns do not reflect payment of any expenses, fees or sales chargesan investor would pay to purchase the securities the index represents. Such costswould lower performance. Investors cannot invest directly in an index.Not FDIC insured – Not bank-guaranteed – May lose valueDistributed by Olstein Capital Management, L.P. – Member FINRA

11
O L S T E I N A L L C A P V A L U E F U N D
6/30
/15
$26,483
6/30
/17
6/30
/08
6/30
/09
$5,000
$10,000
$15,000
$20,000
$25,000
$30,000
$35,000
$40,000
Olstein All Cap Value Fund – Class C
Russell 3000® Value Index
Russell 3000® Index
S&P 500® Index
6/30
/10
6/30
/11
6/30
/12
6/30
/13
6/30
/14
6/30
/16
$26,340$22,817$21,602
6/30
/18
(1) Assumes reinvestment of dividends and capital gains. Also includes all expenses at the end of each period and assumesthe deduction of the appropriate CDSC as if an investor had redeemed at the end of the one year period, and thus repre-sents a “net return.” The CDSC is based on the lesser of the original purchase price and the value of such shares at thetime of redemption. Past performance is not necessarily indicative of future results. Investment returns and principalvalues may fluctuate, so that, when redeemed, shares may be worth more or less than their original cost.
(2) Russell 3000® Value Index return is adjusted upward to reflect reinvested dividends, but does not reflect the deductionof any fees or expenses associated with investments in the index, and thus represents a “gross return”.
(3) The Russell 3000® Index reflects the broad U.S. equity universe and represents approximately 98% of the U.S. market.Russell 3000® Index return is adjusted upward to reflect reinvested dividends, but does not reflect the deduction of anyfees or expenses associated with investments in the index, and thus represents a “gross return”.
(4) S&P 500® Index return is adjusted upward to reflect reinvested dividends, but does not reflect the deduction of any feesor expenses associated with investment in the index, and thus represents a “gross return”.
(5) Commenced operations on September 21, 1995.
Average Annual Total Returns______________________1 Year 5 Year 10 Year 15 Year Inception(5)_____ _____ ______ ______ __________
Olstein All Cap Value – Class C(1) 4.58% 8.86% 8.01% 7.00% 9.95%Russell 3000® Value Index(2) 7.25% 10.40% 8.60% 8.73% 9.11%Russell 3000® Index(3) 14.78% 13.29% 10.23% 9.61% 9.11%S&P 500® Index(4) 14.37% 13.42% 10.17% 9.30% 9.04%
Comparison of the Change in Value of a Hypothetical $10,000 Investment from the Fund’s ClassC for the past 10 years through the Fiscal Year End of 6/30/18. The line chart does not reflectany applicable Contingent Deferred Sales Charge. The returns listed in the table do not reflectthe deduction of taxes on Fund distributions or the redemption of Fund shares.

12
O L S T E I N A L L C A P V A L U E F U N D
6/30
/15
$26,483
6/30
/17
6/30
/08
6/30
/09
$5,000
$10,000
$15,000
$20,000
$25,000
$30,000
$35,000
$40,000
Olstein All Cap Value Fund – Adviser Class
Russell 3000® Value Index
Russell 3000® Index
S&P 500® Index
6/30
/10
6/30
/11
6/30
/12
6/30
/13
6/30
/14
6/30
/16
$26,340$23,556$22,817
6/30
/18
(1) Assumes reinvestment of dividends and capital gains. Also includes all expenses for each period and thus represents a“net return”. Past performance is not necessarily indicative of future results. Investment returns and principal valuesmay fluctuate, so that, when redeemed, shares may be worth more or less than their original cost.
(2) Russell 3000® Value Index return is adjusted upward to reflect reinvested dividends, but does not reflect the deductionof any fees or expenses associated with investments in the index, and thus represents a “gross return”.
(3) The Russell 3000® Index reflects the broad U.S. equity universe and represents approximately 98% of the U.S. market.Russell 3000® Index return is adjusted upward to reflect reinvested dividends, but does not reflect the deduction of anyfees or expenses associated with investments in the index, and thus represents a “gross return”.
(4) S&P 500® Index return is adjusted upward to reflect reinvested dividends, but does not reflect the deduction of any feesor expenses associated with investment in the index, and thus represents a “gross return”.
(5) Commenced operations on September 21, 1999.
Comparison of the Change in Value of a Hypothetical $10,000 Investment from the Fund’s AdviserClass for the past 10 years through the Fiscal Year End of 6/30/18. The returns listed in thetable do not reflect the deduction of taxes on Fund distributions or the redemption of Fund shares.
Average Annual Total Returns______________________1 Year 5 Year 10 Year 15 Year Inception(5)_____ _____ _____ ______ __________
Olstein All Cap Value – Adviser Class(1) 6.66% 9.93% 8.95% 7.90% 7.81%
Russell 3000® Value Index(2) 7.25% 10.40% 8.60% 8.73% 7.04%Russell 3000® Index(3) 14.78% 13.29% 10.23% 9.61% 6.52%S&P 500® Index(4) 14.37% 13.42% 10.17% 9.30% 6.00%

13
O L S T E I N A L L C A P V A L U E F U N D
Olstein All Cap Value Fund Expense Example as of June 30, 2018
As a shareholder of the Fund, you incur two types of costs: (1) transactioncosts, including contingent deferred sales charges on redemptions, if any(Class C only); and (2) ongoing costs, including management fees, distribu-tion fees (12b-1) (Class C only), and other Fund expenses. This Example isintended to help you understand your ongoing costs (in dollars) of investingin the Fund and to compare these costs with the ongoing costs of investingin other mutual funds. The Example is based on an investment of $1,000invested at the beginning of the period and held for the entire period,January 1, 2018 – June 30, 2018.
Actual Expenses The following table provides information about actualaccount values and actual expenses. You will be assessed fees for outgoingwire transfers, returned checks and stop payment orders at prevailing ratescharged by U.S. Bancorp Fund Services, LLC, the Fund’s transfer agent. Ifyou request that a redemption be made by a wire transfer, currently a $15 feeis charged by the Fund’s transfer agent. IRA accounts will be charged a $15annual maintenance fee and a $25 distribution fee. The following exampleincludes, but is not limited to, management fees, distribution fees, fundaccounting, custody and transfer agent fees. However, the following exampledoes not include portfolio trading commissions and related expenses. Youmay use the information in this table, together with the amount you invest-ed, to estimate the expenses that you paid over the period. Simply divideyour account value by $1,000 (for example, an $8,600 account value dividedby $1,000 = 8.6), then multiply the result by the number in the table underthe heading entitled “Expenses Paid During Period’’ to estimate the expensesyou paid on your account during this period.
Hypothetical Example for Comparison Purposes The following table alsoprovides information about hypothetical account values and hypotheticalexpenses based on the Fund’s actual expense ratio and an assumed rate ofreturn of 5% per year before expenses, which is not the Fund’s actual return.The hypothetical account values and expenses may not be used to estimatethe actual ending account balance or expenses you paid for the period. Youmay use this information to compare the ongoing costs of investing in theFund and other funds. To do so, compare this 5% hypothetical example withthe 5% hypothetical examples that appear in the shareholder reports of theother funds.
Common Stocks Short-Term Investment-10%
0%
10%
20%
30%
40%
50%
60%
70%
80%
90%
100%
94.8% 5.2%
14
O L S T E I N A L L C A P V A L U E F U N D
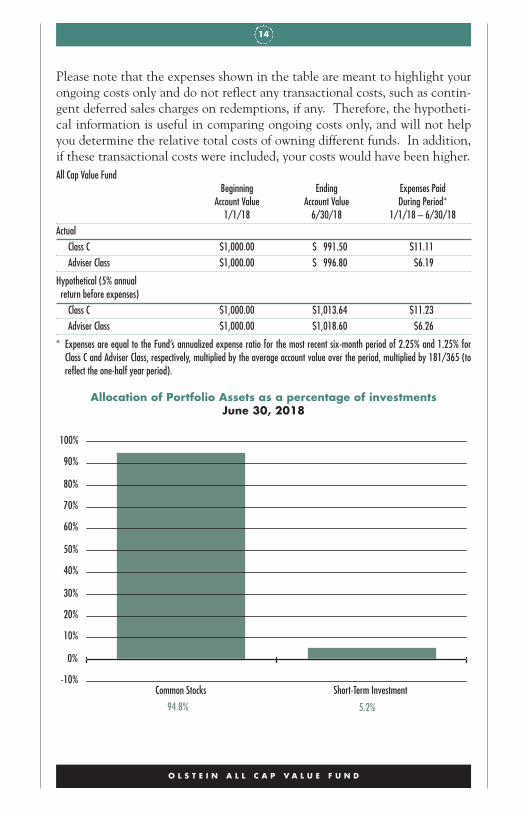
Please note that the expenses shown in the table are meant to highlight yourongoing costs only and do not reflect any transactional costs, such as contin-gent deferred sales charges on redemptions, if any. Therefore, the hypotheti-cal information is useful in comparing ongoing costs only, and will not helpyou determine the relative total costs of owning different funds. In addition,if these transactional costs were included, your costs would have been higher.All Cap Value Fund
Beginning Ending Expenses PaidAccount Value Account Value During Period*
1/1/18 6/30/18 1/1/18 – 6/30/18Actual
Class C $1,000.00 $ 991.50 $11.11Adviser Class $1,000.00 $ 996.80 $6.19
Hypothetical (5% annual return before expenses)Class C $1,000.00 $1,013.64 $11.23Adviser Class $1,000.00 $1,018.60 $6.26
* Expenses are equal to the Fund’s annualized expense ratio for the most recent six-month period of 2.25% and 1.25% forClass C and Adviser Class, respectively, multiplied by the average account value over the period, multiplied by 181/365 (toreflect the one-half year period).
Allocation of Portfolio Assets as a percentage of investmentsJune 30, 2018

15
The accompanying notes are an integral part of these financial statements.
O L S T E I N A L L C A P V A L U E F U N D
Olstein All Cap Value FundSchedule of Investments as of June 30, 2018
COMMON STOCKS – 95.3%ADVERTISING AGENCIES – 1.3% Shares Value
Omnicom Group Inc. 109,000 $8,313,430
AEROSPACE & DEFENSE – 1.0%
United Technologies Corporation 53,500 6,689,105
AIR DELIVERY & FREIGHT SERVICES – 2.0%
FedEx Corp. 29,000 6,584,740
United Parcel Service, Inc. – Class B 64,000 6,798,720
13,383,460
AIRLINES – 3.3%
Delta Air Lines, Inc. 178,000 8,818,120
JetBlue Airways Corporation (a) 325,900 6,185,582
Spirit Airlines, Inc. (a) 185,800 6,753,830
21,757,532
AUTO COMPONENTS – 2.9%
Aptiv Plc (b) 34,500 3,161,235
BorgWarner, Inc. 135,000 5,826,600
Delphi Technologies PLC (b) 74,000 3,364,040
The Goodyear Tire & Rubber Company 292,000 6,800,680
19,152,555
AUTO MANUFACTURERS – 1.0%
General Motors Company 162,000 6,382,800
BEVERAGES – 0.2%
PepsiCo, Inc. 9,300 1,012,491
CAPITAL MARKETS – 0.6%
The Goldman Sachs Group, Inc. 17,000 3,749,690
CHEMICALS – 1.8%
DowDuPont, Inc. 81,000 5,339,520
Eastman Chemical Company 66,000 6,597,360
11,936,880
COMMERCIAL BANKS – 6.2%
The Bank of New York Mellon Corporation 125,000 6,741,250

16
The accompanying notes are an integral part of these financial statements.
O L S T E I N A L L C A P V A L U E F U N D
COMMON STOCKS – 95.3% – continuedCOMMERCIAL BANKS – 6.2% – continued Shares Value
BB&T Corporation 64,000 $3,228,160
Citizens Financial Group Inc. 175,000 6,807,500
Fifth Third Bancorp 169,000 4,850,300
Prosperity Bancshares, Inc. 69,235 4,732,905
U.S. Bancorp 135,000 6,752,700
Wells Fargo & Company 138,000 7,650,720
40,763,535
COMMERCIAL SERVICES – 0.4%
Moody’s Corporation 15,000 2,558,400
COMMUNICATIONS EQUIPMENT – 2.3%
Cisco Systems, Inc. 228,000 9,810,840
CommScope Holding Company, Inc. (a) 194,000 5,665,770
15,476,610
COMPUTERS – 6.4%
Apple Inc. 101,000 18,696,110
Conduent Inc. (a) 446,700 8,116,539
International Business Machines Corporation (IBM) 54,000 7,543,800
Western Digital Corporation 107,000 8,282,870
42,639,319
CONSUMER FINANCE – 2.1%
American Express Company 54,000 5,292,000
MasterCard, Inc. – Class A 18,000 3,537,360
Visa Inc. – Class A 38,000 5,033,100
13,862,460
CONTAINERS & PACKAGING – 2.5%
Owens-Illinois, Inc. (a) 413,100 6,944,211
Sealed Air Corporation 84,000 3,565,800
WestRock Company 107,831 6,148,524
16,658,535
DIVERSIFIED FINANCIAL SERVICES – 3.8%
Franklin Resources, Inc. 203,000 6,506,150
Invesco Ltd. (b) 397,000 10,544,320
Legg Mason, Inc. 240,000 8,335,200
25,385,670

17
The accompanying notes are an integral part of these financial statements.
O L S T E I N A L L C A P V A L U E F U N D
COMMON STOCKS – 95.3% – continuedE-COMMERCE – 1.2% Shares Value
eBay Inc. (a) 225,000 $8,158,500
ELECTRICAL EQUIPMENT – 1.9%
Eaton Corporation PLC (b) 76,000 5,680,240
Generac Holdings Inc. (a) 135,000 6,983,550
12,663,790
ELECTRONICS – 1.7%
Keysight Technologies, Inc. (a) 111,000 6,552,330
Sensata Technologies Holding PLC (a)(b) 103,000 4,900,740
11,453,070
ENERGY – 1.0%
Chevron Corporation 26,500 3,350,395
Exxon Mobil Corporation 43,000 3,557,390
6,907,785
FOOD & DRUG RETAILERS – 3.8%
Casey’s General Stores, Inc. 33,000 3,467,640
CVS Health Corporation 164,000 10,553,400
Walgreens Boots Alliance, Inc. 180,000 10,802,700
24,823,740
FOOD PRODUCTS – 1.3%
Hormel Foods Corporation 94,000 3,497,740
The JM Smucker Company 48,000 5,159,040
8,656,780
HEALTH CARE EQUIPMENT & SUPPLIES – 6.4%
Baxter International Inc. 46,000 3,396,640
Becton, Dickinson and Company 37,000 8,863,720
Danaher Corporation 51,000 5,032,680
Hologic, Inc. (a) 128,000 5,088,000
Intuitive Surgical, Inc. (a) 3,400 1,626,832
Medtronic, PLC (b) 86,000 7,362,460
Zimmer Biomet Holdings, Inc. 96,000 10,698,240
42,068,572
HEALTH CARE PROVIDERS & SERVICES – 2.0%
Henry Schein, Inc. (a) 46,000 3,341,440
18
The accompanying notes are an integral part of these financial statements.
O L S T E I N A L L C A P V A L U E F U N D
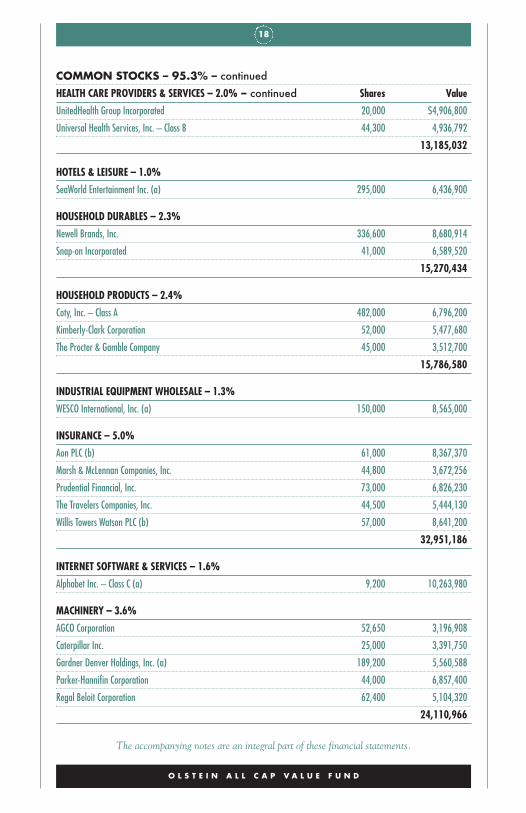
COMMON STOCKS – 95.3% – continuedHEALTH CARE PROVIDERS & SERVICES – 2.0% – continued Shares Value
UnitedHealth Group Incorporated 20,000 $4,906,800
Universal Health Services, Inc. – Class B 44,300 4,936,792
13,185,032
HOTELS & LEISURE – 1.0%
SeaWorld Entertainment Inc. (a) 295,000 6,436,900
HOUSEHOLD DURABLES – 2.3%
Newell Brands, Inc. 336,600 8,680,914
Snap-on Incorporated 41,000 6,589,520
15,270,434
HOUSEHOLD PRODUCTS – 2.4%
Coty, Inc. – Class A 482,000 6,796,200
Kimberly-Clark Corporation 52,000 5,477,680
The Procter & Gamble Company 45,000 3,512,700
15,786,580
INDUSTRIAL EQUIPMENT WHOLESALE – 1.3%
WESCO International, Inc. (a) 150,000 8,565,000
INSURANCE – 5.0%
Aon PLC (b) 61,000 8,367,370
Marsh & McLennan Companies, Inc. 44,800 3,672,256
Prudential Financial, Inc. 73,000 6,826,230
The Travelers Companies, Inc. 44,500 5,444,130
Willis Towers Watson PLC (b) 57,000 8,641,200
32,951,186
INTERNET SOFTWARE & SERVICES – 1.6%
Alphabet Inc. – Class C (a) 9,200 10,263,980
MACHINERY – 3.6%
AGCO Corporation 52,650 3,196,908
Caterpillar Inc. 25,000 3,391,750
Gardner Denver Holdings, Inc. (a) 189,200 5,560,588
Parker-Hannifin Corporation 44,000 6,857,400
Regal Beloit Corporation 62,400 5,104,320
24,110,966

19
The accompanying notes are an integral part of these financial statements.
O L S T E I N A L L C A P V A L U E F U N D
COMMON STOCKS – 95.3% – continuedMATERIALS – 0.7% Shares Value
Axalta Coating Systems Ltd. (a)(b) 156,600 $4,746,546
MEDIA – 6.2%
Comcast Corporation – Class A 274,000 8,989,940
Discovery Communications, Inc. – Class C (a) 481,987 12,290,668
Viacom Inc. – Class B 360,000 10,857,600
The Walt Disney Company 84,500 8,856,445
40,994,653
OFFICE ELECTRONICS – 1.1%
Zebra Technologies Corporation – Class A (a) 53,000 7,592,250
PHARMACEUTICALS – 0.7%
Thermo Fisher Scientific, Inc. 23,000 4,764,220
RESTAURANTS – 0.5%
Dunkin’ Brands Group Inc. 51,000 3,522,570
SEMICONDUCTORS & SEMICONDUCTOR EQUIPMENT – 3.9%
Intel Corporation 176,800 8,788,728
Kulicke and Soffa Industries, Inc. (a) 293,179 6,983,524
Lam Research Corporation 20,000 3,457,000
Texas Instruments Incorporated 58,000 6,394,500
25,623,752
SOFTWARE – 2.6%
Microsoft Corporation 66,300 6,537,843
Oracle Corporation 248,000 10,926,880
17,464,723
SPECIALTY RETAIL – 0.9%
Lowe’s Companies, Inc. 64,000 6,116,480
TELECOMMUNICATIONS – 0.8%
Corning Incorporated 185,000 5,089,350
TEXTILES, APPAREL & LUXURY GOODS – 1.7%
Skechers U.S.A., Inc. – Class A (a) 243,000 7,292,430
Tapestry, Inc. 79,000 3,690,090
10,982,520

20
COMMON STOCKS – 95.3% – continuedTRANSPORTATION EQUIPMENT – 0.8% Shares Value
The Greenbrier Companies, Inc. 96,000 $5,064,000
WASTE MANAGEMENT – 1.1%
Stericycle, Inc. (a) 116,000 7,573,640
TOTAL COMMON STOCKS (Cost $575,754,141) 630,559,491
SHORT-TERM INVESTMENT – 5.2%MONEY MARKET MUTUAL FUND – 5.2%
Morgan Stanley Institutional Liquidity Fund – Government Portfolio – Institutional Class, 1.81% (c) 34,551,776 34,551,776
TOTAL SHORT-TERM INVESTMENT (Cost $34,551,776) 34,551,776
TOTAL INVESTMENTS – 100.5%(Cost $610,305,917) 665,111,267
LIABILITIES IN EXCESS OF OTHER ASSETS – (0.5)% (3,354,767)
TOTAL NET ASSETS – 100.0% $661,756,500
(a) Non-income producing security.(b) U.S. Dollar-denominated foreign security.(c) The rate quoted is the annualized seven-day yield of the fund at period end.
The accompanying notes are an integral part of these financial statements.
O L S T E I N A L L C A P V A L U E F U N D

21
( T H I S P A G E I N T E N T I O N A L L Y L E F T B L A N K . )

22
The accompanying notes are an integral part of these financial statements.
O L S T E I N A L L C A P V A L U E F U N D
Olstein All Cap Value FundStatement of Assets and Liabilities as of June 30, 2018
Assets:
Investments, at value (at cost $610,305,917) $665,111,267
Receivable for securities sold 634,063
Receivable for capital shares sold 25,779
Dividends and interest receivable 725,705
Other assets 21,199
Total Assets $666,518,013
Liabilities:
Payable for securities purchased 2,683,653
Payable for capital shares redeemed 246,091
Payable to Investment Manager (See Note 5) 557,064
Distribution expense payable 950,610
Payable for transfer agent fees and expenses 86,706
Payable for professional fees 62,732
Payable for trustees’ fees and expenses 55,451
Accrued expenses and other liabilities 119,206
Total Liabilities 4,761,513
Net Assets $661,756,500
Net Assets Consist of:
Capital stock $563,359,073
Accumulated net realized gain on investments sold 43,592,077
Net unrealized appreciation on investments 54,805,350
Total Net Assets $661,756,500

23
The accompanying notes are an integral part of these financial statements.
O L S T E I N A L L C A P V A L U E F U N D
CLASS C:
Net assets $456,793,339
Shares of beneficial interest outstanding (unlimited number of shares authorized, $0.001 par value) 23,077,820
Net asset value, offering and redemption (may be subject to contingent deferred sales charge) price per share $19.79
ADVISER CLASS:
Net assets $204,963,161
Shares of beneficial interest outstanding (unlimited number of shares authorized, $0.001 par value) 8,318,886
Net asset value, offering and redemption price per share $24.64

24
The accompanying notes are an integral part of these financial statements.
O L S T E I N A L L C A P V A L U E F U N D
Olstein All Cap Value FundStatement of Operations
For the Year Ended June 30, 2018
Investment Income:
Dividend income $10,869,497
Interest income 495,752
Total investment income 11,365,249
Expenses:
Investment management fees (See Note 5) 6,874,267
Distribution expense – Class C (See Note 6) 4,824,845
Transfer agent fees and expenses 480,592
Administration fees 440,585
Professional fees 259,425
Trustees’ fees and expenses 196,398
Accounting costs 123,883
Federal and state registration 76,886
Custody fees 63,778
Report to shareholders 36,121
Other 64,158
Total expenses 13,440,938
Net investment loss (2,075,689)
Realized and Unrealized Gain (Loss) on Investments:
Realized gain on investments 60,931,170
Change in unrealized appreciation/depreciation on investments (18,685,681)
Net realized and unrealized gain on investments 42,245,489
Net Increase in Net Assets Resulting from Operations $40,169,800

25
The accompanying notes are an integral part of these financial statements.
O L S T E I N A L L C A P V A L U E F U N D
Olstein All Cap Value FundStatements of Changes in Net Assets
For the For theYear Ended Year Ended
June 30, 2018 June 30, 2017
Operations:
Net investment loss $(2,075,689) $(3,136,004)
Net realized gain on investments 60,931,170 43,385,965
Change in unrealized appreciation/depreciation on investments (18,685,681) 79,610,675
Net increase in net assets resulting from operations 40,169,800 119,860,636
Distributions to Class C shareholders from net realized gains (28,329,879) (1,085,704)
Distributions to Adviser Class shareholders from net realized gains (10,050,700) (329,711)
Total distributions to shareholders (38,380,579) (1,415,415)
Net decrease in net assets from Fund share transactions (See Note 7) (32,435,015) (56,480,184)
Total Increase (Decrease) in Net Assets (30,645,794) 61,965,037
Net Assets:
Beginning of period 692,402,294 630,437,257
End of period $661,756,500 $692,402,294
Accumulated net investment loss $— $(1,990,517)

26
The accompanying notes are an integral part of these financial statements.
O L S T E I N A L L C A P V A L U E F U N D
Olstein All Cap Value FundFinancial Highlights
Class C
For the For the For the For the For theYear Year Year Year Year
Ended Ended Ended Ended EndedJune 30, June 30, June 30, June 30, June 30,
2018 2017 2016 2015 2014
Net Asset Value – Beginning of Period $19.90 $16.70 $21.40 $19.82 $16.28
Investment Operations:
Net investment loss(1) (0.12) (0.14) (0.07) (0.16) (0.15)
Net realized and unrealized gain (loss) on investments 1.22 3.38 (1.74) 1.99 3.69
Total from investment operations 1.10 3.24 (1.81) 1.83 3.54
Distributions from net realized gain on investments (1.21) (0.04) (2.89) (0.25) —
Net Asset Value – End of Period $19.79 $19.90 $16.70 $21.40 $19.82
Total Return++ 5.57% 19.42% (8.83)% 9.24% 21.74%
Ratios (to average net assets)/Supplemental Data:
Expenses 2.25% 2.25% 2.25% 2.26% 2.27%
Net investment loss (0.60)% (0.74)% (0.40)% (0.78)% (0.84)%
Portfolio turnover rate(2) 53.79% 55.51% 51.13% 57.57% 51.49%
Net assets at end of period (000 omitted) $456,794 $493,526 $463,972 $618,561 $587,383
++ Total Returns do not reflect any deferred sales charge for Class C Shares.(1) Net investment loss per share represents net investment loss divided by the average shares outstanding throughout the
period.(2) Portfolio turnover is calculated on the basis of the Fund as a whole without distinguishing between the classes of shares
issued.
27
The accompanying notes are an integral part of these financial statements.
O L S T E I N A L L C A P V A L U E F U N D
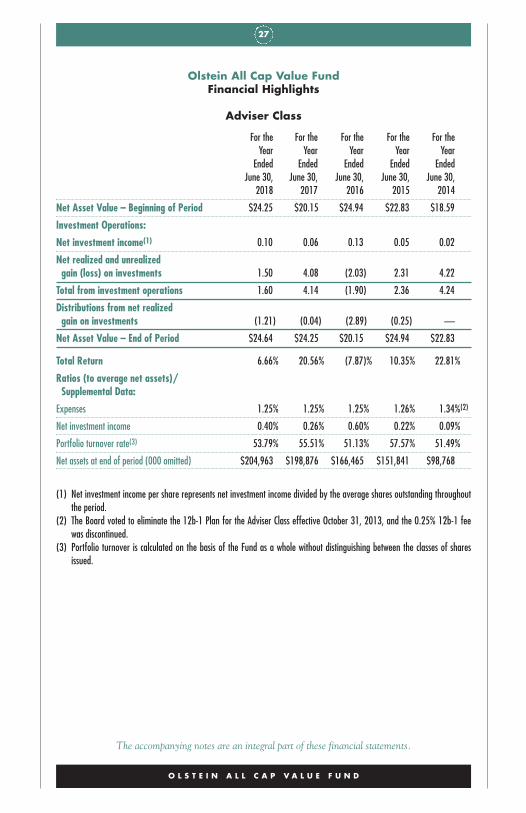
Olstein All Cap Value FundFinancial Highlights
Adviser Class
For the For the For the For the For theYear Year Year Year Year
Ended Ended Ended Ended EndedJune 30, June 30, June 30, June 30, June 30,
2018 2017 2016 2015 2014
Net Asset Value – Beginning of Period $24.25 $20.15 $24.94 $22.83 $18.59
Investment Operations:
Net investment income(1) 0.10 0.06 0.13 0.05 0.02
Net realized and unrealized gain (loss) on investments 1.50 4.08 (2.03) 2.31 4.22
Total from investment operations 1.60 4.14 (1.90) 2.36 4.24
Distributions from net realized gain on investments (1.21) (0.04) (2.89) (0.25) —
Net Asset Value – End of Period $24.64 $24.25 $20.15 $24.94 $22.83
Total Return 6.66% 20.56% (7.87)% 10.35% 22.81%
Ratios (to average net assets)/Supplemental Data:
Expenses 1.25% 1.25% 1.25% 1.26% 1.34%(2)
Net investment income 0.40% 0.26% 0.60% 0.22% 0.09%
Portfolio turnover rate(3) 53.79% 55.51% 51.13% 57.57% 51.49%
Net assets at end of period (000 omitted) $204,963 $198,876 $166,465 $151,841 $98,768
(1) Net investment income per share represents net investment income divided by the average shares outstanding throughoutthe period.
(2) The Board voted to eliminate the 12b-1 Plan for the Adviser Class effective October 31, 2013, and the 0.25% 12b-1 feewas discontinued.
(3) Portfolio turnover is calculated on the basis of the Fund as a whole without distinguishing between the classes of sharesissued.

28
( T H I S P A G E I N T E N T I O N A L L Y L E F T B L A N K . )

29
The accompanying notes are an integral part of these financial statements.
OL S T E I N S T RAT EG I C O P POR TUN I T I E S F UND
30 Letter to Shareholders
41 Expense Example
44 Schedule of Investments
48 Statement of Assets and Liabilities
50 Statement of Operations
51 Statements of Changes in Net Assets
52 Financial Highlights
O L S T E I N S T R A T E G I C O P P O R T U N I T I E S F U N D
29

30
OL S T E I N S T RAT EG I COP POR TUN I T I E S F UND
Letter to Shareholders
D E A R F E L L O W S H A R E H O L D E R S :
For the fiscal year ended June 30, 2018, Class A shares (load waived) of theOlstein Strategic Opportunities Fund appreciated 3.31%, Class C sharesappreciated 2.53% and Adviser Class shares appreciated 3.59%.1 During thesame twelve-month period the Russell 2500® Value Index appreciated11.49% while the Russell 2500® Index appreciated 16.24%.
M A R K E T O U T L O O K
Accelerated economic growth and increased corporate profits continued todrive equity market returns during the Fund’s fiscal year. While we believethat continued job growth, a mildly expansionary tax plan, improved busi-ness confidence and favorable consumer sentiment suggest further economicmomentum and earnings growth during the second half of 2018, we are alsokeeping a wary eye on the continued dominance of “growth” companies inU.S. equity markets.
While investor preference for “growth” stocks is especially pronouncedamong larger capitalization companies – the Russell 3000 Growth Index out-performed the Russell 3000 Value Index by 15.22% for the year-endedJune 30, 2018 – we saw the potential for a major shift in sentiment in theSMID capitalization range during the second quarter of 2018. During thesecond quarter of 2018, the Russell 2500 Value Index outperformed theRussell 2500 Growth Index by 0.27%. As equity markets continue to move
O L S T E I N S T R A T E G I C O P P O R T U N I T I E S F U N D
1 The performance data quoted represents past performance and does not guaranteefuture results. The Olstein Strategic Opportunities Fund Class A return as of6/30/18 for the one-year, five-year, and ten year periods, assuming deduction ofthe maximum Class A sales charge of 5.50%, was -2.35%, 6.81% and 9.88%,respectively. Per the Fund’s 10/31/17 prospectus, the gross expense ratio for theClass A share was 1.62%, and the net expense ratio was 1.61% after contractu-al expense waiver and/or reimbursement. The contractual expense waiver shallremain in effect until at least October 28, 2018. Expense ratios for other shareclasses will vary. Performance for other share classes will vary due to differencesin sales charge structure and class expenses. The investment return and principalvalue of an investment will fluctuate so that an investor’s shares, when redeemed,may be worth more or less than their original cost. Current performance may belower or higher than performance quoted. To obtain performance data current tothe most recent month end, please visit our website at www.olsteinfunds.com.

31
deeper into the “growth dominates” phase, we expect more investors to rec-ognize that “value” stocks, especially those of small- to mid-sized companies,can offer excellent appreciation potential and favorable long-termrisk/reward trade-offs.
During the second half of 2018, we expect continued economic growth,increased consumer consumption driven by stable job growth and wagegains, combined with production/manufacturing growth to improve theprospects for many of the small- to mid-sized companies in our portfolio.Remaining true to our investment discipline, we intend to seize on marketdips as buying opportunities by either strategically adding to existing posi-tions in the portfolio or initiating positions in companies that can be pur-chased at a significant discount to our calculation of their intrinsic values.As such, we maintain an optimistic outlook for our value-oriented approachto investing for the second half of 2018.
O U R S T R A T E G Y
Despite shifts in investor sentiment that tend to chase after fads, trends ormomentum, we continue to focus on company-specific factors and funda-mentals. In today’s market, a company’s ability to generate sustainable futurefree cash flow and securities prices that allow us to buy good companies atwhat we believe are very advantageous prices, guide our pursuit of value. Webelieve it is important to weather market conditions, specific events andshifts in investor-driven momentum by favoring the equities of financiallystrong companies with stable or growing free cash flow that are run by man-agements that have a demonstrated history of deploying cash to the benefitof shareholders.
The Fund’s current portfolio consists of companies that we believe have asustainable competitive advantage, discernible balance sheet strength, amanagement team that emphasizes decisions based on cost of capital calcula-tions and deploys free cash flow to create shareholder value. We remainfocused on individual companies, their operations and prospects for main-taining or growing sustainable free cash flow since, from our perspective aslong-term value investors, we recognize that such companies are well posi-tioned to compete more profitably as economic growth improves.
P O R T F O L I O R E V I E W
At June 30, 2018, the Olstein Strategic Opportunities Fund portfolio con-sisted of 42 holdings with an average weighted market capitalization of$5.54 billion. During the fiscal year, the Fund initiated positions in fourteencompanies and strategically added to positions in five companies. Over thesame time period, the Fund eliminated its holdings in twenty-one companiesand strategically decreased its holdings in another eight companies.
O L S T E I N S T R A T E G I C O P P O R T U N I T I E S F U N D

32
Positions initiated during the last twelve months include: Casey’s GeneralStore, Central Garden & Pet Company, CommScope Holding Company,Denny’s Corp., Discovery Communications, Dunkin Brands Group,Goodyear Tire & Rubber Company, Hain Celestial Group, HomeBancShares Inc., Kulicke & Soffa Industries, Mattel Inc., Newell Brands,Snyder’s-Lance Inc., and Spartan Motors Inc.
Positions eliminated during the past twelve months include: Astronics Corp,Bed Bath & Beyond, Big Lots, CECO Environmental, Charles RiverLaboratories, Convergys Corporation, FTD Companies, Harmonic Inc., Hill-Rom Holdings, IPG Photonics Corporation, Mattel Inc., Patterson Companies,Inc., Potbelly Corporation, Scripps Networks Interactive, ServiceMaster GlobalHoldings Inc., Snyder’s-Lance Inc., Sykes Enterprises, Vishay IntertechnologyInc., VWR Corp., Winnebago Industries, and Xperi Corporation.
During the twelve-month reporting period the Fund both initiated and liquidat-ed positions in Mattel Inc. and Snyder’s-Lance Inc. The Fund initiated a posi-tion in Mattel Inc. in August 2017 and steadily built its holdings over the nextsix weeks. By the end of October, however, the Fund liquidated its positionwhen we determined that the company’s turnaround strategy would take longerthan our original thesis anticipated and that the company’s woes were amplifiedby the bankruptcy of Toys-R-Us, one of its largest distribution partners.
The Fund began buying the stock of Snyder’s-Lance, a snack company, onAugust 16, 2017, and built a position in the portfolio over the next threemonths at an average cost of $36.48 per share. On December 18, 2017, theCampbell Soup Company announced that it would acquire Snyder’s-Lancefor $50 per share in an all-cash transaction. Following the acquisitionannouncement, the Fund exited its position in Snyder’s-Lance at an averagesale price of $49.18 per share (very close to the announced acquisitionprice), representing a 35% increase over its average cost during a very short,four-month holding period.
In addition to Snyder’s-Lance, two additional holdings were sold followingacquisition announcements. Prior to the start of the Fund’s fiscal year, onMay 5, 2017, VWR, a provider of product, supply chain, and service solu-tions to laboratories, announced that it was to be acquired by Avantor, aglobal supplier of ultra-high-purity materials for the life sciences andadvanced technology markets, for $33.25 per share. The Fund liquidated itsholdings in VWR by the end of November 2017, at an average sale price of$33.17, which represented a 23% increase over the Fund’s average cost toacquire the stock. On July 31, 2017, Discovery Communications announcedthat it would acquire Scripps Networks Interactive in a cash and stock trans-action valued at $90 per share. The Fund initiated its position in ScrippsNetworks Interactive on May 9, 2017 and built a position over the next sixweeks at an average cost of approximately $68.35 per share. Following the
O L S T E I N S T R A T E G I C O P P O R T U N I T I E S F U N D

33
acquisition announcement, the Fund exited its position in Scripps with anaverage sale price of $86.29, which represented a 26.24% increase over itsaverage cost during the unusually short, three-month holding period.
Our Leaders
Leading performers for the twelve-month reporting period ended June 30,2018, include: Dine Brands Global, Discovery Communications Inc., KeysightTechnologies, Winnebago Industries, and Zebra Technologies Corp. At theclose of the fiscal year, the Fund continued to maintain positions in DineBrands Global, Discovery Inc., Keysight Technologies, and Zebra TechnologiesCorp. The Fund sold its position in Winnebago Industries as it reached ourvaluation in a relatively short period of time. The Fund built a position inWinnebago in June 2017 at an average price of $29.13 per share. As the com-pany’s stock reached our valuation level, the Fund liquidated its position byDecember 4, 2017, with an average sale price of approximately $49.25 pershare. Over a short holding period of a little more than five months, theFund’s holding in Winnebago Industries appreciated approximately 67%.
Our Laggards
Laggards during the twelve-month reporting period included: PattersonCompanies, FTD Companies, Inc., Xperi Corporation, Owens-Illinois, andLifetime Brands. At the close of the fiscal year, the Fund maintained posi-tions in Owens-Illinois and Lifetime Brands. During the fiscal year the Fundliquidated its positions in Patterson Companies, FTD Companies and, XPeriCorporation. The Fund liquidated its position in Patterson Companies dueto poor execution of their turnaround/restructuring strategy and ongoingchallenges within the market for consumable dental products and supplies.Similarly, the Fund liquidated its holdings in the FTD Companies due togrowing concerns about the effectiveness of the company’s turnaround strate-gy and its ability to achieve our expectation for free cash flow during ourexpected holding period.
R E V I E W O F S T R A T E G I C O P P O R T U N I T I E S
In previous letters to shareholders, we included a discussion of the Fund’sactivist investments under the heading, “Review of Activist Holdings.” Asthe Fund passed its tenth anniversary (November 1, 2016), we decided tobroaden our discussion of specific holdings to include a review of selectedstrategic situations, in addition to the Fund’s activist holdings, that we believemerit attention. As a reminder, we categorize activist investments as situa-tions where we have identified companies that face unique strategic choices,challenges or problems and where Olstein Capital Management or an outsideinvestor, usually a hedge fund or private equity investor, seeks to influence
O L S T E I N S T R A T E G I C O P P O R T U N I T I E S F U N D

34
company management to adopt strategic alternatives that we expect to unlockgreater shareholder value. Our broader definition of strategic opportunities, inaddition to activist investments, also includes situations where companieshave adopted specific strategic plans, undergone significant managementchanges, announced corporate actions that we expect to significantly improvelong-term business value or returned free cash flow to investors throughincreased dividends, share buybacks or substantial debt paydowns.
As of June 30, 2018, the Fund was invested in thirty-seven strategic situations,which represented approximately 90% of the Fund’s equity investments andeight of its top ten holdings. Strategic holdings as of June 30, 2018, includedthe Fund’s twelve activist holdings: Axalta Coating Systems, Blue Bird Corp.,Casey’s General Stores, CommScope Holding Company, Conduent Inc., HainCelestial Group, Lifetime Brands, Newell Brands Inc., Owens-Illinois, PrestigeBrands, SeaWorld Entertainment, and Sensata Technologies.
Twenty-thee portfolio companies (including four of the activist holdingsmentioned above) announced actions over the past fiscal year that returnfree cash flow to investors through share repurchase programs, increased divi-dend payments and/or substantial debt paydowns. We believe the number ofcompanies returning free cash flow to shareholders was much higher thanusual over the past fiscal year due to the Tax Cuts and Job Act of 2017,which lowered the corporate tax rate from 35% to 21%. By way of compari-son, for the fiscal year ended June 30, 2017, ten portfolio companiesannounced actions that returned free cash flow to investors through sharerepurchases and increased dividend payments.
Twenty companies announced substantial share repurchase programs duringthe fiscal year, including: Blue Bird Corp., Casey’s General Stores, CitizensFinancial Group, CommScope Holding Company, Denny’s Corp., DunkinBrands Group, Federal Signal Corp., Goodyear Tire & Rubber Company,Greenbrier Companies, Helen of Troy Ltd., Keysight Technologies, Kulicke& Soffa Industries, Owens-Illinois, Prosperity Bancshares Inc., Regal-BeloitCorp., Sensata Technologies, Skechers USA, Spirit Airlines, WabashNational Corp., and Wesco International. Nine portfolio companiesannounced significant increases to dividend payments during the fiscal yearincluding, Dunkin Brands Group, Federal Signal Corp., Goodyear Tire &Rubber, Greenbrier Companies, Legg Mason, Prosperity Bancshares, Regal-Beloit Corp., Wabash National Corp., and WestRock Company. One com-pany, Kulicke & Soffa Industries, initiated a quarterly dividend program inJune 2018. Three companies announced favorable debt arrangements:Owens-Illinois and Regal-Beloit Corp announced significant debt paydownprograms, while Zebra Technologies completed a comprehensive debtrestructuring that it expects to significantly reduce annual interest payments.
O L S T E I N S T R A T E G I C O P P O R T U N I T I E S F U N D

35
O L S T E I N S T R A T E G I C O P P O R T U N I T I E S F U N D
Fourteen companies in the portfolio have announced senior leadershipchanges, usually at the Chief Executive Officer, Chief Financial Officer and/orChief Marketing & Strategy Officer positions that signal to us the pursuit ofspecific, favorable growth opportunities and/or a focused commitment toenhancing production capabilities while lowering production costs to achieveor maintain higher operating margins. These companies include: Casey’sGeneral Stores, Central Garden and Pet Co., CommScope Holding, DineBrands Global, Dunkin Brands, Federal Signal Corp., Greenbrier Companies,Kulicke & Soffa Industries, Regal-Beloit Corp., SeaWorld Entertainment,Skechers USA, Spartan Motors, Stericycle Inc., and Wabash National Corp.
A Note on the Restructuring of The Olstein Funds
By the time you read this letter you will have received a Proxy Statement andNotice of Special Joint Meeting of Shareholders scheduled for September 12,2018. The meeting is for shareholders of the Olstein All Cap Value Fund andthe Olstein Strategic Opportunities Fund to vote on a proposal to reorganizeour two mutual funds, on a tax-free basis, into a lower-cost investment com-pany operating structure with no change in management or investmentobjectives. Shareholders of each Olstein fund have been asked to vote on aproposal to reorganize their fund into a corresponding newly created Olsteinmutual fund within Managed Portfolio Series, a registered investment compa-ny operated by the Olstein Funds’ current service provider, U.S. BancorpFund Services, LLC. Each new Olstein fund within Managed Portfolio Serieshas been created specifically to continue the operation of the correspondingOlstein Fund without interruption, has the same fund name and share classticker symbols, retains Olstein Capital Management as investment manager,is managed according to the same investment objective and investment phi-losophy, and will carry forward the fund’s financial and performance history.The proposed administrative change provides continuity of service and sup-port for the funds and shareholders while providing cost savings and efficien-cies associated with being part of a larger investment company.
The Olstein Funds Board of Trustees believes that the proposed reorganiza-tion of each Olstein fund into the corresponding acquiring fund is in the bestinterests of shareholders and, for the reasons described in the ProxyStatement/Prospectus previously sent to you, recommends that you vote“FOR” the proposed reorganization. Regardless of your account size, we needyour vote! To avoid delay and additional expense, and to assure that yourshares are represented, please vote as promptly as possible, either by Internetthrough the website listed in the proxy voting instructions; by Telephoneusing the toll-free number listed in the proxy voting instructions; or by Mailwith the proxy card(s) sent to you. We expect the new funds will begin oper-ations on or around September 14, 2018, following a favorable vote at theupcoming Shareholder Meeting on September 12, 2018.

36
F I N A L T H O U G H T S
We believe that instead of making investment decisions based on momen-tum or current market sentiment, investors should focus on opportunities formeaningful capital appreciation presented by individual companies. Webelieve that analysis of specific companies, their potential, prospects andvalue and not overall market sentiment should guide investors’ actions. Wecontinue to focus on understanding a business, its potential to generate sus-tainable free cash flow and ultimately its value. After identifying companiesthat meet well-defined investment criteria, we then take advantage of mar-ket conditions and downward price movements to buy such companies atwhat we believe to be advantageous prices that increase the chance for a suc-cessful investment outcome.
We value your trust and remind you that our money is invested alongsideyours as we work hard to accomplish the Fund’s objective of long-term capi-tal appreciation. We look forward to writing to you again at the close of theyear.
Sincerely,
Eric Heyman Robert A. OlsteinCo-Portfolio Manager Chairman and Chief Investment Officer
The above represents the opinion of the Manager, and is not intended to be aforecast of future events, a guarantee of future results, or investment advice. Thereferences to securities are not buy or sell recommendations, but are intended to bedescriptive examples of the Fund’s investment philosophy and are subject to change.Do not make investments based on the securities referenced. A full schedule ofFund holdings as of 6/30/18 is contained in this report, and is subject to change.This information should be preceded or accompanied by a current prospectus,which contains more complete information, including investment objectives, risks,charges and expenses of the Olstein Funds and should be read carefully beforeinvesting. A current prospectus may be obtained by calling (800) 799-2113 orvisiting the Olstein Funds’ website at www.olsteinfunds.com.
The Olstein Funds follow a value-oriented investment approach. However, aparticular value stock may not increase in price as the Investment Manageranticipates and may actually decline in price if other investors fail to recognize thestock’s value or if a catalyst that the Investment Manager believes will increase theprice of the stock does not occur or does not affect the price of the stock in themanner or to the degree that the Investment Manager anticipated. Also, the
O L S T E I N S T R A T E G I C O P P O R T U N I T I E S F U N D

37
Investment Manager’s calculation of a stock’s private market value involvesestimates of future cash flow which may prove to be incorrect and, therefore, couldresult in sales of the stock at prices lower than the Fund’s original purchase price.The investment return and principal value of an investment will fluctuate so thatan investor’s shares, when redeemed, may be worth more or less than their originalcost. There is no assurance that the Fund will achieve its investment objective.
An investment in a portfolio containing small- and mid-cap companies is subject toadditional risks, as the share prices of small- and mid-cap companies are often morevolatile than those of larger companies due to several factors, including limitedtrading volumes, products, financial resources, management inexperience and lesspublicly available information. The activist strategy invests in stocks ofunderperforming companies and any shareholder activism might not result in achange in performance or corporate governance. These stocks could also experienceless liquidity and higher share price and trading volume volatility than stocks ofother companies.
The Russell 2500 Index® measures the performance of the small to mid-capsegment of the U.S. equity universe, commonly referred to as “SMID” cap. TheRussell 2500 Index® is a subset of the Russell 3000 Index®. It includesapproximately 2,500 of the smallest securities based on a combination of theirmarket cap and current index membership. The Russell 2500 Value Index®
measures the performance of the small to mid-cap value segment of the U.S. equityuniverse. It includes those Russell 2500® companies that are considered more valueoriented relative to the overall market as defined by Russell’s leading stylemethodology. The Russell 2500 Value Index® is constructed to provide acomprehensive and unbiased barometer of the small to mid-cap value market. TheRussell 3000 Index® is an unmanaged index that seeks to represent the broad U.S.equity universe accounting for approximately 98% of the U.S. marketcapitalization. The Russell 3000 Value Index® measures the performance of thebroad value segment of U.S. equity value universe. It includes those Russell 3000®
companies with lower price-to-book ratios and lower forecasted growth values. TheRussell 3000 Value Index® is constructed to provide a comprehensive and unbiasedbarometer of the broad value market. While not Fund benchmarks, the Russell3000 Index® and Russell 3000 Value Index® are broad market indices that areconsidered to represent the U.S. stock market performance in general. Pastperformance does not guarantee future results. Index returns do not reflectpayment of any expenses, fees or sales charges an investor would pay to purchasethe securities the Index represents. Such costs would lower performance. Aninvestor cannot invest directly in an index.
Not FDIC-insured / Not bank-guaranteed / May lose value.
Distributed by Olstein Capital Management, L.P. Member FINRA.
O L S T E I N S T R A T E G I C O P P O R T U N I T I E S F U N D

38
O L S T E I N S T R A T E G I C O P P O R T U N I T I E S F U N D
$5,000
$10,000
$15,000
$20,000
$25,000
$30,000
$35,000
Olstein Strategic Opportunities Fund – Class A (without load)
Olstein Strategic Opportunities Fund – Class A (load adjusted)
Russell 2500® Value Index
Russell 2500® Index
S&P 500® Index
6/30
/17
6/30
/08
$27,731
6/30
/10
6/30
/09
6/30
/11
6/30
/12
6/30
/13
6/30
/14
6/30
/15
6/30
/16
$27,128
$26,175$26,340
$25,649
6/30
/18
(1) Assumes reinvestment of dividends and capital gains. Reflects the effect of the maximum sale load charge of 5.50% inload adjusted return. Past performance is not necessarily indicative of future results. Investment returns and principalvalues may fluctuate, so that, when redeemed, shares may be worth more or less than their original cost.
(2) Russell 2500® Value Index return is adjusted upward to reflect reinvested dividends, but does not reflect the deductionof any fees or expenses associated with investments in the index, and thus represents a “gross return”.
(3) The Russell 2500® Index measures the performance of the 2,500 smallest companies in the Russell 3000® Index.Russell 2500® Index return is adjusted upward to reflect reinvested dividends, but does not reflect the deduction of anyfees or expenses associated with investments in the index, and thus represents a “gross return”.
(4) S&P 500® Index return is adjusted upward to reflect reinvested dividends, but does not reflect the deduction of any feesor expenses associated with investment in the index, and thus represents a “gross return”.
(5) Commenced operations on November 1, 2006.
Average Annual Total Returns______________________1 Year 5 Year 10 Year Inception(5)_____ _____ ______ _________
Olstein Strategic Opportunities – Class A (without Load)(1) 3.31% 8.02% 10.49% 7.28%
Olstein Strategic Opportunities – Class A (Load Adjusted)(1) -2.35% 6.81% 9.88% 6.77%
Russell 2500® Value Index(2) 11.49% 10.78% 10.10% 7.59%Russell 2500® Index(3) 16.24% 12.29% 10.74% 8.95%S&P 500® Index(4) 14.37% 13.42% 10.17% 8.35%
Comparison of the Change in Value of a Hypothetical $10,000 Investment from the Fund’s ClassA for the past 10 years through the Fiscal Year End of 6/30/18. The returns listed in the tabledo not reflect the deduction of taxes on Fund distributions or the redemption of Fund shares.

39
O L S T E I N S T R A T E G I C O P P O R T U N I T I E S F U N D
$5,000
$10,000
$15,000
$20,000
$25,000
$30,000
$35,000
Olstein Strategic Opportunities Fund – Class C
Russell 2500® Value Index
Russell 2500® Index
S&P 500® Index
6/30
/17
6/30
/08
6/30
/10
6/30
/09
6/30
/11
6/30
/12
6/30
/13
6/30
/14
6/30
/15
$27,731
6/30
/16
$26,340$26,175$25,164
6/30
/18
(1) Assumes reinvestment of dividends and capital gains. Also includes all expenses at the end of each period and assumesthe deduction of the appropriate CDSC as if an investor had redeemed at the end of the one year period, and thus repre-sents a “net return.” The CDSC is based on the lesser of the original purchase price or the value of such shares at thetime of redemption. Past performance is not necessarily indicative of future results. Investment returns and principalvalues may fluctuate, so that, when redeemed, shares may be worth more or less than their original cost.
(2) Russell 2500® Value Index return is adjusted upward to reflect reinvested dividends, but does not reflect the deductionof any fees or expenses associated with investments in the index, and thus represents a “gross return”.
(3) The Russell 2500® Index measures the performance of the 2,500 smallest companies in the Russell 3000® Index.Russell 2500® Index return is adjusted upward to reflect reinvested dividends, but does not reflect the deduction of anyfees or expenses associated with investments in the index, and thus represents a “gross return”.
(4) S&P 500® Index return is adjusted upward to reflect reinvested dividends, but does not reflect the deduction of any feesor expenses associated with investment in the index, and thus represents a “gross return”.
(5) Commenced operations on November 1, 2006.
Comparison of the Change in Value of a Hypothetical $10,000 Investment from the Fund’s ClassC for the past 10 years through the Fiscal Year End of 6/30/18. The line chart does not reflectany applicable Contingent Deferred Sales Charge. The returns listed in the table do not reflectthe deduction of taxes on Fund distributions or the redemption of Fund shares.
Average Annual Total Returns______________________1 Year 5 Year 10 Year Inception(5)_____ _____ ______ _________
Olstein Strategic Opportunities – Class C(1) 1.53% 7.21% 9.67% 6.51%
Russell 2500® Value Index(2) 11.49% 10.78% 10.10% 7.59%Russell 2500® Index(3) 16.24% 12.29% 10.74% 8.95%S&P 500® Index(4) 14.37% 13.42% 10.17% 8.35%

40
O L S T E I N S T R A T E G I C O P P O R T U N I T I E S F U N D
$6,000
$8,000
$10,000
$12,000
$14,000
$16,000
$18,000
$20,000
Olstein Strategic Opportunities Fund – Adviser Class
Russell 2500® Value Index
Russell 2500® Index
S&P 500® Index
$13,784
6/30
/15
5/11
/15
$13,134
$10,501
$13,437
6/30
/17
6/30
/16
6/30
/18
(1) Assumes reinvestment of dividends and capital gains. Also includes all expenses at the end of each period and thus rep-resents a “net return.” Past performance is not necessarily indicative of future results. Investment returns and principalvalues may fluctuate, so that, when redeemed, shares may be worth more or less than their original cost.
(2) Russell 2500® Value Index return is adjusted upward to reflect reinvested dividends, but does not reflect the deductionof any fees or expenses associated with investments in the index, and thus represents a “gross return”.
(3) The Russell 2500® Index measures the performance of the 2,500 smallest companies in the Russell 3000® Index, whichrepresents approximately 20% of the total market capitalization of the Russell 3000® Index. Russell 2500® Indexreturn is adjusted upward to reflect reinvested dividends, but does not reflect the deduction of any fees or expenses asso-ciated with investments in the index, and thus represents a “gross return”.
(4) S&P 500® Index return is adjusted upward to reflect reinvested dividends, but does not reflect the deduction of any feesor expenses associated with investment in the index, and thus represents a “gross return”.
(5) Commenced operations on May 11, 2015.
Comparison of the Change in Value of a Hypothetical $10,000 Investment from the Fund’sAdviser Class Inception through the Fiscal Year End of 6/30/18. The returns listed in the tabledo not reflect the deduction of taxes on reinvested dividends.
Average Annual Total Returns______________________1 Year Inception(5)_____ _________
Olstein Strategic Opportunities – Adviser Class(1) 3.59% 1.57%Russell 2500® Value Index(2) 11.49% 9.08%Russell 2500® Index(3) 16.24% 9.87%S&P 500® Index(4) 14.37% 10.77%
41
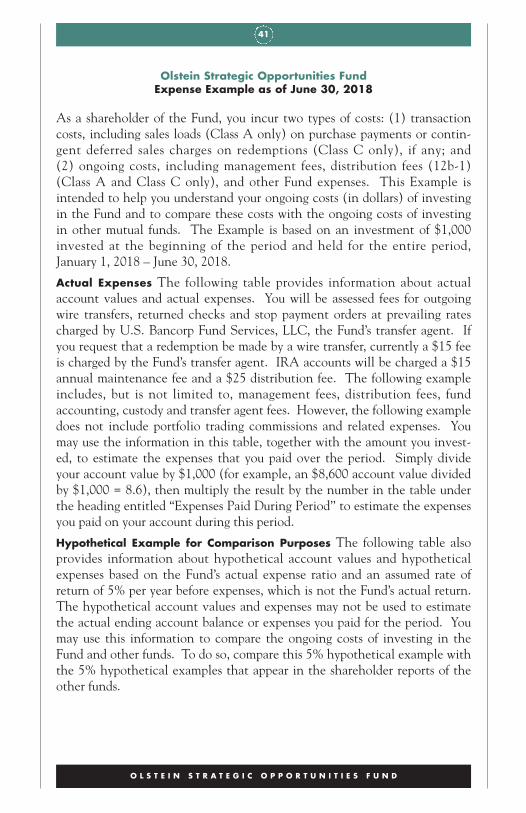
Olstein Strategic Opportunities FundExpense Example as of June 30, 2018
As a shareholder of the Fund, you incur two types of costs: (1) transactioncosts, including sales loads (Class A only) on purchase payments or contin-gent deferred sales charges on redemptions (Class C only), if any; and (2) ongoing costs, including management fees, distribution fees (12b-1)(Class A and Class C only), and other Fund expenses. This Example isintended to help you understand your ongoing costs (in dollars) of investingin the Fund and to compare these costs with the ongoing costs of investingin other mutual funds. The Example is based on an investment of $1,000invested at the beginning of the period and held for the entire period,January 1, 2018 – June 30, 2018.
Actual Expenses The following table provides information about actualaccount values and actual expenses. You will be assessed fees for outgoingwire transfers, returned checks and stop payment orders at prevailing ratescharged by U.S. Bancorp Fund Services, LLC, the Fund’s transfer agent. Ifyou request that a redemption be made by a wire transfer, currently a $15 feeis charged by the Fund’s transfer agent. IRA accounts will be charged a $15annual maintenance fee and a $25 distribution fee. The following exampleincludes, but is not limited to, management fees, distribution fees, fundaccounting, custody and transfer agent fees. However, the following exampledoes not include portfolio trading commissions and related expenses. Youmay use the information in this table, together with the amount you invest-ed, to estimate the expenses that you paid over the period. Simply divideyour account value by $1,000 (for example, an $8,600 account value dividedby $1,000 = 8.6), then multiply the result by the number in the table underthe heading entitled “Expenses Paid During Period’’ to estimate the expensesyou paid on your account during this period.
Hypothetical Example for Comparison Purposes The following table alsoprovides information about hypothetical account values and hypotheticalexpenses based on the Fund’s actual expense ratio and an assumed rate ofreturn of 5% per year before expenses, which is not the Fund’s actual return.The hypothetical account values and expenses may not be used to estimatethe actual ending account balance or expenses you paid for the period. Youmay use this information to compare the ongoing costs of investing in theFund and other funds. To do so, compare this 5% hypothetical example withthe 5% hypothetical examples that appear in the shareholder reports of theother funds.
O L S T E I N S T R A T E G I C O P P O R T U N I T I E S F U N D

42
O L S T E I N S T R A T E G I C O P P O R T U N I T I E S F U N D
Please note that the expenses shown in the table are meant to highlight yourongoing costs only and do not reflect any transactional costs, such as salescharges (loads) on purchase payments or contingent deferred sales chargeson redemptions, if any. Therefore, the hypothetical information is useful incomparing ongoing costs only, and will not help you determine the relativetotal costs of owning different funds. In addition, if these transactional costswere included, your costs would have been higher.Strategic Opportunities Fund
Beginning Ending Expenses PaidAccount Value Account Value During Period*
1/1/18 6/30/18 1/1/18 – 6/30/18Actual
Class A $1,000.00 $ 998.90 $7.93Class C $1,000.00 $ 995.00 $11.62Adviser Class $1,000.00 $1,000.00 $6.69
Hypothetical (5% annual return before expenses)Class A $1,000.00 $1,016.86 $8.00Class C $1,000.00 $1,013.14 $11.73Adviser Class $1,000.00 $1,018.10 $6.76
* Expenses are equal to the Fund’s annualized expense ratio for the most recent six-month period of 1.60%, 2.35% and1.35% for Class A, Class C and Adviser Class, respectively, multiplied by the average account value over the period, multi-plied by 181/365.

43
Allocation of Portfolio Assets as a percentage of investmentsJune 30, 2018
O L S T E I N S T R A T E G I C O P P O R T U N I T I E S F U N D
Common Stocks Short-Term Investment-10%
0%
10%
20%
30%
40%
50%
60%
70%
80%
90%
100%
97.0% 3.0%

44
The accompanying notes are an integral part of these financial statements.
O L S T E I N S T R A T E G I C O P P O R T U N I T I E S F U N D
Olstein Strategic Opportunities FundSchedule of Investments as of June 30, 2018
COMMON STOCKS – 96.4%AIRLINES – 3.5% Shares Value
Spirit Airlines, Inc. (a) 116,800 $4,245,680
AUTO COMPONENTS – 5.3%
The Goodyear Tire & Rubber Company 92,000 2,142,680
Miller Industries, Inc. 66,941 1,710,343
Spartan Motors, Inc. 173,000 2,612,300
6,465,323
AUTO MANUFACTURERS – 1.2%
Blue Bird Corp. (a) 66,300 1,481,805
COMMERCIAL BANKS – 6.6%
Citizens Financial Group Inc. 77,750 3,024,475
Home BancShares Inc. 59,300 1,337,808
Prosperity Bancshares, Inc. 52,915 3,617,269
7,979,552
COMMUNICATIONS EQUIPMENT – 1.7%
CommScope Holding Company, Inc. (a) 70,700 2,064,793
COMPUTERS – 3.3%
Conduent Inc. (a) 220,300 4,002,851
CONTAINERS & PACKAGING – 5.5%
Owens-Illinois, Inc. (a) 263,400 4,427,754
WestRock Company 39,550 2,255,141
6,682,895
DIVERSIFIED FINANCIAL SERVICES – 5.5%
Janus Henderson Group PLC (b) 77,000 2,366,210
Legg Mason, Inc. 123,500 4,289,155
6,655,365
ELECTRONICS – 4.2%
Keysight Technologies, Inc. (a) 52,000 3,069,560
Sensata Technologies Holding PLC (a)(b) 43,841 2,085,955
5,155,515

45
The accompanying notes are an integral part of these financial statements.
O L S T E I N S T R A T E G I C O P P O R T U N I T I E S F U N D
COMMON STOCKS – 96.4% – continuedFOOD & STAPLES RETAILING – 1.5% Shares Value
Casey’s General Stores, Inc. 17,800 $1,870,424
FOOD PRODUCTS – 2.1%
The Hain Celestial Group, Inc. (a) 85,000 2,533,000
HEALTH CARE EQUIPMENT & SUPPLIES – 4.9%
Natus Medical Incorporated (a) 34,000 1,173,000
Zimmer Biomet Holdings, Inc. 43,000 4,791,920
5,964,920
HOTELS & LEISURE – 3.4%
SeaWorld Entertainment Inc. (a) 192,000 4,189,440
HOUSEHOLD DURABLES – 8.5%
Central Garden & Pet Company – Class A (a) 53,900 2,181,333
Helen of Troy Ltd. (a)(b) 25,580 2,518,351
Lifetime Brands, Inc. 193,000 2,441,450
Newell Brands, Inc. 122,400 3,156,696
10,297,830
INDUSTRIAL EQUIPMENT WHOLESALE – 4.8%
Park-Ohio Holdings Corp. 38,000 1,417,400
WESCO International, Inc. (a) 76,970 4,394,987
5,812,387
MACHINERY – 4.8%
AGCO Corporation 20,200 1,226,544
Federal Signal Corporation 61,900 1,441,651
Regal Beloit Corporation 38,600 3,157,480
5,825,675
MATERIALS – 1.8%
Axalta Coating Systems Ltd. (a)(b) 71,199 2,158,042
MEDIA – 3.8%
Discovery Communications, Inc. – Class C (a) 179,750 4,583,625
OFFICE ELECTRONICS – 3.1%
Zebra Technologies Corporation – Class A (a) 26,000 3,724,500

46
The accompanying notes are an integral part of these financial statements.
COMMON STOCKS – 96.4% – continuedPHARMACEUTICALS – 4.0% Shares Value
Prestige Brands Holdings, Inc. (a) 126,905 $4,870,614
RESTAURANTS – 4.5%
Denny’s Corporation (a) 91,520 1,457,914
Dine Brands Global, Inc. 35,688 2,669,462
Dunkin’ Brands Group Inc. 19,000 1,312,330
5,439,706
SEMICONDUCTORS & SEMICONDUCTOR EQUIPMENT – 3.0%
Kulicke and Soffa Industries, Inc. (a) 155,700 3,708,774
TEXTILES, APPAREL & LUXURY GOODS – 1.4%
Skechers U.S.A., Inc. – Class A (a) 55,700 1,671,557
TRANSPORTATION EQUIPMENT – 4.3%
The Greenbrier Companies, Inc. 58,500 3,085,875
Wabash National Corporation 116,000 2,164,560
5,250,435
WASTE MANAGEMENT – 3.7%
Stericycle, Inc. (a) 69,000 4,505,010
TOTAL COMMON STOCKS (Cost $108,983,424) 117,139,718
SHORT-TERM INVESTMENT – 3.0%MONEY MARKET MUTUAL FUND – 3.0%
Morgan Stanley Institutional Liquidity Fund – Government Portfolio – Institutional Class, 1.81% (c) 3,610,164 3,610,164
TOTAL SHORT-TERM INVESTMENT (Cost $3,610,164) 3,610,164
TOTAL INVESTMENTS – 99.4%(Cost $112,593,588) 120,749,882
OTHER ASSETS IN EXCESS OF LIABILITIES – 0.6% 697,987
TOTAL NET ASSETS – 100.0% $121,447,869
(a) Non-income producing security.(b) U.S. Dollar-denominated foreign security.(c) The rate quoted is the annualized seven-day yield of the fund at period end.
O L S T E I N S T R A T E G I C O P P O R T U N I T I E S F U N D

47
( T H I S P A G E I N T E N T I O N A L L Y L E F T B L A N K . )
O L S T E I N S T R A T E G I C O P P O R T U N I T I E S F U N D

48
The accompanying notes are an integral part of these financial statements.
Olstein Strategic Opportunities FundStatement of Assets and Liabilities as of June 30, 2018
Assets:
Investments, at value (at cost $112,593,588) $120,749,882
Receivable for securities sold 984,864
Receivable for capital shares sold 113,390
Dividends and interest receivable 134,135
Other assets 18,983
Total Assets $122,001,254
Liabilities:
Payable for securities purchased 73,286
Payable for capital shares redeemed 226,881
Payable to Investment Manager (See Note 5) 100,780
Distribution expense payable 52,394
Payable for professional fees 27,940
Payable for transfer agent fess and expenses 27,782
Payable for trustees’ fees and expenses 13,115
Accrued expenses and other liabilities 31,207
Total Liabilities 553,385
Net Assets $121,447,869
Net Assets Consist of:
Capital stock $118,148,055
Accumulated net investment loss (366,160)
Accumulated net realized loss on investments sold (4,490,320)
Net unrealized appreciation on investments 8,156,294
Total Net Assets $121,447,869
O L S T E I N S T R A T E G I C O P P O R T U N I T I E S F U N D
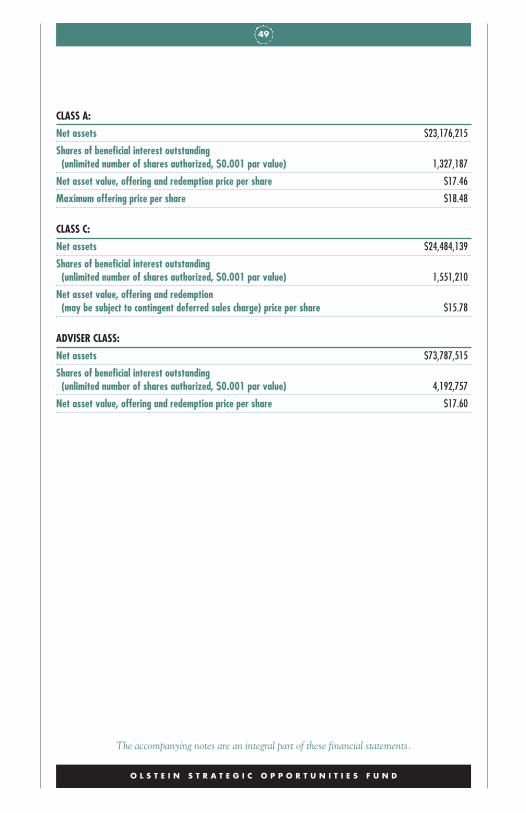
49
The accompanying notes are an integral part of these financial statements.
CLASS A:
Net assets $23,176,215
Shares of beneficial interest outstanding (unlimited number of shares authorized, $0.001 par value) 1,327,187
Net asset value, offering and redemption price per share $17.46
Maximum offering price per share $18.48
CLASS C:
Net assets $24,484,139
Shares of beneficial interest outstanding (unlimited number of shares authorized, $0.001 par value) 1,551,210
Net asset value, offering and redemption (may be subject to contingent deferred sales charge) price per share $15.78
ADVISER CLASS:
Net assets $73,787,515
Shares of beneficial interest outstanding (unlimited number of shares authorized, $0.001 par value) 4,192,757
Net asset value, offering and redemption price per share $17.60
O L S T E I N S T R A T E G I C O P P O R T U N I T I E S F U N D

50
The accompanying notes are an integral part of these financial statements.
Olstein Strategic Opportunities FundStatement of Operations
For the Year Ended June 30, 2018
Investment Income:
Dividend income $1,362,327
Interest income 100,978
Total investment income 1,463,305
Expenses:
Investment management fees (See Note 5) 1,376,231
Distribution expense – Class A (See Note 6) 66,712
Distribution expense – Class C (See Note 6) 286,970
Transfer agent fees and expenses 153,694
Administration fees 98,086
Professional fees 67,934
Federal and state registration 56,742
Accounting costs 46,754
Trustees’ fees and expenses 41,563
Custody fees 16,879
Report to shareholders 13,698
Other 14,393
Total expenses 2,239,656
Net expenses waived by Investment Manager (See Note 5) (28,063)
Net expenses 2,211,593
Net investment loss (748,288)
Realized and Unrealized Gain (Loss) on Investments:
Realized gain on investments 5,529,448
Change in unrealized appreciation/depreciation on investments (382,804)
Net realized and unrealized gain on investments 5,146,644
Net Increase in Net Assets Resulting from Operations $4,398,356
O L S T E I N S T R A T E G I C O P P O R T U N I T I E S F U N D

51
The accompanying notes are an integral part of these financial statements.
Olstein Strategic Opportunities FundStatements of Changes in Net Assets
For the For theYear Ended Year Ended
June 30, 2018 June 30, 2017
Operations:
Net investment loss $(748,288) $(838,516)
Net realized gain on investments 5,529,448 2,562,887
Change in unrealized appreciation/depreciation on investments (382,804) 30,262,187
Net increase in net assets resulting from operations 4,398,356 31,986,558
Net decrease in net assets from Fund share transactions (See Note 7) (36,418,866) (21,028,941)
Total Increase (Decrease) in Net Assets (32,020,510) 10,957,617
Net Assets:
Beginning of period 153,468,379 142,510,762
End of period $121,447,869 $153,468,379
Accumulated net investment loss $(366,160) $(467,736)
O L S T E I N S T R A T E G I C O P P O R T U N I T I E S F U N D
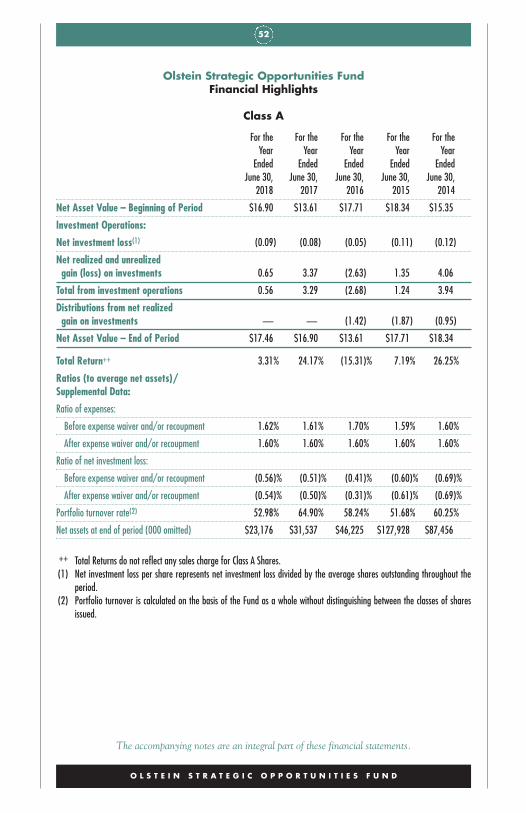
52
The accompanying notes are an integral part of these financial statements.
Olstein Strategic Opportunities FundFinancial Highlights
Class A
For the For the For the For the For theYear Year Year Year Year
Ended Ended Ended Ended EndedJune 30, June 30, June 30, June 30, June 30,
2018 2017 2016 2015 2014
Net Asset Value – Beginning of Period $16.90 $13.61 $17.71 $18.34 $15.35
Investment Operations:
Net investment loss(1) (0.09) (0.08) (0.05) (0.11) (0.12)
Net realized and unrealized gain (loss) on investments 0.65 3.37 (2.63) 1.35 4.06
Total from investment operations 0.56 3.29 (2.68) 1.24 3.94
Distributions from net realized gain on investments — — (1.42) (1.87) (0.95)
Net Asset Value – End of Period $17.46 $16.90 $13.61 $17.71 $18.34
Total Return++ 3.31% 24.17% (15.31)% 7.19% 26.25%
Ratios (to average net assets)/Supplemental Data:
Ratio of expenses:
Before expense waiver and/or recoupment 1.62% 1.61% 1.70% 1.59% 1.60%
After expense waiver and/or recoupment 1.60% 1.60% 1.60% 1.60% 1.60%
Ratio of net investment loss:
Before expense waiver and/or recoupment (0.56)% (0.51)% (0.41)% (0.60)% (0.69)%
After expense waiver and/or recoupment (0.54)% (0.50)% (0.31)% (0.61)% (0.69)%
Portfolio turnover rate(2) 52.98% 64.90% 58.24% 51.68% 60.25%
Net assets at end of period (000 omitted) $23,176 $31,537 $46,225 $127,928 $87,456
++ Total Returns do not reflect any sales charge for Class A Shares.(1) Net investment loss per share represents net investment loss divided by the average shares outstanding throughout the
period.(2) Portfolio turnover is calculated on the basis of the Fund as a whole without distinguishing between the classes of shares
issued.
O L S T E I N S T R A T E G I C O P P O R T U N I T I E S F U N D

53
The accompanying notes are an integral part of these financial statements.
Olstein Strategic Opportunities FundFinancial Highlights
Class C
For the For the For the For the For theYear Year Year Year Year
Ended Ended Ended Ended EndedJune 30, June 30, June 30, June 30, June 30,
2018 2017 2016 2015 2014
Net Asset Value – Beginning of Period $15.39 $12.49 $16.50 $17.33 $14.66
Investment Operations:
Net investment loss(1) (0.20) (0.18) (0.14) (0.23) (0.23)
Net realized and unrealized gain (loss) on investments 0.59 3.08 (2.45) 1.27 3.85
Total from investment operations 0.39 2.90 (2.59) 1.04 3.62
Distributions from net realized gain on investments — — (1.42) (1.87) (0.95)
Net Asset Value – End of Period $15.78 $15.39 $12.49 $16.50 $17.33
Total Return++ 2.53% 23.22% (15.92)% 6.41% 25.28%
Ratios (to average net assets)/Supplemental Data:
Ratio of expenses:
Before expense waiver and/or recoupment 2.37% 2.36% 2.45% 2.34% 2.35%
After expense waiver and/or recoupment 2.35% 2.35% 2.35% 2.35% 2.35%
Ratio of net investment loss:
Before expense waiver and/or recoupment (1.31)% (1.26)% (1.15)% (1.35)% (1.44)%
After expense waiver and/or recoupment (1.29)% (1.25)% (1.05)% (1.36)% (1.44)%
Portfolio turnover rate(2) 52.98% 64.90% 58.24% 51.68% 60.25
Net assets at end of period (000 omitted) $24,484 $35,107 $36,127 $46,193 $26,367
++ Total Returns do not reflect any deferred sales charge for Class C Shares.(1) Net investment loss per share represents net investment loss divided by the average shares outstanding throughout the
period.(2) Portfolio turnover is calculated on the basis of the Fund as a whole without distinguishing between the classes of shares
issued.
O L S T E I N S T R A T E G I C O P P O R T U N I T I E S F U N D

54
The accompanying notes are an integral part of these financial statements.
Olstein Strategic Opportunities FundFinancial Highlights
Adviser Class
For the For the For theYear Year Year
Ended Ended Ended May 11, 2015(1)June 30, June 30, June 30, Through
2018 2017 2016 June 30, 2015
Net Asset Value – Beginning of Period $16.99 $13.65 $17.72 $18.47
Investment Operations:
Net investment loss(2) (0.05) (0.04) (0.01) (0.00)
Net realized and unrealized gain (loss) on investments 0.66 3.38 (2.64) (0.75)
Total from investment operations 0.61 3.34 (2.65) (0.75)
Distributions from net realized gain on investments — — (1.42) —
Net Asset Value – End of Period $17.60 $16.99 $13.65 $17.72
Total Return 3.59% 24.47% (15.11)% (4.06)%*
Ratios (to average net assets)/Supplemental Data:
Ratio of expenses:
Before expense waiver and/or recoupment 1.37% 1.36% 1.45% 1.31%**
After expense waiver and/or recoupment 1.35% 1.35% 1.35% 1.35%**
Ratio of net investment loss:
Before expense waiver and/or recoupment (0.31)% (0.26)% (0.16)% (0.10)%**
After expense waiver and/or recoupment (0.29)% (0.25)% (0.06)% (0.14)%**
Portfolio turnover rate(3) 52.98% 64.90% 58.24% 51.68%*
Net assets at end of period (000 omitted) $73,788 $86,824 $60,159 $51,738
* Not annualized.** Annualized.(1) Commencement of operations.(2) Net investment loss per share represents net investment loss divided by the average shares outstanding throughout the
period.(3) Portfolio turnover is calculated on the basis of the Fund as a whole without distinguishing between the classes of shares
issued.
O L S T E I N S T R A T E G I C O P P O R T U N I T I E S F U N D

55
The Olstein FundsNotes to Financial Statements
1 Description of the Funds The Olstein Funds (the “Trust”), a Delawarestatutory trust organized on March 31, 1995, is registered under theInvestment Company Act of 1940, as amended (the “1940 Act”), as anopen-end investment management company. The Trust consists of twoseries, the Olstein All Cap Value Fund (“All Cap Value Fund”) and theOlstein Strategic Opportunities Fund (“Strategic Fund”) (collectively,the “Funds”). Each Fund is a diversified investment management compa-ny. The primary investment objective of each Fund is long-term capitalappreciation with a secondary objective of income. The Funds areInvestment Companies and therefore follow the Investment Companyaccounting and reporting guidance of the Financial AccountingStandards Board (“FASB”) Accounting Standards Codification Topic946 Financial Services – Investment Companies. The All Cap ValueFund commenced investment operations on September 21, 1995, and theStrategic Fund commenced operations on November 1, 2006.
The All Cap Value Fund issued a second class of shares, Adviser Classshares, and renamed the initial class as Class C shares on September 1,1999. The Adviser Class shares were initially sold on September 21, 1999,and were subject to expenses pursuant to the Distribution andShareholder Servicing Plan for the Adviser Class shares described in Note6 through October 30, 2013 (at which time the Plan was eliminated).The Class C shares are subject to a contingent deferred sales charge(“CDSC”) for redemptions in accordance with the All Cap Value Fund’sprospectus and expenses pursuant to the Distribution and ShareholderServicing Plan for the Class C shares described in Note 6. The maximumCDSC is 1.00% based on the lesser of the original purchase price or thevalue of such shares at the time of redemption for Class C shares withinone year of purchase.
The Strategic Fund offers Class A and Class C shares, which are subjectto expenses pursuant to the Distribution and Shareholder Servicing Plansdescribed in Note 6. Class A shares have a maximum front-end salescharge of 5.50% that is included in the offering price of the Class Ashares. The Class C shares are subject to a CDSC for redemptions withinone year of purchase in accordance with the Strategic Fund’s prospectus.The maximum CDSC is 1.00% based on the lesser of the original
T H E O L S T E I N F U N D S

56
purchase price or the value of such shares at the time of redemption. TheStrategic Fund began offering a third class of shares, Adviser Class shares,on April 28, 2015, which were initially sold on May 11, 2015.
Reorganization into Managed Portfolio Series On March 29, 2018, theBoard of Trustees approved an Agreement and Plan of Reorganization(the “Reorganization”) for the Funds from The Olstein Funds Trust toManaged Portfolio Series. Subject to the approval of the Funds’shareholders as of the record date of July 6, 2018, it is anticipated thatthe Reorganization will occur on or about September 14, 2018. Theinvestment objectives, strategies, policies and investment managementfees will be the same after the Reorganization.
2 Significant Accounting Policies The following is a summary of the signif-icant accounting policies of the Funds:
Security Valuation. The Funds’ equity securities, except securities reportedon the NASDAQ NMS or Small Cap exchanges, are valued at their fairvalue as determined by their last reported sale price on the exchange onwhich the security is principally traded. Securities traded on NASDAQNMS or Small Cap exchanges are valued at the NASDAQ OfficialClosing Price (“NOCP”). Lacking any sales, the security is valued at themean between the closing bid and ask prices. The value of securities forwhich no quotations are readily available is determined in good faith by,or under procedures approved by, the Board of Trustees (the “Board”).The Board has adopted specific procedures for valuing portfolio securitiesand delegated the implementation of these procedures to Olstein CapitalManagement, L.P. (“Olstein” or the “Investment Manager”). Theprocedures authorize the Investment Manager to make all necessarydeterminations regarding the fair value of a portfolio security and toreport such determinations to the Board of Trustees. The Funds useindependent pricing services to assist in pricing portfolio securities.Redeemable securities issued by open-end investment companies,including money market funds, and held by a Fund are valued on anygiven business day using the respective NAVs of such companies forpurchase and/or redemption orders placed on that day.
The Trust has adopted fair valuation accounting standards which estab-lish an authoritative definition of fair value and set out a hierarchy formeasuring fair value. These standards require additional disclosuresabout the various inputs and valuation techniques used to develop the
T H E O L S T E I N F U N D S

57
measurements of fair value and a discussion of changes in valuation tech-niques and related inputs during the period. These standards define fairvalue as the price that would be received to sell an asset or paid to trans-fer a liability in an orderly transaction between market participants at themeasurement date. The fair value hierarchy is organized into three levelsbased upon the assumptions (referred to as “inputs”) used in pricing theasset or liability. These standards state that “observable inputs” reflect theassumptions market participants would use in pricing the asset or liabilitybased on market data obtained from independent sources, and “unobserv-able inputs” reflect an entity’s own assumptions about the assumptionsmarket participants would use in pricing the asset or liability. Theseinputs are summarized in the three broad levels listed below.
Level 1 – Quoted unadjusted prices for identical instruments in active mar-kets to which the Trust has access at the date of measurement.
Level 2 – Quoted prices for similar instruments in active markets; quotedprices for identical or similar instruments in markets that arenot active; and model-derived valuations in which all signifi-cant inputs and significant value drivers are observable inactive markets. Level 2 inputs are those in markets for whichthere are few transactions, the prices are not current, little pub-lic information exists or instances where prices vary substantial-ly over time or among brokered market makers.
Level 3 – Model derived valuations in which one or more significantinputs or significant value drivers are unobservable.Unobservable inputs are those inputs that reflect the Trust’sown assumptions that market participants would use to pricethe asset or liability based on the best available information.
T H E O L S T E I N F U N D S

58
The inputs or methodology used for valuing securities are not necessarilyan indication of the risk associated with investing in those securities.The following is a summary of the inputs used to value the Funds’ invest-ments as of June 30, 2018:
Level 1 Level 2 Level 3 Total
All Cap Value Fund
Equity
Information Technology $140,636,154 $— $— $140,636,154
Consumer Discretionary 125,330,842 — — 125,330,842
Financials 114,237,841 — — 114,237,841
Industrials 99,807,493 — — 99,807,493
Health Care 60,017,824 — — 60,017,824
Consumer Staples 50,279,591 — — 50,279,591
Materials 33,341,961 — — 33,341,961
Energy 6,907,785 — — 6,907,785
Total Equity 630,559,491 — — 630,559,491
Short-Term Investment 34,551,776 — — 34,551,776
Total Investments in Securities $665,111,267 $— $— $665,111,267
Level 1 Level 2 Level 3 Total
Strategic Fund
Equity
Consumer Discretionary $32,647,481 $— $— $32,647,481
Industrials 27,120,992 — — 27,120,992
Information Technology 18,656,433 — — 18,656,433
Financials 14,634,917 — — 14,634,917
Health Care 10,835,534 — — 10,835,534
Materials 8,840,937 — — 8,840,937
Consumer Staples 4,403,424 — — 4,403,424
Total Equity 117,139,718 — — 117,139,718
Short-Term Investment 3,610,164 — — 3,610,164
Total Investments in Securities $120,749,882 $— $— $120,749,882
There were no transfers between levels during the reporting period, ascompared to their classification from the most recent annual report. It isthe Funds’ policy to recognize transfers at the end of the reporting period.
Subsequent Events. In preparing these financial statements, the Trust hasevaluated events after June 30, 2018, through the date the financialstatements were issued, and determined that there were no significant
T H E O L S T E I N F U N D S
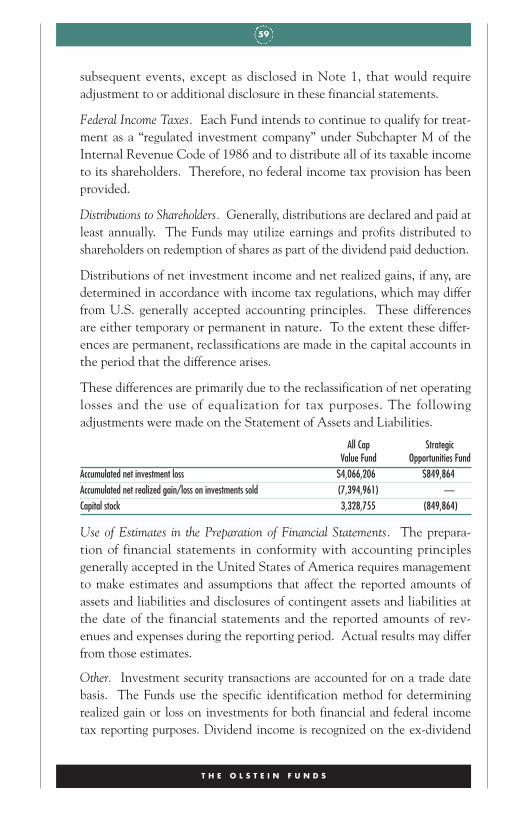
59
subsequent events, except as disclosed in Note 1, that would requireadjustment to or additional disclosure in these financial statements.
Federal Income Taxes. Each Fund intends to continue to qualify for treat-ment as a “regulated investment company” under Subchapter M of theInternal Revenue Code of 1986 and to distribute all of its taxable incometo its shareholders. Therefore, no federal income tax provision has beenprovided.
Distributions to Shareholders. Generally, distributions are declared and paid atleast annually. The Funds may utilize earnings and profits distributed toshareholders on redemption of shares as part of the dividend paid deduction.
Distributions of net investment income and net realized gains, if any, aredetermined in accordance with income tax regulations, which may differfrom U.S. generally accepted accounting principles. These differencesare either temporary or permanent in nature. To the extent these differ-ences are permanent, reclassifications are made in the capital accounts inthe period that the difference arises.
These differences are primarily due to the reclassification of net operatinglosses and the use of equalization for tax purposes. The followingadjustments were made on the Statement of Assets and Liabilities.
All Cap StrategicValue Fund Opportunities Fund
Accumulated net investment loss $4,066,206 $849,864Accumulated net realized gain/loss on investments sold (7,394,961) —Capital stock 3,328,755 (849,864)
Use of Estimates in the Preparation of Financial Statements. The prepara-tion of financial statements in conformity with accounting principlesgenerally accepted in the United States of America requires managementto make estimates and assumptions that affect the reported amounts ofassets and liabilities and disclosures of contingent assets and liabilities atthe date of the financial statements and the reported amounts of rev-enues and expenses during the reporting period. Actual results may differfrom those estimates.
Other. Investment security transactions are accounted for on a trade datebasis. The Funds use the specific identification method for determiningrealized gain or loss on investments for both financial and federal incometax reporting purposes. Dividend income is recognized on the ex-dividend
T H E O L S T E I N F U N D S

60
date or as soon as information is available to the Funds, and interest incomeis recognized on an accrual basis. Income, realized and unrealized gains orlosses on investments are allocated to each class of shares based on eachFund’s relative net assets. All discounts and premiums are amortized usingthe effective interest method for tax and financial reporting purposes.
Expenses. Expenses directly attributable to a class of shares, such as Rule12b-1 distribution fees, are charged to that class. Expenses that are notattributable to a particular class are typically allocated within each Fundamong each class in proportion to their respective net assets. Expensesincurred by the Trust that do not specifically relate to an individual Fundof the Trust are allocated to the Funds based on each Fund’s relative netassets or other appropriate basis deemed fair and equitable by the Trustees.
3 Purchases and Sales of Investment Securities During the year endedJune 30, 2018, purchases and sales of investment securities (excludingshort-term investments) were as follows:
Purchases SalesAll Cap Value Fund $345,833,816 $398,930,548Strategic Fund $68,335,926 $102,048,543
The Funds did not purchase long-term U.S. Government securities as apart of their investment strategy during the respective periods.
4 Tax Information At June 30, 2018, the components of accumulatedearnings/losses on a tax basis were as follows:
All Cap StrategicValue Fund Fund
Cost of Investments $611,263,714 $112,989,882Gross unrealized appreciation $84,274,201 $15,059,778Gross unrealized depreciation (30,426,648) (7,299,778)Net unrealized appreciation $53,847,553 $7,760,000Undistributed ordinary income 5,048,659 —Undistributed long-term capital gain 39,501,215 —Total distributable earnings $44,549,874 $—Other accumulated losses $— $(4,460,186)Total accumulated gains (losses) $98,397,427 $3,299,814
The difference between book-basis and tax-basis net unrealized apprecia-tion is attributable primarily to the tax deferral of losses on wash sales forthe All Cap Value Fund and the Strategic Fund.
T H E O L S T E I N F U N D S

61
At June 30, 2018, the accumulated capital loss carryforwards were as follows:
All Cap StrategicValue Fund Fund
Unexpiring Losses $— $4,094,026 ST
To the extent the Funds realize future net capital gains, taxable distribu-tions will be reduced by any unused capital loss carryforwards as permit-ted by the Internal Revenue Code.
At June 30, 2018, the Funds deferred, on a tax basis, ordinary late-yearlosses of:
OrdinaryLate Year Loss
All Cap Value Fund $—
Strategic Fund $366,160
The tax components of dividends paid by the Funds during the periodsended June 30, 2018 and June 30, 2017 were as follows:
Year Ended Year EndedAll Cap Value Fund June 30, 2018 June 30, 2017
Long-Term Capital Gain $38,380,579 $1,415,415
Strategic Fund
Ordinary Income $— $—
Long-Term Capital Gain $— $—
The Funds designated as long-term capital gain dividend, pursuant toInternal Revenue Code Section 852(b)(3), the amount necessary toreduce earnings and profits of the Funds related to net capital gain to zerofor the tax years ended June 30, 2018 and 2017.
The Trust has adopted financial reporting rules regarding recognition andmeasurement of tax positions taken or expected to be taken on a tax return.The Trust has reviewed all open tax years and major jurisdictions and con-cluded that there is no impact on the Funds’ financial position or results ofoperations as a result of open tax years. Tax years that remain open toexamination by major tax jurisdictions include tax years ended June 30,2015 through June 30, 2018. There is no tax liability resulting from unrecog-nized tax benefits relating to uncertain income tax positions taken orexpected to be taken on tax returns as of and for the year ended June 30,2018. The Funds are also not aware of any tax positions for which it is rea-sonably possible that the total amounts of unrecognized tax benefits will sig-nificantly change in the next twelve months. If applicable, the Funds would
T H E O L S T E I N F U N D S

62
recognize interest accrued related to unrecognized tax benefits in “interestexpense” and penalties in “other expense” on the statements of operations.
5 Investment Management Fee and Other Agreements The Fundsemploy Olstein as the Investment Manager. Pursuant to investmentmanagement agreements with the Funds, the Investment Manager selectsinvestments and supervises the assets of the Funds in accordance with theinvestment objectives, policies and restrictions of the Funds, subject tothe supervision and direction of the Board of Trustees. For its services,the Investment Manager earns a monthly fee at the annual rate of 1.00%for the first $1 billion, 0.95% for $1 billion to $1.5 billion, 0.90% for $1.5billion to $2 billion, 0.85% for $2 billion to $2.5 billion, 0.80% for $2.5billion to $3 billion and 0.75% for over $3 billion of the All Cap ValueFund’s average daily net assets and 1.00% of the Strategic Fund’s averagedaily net assets. For the year ended June 30, 2018, the All Cap ValueFund incurred investment management fees of $6,874,267, with$557,064 payable to the Investment Manager as of June 30, 2018. Forthe same period, the Strategic Fund incurred management fees of$1,376,231, with $100,780 net payable to the Investment Manager as ofJune 30, 2018. The Investment Manager receivables and payables aresettled monthly. The Investment Manager has agreed to contractuallywaive or reduce all or a portion of its management fee and, if necessary,to bear certain other expenses to limit the annualized expenses of theStrategic Fund to 1.35%, exclusive of 12b-1 and shareholder servicingfees, acquired fund fees and expenses, taxes, interest and non-routineexpenses. This agreement remains in effect until at least October 28,2018. The Investment Manager may seek reimbursement of its waivedfees and expenses borne for a rolling three-year period following the fiscalyear such fee waivers and expense reimbursements are incurred, providedthat the reimbursement by the Strategic Fund of the InvestmentManager will not cause total operating expenses exclusive of 12b-1 fees,shareholder servicing fees, acquired fund fees and expenses, taxes, inter-est, and non-routine expenses to exceed the expense cap as then may bein effect or the expense cap in place at the time of the fee waiver.
Strategic FundReimbursed/Absorbed Expenses Subject to Recovery by Investment Manager Until:2019 $159,0212020 21,0702021 29,186Total $209,277
T H E O L S T E I N F U N D S

63
T H E O L S T E I N F U N D S
Certain trustees and officers of the Trust are also officers of the Trust’sInvestment Manager. Such trustees and officers are paid no fees by theTrust for serving as trustees or officers of the Trust.
6 Distribution and Shareholder Servicing Plans Olstein has entered into adistribution and underwriting agreement with the Funds dated August 18,1995 (subsequently revised on July 29, 1998 to reflect the additional classand further amended and restated effective October 1, 2007), underwhich Olstein acts as underwriter to engage in activities designed to assistthe Funds in securing purchasers for their shares. The Funds have adopt-ed Distribution and Shareholder Servicing Plans pursuant to Rule 12b-1under the 1940 Act (the “12b-1 Plans”). Amounts paid under the 12b-1Plans may compensate Olstein or others for the activities in the promo-tion and distribution of each Fund’s shares and for shareholder servicing.The total amount that the All Cap Value Fund will pay under the 12b-1Plans for the Class C shares is 1.00% per annum of the Fund’s averagedaily net assets of Class C shares. For the year ended June 30, 2018, feesincurred by the All Cap Value Fund pursuant to the 12b-1 Plan were$4,824,845 for Class C shares. The total amount that the Strategic Fundwill pay under the 12b-1 Plans for the Class A and Class C shares are0.25% and 1.00%, respectively, per annum of the Fund’s average daily netassets of Class A and Class C shares, respectively. For the year endedJune 30, 2018, fees incurred by the Strategic Fund pursuant to the 12b-1Plans were $66,712 for Class A shares and $286,970 for Class C shares.For the year ended June 30, 2018, Olstein retained $2,467 from salescharges on the Strategic Fund Class A shares. During the year endedJune 30, 2018, Olstein received contingent deferred sales charges fromredeeming shareholders in the amounts of $10,392 and $307 for the AllCap Value Fund and the Strategic Fund, respectively. The Adviser Classshares of the Funds do not have a 12b-1 Plan.
During the year ended June 30, 2018, the All Cap Value Fund and theStrategic Fund paid no brokerage commissions to affiliated broker-dealersin connection with purchases and sales of investment securities.

64
7 Fund Shares At June 30, 2018, there was an unlimited number of sharesof beneficial interest, $0.001 par value, authorized. The following tablesummarizes the activity in shares of each class of the Funds:
All Cap Value FundYear Ended Year Ended
June 30, 2018 June 30, 2017
Class C Class C
Shares Amount Shares Amount
Shares sold 259,120 $5,182,791 362,401 $6,737,217
Shares reinvested 1,300,320 25,629,316 54,245 1,025,764
Shares redeemed (3,279,679) (65,995,506) (3,394,708) (63,200,847)
Net decrease (1,720,239) $(35,183,399) (2,978,062) $(55,437,866)
Shares Outstanding:
Beginning of period 24,798,059 27,776,121
End of period 23,077,820 24,798,059
Year Ended Year EndedJune 30, 2018 June 30, 2017
Adviser Class Adviser ClassShares Amount Shares Amount
Shares sold 920,693 $22,747,961 1,005,719 $22,838,529
Shares reinvested 393,823 9,609,284 13,882 318,167
Shares redeemed (1,195,714) (29,608,861) (1,082,463) (24,199,014)
Net increase (decrease) 118,802 $2,748,384 (62,862) $(1,042,318)
Shares Outstanding:
Beginning of period 8,200,084 8,262,946
End of period 8,318,886 8,200,084
Total Net Decrease $(32,435,015) $(56,480,184)
Strategic FundYear Ended Year Ended
June 30, 2018 June 30, 2017
Class A Class A
Shares Amount Shares Amount
Shares sold 90,908 $1,535,881 188,646 $3,064,924
Shares redeemed (630,008) (10,667,895) (1,719,389) (26,908,754)
Net decrease (539,100) $(9,132,014) (1,530,743) $(23,843,830)
Shares Outstanding:
Beginning of period 1,866,287 3,397,030
End of period 1,327,187 1,866,287
T H E O L S T E I N F U N D S

65
Year Ended Year EndedJune 30, 2018 June 30, 2017
Class C Class CShares Amount Shares Amount
Shares sold 89,789 $1,401,512 206,305 $2,968,329
Shares redeemed (819,895) (12,607,619) (818,535) (11,702,232)
Net decrease (730,106) $(11,206,107) (612,230) $(8,733,903)
Shares Outstanding:
Beginning of period 2,281,316 2,893,546
End of period 1,551,210 2,281,316
Year Ended Year EndedJune 30, 2018 June 30, 2017
Adviser Class Adviser ClassShares Amount Shares Amount
Shares sold 948,744 $16,179,672 1,802,624 $28,969,800
Shares redeemed (1,867,026) (32,260,417) (1,100,388) (17,421,008)
Net increase (decrease) (918,282) $(16,080,745) 702,236 $11,548,792
Shares Outstanding:
Beginning of period 5,111,039 4,408,803
End of period 4,192,757 5,111,039
Total Net Decrease $(36,418,866) $(21,028,941)
8 Line of Credit The All Cap Value Fund and the Strategic Fund had linesof credit of $50 million and $20 million, respectively, with U.S. Bank,N.A. (the “Bank”), which matured on May 15, 2018, which were usedfor liquidity purposes, subject to certain restrictions and covenants. Tothe extent that the line was utilized, it was collateralized by securities inthe Funds’ portfolios. The interest rate on any borrowings was the Bank’sannounced prime rate.
During the period from July 1, 2017 through May 15, 2018, the Funds didnot draw upon the lines of credit.
9 Indemnifications Under the Trust’s organizational documents, itsOfficers and Trustees are indemnified against certain liabilities arising outof the performance of their duties to the Funds. In addition, in the nor-mal course of business, the Funds enter into contracts that provide gener-al indemnifications to other parties. The Funds’ maximum exposureunder these arrangements is unknown as this would involve future claimsthat may be made against the Funds that have not yet occurred.However, the Funds have not had prior claims or losses pursuant to thesecontracts and expect the risk of loss to be remote.
T H E O L S T E I N F U N D S
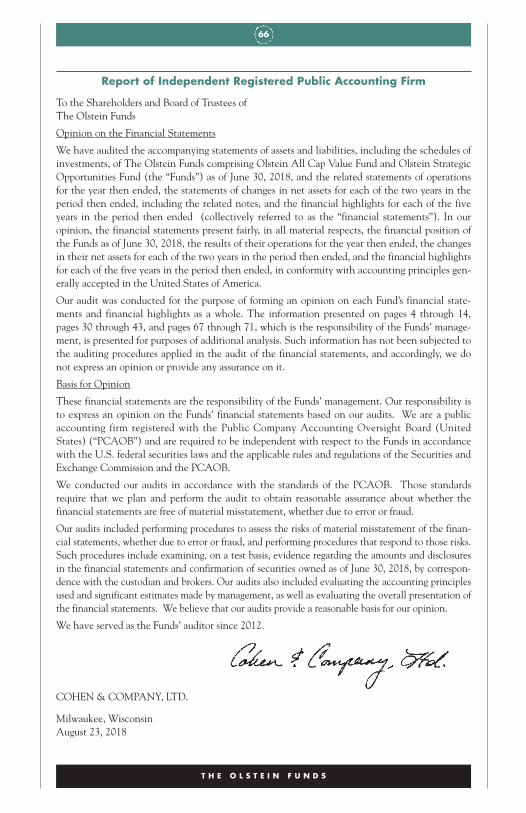
66
Report of Independent Registered Public Accounting Firm
To the Shareholders and Board of Trustees ofThe Olstein Funds
Opinion on the Financial Statements
We have audited the accompanying statements of assets and liabilities, including the schedules ofinvestments, of The Olstein Funds comprising Olstein All Cap Value Fund and Olstein StrategicOpportunities Fund (the “Funds”) as of June 30, 2018, and the related statements of operationsfor the year then ended, the statements of changes in net assets for each of the two years in theperiod then ended, including the related notes, and the financial highlights for each of the fiveyears in the period then ended (collectively referred to as the “financial statements”). In ouropinion, the financial statements present fairly, in all material respects, the financial position ofthe Funds as of June 30, 2018, the results of their operations for the year then ended, the changesin their net assets for each of the two years in the period then ended, and the financial highlightsfor each of the five years in the period then ended, in conformity with accounting principles gen-erally accepted in the United States of America.
Our audit was conducted for the purpose of forming an opinion on each Fund’s financial state-ments and financial highlights as a whole. The information presented on pages 4 through 14,pages 30 through 43, and pages 67 through 71, which is the responsibility of the Funds’ manage-ment, is presented for purposes of additional analysis. Such information has not been subjected tothe auditing procedures applied in the audit of the financial statements, and accordingly, we donot express an opinion or provide any assurance on it.
Basis for Opinion
These financial statements are the responsibility of the Funds’ management. Our responsibility isto express an opinion on the Funds’ financial statements based on our audits. We are a publicaccounting firm registered with the Public Company Accounting Oversight Board (UnitedStates) (“PCAOB”) and are required to be independent with respect to the Funds in accordancewith the U.S. federal securities laws and the applicable rules and regulations of the Securities andExchange Commission and the PCAOB.
We conducted our audits in accordance with the standards of the PCAOB. Those standardsrequire that we plan and perform the audit to obtain reasonable assurance about whether thefinancial statements are free of material misstatement, whether due to error or fraud.
Our audits included performing procedures to assess the risks of material misstatement of the finan-cial statements, whether due to error or fraud, and performing procedures that respond to those risks.Such procedures include examining, on a test basis, evidence regarding the amounts and disclosuresin the financial statements and confirmation of securities owned as of June 30, 2018, by correspon-dence with the custodian and brokers. Our audits also included evaluating the accounting principlesused and significant estimates made by management, as well as evaluating the overall presentation ofthe financial statements. We believe that our audits provide a reasonable basis for our opinion.
We have served as the Funds’ auditor since 2012.
COHEN & COMPANY, LTD.
Milwaukee, WisconsinAugust 23, 2018
T H E O L S T E I N F U N D S

67
T H E O L S T E I N F UNDS
Additional Information
P R O X Y V O T I N G
The Board of Trustees of the Trust, on behalf of the Funds, has delegated allproxy voting responsibilities related to the portfolio securities held by theFunds to the Investment Manager. A description of the Funds’ proxy votingpolicies and procedures is available without charge, upon request, by callingtoll-free 1-800-799-2113. A description is also included in the Funds’Statement of Additional Information, which is available on the SEC’s websiteat http://www.sec.gov.
The Investment Manager’s proxy voting record for the Funds for annual peri-ods ending June 30 each year will be available to shareholders. The proxyvoting record is available, without charge, upon request by calling, toll-free,1-800-799-2113 and on the SEC website at http://www.sec.gov.
P O R T F O L I O H O L D I N G S
The Funds include complete schedules of their portfolio holdings in the annualand semi-annual reports. The Funds are required to file complete schedules ofportfolio holdings with the SEC for the first and third fiscal quarters on FormN-Q. Once filed, the Form N-Q is available, without charge, upon request onthe SEC’s website at http://www.sec.gov. Copies of Form N-Q can also beobtained by: (i) visiting the SEC’s Public Reference Room in Washington, DC(information on the operation of the Public Reference Room may be obtainedby calling 1-800-SEC-0330); (ii) sending your request and a duplicating fee tothe SEC’s Public Reference Room, Washington, DC 20549-0102; or (iii) send-ing your request electronically to http://[email protected].
B O A R D O F T R U S T E E S A N D O F F I C E R S O F T H E T R U S T
The Board of Trustees of the Trust consists of seven individuals, five of whomare not “interested persons” of the Trust or Funds as that term is defined inthe 1940 Act. The Trustees are fiduciaries for the Funds’ shareholders and aregoverned by the law of the State of Delaware in this regard. They establishpolicy for the operation of the Funds and appoint the officers who conductthe daily business of the Funds.
T H E O L S T E I N F U N D S

68
The officers conduct and supervise the daily business operations of the Trust,while the Trustees review such actions and decide on general policy.Compensation to officers and Trustees of the Trust who are affiliated with theInvestment Manager is paid by the Investment Manager and not by the Trust.
Information pertaining to the Trustees and Principal Executive Officers of theFunds is set forth below. The Statement of Additional Information includesadditional information about the Funds’ Trustees and Officers and is available,without charge, upon request by calling 1-800-799-2113.
Term of Number of Office** Portfolios in
Position and Length Principal Fund Complex Otherand Office of Time Occupation During Overseen Directorships
Name, Address and Age with the Trust Served the Past Five Years by Trustee Held by Trustee___________________ __________ _______ ______________ _________ __________Disinterested Trustees:Fred W. Lange Trustee Since Private Investor. 2 Wagner 4 Manhattanville Road 1995 CollegePurchase, NY 10577Age: 86
John Lohr Trustee Since Owner, Howling 2 LAMCO4 Manhattanville Road 1996 Wolf Enterprises LLC AdvisoryPurchase, NY 10577 (financial educator), ServicesAge: 73 since 1986; General (investment
Counsel, LFG, Inc. adviser);(provider of Howling Wolfinvestment products), EnterprisesSeptember 1995- LLCOctober 2002; and (publishing);President, Lockwood HowlingFinancial Services Wolf Capital(broker-dealer), Partners LLCJanuary 1996- (private equitySeptember 2002. company).
D. Michael Murray Trustee Since President, Murray, 2 The Eric Fund4 Manhattanville Road 1996 Montgomery & (charitablePurchase, NY 10577 O’Donnell organization);Age: 78 (consultants), Stuart Murray
since 1968. Group LLC(governmentrelations).
T H E O L S T E I N F U N D S

69
Term of Number of Office** Portfolios in
Position and Length Principal Fund Complex Otherand Office of Time Occupation During Overseen Directorships
Name, Address and Age with the Trust Served the Past Five Years by Trustee Held by Trustee___________________ __________ _______ ______________ _________ __________Lawrence K. Wein Lead Since Private 2 eRooms 4 Manhattanville Road Independent 1995 Consultant for SystemsPurchase, NY 10577 Trustee telecommunications TechnologiesAge: 76 industry, since July (ERMS. OB)
2001; Former VicePresident-Wholesale Business Operations, Concert Communications an ATT/BT Company,April 2000-June 2001;Former Executive Manager, AT&T, Inc.,for 35 years, retired July 2001.
Daniel G. Nelson Trustee Since Senior Vice 2 None4 Manhattanville Road July, President, Ingalls & Purchase, NY 10577 2014 Snyder LLC Age: 73 (investment adviser
and broker-dealer), since May 2015; Managing Director, Morgan Stanley Wealth Management Research and Strategy Group, Morgan Stanley, June 2010-January 2013;Managing Director, Smith Barney Researchand Strategy Group,Citi-Smith Barney,June 1980-June 2010.
T H E O L S T E I N F U N D S
70
Term of Number of Office** Portfolios in
Position and Length Principal Fund Complex Otherand Office of Time Occupation During Overseen Directorships
Name, Address and Age with the Trust Served the Past Five Years by Trustee Held by Trustee___________________ __________ _______ ______________ _________ __________Interested Trustees:
Erik K. Olstein*+ Trustee, Since President and Chief 2 The Trinity-Olstein Capital Secretary 1995 Operating Officer, PawlingManagement, L.P. and Olstein Capital School;4 Manhattanville Road Assistant Management, L.P., AmericanPurchase, NY 10577 Treasurer since 2000; Vice Friends of theAge: 51 President of Sales National
and Chief Operating Museum Officer, Olstein of the Capital Management, Royal Navy;L.P., 1994-2000. National
MaritimeHistoricalSociety.
Robert A. Olstein*+ Trustee, Since Chairman, Chief 2 NoneOlstein Capital Chairman 1995 Executive Officer Management, L.P. and and Chief Investment4 Manhattanville Road President Officer, OlsteinPurchase, NY 10577 Capital Management, Age: 77 L.P., since 2000;
Chairman, ChiefExecutive Officer, Chief Investment Officer and President, Olstein Capital Management, L.P., 1994-2000; President, Secretary and Sole Shareholder ofOlstein, Inc., since June 1994.
T H E O L S T E I N F U N D S

71
Term ofOffice**
Position and Length Principaland Office of Time Occupation During
Name, Address and Age with the Trust Served the Past Five Years___________________ __________ _______ ______________Officers:Michael Luper Chief Since Executive Vice Olstein Capital Accounting 1995 President and Chief Management, L.P. Officer and Financial Officer, 4 Manhattanville Road Treasurer Olstein Capital Purchase, NY 10577 Management, L.P., Age: 49 since 2000; Vice
President and Chief Financial Officer, OlsteinCapital Management, L.P., 1994-2000.
James B. Kimmel Chief Since Senior Vice President, Olstein Capital Compliance 2004 General Counsel Management, L.P. Officer and Chief Compliance4 Manhattanville Road Officer, Olstein CapitalPurchase, NY 10577 Management, L.P. sinceAge: 56 2007; Vice President,
General Counsel and Chief Compliance Officer of Olstein Capital Management, L.P., 2004-2007. Previously, Of Counsel at Stradley Ronon Stevens & Young LLP (law firm), 2001 to 2004; Vice President and Assistant Counsel in the Corporate and Securities Group at Summit Bancorp, 1996-2001; Associate Attorney, Investment Management Practice at Morgan Lewis & Bockius LLP, from 1990 through 1996.
* Robert and Erik Olstein are each officers of Olstein Capital Management, L.P. or its affiliatesand are considered to be “interested persons” of the Funds within the meaning of theInvestment Company Act.
** Each Trustee holds office for an indefinite term.+ Erik K. Olstein is the nephew of Robert A. Olstein.
T H E O L S T E I N F U N D S

72
T H E O L S T E I N F U N D S
P R I V A C Y P O L I C Y
FACTS WHAT DOES THE OLSTEIN FUNDS DOWITH YOUR PERSONAL INFORMATION?
Why? Financial companies choose how they share your personal informa-tion. Federal law gives consumers the right to limit some but not allsharing. Federal law also requires us to tell you how we collect,share, and protect your personal information. Please read this noticecarefully to understand what we do.
What? The types of personal information we collect and share depend on theproduct or service you have with us. This information can include:• Social Security number and employment information• transaction history and wire transfer instructions• account balances and checking account informationWhen you are no longer our customer, we continue to share yourinformation as described in this notice.
How? All financial companies need to share customers’ personal informa-tion to run their everyday business. In the section below, we list thereasons financial companies can share their customers’ personalinformation; the reasons The Olstein Funds chooses to share; andwhether you can limit this sharing.
Reasons we can share your Does The Olstein Can you limit personal information Funds share? this sharing?
For our everyday business purposes—such as to process your transactions, maintain your account(s), respond to Yes Nocourt orders and legal investigations, or report to credit bureaus
For our marketing purposes—to offer our products and services to you Yes No
For joint marketing with other financial companies No We don’t share
For our affiliates’ everyday business purposes—information about your Yes No
transactions and experiences
For our affiliates’ everyday business purposes— No We don’t shareinformation about your creditworthiness
For our affiliates to market to you No We don’t share
For nonaffiliates to market to you No We don’t share
Questions? Call 800-799-2113 or go to www.olsteinfunds.com

73
T H E O L S T E I N F U N D S
H O U S E H O L D I N G N O T I C E
In order to reduce expenses, we will deliver a single copy of prospectuses andfinancial reports to shareholders with the same residential address, providedthey have the same last name or we reasonably believe them to be members ofthe same family. Unless we are notified otherwise, we will continue to sendyou only one copy of these materials for as long as you remain a shareholderin The Olstein Funds. If you would like to receive individual mailings, pleasecall (800) 799-2113 and you will be sent a separate copy of these materials.
This Privacy Policy is not a part of this Annual Report.
Who we are
Who is providing The Olstein Fundsthis notice?
What we do
How does The Olstein To protect your personal information from unauthorized Funds protect my access and use, we use security measures that comply withpersonal information? federal law. These measures include computer safeguards
and secured files and buildings.
How does The Olstein We collect your personal information, for example, when you:Funds collect my • open an account or give us your contact informationpersonal information? • make a wire transfer or seek advice about your investments
• make deposits or withdrawals from your account
Why can’t I limit Federal law gives you the right to limit only:all sharing? • sharing for affiliates’ everyday business purposes—infor-
mation about your creditworthiness• affiliates from using your information to market to you• sharing for nonaffiliates to market to youState laws and individual companies may give you addi-tional rights to limit sharing.
Definitions
Affiliates Companies related by common ownership or control.They can be financial and nonfinancial companies.• Our affiliates include Olstein Capital Management, L.P.
Nonaffiliates Companies not related by common ownership or control.They can be financial and nonfinancial companies.• The Olstein Funds does not share with nonaffiliates so theycan market to you.
Joint marketing A formal agreement between nonaffiliated financial com-panies that together market financial products or servicesto you.• The Olstein Funds doesn’t jointly market.

( T H I S P A G E I N T E N T I O N A L L Y L E F T B L A N K . )


The Olstein Funds4 Manhattanville RoadPurchase, NY 10577
Olstein All Cap Value Fund
Olstein Strategic Opportunities Fund
TrusteesRobert A. Olstein, ChairmanFred W. LangeJohn LohrD. Michael MurrayDaniel G. NelsonErik K. OlsteinLawrence K. Wein
Investment ManagerOlstein Capital Management, L.P.4 Manhattanville RoadPurchase, NY 10577
DistributorOlstein Capital Management, L.P.
Administrator, Transfer Agent, Dividend Paying Agent & Shareholder Servicing AgentU.S. Bancorp Fund Services, LLC615 East Michigan StreetP.O. Box 701Milwaukee, WI 53202
CustodianU.S. Bank, N.A.1555 North RiverCenter Drive, Suite 302Milwaukee, WI 53212
Legal CounselStradley, Ronon, Stevens & Young, LLP2005 Market Street, Suite 2600Philadelphia, PA 19103-7098
Independent Registered Public Accounting FirmCohen & Company, Ltd.342 North Water Street, Suite 830Milwaukee, WI 53202
This report is submitted for the general information of the shareholders of the Funds. The report is not authorized for distribution to prospective investors in the Funds unless preceded or accompanied by an effective Prospectus.
Toll Free Telephone800.799.2113www.olsteinfunds.com