oltp-bench: an extensible testbed for benchmarking ...pavlo/static/papers/oltpbench-vldb.pdf ·...
TRANSCRIPT
OLTP-Bench: An Extensible Testbed forBenchmarking Relational Databases
Djellel Eddine Difallah Andrew PavloU. of Fribourg, Switzerland Carnegie Mellon University, USA
[email protected] [email protected]
Carlo Curino Philippe Cudre-MaurouxMicrosoft Corporation, USA U. of Fribourg, [email protected] [email protected]
ABSTRACTBenchmarking is an essential aspect of any database managementsystem (DBMS) effort. Despite several recent advancements, suchas pre-configured cloud database images and database-as-a-service(DBaaS) offerings, the deployment of a comprehensive testing plat-form with a diverse set of datasets and workloads is still far frombeing trivial. In many cases, researchers and developers are limitedto a small number of workloads to evaluate the performance charac-teristics of their work. This is due to the lack of a universal bench-marking infrastructure, and to the difficulty of gaining access to realdata and workloads. This results in lots of unnecessary engineer-ing efforts and makes the performance evaluation results difficult tocompare. To remedy these problems, we present OLTP-Bench, anextensible “batteries included” DBMS benchmarking testbed. Thekey contributions of OLTP-Bench are its ease of use and extensibil-ity, support for tight control of transaction mixtures, request rates,and access distributions over time, as well as the ability to supportall major DBMSs and DBaaS platforms. Moreover, it is bundledwith fifteen workloads that all differ in complexity and system de-mands, including four synthetic workloads, eight workloads frompopular benchmarks, and three workloads that are derived fromreal-world applications. We demonstrate through a comprehen-sive set of experiments conducted on popular DBMS and DBaaSofferings the different features provided by OLTP-Bench and theeffectiveness of our testbed in characterizing the performance ofdatabase services.
1. INTRODUCTIONPerformance analysis and tuning is one of the more difficult as-
pects of data management. It is especially challenging for com-plex systems that execute highly-concurrent workloads on large-scale datasets, because there are many factors that influence perfor-mance. We suspect, in fact, that the recent success of distributedkey-value storage systems [13] is at least partially due to the diffi-culty of understanding and predicting the performance of relationalDBMSs for these execution environments.
This work is licensed under the Creative Commons Attribution-NonCommercial-NoDerivs 3.0 Unported License. To view a copy of this li-cense, visit http://creativecommons.org/licenses/by-nc-nd/3.0/. Obtain per-mission prior to any use beyond those covered by the license. Contactcopyright holder by emailing [email protected]. Articles from this volumewere invited to present their results at the 40th International Conference onVery Large Data Bases, September 1st - 5th 2014, Hangzhou, China.Proceedings of the VLDB Endowment, Vol. 7, No. 4Copyright 2013 VLDB Endowment 2150-8097/13/12.
To overcome this problem, it is imperative that application de-velopers use a testing environment that is stable, controlled andrepeatable [19]. In the context of DBMSs, this is achieved throughthe use of a benchmark that allows one to measure key performancemetrics of a system under stress conditions. A benchmark consistsof a sample data set and a corresponding workload that is represen-tative of the target application for the system. A good benchmarkprovides insight to users and enables them to (1) validate alternativeoptions (e.g., by experimenting with different systems or configu-rations), (2) collect performance metrics and compare them withreal-world requirements, and (3) explore the causes of performancebottlenecks. From these requirements emerges the need for a com-prehensive testbed that supports both a large number of databasesystems and a wide range of benchmarks that capture the essenceof an important set of applications. Although a number of bench-marks have been proposed in the past [10, 16], to the best of ourknowledge such an extensive testbed is not available today.
The work that we present in this paper represents our effort totackle this problem and to contribute to better repeatability and eas-ier comparison of results for evaluating DBMS performance. Wepresent OLTP-Bench, an extensible, open-source testbed for bench-marking DBMSs using a diverse set of workloads [2]. This effortis motivated by our own laborious experiences in setting up exper-imental evaluation frameworks for previous research projects. Thetestbed is capable of (1) driving relational DBMSs via standardinterfaces, (2) tightly controlling the transaction mixture, requestrate, and access distribution of the workload, and (3) automaticallygathering a rich set of performance and resource statistics.
In addition to the testbed itself, we implemented 15 benchmarksin OLTP-Bench. We believe that the combination of awell-designed testbed with a rich family of benchmarks is avaluable asset. In summary, our contributions include:• An automated and extensible framework to setup, run, and an-
alyze the results of DBMS performance experiments with con-trolled and repeatable settings.
• Both real datasets and synthetic generators, along with their ac-companying workloads, that span many interesting OLTP/Webapplications, all implemented in the same framework.
• Experimental findings about popular DBMSs and DBaaS offer-ings derived from hundreds of experiments.
The rest of this paper is organized as follows: we start by dis-cussing the motivation for this project in Section 2, followed by anintroduction to the OLTP-Bench architecture and its main featuresin Section 3. Section 4 is dedicated to the description of the dataand workloads that are currently bundled with OLTP-Bench. We
277
then demonstrate how OLTP-Bench can be leveraged in many dif-ferent benchmarking scenarios in Sections 6 and 7. Finally, wepresent our conclusions and discuss how we plan to extend ourwork and foster a community-driven effort in Sections 9 and 10.
2. MOTIVATIONIn the early 1990s, Jim Gray edited a compendium that dis-
cussed popular benchmarks and various metrics (e.g., price vs per-formance) for evaluating transaction processing systems [19]. Grayargued both for generic benchmarks, which are useful in comparingthe general performance of several systems, and domain-specificbenchmarks, since “performance varies enormously from one ap-plication domain to another.” For the latter, a meaningful bench-mark is one that is relevant, portable, scalable, and simple.
Given these guidelines, one fundamental design principle of theOLTP-Bench project is that it does not impose any fixed set of con-figuration rules or pre-defined metrics of success for the bench-marks. We do not want to restrict the applicability of our frame-work and workloads to any specific context, since we believe that itis impossible to devise any single set of rules that will be applicableand relevant for all future deployment and execution scenarios. Forexample, novel hardware configurations are likely to require dif-ferent database sizes and access distributions, while new executionmodels may require a different number of concurrent connections,latency requirements, and transaction mixtures. Hence, we contendthat such standardizations are often biased towards the opinions ofthe proposers, and are likely to lead to design decisions that areonly aimed at “scoring well” according to synthetic metrics of suc-cess. Nevertheless, having an immediate appreciation of how a sys-tem achieved is important and can be extracted from the classicalthroughput and latency metrics.
Others have called for the diversification of the data sets usedfor database research by encouraging more public and challeng-ing workloads [39]. Existing benchmarking frameworks, however,only support a small number of workloads [16, 24] or a singleDBMS [3, 5]. Our framework improves on previous efforts by sup-porting a greater selection of both benchmarks and DBMSs. Wealso follow the lead of [16] in leaving competition rules unspeci-fied and let the users decide what the most suitable use cases aregiven their execution environment.
As mentioned above, this effort is motivated by the challengesthat we faced when setting up performance evaluation campaignsfor our previous projects [17, 25], as well as from extensive dis-cussions with several other database developers and experiencedresearchers. From these interactions, we gathered the following listof requirements for a modern database testbed:
(R1) Transactional Scalability: the ability to scale to highthroughputs, without being restricted by clients;
(R2) Flexible Workload Generation: the ability to generateworkloads for open, closed, and semi-open loop systems;
(R3) Fine-Grained Rate Control: the ability to control requestrates with great precision (since even small oscillations of thethroughput can make the interpretation of results difficult);
(R4) Mixed and Evolving Workloads: the ability to supportmixed workloads, and to change the rate, composition, andaccess distribution of the workloads dynamically over timeto simulate real-life events and evolving workloads;
(R5) Synthetic and Real Data & Workloads: the need to han-dle both synthetic and real data sets and workloads, to avoidcompromises between real-life tests and ease of scalability;
Remote OLTP-Bench
config.xml trace.txt
Workload Manager
StatisticsCollection
Server
SQL-DialectManagement
ResourceMonitoring
TraceAnalyzer
Data Dumps
workloads
DataGenerators
t3 t1t2..
consumeQueue
Add
Master OLTP-Bench
...
WorkerWorker
Worker
JDBCPool
think_tim
e
Init/
Sync
DBMS
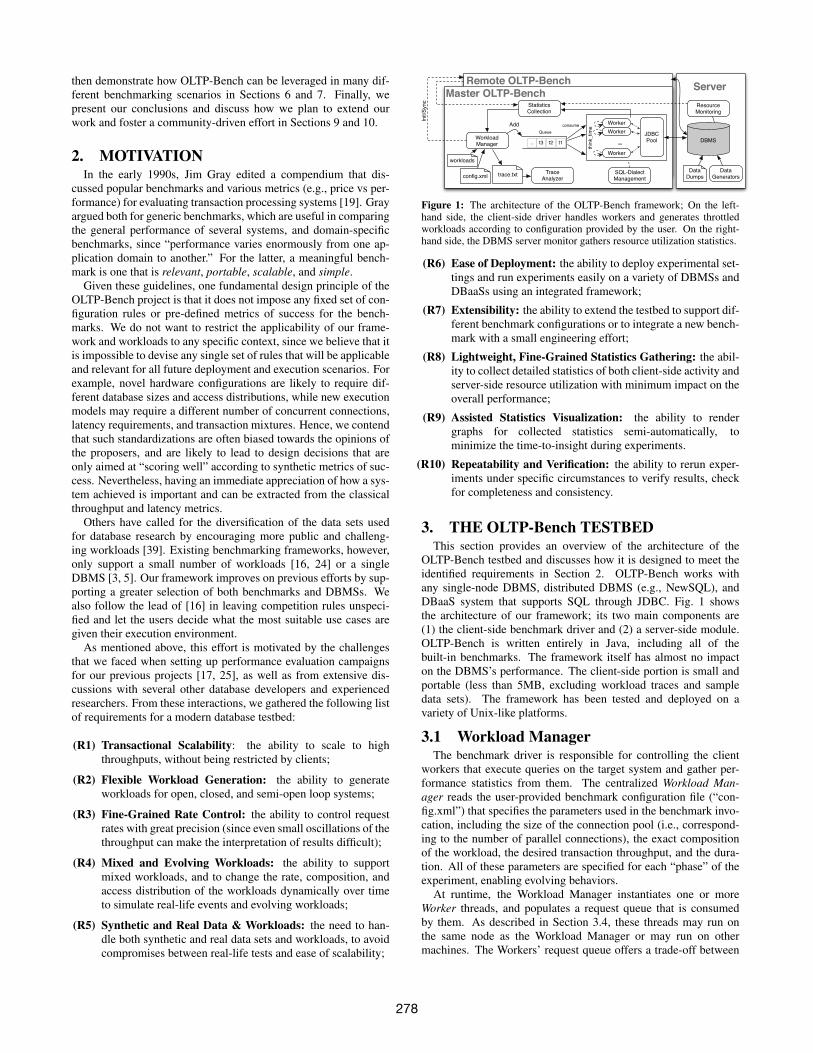
Figure 1: The architecture of the OLTP-Bench framework; On the left-hand side, the client-side driver handles workers and generates throttledworkloads according to configuration provided by the user. On the right-hand side, the DBMS server monitor gathers resource utilization statistics.
(R6) Ease of Deployment: the ability to deploy experimental set-tings and run experiments easily on a variety of DBMSs andDBaaSs using an integrated framework;
(R7) Extensibility: the ability to extend the testbed to support dif-ferent benchmark configurations or to integrate a new bench-mark with a small engineering effort;
(R8) Lightweight, Fine-Grained Statistics Gathering: the abil-ity to collect detailed statistics of both client-side activity andserver-side resource utilization with minimum impact on theoverall performance;
(R9) Assisted Statistics Visualization: the ability to rendergraphs for collected statistics semi-automatically, tominimize the time-to-insight during experiments.
(R10) Repeatability and Verification: the ability to rerun exper-iments under specific circumstances to verify results, checkfor completeness and consistency.
3. THE OLTP-Bench TESTBEDThis section provides an overview of the architecture of the
OLTP-Bench testbed and discusses how it is designed to meet theidentified requirements in Section 2. OLTP-Bench works withany single-node DBMS, distributed DBMS (e.g., NewSQL), andDBaaS system that supports SQL through JDBC. Fig. 1 showsthe architecture of our framework; its two main components are(1) the client-side benchmark driver and (2) a server-side module.OLTP-Bench is written entirely in Java, including all of thebuilt-in benchmarks. The framework itself has almost no impacton the DBMS’s performance. The client-side portion is small andportable (less than 5MB, excluding workload traces and sampledata sets). The framework has been tested and deployed on avariety of Unix-like platforms.
3.1 Workload ManagerThe benchmark driver is responsible for controlling the client
workers that execute queries on the target system and gather per-formance statistics from them. The centralized Workload Man-ager reads the user-provided benchmark configuration file (“con-fig.xml”) that specifies the parameters used in the benchmark invo-cation, including the size of the connection pool (i.e., correspond-ing to the number of parallel connections), the exact compositionof the workload, the desired transaction throughput, and the dura-tion. All of these parameters are specified for each “phase” of theexperiment, enabling evolving behaviors.
At runtime, the Workload Manager instantiates one or moreWorker threads, and populates a request queue that is consumedby them. As described in Section 3.4, these threads may run onthe same node as the Workload Manager or may run on othermachines. The Workers’ request queue offers a trade-off between
278
requirements R1, R2, R3, and R4; the centralized manager notonly enables us to control the exact throughput rates and mixturesof the benchmark, but it also allows the workers to be lightweightenough to achieve good scalability. In a simple test using theYCSB benchmark with a main-memory DBMS, we were able togenerate 12.5k transactions per second per Worker thread.
The Workers connect to the target DBMS using JDBC and itera-tively pull tasks from the request queue. For each new transaction,the Worker invokes the corresponding transaction’s control code(i.e., program logic with parameterized queries) and either commitsor aborts the transaction. The Workload Manager creates requestsfor the Workers using either a synthetic load generator or from “re-playing” a pre-existing execution trace (R5). For example, for theWikipedia benchmark, we use a trace from the actual website.
3.2 Workload GenerationOLTP-Bench supports three different system models for Work-
ers to invoke transactions: (1) closed-loop, (2) open-loop, and (3)semi-open-loop [32]. Allowing users to choose which model to usein their testing enables them to explore different application scenar-ios and simulate several real-world scenarios (R2). In closed-looptesting, OLTP-Bench initializes a fixed number of Workers that re-peatedly issue transactions with a random think time between eachrequest. With the open-loop execution setting, the rate at whichrequests are invoked follows a stochastic process. Lastly, undera semi-open policy, the system acts essentially as an open-systemwith the difference that the Worker pauses for a random think timebefore submitting a new transaction. This simulates real-worldworkloads where clients do not immediately submit a new requestas soon as their previous query is answered.
In addition to the aforementioned features, OLTP-Bench canhandle dynamic changes to the number of Workers and transactionweights over the phases to allow more complex modeling.OLTP-Bench can also drive multiple benchmarks at the same timeto test the ability of a DBMS to balance the workload amongdifferent databases or multiple tenants.
3.3 SQL Dialect TranslationIn order to support multiple DBMSs in a single framework, we
developed a special sub-component, called the SQL-Dialect Man-ager, that rewrites the pre-defined queries for each transaction fromSQL-92 to the native format of the target DBMS (R6)1. Alongwith the SQL-Dialect Manager, OLTP-Bench uses a universal in-ternal catalog for each benchmark (regardless of the target DBMS)to extract additional information about the benchmark’s tables andcolumns. This allows the benchmark’s utility code and transactioncontrol code to be ported to new DBMSs with minimal effort (R7).The current version of OLTP-Bench supports a number of com-mercial systems, including MSSQL, Oracle, and DB2, as well aspopular open-source systems, such as MySQL and PostgreSQL.
3.4 Distributed ClientsIn order to saturate high-performance distributed DBMSs with
enough transaction requests, OLTP-Bench supports deployingworkers across multiple machines [17, 25]. Multiple remoteOLTP-Bench instances are spawned by the central WorkloadManager via SSH (R1). The Manager then sends commands forstarting and stopping the benchmark trial over a network socket.At the end of the benchmark run, it retrieves the results from theclient nodes and merges them into a single output file.
1More complex and non-standard SQL must be manually loaded into OLTP-Bench.We defer the problem of automatically translating SQL to the appropriate dialect asfuture work.
Class Benchmark Application Domain
Transactional
AuctionMark On-line AuctionsCH-benCHmark Mixture of OLTP and OLAPSEATS On-line Airline TicketingSmallBank Banking SystemTATP Caller Location AppTPC-C Order ProcessingVoter Talent Show Voting
Web-Oriented
Epinions Social NetworkingLinkBench Social NetworkingTwitter Social NetworkingWikipedia On-line Encyclopedia
Feature Testing
ResourceStresser Isolated Resource StresserYCSB Scalable Key-value StoreJPAB Object-Relational MappingSIBench Transactional Isolation
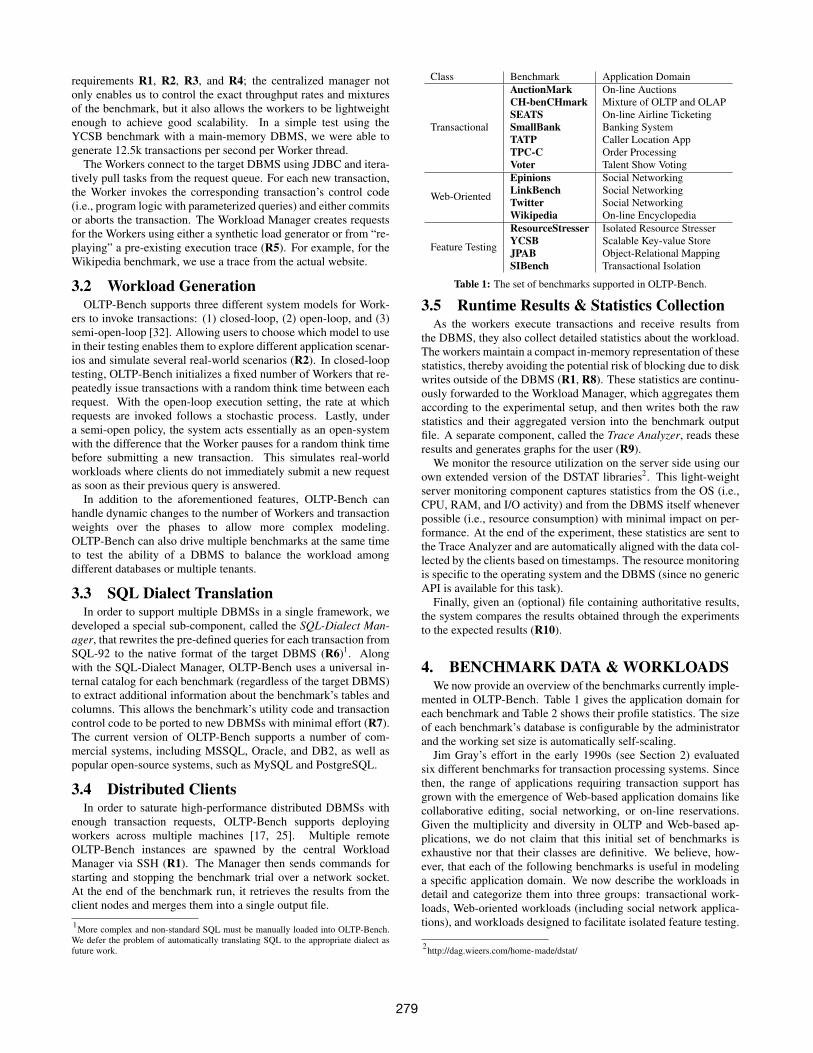
Table 1: The set of benchmarks supported in OLTP-Bench.
3.5 Runtime Results & Statistics CollectionAs the workers execute transactions and receive results from
the DBMS, they also collect detailed statistics about the workload.The workers maintain a compact in-memory representation of thesestatistics, thereby avoiding the potential risk of blocking due to diskwrites outside of the DBMS (R1, R8). These statistics are continu-ously forwarded to the Workload Manager, which aggregates themaccording to the experimental setup, and then writes both the rawstatistics and their aggregated version into the benchmark outputfile. A separate component, called the Trace Analyzer, reads theseresults and generates graphs for the user (R9).
We monitor the resource utilization on the server side using ourown extended version of the DSTAT libraries2. This light-weightserver monitoring component captures statistics from the OS (i.e.,CPU, RAM, and I/O activity) and from the DBMS itself wheneverpossible (i.e., resource consumption) with minimal impact on per-formance. At the end of the experiment, these statistics are sent tothe Trace Analyzer and are automatically aligned with the data col-lected by the clients based on timestamps. The resource monitoringis specific to the operating system and the DBMS (since no genericAPI is available for this task).
Finally, given an (optional) file containing authoritative results,the system compares the results obtained through the experimentsto the expected results (R10).
4. BENCHMARK DATA & WORKLOADSWe now provide an overview of the benchmarks currently imple-
mented in OLTP-Bench. Table 1 gives the application domain foreach benchmark and Table 2 shows their profile statistics. The sizeof each benchmark’s database is configurable by the administratorand the working set size is automatically self-scaling.
Jim Gray’s effort in the early 1990s (see Section 2) evaluatedsix different benchmarks for transaction processing systems. Sincethen, the range of applications requiring transaction support hasgrown with the emergence of Web-based application domains likecollaborative editing, social networking, or on-line reservations.Given the multiplicity and diversity in OLTP and Web-based ap-plications, we do not claim that this initial set of benchmarks isexhaustive nor that their classes are definitive. We believe, how-ever, that each of the following benchmarks is useful in modelinga specific application domain. We now describe the workloads indetail and categorize them into three groups: transactional work-loads, Web-oriented workloads (including social network applica-tions), and workloads designed to facilitate isolated feature testing.
2http://dag.wieers.com/home-made/dstat/
279
Tables Columns Indexes Txns Read-Only TxnsAuctionMark 16 125 14 9 55.0%CH-benCHmark 12 106 3 27 54.0%Epinions 5 21 10 9 50.0%JPAB 7 68 5 4 25.0%LinkBench 3 17 1 10 69.05%ResourceStresser 4 23 0 6 33.3%SEATS 10 189 5 6 45.0%SIBench 1 2 1 2 50.0%SmallBank 3 6 4 6 15.0%TATP 4 51 5 7 40.0%TPC-C 9 92 3 5 8.0%Twitter 5 18 4 5 0.9%Voter 3 9 3 1 0.0%Wikipedia 12 122 40 5 92.2%YCSB 1 11 0 6 50.0%
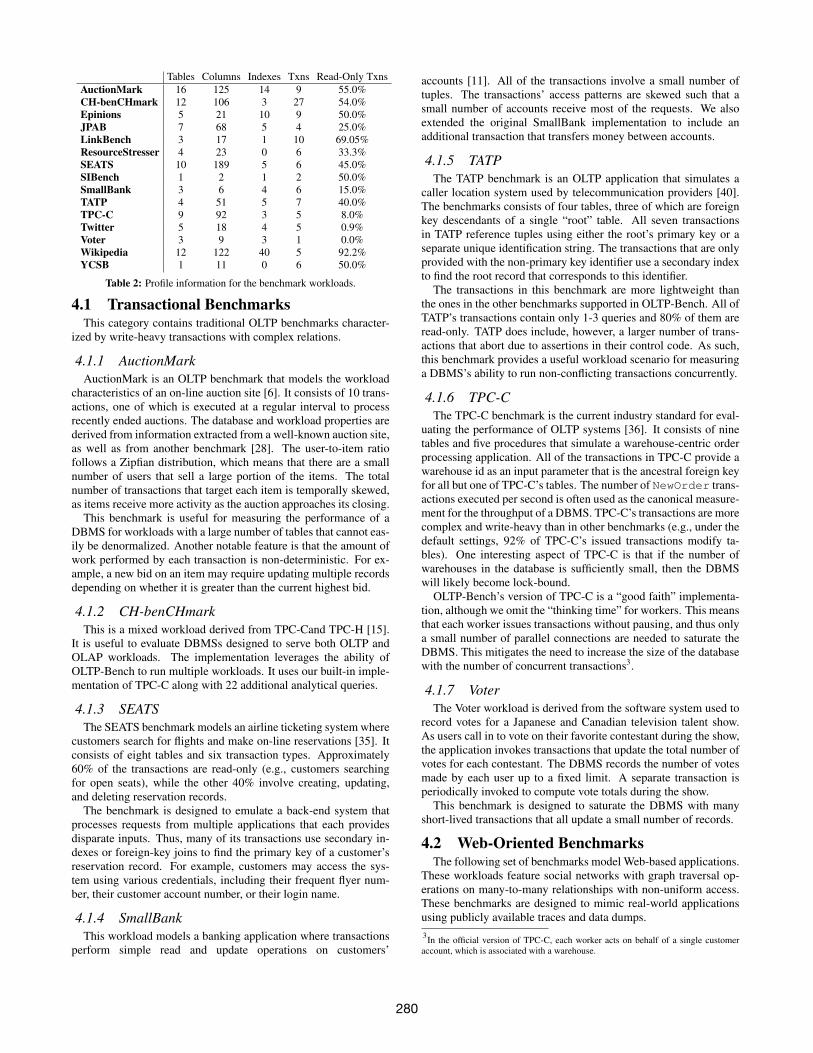
Table 2: Profile information for the benchmark workloads.
4.1 Transactional BenchmarksThis category contains traditional OLTP benchmarks character-
ized by write-heavy transactions with complex relations.
4.1.1 AuctionMarkAuctionMark is an OLTP benchmark that models the workload
characteristics of an on-line auction site [6]. It consists of 10 trans-actions, one of which is executed at a regular interval to processrecently ended auctions. The database and workload properties arederived from information extracted from a well-known auction site,as well as from another benchmark [28]. The user-to-item ratiofollows a Zipfian distribution, which means that there are a smallnumber of users that sell a large portion of the items. The totalnumber of transactions that target each item is temporally skewed,as items receive more activity as the auction approaches its closing.
This benchmark is useful for measuring the performance of aDBMS for workloads with a large number of tables that cannot eas-ily be denormalized. Another notable feature is that the amount ofwork performed by each transaction is non-deterministic. For ex-ample, a new bid on an item may require updating multiple recordsdepending on whether it is greater than the current highest bid.
4.1.2 CH-benCHmarkThis is a mixed workload derived from TPC-Cand TPC-H [15].
It is useful to evaluate DBMSs designed to serve both OLTP andOLAP workloads. The implementation leverages the ability ofOLTP-Bench to run multiple workloads. It uses our built-in imple-mentation of TPC-C along with 22 additional analytical queries.
4.1.3 SEATSThe SEATS benchmark models an airline ticketing system where
customers search for flights and make on-line reservations [35]. Itconsists of eight tables and six transaction types. Approximately60% of the transactions are read-only (e.g., customers searchingfor open seats), while the other 40% involve creating, updating,and deleting reservation records.
The benchmark is designed to emulate a back-end system thatprocesses requests from multiple applications that each providesdisparate inputs. Thus, many of its transactions use secondary in-dexes or foreign-key joins to find the primary key of a customer’sreservation record. For example, customers may access the sys-tem using various credentials, including their frequent flyer num-ber, their customer account number, or their login name.
4.1.4 SmallBankThis workload models a banking application where transactions
perform simple read and update operations on customers’
accounts [11]. All of the transactions involve a small number oftuples. The transactions’ access patterns are skewed such that asmall number of accounts receive most of the requests. We alsoextended the original SmallBank implementation to include anadditional transaction that transfers money between accounts.
4.1.5 TATPThe TATP benchmark is an OLTP application that simulates a
caller location system used by telecommunication providers [40].The benchmarks consists of four tables, three of which are foreignkey descendants of a single “root” table. All seven transactionsin TATP reference tuples using either the root’s primary key or aseparate unique identification string. The transactions that are onlyprovided with the non-primary key identifier use a secondary indexto find the root record that corresponds to this identifier.
The transactions in this benchmark are more lightweight thanthe ones in the other benchmarks supported in OLTP-Bench. All ofTATP’s transactions contain only 1-3 queries and 80% of them areread-only. TATP does include, however, a larger number of trans-actions that abort due to assertions in their control code. As such,this benchmark provides a useful workload scenario for measuringa DBMS’s ability to run non-conflicting transactions concurrently.
4.1.6 TPC-CThe TPC-C benchmark is the current industry standard for eval-
uating the performance of OLTP systems [36]. It consists of ninetables and five procedures that simulate a warehouse-centric orderprocessing application. All of the transactions in TPC-C provide awarehouse id as an input parameter that is the ancestral foreign keyfor all but one of TPC-C’s tables. The number of NewOrder trans-actions executed per second is often used as the canonical measure-ment for the throughput of a DBMS. TPC-C’s transactions are morecomplex and write-heavy than in other benchmarks (e.g., under thedefault settings, 92% of TPC-C’s issued transactions modify ta-bles). One interesting aspect of TPC-C is that if the number ofwarehouses in the database is sufficiently small, then the DBMSwill likely become lock-bound.
OLTP-Bench’s version of TPC-C is a “good faith” implementa-tion, although we omit the “thinking time” for workers. This meansthat each worker issues transactions without pausing, and thus onlya small number of parallel connections are needed to saturate theDBMS. This mitigates the need to increase the size of the databasewith the number of concurrent transactions3.
4.1.7 VoterThe Voter workload is derived from the software system used to
record votes for a Japanese and Canadian television talent show.As users call in to vote on their favorite contestant during the show,the application invokes transactions that update the total number ofvotes for each contestant. The DBMS records the number of votesmade by each user up to a fixed limit. A separate transaction isperiodically invoked to compute vote totals during the show.
This benchmark is designed to saturate the DBMS with manyshort-lived transactions that all update a small number of records.
4.2 Web-Oriented BenchmarksThe following set of benchmarks model Web-based applications.
These workloads feature social networks with graph traversal op-erations on many-to-many relationships with non-uniform access.These benchmarks are designed to mimic real-world applicationsusing publicly available traces and data dumps.3In the official version of TPC-C, each worker acts on behalf of a single customeraccount, which is associated with a warehouse.
280

4.2.1 EpinionsThis benchmark is derived from the Epinions.com consumer re-
view website. It uses data collected from a previous study [23]together with additional statistics extracted from the website. Thisworkload is centered on users interacting with other users and writ-ing reviews for various items in the database (e.g., products). Itconsists of nine different transactions, of which four interact withuser records only, four interact with item records only, and one in-teracts with all of the tables in the database. Users have both ann-to-m relationship with items (i.e., representing user reviews andratings of items) and an n-to-m relationship with users.
This workload emerged from one of the original “social network-ing” websites and thus provides an interesting challenge for rela-tional DBMSs. It is similar to the Twitter benchmark, except thatits many-to-many relationships are traversed using SQL joins (asopposed to application-side joins), and it has more complex inter-actions between its tables.
4.2.2 LinkBenchThis synthetic benchmark was developed by Facebook to eval-
uate systems running a workload similar to their MySQL produc-tion deployment [8]. The social graph is synthetically generated atconfigurable scale while keeping the properties of the real socialgraph. The workload is based on real traces of queries executed onthe production system.
4.2.3 TwitterThe Twitter workload is inspired by the popular micro-blogging
website. In order to provide a realistic benchmark, we obtainedan anonymized snapshot of the Twitter social graph from August2009 that contains 51 million users and almost 2 billion “follows”relationships [14]. We created a synthetic workload generator thatis based on an approximation of the queries/transactions needed tosupport the application functionalities as we observe them by us-ing the web site, along with information derived from a data setof 200,000 tweets. Although we do not claim that this is a preciserepresentation of Twitter’s system, it still reflects its important char-acteristics, such as heavily skewed many-to-many relationships.
4.2.4 WikipediaThis workload is based on the popular on-line encyclopedia.
Since the website’s underlying software, MediaWiki, isopen-source, we are able to use the real schema, transactions, andqueries as used in the live website. This benchmark’s workloadis derived from (1) data dumps, (2) statistical information on theread/write ratios, and (3) front-end access patterns [38] and severalpersonal email communications with the Wikipedia administrators.Although the total size of the Wikipedia database exceeds 4TB, asignificant portion of it is historical or archival data (e.g., everyarticle revision is stored in the database). Thus, the working setsize at any time is much smaller than the overall data.
We extracted and modeled the most common operations in Wiki-pedia for article and “watchlist” management. These two operationcategories account for over 99% of the actual workload executed onWikipedia’s underlying DBMS cluster. The combination of a largedatabase (including large secondary indexes), a complex schema,and the use of transactions makes this benchmark invaluable to testnovel indexing, caching, and partitioning strategies.
4.3 Feature Testing BenchmarksOLTP-Bench’s third category of benchmarks are intended to
test individual features of a system. These workloads, also known
as micro-benchmarks, are simpler and more lightweight than thebenchmarks found in the other two categories.
4.3.1 JPAB (Object Relation Mapping)Since object-relational mapping tools are often used in
DBMS-based applications, especially in enterprise settings, weported the Java Persistence API Performance Benchmark (JPAB)to our framework [1]. This workload represents a large class ofenterprise applications that have several properties that are uniqueto ORMs. For example, many ORM implementations generateunoptimized bursts of small reads in order to chase object pointers.As such, this workload can be used to test various improvements inboth the application and DBMS-level for this type of application.
4.3.2 ResourceStresserIn contrast to most of the other benchmarks in OLTP-Bench
that emulate existing systems or common application patterns, wedeveloped ResourceStresser as a purely synthetic benchmark thatcan create isolated contention on system resources. Each of thebenchmark’s transaction imposes some load on three specific re-sources: CPU, disk I/O, and locks. As an example, the CPU-intensive transactions repeatedly execute SQL encryption functionson small amounts of data. Using these transactions as buildingblocks, one can control the workload mixture in the framework tosimulate diverse kinds of applications and execution scenarios.
4.3.3 SIBenchSIBench is a microbenchamark designed to explore snapshot iso-
lation in DBMSs [12]. It contains a single key/value table and twotransactions that fetch the minimum value of a column or incrementa single value of an entry. This workload creates a situation wherethe DBMS must resolve read-write conflicts while also stressingthe CPU by scanning the table for the minimum value.
4.3.4 YCSBThe Yahoo! Cloud Serving Benchmark (YCSB) is a collection
of micro-benchmarks that represent data management applicationswhose workload is simple but requires high scalability [16]. Suchapplications are often large-scale services created by Web-basedcompanies. Although these services are often deployed using dis-tributed key/value storage systems, this benchmark can also pro-vide insight into the capabilities of traditional DBMSs.
The YCSB workload contains various combinations ofread/write operations and access distributions that match productsinside Yahoo! It is representative of simple key-value store appli-cations. The benchmark has been leveraged in previous studies forexploiting the trade-offs between availability/consistency/partitiontolerance, and more generally to showcase storage engines andcaching results (e.g., improving the throughput of random writes).
5. EXPERIMENTAL DEPLOYMENTWe now turn to two series of experiments that we performed to
demonstrate the capabilities of OLTP-Bench. In Section 6, we firstshowcase the key features of the OLTP-Bench testbed and demon-strate the relevance of the workloads we have implemented. Wethen present experiments on DBaaS systems in Section 7 that ex-amine the variance in service quality, and the metrics that OLTP-Bench computes. We also use OLTP-Bench to evaluate the DBaaSswith respect to price and instance selection for a given scenario. Weuse a total of three different DBaaS offerings from two differentvendors: two from Amazon’s RDS and the other from Microsoft’sSQL Azure platform. Due to the commercial license agreementsfor both vendors, we anonymize the service names in this section
281
0 100 200 300 400 500 600 7000
500
1000
1500
2000
time (sec)
thro
ughp
ut (t
ps)
0 100 200 300 400 500 600 7000
500
1000
1500
time (sec)
late
ncy
(ms)
500
525
throughput
95th %ile latency
(a) Throughput0 100 200 300 400 500 600 700
0
500
1000
1500
2000
time (sec)
thro
ughp
ut (t
ps)
0 100 200 300 400 500 600 7000
500
1000
1500
time (sec)
late
ncy
(ms)
500
525
throughput
95th %ile latency
(b) Latency
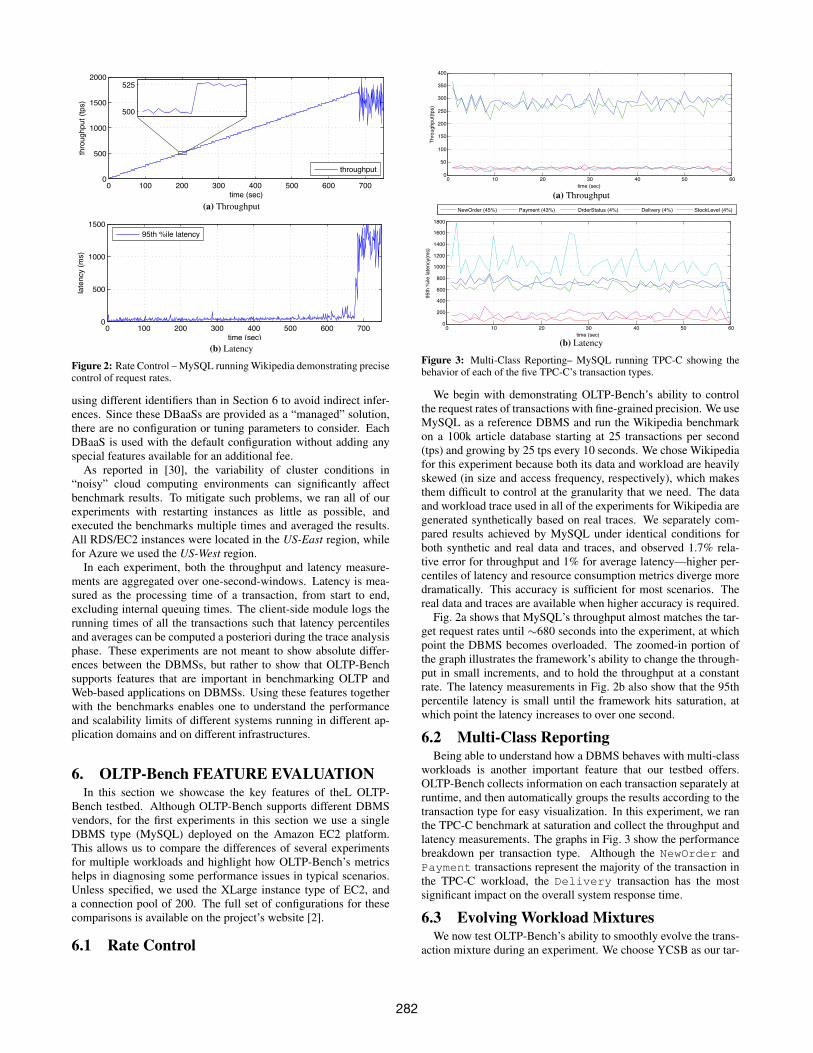
Figure 2: Rate Control – MySQL running Wikipedia demonstrating precisecontrol of request rates.
using different identifiers than in Section 6 to avoid indirect infer-ences. Since these DBaaSs are provided as a “managed” solution,there are no configuration or tuning parameters to consider. EachDBaaS is used with the default configuration without adding anyspecial features available for an additional fee.
As reported in [30], the variability of cluster conditions in“noisy” cloud computing environments can significantly affectbenchmark results. To mitigate such problems, we ran all of ourexperiments with restarting instances as little as possible, andexecuted the benchmarks multiple times and averaged the results.All RDS/EC2 instances were located in the US-East region, whilefor Azure we used the US-West region.
In each experiment, both the throughput and latency measure-ments are aggregated over one-second-windows. Latency is mea-sured as the processing time of a transaction, from start to end,excluding internal queuing times. The client-side module logs therunning times of all the transactions such that latency percentilesand averages can be computed a posteriori during the trace analysisphase. These experiments are not meant to show absolute differ-ences between the DBMSs, but rather to show that OLTP-Benchsupports features that are important in benchmarking OLTP andWeb-based applications on DBMSs. Using these features togetherwith the benchmarks enables one to understand the performanceand scalability limits of different systems running in different ap-plication domains and on different infrastructures.
6. OLTP-Bench FEATURE EVALUATIONIn this section we showcase the key features of theL OLTP-
Bench testbed. Although OLTP-Bench supports different DBMSvendors, for the first experiments in this section we use a singleDBMS type (MySQL) deployed on the Amazon EC2 platform.This allows us to compare the differences of several experimentsfor multiple workloads and highlight how OLTP-Bench’s metricshelps in diagnosing some performance issues in typical scenarios.Unless specified, we used the XLarge instance type of EC2, anda connection pool of 200. The full set of configurations for thesecomparisons is available on the project’s website [2].
6.1 Rate Control
0 10 20 30 40 50 600
50
100
150
200
250
300
350
400
time (sec)
Thro
ughp
ut(tp
s)
(a) Throughput
0 10 20 30 40 50 600
200
400
600
800
1000
1200
1400
1600
1800
time (sec)
95th
%ile
late
ncy(
ms)
(b) Latency
NewOrder (45%) Payment (43%) OrderStatus (4%) Delivery (4%) StockLevel (4%)(a) Throughput0 10 20 30 40 50 600
50
100
150
200
250
300
350
400
time (sec)
Thro
ughp
ut(tp
s)
(a) Throughput
0 10 20 30 40 50 600
200
400
600
800
1000
1200
1400
1600
1800
time (sec)
95th
%ile
late
ncy(
ms)
(b) Latency
NewOrder (45%) Payment (43%) OrderStatus (4%) Delivery (4%) StockLevel (4%)
0 10 20 30 40 50 600
50
100
150
200
250
300
350
400
time (sec)
Thro
ughp
ut(tp
s)
(a) Throughput
0 10 20 30 40 50 600
200
400
600
800
1000
1200
1400
1600
1800
time (sec)
95th
%ile
late
ncy(
ms)
(b) Latency
NewOrder (45%) Payment (43%) OrderStatus (4%) Delivery (4%) StockLevel (4%)
(b) Latency
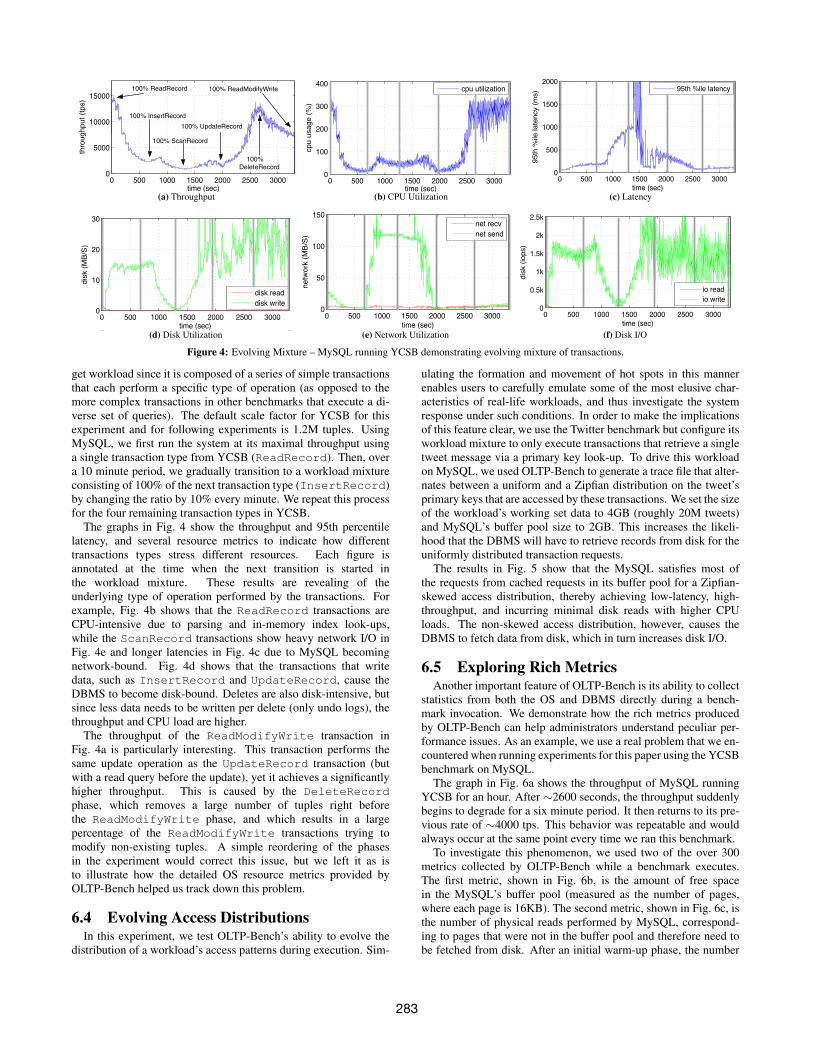
Figure 3: Multi-Class Reporting– MySQL running TPC-C showing thebehavior of each of the five TPC-C’s transaction types.
We begin with demonstrating OLTP-Bench’s ability to controlthe request rates of transactions with fine-grained precision. We useMySQL as a reference DBMS and run the Wikipedia benchmarkon a 100k article database starting at 25 transactions per second(tps) and growing by 25 tps every 10 seconds. We chose Wikipediafor this experiment because both its data and workload are heavilyskewed (in size and access frequency, respectively), which makesthem difficult to control at the granularity that we need. The dataand workload trace used in all of the experiments for Wikipedia aregenerated synthetically based on real traces. We separately com-pared results achieved by MySQL under identical conditions forboth synthetic and real data and traces, and observed 1.7% rela-tive error for throughput and 1% for average latency—higher per-centiles of latency and resource consumption metrics diverge moredramatically. This accuracy is sufficient for most scenarios. Thereal data and traces are available when higher accuracy is required.
Fig. 2a shows that MySQL’s throughput almost matches the tar-get request rates until ∼680 seconds into the experiment, at whichpoint the DBMS becomes overloaded. The zoomed-in portion ofthe graph illustrates the framework’s ability to change the through-put in small increments, and to hold the throughput at a constantrate. The latency measurements in Fig. 2b also show that the 95thpercentile latency is small until the framework hits saturation, atwhich point the latency increases to over one second.
6.2 Multi-Class ReportingBeing able to understand how a DBMS behaves with multi-class
workloads is another important feature that our testbed offers.OLTP-Bench collects information on each transaction separately atruntime, and then automatically groups the results according to thetransaction type for easy visualization. In this experiment, we ranthe TPC-C benchmark at saturation and collect the throughput andlatency measurements. The graphs in Fig. 3 show the performancebreakdown per transaction type. Although the NewOrder andPayment transactions represent the majority of the transaction inthe TPC-C workload, the Delivery transaction has the mostsignificant impact on the overall system response time.
6.3 Evolving Workload MixturesWe now test OLTP-Bench’s ability to smoothly evolve the trans-
action mixture during an experiment. We choose YCSB as our tar-
282
0 500 1000 1500 2000 2500 30000
5000
10000
15000
thro
ughp
ut (t
ps)
throughput
0 500 1000 1500 2000 2500 30000
500
1000
1500
2000
time (sec)
95th
%ile
late
ncy
(ms)
95th %ile latency
0 500 1000 1500 2000 2500 30000
100
200
300
400
cpu
usag
e (%
)
cpu utilization
0 500 1000 1500 2000 2500 30000
10
20
30
disk
(MB/
S)
disk readdisk write
0 500 1000 1500 2000 2500 30000
0.5k
1k
1.5k
2k
2.5k
time (sec)
disk
(iop
s)
io readio write
0 500 1000 1500 2000 2500 30000
50
100
150
time (sec)ne
twor
k (M
B/S)
net recvnet send
100% ReadRecord
100% InsertRecord
100% ScanRecord
100% DeleteRecord
100% ReadModifyWrite
100% UpdateRecord
time (sec) time (sec) time (sec)(a) Throughput
0 500 1000 1500 2000 2500 30000
5000
10000
15000th
roug
hput
(tps
)
throughput
0 500 1000 1500 2000 2500 30000
500
1000
1500
2000
time (sec)
95th
%ile
late
ncy
(ms)
95th %ile latency
0 500 1000 1500 2000 2500 30000
100
200
300
400
cpu
usag
e (%
)
cpu utilization
0 500 1000 1500 2000 2500 30000
10
20
30
disk
(MB/
S)
disk readdisk write
0 500 1000 1500 2000 2500 30000
0.5k
1k
1.5k
2k
2.5k
time (sec)
disk
(iop
s)
io readio write
0 500 1000 1500 2000 2500 30000
50
100
150
time (sec)ne
twor
k (M
B/S)
net recvnet send
100% ReadRecord
100% InsertRecord
100% ScanRecord
100% DeleteRecord
100% ReadModifyWrite
100% UpdateRecord
time (sec) time (sec) time (sec)(b) CPU Utilization
0 500 1000 1500 2000 2500 30000
5000
10000
15000
thro
ughp
ut (t
ps)
throughput
0 500 1000 1500 2000 2500 30000
500
1000
1500
2000
time (sec)
95th
%ile
late
ncy
(ms)
95th %ile latency
0 500 1000 1500 2000 2500 30000
100
200
300
400
cpu
usag
e (%
)
cpu utilization
0 500 1000 1500 2000 2500 30000
10
20
30
disk
(MB/
S)
disk readdisk write
0 500 1000 1500 2000 2500 30000
0.5k
1k
1.5k
2k
2.5k
time (sec)
disk
(iop
s)
io readio write
0 500 1000 1500 2000 2500 30000
50
100
150
time (sec)
netw
ork
(MB/
S)
net recvnet send
100% ReadRecord
100% InsertRecord
100% ScanRecord
100% DeleteRecord
100% ReadModifyWrite
100% UpdateRecord
(c) Latency
0 500 1000 1500 2000 2500 30000
5000
10000
15000
thro
ughp
ut (t
ps)
throughput
0 500 1000 1500 2000 2500 30000
500
1000
1500
2000
time (sec)
95th
%ile
late
ncy
(ms)
95th %ile latency
0 500 1000 1500 2000 2500 30000
100
200
300
400
cpu
usag
e (%
)
cpu utilization
0 500 1000 1500 2000 2500 30000
10
20
30
disk
(MB/
S)
disk readdisk write
0 500 1000 1500 2000 2500 30000
0.5k
1k
1.5k
2k
2.5k
time (sec)
disk
(iop
s)
io readio write
0 500 1000 1500 2000 2500 30000
50
100
150
time (sec)
netw
ork
(MB/
S)
net recvnet send
100% ReadRecord
100% InsertRecord
100% ScanRecord
100% DeleteRecord
100% ReadModifyWrite
100% UpdateRecord
time (sec) time (sec) time (sec)(d) Disk Utilization
0 500 1000 1500 2000 2500 30000
5000
10000
15000
thro
ughp
ut (t
ps)
throughput
0 500 1000 1500 2000 2500 30000
500
1000
1500
2000
time (sec)
95th
%ile
late
ncy
(ms)
95th %ile latency
0 500 1000 1500 2000 2500 30000
100
200
300
400
cpu
usag
e (%
)
cpu utilization
0 500 1000 1500 2000 2500 30000
10
20
30
disk
(MB/
S)
disk readdisk write
0 500 1000 1500 2000 2500 30000
0.5k
1k
1.5k
2k
2.5k
time (sec)
disk
(iop
s)
io readio write
0 500 1000 1500 2000 2500 30000
50
100
150
time (sec)
netw
ork
(MB/
S)
net recvnet send
100% ReadRecord
100% InsertRecord
100% ScanRecord
100% DeleteRecord
100% ReadModifyWrite
100% UpdateRecord
(e) Network Utilization
0 500 1000 1500 2000 2500 30000
5000
10000
15000
thro
ughp
ut (t
ps)
throughput
0 500 1000 1500 2000 2500 30000
500
1000
1500
2000
time (sec)
95th
%ile
late
ncy
(ms)
95th %ile latency
0 500 1000 1500 2000 2500 30000
100
200
300
400
cpu
usag
e (%
)
cpu utilization
0 500 1000 1500 2000 2500 30000
10
20
30
disk
(MB/
S)
disk readdisk write
0 500 1000 1500 2000 2500 30000
0.5k
1k
1.5k
2k
2.5k
time (sec)
disk
(iop
s)
io readio write
0 500 1000 1500 2000 2500 30000
50
100
150
time (sec)ne
twor
k (M
B/S)
net recvnet send
100% ReadRecord
100% InsertRecord
100% ScanRecord
100% DeleteRecord
100% ReadModifyWrite
100% UpdateRecord
(f) Disk I/O
Figure 4: Evolving Mixture – MySQL running YCSB demonstrating evolving mixture of transactions.
get workload since it is composed of a series of simple transactionsthat each perform a specific type of operation (as opposed to themore complex transactions in other benchmarks that execute a di-verse set of queries). The default scale factor for YCSB for thisexperiment and for following experiments is 1.2M tuples. UsingMySQL, we first run the system at its maximal throughput usinga single transaction type from YCSB (ReadRecord). Then, overa 10 minute period, we gradually transition to a workload mixtureconsisting of 100% of the next transaction type (InsertRecord)by changing the ratio by 10% every minute. We repeat this processfor the four remaining transaction types in YCSB.
The graphs in Fig. 4 show the throughput and 95th percentilelatency, and several resource metrics to indicate how differenttransactions types stress different resources. Each figure isannotated at the time when the next transition is started inthe workload mixture. These results are revealing of theunderlying type of operation performed by the transactions. Forexample, Fig. 4b shows that the ReadRecord transactions areCPU-intensive due to parsing and in-memory index look-ups,while the ScanRecord transactions show heavy network I/O inFig. 4e and longer latencies in Fig. 4c due to MySQL becomingnetwork-bound. Fig. 4d shows that the transactions that writedata, such as InsertRecord and UpdateRecord, cause theDBMS to become disk-bound. Deletes are also disk-intensive, butsince less data needs to be written per delete (only undo logs), thethroughput and CPU load are higher.
The throughput of the ReadModifyWrite transaction inFig. 4a is particularly interesting. This transaction performs thesame update operation as the UpdateRecord transaction (butwith a read query before the update), yet it achieves a significantlyhigher throughput. This is caused by the DeleteRecordphase, which removes a large number of tuples right beforethe ReadModifyWrite phase, and which results in a largepercentage of the ReadModifyWrite transactions trying tomodify non-existing tuples. A simple reordering of the phasesin the experiment would correct this issue, but we left it as isto illustrate how the detailed OS resource metrics provided byOLTP-Bench helped us track down this problem.
6.4 Evolving Access DistributionsIn this experiment, we test OLTP-Bench’s ability to evolve the
distribution of a workload’s access patterns during execution. Sim-
ulating the formation and movement of hot spots in this mannerenables users to carefully emulate some of the most elusive char-acteristics of real-life workloads, and thus investigate the systemresponse under such conditions. In order to make the implicationsof this feature clear, we use the Twitter benchmark but configure itsworkload mixture to only execute transactions that retrieve a singletweet message via a primary key look-up. To drive this workloadon MySQL, we used OLTP-Bench to generate a trace file that alter-nates between a uniform and a Zipfian distribution on the tweet’sprimary keys that are accessed by these transactions. We set the sizeof the workload’s working set data to 4GB (roughly 20M tweets)and MySQL’s buffer pool size to 2GB. This increases the likeli-hood that the DBMS will have to retrieve records from disk for theuniformly distributed transaction requests.
The results in Fig. 5 show that the MySQL satisfies most ofthe requests from cached requests in its buffer pool for a Zipfian-skewed access distribution, thereby achieving low-latency, high-throughput, and incurring minimal disk reads with higher CPUloads. The non-skewed access distribution, however, causes theDBMS to fetch data from disk, which in turn increases disk I/O.
6.5 Exploring Rich MetricsAnother important feature of OLTP-Bench is its ability to collect
statistics from both the OS and DBMS directly during a bench-mark invocation. We demonstrate how the rich metrics producedby OLTP-Bench can help administrators understand peculiar per-formance issues. As an example, we use a real problem that we en-countered when running experiments for this paper using the YCSBbenchmark on MySQL.
The graph in Fig. 6a shows the throughput of MySQL runningYCSB for an hour. After ∼2600 seconds, the throughput suddenlybegins to degrade for a six minute period. It then returns to its pre-vious rate of ∼4000 tps. This behavior was repeatable and wouldalways occur at the same point every time we ran this benchmark.
To investigate this phenomenon, we used two of the over 300metrics collected by OLTP-Bench while a benchmark executes.The first metric, shown in Fig. 6b, is the amount of free spacein the MySQL’s buffer pool (measured as the number of pages,where each page is 16KB). The second metric, shown in Fig. 6c, isthe number of physical reads performed by MySQL, correspond-ing to pages that were not in the buffer pool and therefore need tobe fetched from disk. After an initial warm-up phase, the number
283

0
5k
10k
15kth
roug
hput
(tps
)
0
1000
2000
95th
%ile
late
ncy
(ms)
0
200
400
cpu
usag
e (%
)
0
2
4
6
8
disk
(MB/
S)
disk readdisk write
0 200 400 600 800 1000 1200 1400 1600 1800 20000
200
400
time (sec)
disk
(iop
s)
io readio write
Zipfianuniform uniform Zipfian
Figure 5: Evolving Access Distributions – MySQL running Twitter alter-nating random reads with uniform and Zipfian distributions.
of page reads is close to zero; this indicates that the benchmark’sworking set fits entirely in memory. After 2600 seconds, however,the graph in Fig. 6b shows that MySQL runs out of empty pagesin the buffer pool and therefore must evict pages to accommodatenew data. Since many pages get evicted all at once, it is likely thatMySQL chooses to free up non-dirty pages (which can be droppedwithout a disk write) rather than pushing dirty pages to disk. As aresult, the pages needed for new transactions are now only avail-able from disk, which explains the increase in page reads shown inFig. 6c. Eventually, the algorithms governing the eviction and thosecontrolling dirty-pages write-backs converge to a more stable state,in which MySQL maintains the load effectively. The availabilityof a large variety of metrics and data, such as those automaticallycaptured by OLTP-Bench, is invaluable when looking into specificissues like the one described above.
6.6 MultitenancyWe next use OLTP-Bench’s ability to support multiple bench-
marks simultaneously to explore how well MySQL is able to han-dle multiple workloads within the same DBMS instance. Such de-ployments are common in shared-hosting and virtualized environ-ments. We execute the TATP, TPC-C, and Wikipedia benchmarkssimultaneously and measure how well the system is able to handlethe concurrent workloads. These benchmarks were chosen becausethey each have different characteristics.
We first load the three benchmarks’ data sets into the targetDBMS. We then start all three benchmark clients simultaneouslyrunning at throttled speeds: TATP at 5000 tps, TPC-C at 10 tps,and Wikipedia at 500 tps. These numbers were chosen fromprevious experiments showing that the three DBMSs were ableto handle such workloads without becoming overloaded. Afterfive minutes, we increase the requested throughput for TPC-C topush the DBMS to become disk-bound (due to the large numberof writes in TPC-C), and observe the impact on the other twobenchmarks before going back to the initial setting. Although wedid not expect that each workload would be fully isolated from the
0 500 1000 1500 2000 2500 3000 35000
1000
2000
3000
4000
5000
thro
ughp
ut (t
ps)
throughput
0 500 1000 1500 2000 2500 3000 35000
100k200k300k400k500k
free
buffe
rpoo
l (#p
ages
)
Innodb free bufferpool
0 500 1000 1500 2000 2500 3000 35000
50
100
150
time (sec)
inno
db p
hysi
cal r
eads
(#)
Innodb physical reads
Runs-out of free pages
Fetches from diskevicted pages
time (sec)
time (sec)(a) Throughput
0 500 1000 1500 2000 2500 3000 35000
1000
2000
3000
4000
5000
thro
ughp
ut (t
ps)
throughput
0 500 1000 1500 2000 2500 3000 35000
100k200k300k400k500k
free
buffe
rpoo
l (#p
ages
)
Innodb free bufferpool
0 500 1000 1500 2000 2500 3000 35000
50
100
150
time (sec)in
nodb
phy
sica
l rea
ds (#
)
Innodb physical reads
Runs-out of free pages
Fetches from diskevicted pages
time (sec)
time (sec)
(b) Number of Free Buffer Pool Pages
0 500 1000 1500 2000 2500 3000 35000
1000
2000
3000
4000
5000
thro
ughp
ut (t
ps)
throughput
0 500 1000 1500 2000 2500 3000 35000
100k200k300k400k500k
free
buffe
rpoo
l (#p
ages
)
Innodb free bufferpool
0 500 1000 1500 2000 2500 3000 35000
50
100
150
time (sec)in
nodb
phy
sica
l rea
ds (#
)
Innodb physical reads
Runs-out of free pages
Fetches from diskevicted pages
time (sec)
time (sec)
(c) Number of Physical Reads
Figure 6: Exploring Rich Metrics – MySQL running YCSB leveragingDBMS metrics to investigate an unexpected performance drop.
effects of the other workloads, we wanted to observe the degree offairness in each system’s scheduler and the extent to which eachworkload is throttled.
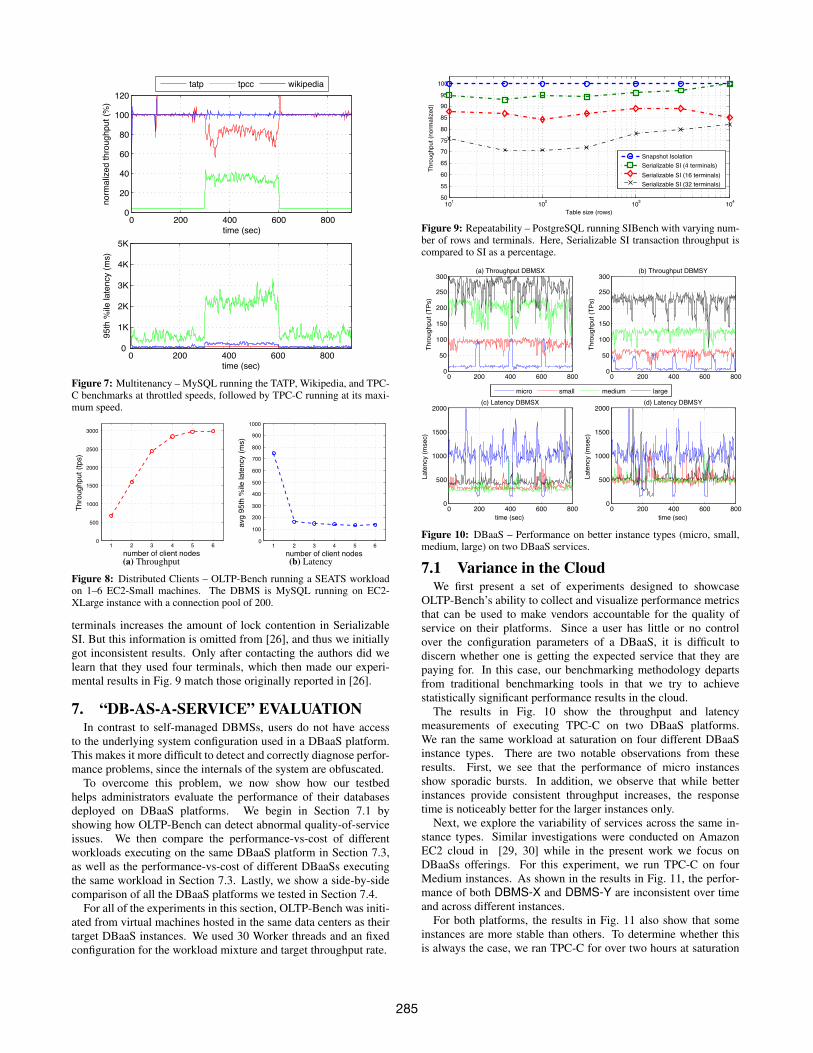
As shown in Fig. 7, MySQL sustains this combined workload el-egantly in the first part of the experiment, fully serving the requestrates imposed by the clients (normalized for the sake of presenta-tion). MySQL provides good performance overall, albeit in a moreskewed way, since Wikipedia is only slightly affected but TATP’sthroughput is reduced by 20%.
6.7 Distributed ClientsWe demonstrate how OLTP-Bench can run multiple clients
in parallel to overcome any client side bottleneck that mighthinder the full exploitation of the server. We used the SEATSbenchmark deployed in MySQL. We configured OLTP-Bench touse a fixed pool of 200 Worker threads that were deployed onEC2 Small instances. For each trial, we increase the number ofclient instances and evenly assign the Workers among them. Theresults in Fig. 8 show that using a single client machine achievesthe lowest throughput and highest latency (for this benchmark).By distributing the client-side computation workload on moremachines, we improve the overall throughput until reaching thesaturated throughput of the server at five client instances.
6.8 RepeatabilityLastly, we demonstrate how OLTP-Bench can be used to validate
or refute previous experimental results. Repeatability is difficult ifthe testbed is not publicly available, configuration parameters werenot reported, or the hardware is difficult to acquire (e.g., outdated,expensive). We ran the SIBench workload with a hardware settingsimilar to the one used in [26]. Fig. 9 shows a comparison betweenSnapshot Isolation (SI) [26] versus the Serializable SI introducedin PostgreSQL v9.1. As previously reported in [12], the number of
284
0 200 400 600 8000
20
40
60
80
100
120
time (sec)
norm
aliz
ed th
roug
hput
(%)
tatp tpcc wikipedia
0 200 400 600 800 0
1K
2K
3K
4K
5K
time (sec)
95th
%ile
late
ncy
(ms)
0 200 400 600 8000
20
40
60
80
100
120
time (sec)
norm
aliz
ed th
roug
hput
(%)
tatp tpcc wikipedia
0 200 400 600 800 0
1K
2K
3K
4K
5K
time (sec)
95th
%ile
late
ncy
(ms)
0 200 400 600 8000
20
40
60
80
100
120
time (sec)
norm
aliz
ed th
roug
hput
(%)
tatp tpcc wikipedia
0 200 400 600 800 0
1K
2K
3K
4K
5K
time (sec)
95th
%ile
late
ncy
(ms)
MySQL DBMS-X DBMS-Y
Figure 7: Multitenancy – MySQL running the TATP, Wikipedia, and TPC-C benchmarks at throttled speeds, followed by TPC-C running at its maxi-mum speed.
1 2 3 4 5 60
500
1000
1500
2000
2500
3000
number of client nodes
Thro
ughp
ut (t
ps)
1 2 3 4 5 60
100
200
300
400
500
600
700
800
900
1000
number of client nodes
avg
95th
%ile
late
ncy
(ms)
(a) Throughput
1 2 3 4 5 60
500
1000
1500
2000
2500
3000
number of client nodes
Thro
ughp
ut (t
ps)
1 2 3 4 5 60
100
200
300
400
500
600
700
800
900
1000
number of client nodes
avg
95th
%ile
late
ncy
(ms)
(b) Latency
Figure 8: Distributed Clients – OLTP-Bench running a SEATS workloadon 1–6 EC2-Small machines. The DBMS is MySQL running on EC2-XLarge instance with a connection pool of 200.
terminals increases the amount of lock contention in SerializableSI. But this information is omitted from [26], and thus we initiallygot inconsistent results. Only after contacting the authors did welearn that they used four terminals, which then made our experi-mental results in Fig. 9 match those originally reported in [26].
7. “DB-AS-A-SERVICE” EVALUATIONIn contrast to self-managed DBMSs, users do not have access
to the underlying system configuration used in a DBaaS platform.This makes it more difficult to detect and correctly diagnose perfor-mance problems, since the internals of the system are obfuscated.
To overcome this problem, we now show how our testbedhelps administrators evaluate the performance of their databasesdeployed on DBaaS platforms. We begin in Section 7.1 byshowing how OLTP-Bench can detect abnormal quality-of-serviceissues. We then compare the performance-vs-cost of differentworkloads executing on the same DBaaS platform in Section 7.3,as well as the performance-vs-cost of different DBaaSs executingthe same workload in Section 7.3. Lastly, we show a side-by-sidecomparison of all the DBaaS platforms we tested in Section 7.4.
For all of the experiments in this section, OLTP-Bench was initi-ated from virtual machines hosted in the same data centers as theirtarget DBaaS instances. We used 30 Worker threads and an fixedconfiguration for the workload mixture and target throughput rate.
101 102 103 10450
55
60
65
7075
80
85
9095
100
Table size (rows)
Thro
ughp
ut (n
orm
aliz
ed)
Snapshot IsolationSerializable SI (4 terminals)Serializable SI (16 terminals)Serializable SI (32 terminals)
Figure 9: Repeatability – PostgreSQL running SIBench with varying num-ber of rows and terminals. Here, Serializable SI transaction throughput iscompared to SI as a percentage.
0 200 400 600 8000
50
100
150
200
250
300
Thro
ughp
ut (T
Ps)
(a) Throughput DBMSX
micro small medium large
0 200 400 600 8000
500
1000
1500
2000
time (sec)
Late
ncy
(mse
c)
(c) Latency DBMSX
0 200 400 600 8000
50
100
150
200
250
300
Thro
ughp
ut (T
Ps)
(b) Throughput DBMSY
0 200 400 600 8000
500
1000
1500
2000
time (sec)
Late
ncy
(mse
c)
(d) Latency DBMSY
Figure 10: DBaaS – Performance on better instance types (micro, small,medium, large) on two DBaaS services.
7.1 Variance in the CloudWe first present a set of experiments designed to showcase
OLTP-Bench’s ability to collect and visualize performance metricsthat can be used to make vendors accountable for the quality ofservice on their platforms. Since a user has little or no controlover the configuration parameters of a DBaaS, it is difficult todiscern whether one is getting the expected service that they arepaying for. In this case, our benchmarking methodology departsfrom traditional benchmarking tools in that we try to achievestatistically significant performance results in the cloud.
The results in Fig. 10 show the throughput and latencymeasurements of executing TPC-C on two DBaaS platforms.We ran the same workload at saturation on four different DBaaSinstance types. There are two notable observations from theseresults. First, we see that the performance of micro instancesshow sporadic bursts. In addition, we observe that while betterinstances provide consistent throughput increases, the responsetime is noticeably better for the larger instances only.
Next, we explore the variability of services across the same in-stance types. Similar investigations were conducted on AmazonEC2 cloud in [29, 30] while in the present work we focus onDBaaSs offerings. For this experiment, we run TPC-C on fourMedium instances. As shown in the results in Fig. 11, the perfor-mance of both DBMS-X and DBMS-Y are inconsistent over timeand across different instances.
For both platforms, the results in Fig. 11 also show that someinstances are more stable than others. To determine whether thisis always the case, we ran TPC-C for over two hours at saturation
285
0 100 200 300 400 500 600 700 8000
50
100
150
200
250
300
350
time (sec)
Thro
ughp
ut (T
Ps)
0 100 200 300 400 500 600 700 8000
200
400
600
800
1000
time (sec)
Late
ncy
(mse
c)
Instance1 Instance2 Instance3 Instance4
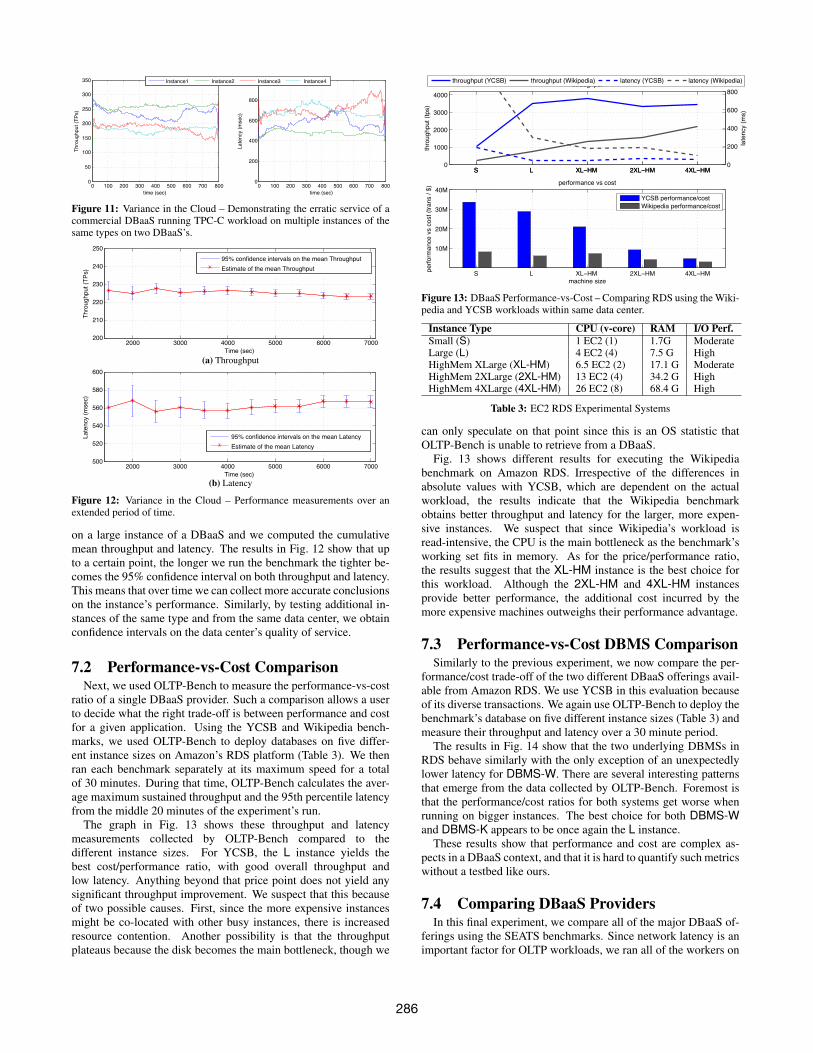
Figure 11: Variance in the Cloud – Demonstrating the erratic service of acommercial DBaaS running TPC-C workload on multiple instances of thesame types on two DBaaS’s.
2000 3000 4000 5000 6000 7000200
210
220
230
240
250
Time (sec)
Thro
ughp
ut (T
Ps)
95% confidence intervals on the mean ThroughputEstimate of the mean Throughput
2000 3000 4000 5000 6000 7000500
520
540
560
580
600
Time (sec)
Late
ncy
(mse
c)
95% confidence intervals on the mean LatencyEstimate of the mean Latency
(a) Throughput
2000 3000 4000 5000 6000 7000200
210
220
230
240
250
Time (sec)
Thro
ughp
ut (T
Ps)
95% confidence intervals on the mean ThroughputEstimate of the mean Throughput
2000 3000 4000 5000 6000 7000500
520
540
560
580
600
Time (sec)
Late
ncy
(mse
c)
95% confidence intervals on the mean LatencyEstimate of the mean Latency
(b) Latency
Figure 12: Variance in the Cloud – Performance measurements over anextended period of time.
on a large instance of a DBaaS and we computed the cumulativemean throughput and latency. The results in Fig. 12 show that upto a certain point, the longer we run the benchmark the tighter be-comes the 95% confidence interval on both throughput and latency.This means that over time we can collect more accurate conclusionson the instance’s performance. Similarly, by testing additional in-stances of the same type and from the same data center, we obtainconfidence intervals on the data center’s quality of service.
7.2 Performance-vs-Cost ComparisonNext, we used OLTP-Bench to measure the performance-vs-cost
ratio of a single DBaaS provider. Such a comparison allows a userto decide what the right trade-off is between performance and costfor a given application. Using the YCSB and Wikipedia bench-marks, we used OLTP-Bench to deploy databases on five differ-ent instance sizes on Amazon’s RDS platform (Table 3). We thenran each benchmark separately at its maximum speed for a totalof 30 minutes. During that time, OLTP-Bench calculates the aver-age maximum sustained throughput and the 95th percentile latencyfrom the middle 20 minutes of the experiment’s run.
The graph in Fig. 13 shows these throughput and latencymeasurements collected by OLTP-Bench compared to thedifferent instance sizes. For YCSB, the L instance yields thebest cost/performance ratio, with good overall throughput andlow latency. Anything beyond that price point does not yield anysignificant throughput improvement. We suspect that this becauseof two possible causes. First, since the more expensive instancesmight be co-located with other busy instances, there is increasedresource contention. Another possibility is that the throughputplateaus because the disk becomes the main bottleneck, though we
S L XL−HM 2XL−HM 4XL−HM0
1000
2000
3000
4000throughput
thro
ughp
ut (t
ps)
S L XL−HM 2XL−HM 4XL−HM0
200
400
600
800
late
ncy
(ms)
throughput (YCSB) throughput (Wikipedia) latency (YCSB) latency (Wikipedia)
ycsb RDS price−performance
S L XL−HM 2XL−HM 4XL−HM
10M
20M
30M
40Mperformance vs cost
machine size
perfo
rman
ce v
s co
st (t
rans
/ $)
YCSB performance/costWikipedia performance/cost
Figure 13: DBaaS Performance-vs-Cost – Comparing RDS using the Wiki-pedia and YCSB workloads within same data center.
Instance Type CPU (v-core) RAM I/O Perf.Small (S) 1 EC2 (1) 1.7G ModerateLarge (L) 4 EC2 (4) 7.5 G HighHighMem XLarge (XL-HM) 6.5 EC2 (2) 17.1 G ModerateHighMem 2XLarge (2XL-HM) 13 EC2 (4) 34.2 G HighHighMem 4XLarge (4XL-HM) 26 EC2 (8) 68.4 G High
Table 3: EC2 RDS Experimental Systems
can only speculate on that point since this is an OS statistic thatOLTP-Bench is unable to retrieve from a DBaaS.
Fig. 13 shows different results for executing the Wikipediabenchmark on Amazon RDS. Irrespective of the differences inabsolute values with YCSB, which are dependent on the actualworkload, the results indicate that the Wikipedia benchmarkobtains better throughput and latency for the larger, more expen-sive instances. We suspect that since Wikipedia’s workload isread-intensive, the CPU is the main bottleneck as the benchmark’sworking set fits in memory. As for the price/performance ratio,the results suggest that the XL-HM instance is the best choice forthis workload. Although the 2XL-HM and 4XL-HM instancesprovide better performance, the additional cost incurred by themore expensive machines outweighs their performance advantage.
7.3 Performance-vs-Cost DBMS ComparisonSimilarly to the previous experiment, we now compare the per-
formance/cost trade-off of the two different DBaaS offerings avail-able from Amazon RDS. We use YCSB in this evaluation becauseof its diverse transactions. We again use OLTP-Bench to deploy thebenchmark’s database on five different instance sizes (Table 3) andmeasure their throughput and latency over a 30 minute period.
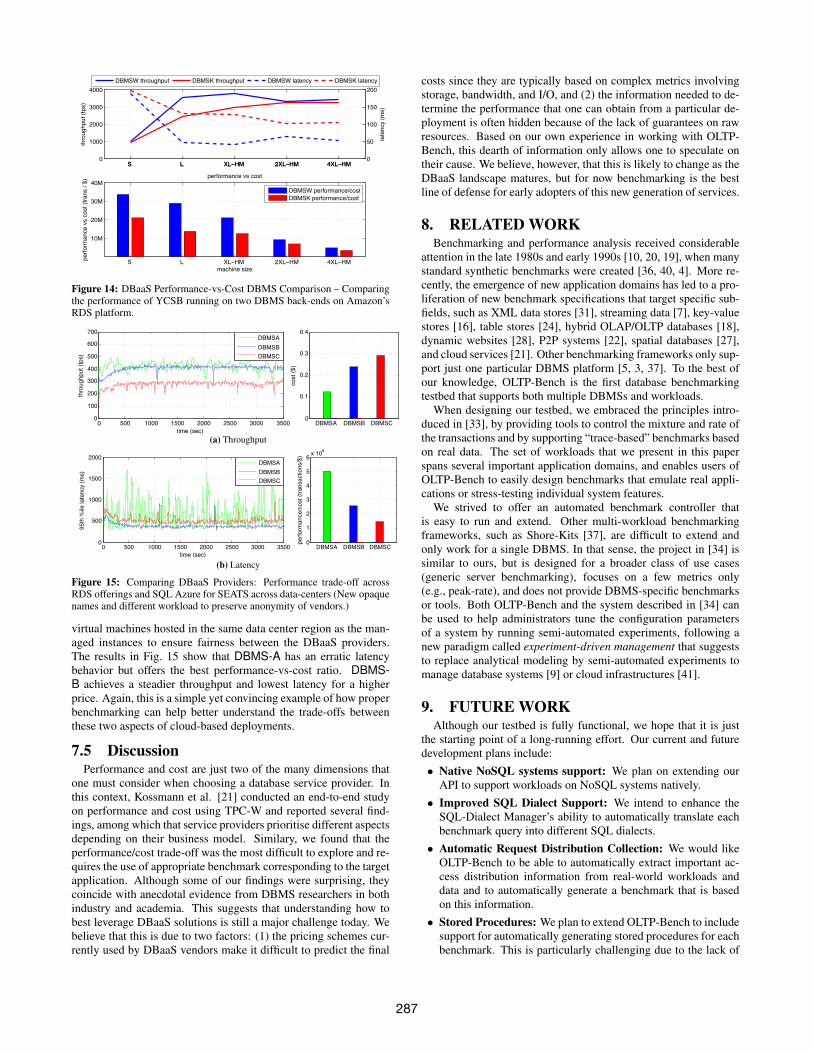
The results in Fig. 14 show that the two underlying DBMSs inRDS behave similarly with the only exception of an unexpectedlylower latency for DBMS-W. There are several interesting patternsthat emerge from the data collected by OLTP-Bench. Foremost isthat the performance/cost ratios for both systems get worse whenrunning on bigger instances. The best choice for both DBMS-Wand DBMS-K appears to be once again the L instance.
These results show that performance and cost are complex as-pects in a DBaaS context, and that it is hard to quantify such metricswithout a testbed like ours.
7.4 Comparing DBaaS ProvidersIn this final experiment, we compare all of the major DBaaS of-
ferings using the SEATS benchmarks. Since network latency is animportant factor for OLTP workloads, we ran all of the workers on
286
S L XL−HM 2XL−HM 4XL−HM0
1000
2000
3000
4000throughput
thro
ughp
ut (t
ps)
S L XL−HM 2XL−HM 4XL−HM0
50
100
150
200
late
ncy
(ms)
DBMSW throughput DBMSK throughput DBMSW latency DBMSK latency
ycsb RDS price−performance
S L XL−HM 2XL−HM 4XL−HM
10M
20M
30M
40Mperformance vs cost
machine size
perfo
rman
ce v
s co
st (t
rans
/ $)
DBMSW performance/costDBMSK performance/cost
Figure 14: DBaaS Performance-vs-Cost DBMS Comparison – Comparingthe performance of YCSB running on two DBMS back-ends on Amazon’sRDS platform.
0 500 1000 1500 2000 2500 3000 35000
100
200
300
400
500
600
700
time (sec)
thro
ughp
ut (t
ps)
DBMSADBMSBDBMSC
0 500 1000 1500 2000 2500 3000 35000
500
1000
1500
2000
time (sec)
95th
%ile
late
ncy
(ms)
DBMSADBMSBDBMSC
DBMSA DBMSB DBMSC0
0.1
0.2
0.3
0.4
cost
($)
DBMSA DBMSB DBMSC0
1
2
3
4
5
6 x 10⁶
perfo
rman
ce/c
ost (
trans
actio
ns/$
)
(a) Throughput0 500 1000 1500 2000 2500 3000 3500
0
100
200
300
400
500
600
700
time (sec)
thro
ughp
ut (t
ps)
DBMSADBMSBDBMSC
0 500 1000 1500 2000 2500 3000 35000
500
1000
1500
2000
time (sec)
95th
%ile
late
ncy
(ms)
DBMSADBMSBDBMSC
DBMSA DBMSB DBMSC0
0.1
0.2
0.3
0.4
cost
($)
DBMSA DBMSB DBMSC0
1
2
3
4
5
6 x 10⁶
perfo
rman
ce/c
ost (
trans
actio
ns/$
)
(b) Latency
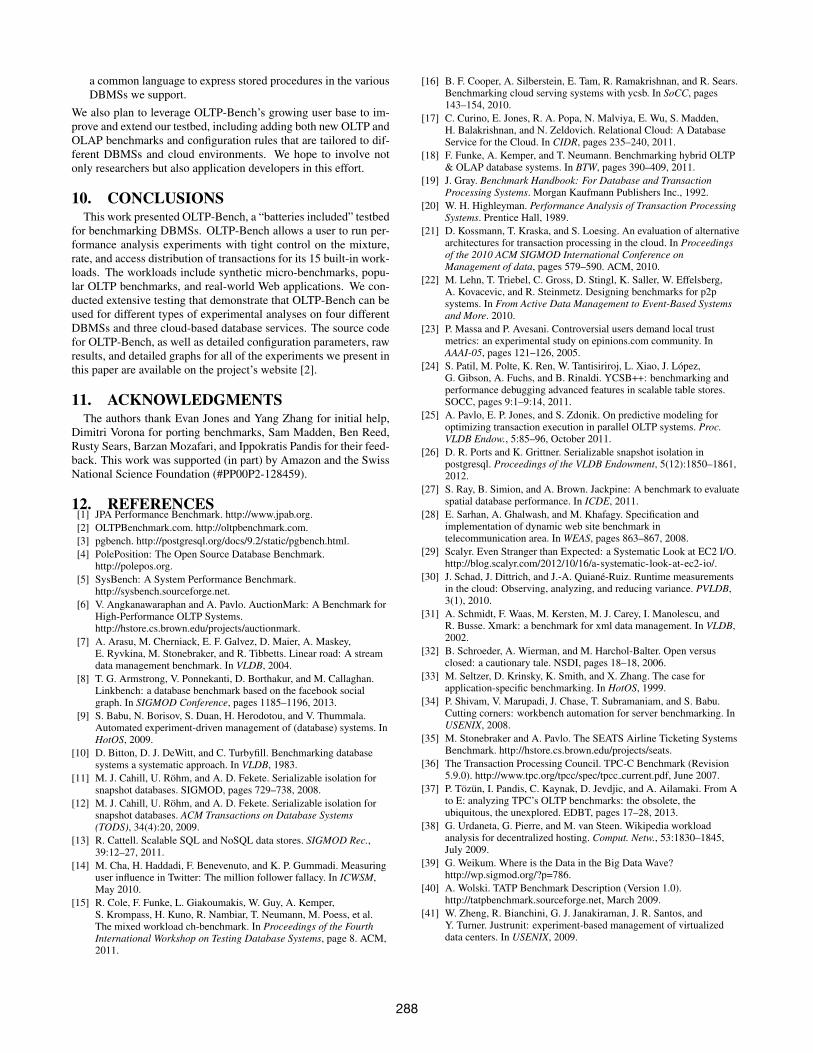
Figure 15: Comparing DBaaS Providers: Performance trade-off acrossRDS offerings and SQL Azure for SEATS across data-centers (New opaquenames and different workload to preserve anonymity of vendors.)
virtual machines hosted in the same data center region as the man-aged instances to ensure fairness between the DBaaS providers.The results in Fig. 15 show that DBMS-A has an erratic latencybehavior but offers the best performance-vs-cost ratio. DBMS-B achieves a steadier throughput and lowest latency for a higherprice. Again, this is a simple yet convincing example of how properbenchmarking can help better understand the trade-offs betweenthese two aspects of cloud-based deployments.
7.5 DiscussionPerformance and cost are just two of the many dimensions that
one must consider when choosing a database service provider. Inthis context, Kossmann et al. [21] conducted an end-to-end studyon performance and cost using TPC-W and reported several find-ings, among which that service providers prioritise different aspectsdepending on their business model. Similary, we found that theperformance/cost trade-off was the most difficult to explore and re-quires the use of appropriate benchmark corresponding to the targetapplication. Although some of our findings were surprising, theycoincide with anecdotal evidence from DBMS researchers in bothindustry and academia. This suggests that understanding how tobest leverage DBaaS solutions is still a major challenge today. Webelieve that this is due to two factors: (1) the pricing schemes cur-rently used by DBaaS vendors make it difficult to predict the final
costs since they are typically based on complex metrics involvingstorage, bandwidth, and I/O, and (2) the information needed to de-termine the performance that one can obtain from a particular de-ployment is often hidden because of the lack of guarantees on rawresources. Based on our own experience in working with OLTP-Bench, this dearth of information only allows one to speculate ontheir cause. We believe, however, that this is likely to change as theDBaaS landscape matures, but for now benchmarking is the bestline of defense for early adopters of this new generation of services.
8. RELATED WORKBenchmarking and performance analysis received considerable
attention in the late 1980s and early 1990s [10, 20, 19], when manystandard synthetic benchmarks were created [36, 40, 4]. More re-cently, the emergence of new application domains has led to a pro-liferation of new benchmark specifications that target specific sub-fields, such as XML data stores [31], streaming data [7], key-valuestores [16], table stores [24], hybrid OLAP/OLTP databases [18],dynamic websites [28], P2P systems [22], spatial databases [27],and cloud services [21]. Other benchmarking frameworks only sup-port just one particular DBMS platform [5, 3, 37]. To the best ofour knowledge, OLTP-Bench is the first database benchmarkingtestbed that supports both multiple DBMSs and workloads.
When designing our testbed, we embraced the principles intro-duced in [33], by providing tools to control the mixture and rate ofthe transactions and by supporting “trace-based” benchmarks basedon real data. The set of workloads that we present in this paperspans several important application domains, and enables users ofOLTP-Bench to easily design benchmarks that emulate real appli-cations or stress-testing individual system features.
We strived to offer an automated benchmark controller thatis easy to run and extend. Other multi-workload benchmarkingframeworks, such as Shore-Kits [37], are difficult to extend andonly work for a single DBMS. In that sense, the project in [34] issimilar to ours, but is designed for a broader class of use cases(generic server benchmarking), focuses on a few metrics only(e.g., peak-rate), and does not provide DBMS-specific benchmarksor tools. Both OLTP-Bench and the system described in [34] canbe used to help administrators tune the configuration parametersof a system by running semi-automated experiments, following anew paradigm called experiment-driven management that suggeststo replace analytical modeling by semi-automated experiments tomanage database systems [9] or cloud infrastructures [41].
9. FUTURE WORKAlthough our testbed is fully functional, we hope that it is just
the starting point of a long-running effort. Our current and futuredevelopment plans include:• Native NoSQL systems support: We plan on extending our
API to support workloads on NoSQL systems natively.• Improved SQL Dialect Support: We intend to enhance the
SQL-Dialect Manager’s ability to automatically translate eachbenchmark query into different SQL dialects.
• Automatic Request Distribution Collection: We would likeOLTP-Bench to be able to automatically extract important ac-cess distribution information from real-world workloads anddata and to automatically generate a benchmark that is basedon this information.
• Stored Procedures: We plan to extend OLTP-Bench to includesupport for automatically generating stored procedures for eachbenchmark. This is particularly challenging due to the lack of
287
a common language to express stored procedures in the variousDBMSs we support.
We also plan to leverage OLTP-Bench’s growing user base to im-prove and extend our testbed, including adding both new OLTP andOLAP benchmarks and configuration rules that are tailored to dif-ferent DBMSs and cloud environments. We hope to involve notonly researchers but also application developers in this effort.
10. CONCLUSIONSThis work presented OLTP-Bench, a “batteries included” testbed
for benchmarking DBMSs. OLTP-Bench allows a user to run per-formance analysis experiments with tight control on the mixture,rate, and access distribution of transactions for its 15 built-in work-loads. The workloads include synthetic micro-benchmarks, popu-lar OLTP benchmarks, and real-world Web applications. We con-ducted extensive testing that demonstrate that OLTP-Bench can beused for different types of experimental analyses on four differentDBMSs and three cloud-based database services. The source codefor OLTP-Bench, as well as detailed configuration parameters, rawresults, and detailed graphs for all of the experiments we present inthis paper are available on the project’s website [2].
11. ACKNOWLEDGMENTSThe authors thank Evan Jones and Yang Zhang for initial help,
Dimitri Vorona for porting benchmarks, Sam Madden, Ben Reed,Rusty Sears, Barzan Mozafari, and Ippokratis Pandis for their feed-back. This work was supported (in part) by Amazon and the SwissNational Science Foundation (#PP00P2-128459).
12. REFERENCES[1] JPA Performance Benchmark. http://www.jpab.org.[2] OLTPBenchmark.com. http://oltpbenchmark.com.[3] pgbench. http://postgresql.org/docs/9.2/static/pgbench.html.[4] PolePosition: The Open Source Database Benchmark.
http://polepos.org.[5] SysBench: A System Performance Benchmark.
http://sysbench.sourceforge.net.[6] V. Angkanawaraphan and A. Pavlo. AuctionMark: A Benchmark for
High-Performance OLTP Systems.http://hstore.cs.brown.edu/projects/auctionmark.
[7] A. Arasu, M. Cherniack, E. F. Galvez, D. Maier, A. Maskey,E. Ryvkina, M. Stonebraker, and R. Tibbetts. Linear road: A streamdata management benchmark. In VLDB, 2004.
[8] T. G. Armstrong, V. Ponnekanti, D. Borthakur, and M. Callaghan.Linkbench: a database benchmark based on the facebook socialgraph. In SIGMOD Conference, pages 1185–1196, 2013.
[9] S. Babu, N. Borisov, S. Duan, H. Herodotou, and V. Thummala.Automated experiment-driven management of (database) systems. InHotOS, 2009.
[10] D. Bitton, D. J. DeWitt, and C. Turbyfill. Benchmarking databasesystems a systematic approach. In VLDB, 1983.
[11] M. J. Cahill, U. Rohm, and A. D. Fekete. Serializable isolation forsnapshot databases. SIGMOD, pages 729–738, 2008.
[12] M. J. Cahill, U. Rohm, and A. D. Fekete. Serializable isolation forsnapshot databases. ACM Transactions on Database Systems(TODS), 34(4):20, 2009.
[13] R. Cattell. Scalable SQL and NoSQL data stores. SIGMOD Rec.,39:12–27, 2011.
[14] M. Cha, H. Haddadi, F. Benevenuto, and K. P. Gummadi. Measuringuser influence in Twitter: The million follower fallacy. In ICWSM,May 2010.
[15] R. Cole, F. Funke, L. Giakoumakis, W. Guy, A. Kemper,S. Krompass, H. Kuno, R. Nambiar, T. Neumann, M. Poess, et al.The mixed workload ch-benchmark. In Proceedings of the FourthInternational Workshop on Testing Database Systems, page 8. ACM,2011.
[16] B. F. Cooper, A. Silberstein, E. Tam, R. Ramakrishnan, and R. Sears.Benchmarking cloud serving systems with ycsb. In SoCC, pages143–154, 2010.
[17] C. Curino, E. Jones, R. A. Popa, N. Malviya, E. Wu, S. Madden,H. Balakrishnan, and N. Zeldovich. Relational Cloud: A DatabaseService for the Cloud. In CIDR, pages 235–240, 2011.
[18] F. Funke, A. Kemper, and T. Neumann. Benchmarking hybrid OLTP& OLAP database systems. In BTW, pages 390–409, 2011.
[19] J. Gray. Benchmark Handbook: For Database and TransactionProcessing Systems. Morgan Kaufmann Publishers Inc., 1992.
[20] W. H. Highleyman. Performance Analysis of Transaction ProcessingSystems. Prentice Hall, 1989.
[21] D. Kossmann, T. Kraska, and S. Loesing. An evaluation of alternativearchitectures for transaction processing in the cloud. In Proceedingsof the 2010 ACM SIGMOD International Conference onManagement of data, pages 579–590. ACM, 2010.
[22] M. Lehn, T. Triebel, C. Gross, D. Stingl, K. Saller, W. Effelsberg,A. Kovacevic, and R. Steinmetz. Designing benchmarks for p2psystems. In From Active Data Management to Event-Based Systemsand More. 2010.
[23] P. Massa and P. Avesani. Controversial users demand local trustmetrics: an experimental study on epinions.com community. InAAAI-05, pages 121–126, 2005.
[24] S. Patil, M. Polte, K. Ren, W. Tantisiriroj, L. Xiao, J. Lopez,G. Gibson, A. Fuchs, and B. Rinaldi. YCSB++: benchmarking andperformance debugging advanced features in scalable table stores.SOCC, pages 9:1–9:14, 2011.
[25] A. Pavlo, E. P. Jones, and S. Zdonik. On predictive modeling foroptimizing transaction execution in parallel OLTP systems. Proc.VLDB Endow., 5:85–96, October 2011.
[26] D. R. Ports and K. Grittner. Serializable snapshot isolation inpostgresql. Proceedings of the VLDB Endowment, 5(12):1850–1861,2012.
[27] S. Ray, B. Simion, and A. Brown. Jackpine: A benchmark to evaluatespatial database performance. In ICDE, 2011.
[28] E. Sarhan, A. Ghalwash, and M. Khafagy. Specification andimplementation of dynamic web site benchmark intelecommunication area. In WEAS, pages 863–867, 2008.
[29] Scalyr. Even Stranger than Expected: a Systematic Look at EC2 I/O.http://blog.scalyr.com/2012/10/16/a-systematic-look-at-ec2-io/.
[30] J. Schad, J. Dittrich, and J.-A. Quiane-Ruiz. Runtime measurementsin the cloud: Observing, analyzing, and reducing variance. PVLDB,3(1), 2010.
[31] A. Schmidt, F. Waas, M. Kersten, M. J. Carey, I. Manolescu, andR. Busse. Xmark: a benchmark for xml data management. In VLDB,2002.
[32] B. Schroeder, A. Wierman, and M. Harchol-Balter. Open versusclosed: a cautionary tale. NSDI, pages 18–18, 2006.
[33] M. Seltzer, D. Krinsky, K. Smith, and X. Zhang. The case forapplication-specific benchmarking. In HotOS, 1999.
[34] P. Shivam, V. Marupadi, J. Chase, T. Subramaniam, and S. Babu.Cutting corners: workbench automation for server benchmarking. InUSENIX, 2008.
[35] M. Stonebraker and A. Pavlo. The SEATS Airline Ticketing SystemsBenchmark. http://hstore.cs.brown.edu/projects/seats.
[36] The Transaction Processing Council. TPC-C Benchmark (Revision5.9.0). http://www.tpc.org/tpcc/spec/tpcc current.pdf, June 2007.
[37] P. Tozun, I. Pandis, C. Kaynak, D. Jevdjic, and A. Ailamaki. From Ato E: analyzing TPC’s OLTP benchmarks: the obsolete, theubiquitous, the unexplored. EDBT, pages 17–28, 2013.
[38] G. Urdaneta, G. Pierre, and M. van Steen. Wikipedia workloadanalysis for decentralized hosting. Comput. Netw., 53:1830–1845,July 2009.
[39] G. Weikum. Where is the Data in the Big Data Wave?http://wp.sigmod.org/?p=786.
[40] A. Wolski. TATP Benchmark Description (Version 1.0).http://tatpbenchmark.sourceforge.net, March 2009.
[41] W. Zheng, R. Bianchini, G. J. Janakiraman, J. R. Santos, andY. Turner. Justrunit: experiment-based management of virtualizeddata centers. In USENIX, 2009.
288