olympic games impact (ogi) study for the 2010...
TRANSCRIPT

Olympic Games Impact (OGI) Study for the 2010 Olympic and Paralympic Winter Games Post-Games Report October 23, 2013
Prepared by: The OGI-UBC Research Team:
Lead: Rob VanWynsberghe Analyst: Brenda Kwan
For: The Canadian Olympic Committee (COC)

OGI-UBC Post-Games Report Table of Contents
i
Table of Contents Table of Contents ............................................................................................................................. i
Acknowledgements ........................................................................................................................ iv 1. Introduction ............................................................................................................................... 5
1.1. Changes to the Olympic Games Impact (OGI) Study in 2011 ....................................... 5 1.2. Organization of the Vancouver OGI Post-Games Report .............................................. 5
1.2.1. Categorization of Individual Indicators .................................................................. 5 1.2.2. Sections of the Report ............................................................................................. 6
1.3. Caveats about the OGI Study .......................................................................................... 6 1.4. Host Region for the 2010 Winter Games: The Province of British Columbia, Metro
Vancouver, and the Squamish-Lillooet Regional District ............................................ 6 1.4.1. Population ............................................................................................................... 7
1.4.2. Land ........................................................................................................................ 7 1.5. Host City and Resort for the 2010 Winter Games – City of Vancouver and the Resort
Municipality of Whistler ............................................................................................... 8 References ................................................................................................................................. 9
2. Synthesis of Indicators: Games-specific and Attribution Analysis ........................................ 10 2.1. Synthesis of Games-specific Indicators ........................................................................ 10
2.1.1. Cost ....................................................................................................................... 10 2.1.2. Human Capital ...................................................................................................... 10
2.1.3. Land Use ............................................................................................................... 10 2.1.4. Goods Consumed à Outputs ............................................................................... 11
2.1.5. Inclusion ................................................................................................................ 11 2.2. Synthesis of Attribution Analysis Indicators ................................................................ 12
2.2.1. Jobs ....................................................................................................................... 12 2.2.2. Businesses ............................................................................................................. 12
2.2.3. Tourism ................................................................................................................. 12 2.2.4. Tax Revenue ......................................................................................................... 12
2.2.5. Air Quality ............................................................................................................ 12 2.2.6. Public Opinion of the Games ................................................................................ 12
2.2.7. Attractiveness of the Host ..................................................................................... 13 2.2.8. Home Advantage .................................................................................................. 13
3. Final Words on OGI for the 2010 Winter Games in Vancouver ............................................ 14

OGI-UBC Post-Games Report Table of Contents
ii
4. Summary Tables of Findings for All Indicators ..................................................................... 16
Ec01 – Employment and Business .......................................................................................... 16 Ec02 – Tourism ....................................................................................................................... 17
Ec03 – Prices ........................................................................................................................... 18 Ec04 – Structure of OCOG Budget ........................................................................................ 18
Ec05 - Operating and Capital Expenditures and Catalyst Effect ............................................ 19 Ec06 – Ratios Specific to Olympic Activities ........................................................................ 19
Ec07 – Public Economy .......................................................................................................... 20 Ec08 – Gross Domestic Product (GDP) .................................................................................. 20
En01 – Water Quality ............................................................................................................. 21 En02 – Air Quality and GHG Emission ................................................................................. 21
En03 – Land Use Changes Protected Sites and Biodiversity ................................................. 21 En04 – Olympic Venues ......................................................................................................... 22
En05 – Transport ..................................................................................................................... 23 En06 – Energy Consumption .................................................................................................. 23
En07 – Waste and Wastewater ............................................................................................... 23 En08 – Life Cycle Inventory ................................................................................................... 24
En09 – Sustainable Sourcing .................................................................................................. 24 So01 – Political Social and Legal Apparatus .......................................................................... 24
So02 – Accessibility of Public Buildings and Venues ............................................................ 25 So03 – Public Opinion and Consultation ................................................................................ 26
So04 – Promotion and Participation of Minority Groups ....................................................... 26 So05 – Human Development .................................................................................................. 27
So06 – Culture ........................................................................................................................ 28 So07 – Sport for All and Elite Sport ....................................................................................... 28
So08 – Anti-doping Controls .................................................................................................. 29 So09 – Olympic Induced Housing .......................................................................................... 29
So10 – Media and the Host City Image .................................................................................. 29 So11 – Professional Sport Education for People with Disabilities ......................................... 30
So12 – Health and Safety ........................................................................................................ 30 Appendix A: OGI 2007 Indicators Not Included in OGI 2011 ..................................................... 31 Appendix B: Detailed Analyses of Indicators .............................................................................. 34

OGI-UBC Post-Games Report Table of Contents
iii
Ec01 – Employment and Business .......................................................................................... 34
Ec02 – Tourism Indicators ...................................................................................................... 47 Ec03 – Prices ........................................................................................................................... 63
Ec04 – Structure of OCOG Budget ........................................................................................ 82 Ec05 - Operating and Capital Expenditures and Catalyst Effect ............................................ 86
Ec06 – Ratios Specific to Olympic Activities ........................................................................ 91 Ec07 – Public Economy .......................................................................................................... 93
Ec08 – Gross Domestic Product (GDP) .................................................................................. 99 En01 – Water Quality ........................................................................................................... 102
En02 – Air Quality and GHG Emission ............................................................................... 104 En03 – Land Use Changes Protected Sites and Biodiversity ............................................... 114
En04 – Olympic Venues ....................................................................................................... 118 En05 – Transport ................................................................................................................... 125
En06 – Energy Consumption ................................................................................................ 131 En07 – Waste and Wastewater ............................................................................................. 136
En08 – Life Cycle Inventory ................................................................................................. 140 En09 – Sustainable Sourcing ................................................................................................ 144
So01 – Political Social and Legal Apparatus ........................................................................ 145 So02 – Accessibility of Public Buildings and Venues .......................................................... 151
So03 – Public Opinion and Consultation .............................................................................. 153 So04 – Promotion and Participation of Minority Groups ..................................................... 170
So05 – Human Development ................................................................................................ 174 So06 – Culture ...................................................................................................................... 197
So07 – Sport for All and Elite Sport ..................................................................................... 204 So08 – Anti-doping Controls ................................................................................................ 212
So09 – Olympic Induced Housing ........................................................................................ 216 So10 – Media and the Host City Image ................................................................................ 217
So11 – Professional Sport Education for People with Disabilities ....................................... 219 So12 – Health and Safety ...................................................................................................... 220
Appendix C: OGI Methodology ................................................................................................. 221

OGI-UBC Post-Games Report Acknowledgements
iv
Acknowledgements The OGI-UBC Research Team would like to recognize the assistance of all those who provided data for the series of OGI reports for the 2010 Winter Games. Since this is the final report, it is especially important to acknowledge the OGI Steering Committee and, in particular, Dr. Robert Sparks, Director, School of Kinesiology, The University of British Columbia and Ken Baker, Consulting Director Environmental Sustainability, Vancouver Organizing Committee for the 2010 Olympic and Paralympic Winter Games.

OGI-UBC Post-Games Results Report
5
1. Introduction This is the fourth and final report in the Olympic Games Impact (OGI) series for the 2010 Olympic and Paralympic Winter Games in Vancouver/Whistler. The 2010 Winter Games was the first edition of the Games to be contractually required to complete the OGI study.
The series of four OGI reports captures a twelve-year period that begins two years before Host City Election (2001 for Vancouver) and ends three years after the Games (2013 for Vancouver). The baseline report (2007) presented context data starting from 2001. In 2009, a second report (Pre-Games) updated the data from the baseline report. One year after the Games (2011), a third report (Games-time) presented event indicator data. Finally, three years after the Games (2013), the current fourth and final report interprets indicator data over the entire reporting period (2001-2013). All OGI reports are prepared for the Games organizers (OCOG) and ultimately for the IOC. The Vancouver Organizing Committee for the 2010 Olympic and Paralympic Winter Games (VANOC) coordinated the OGI study for the first three reports. After VANOC was dissolved after the 2010 Games, the Canadian Olympic Committee (COC) took over coordination of the rest of the OGI study. An independent research partner, in this case the University of British Columbia (OGI-UBC), was contracted to conduct the study, including the collection, analysis, and interpretation of data and the preparation of the reports.
1.1. Changes to the Olympic Games Impact (OGI) Study in 2011 The Olympic Games Impact (OGI) Study was developed by the International Olympic Committee (IOC) in 2003 to monitor the impacts for each edition of the Olympic and Paralympic Games and to help bidding and future Games organizers identify potential legacies in order to maximize the benefits of hosting the Games. Hosts must complete OGI requirements using a prescribed set of indicators to measure impacts across three topic areas or spheres of sustainability – socio-cultural, economic, and environmental.
In 2011, the IOC revised the Technical Manual on Games Impact, which is a reference document that provides details on the indicators to be measured in OGI (the last version was from 2007). The revisions to the Technical Manual occurred after the Vancouver OGI Games-time Report was drafted. This Post-Games Report is organized around the 2011 version of the Technical Manual (henceforth referred to as “OGI 2011”). In other words, this report: 1) presents the 75 indicators in OGI 2011 (instead of the 126 in OGI 2007; 7 new indicators were added); and 2) uses the new codes for indicator thematic groups in OGI 2011 (instead of the codes for individual indicators in OGI 2007). Note: Although the OGI 2011 codes look similar to the OGI 2007 codes (e.g., So01), the new and old codes do not represent the same things and therefore should not be confused with each other. The new OGI 2011 codes are used in this report. The OGI 2007 indicators that are not in OGI 2011 are listed in Appendix A.
1.2. Organization of the Vancouver OGI Post-Games Report
1.2.1. Categorization of Individual Indicators
In this report, individual indicators are categorized as either: 1) Games-specific; 2) Attribution Analysis; or 3) No Attribution Analysis.

OGI-UBC Post-Games Results Report
6
The Games-specific category includes indicators that reflect Games operations, i.e., planning for and staging the Games by VANOC and governments. This category includes staffing, venues, procurement, etc. The Attribution Analysis category includes indicators that reflect the state of the Host that could plausibly be influenced by the Games. Plausibility here refers to the host jurisdiction and not the OGI indicators and may be based on past research or on speculation, concerns, or interests expressed by groups in the Host. The No Attribution Analysis category includes indicators that reflect the state of the Host that could not plausibly be influenced by the Games. Plausibility here refers to the host jurisdiction and not the OGI indicators.
1.2.2. Sections of the Report
This report includes the following sections:
• A synthesis of the Games-specific indicators – this section gives an idea of what was required in order to host the 2010 Games, and outputs of staging the Games;
• A synthesis of the Attribution Analysis indicators – this section gives an idea of the effect of the Games on the Host (context);
• Summary tables of findings for all the indicators (by indicator group); • Final words and looking forward; and • Appendices (list of OGI 2007 indicators not included in OGI 2011; detailed analyses of
individual indicators).
1.3. Caveats about the OGI Study One caveat about the OGI study is that most of the data obtained are secondary data (from other sources) and not primary data (collected first-hand by the OGI-UBC team). Therefore, the OGI study is based on the frequency and reliability of data collected and reported on by other sources. The OGI study generally relies on four types of data sources – data from the OCOG (either collected as primary data by the OCOG or obtained by the OCOG from third parties that the OCOG deals with in planning and staging the Games), secondary data from reliable sources (e.g., statistical agencies, government), consultants reports that reflect primary and secondary data collection and, primary data collected by the OGI research team (e.g., opinion polls).
Another caveat is that the OGI study is not an exhaustive analysis of all possible impacts. The OGI study is based on a set of prescribed indicators described in the OGI 2011 Technical Manual.
1.4. Host Region for the 2010 Winter Games: The Province of British Columbia, Metro Vancouver, and the Squamish-Lillooet Regional District
The province of British Columbia (B.C.) is found on the west coast of Canada and is famed for its natural beauty. The capital city of the province of BC is Victoria, and the largest city is Vancouver--the third-largest metropolitan area in Canada.

OGI-UBC Post-Games Results Report
7
Metro Vancouver is a regional level of government (regional district) containing 22 municipalities, including the City of Vancouver, and 1 electoral area.1 Places to note in its regional natural environment include the coastal mountain range, the Strait of Georgia, and the Fraser River. The Squamish-Lillooet Regional District stretches from Britannia Beach in the south to Pavilion in the north. It includes the Resort Municipality of Whistler and the Sea-to-Sky Corridor
1.4.1. Population The population of British Columbia was 4,113,487 in 2006, a 5.3 percent increase from 2001’s population of 3,907,738 (Statistics Canada 2008). B.C.’s population is the third largest provincial population in Canada, after Ontario (12,160,282) and Quebec (7,546,131). About 4.8 percent of the population in British Columbia was of Aboriginal/First Nation descent, and persons who were immigrants made up about 27 percent of the population. Most of the immigrants were born in the People’s Republic of China, the United Kingdom, India, and Hong Kong. Together, immigrants from these places made up about 43 percent of the immigrant population in British Columbia. The province’s birth rate in 2006 was 9.7, the fourth lowest in the country, and the median age was 40.8, up from 38.4 in 2001 (B.C. Stats 2008a).
Metro Vancouver had a population of 2,116,581 in 2006, representing 51 percent of the population in British Columbia. Forty percent of people living in Metro Vancouver were born outside Canada and 42 percent were born in B.C. The average household had 2.6 people, while the median age had increased to 39.1 from 37.4 in 2001. The most popular language spoken in households was English at 58 percent, with Chinese coming in second. Cantonese, Mandarin, and other Chinese dialects made up 15 percent. More than 70 other languages are spoken in Metro Vancouver. The Squamish-Lillooet Regional District had a population of 35,335 in 2006, representing a 6.7 percent growth in population from 33,011 in 2001.
1.4.2. Land
The province of British Columbia has a total land area of 924,815 square kilometres, which is similar to the combined areas of Germany, France and Belgium. This translates into a population density of 4.4 persons per square kilometre (higher than the national Canadian average of 3.5).
Metro Vancouver has a land area of 2,877 square kilometres, resulting in a population density of 735.6 persons per square kilometre (in 2006).
1 Metro Vancouver is “both a nonpartisan political body and corporate entity operating under provincial legislation as a ‘regional district’ and ‘greater boards’ on behalf of twenty-two member municipalities and one electoral area. The three primary roles are service delivery, planning, and political leadership” (http://www.metrovancouver.org/about/Pages/faqs.aspx) (accessed April 2, 2009). It includes four separate corporate entities, including: 1) Greater Vancouver Regional District (GVRD); 2) Greater Vancouver Sewerage and Drainage District (GVS&DD); 3) Greater Vancouver Water District (GVWD); and 4) Metro Vancouver Housing Corporation (MVHC).

OGI-UBC Post-Games Results Report
8
The total land area of Squamish-Lillooet is 16,354 square kilometres, with a population density of 2.2 persons per square kilometre.
1.5. Host City and Resort for the 2010 Winter Games – City of Vancouver and the Resort Municipality of Whistler
City of Vancouver. Source: City of Vancouver.
Consistently ranked as one of the most livable cities in the world, the City of Vancouver is home to a population of 611,869, up from 583,282 in 2003 (B.C. Stats, 2007). As the biggest municipality in the metropolitan area of Vancouver, the City of Vancouver was chosen as their place of residence by the majority of immigrants to the area. 28.7 percent of newcomers chose it as their destination when they arrived between 2001 and 2006. Encompassing a total land area of about 115 square kilometres, Vancouver has a population density of 5,039 per square kilometre. In 2006, there were 273,804 private dwellings (defined as a set of living quarters for human habitation in which a person or group of persons could reside). The average household size was 2.2 persons, and the average value of an owned dwelling was estimated at $628,682.
Whistler. Source: Resort Municipality of Whistler

OGI-UBC Post-Games Results Report
9
In 2006, the Resort Municipality of Whistler had 9,595 permanent residents and an estimated 2,266 seasonal residents. It had a total land area of about 162 square kilometres, but has recently expanded to about 243 square kilometres. There are ongoing efforts to make both Vancouver and Whistler municipalities more sustainable, and local governments have concentrated efforts into zero waste, smart growth, green buildings, sustainable transportation, energy efficiency, and water conservation. Another major policy area is physical activity and health, as demonstrated in the increase of programs. The distance between Whistler and Vancouver is about 120km, and travel time by car takes about two hours. Tourism is a very important industry to the area, pumping money into the local economy while offering sustained employment. In 2007, there was an estimated 2,747,337 overnight visitors to the Greater Vancouver Area, of approximately 5,373,504 visitors to Canada (Tourism Vancouver 2008). Approximately 2.15 million people visit Whistler annually, and as of December 31, 2005, the total number of dwelling units zoned for tourist accommodation in Whistler was 5,967. An increase in the total number of dwelling units zoned for tourist accommodation is expected in Vancouver. In 2008, there were a total of 24,060 hotel/motel rooms in Metro Vancouver, and more accommodation is planned to be complete by 2010 (Tourism Vancouver 2008).
References B.C. Stats. 2007. "British Columbia Municipal and Regional District Population Estimates.” (http://www.bcstats.gov.bc.ca/data/pop/pop/mun/mun2007e.pdf) (accessed February 28, 2009). B.C. Stats. 2008a. "Ethnic and Visible Minority Characteristics of BC's Population.” B.C. Stats Infoline 08-39 (2008): 1-5 (http://www.bcstats.gov.bc.ca/releases/info2008/in0839.pdf) (accessed February 28, 2009).
B.C. Stats. 2008b. "Economic Activity: British Columbia and Canada." (http://www.bcstats.gov.bc.ca/data/bus_stat/bcea/tab1.asp) (accessed February 28, 2009).
Statistics Canada. 2007. "Population by immigrant status and period of immigration, 2006 counts, for Canada, provinces and territories – 20% sample data." (http://www12.statcan.ca/english/census06/data/highlights/Immigration/Table403.cfm?Lang=E&T=403&GH=4&SC=1&S=99&O=A) (accessed February 2 2009).
Statistics Canada. 2008. “Census 2006 Population and Dwelling Counts." (http://www12.statcan.ca/census-recensement/2006/dp-pd/hlt/97-550/Index.cfm?TPL=P1C&Page=RETR&LANG=Eng&T=101) (accessed February 2, 2009). Tourism Vancouver. 2008. "Market Origin of Overnight Visitors to Greater Vancouver." (http://www.tourismvancouver.com/pdf/research/ytd_visitor_volume_2007.pdf) (accessed February 28, 2009).
Tourism Vancouver. 2009. "Hotel/Motel Rooms Available In Metro Vancouver 2008." (http://www.tourismvancouver.com/pdf/research/hotelmotel_rooms_available.pdf) (accessed February 28, 2009).

OGI-UBC Post-Games Report 2 Synthesis of Attribution Analysis Indicators: Games-specific and Attribution Analysis
10
2. Synthesis of Indicators: Games-specific and Attribution Analysis This section summarizes Games-specific and Games-attributable indicators.
2.1. Synthesis of Games-specific Indicators The indicators in this section relate specifically to the staging of the Games as implemented by the OCOG (VANOC) and governments.
2.1.1. Cost
The cost of hosting the 2010 Winter Games includes expenditures by VANOC and by governments (Canadian, BC, and local). The cost of Olympic activities (Olympic total) was $4,083 million CAD (see Table 1). Adding non-venue infrastructure projects to the cost brings the total to $7,771 million CAD. Governments contributed the majority of costs to both Olympic activities (58 percent) and context activities (62 percent).
Table 1: Total VANOC and Government Contributions to Operating, Capital, and Context Activities (in millions of dollars, CAD)
Expenditures Total OCOG OCOG Share Governments
Public Share
Operating – VANOC $1,884.1 $1,696.3 90% $187.8 10% Operating – external to VANOC $1,446.7 $0 0% $1,446.7 100% Capital (venues) $752.3 $23.3 3% $729 97%
Olympic subtotal $4,083 $1,720 42% $2,364 58% Olympic Linea $9 $0 0% $9 $100% Context (3 Olympic-induced infrastructure projects) $3,679 $0 0% $2,474 67%
Non-venue infrastructure subtotal $3,688 $0 0% $2,483 67% Totalb $7,771 $1,720 22% $4,847 62%
aThe Olympic Line was a demonstration streetcar project in Vancouver that was piloted during the Games. Rides were free and one of the stations was near the Olympic Village. bThe percentages do not add up to 100 percent because 16 percent of the budget for the three Olympic-induced infrastructure came from non-VANOC, non-governmental sources (e.g., transportation authority).
2.1.2. Human Capital
The total number of staff required at Games-time (roughly January to March 2010) is estimated to include 21,693 people in the Olympic workforce (includes 17,273 volunteers) and at least 15,695 staff in the external workforce.
2.1.3. Land Use
Venues (9 competition, 2 training, and 6 non-competition) development ranged from no change in land use (e.g., an existing spectator venue) to use of previously harvested timber area or industrial/brownfield site. An area of 5.9 km2 (590 hectares) were within or near (3km or less) protected areas or areas of high biodiversity value.
The only permanent Olympic-induced housing was at the Olympic and Paralympic Villages (in Vancouver and in Whistler). No residential floor area was lost in order to develop the two Villages.

OGI-UBC Post-Games Report 2 Synthesis of Attribution Analysis Indicators: Games-specific and Attribution Analysis
11
2.1.4. Goods Consumed à Outputs
The total amount and type of material goods used for the 2010 Games is unknown (e.g., construction materials for venue development, supplies for the VANOC office, etc.). The only data that were available for consumption of goods was for energy usage (fuel and electricity combined). From 2005 and 2010, a cumulative total of 1,184,596 gigajoules of energy was used for the Games, with 76.6 percent of this occurring during the last reporting period (2009-2010), which includes the event of the Games. From 2005 to 2010, energy consumption led to a cumulative total of 277,677 CO2e of greenhouse gas emissions, mostly during 2009-2010 and from transportation (87.5 percent). From 2005 to 2010, 31,077 metric tons of solid waste was generated by the Games, with most of this occurring at the beginning from 2005 to 2007 (venue construction) and at the end in 2010 (during the Games and post-Games). VANOC was able to attain relatively high waste diversion rates (72 to 98 per cent per reporting period). No data were available on the volume or the quality of the wastewater generated by the Games.
Despite a lack of data on the consumption of goods (other than energy), efforts had been made by VANOC to reduce the consumption of goods and/or mitigate negative impacts on the environment. For example, VANOC received at least a Silver LEED certification for five new venues.
A direct legacy of the Games is the venues. None of the venues were temporary, i.e., they were pre-existing or planned for post-Games use (e.g., converted for other uses).
2.1.5. Inclusion
VANOC attempted to include culture, various stakeholders, and various populations (women, Aboriginals, visible minorities, persons with a disability) in the Games:
• Three major cultural festivals, including the Cultural Olympiad, were organized, with a cumulative total of 6,462,637 visitors;
• Seven stakeholder groups were consulted on various topics;
• VANOC had employed some people from minority populations (number of employees not available);
• VANOC created 267 training positions for priority populations (220 filled);
• VANOC implemented nine educational and promotional programs related to minorities and aimed at the general public (2010 Legacies Now implemented four programs);
• VANOC created six major educational activities to engage with visitors on the topics of education and sport; and
• Venues generally complied with accessibility criteria.

OGI-UBC Post-Games Report 2 Synthesis of Attribution Analysis Indicators: Games-specific and Attribution Analysis
12
2.2. Synthesis of Attribution Analysis Indicators The indicators in this section relate to plausible ways in which the staging of the Games could affect the state of the Host. Findings are highlighted for indicators with data of adequate volume and quality, which are needed in order to conduct analyses on the effect of the Games with some degree of confidence. Attribution analyses provide evidence of either no change or some degree of change. Indicators with inconclusive findings or with no data available are also mentioned.
2.2.1. Jobs
An estimated 38,530 to 51,510 jobs in BC were created or supported by the Games from 2003 to 2010 (21,690 jobs in the event year) (data from PriceWaterhouseCoopers based on economic modeling).
2.2.2. Businesses
According to a consultant’s report, an estimated 1,500 new businesses were created in BC that were induced by the Games from 2003 to 2010.
2.2.3. Tourism
The Games may have contributed to a slightly higher than ‘normal’ increase in the number of accommodation properties and rooms and accommodation occupancy rate during the event year. Average hotel prices increased more than usual in the event regions during the Olympic Games (February 2010) but not during the Paralympic Games (March 2010). Visitors did not appear to stay longer or spend more money than usual during the event year (monthly data were not available to examine whether the Games had an effect only during the events months of February 2010 and March 2010 vs. the rest of that year).
2.2.4. Tax Revenue
Tax revenue related to the Games may be generated from a variety of sources, of which only VANOC staffing (income tax) and visitor spending were examined based on available data. At best, these are only estimates – to be interpreted with caveats – rather than direct numbers (the exact amount remains unknown). From 2003 to 2010, at least $50 million in income tax was estimated from VANOC staffing. From around January to March of 2010 (Games-time), tax revenue from ‘incremental’ visitor spending (tourists who came in relation to the Games) was estimated to be from $10-19 million.
2.2.5. Air Quality
Air pollution (exceedances) near Olympic cities/venues was not significantly altered during the construction of the venues or during the Olympic Games or Paralympic Games.
2.2.6. Public Opinion of the Games
Canadian residents reported being more supportive (somewhat or very) of the 2010 Games in December 2009 (70 percent) than in 2003 (53 percent), based on personal recall. Canadians also

OGI-UBC Post-Games Report 2 Synthesis of Attribution Analysis Indicators: Games-specific and Attribution Analysis
13
generally believed that the 2010 Paralympic Games had increased awareness of acceptance of people with disabilities (before-after data).
2.2.7. Attractiveness of the Host
The Games did not appear to have influenced the attractiveness of the Host with respect to either Consumer Price Index or the real estate market (cost of homes) (no unusual change in either). There was inconclusive evidence to determine whether or not the Games had an effect on the hosting of international events, while there was no data available that was specific to the hosting of major sporting events. Finally, there was no data available to monitor the media image of the Host city (Vancouver) over time, although Games-time data (February 9 to March 8, 2010) suggest that early media reports drew negative attention to Vancouver’s organizational capabilities while articles towards the end of the Games reported the experience more positively.
2.2.8. Home Advantage
Although medals records (by number) were broken for Canadian athletes for the 2010 Games, an examination of data for Canadian results at previous Winter Games suggest that the records were not due to a home advantage (it was part of an existing trend).

OGI-UBC Post-Games Report 3. Final Words on OGI for the 2010 Winter Games in Vancouver
14
3. Final Words on OGI for the 2010 Winter Games in Vancouver The Games-specific indicators – being directly related to the staging of the Games by the OCOG and governments – can be anticipated to have the most ‘impact.’ Data for these indicators are reported as is (either at one point in time or over time), and no attribution analyses are necessary or possible because the before state is always zero (no investment in the Games). Arguably, an impact of the Games could be that public dollars and other resources are directed away from other purposes in order to invest in the Games, but that type of impact is not part of the scope of OGI. Games-specific indicators relate to cost (to fund the Games), human capital, land use (for venues), goods consumed and outputs generated through their consumption, and inclusion. While data for these indicators are provided for the 2010 Games, the findings cannot be compared with other Games for two reasons. First, the OGI methodology does not incorporate methods to ‘standardize’ data across Hosts. Second, Vancouver was the first Host to be contractually required to implement OGI. Comparisons between Winter Games in the future may be possible if OGI includes methodology that standardizes data between Hosts (e.g., cost per capita rather than just comparing absolute costs). As section 2.2 exemplifies the 2010 edition of OGI has demonstrated the limited ability to identify trends in Games-attributable but non-Games specific indicators. Attribution analyses were conducted for indicators that reflect the state of the Host that could plausibly be affected by the staging of the Games. The analyses found impacts in some cases (e.g., creation of jobs and new businesses, greater acceptance in society of people with disabilities, and permanent venue infrastructure). However, other benefits or losses that were speculated were not supported by the available data, i.e., a boon to tourism, increased air pollution, increased cost of living. There is insufficient post-Games data to determine whether the findings are sustained after the Games, e.g., whether jobs are long-term. Some data are not released until 1, 2 or more years after they are collected, while other data are terminated (not collected anymore). Both these factors prevent a longer-term analysis of the impacts of the Games on the Host. There is also insufficient data to conduct a more integrative analysis to show the balance between inputs to host the Games and outputs generated from the Games, e.g., financial benefit vs. amount invested. As the 2010 edition has demonstrated, OGI makes it possible to understand how governments and OCOGs, as main actors in the hosting exercise, can implement policies, programs, and practices to stimulate benefits and mitigate negative impacts of the Games, either by directly staging the Games or by supporting other actors. For example, planning for the permanence of venues after the 2010 Winter Games was a conscious decision. Although there is no available data to link programs to outcomes, a provincial government program supported Olympic-related businesses (perhaps contributing to the creation of new businesses), but the provincial government pulled Tourism BC shortly before the Games (perhaps contributing to little impact on tourism in addition to the effects of a recent recession).
Moving forward, OGI indicators should be used by future OCOGs and governments as a planning tool to make decisions that would facilitate these jurisdictions to stage sustainable Games. For example, OCOGs and governments could develop policies, programs, and practices related to indicators that reflect benefits and negative impacts that are most amenable to

OGI-UBC Post-Games Report 3. Final Words on OGI for the 2010 Winter Games in Vancouver
15
influence within the Host context. While several indicators in Vancouver showed some impact of the Games, the indicators that are more amenable to change across multiple Hosts may become apparent as OGI is conducted for other Games in the future.

OGI-UBC Post-Games Report 4. Summary Tables of Findings for All Indicators
16
4. Summary Tables of Findings for All Indicators For each indicator group, a table summarizes the findings for indicators in the Games-specific and Attribution Analysis categories (indicators with No Attribution Analysis are only listed). Data periods are underlined. The page number for the detailed analyses of each indicator group is also provided.
Ec01 – Employment and Business See page 34 for detailed analyses.
Jobs
Games-specific Attribution Analysis No Attribution
Analysis
Jobs created in Olympic and context activities:
Jan. 2003-Dec. 2010: 38,530-51,510 jobs in BC created or supported by the Games (21,690 jobs in the event year).
Employment indicators:
1996-2009: Vancouver may have enjoyed an Olympic advantage 2003-2009 with respect to unemployment rate (exact extent unknown).
2009-2011: Effect not sustained.
Employment of people with disabilities
Wages paid in Olympic activities:
Sep. 20, 2003-Jul. 31, 2010: $298.4 million CAD spent by VANOC on staffing.
Wages
Non-accredited people working in context activities: (Note: No accreditation data.)
2010 (Games-time): ≥15,695 staff in external workforce and 21,693 in Olympic workforce (includes 17,273 volunteers).
Businesses
Games-specific Attribution Analysis No Attribution
Analysis
New Olympic and Paralympic related businesses:
2003-2010: 1,500 new businesses created in BC induced by the Games.

OGI-UBC Post-Games Report 4. Summary Tables of Findings for All Indicators
17
Capacity / Infrastructure
Games-specific Attribution
Analysis No Attribution
Analysis
Economic legacy:
2006-2010: 267 training positions created by VANOC for priority populations (220 filled)
2006-2010: 62 sustainability innovations related to Games venues and operations awarded a “star” by VANOC.
Ec02 – Tourism See page 47 for detailed analyses. Accommodation Infrastructure
Games-specific Attribution Analysis No Attribution
Analysis
Accommodation infrastructure:
2000-2010: The Games may have contributed to a slightly higher increase in the number of accommodation properties and rooms in the event regions during the event year.
Accommodation occupancy rate:
1999-2011: The Games may have contributed to a slightly higher accommodation occupancy rate during the event year.
Tourists
Games-specific Attribution Analysis No Attribution
Analysis
Tourist nights:
2000-2011: Minimal increase (if at all) in number of overnight tourists in Greater Vancouver during the event year (compared to non-event regions).
1998-2011: No Olympic Host advantage for Greater Vancouver re: how long visitors stayed during the event year.
Visitors spending:
2000-2011: No Olympic Host advantage for Greater Vancouver re: how much visitors spent during the event year.

OGI-UBC Post-Games Report 4. Summary Tables of Findings for All Indicators
18
Hosting Events
Games-specific Attribution Analysis No Attribution
Analysis
Hosting international events:
2001-2010: Inconclusive evidence re: whether the Games affected the attractiveness of Vancouver for hosting events.
Ec03 – Prices See page 63 for detailed analyses.
Games-specific Attribution Analysis No Attribution
Analysis
Consumer Price Index:
1998-2011: The prices of consumer goods and services did not exceed what they would ‘normally’ be at the level of the event city (Vancouver), region (BC), or country (Canada).
Hotel Price Index:
2003-2011: The data support an Olympic impact (but not a Paralympic impact) on average hotel prices that was limited to the event regions (not BC), and only during the month of the event itself (Feb. 2010).
Real estate market:
Jan. 2005-Jan. 2013: The Games had little to no effect on the cost of a benchmark home in the event region (Greater Vancouver).
Ec04 – Structure of OCOG Budget See page 82 for detailed analyses.
Games-specific Attribution
Analysis No Attribution
Analysis
Structure of OCOG revenues and Structure of OCOG expenditures
2003-2010: $1.884 billion CAD actual budget (7.3 percent more than projected)

OGI-UBC Post-Games Report 4. Summary Tables of Findings for All Indicators
19
Ec05 - Operating and Capital Expenditures and Catalyst Effect See page 86 for detailed analyses. Olympic Expenditures
Games-specific Attribution
Analysis No Attribution
Analysis
Total operating expenditure (Olympic activities):
2003-2010: $1.884 billion CAD (same as OCOG budget).
Total capital expenditure (Olympic activities):
2003-2010: $603 million CAD.
Context Expenditures
Games-specific Attribution
Analysis No Attribution
Analysis
Total capital expenditure (context activities):
2005-2009: $3.7 billion CAD (2009 dollars) on three infrastructure projects (transportation and venue).
Overall Benefits
Games-specific Attribution
Analysis No Attribution
Analysis
Catalyst effect of the Games:
2003-2010: Vancouver benefited more than the rest of BC (based on ratio of capital expenditure on context activities to capital expenditure on Olympic activities).
Ec06 – Ratios Specific to Olympic Activities See page 91 for detailed analyses.
Games-specific Attribution
Analysis No Attribution
Analysis
Ratios specific to Olympic activities (relative costs):
2003-2010: The cost of operating the Games was over three times the cost of capital investment on venue development for the Games.

OGI-UBC Post-Games Report 4. Summary Tables of Findings for All Indicators
20
Ec07 – Public Economy See page 93 for detailed analyses. Public Expenditures
Games-specific Attribution
Analysis No Attribution
Analysis
Public share of expenditure (Olympic activities):
2003-2010: Public authorities funded 96.9% of capital expenditures and about 50% of operating expenditures for Olympic activities (VANOC funded the rest).
Public share of expenditure (context activities):
2003-2010: Public authorities funded a significant share of capital expenditures on 3 Olympic-induced infrastructure projects (46%, 86%, and 100%).
Total public expenditures (Olympic and context activities) = $4,838 billion CAD
Tax Revenue
Games-specific Attribution Analysis No Attribution
Analysis
Tax revenue from Olympic activities: (Note: these estimates are to be interpreted with caveats)
2003-2010: >$50 million (staffing).
2010 (Games-time): $10-19 million (visitor spending).
Ec08 – Gross Domestic Product (GDP) See page 99 for detailed analyses.
Games-specific Attribution
Analysis No Attribution Analysis
Gross Domestic Product

OGI-UBC Post-Games Report 4. Summary Tables of Findings for All Indicators
21
En01 – Water Quality See page 102 for detailed analyses.
Games-specific Attribution
Analysis No Attribution
Analysis
Quality of water discharged by Olympic and Paralympic venues:
No available data (but a wastewater treatment plant was built at Whistler Olympic/Paralympic Park).
Water quality
En02 – Air Quality and GHG Emission See page 104 for detailed analyses.
Games-specific Attribution Analysis No Attribution
Analysis
Greenhouse gas emissions of the Olympic and Paralympic Games:
2005-2010: Total GHG emissions was 277,677 CO2e, mostly during 2009-2010 and from transportation (87.5 percent).
Air quality:
2000-2011: Higher than usual levels of NO2, SO2, and PM10 (but not O3) from 2005-2008 at Whistler and/or Squamish (near some Olympic venues) were more likely to have been a result of highway upgrades (a context activity) than of construction of Olympic venues.
2010 (Games-time): Air pollution was not significantly altered during the Olympic period (February 12 to 28) or the Paralympic period (March 12 to 21).
En03 – Land Use Changes Protected Sites and Biodiversity See page 114 for detailed analyses. Land Use
Games-specific Attribution
Analysis No Attribution
Analysis
Olympic-induced land use changes:
2005-2010: Changes in land use for venue development ranged from no change to use of previously harvested timber area or industrial/brownfield site.

OGI-UBC Post-Games Report 4. Summary Tables of Findings for All Indicators
22
Protected Sites and Threatened Species
Games-specific Attribution
Analysis No Attribution
Analysis
Olympic and Paralympic venues in protected sites:
2005-2010: An area of 5.9 km2 (590 hectares) were within or near (3km or less) protected areas or areas of high biodiversity value.
Threatened species:
2005-2010: No data available (but VANOC incorporated avoidance strategies at venue sites where at-risk species had the potential to inhabit).
En04 – Olympic Venues See page 118 for detailed analyses. Venue Evolution
Games-specific Attribution
Analysis No Attribution
Analysis
Evolution of new venues’ project:
2005-2010: Various strategies were used to minimize the environmental impact of the Games venues.
Capacity of Olympic venues:
2005-2010: Temporary spectator seating was mostly only brought in for new venues and pre-existing venues that had no prior spectator seating. Four pre-existing venues generally maintained seating capacity.
Venue Operation
Games-specific Attribution
Analysis No Attribution
Analysis
Operating and maintenance of Olympic and Paralympic venues:
2005-2010: Limited data were available, except: energy usage of the venues was negligible in the pre-Games period (August 1, 2005 to July 31, 2009) compared to the Games period (August 1, 2009 to April 30, 2010).
OGI-UBC Post-Games Report 4. Summary Tables of Findings for All Indicators
23
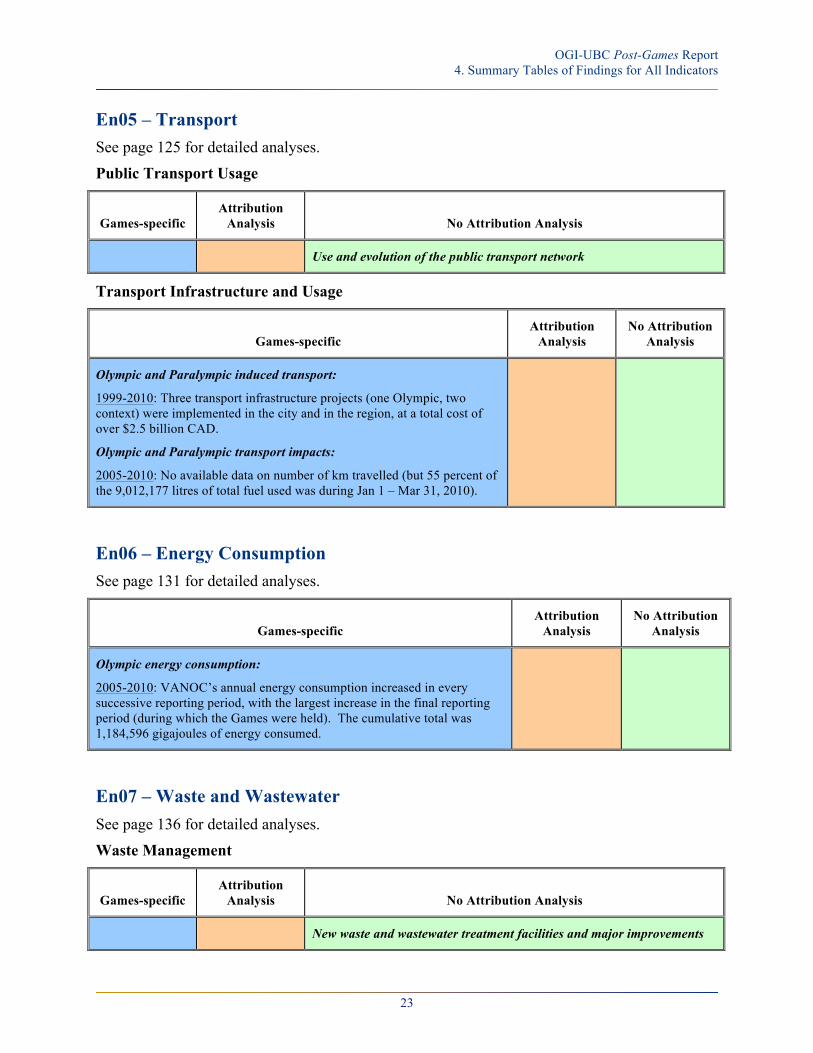
En05 – Transport See page 125 for detailed analyses. Public Transport Usage
Games-specific Attribution
Analysis No Attribution Analysis
Use and evolution of the public transport network
Transport Infrastructure and Usage
Games-specific Attribution
Analysis No Attribution
Analysis
Olympic and Paralympic induced transport:
1999-2010: Three transport infrastructure projects (one Olympic, two context) were implemented in the city and in the region, at a total cost of over $2.5 billion CAD.
Olympic and Paralympic transport impacts:
2005-2010: No available data on number of km travelled (but 55 percent of the 9,012,177 litres of total fuel used was during Jan 1 – Mar 31, 2010).
En06 – Energy Consumption See page 131 for detailed analyses.
Games-specific Attribution
Analysis No Attribution
Analysis
Olympic energy consumption:
2005-2010: VANOC’s annual energy consumption increased in every successive reporting period, with the largest increase in the final reporting period (during which the Games were held). The cumulative total was 1,184,596 gigajoules of energy consumed.
En07 – Waste and Wastewater See page 136 for detailed analyses. Waste Management
Games-specific Attribution
Analysis No Attribution Analysis
New waste and wastewater treatment facilities and major improvements

OGI-UBC Post-Games Report 4. Summary Tables of Findings for All Indicators
24
Waste Production
Games-specific Attribution
Analysis No Attribution
Analysis
Solid waste production of the Olympic and Paralympic Games:
2005-2010: Most of the 31,077 metric tonnes of solid waste generated by the Games occurred at the beginning from 2005-2007 (venue construction) and at the end in 2010 (during the Games and post-Games). VANOC was able to attain relatively high waste diversion rates (72 to 98 per cent per reporting period).
En08 – Life Cycle Inventory See page 140 for detailed analyses.
Games-specific Attribution
Analysis No Attribution
Analysis
Life cycle inventory of Olympic and Paralympic Games:
2005-2010: Limited data on two venues suggest that carcass work constituted the largest share of all life-cycle phases for both inputs and outputs for both venues.
En09 – Sustainable Sourcing See page 144 for detailed analyses.
Games-specific Attribution
Analysis No Attribution
Analysis
Procured products and services with sustainability credentials:
2005-2010: No data available (but VANOC did create policies and initiatives for sustainable and ethical sourcing).
So01 – Political Social and Legal Apparatus See page 145 for detailed analyses.
Government Support
Games-specific Attribution
Analysis No Attribution
Analysis

OGI-UBC Post-Games Report 4. Summary Tables of Findings for All Indicators
25
Games-specific Attribution
Analysis No Attribution
Analysis
Votes connected with the Olympic Games and Paralympic Games:
2001-2012: 13 bills and by-laws related to the Games were introduced (1 Canada, 9 BC, 4 Vancouver). None were introduced after 2010, and 11 were passed. A Feb. 2003 non-legally binding plebiscite of the government of Vancouver found that most residents who voted were in favour of hosting the Games (64 percent).
Deferment and abandonment of public policies:
1998-2010: No public policies were recorded as having been deferred or abandoned in favour of the Games (BC, Vancouver, Whistler), while 51 public policies and projects were created to take advantage of the Games.
General Public Support
Games-specific Attribution
Analysis No Attribution
Analysis
Pressure groups:
2001-2012: Six pressure groups opposed or monitored the Games.
So02 – Accessibility of Public Buildings and Venues See page 151 for detailed analyses.
Games-specific Attribution
Analysis No Attribution
Analysis
Compliance of Olympic venues with accessibility criteria:
2009-2010: In cases were data were available, the venues complied with accessibility criteria at Games-time and remained compliant at the final situation (2010), except for one venue (Cypress Mountain).
Compliance of public building with accessibility criteria

OGI-UBC Post-Games Report 4. Summary Tables of Findings for All Indicators
26
So03 – Public Opinion and Consultation See page 153 for detailed analyses. Public Opinion
Games-specific Attribution Analysis No Attribution
Analysis
Opinion polls:
Dec. 2009: Canadian residents reported being more supportive (somewhat or very) of the 2010 Games in Dec. 2009 (70 percent) than in 2003 (53 percent), based on personal recall.
Dec. 2009-May 2010: Canadians generally believed that the 2010 Paralympic Games had increased awareness of acceptance of people with disabilities.
Consultation
Games-specific Attribution
Analysis No Attribution
Analysis
Consultation with stakeholders:
2008-2010: VANOC consulted with seven stakeholder groups (1 city-level, 6 provincial-level) on a variety of topics.
So04 – Promotion and Participation of Minority Groups See page 170 for detailed analyses.
Promotion and Participation of Minority Groups in the Games
Games-specific Attribution
Analysis No Attribution
Analysis
Participation of minorities in the Games:
2006-2010: Members of minority groups (women, Aboriginals, visible minorities, persons with a disability) were hired as VANOC employees (number of employees not available).
Promotion of minorities and Indigenous population:
2006-2010: 13 educational and promotional programs related to minorities and Indigenous populations and aimed at the general public were implemented through VANOC (9 programs) and 2010 Legacies Now (4 programs).

OGI-UBC Post-Games Report 4. Summary Tables of Findings for All Indicators
27
Societal Perceptions about People with Disabilities
Games-specific Attribution Analysis No Attribution
Analysis
Perception about people with disabilities in society:
(See So03 on Opinion Polls.)
So05 – Human Development See page 174 for detailed analyses.
Social Indicators
Games-specific Attribution
Analysis No Attribution Analysis
Poverty and social exclusion
Educational level
Crime rates
Health Indicators
Games-specific Attribution
Analysis No Attribution Analysis
Health
Nutrition

OGI-UBC Post-Games Report 4. Summary Tables of Findings for All Indicators
28
So06 – Culture See page 197 for detailed analyses.
Games-specific Attribution
Analysis No Attribution
Analysis
Olympic Cultural Programme:
2008-2010: Cumulatively, $84,970,829 was spent on three Cultural Olympiads, with a total of 6,462,637 visitors. The budget and number of visitors increased each year: $7,334,350 in 2008 (163,128 visitors); $21,215,350 in 2009 (283,773 visitors); and $56,420,129 in 2010 (6,015,736 visitors).
Olympic and Paralympic educational activities:
2005-2010: VANOC created six major Olympic and Paralympic Educational Activities to engage with visitors on the topics of education and sport.
Host City cultural activities
So07 – Sport for All and Elite Sport See page 204 for detailed analyses. Physical Activity and Education
Games-specific Attribution
Analysis No Attribution Analysis
Sport and physical activities
Physical education and school sport
Sport Facilities
Games-specific Attribution Analysis No Attribution
Analysis
Major sporting events hosted:
No data available.
Sport facilities

OGI-UBC Post-Games Report 4. Summary Tables of Findings for All Indicators
29
Top Athletes
Games-specific Attribution Analysis No Attribution
Analysis
Results at the Olympic and Paralympic Games and World Championships:
1988-2010: The records broken during the 2010 Winter Games are part of a trend since 1988, in which both the number of medals and the rank had been steadily increasing with each consecutive Olympic Winter Game (no home advantage for Canada during the 2010 Games).
Top level sportsmen and women
So08 – Anti-doping Controls See page 212 for detailed analyses.
Games-specific Attribution
Analysis No Attribution Analysis
Anti-doping controls
So09 – Olympic Induced Housing See page 216 for detailed analyses.
Games-specific Attribution
Analysis No Attribution
Analysis
Olympic induced housing:
2005-2013: The only permanent Olympic-induced housing was at the Olympic and Paralympic Villages (in Vancouver and in Whistler). No residential floor area was lost in order to develop the two Villages.
So10 – Media and the Host City Image See page 217 for detailed analyses.
Games-specific Attribution Analysis No Attribution
Analysis
Host City’s media image:
No data available to conduct an attribution analysis.
Feb. 9-Mar. 8, 2010: While early media reports drew negative attention to Vancouver’s organizational capabilities, articles towards the end of the Games report the experience as a much more positive one.

OGI-UBC Post-Games Report 4. Summary Tables of Findings for All Indicators
30
So11 – Professional Sport Education for People with Disabilities See page 219 for detailed analyses.
Games-specific Attribution
Analysis No Attribution Analysis
Professional sport education for people with disabilities
So12 – Health and Safety See page 220 for detailed analyses.
Games-specific Attribution
Analysis No Attribution
Analysis
Health and safety:
Aug. 1, 2005-Mar. 31, 2010: 128 incidents reported to WorkSafeBC (Workers’ Compensation Board of BC). No incidents led to loss of life or limb (fatal or serious incidents).

OGI-UBC Post-Games Report Appendix A
31
Appendix A: OGI 2007 Indicators Not Included in OGI 2011 Strictly speaking, there were 58 indicators in OGI 2007 that are not in OGI 2011. Note: The indicator codes are the ones used in OGI 2007, and are not the ones used in OGI 2011.
The indicators below were previously analyzed in the Vancouver OGI Pre-Games and Games-time Reports. Please refer to those reports for detailed analyses of these indicators.
Table 2: OGI 2007 Indicators Not Included in OGI 2011
Old Code in OGI 2007 Indicator
Ec01 Employment by Economic Activity
Ec03 Size of Companies
Ec04 Quality Management of Companies
Ec05 Motor Vehicle Population
Ec06 Public Transport
Ec10 Airport Traffic
Ec11 Foreign Organization Establishments
Ec14 GINI Income Distribution Index
Ec16 Price Indexes
Ec19 Economic Balance (Import / Export)
Ec20 Dynamics of Service Activities
Ec21 Investment Risks
Ec22 Foreign Direct Investment
Ec23 Economic Role of the State
Ec24 Structure of Public Spending
Ec25 Structure of Fiscal Revenue
Ec26 Public Debt

OGI-UBC Post-Games Report Appendix A
32
Old Code in OGI 2007 Indicator
Ec28 Composition of Committees by Sector
Ec30 Size and Quality Management of contracted Companies
En01 Renewable Fresh Water Use
En02 Public Water Supply
En04 Greenhouse Gas Emissions
En06 Land Use Changes
En07 Protected Sites
En09 Housing Areas
En10 Public Open-air Leisure Areas
En11 Transport Networks
En13 Road Congestion
En14 Energy Consumption by Source
En15 Energy Consumption by Use
En16 Energy Self-sufficiency
En17 Raw Material Consumption
En18 Solid Waste Treatment
En19 Wastewater Treatment
En23 Food Production Consumed during Olympic Games and Paralympic Games
En25 Indoor Air Quality
En27 Life-cycle Inventory of Olympic and Paralympic Venues
En30 Olympic Transport Impacts
So01 Political Representation

OGI-UBC Post-Games Report Appendix A
33
Old Code in OGI 2007 Indicator
So02 Legislative activity
So04 Community Centres and Associations
So05 Minorities
So15 Exclusion, Discrimination, Racism and Violence in Sport
So17 Professional Leagues
So21 Media specializing in sport
So22 Sports broadcasting
So23 Information media
So24 Information and Communications Technology
So25 Political involvement in the organization of the Games
So31 Homeless, low-rent Market and Affordable Housing
So33 Olympic and Paralympic Arts Designers and Participants
So35 Recognition of Olympic and Paralympic Logos and Mascots
So36 Reported Complaints about Racism, Discrimination and Violence during the Games
So37 National Sport Development
So38 Volunteers
So39 Spectators
So40 Attending Events – Affordable Games
So45 Support Network for Disabled People

OGI-UBC Post-Games Report Appendix B (Ec01 – Employment and Business)
34
Appendix B: Detailed Analyses of Indicators
Ec01 – Employment and Business
Focus Area Purpose (as stated in 2011 OGI)
*Employment indicators
This indicator reveals the evolution of socio-economic characteristics of the host city/region. A comparison between city, regional and national data may help to identify impacts of the Olympic Games.
Employment of people with disabilities
This indicator monitors the evolution of employment difficulty for people with disabilities in the labour market.
Wages This indicator shows the evolution of wage levels of the city (if available) the region and the country.
Wages paid in Olympic activities
This indicator determines the directly induced earnings by Olympic activities.
Jobs created in Olympic and context activities
This indicator distinguishes between the creation of new jobs associated with the Olympic and Paralympic Games, and additional work done by workers already under contract.
New Olympic and Paralympic related businesses
The Olympic and Paralympic Games can provide an opportunity for the creation of small and medium businesses (which can develop and find new markets in sports technology, marketing, consulting, etc.). This indicator describes newly created businesses directly related to the Olympic and Paralympic Games.
**Economic legacy
This indicator assesses the economic legacy created by the Games from improvements in key aspects of economic competitiveness.
Non-accredited people working in context activities
Many people work directly for the Olympic Games and/or Paralympic Games in support functions but are not registered in the accreditation system because they don't require access to Olympic and/or Paralympic venues during the Games. These people work for different authorities (municipalities or regional / national authorities) or for private organizations (support functions of sponsors, security agents, etc.). This indicator gives a more detailed overview of the number of people in different functions that generally escape Games statistics.
*Attribution analysis was conducted for at least one of the indicators in this focus area. **This is a new OGI focus area.
Employment Indicators
OGI-UBC Post-Games Report Appendix B (Ec01 – Employment and Business)
35
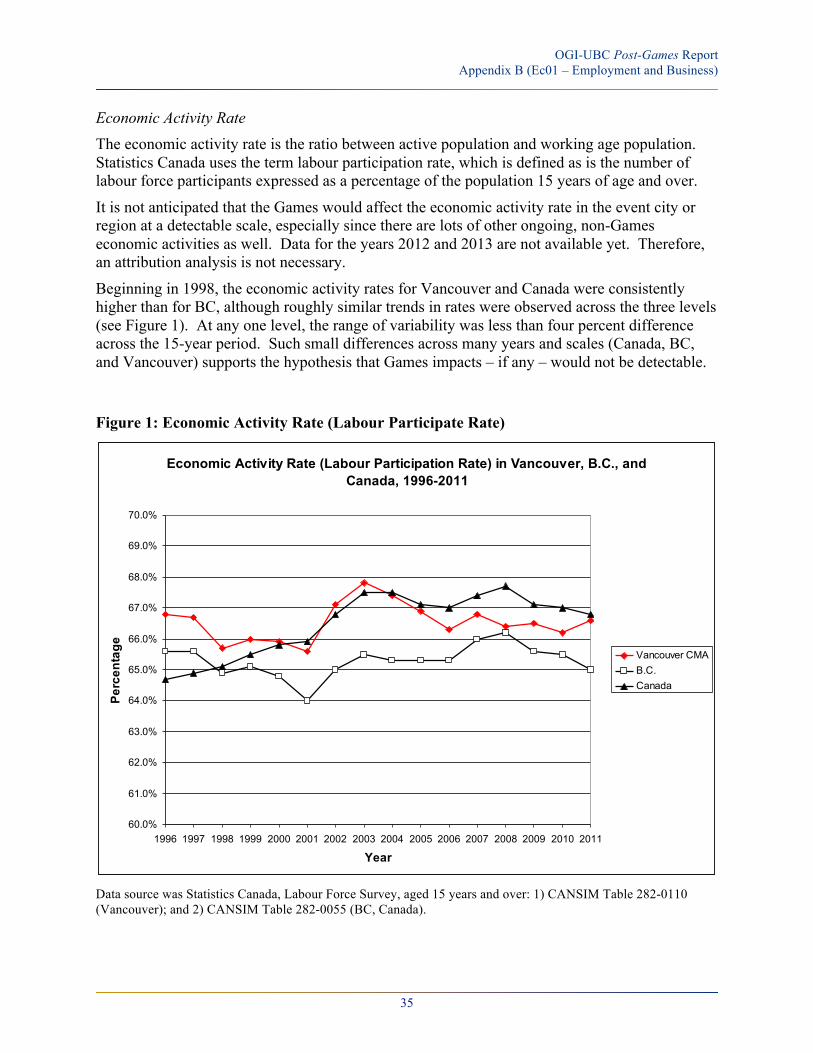
Economic Activity Rate The economic activity rate is the ratio between active population and working age population. Statistics Canada uses the term labour participation rate, which is defined as is the number of labour force participants expressed as a percentage of the population 15 years of age and over.
It is not anticipated that the Games would affect the economic activity rate in the event city or region at a detectable scale, especially since there are lots of other ongoing, non-Games economic activities as well. Data for the years 2012 and 2013 are not available yet. Therefore, an attribution analysis is not necessary.
Beginning in 1998, the economic activity rates for Vancouver and Canada were consistently higher than for BC, although roughly similar trends in rates were observed across the three levels (see Figure 1). At any one level, the range of variability was less than four percent difference across the 15-year period. Such small differences across many years and scales (Canada, BC, and Vancouver) supports the hypothesis that Games impacts – if any – would not be detectable.
Figure 1: Economic Activity Rate (Labour Participate Rate)
Data source was Statistics Canada, Labour Force Survey, aged 15 years and over: 1) CANSIM Table 282-0110 (Vancouver); and 2) CANSIM Table 282-0055 (BC, Canada).
Economic Activity Rate (Labour Participation Rate) in Vancouver, B.C., and Canada, 1996-2011
60.0%
61.0%
62.0%
63.0%
64.0%
65.0%
66.0%
67.0%
68.0%
69.0%
70.0%
1996 1997 1998 1999 2000 2001 2002 2003 2004 2005 2006 2007 2008 2009 2010 2011
Year
Perc
enta
ge
Vancouver CMAB.C.Canada

OGI-UBC Post-Games Report Appendix B (Ec01 – Employment and Business)
36
Percentage of Women in the Active Population The OGI Technical Manual states that the percentage of women in the active population is the “ratio between the number of active women and active population” (what proportion of the labour force is female). In order to take into consideration the total population of women, data on the percentage of women who are active in the labour force are reported instead (what proportion of women are in the labour force).
It is not anticipated that the Games would affect the percentage of women in the active population in the event city or region. Therefore, an attribution analysis is not necessary.
During the period 1996-2011, the percentage of women who are active in the labour force has consistently been lower than the percentage of men who are active in the labour force in Vancouver, BC, and Canada (see Figure 2). However, the 15-year overall trend at all levels appears to be an increase for females and a decrease for males, i.e., the gap between sexes with respect to labour force participation appears to be decreasing over time. For example in Vancouver, the gap between sexes was 14.2 percent in 1996 and 8.7 percent in 2011. For most years between 1996 and 2011, BC had the lowest percentage of women in the labour force compared to Vancouver and Canada.
Figure 2: Percentage of Women in Active Population
Percentage of Population in Labour Force by Gender in Vancouver, B.C., and Canada, 1996-2011
50.0%
55.0%
60.0%
65.0%
70.0%
75.0%
80.0%
1996
1997
1998
1999
2000
2001
2002
2003
2004
2005
2006
2007
2008
2009
2010
2011
Year
Perc
enta
ge
Vancouver CMA, femalesB.C., femalesCanada, femalesVancouver CMA, malesB.C., malesCanada, males

OGI-UBC Post-Games Report Appendix B (Ec01 – Employment and Business)
37
Unemployment Rate The unemployment rate is the ratio between the number of unemployed and the active population (labour force). Using available data, the following hypothesis of impact was tested: that the unemployment rate in the event region (Greater Vancouver) would begin to decrease beginning in 2004 (the year after it was announced that Vancouver would host the 2010 Olympic Winter Games) and continue to be reduced up to at least the event year of 2010 when compared to other major Canadian cities (Calgary, Edmonton, Toronto). The assumption is that Olympic-specific jobs would be created in the event region in planning for (e.g., VANOC staff), preparing for (e.g., venue construction), and hosting the Games, while indirect jobs would also be created that are beyond the influence of the OCOG (e.g., tour operators). Between 1996 and 2011, the unemployment rate fluctuated in all four CMAs (census metropolitan areas) (see Figure 3). The trends between Calgary and Edmonton in the neighbouring province of Alberta were fairly similar to each other and their unemployment rates were almost always the lowest when compared to Vancouver or Toronto. After 2002, the unemployment rate in Vancouver was consistently lower than the rate in Toronto. Also after 2002, the gap between the unemployment rates in Vancouver and the two Albertan CMAs began to narrow, such that between 2006 and 2009 the unemployment rate in Vancouver was only slightly higher than the rates in the Albertan CMAs. In 2007, the unemployment rate reached an all-time low of four percent in Vancouver during the 1996-2011 period. However, after 2009 the gap between Vancouver and the Albertan CMAs began to widen again, with simultaneous increasing unemployment rates in Vancouver and decreasing rates in the Albertan CMAs. The comparatively faster rate at which the unemployment rate decreased in Vancouver and the narrowing gap with the Albertan CMAs between 2003 and 2009 suggest that Vancouver may have enjoyed an Olympic advantage with respect to unemployment rate between 2003 and 2009. A decrease in the unemployment rate suggests that more jobs were available in Vancouver (even as the size of the labour force increased). However, data were not available on whether jobs were directly Olympic-specific (e.g., at VANOC, construction of Olympic venues), indirectly Olympic-related (e.g., tour operators), or neither (not related directly or indirectly to the Games). A rough estimate of the number of people who became employed can be calculated using the year-to-year reduction in the number of unemployed persons (the size of the labour force is not taken into consideration because its rate of growth is generally not significant, ranging from +0.2 percent to +3.8 percent). Using this method for the period 2003-2007 when unemployment rates in Vancouver decreased, an estimated 39,400 new jobs were created. This number is about twice as high as the PricewaterhouseCoopers2 estimation of 15,875-20,780 jobs that were produced or supported by the Olympics in the province of BC (not Vancouver only) between 2003 and 2008. The data suggest that beginning in 2003 some of the new jobs created in Vancouver were produced or supported by the Olympics; however, the actual number of jobs remains unknown.
2 (2009). The Games Effect: Report 3: Impact of the Olympic and Paralympic Winter Games on British Columbia and Canada: 2003-2008. Vancouver, Canada: PricewaterhouseCoopers.

OGI-UBC Post-Games Report Appendix B (Ec01 – Employment and Business)
38
In summary, Vancouver appeared to have enjoyed an Olympic advantage with respect to unemployment rate – albeit to an unknown extent – between 2003 and 2009. However, whatever Olympic advantage there was from 2003-2009 appeared to have dissipated after 2009, i.e., Vancouver did not appear to enjoy an Olympic advantage during the event year or post-Games, possibly because Games-related employment would have dissipated after the event itself (February to March 2010) was over.
Figure 3: Unemployment Rate
Data source: Statistics Canada, CANSIM Table 282-0110, Labour Force Survey for population aged 15 years and over.
Foreign-born Unemployment Rate
The foreign-born unemployment rate is a new OGI indicator. Compared against the Canadian-born unemployment rate, it reflects potential differences in employment patterns by immigrant status. Using available data, the following hypothesis of impact was tested: that any Olympic advantage in unemployment rate in Vancouver should also be observed among those who are foreign-born.
Unemployment Rate in Vancouver, Calgary, Edmonton, and Toronto Census Metropolitan Areas (CMAs), 1996-2011
0.0%
1.0%
2.0%
3.0%
4.0%
5.0%
6.0%
7.0%
8.0%
9.0%
10.0%
1996 1997 1998 1999 2000 2001 2002 2003 2004 2005 2006 2007 2008 2009 2010 2011
Year
Une
mpl
oym
ent R
ate
VancouverCalgaryEdmontonToronto

OGI-UBC Post-Games Report Appendix B (Ec01 – Employment and Business)
39
Between 2006 and 2011 in Vancouver, the unemployment rate for landed immigrants was consistently higher than for the total population (Figure 4), which suggests that landed immigrants face a slight disadvantage compared to the general population with respect to employment. The trends in unemployment rate between landed immigrants and the total population were similar, which suggests that landed immigrants may have also enjoyed an Olympic advantage in employment, at least from 2006-2008 (conclusions are not made about the rate before 2006 due to lack of available data). In summary, when compared to the total population in Vancouver, those who are foreign-born also appeared to enjoy an Olympic advantage in employment between 2006 and 2008.
Figure 4: Unemployment rate by Immigrant Status
Data source was Statistics Canada, Labour Force Survey for population aged 15 years and over: 1) CANSIM Table 282-0102; and 2) CANSIM Table 282-0110. A landed immigrant is a person who has been granted the right to live in Canada permanently by immigration authorities. Excluded are Canadian citizens born outside Canada and non-permanent residents.
Unemployment Rate in Vancouver CMA, Landed Immigrants and Total Population, 2006-2011
0.0%
1.0%
2.0%
3.0%
4.0%
5.0%
6.0%
7.0%
8.0%
9.0%
10.0%
2006 2007 2008 2009 2010 2011
Year
Une
mpl
oym
ent R
ate
Landed immgrantsTotal population

OGI-UBC Post-Games Report Appendix B (Ec01 – Employment and Business)
40
Employment of People with Disabilities There is a lack of regular, longitudinal data on employment of people with disabilities in Canada. Therefore, no attribution analysis is conducted, although a possible Olympic impact is an increase in employment of people with disabilities as awareness is raised through the Paralympic Games. Data for Canada for the year 2006 were retrieved from the Statistics Canada report titled Participation and Activity Limitation Survey 2006: Labour Force Experience of People with Disabilities in Canada (2009). The report is based on data from the Participation and Activity Limitation Survey (PALS),3 which is no longer active.
• Ratio of active population with disabilities to active population (proportion of the labour force who have disabilities): 8.4 percent
• Ratio of active population with disabilities to population with disabilities (proportion of people with disabilities who are in the labour force): 55.8 percent (vs. 80.2 percent of people without disabilities who were in the labour force)
• Ratio of the number of unemployed people with disabilities to the number of people with disabilities actively working (ratio of unemployed: employed for people with disabilities): 0.095 (or 10.5 times as many people with disabilities were employed than unemployed) (vs. 15.0 times as many people without disabilities were employed than unemployed)
• Neither the average nor median wage of employed persons with disabilities was available. Instead, data are presented on the average total income – $27,031 for people with disabilities and $37,998 for people without disabilities.4
In summary, the data suggest that in the mid-2000s in Canada, a disproportionately lower number of people with disabilities were in the labour force and employed compared to people without disabilities. In addition, working people with disabilities were on average earning less than working people without disabilities.
Wages The Games are not anticipated to significantly influence wages in the event city or region (no attribution analysis was conducted) at a detectable scale, as the Games constitute only one type of economic activity, and wages are influenced by many other factors. In addition, data were only available at the BC and Canada levels. Mean and Median Hourly Wage Rates (Overall)
The mean and median hourly wage rates overall (in current dollars)5 for BC and Canada between 1997 and 2011 are shown in Figure 5. In absolute terms (not accounting for inflation), both the
3 A previous attempt was made to collect data on disabilities using the Health and Activity Limitation Survey or HALS (1986 and 1991). However, the data from HALS are not comparable with data from PALS (2001 and 2006). 4 Retrieved on July 27, 2012 from Human Resources and Skills Development Canada: http://www.hrsdc.gc.ca/eng/disability_issues/reports/disability_profile/2011/fact_sheet/income.shtml.

OGI-UBC Post-Games Report Appendix B (Ec01 – Employment and Business)
41
mean and median hourly wages rates show an overall increasing trend in both BC and Canada, with the most recent mean and median wage rates in 2011 being at least $20.00/hour. Mean hourly wage rates are consistently higher than median hourly wage rates, which suggest that the distribution of wage rates is skewed towards higher wages (thus making the mean higher than the median).
Figure 5: Mean and Median Wage Rates
Data source: Statistics Canada, CANSIM Table 282-0070, Labour Force Survey, current dollars.
Ratio between Men and Women’s Wages Between 1997 and 2011 in both BC and Canada, the mean and median wage rates for men were consistently at least 1.16 times higher than for women (see Figure 6). However, there appears to
5 “Current dollars” means dollars in the year they were actually received or paid, unadjusted for price changes. It means that dollar values are not converted to present-day dollars or any other reference year (“chained”).
Mean and Median Hourly Wage Rates in Current Dollars for B.C. and Canada, 1997-2011
$0.00
$5.00
$10.00
$15.00
$20.00
$25.00
Year
Hou
rly W
age
Rat
e (C
urre
nt D
olla
rs)
Canada Mean $15.59 $15.78 $16.17 $16.66 $17.21 $17.66 $18.05 $18.50 $19.09 $19.72 $20.41 $21.31 $22.04 $22.53 $22.99
B.C. Mean $16.91 $17.16 $17.32 $17.63 $17.98 $18.60 $19.04 $19.00 $19.37 $19.92 $20.48 $21.41 $22.17 $22.78 $23.17
Canada Median $14.00 $14.29 $14.50 $15.00 $15.38 $15.65 $16.00 $16.35 $17.00 $17.31 $18.00 $18.75 $19.23 $20.00 $20.00
B.C. Median $16.00 $16.48 $16.80 $16.92 $17.00 $17.46 $18.00 $17.79 $18.00 $18.00 $19.00 $19.62 $20.00 $20.98 $20.85
1997 1998 1999 2000 2001 2002 2003 2004 2005 2006 2007 2008 2009 2010 2011

OGI-UBC Post-Games Report Appendix B (Ec01 – Employment and Business)
42
be a slight decreasing trend in the ratio, suggesting that the gap in wage rates between sexes is narrowing in BC and in Canada.
Figure 6: Ratio of Men: Women Mean and Median Hourly Wage Rates
Data source: Calculated from Statistics Canada, CANSIM Table 282-0070, Labour Force Survey, current dollars.
Wages Paid in Olympic Activities
No new data on wages for Olympic activities are expected after the Post-Games report because the VANOC had already been dissolved. The data presented are from the Post-Games report.
VANOC spent a total of $298.4 million (Canadian dollars) on staffing costs from the time it was incorporated until a few months after the Games. The largest proportion of staffing costs (29 percent) was spent on Service and Games Operations ($86.3 million). Due to the lack of data on the residence of wage-earners and where they spend their money, a multiplier effect cannot be discerned with respect to which economy benefited (local, regional, national, foreign).
Ratio of Men:Women Mean and Median Hourly Wage Rates for B.C. and Canada, 1997-2011
1.05
1.10
1.15
1.20
1.25
1.30
1.35
Year
Rat
io M
en:W
omen
Mean Canada 1.23 1.23 1.23 1.24 1.24 1.22 1.21 1.20 1.19 1.19 1.19 1.19 1.18 1.17 1.16
Mean B.C. 1.25 1.22 1.21 1.23 1.21 1.20 1.19 1.18 1.20 1.21 1.19 1.21 1.21 1.21 1.19
Median Canada 1.27 1.28 1.26 1.29 1.25 1.25 1.25 1.20 1.24 1.22 1.22 1.19 1.18 1.20 1.18
Median B.C. 1.31 1.29 1.27 1.29 1.28 1.26 1.25 1.23 1.25 1.22 1.24 1.23 1.26 1.24 1.26
1997 1998 1999 2000 2001 2002 2003 2004 2005 2006 2007 2008 2009 2010 2011

OGI-UBC Post-Games Report Appendix B (Ec01 – Employment and Business)
43
Table 3: Wages Paid in Olympic Activities
VANOC Operating Expense Staffing Cost (in millions)
Revenue, marketing, and communications $43.6
Sport and games operations (delivery of sporting competitions, venue management, medical and anti-doping services)
$46.5
Service and games operations (overlay program, food and beverage services, Olympic and Paralympic Villages, accommodation services, transportation, logistics, snow removal, cleaning and waste services, ceremonies and the Cultural Olympiad, press and broadcast services, property rentals)
$86.3
Technology (energy services, timing and scoring, Games management systems, internet services, broadcast integration services, telecommunications, ongoing network services)
$31.0
Workforce and sustainabilitya $51.4
Finance (administration, legal services, risk and assurance, financial services, dissolution of VANOC)
$39.6
Total $298.4 Data source: Consolidated Financial Statements of the Vancouver Organizing Committee for the 2010 Olympic and Paralympic Winter Games for the cumulative period from September 30, 2003 (incorporation) to July 31, 2010. a “Sustainability” in this table does not refer to a specific department, but rather to VANOC sustainability activities across the organization.
Jobs Created in Olympic and Context Activities
Number of Jobs Created Available data on the number of jobs created or supported by the Olympics were retrieved from the PricewaterhouseCoopers (PwC) report titled The Games Effect: Report 7: Global Summary of the Impact of the 2010 Olympic and Paralympic Winter Games on British Columbia and Canada 2003 to 2010 (October 2011). PwC estimated that a low of 38,530 to a high of 51,510 jobs (midpoint of 45,020 jobs) were created in BC between January 2003 and December 2010, with 21,690 of those jobs occurring during the event year (2010). These estimates include jobs in construction, operations, and tourism, and do not include projects like the Sea-to-Sky Highway, Canada Line, and expansion of the Vancouver Convention and Exhibition Centre (considered to be context activities). Local Hiring
No data were available on the percentage of local hiring jobs and percentage of VANOC positions filled by local residents. The only data available from the VANOC Sustainability Report 2009-10, which reported that 8 of the 18 full-time senior management personnel (director

OGI-UBC Post-Games Report Appendix B (Ec01 – Employment and Business)
44
level and above) hired during the reporting period as at February 12, 2010 were from Canada (44 percent).
New Olympic and Paralympic Related Businesses
Available data on new Olympic and Paralympic-related businesses were retrieved from the PwC report titled The Games Effect: Report 7: Global Summary of the Impact of the 2010 Olympic and Paralympic Winter Games on British Columbia and Canada 2003 to 2010 (October 2011). Based on economic modelling, PwC estimated that about 1,500 new businesses (both directly and indirectly related to the 2010 Winter Games) were created in BC between 2003 and 2010 as a result of induced economic growth from hosting the Games.
Economic legacy
Economic legacy is a new OGI indicator that includes:
• Total number of programs to qualify local work force and enhance professional skills and knowledge of local population, and number of people qualified; and
• Total number of new technology and innovations designed, implemented, or scaled up directly induced by the Games.
Skills Training Programs
Data on skills training programs were retrieved from the VANOC Sustainability Report 2009-10. Between 2006 and 2010, VANOC collaborated with community organizations, industry, and government partners to create a total of 267 training positions for priority populations, of which 220 positions were filled. Priority populations include inner city residents, Aboriginal peoples, persons with a disability, and new immigrants. The types of skills training provided included customer service, carpentry, and material handling. A total of 35 trainees were hired for VANOC jobs, including the RONA Vancouver 2010 Fabrication Shop that made items for the 2010 Winter Games such as podiums and wheelchair ramps.
New Technology and Innovations Data on new technology and innovations were retrieved from the VANOC Sustainability Report 2009-10. Through an initiative called the Vancouver 2010 Sustainability Star Program, a total of 62 sustainability innovations related to Olympic venues, villages and operations were identified (awarded a “star”) between 2006 and 2010 for VANOC and Games partners and sponsors. The criteria to be awarded a star were that an innovation must demonstrate two or more sustainability features (social, economic, and/or environmental), be directly linked to the 2010 Winter Games, produce a measureable outcome, and be new to the Games region or the Games in general or significantly scaled up through the Games. Examples of star innovations included clean power, ethical sourcing, and the Olympic Line (a 60-day demonstration streetcar project that was free to all riders during the Games).

OGI-UBC Post-Games Report Appendix B (Ec01 – Employment and Business)
45
Non-accredited People Working in Context Activities No new data were expected after the Games. The data presented here are from the Vancouver OGI Post-Games Report. Data on accreditation were not available. Instead, data on the number of staff (regardless of whether they were accredited or not, which was not specified) involved in the Games-time external workforce (security and police force, the City of Vancouver “Host City Team” and the transit host program) and in the Games-time Olympic workforce were used. The support functions shown in Table 4 for the Games-time external workforce are not exhaustive; they only reflect data that were available. The available data show that approximately 15,695 staff were reported to have been part of the Games-time external workforce. This external workforce was fairly large as it was almost three-quarters the size of the Olympic workforce (21,693). The Olympic workforce itself was composed mostly of volunteers (17,273). Additional data from the Vancouver Police Department (VPD), which is a different police force from the RCMP, estimated an Olympic-related cost of $5.9 million in overtime pay for VPD staff (vs. number of staff) between February 1 and 28, 2010, and $7.8 million in overtime pay from 2009-2010.6
Although the available data do not specify whether members of either the Olympic or external workforce were accredited or not, the data do suggest that the external workforce that supported the Games was fairly large, especially when compared to the size of the Olympic workforce and given that the numbers for the external workforce are not exhaustive. The external workforce is an important, additional resource that supports, but is not part of, the organizing committee.
Table 4: Non-accredited People Working in Context Activities
Activity Number of Staff
Games-time external workforce
Security and police (RCMP) 15,000
City of Vancouver staff “Hosts” 485
Transit hosts 210
Subtotal 15,698
6 Data are as of June 8, 2010 from the Vancouver Police Department (http://vancouver.ca/police/assets/pdf/foi/2010/foi-olympic-overtime-estimates-feb-2010.pdf, accessed on August 30, 2012).

OGI-UBC Post-Games Report Appendix B (Ec01 – Employment and Business)
46
Games-time Olympic workforce
Contractors 763
Co-op/intern 143
Full-time 1,331
Temporary 1,578
Secondee 356
Volunteer 17,273
Subtotal 21,693 Data sources for Games-time external workforce: 1) Royal Canadian Mounted Police (RCMP), BC, Canada (http://bc.rcmp.ca); 2) City of Vancouver (http://vancouver.ca); and 3) TransLink (buzzer.translink.ca). Data source for Games-time Olympic workforce: VANOC Sustainability Report 2009-10 (numbers are as at February 12, 2010).
Summary and Interpretation of Employment and Business Indicators Between 2003 and 2009, Vancouver CMA may have enjoyed an Olympic advantage in terms of a reduction in the unemployment rate; however, any Olympic advantage appears to have been lost after 2009, possibly because Games-related employment would have dissipated after the event itself (February to March 2010) was over. The context of employment at all levels (national, provincial, and municipal) is an underlying disadvantage for specific sub-populations (foreign-born, females, and people with disabilities) with respect to labour force participation, unemployment rate, and/or wages.
The 2010 Winter Games appeared to have created or supported both the creation of new businesses (estimated to be about 1,500 businesses) and jobs (estimate of between 38,530 and 51,510 jobs) in BC between January 2003 and December 2010. Some of these jobs would have included the Games-time external workforce. Staffing costs for VANOC (internal workforce) amounted to $298.4 million. With respect to economic legacies, VANOC was involved in skills training programs that targeted priority (disadvantaged) populations, with some of the trainees being hired for Olympic work. VANOC also attempted to foster innovation through its Sustainability Star program.

OGI-UBC Post-Games Report Appendix B (Ec02 – Tourism)
47
Ec02 – Tourism Indicators
Focus Area Purpose (as stated in 2011 OGI)
*Accommodation infrastructure
This indicator describes the evolution of the number of hotels and similar establishments by category and estimated guest capacity. The evolution of accessible guest accommodation assesses the impact of hosting the Paralympic Games in the creation of possibilities for accessible tourism.
*Accommodation occupancy rate
This indicator monitors the occupancy rate of hotel and similar establishments in each national category. It shows how well the available hotel infrastructure meets demand pre-, during and post-Games. A comparison between regional and national data may provide additional insights on the regional impact of the Olympic Games.
*Tourist nights This indicator highlights the evolution of the number of tourists in hotels and similar establishments and their length of stay pre-, during and post-Games Period.
*Visitors spending
This indicator estimates the spending of tourists who come specifically for the Games (the visitors). Through comparison of this information with data for other years, extra monetary resources injected into the local economy due to the Olympic and Paralympic Games can be estimated.
*Hosting international events
This indicator captures the attractiveness of the host region and country for international events. A comparison between regional and national data reveals the impact of the Olympic and Paralympic Games on relative attractiveness.
*All Tourism indicators are anticipated to show increases, at least during the event. Therefore, all Tourism indicators will be analyzed with respect to attribution (Games impact).
Accommodation Infrastructure
No data were available for accommodation properties or rooms that accommodate people with disabilities.
Accommodation Property Count Using available data, comparisons are made within BC for the following hypothesis of impact: that property counts in event regions (Greater Vancouver and Squamish-Lillooet) would increase around the time of the event (2010) compared to the rest of BC in order to deal with an anticipated influx of tourists for the Games. Between 2000 and 2010, the total number of accommodation properties in BC remained relatively stable, with a slight peak in the mid-2000s, a slight decline in the late 2000s (during the recession), and showing an increase in 2010 (see Figure 7). Similar trends were observed in regions where the 2010 Winter Olympic Games were held – in Greater Vancouver and in

OGI-UBC Post-Games Report Appendix B (Ec02 – Tourism)
48
Squamish-Lillooet (see Figure 8) – as well as in the rest of BC (see Figure 7). The similarities in trends at the provincial level, in the Games locations, and in the rest of the province suggest that the 2010 Winter Games did not have a significant impact on the number of accommodation properties during the period 2000-2010.
As seen in Table 5, Greater Vancouver had the second highest increase (13.5 percent) in number of accommodation properties in 2010 compared to 2009, while Squamish-Lillooet had the fourth highest increase (8.0 percent). The comparatively larger increases in the event regions suggest that the 2010 Winter Games may have contributed, at least in part, to there being more accommodation properties in the event regions in 2010 than ‘normal.’ However, without data for 2011 and after, no conclusions can be made about whether the number of accommodation properties in the event regions will be maintained or will continue to increase more than ‘normal’ post-Games.
In summary, the data provide some support to the hypothesis that the Games may have contributed to a slightly higher than ‘normal’ increase in the number of accommodation properties during the event year (2010) but not before, while what happens post-event remains unknown.
Figure 7: Accommodation Infrastructure - Property Count (a)
Data source: BC Stats.
Accommodation Property Count in B.C. and Event Regions, 2000-2010
0
500
1,000
1,500
2,000
2,500
3,000
2000 2001 2002 2003 2004 2005 2006 2007 2008 2009 2010
Year
Num
ber o
f Pro
perti
es
Greater Vancouver
Squamish-Lillooet
B.C., other
B.C., total

OGI-UBC Post-Games Report Appendix B (Ec02 – Tourism)
49
Figure 8: Accommodation Infrastructure - Property Count (b)
Data source: BC Stats.
Table 5: Accommodation Infrastructure - Property Count and Room Count in Regions in BC
Region in BC
% Change 2009-2010
Property Count Room Count
North Okanagan 16.0% 28.7%
Greater Vancouver 13.5% 10.3%
Mount Waddington 8.1% 3.5%
Squamish-Lillooet 8.0% 16.2%
Thompson-Nicola 5.1% 7.2%
Accommodation Property Count in Event Regions, 2000-2010
0
50
100
150
200
250
300
350
2000 2001 2002 2003 2004 2005 2006 2007 2008 2009 2010
Year
Num
ber o
f Pro
perti
es
Greater Vancouver
Squamish-Lillooet

OGI-UBC Post-Games Report Appendix B (Ec02 – Tourism)
50
Region in BC
% Change 2009-2010
Property Count Room Count
Fraser Valley 4.9% 4.0%
Fraser-Ft George 4.2% 3.3%
Kitimat-Stikine 3.8% 7.1%
Okanagan-Similkameen 2.8% 0.3%
East Kootenay 2.7% 12.4%
Cariboo 2.5% 3.5%
Skeena-Queen Charlotte 1.9% 2.3%
Comox+Strathcona 1.8% 2.6%
Central Okanagan 1.2% 21.4%
Powell River 0.0% 0.0%
Sunshine Coast 0.0% -0.9%
Columbia-Shuswap 0.0% -2.8%
Central Kootenay 0.0% 1.7%
Kootenay Boundary 0.0% -1.2%
Capital -1.0% -1.8%
Alberni-Clayoquot -1.1% 3.7%
Northeast -1.1% 4.0%
Nanaimo -1.2% -7.0%
Nechako -1.4% -0.6%
Cowichan Valley -2.3% -5.1%
Central Coast -5.9% -6.5%

OGI-UBC Post-Games Report Appendix B (Ec02 – Tourism)
51
Region in BC
% Change 2009-2010
Property Count Room Count
British Columbia 3.3% 6.6% Data source: BC Stats.
Accommodation Room Count Using available data, comparisons are made within BC for the following hypothesis of impact: that room counts in event regions (Greater Vancouver and Squamish-Lillooet) increased around the time of the event (2010) compared to the rest of BC in order to deal with an anticipated influx of tourists for the Games. Similar to the trend for accommodation property count between 2000 and 2010, the trend for accommodation room count also appeared to have a slight mid-2000s peak, a slight late-2000s dip, and an increase in 2010 in BC (see Figure 9) and in the event regions (see Figure 10). However, there also appeared to be an overall trend of increasing accommodation room count in BC. During this 10-year period in BC, the lowest room count (94,474 rooms) was in 2000, while the highest count (106,393) was in 2010. In the event regions, however, the trends, while similar, did not appear to increase overall. Therefore, the Games did not appear to have significantly affected (increased) the number of accommodation rooms in the event regions during the 10-year period. An exception may be in 2010 (event year). Greater Vancouver had the fifth highest increase (10.3 percent) in number of accommodation properties in 2010 compared to 2009, while Squamish-Lillooet had the third highest increase (16.2 percent) (see Table 5). The comparatively larger increases in the event regions suggest that the 2010 Winter Games may have contributed, at least in part, to there being more accommodation rooms in the event regions in 2010 than ‘normal.’ However, without data for 2011 and after, no conclusions can be made about whether the number of accommodation rooms in the event regions will be maintained or will continue to increase more than ‘normal’ post-Games. In summary, the data provide some support to the hypothesis that the Games may have contributed to a slightly higher increase in the number of accommodation rooms during the event year (2010) but not before, while what happens post-event remains unknown.

OGI-UBC Post-Games Report Appendix B (Ec02 – Tourism)
52
Figure 9: Accommodation Infrastructure - Room Count (a)
Data source: BC Stats.
Accommodation Room Count in B.C. and Selected Areas, 2000-2010
0
20,000
40,000
60,000
80,000
100,000
120,000
2000 2001 2002 2003 2004 2005 2006 2007 2008 2009 2010
Year
Num
ber o
f Roo
ms
Greater Vancouver
Squamish-Lillooet
B.C., other
B.C., total

OGI-UBC Post-Games Report Appendix B (Ec02 – Tourism)
53
Figure 10: Accommodation Infrastructure - Room Count (b)
Data source: BC Stats.
Accommodation Occupancy Rate
Using available data, the following hypothesis of impact was tested: that accommodation occupancy rate in the event region (Greater Vancouver) increased around the time of the event (2010) compared to other major cities in Canada (Calgary and Toronto), based on the assumption that more tourists will visit in relation to the Games. Like Vancouver, Calgary is a city in western Canada. Calgary is also a previous host city for the 1988 Winter Olympic Games. Toronto is a city in eastern Canada that is often viewed as a competing city for Vancouver.
Between 2000/2001 to 2011, the trends in accommodation occupancy rates were similar between Greater Vancouver, BC, Calgary, and Toronto (see Figure 11), although Greater Vancouver has consistently had one of the highest occupancy rates among the locations compared. A rise in the mid-2000s is followed by a dip in the late-2000s. In 2010 in Greater Vancouver, BC, and Toronto, an increase in rate was observed, followed by a decrease in the following year. In Calgary, however, the reverse was observed (a dip in 2010 followed by an increase in 2011). The similarities in trends between event and non-event locations suggests that the Games did not significantly affect accommodation occupancy rate in the event region (data were not available for the other event region – Squamish-Lillooet region).
Accommodation Room Count in Selected Areas in Event Regions, 2000-2010
0
5,000
10,000
15,000
20,000
25,000
30,000
35,000
2000 2001 2002 2003 2004 2005 2006 2007 2008 2009 2010
Year
Num
ber o
f Roo
ms
Greater Vancouver
Squamish-Lillooet

OGI-UBC Post-Games Report Appendix B (Ec02 – Tourism)
54
A closer look at the year 2010 shows that both the number of rooms available and rooms occupied increased in Greater Vancouver (see Figure 12) and in the rest of BC (see Figure 13). This finding suggests that being an event region did not afford Greater Vancouver a significant advantage in either room supply or demand during the event year (compared to non-event regions), although there may have been a more than ‘normal’ slight increase in both room supply and demand in the event region during the event year. Between 2009 and 2010, Greater Vancouver experienced a larger increase in both the number of rooms available (+10.3 percent) and the number of rooms occupied (+18.9 percent) than did the rest of BC (+5.1 percent in the number of rooms available and +4.3 percent in the number of rooms occupied). In 2011 compared to 2010, occupancy rates had decreased the most in Greater Vancouver (-4.0 percent), followed by BC (-0.8 percent) and Toronto (-0.6 percent), while occupancy rate increased in Calgary (+4.5 percent) (see Figure 11). These data suggest that any slight, Olympic effect on occupancy rate in Greater Vancouver during the event year did not appear to be maintained post-Games. A possible explanation for the observed dip in 2010 and subsequent increase in 2011 in Calgary may have been due to tourists travelling to Vancouver instead of Calgary (both are cities in Western Canada) during the event year. However, without data on both the number of rooms available and the number of rooms occupied for Calgary, this hypothesis can be neither supported nor refuted.
In summary, the data provide some support to the hypothesis that the Games may have contributed to a slightly higher accommodation occupancy rate during the event year (2010) but not before, while what happens post-event remains unknown.
Figure 11: Accommodation Occupancy Rate (a)
Data sources: 1) BC Ministry of Jobs, Tourism and Innovation (for Greater Vancouver and BC); 2) Alberta Tourism, Parks and Recreation (for Calgary); and 3) Tourism Toronto.
Hotel Occupancy Rates for Greater Vancouver, B.C., Calgary and Toronto, 1999-2011
50.0%
55.0%
60.0%
65.0%
70.0%
75.0%
80.0%
1999 2000 2001 2002 2003 2004 2005 2006 2007 2008 2009 2010 2011
Year
Rat
e
Greater VancouverCalgaryTorontoB.C.

OGI-UBC Post-Games Report Appendix B (Ec02 – Tourism)
55
Figure 12: Accommodation Occupancy Rate (b)
Data sources: 1) BC Ministry of Jobs, Tourism and Innovation (BC); and 2) BC Stats (Greater Vancouver).
Accommodation Occupancy in Greater Vancouver, 2000-2010
0
10,000
20,000
30,000
40,000
50,000
60,000
2000 2001 2002 2003 2004 2005 2006 2007 2008 2009 2010
Year
Num
ber o
f Roo
ms
Occupied
Total
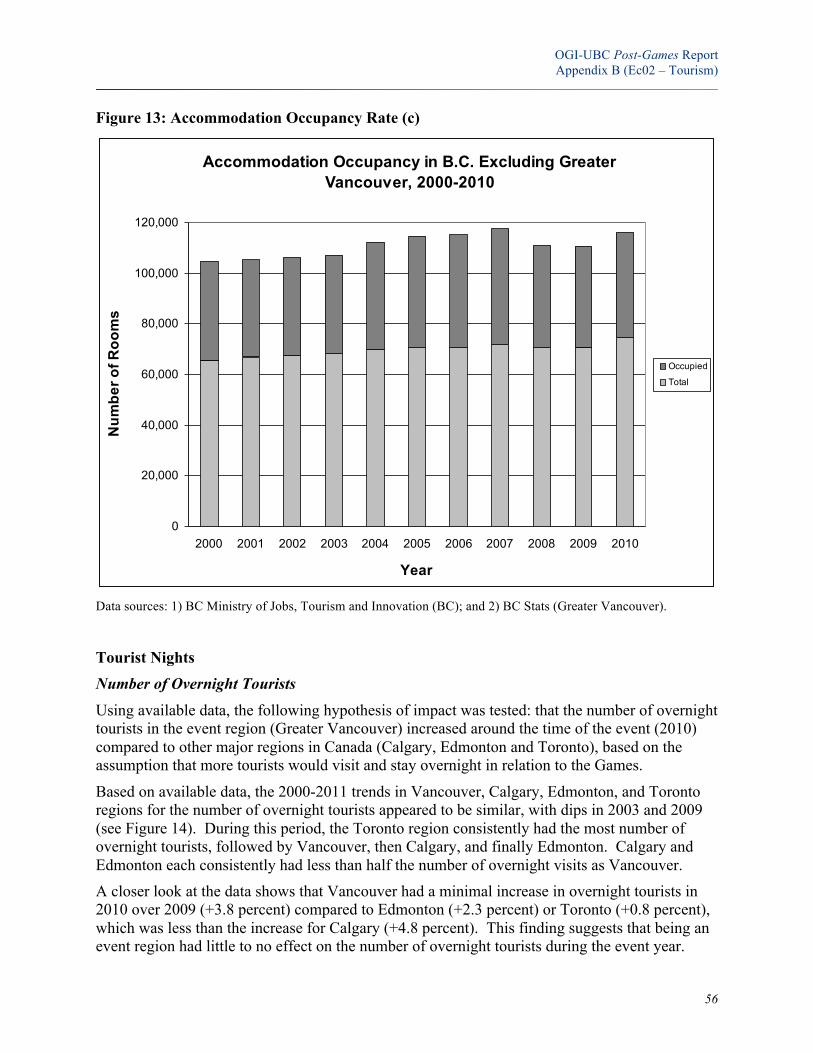
OGI-UBC Post-Games Report Appendix B (Ec02 – Tourism)
56
Figure 13: Accommodation Occupancy Rate (c)
Data sources: 1) BC Ministry of Jobs, Tourism and Innovation (BC); and 2) BC Stats (Greater Vancouver).
Tourist Nights Number of Overnight Tourists
Using available data, the following hypothesis of impact was tested: that the number of overnight tourists in the event region (Greater Vancouver) increased around the time of the event (2010) compared to other major regions in Canada (Calgary, Edmonton and Toronto), based on the assumption that more tourists would visit and stay overnight in relation to the Games.
Based on available data, the 2000-2011 trends in Vancouver, Calgary, Edmonton, and Toronto regions for the number of overnight tourists appeared to be similar, with dips in 2003 and 2009 (see Figure 14). During this period, the Toronto region consistently had the most number of overnight tourists, followed by Vancouver, then Calgary, and finally Edmonton. Calgary and Edmonton each consistently had less than half the number of overnight visits as Vancouver. A closer look at the data shows that Vancouver had a minimal increase in overnight tourists in 2010 over 2009 (+3.8 percent) compared to Edmonton (+2.3 percent) or Toronto (+0.8 percent), which was less than the increase for Calgary (+4.8 percent). This finding suggests that being an event region had little to no effect on the number of overnight tourists during the event year.
Accommodation Occupancy in B.C. Excluding Greater Vancouver, 2000-2010
0
20,000
40,000
60,000
80,000
100,000
120,000
2000 2001 2002 2003 2004 2005 2006 2007 2008 2009 2010
Year
Num
ber o
f Roo
ms
Occupied
Total

OGI-UBC Post-Games Report Appendix B (Ec02 – Tourism)
57
Any minor positive effect for Vancouver also appears to have been lost in the year after the event (2011), as the number of overnight tourists in Toronto increased in 2011 over 2010 while the number in Vancouver had decreased. In summary, the data provide weak evidence to support the hypothesis that the number of overnight tourists in the event region (Greater Vancouver) increased around the time of the event (2010). In other words, a possible minimal increase (if at all) in overnight tourists in Greater Vancouver appeared to have been lost in the year after the event.
Figure 14: Overnight Tourists (a)
Data sources: 1) Tourism Vancouver; 2) Alberta Tourism, Parks and Recreation (for Calgary and Edmonton); and 3) Tourism Toronto. Data were not obtained for 2005 for Calgary and Edmonton.
Average Length of Stay
Using available data, the following hypothesis of impact was tested: that average length of stay of visitors would increase more in the event region (Greater Vancouver) around the time of the event (2010) than in either the Calgary or Edmonton regions (data were not available for Toronto), based on the assumption that tourists would stay longer in relation to the Games.
Between 1998 and 2011, visitors consistently stayed longer on average in Greater Vancouver (3.8 to 5 nights) than in either the Calgary (2.97 to 4 nights) or Edmonton (3.0 to 3.5 nights) region (see Figure 15). During the 13-year period, there appeared to be an overall slight
Overnight Tourists to Selected Regions in Canada, 2000-2011
0.00
2.00
4.00
6.00
8.00
10.00
12.00
2000 2001 2002 2003 2004 2005 2006 2007 2008 2009 2010 2011
Year
Num
ber o
f Ove
rnig
ht T
ouris
ts (i
n m
illio
ns)
Greater VancouverCalgary and areaEdmonton and areaToronto region

OGI-UBC Post-Games Report Appendix B (Ec02 – Tourism)
58
increasing trend in the average length of stay, with the exception of a slight dip in 2007 in Calgary and Edmonton and in 2008 in Vancouver. Between 1998 and 2011, the highest average length of stay in Vancouver was in 2009, which was not during the event year (2010). The peak in 2009 in Vancouver (17.4 per cent increase from 2008) was comparable to the peak in 2008 in Calgary (17.1 per cent increase from 2007) one year earlier. Relative to the overall trend from 1998 to 2009, the data for the event year (2010) in each of the three regions did not appear unusually high or low. In 2011, which was one year after the 2010 Winter Games, the average length of stay remained stable at 4.9 nights. The lack of a peak in average length of stay in Vancouver in the event year or thereafter suggests that the 2010 Winter Games did not increase average length of stay by visitors. One may hypothesize that the peak average length of stay in Vancouver in 2009 (one year prior to the event) may be related to the 2010 Winter Games (perhaps visitors stay longer just before the Games rather than during the event year). However, the data from Calgary (a comparable increase and a peak one year earlier than in Vancouver) suggests little evidence for this latter hypothesis.
In summary, the data did not support the hypothesis that average length of stay in the event region (Greater Vancouver) increased around the time of the event (2010) or thereafter more than in comparison regions (Calgary and Edmonton). In other words, Greater Vancouver did not appear to have an Olympic Host advantage in how long visitors stayed.
Figure 15: Average Length of Stay
Data were obtained from Tourism Vancouver and from Alberta Tourism, Parks and Recreation (for Calgary and Edmonton).
Average Length of Stay (Overnight Visits) in Vancouver, Calgary, and Edmonton Regions, 1998-2011
0.00
1.00
2.00
3.00
4.00
5.00
6.00
1998 1999 2000 2001 2002 2003 2004 2005 2006 2007 2008 2009 2010 2011
Year
Ave
rage
Num
ber o
f Nig
hts
Greater VancouverCalgary and areaEdmonton and area

OGI-UBC Post-Games Report Appendix B (Ec02 – Tourism)
59
Visitor Spending Using available data, the following hypothesis of impact was tested: that visitor spending would increase more in the event region (Greater Vancouver) around the time of the event (2010) than in other major regions in Canada (Calgary, Edmonton and Toronto). A breakdown by type of expense was not available. Comparable data between regions by month were not available. Therefore, analyses could not be conducted to examine the effect of the Games during the event months specifically (February 2010 for the Olympic Games and March 2010 for the Paralympic Games) (to test the hypothesis that visitors would spend more in total during the event months but not necessarily during the rest of that year). The trends between the comparison regions are roughly similar, with low points in 2003 and around 2009 (although there are greater differences between the trends than in the above tourism indicators) (see Figure 16). Annual visitor spending was highest in Toronto, except for a few years when it was exceeded by Vancouver. Visitor spending in each of Calgary and Edmonton was less than half of visitor spending in Toronto and in Vancouver.
A closer look at the data shows that Vancouver experienced a +9.4 percent increase in visitor spending in 2010 over 2009, which was less than in Toronto (+11.5 percent), but more than in Calgary (+9.0 percent) or Edmonton (-0.9 percent). This finding suggests that being an event region had little to no effect on visitor spending during the event year, especially as visitor spending was higher in Toronto than in Vancouver, and the rate of increase in Calgary was very similar. Due to lack of available data, it is unclear whether any potential impact (if at all) of the Games on visitor spending would have been maintained in Vancouver post-Games. In summary, the data did not support the hypothesis that visitor spending in the event region (Greater Vancouver) increased around the time of the event (2010) more than in comparison cities. In other words, Greater Vancouver did not appear to have an Olympic Host advantage in how much visitors spent.

OGI-UBC Post-Games Report Appendix B (Ec02 – Tourism)
60
Figure 16: Visitor Spending
Data sources: 1) Tourism Vancouver; 2) Alberta Tourism, Parks and Recreation (Calgary, Edmonton); and 3) Tourism Toronto.
Hosting International Events Using available data, the following hypothesis of impact was tested: that the number of international association meetings in the event city (Vancouver) would remain similar to another major city in Canada (Toronto) but would begin to show a greater increase in the number of events post-Games (2011 and on) than in the comparison city. This hypothesis is based on two assumptions: 1) that international meetings on average take about one year from the time a meeting location is selected to the time the meeting is actually held (hence post-Games); and 2) that an increase in 2010 is not anticipated (at least not during the time of the event) to avoid a lack of accommodation, etc. for meeting delegates due to an influx of Games-specific tourists. A few caveats about the data are noted. First, the data are based on survey and booking data provided to the International Congress and Convention Association (ICCA) by its members. Therefore, other organizations in the meetings industry may not be included. For example, there are only 11 cities in Canada (including Vancouver and Toronto) in which ICCA members are located. On the other hand, these are considered major cities in Canada that are most likely to
Visitor Spending (Same Day and Overnight) in Selected Regions in Canada, 2000-2011
$0.00
$0.50
$1.00
$1.50
$2.00
$2.50
$3.00
$3.50
$4.00
$4.50
$5.00
2000 2001 2002 2003 2004 2005 2006 2007 2008 2009 2010 2011
Year
Bill
ions
of D
olla
rs
Greater VancouverCalgary and areaEdmonton and areaToronto region

OGI-UBC Post-Games Report Appendix B (Ec02 – Tourism)
61
host international events. Second, data on the types of meetings held (e.g., environmental, social, etc.) were not available.
Despite year-to-year fluctuations, the overall trend during the period 2001-2010 has been an increasing number of international meetings held in Vancouver, Toronto, and Canada (see Figure 17). This finding supports the hypothesis that trends did not appear to differ between the event city of Vancouver and the comparison city of Toronto prior to the Games. Data for the event year (2010) show a greater increase in Vancouver (+23.4 percent) over Toronto (+15.8 percent) and Canada (-0.4), which suggests that the hypothesis may have been incorrect about Vancouver not having an advantage over Toronto during the event year. However, this could also be explained by the expansion of the convention centre in Vancouver, which was completed in 2009. Therefore, it is unclear whether the greater increase in Vancouver in 2010 was due to the Games (making Vancouver a more attractive location for hosting international events) or due to a greater capacity to host international events with the completed expansion of the convention centre. Due to a lack of available data, it remains unknown whether the number of international meetings in Vancouver would continue to show a greater increase post-Games. In summary, the data supported the hypothesis that the trend in the number of international association meetings in Vancouver would remain similar to the trend in Toronto prior to the Games, but provided inconclusive evidence to support or refute the hypothesis of similarity for the event year.

OGI-UBC Post-Games Report Appendix B (Ec02 – Tourism)
62
Figure 17: Hosting International Events
Data were retrieved from the report titled "Statistics Report 2001-2010: International Association Meetings Market” by the International Congress and Convention Association.
Summary and Interpretation of Tourism Indicators Data were generally available for 2000/2001 to 2010 (no post-Games data were available yet). The data provide some support to the hypotheses that the Games may have contributed to a slightly higher increase in the event region (vs. comparison cities) during the event year for the following: 1) accommodation infrastructure; 2) accommodation room count; and 3) accommodation occupancy rate. However, the data suggest that Vancouver did not appear to enjoy a definite Olympic Host advantage with respect to the number of overnight tourists, how long visitors stayed, how much visitors spent, or the hosting of international association meetings.
Number of International Association Meetings in Canada, Vancouver, and Toronto, 2001-2010
0
50
100
150
200
250
300
2001 2002 2003 2004 2005 2006 2007 2008 2009 2010
Year
Num
ber o
f Mee
tings
VancouverTorontoCanada

OGI-UBC Post-Games Report Appendix B (Ec03 – Prices)
63
Ec03 – Prices
Focus Area Purpose (as stated in 2011 OGI)
*Consumer price index
This indicator is the best well-known indicator of inflation, and as such, a key indicator of economic performance in most countries. It can also be used to transform current prices into constant prices, facilitating the comparison of prices, wages and social security benefits in different periods.
*Hotel price index
The indicator shows the evolution of the price of visitor accommodation in the city and region in comparison to national standards. It assesses the capacity of the city to control the hotel room rates and keep them reasonable during and after the Games period.
*Real estate market
This indicator monitors the impact of urban transformation – renewal, regeneration, urban park creation, transport network upgrades, etc., on housing prices, partially as a consequence of the changes brought by the construction and preparation of the facilities for the Games.
*All Prices indicators are anticipated to show increases at some point during the OGI reporting period for the 2010 Winter Games (2001-2013). Therefore, all Prices indicators will be analyzed with respect to attribution (Games impact).
Consumer Price Index The consumer price index (CPI) measures the rate at which the prices of consumer goods and services are changing over time (in a given area). The data for CPI in Canada are for a 2009 basket with a base index of 2002=100 (2002 is the base or reference year against which other years are compared and is represented by a value of 100). Using available data, comparisons are made for the following hypotheses of impact (based on the assumption that the Games would increase the attractiveness of the Host and thereby increase costs):
• That the annual CPI in the event region (Vancouver CMA and BC) would increase at a higher rate than in the whole of Canada during the event year (2010) and possibly after;
• 2) That the annual CPI in the event country (Canada) would increase at a higher rate than in the neighbouring non-event country (U.S.) during the event year (2010) and possibly after; and
• 3) That the monthly CPI in Vancouver CMA would increase more than in non-event cities in Canada (Victoria, Calgary, Edmonton, Toronto) during the event year (2010) and possibly after.
Data on annual CPI from 1988 to 2011 (see Figure 18) does not appear to support the first hypothesis. In other words, beginning in 2010 (event year), the CPI did not increase more in Vancouver CMA or in BC than in whole of Canada. Actually, a slight, opposite trend was observed in which the CPI increased more in Canada after 2003 than in either Vancouver CMA or in BC.

OGI-UBC Post-Games Report Appendix B (Ec03 – Prices)
64
Figure 18: Consumer Price Index (A)
Data source: Statistics Canada, CANSIM 326-0021. The data are for a 2009 basket with the base index being 2002=100.
Although the CPI differs between Canada and the US with respect to basket, basket year, and base index, the annual percentage changes may be compared between the countries. Between 1988 and 2011, the percentage increase in annual CPI was higher in the US than in Canada for most years, except in 1989, 1991, 2002, 2003, 2009, and 2010 (see Figure 19). Despite year-to-year fluctuations, the overall trend for Canada and for the US appeared to be roughly similar (e.g., the increase in CPI appeared to be exceptionally higher around 1989-1991 for both countries compared to the rest of the reporting period). While the percentage change in CPI in event year 2010 was slightly higher in Canada (+1.8 per cent) than in the US (+1.6 per cent), this difference was smaller than for all other years in which the percentage change in CPI was higher in Canada than in the US (1989, 1991, 2002, 2003, and 2009). In addition, in 2011 (post-event) the percentage change in CPI in the US was higher than Canada. Therefore, the data do not appear to support the second hypothesis that the change in annual CPI in Canada in the event year, and possibly after, would be higher than ‘normal’ compared to the US.
Consumer Price Index (CPI) for Canada, BC, and Vancouver CMA, 1988-2011 (2009 Basket, 2002=100)
0
10
20
30
40
50
60
70
80
90
100
110
120
130
1988 1989 1990 1991 1992 1993 1994 1995 1996 1997 1998 1999 2000 2001 2002 2003 2004 2005 2006 2007 2008 2009 2010 2011
Year
CPI
CanadaBCVancouver

OGI-UBC Post-Games Report Appendix B (Ec03 – Prices)
65
Figure 19: Consumer Price Index (B)
Data source: 1) Statistics Canada, CANSIM 326-0021. The data are for a 2009 basket with the base index being 2002=100. 2) US Department of Labor, Bureau of Labor Statistics (http://stats.bls.gov/cpi/home.htm, accessed December 7, 2012). The US CPI basket is for 2007-2008 with a base index of 1982-1984=100.
Data on the percentage change in monthly CPI (compared to the same month in the previous year) in 2010 (see Figure 20) and in 2011 (see Figure 21) in selected cities in Canada (Vancouver, Victoria, Calgary, Edmonton, and Toronto) do not appear to support the third hypothesis that the 2010 Winter Games raised the CPI in the event city (Vancouver). If the third hypothesis was supported, the percentage change observed in Vancouver in 2010 and possibly in 2011 would be anticipated to exceed the percentage change observed in the selected non-event cities. However in both years, the percentage change in Toronto consistently exceeded the percentage change in Vancouver, which suggests that the third hypothesis is not supported.
Percentage Change in Annual Consumer Price Index for Canada and for the US, 1989-2011
-1.0%
0.0%
1.0%
2.0%
3.0%
4.0%
5.0%
6.0%
1989 1990 1991 1992 1993 1994 1995 1996 1997 1998 1999 2000 2001 2002 2003 2004 2005 2006 2007 2008 2009 2010 2011
Year
Perc
enta
ge c
hang
e fro
m p
revi
ous
year
CanadaUS

OGI-UBC Post-Games Report Appendix B (Ec03 – Prices)
66
Figure 20: Consumer Price Index (C)
Percentage Change (from Previous Year) in Monthly Consumer Price Index for Selected Canadian Cities, 2010
0.0%
0.5%
1.0%
1.5%
2.0%
2.5%
3.0%
3.5%
January
February
March Ap
rilMay
June Ju
ly
August
September
October
November
December
Month
Perc
enta
ge c
hang
e fro
m p
revi
ous
year
VancouverVictoriaCalgaryEdmontonToronto

OGI-UBC Post-Games Report Appendix B (Ec03 – Prices)
67
Figure 21: Consumer Price Index (D)
In summary, none of the three hypotheses about CPI were supported by the data. In other words, the prices of consumer goods and services did not exceed what they would ‘normally’ be at the level of the event city (Vancouver), region (BC), or country (Canada).
Hotel Price Index
Using available data, comparisons are made for the following hypotheses of impact (based on the assumption that the Games would make the Host more attractive and thereby increase the hotel prices):
• That average hotel prices would increase more in the event regions (Greater Vancouver and Whistler Resort) than in selected major non-event cities/regions in BC (Greater Victoria, Nanaimo, Kamloops, Kelowna, Penticton, and Prince George) during the event (February and March 2010), based on the assumption that increased tourism demand during the 2010 Winter Games would drive up hotel prices; and
• 2) That higher hotel prices would be sustained after the event in the event regions (Greater Vancouver and Whistler Resort), and possibly in selected non-event cities/regions in BC.
Percentage Change (from Previous Year) in Monthly Consumer Price Index for Selected Canadian Cities, 2011
0.0%
0.5%
1.0%
1.5%
2.0%
2.5%
3.0%
3.5%
4.0%
4.5%
January
February
March Ap
rilMay
June Ju
ly
August
September
October
November
December
Month
Perc
enta
ge c
hang
e fro
m p
revi
ous
year
VancouverVictoriaCalgaryEdmontonToronto

OGI-UBC Post-Games Report Appendix B (Ec03 – Prices)
68
In order to compare annual average hotel rates over time, the rates for the years 2003 to 2012 were converted to 2012 dollars to account for inflation (see Figure 22). Annual average hotel rates in Whistler Resort were consistently higher than in both Greater Vancouver and BC overall (Whistler is both a summer and winter recreational resort). The annual average hotel rate appeared to be fairly constant in Greater Vancouver and in BC overall, but decreasing in Whistler Resort. Two peaks in average hotel prices – one in 2008 and one in 2010 (event year) – were observed at all levels (Greater Vancouver, Whistler Resort, and BC overall).
Figure 22: Hotel Price Index (A)
Data were obtained from Data Supplement Tables for tourism indicators from the BC Ministry of Jobs, Tourism and Skills Training and Responsible for Labour (http://www.jtst.gov.bc.ca/research/, accessed January 3, 2013). The data were supplied to the Ministry from Parnell Kerr Forster Consulting Inc. The average rate is derived by dividing actual total revenue for the period represented by the total number of occupied room nights.
Analyses of monthly data were conducted to test the hypothesis that the peak in annual average hotel rates in 2010 could be related to the 2010 Winter Games (see Figure 23 for Greater Vancouver, Figure 24 for Whistler Resort, and Figure 25 for BC overall). At all levels (Greater
Annual Average Hotel Rates in Greater Vancouver, Whistler Resort, and BC Overall, 2003 to 2012 (in 2012 Dollars)
$0
$50
$100
$150
$200
$250
2003 2004 2005 2006 2007 2008 2009 2010 2011 2012
Year
Ann
ual A
vera
ge H
otel
Rat
e (in
201
2 D
olla
rs)
Greater VancouverWhistler ResortBC overall

OGI-UBC Post-Games Report Appendix B (Ec03 – Prices)
69
Vancouver, Whistler Resort, and BC overall), patterns in monthly average hotel prices (in 2012 dollars) were fairly constant across the years 2003 to 2012, with the exception of a significant peak in February 2010 at all levels. The occurrence of this large peak coincides with the staging of the 2010 Winter Olympic Games. However, no peak was observed at any of the levels (Greater Vancouver, Whistler Resort, and BC overall) in March 2010, which was the month during which the 2010 Winter Paralympic Games were held. The unusually high average hotel prices of February 2010 were not sustained at any level (Greater Vancouver, Whistler Resort, and BC overall), i.e., after February 2010, the average hotel prices were back to ‘normal.’ In addition, no similar peak was observed in major non-event cities/regions in BC for which data were available (Greater Victoria, Nanaimo, Kamloops, Kelowna, Penticton, and Prince George) (see Table 6). In Greater Vancouver, hotel prices in February 2010 increased by 98 per cent over the 2004-2009 February average, while in Whistler Resort hotel prices increased by 51.9 per cent over previous years on average. In comparison, hotel prices in the selected non-event cities in BC in February 2010 were much closer to their respective previous-year averages for the month of February. In other words, the unusual peak in average hotel prices in the event regions (Greater Vancouver and Whistler Resort) in February 2010 mostly likely contributed to the peak in BC overall. In summary, the unusually high peak in average hotel prices (in 2012 dollars) in the event regions (Greater Vancouver and Whistler Resort) in February 2010, combined with a lack of a similar peak in selected major, non-event cities in BC, suggest that the 2010 Winter Olympic Games drove up average hotel prices considerably in the event regions but had minimal, if any effect, on hotel prices in the rest of BC. In other words, the data support an Olympic impact (but not a Paralympic impact) on average hotel prices that was limited to the event regions, and only during the month of the event itself.

OGI-UBC Post-Games Report Appendix B (Ec03 – Prices)
70
Figure 23: Hotel Price Index (B)
Notes: The average rate is derived by dividing actual total revenue for the period represented by the total number of occupied room nights. Original data from April 2003 to October 2012 were from the Data Supplement Tables for tourism indicators from the BC Ministry of Jobs, Tourism and Skills Training and Responsible for Labour (http://www.jtst.gov.bc.ca/research/, accessed January 3, 2013), which were supplied to the Ministry from Pannell Kerr Forster Consulting Inc. The Inflation Calculator of the Bank of Canada (http://www.bankofcanada.ca/rates/related/inflation-calculator/, accessed January 3, 2013) was used to derive the average hotel prices in 2012 dollars.
Average Hotel Prices by Month for Greater Vancouver (in 2012 Dollars), 2003-2012
$0
$50
$100
$150
$200
$250
January
February
March Ap
rilMay
June Ju
ly
August
September
October
November
December
Month
Ave
rage
Mon
thly
Hot
el P
rices
(in
2012
Dol
lars
)
2003200420052006200720082009201020112012

OGI-UBC Post-Games Report Appendix B (Ec03 – Prices)
71
Figure 24: Hotel Price Index (C)
Notes: The average rate is derived by dividing actual total revenue for the period represented by the total number of occupied room nights. Original data from April 2003 to October 2012 were from the Data Supplement Tables for tourism indicators from the BC Ministry of Jobs, Tourism and Skills Training and Responsible for Labour (http://www.jtst.gov.bc.ca/research/, accessed January 3, 2013), which were supplied to the Ministry from Pannell Kerr Forster Consulting Inc. The Inflation Calculator of the Bank of Canada (http://www.bankofcanada.ca/rates/related/inflation-calculator/, accessed January 3, 2013) was used to derive the average hotel prices in 2012 dollars.
Average Hotel Prices by Month for Whistler Resort (in 2012 Dollars), 2003-2012
$0
$50
$100
$150
$200
$250
$300
$350
$400
$450
$500
January
February
March Ap
rilMay
June Ju
ly
August
September
October
November
December
Month
Ave
rage
Mon
thly
Hot
el P
rices
(in
2012
Dol
lars
)
2003200420052006200720082009201020112012

OGI-UBC Post-Games Report Appendix B (Ec03 – Prices)
72
Figure 25: Hotel Price Index (D)
Notes: The average rate is derived by dividing actual total revenue for the period represented by the total number of occupied room nights. Original data from April 2003 to October 2012 were from the Data Supplement Tables for tourism indicators from the BC Ministry of Jobs, Tourism and Skills Training and Responsible for Labour (http://www.jtst.gov.bc.ca/research/, accessed January 3, 2013), which were supplied to the Ministry from Pannell Kerr Forster Consulting Inc. The Inflation Calculator of the Bank of Canada (http://www.bankofcanada.ca/rates/related/inflation-calculator/, accessed January 3, 2013) was used to derive the average hotel prices in 2012 dollars.
Average Hotel Prices by Month for BC Overall (in 2012 Dollars), 2003-2012
$0
$50
$100
$150
$200
$250
January
February
March Ap
rilMay
June Ju
ly
August
September
October
November
December
Month
Ave
rage
Mon
thly
Hot
el P
rices
(in
2012
Dol
lars
)
2003200420052006200720082009201020112012

OGI-UBC Post-Games Report Appendix B (Ec03 – Prices)
73
Table 6: Hotel Price Index (in 2012 Dollars)
Location
Before the Games (February Average,
2004-2009)
Games-time (February
2010)
Games-time vs. Before-Games
Average
Greater Vancouver $122.11 $241.80 98.0%
Whistler Resort $313.51 $476.21 51.9%
BC overall $131.34 $219.45 67.1%
Greater Victoria $101.28 $102.35 1.1%
Nanaimo $94.77 $106.06 11.9%
Kamloops $86.03 $92.79 7.9%
Kelowna $91.52 $100.29 9.6%
Penticton $92.81 $89.31 -3.8%
Prince George $105.46 $106.33 0.8% Notes: Original data were from the Data Supplement Tables for tourism indicators from the BC Ministry of Jobs, Tourism and Skills Training and Responsible for Labour (http://www.jtst.gov.bc.ca/research/, accessed January 3, 2013), which were supplied to the Ministry from Pannell Kerr Forster Consulting Inc. The Inflation Calculator of the Bank of Canada (http://www.bankofcanada.ca/rates/related/inflation-calculator/, accessed January 3, 2013) was used to derive the average hotel prices in 2012 dollars.
Real Estate Market The data used to monitor the real estate market is the Multiple Listing Service ® (MLS®) Home Price Index (HPI) (http://homepriceindex.ca/hpi_home_en.html). The MLS® HPI was developed to gauge major housing markets in Canada by tracking price levels at a point in time relative to price levels in a base (reference) period. Modelled after the Consumer Price Index, the MLS® HPI has a base period (which is January 2005) value of 100 and is based on a ‘basket’ of housing features. Although MLS® HPI data begin in 2005 and the MLS® HPI is not a conventional measure of real estate markets such as mean or median average prices,7 it was selected in order to be able to compare between the event region (Greater Vancouver) and major non-event cities in Canada.
7 Further explanation of the advantages of the MLS® HPI over conventional measures (mean or median average prices) can be found on the website of the Real Estate Board of Greater Vancouver (http://www.rebgv.org/mls%C2%AE-home-price-index-explained, accessed January 4, 2013).

OGI-UBC Post-Games Report Appendix B (Ec03 – Prices)
74
Using available data, comparisons are made for the following hypothesis of impact: that the MLS® HPI in the event region (Greater Vancouver) would increase at a higher rate than in major non-event cities in Canada (Calgary and Greater Toronto) during the event year (2010), and possibly after. This is based on the assumption that the Games would increase the attractiveness of the Host region as a place to live and thereby drive up housing costs. The chart images shown below were generated using the HPI tool from the MLS® HPI web site on January 4 and 10, 2013. The event month (February 2010) is marked by a circle on the lines in each chart.
Figure 26 shows the HPI composite benchmark price over time. A “benchmark home” is one whose attributes are typical of homes traded in the area where it is located (see the MLS® HPI website for more details on methodology). The composite price aggregates the prices of all home types (single family, one storey, two storey, townhouse, and apartment). The composite benchmark home for Greater Vancouver has consistently been higher than the composite benchmark home for Calgary and for Greater Toronto. The ranges of the composite benchmark home were: for Vancouver, a low of $381,400 (January 2005) to a high of $625,100 (May 2012); for Calgary, a low of $212,200 (January 2005) to a high of $414,600 (July 2007); and for Greater Toronto, a low of $305,100 (January 2005) and a high of $461,900 (June 2012). However, similar trends in the price of the composite benchmark home are observed across the three regions – increasing after January 2005, dipping around January 2009, and increasing again after January 2009 up to the end of 2012. Despite fluctuations, the cost of a composite benchmark home for Greater Vancouver appeared to increase at a similar rate as for Greater Toronto, which suggests that the 2010 Winter Games had little to no effect on the cost of a benchmark home in the event region (Greater Vancouver).

OGI-UBC Post-Games Report Appendix B (Ec03 – Prices)
75
Figure 26: Real Estate Market (A)
Figure 27 shows the MLS® composite HPI over time. The HPI is generally highest for Calgary, followed by Greater Vancouver and then Greater Toronto. The trends in composite HPI for Greater Vancouver and for Greater Toronto are more similar to each other than to Calgary. Nevertheless, similar trends in the HPI are observed across the three regions – a peak in 2007-2008, a dip in January 2009, and increasing again after January 2009. The trend in composite HPI for Greater Vancouver is very close to the trend in composite HPI for Greater Toronto after February 2010 (event month), which suggests that the 2010 Winter Games had little to no effect on the composite HPI in the event region (Greater Vancouver).

OGI-UBC Post-Games Report Appendix B (Ec03 – Prices)
76
Figure 27: Real Estate Market (B)
When broken down by type of home, similar trends in HPI (with some variation) were also observed – see Figure 28 for single family, Figure 29 for one storey, Figure 30 for two storey, Figure 31 for townhouse, and Figure 32 for apartment.

OGI-UBC Post-Games Report Appendix B (Ec03 – Prices)
77
Figure 28: Real Estate Market (C) – Single Family

OGI-UBC Post-Games Report Appendix B (Ec03 – Prices)
78
Figure 29: Real Estate Market (D) - One Storey

OGI-UBC Post-Games Report Appendix B (Ec03 – Prices)
79
Figure 30: Real Estate Market (E) - Two Storey

OGI-UBC Post-Games Report Appendix B (Ec03 – Prices)
80
Figure 31: Real Estate Market (F) - Townhouse

OGI-UBC Post-Games Report Appendix B (Ec03 – Prices)
81
Figure 32: Real Estate Market (G) - Apartment
Summary and Interpretation of Prices Indicators
The prices of consumer goods and services (represented by the Consumer Price Index) did not appear to exceed what they would ‘normally’ be at the level of the event city (Vancouver), region (BC), or country (Canada) during the event year (2010) or thereafter. Average hotel prices, however, peaked in February 2010 (Olympic event month) in the event regions (Greater Vancouver and Whistler Resort) compared to non-event regions in BC. This peak is unusually large and suggests that the 2010 Winter Games drove up average hotel prices considerably in the event regions but had minimal, if any effect, on hotel prices in the rest of BC or after the event. No effect on average hotel prices was observed for the Paralympic event month (March 2010) or thereafter. Although the cost of a MLS® composite benchmark home for Greater Vancouver (event region) was consistently higher than for either of the non-event regions (Calgary and Greater Toronto), the 2010 Winter Games appeared to have had little to no effect on the MLS® Home Price Index in the event region (Greater Vancouver) during or after the event (February 2010) compared to the non-event regions.

OGI-UBC Post-Games Report Appendix B (Ec04 – Structure of OCOG Budget)
82
Ec04 – Structure of OCOG Budget
Focus Area Purpose (as stated in 2011 OGI)
Structure of OCOG revenues
Total OCOG revenue broken down by source and geographical origin (according to the projected and actual budgets).
Structure of OCOG expenditures
Total OCOG expenditure broken down by programme.
Structure of OCOG Revenues No post-Games data were anticipated after the Vancouver OGI Games-time Report; therefore, the presented data are from the Games-time Report. Data were from VANOC. The total actual Olympic Games revenue was $1,884,129,000 CAD, or 7.3 percent more than estimated in the forward budget (see Table 7). While some sources produced less revenue than expected in the forward budget – specifically The Olympic Partners (TOP) sponsorship (less by 11.6 percent) and local/national sponsorship (less by 2.6 percent) – all other sources produced more revenue than projected in the forward budget. The major sources of revenue that registered an increase were government subsidies (almost 50 percent more), disposal of assets and other income (both about 40 percent more), as well as donations (although a relatively minor source in and of itself, it generated more than twice the expected revenue). IOC contributions (7.3 percent more), revenue from official suppliers (1.2 percent more), tickets sales (3.5 percent more) and licensing (1.5 percent more) also contributed more revenue than anticipated in the forward budget. As part of the Host City Contract and Marketing Plan Agreement, VANOC was required to pay a portion of its marketing revenues to the IOC and to the Canadian Olympic Committee. Marketing royalties in the actual Olympic period budget were 5.4 percent less than projected in the forward budget. Because marketing royalties are subtracted from (rather than added to) revenues, the actual marketing royalties – being lower than projected – contributed to the higher net revenue registered in the actual Olympic period budget. In terms of the size of the revenue sources as a proportion of the total revenue, local/national sponsorship had the largest share with about a third of revenues. IOC contributions to the VANOC budget were second and supplied about a quarter of the total revenue. Ticket sales were third and supplied less than 15 percent of total revenue. TOP sponsorship and government subsidies shared fourth place and each provided about 10 percent of the total revenue. All other sources supplied less than 10 percent each, along with the shortfall which was also around 10 percent of the total. Between the forward and actual budgets, most revenue sources maintained their same share of the total revenue. The proportions of government subsidies and other income increased slightly (by 2.7 and 2 percentage points each), while TOP sponsorship and local/national sponsorship somewhat decreased in their proportions (2 and 3.3 percentage points each).

OGI-UBC Post-Games Report Appendix B (Ec04 – Structure of OCOG Budget)
83
In summary, slight variations in the size of the revenue sources as a proportion of total revenue amounted to a slight difference of 7.3 percent between the forward budget and actual budget for the 2010 Olympic and Paralympic Winter Games (budget data are not individualized for the Olympic Games or the Paralympic Games). This suggests that the actual budget did not differ drastically from the forward budget for the 2010 Winter Games. The two main sources of revenue for the 2010 Winter Games were local/national sponsorship and IOC contribution, which together contributed approximately 60 percent of total revenue.
Table 7: Structure of OCOG Revenues
Structure of OCOG Expenditures
No new data were anticipated after the Vancouver OGI Games-time Report. Therefore, the presented data are from the Games-time Report. Combined data on the Olympic Games and the Paralympic Games were available from VANOC. The total operations expenditure of VANOC was $1,884,129,000 CAD, 7.3 percent more than what was projected in the forward budget.
The programmes that had more expenditures than expected were the following: Ceremonies & Culture and Olympic Villages (each about 36 percent more); Sports Venues and Other Expenditures (each about 25 percent more); Telecommunications and other technologies (11.2 percent more); Informations systems and Pre-Olympic events and coordination (each about 9 percent more); Transport (7 percent more); and MPC (just above 1 percent more). All other programmes incurred less expenditures than expected, specifically: Administration (35 percent less); Catering (19 percent less); Workforce and Paralympic Games (each about 11
Amounts % Amounts %
IOC contribution 447,010 25.5% 479,742 25.5%The Olympic Partners sponsorship 196,356 11.2% 173,558 9.2%Local/national sponsorship 628,348 35.8% 612,126 32.5%Official suppliers 116,668 6.6% 118,031 6.3%Ticket sales 260,450 14.8% 269,459 14.3%Licensing 53,819 3.1% 54,618 2.9%Lotteries 0 0.0% 0 0.0%Donations 650 0.0% 1,398 0.1%Disposal of assets 10,990 0.6% 15,248 0.8%Subsidies (national, regional and local government) 126,791 7.2% 187,796 10.0%Other Income 112,115 6.4% 158,912 8.4%Less: Marketing Royalties -197,346 -11.2% -186,759 -9.9%Total 1,755,850 100.0% 1,884,129 100.0%
Source: VANOC Audited Financial Statements and Internal Management Reports.
Structure of VANOC Revenue: Forward Budget for the Olympic Games and Actual Budget for the Olympic Period (thousands of CAD)
Forward budget Olympic period budget

OGI-UBC Post-Games Report Appendix B (Ec04 – Structure of OCOG Budget)
84
percent less); Security (9 percent less); Medical Services (7.5 percent less); Internet (6 percent less); and Advertising and Promotion (4 percent less).
In terms of share of the total expenditures, there was little change between the forward budget and the actual budget, with the majority of programmes staying similar to their projected size relative to the total. The most sizable difference was in Sports Venues, which increased 3.5 percentage points in its proportion of the total actual budget, while Administration reduced its proportion of the total by 3.9 percentage points. In addition to the Operations expenditures, capital expenditures were $603,271,000 CAD (see Ec05 Operating and Capital Expenditures and Catalyst Effect, p.86). The capital investments were mainly funded 50/50 by the BC and Canadian governments as planned during the bid phase (combined contribution of $580 million CAD), with the remaining amount of capital investments generated through sponsorship and other means.
In summary, slight variations in the size of the expenditures as a proportion of total expenditure amounted to a slight difference of 7.3 percent between the forward budget and actual budget for the 2010 Olympic and Paralympic Winter Games. This suggests that the actual budget did not differ drastically from the forward budget for the 2010 Winter Games. The two main expenditures for the 2010 Winter Games were operations for Sports Venues and Informations Systems, which together contributed almost 40 percent of total expenditure. The only separate budget item for the 2010 Paralympic Games was that just over $2 million CAD was both projected and actually spent on operations for the 2010 Paralympic Games.

OGI-UBC Post-Games Report Appendix B (Ec04 – Structure of OCOG Budget)
85
Table 8: Structure of OCOG Expenditures
Summary and Interpretation of Structure of OCOG Budget Indicators
For both revenue and expenditures, the actual budget was 7.3 percent more than the forward budget for the 2010 Olympic and Paralympic Winter Games. The two main sources of revenue for the 2010 Winter Games were local/national sponsorship and IOC contribution, which together contributed approximately 60 percent of total revenue. The two main expenditures for the 2010 Winter Games were operations for Sports Venues and Informations Systems, which together contributed almost 40 percent of total expenditure. The only separate budget item for the 2010 Paralympic Games was that just over $2 million CAD was both projected and actually spent on operations for the 2010 Paralympic Games.
Amounts % Amounts %
Capital investmentsSports facilities, olympic village and others villages, MPC & IBC, other (specify) 603,271,000
OperationsSports venues 367,355,646 20.9% 460,019,491 24.4%Olympic village & other villages 41,323,595 2.4% 56,057,060 3.0%MPC 16,916,718 1.0% 17,115,604 0.9%IBC 0 0.0% 0 0.0%Workforce 114,443,633 6.5% 101,686,806 5.4%Informations systems 257,176,110 14.6% 281,058,699 14.9%Telecommunications & other technologies 71,896,000 4.1% 79,941,004 4.2%Internet 12,453,089 0.7% 11,707,241 0.6%Ceremonies & Culture 81,767,713 4.7% 111,340,956 5.9%Medical Services 38,487,146 2.2% 35,607,979 1.9%Catering 38,253,768 2.2% 31,078,102 1.6%Transport 198,411,637 11.3% 212,119,461 11.3%Security 14,325,023 0.8% 13,002,631 0.7%Paralympic Games 2,392,175 0.1% 2,111,198 0.1%Advertising and Promotion 132,607,930 7.6% 127,408,738 6.8%Administration 175,363,005 10.0% 114,067,574 6.1%Pre-Olympic Events and Coordination 65,708,873 3.7% 71,870,345 3.8%Other 126,967,672 7.2% 157,936,111 8.4%Surplus 0 0.0% 0 0.0%Total 1,755,849,733 100.0% 1,884,129,000 100.0%
Source: VANOC Audited Financial Statements and Internal Management Reports.
Forward budget Olympic Period budget
Structure of VANOC Expenditures: Forward Budget for the Olympic Games and Actual Budget for the Olympic Period (CAD)

OGI-UBC Post-Games Report Appendix B (Ec05 – Operating and Capital Expenditures and Catalyst Effect)
86
Ec05 - Operating and Capital Expenditures and Catalyst Effect
Focus Area Purpose (as stated in 2011 OGI)
Total operating expenditure (Olympic activities)
Total Olympic operating expenditure including OCOG operational expenditure, but without OCOG capital expenditure and non-OCOG operational expenditure, broken down by the nature of the costs and the area where the money is spent.
Total capital expenditure (Olympic activities)
Total capital expenditure of Olympic activities, broken down by the nature of the costs and the area where the money is spent.
Total capital expenditure (context activities)
Total capital expenditures for context activities, broken down by the nature of the costs and the area where the money is spent.
Catalyst effect of the Games
This ratio may reveal the vitalizing effects that the planning and staging of the Games may have on the local economy. While the Games require the host context to adapt in terms of infrastructure and logistics, they also provide an unprecedented opportunity for local and regional development. The higher the ratio, the greater the catalyst effect of the Games. For methodological reasons, however, it cannot distinguish between activities resulting from local drive and determination from Olympic-driven activities.
Total Operating Expenditure (Olympic Activities) No new data were anticipated after the Games. Therefore, the presented data are from the Vancouver OGI Games-time Report. Data were from VANOC (see Table 9). The total operating expenditures for Olympic activities for VANOC was $1,884,129,000 CAD (part of VANOC’s revenue was from government contributions of $187.8 million or 10 percent). Overall, 16 percent of total expenditures was for wages and social charges ($309,065,353 CAD), while the remaining 84 percent ($1,575,063,647 CAD) was spent on goods and services. Based on the available data, 75 percent of total Olympic operating expenditures was spent in the region, 16 percent in the rest of the country, and 9 percent abroad. All wages and social charges ($309,065,353 CAD) were reported as being incurred in the region (no data related to wages paid in the rest of the country or abroad), while the expenditures on goods and services were 70 percent in the region, 19 percent in the rest of the country, and 11 percent abroad. The available data suggest that the Vancouver region benefited most, with three quarters of the total expenditures spent there.

OGI-UBC Post-Games Report Appendix B (Ec05 – Operating and Capital Expenditures and Catalyst Effect)
87
Table 9: Total Operating Expenditure (Olympic Activities)
Total Capital Expenditure (Olympic Activities) No new data were anticipated after the Games. Therefore, the presented data are from the Vancouver OGI Games-time Report. Data were from VANOC (see Table 10). The $603,271,000 CAD total capital expenditure on Olympic activities consists of approximately $600 million CAD in total venue expenses and $3.5 million CAD in interest and carrying charges. Expenditure on venue development included contributions of $290,000 each from the Canadian and BC governments (96 percent of venue development costs). Additional costs by local governments (Vancouver and Richmond) are shown in Table 16 on page 94
Capital expenditures were spent on: snowmaking, earthworks, etc. on Cypress Mountain and Whistler Creekside; building the new Vancouver Olympic/Paralympic Centre; major renovations of the Pacific Coliseum and renovations of BC Place; building the new Richmond Olympic Oval (constructed by the City of Richmond with additional spending); building the new UBC Thunderbird Arena (constructed by UBC with additional spending); a contribution to the construction of the Olympic and Paralympic Village to the City of Vancouver; building the new Whistler Athletes’ Centre, Whistler Olympic/Paralympic Park, Olympic and Paralympic Village, and Sliding Centre; and various overheads, management, etc. included in the General expenditures. About 60 percent of the total expenditure was incurred in Whistler (Athletes’ Centre, Media Centre, Whistler Creekside, Olympic/Paralympic Park, the Olympic and Paralympic Village, and the Sliding Centre). The remaining 40 percent of capital expenditures was spent in Vancouver, Richmond and Cypress Mountain. Thus, the entire capital expenditure for Olympic activities benefits the Vancouver and Whistler regions.
Amount % Amount % Amount % Amount %Wages and social charges 309,065,353 100% DNAA DNAA DNAA DNAA 309,065,353 16%Goods and services 1,104,031,397 70% 301,460,640 19% 169,571,610 11% 1,575,063,647 84%Taxes and duties DNAA DNAA DNAA DNAA DNAA DNAA DNAA DNAAGeneral expenses DNAA DNAA DNAA DNAA DNAA DNAA DNAA DNAATotal 1,413,096,750 75% 301,460,640 16% 169,571,610 9% 1,884,129,000 100%
Total Operating Expenditure (Olympic Activities), CADRegion Country Abroad Total

OGI-UBC Post-Games Report Appendix B (Ec05 – Operating and Capital Expenditures and Catalyst Effect)
88
Table 10: Total Capital Expenditure (Olympic Activities)
Total Capital Expenditure (Context Activities)
No new data were anticipated after the Games. Therefore, the presented data are from the Vancouver OGI Games-time Report. Data were available for three Olympic-induced infrastructure projects, which all began construction in 2005 and were completed in 2009 – improvements to the Sea-to-Sky Highway that links Vancouver to Whistler, the construction of the new Canada Line (rapid transit), and expansion of the Vancouver Convention Centre (see Table 11).
While upgrades to the Sea-to-Sky Highway (between Vancouver and Whistler) and construction of the new Canada Line (between Vancouver and Richmond) benefited regional areas, the city of Vancouver also benefited from these two infrastructure projects, as well as benefiting from expansion of the Vancouver Convention Centre. The sum capital expenditure of all three projects was $3.7 billion (Canadian dollars, 2009) or $3.2 billion (US dollars, 2009). For the expansion of the Vancouver Convention Centre, land was acquired in 2003 by both the provincial and municipal governments at a total cost of $39.7 (in 2003 dollars), which was equivalent to $44.4 million in 2009. Based on the available data, the city of Vancouver benefited from the three Olympic-induced infrastructure projects, while other parts of the province benefited from two of the projects (Sea-to-Sky and Canada Line), at a total cost of over $3 billion US dollars in 2009.
Venue Cost
Cypress Mountain 17,597,000 Vancouver Olympic/Paralympic Centre 41,386,000 Pacific Coliseum 18,920,000 Richmond Olympic Oval 63,679,000 Training Venues 5,200,000 UBC Thunderbird Arena 38,216,000 Olympic and Paralympic Village Vancouver 30,000,000 Whistler Athletes' Centre 57,809,000 Whistler Media Centre 3,000,000 Whistler Creekside 31,312,000 Whistler Olympic/Paralympic Park 122,467,000 Olympic and Paralympic Village Whistler 37,500,000 The Whistler Sliding Centre 104,928,000 BC Place 12,094,000 General 15,654,000 Total venue expenses 599,762,000 Interest and carrying charges 3,509,000 Total venue development expenses 603,271,000
Capital Expenditures (Olympic Activities), CAD

OGI-UBC Post-Games Report Appendix B (Ec05 – Operating and Capital Expenditures and Catalyst Effect)
89
Table 11: Total Capital Expenditure (Context Activities)
Catalyst Effect of the Games
No new data were anticipated after the Games. Therefore, the presented data are from the Vancouver OGI Games-time Report. Data from Total Capital Expenditure (Olympic Activities) and from Total Capital Expenditure (Context Activities) are used to calculate the catalyst effect of the Games.
The ratio of capital expenditure on context activities (e.g., expansion of convention centre, etc.) to capital expenditure on Olympic activities (venues) was 11.9:1 for the city of Vancouver and 2.2:1 for the rest of BC. All capital investments were for projects located in BC (none in the rest of Canada). While the ratios suggest some catalytic effects of the 2010 Winter Games on the BC economy outside of the city of Vancouver, the catalytic effect was more than five times greater in the city of Vancouver.
Table 12: Catalystic Effect of the Games
Summary and Interpretation of Operating and Capital Expenditures and Catalyst Effect Indicators
Total expenditures were: $1,884,129,000 CAD for operations of Olympic activities; $603,271,000 CAD for capital for Olympic activities; and $3.7 billion CAD (in 2009 dollars) for
Project Area CAD USDSea-to-Sky Highway upgrades Regional $796 million $698 million2
Canada Line (new rapid transit) Regional $2 billion $1.75 billion2
Vancouver Convention Centre expansion City $883.2 million $774 million2
Land acquisition - Government of BC - $31 million1 $23.1 million2
Land acquisition - City of Vancouver - $13.4 million1 $10.0 million2
1 Based on the Bank of Canada Inflation Calculator (bankofcanada.ca/en/rates/inflation_calc.html) for the year 2009 compared to the year 2003, which was when the land was acquired.2 Based on the Bank of Canada exchange rate of 1.1412 for the year 2009.
Total Capital Expenditure (Context Activities) - 2009Total Capital Expenditure
Context Activities1
Olympic Activities2
Ratio of the capital expenditure3
City (Vancouver) $2,883,200,000 $242,746,000 11.9:1Region (Whistler and rest of BC) $796,000,000 $357,016,000 2.2:11 Data from Total Capital Expenditure (Context Activities). The Canada Line, although listed as regional for Total Capital Expenditure (Context Activities), is mostly within the boundaries of the city of Vancouver.2 Data from Total Capital Expenditure (Olympic Activities).3 Ratio of Total Capital Expenditure (Olympic Activities) to Total Capital Expenditure (Context Activities).

OGI-UBC Post-Games Report Appendix B (Ec05 – Operating and Capital Expenditures and Catalyst Effect)
90
capital for context activities (three infrastructure projects). Overall, Vancouver/Whistler benefited the most from the expenditures, followed by the rest of BC, the rest of the country, and abroad.

OGI-UBC Post-Games Report Appendix B (Ec06 – Ratios Specific to Olympic Activities)
91
Ec06 – Ratios Specific to Olympic Activities
Focus Area Purpose (as stated in 2011 OGI)
Ratios specific to Olympic activities
Five ratios show essential aspects of Olympic activities, particularly regarding the construction of Olympic venues.
These ratios draw on data on expenditures as reported for Ec05 (p. 86) for Total Operating Expenditures for Olympic Activities, Total Capital Expenditures for Olympic Activities, and Total Capital Expenditures for Context Activities).
Ratios Specific to Olympic Activities Calculations for Ratio 1 are shown in Table 13, while calculations for Ratio 2 are shown in Table 14. Table 15 shows a summary of all five ratios. The cost of operating the 2010 Winter Games was over three times the cost of capital investment on venue development for the Games. In terms of share of total capital costs, significantly more was spent on major venue construction projects than on renovations; however, all venues are planned as permanent legacies.
Table 13: Calculations for Ratio 1
Table 14: Calculations for Ratio 2
Operating CapitalTotal (Operating +
Capital)Ratio of Operating to
Total Cost$1,884,129,000 $603,271,000 $2,487,400,000 0.76 to 1
Ratio 1: Operating Expenditure to Total ExpenditureCosts
Pacific Colisuem
Whistler Media Centre BC Place
Renovation Total
Total Capital Expenditures
Ratio of Renovation to Total Capital
$18,920,000 $3,000,000 $12,094,000 $34,014,000 $603,271,000 0.06 to 1
Ratio 2: Renovation Expenditures to Total Capital Expenditures

OGI-UBC Post-Games Report Appendix B (Ec06 – Ratios Specific to Olympic Activities)
92
Table 15: Ratios Specific to Olympic Activities
Ratio Number Description of Ratio Ratio Interpretation
1 Operating expenditure to total expenditure (operating and capital)
0.76 to 1 The cost of running the Games (operating costs) was over three times the cost of venue development (capital costs).
2 Capital expenditure on renovation to total capital expenditure (renovation and construction)
0.06 to 1 Capital expenditures were largely spent on major venue construction projects (new venues or significant upgrades of existing venues). Only three venues were renovated at a total cost of $34,014,000.
3 Capital expenditure on temporary facilities to total capital expenditure (temporary and permanent)
n/a None of the venues were constructed for temporary use. All venues were planned to become permanent legacies (although not necessarily as a sport event venue).
4 Capital expenditure on renovation of existing facilities to total original capital expenditure of these facilities
n/a1 n/a
5 Land acquisition costs to total capital expenditure of new permanent facilities
n/a There were no land acquisition costs for venue development.
1 Data on the original capital expenditures of renovated facilities were not available.

OGI-UBC Post-Games Report Appendix B (Ec07 – Public Economy)
93
Ec07 – Public Economy
Focus Area Purpose (as stated in 2011 OGI)
Public share of expenditure (Olympic activities)
This indicator determines the public or state participation in financing Olympic activities.
Public share of expenditure (context activities)
This indicator monitors the participation of the State or public authorities in adapting and developing the context in which the Games will take place.
*Tax revenue from Olympic activities
This indicator monitors the evolution of tax revenue associated with the economic activities due to Olympic activities.
*Attribution analysis was conducted for the first quarter of 2010 (January to March) on visitor spending. The 2010 Winter Games were held during this period.
Public Share of Expenditure (Olympic Activities)
No new data were anticipated after the Games; therefore, the presented data are from the Vancouver OGI Games-time Report. Data were available in Olympic-related budget reports from the relevant public authorities (Vancouver, Richmond, Whistler, BC, and Canada) for capital investments and operating expenditures overall (see Table 16).
Capital expenditures for Olympic activities were almost exclusively funded by public authorities (96.9 percent), while operating expenditures for Olympic activities were funded approximately 50/50 by public authorities and VANOC. Overall, the public share of total expenditures was over one half (57.9 percent). In absolute amounts, the public authorities that spent the most overall were the Governments of Canada (30.5 percent of total expenditures) and BC (22.7 percent of total expenditures).

OGI-UBC Post-Games Report Appendix B (Ec07 – Public Economy)
94
Table 16: Public Share of Expenditure (Olympic Activities) (in millions of dollars)
Public Share of Expenditure (Context Activities)
No new data were anticipated after the Games; therefore, the presented data are from the Vancouver OGI Games-time Report. The data are for ‘Olympic-induced’ infrastructure projects, i.e., projects that were not built specifically for the Games, but the coming of the Games gave the projects higher priority because the projects supported the Games. The Sea-to-Sky Highway links Vancouver and Whistler (the two main sport event cities). The Canada Line includes a station near the Olympic Village and an airport station. The Vancouver Convention Centre hosted the Main Media Centre of the 2010 Games. Overall, the public share of expenditure for three Olympic-induced infrastructure projects was 67 percent ($2.473 billion of a total of $3.679 billion), and ranged from 46 percent to 100 percent of a project. While it may appear that governments only contributed 46 percent towards the cost of the Canada Line, local governments also contributed indirectly (e.g., the local transportation authority TransLink also helped fund the Canada Line and TransLink, as reported in its 2009 Annual Report, received 22 percent of its revenues from property taxes collected from local governments). The provincial government contributed the most to these Olympic-induced infrastructure projects, followed by the federal government. The Vancouver government contributed the least.
Table 17: Public Share of Expenditure (Context Activities)
Vancouver1 Richmond2 Whistler3 BC4 Canada5Total Public
SharePublic Share of
Total VANOC6Total (includes
VANOC)Capital expenditures $139,400,000 $9,647,000 DNAA $290,000,000 $290,000,000 $729,047,000 96.9% $23,271,000 $752,318,000Operating expenditures7 $30,300,000 $6,300,000 $6,026,966 $635,200,000 $956,700,000 $1,634,526,966 49.1% $1,696,300,000 $3,330,826,966
Totals $169,700,000 $15,947,000 $6,026,966 $925,200,000 $1,246,700,000 $2,363,573,966 57.9% $1,719,571,000 $4,083,144,966
6 The amount for VANOC capital expenditures is $603,271,000 minus the contributions from the BC and Canada governments ($290,000,000 each). The amount for VANOC operating expenditures is $1,884 million minus government contributions of $187.8 million.7 $187.8 million of the public dollars for operating expenditures were contributed to VANOC ($74,401,000 from the Canadian government and $113,395,000 from the BC government). This amount is not included in the amount shown for VANOC for operating expenditures.
4 From the report titled British Columbia's Investment in the 2010 Olympic and Paralympic Games and Related Actitivies (2010) from the BC Olympic and Paralympic Winter Games Secretariat.5 From "Canada's Investments for the 2010 Winter Games" at http://www.canada2010.gc.ca/invsts/index-eng.cfm (accessed February 2011).
Public AuthorityPublic Share of Expenditure (Olympic Activities) (CAD)
1 City of Vancouver Administrative Report of March 31, 2010. The amount of $139,400,000 is for Olympic venues only, although the City report lists other Olympic-related capital investments.2 Capital expenditures from the 2008 and 2009 Annual Reports from the City of Richmond (the 2010 Annual Report was not available as of January 21, 2011). Operating expenditures from http://www.richmond.ca/discover/2010-Olympics/ozone.htm (Richmond O Zone Celebration Site).3 Operating expenditures from the report titled Living the Dream (2010) from the Resort Municipality of Whistler.
Project CAD USD CAD USD CAD USD CAD USDSea-to-Sky Highway upgrades $796 $698 100% $796 $0 $0 $796 $698 $0 $0Canada Line (new rapid transit) $2,000 $1,750 46% $914 $29 $25 $435 $381 $450 $394Vancouver Convention Centre expansion $883 $774 86% $763 $0 $0 $541 $474 $223 $195
Total $3,679 $3,222 67% $2,473 $29 $25 $1,772 $1,553 $673 $589
2 From the March 31, 2010 Administrative Report of the City of Vancouver.
4 From the March 27, 2009 news release from Transport Canada titled “Canada, B.C. Celebrate Near Completion of Canada Line."
3 From: 1) the Service Plan Update 2009/10 – 2010/2011 of the B.C. Ministry of Tourism, Culture and the Arts; and 2) the Annual Service Plan Report 2009/10 of the B.C. Ministry of Transportation and Infrastructure.
1 All USD are based on the Bank of Canada exchange rate of 1.1412 for the year 2009, which was when all the projects were completed.
Total Public Share
Public Share of Expenditure (Context Activities) - 2009 (millions of dollars)1
Vancouver2 BC3 Canada4Level of Public Authority (Government)
Total Costs Public Cost (CAD)

OGI-UBC Post-Games Report Appendix B (Ec07 – Public Economy)
95
Tax Revenue from Olympic Activities No new data were anticipated after the Games; therefore, the presented data are mostly from the Vancouver OGI Games-time Report, with the addition of some updates. Detailed data on tax revenue specific to Olympic activities were not available. In other words, the types of taxes or duties paid for goods and services (rates vary depending on the type of expenditure) cannot be determined. Therefore, no estimate of the total taxes and duties paid by VANOC for goods and services can be calculated with an adequate level of accuracy (although the estimate would be no small amount, based on VANOC’s total expenditures of almost $1.9 billion CAD). One estimate that could be calculated with some confidence is the tax revenue from employment earnings, based on internal staffing costs from VANOC’s last financial statement of December 2010 (see Table 18). Approximate $50 million CAD in tax revenue (give or take) was roughly estimated to have been generated via tax on employment income with VANOC. This estimate should be interpreted cautiously because: 1) it is based on tax paid as a proportion of income from previous years rather than for 2010 (which was not available at the time of analysis); 2) it is based on an assumptions that most of VANOC’s internal workforce is from the Greater Vancouver Regional District and that their earnings are representative of the earnings in this area; and 3) the tax paid as a proportion of income varies with income bracket (this specificity of data was not available). Another estimate that could be calculated with some confidence is the tax revenue from tourist spending (see Table 19). There are no data on visitor spending (Ec02 Tourism, see p.47) that are specific to visitors who traveled to/within Canada for the 2010 Winter Games. At most, the increases in visitor spending in Canada and in BC were attributed in part (i.e., not entirely) to the Games. The following two extreme-case scenarios were used to calculate a lower- and an upper limit between which the ‘actual’ tax revenue probably lies. The lower-limit is a scenario in which none of the increase in visitor spending between the first quarter of 2009 and 2010 was related to the Games ($0). The upper-limit is a scenario in which all the increase in visitor spending was specific to the Games during the comparison periods. Because tax rates differ between provinces/territories and in some cases between goods and services, median/average tax rates were used. The estimates are that Canada benefited by less than $101.4 million in tax revenue from visitor spending related to the Games ($98.5 million USD) while BC (based only on international and US visitors) benefited by less than $7.7 million ($7.5 million USD). These estimates are to be interpreted as the upper-limits possible for tax revenue from Games-related visitor spending – they are not to be interpreted as ‘actual’ tax revenue.
A PricewaterhouseCoopers (PwC) report8 on the impacts of the Games commissioned by the BC government estimated an ‘incremental’9 tourism impact of $228.1 million for the first quarter of
8 PricewaterhouseCooper (2011 October). The Games Effect. Report 7: Global Summary of the Impact of the 2010 Olympic and Paralympic Winter Games on British Columbia and Canada 2003 to 2010. Vancouver, Canada: PricewaterhouseCoopers.

OGI-UBC Post-Games Report Appendix B (Ec07 – Public Economy)
96
2010. Applying an average tax rate of 8.5 percent on goods and services in BC to the PwC estimate of ‘incremental’ spending gives an estimate of $19.4 million in tax revenue for BC. In Table 19, the upper estimate in tax revenue for BC from international (non-Canadian) visitors (based on the increase in spending in 2010 over 2009) is $7.7 million for the first quarter of 2010. In the PwC report, the number of Canadian visitors to BC was estimated to be 79,000 (out of a total of 205,000 total visitors to BC, or about 38.5 percent of visitors to BC). Assuming that the spending habits of Canadian tourists are similar to international tourists, applying the share of Canadian tourists (38.5 percent) to the ‘incremental’ spending in BC in the first quarter of 2010 ($228.1) suggests that Canadian tourists to BC spent about $87.8 million, and applying an average BC tax rate of 8.5 percent to Canadian tourist spending gives about $7.5 million in tax revenue. Adding $7.5 million in tax revenue (Canadian tourists) to the $7.7 million in tax revenue (non-Canadian tourists) in Table 19 gives about $15.2 million in tax revenue from visitor spending in the first quarter of 2010. This $15.2 million is about $4.2 million less than the estimate using PwC numbers. Of course, the numbers in this Post-Games Report and in the PwC report are all based on a variety of estimates for data that were not available. A conservative estimate is that the tax revenue for BC from visitor spending during the first quarter of 2010 that could be attributable to the Games is possibly $10 million or more (but no more than $19 million).
9 ‘Incremental’ visitor spending is spending that is directly attributable to the Games. ‘Non-incremental’ spending is spending that would have taken place regardless of the Games being held. Details on how ‘incremental’ spending was estimated can be found in PwC report.

OGI-UBC Post-Games Report Appendix B (Ec07 – Public Economy)
97
Table 18: Tax Revenue from Olympic Activities (B) - Earnings
Table 19: Tax Revenue from Olympic Activities (A) - Visitor Spending
VANOC Staffing Costs
Tax Rate for Greater Vancouver1 CAD USD
Games-time estimate2 $298.4 17.3% $51.6 $50.1Post-Games estimate3 $298.4 16.3% $48.6 $47.2
Tax Revenue from Olympic Activities - Earnings of VANOC Internal Workforce (Estimates Based on Wages Paid in Olympic Activities, Ec01)
(in millions of dollars)Estimated Tax Revenues from
Earnings4
1 Calculated based on the tax paid as percentage of income for the Greater Vancouver Regional District (assuming that most of VANOC's internal workforce are from this region) from the report series titled "British Columbia Taxation Statistics " from BC Stats (based on data from the Canada Revenue Agency). The latest report is only available for personal tax returns filed two years earlier.2 Tax rate from the year 2008, as was reported in the Games-time Report..3 Tax rate from the year 2009. The tax rate for the year 2010 was not available when last checked on March 8, 2013.4 Although staffing costs were reported in 2010, the estimates of taxes paid as a percentage of income were from 2008 and 2009. Currency conversion to USD is based on the rate from the Bank of Canada for the year 2010 (1.02993904).
20091 20101Increase
2009-2010Median/average
tax rate2 Lower-end Upper-end Lower-end Upper-endCanada $17,344.0 $18,189.0 $845.0 12% $0 $101.4 $0 $98.5BC5 $575.4 $666.1 $90.7 8.5% $0 $7.7 $0 $7.5
International visitors $349.2 $396.3 $47.1 8.5% $0 $4.0 $0 $3.9US visitors $226.2 $269.8 $43.6 8.5% $0 $3.7 $0 $3.6
5 The numbers for BC do not include within-Canada travel, i.e., Canadians who traveled to Vancouver for the Games.
3 The lower end assumes that 0 percent of the increase in visitor spending was for the Games. The upper end assumes that 100 percent of the visitor spending was for the Games. The 'actual' number is probably somewhere between these two numbers.4 Based on the average of the exchange rates for January-March 2010 for the US from the Bank of Canada. All other amounts in this Table are in Canadian dollars.
USD4CADVisitor Spending
Tax Revenue from Olympic Activities - Visitor Spending, Canada and BC(Estimates Based on Ec02: First Quarter Tourist Spending, Seasonally Adjusted)
(in millions of dollars)
1 Numbers for Canada are from Statistics Canada reports on National Tourism Indicators Quarterly Estimates for 2009 and for 2010. Numbers for BC are from Canada Tourism Commission reports on Travel Characteristics Q1 for 2009 and for 2010.
Estimated Tax Revenues3
2 The median tax rate across all provinces and territories was used for Canada. The average of the lowest and the highest tax rate (the Provincial Sales Tax was applicable only on selected goods and services) was used for BC.

OGI-UBC Post-Games Report Appendix B (Ec07 – Public Economy)
98
Summary and Interpretation of Public Economy Indicators The contribution of funding by public authorities for both Olympic activities (capital and operating) ($2,363.6 million CAD) and context activities (Olympic-induced infrastructure projects) ($2,474 million CAD) was significant; across all levels of government, a total of $4,837.6 million CAD) was spent. Similar amounts were spent on Olympic activities (about $2.4 billion) and context activities (about $2.5 billion). The federal and provincial governments spent the most (compared to public authorities in Vancouver, Richmond, and Whistler). While a lack of data precludes accurate estimates of tax revenues from all VANOC-related Olympic activities, an estimate – with caveats – was calculated for tax revenue from VANOC internal staffing (based on income tax rates) (about $50 million). An estimate – again with caveats – was also calculated for visitor spending in BC in the first quarter of 2010 ($10 million to $19 million) that could possibly be attributable to the Games.

OGI-UBC Post-Games Report Appendix B (Ec08 – Gross Domestic Product)
99
Ec08 – Gross Domestic Product (GDP)
Focus Area Purpose (as stated in 2011 OGI)
Gross domestic product
The purpose of this indicator is to measure the evolution of the economic situation in the host city and the region.
Gross Domestic Product
This new OGI indicator was introduced in 2011. Statistics Canada has reported on GDP for many years. However in 2012, international national accounting methods were revised.10 Using the revised methods, Statistics Canada will make revised data available back to 1981, but has not made the data fully available yet as on March 1, 2013 (only available from 2007 on).
The expenditure-based nominal GDP, real GDP and population are shown in Table 20 for Canada and in Table 21 for BC. Currency exchange rates for converting to US dollars are shown in Table 22. The BC real GDP as a share of the Canada real GDP is shown in Table 23. Between 2007 and 2011, in both Canada and BC, the real GDP grew slightly (about 1 to 3 per cent), except in 2009 when the real GDP shrunk slightly (the recession was from 2008 to 2010). The real GDP per capita for Canada and for BC dipped slightly during the recession (2008/2009) and began to increase in 2010. In 2011, the real GDP per capita was still slightly less than pre-recession (2007). The BC share of the Canada real GDP remained relatively stable at around 12.6 percent from 2007 to 2011. The real GDP per capita in BC was consistently around $2,000 less than that for Canada.
10 For a full explanation of the change in methodology, see Canadian System of National Accounts 2012 Historical Revision at http://www.statcan.gc.ca/nea-cen/hr2012-rh2012/start-debut-eng.htm, accessed on March 1, 2013.

OGI-UBC Post-Games Report Appendix B (Ec08 – Gross Domestic Product)
100
Table 20: GDP (Canada)
Year
Nominal GDP (in millions of dollars)
Implicit Price Index (2007= 100)2
Real GDP (in millions of dollars)3 Population4
Real GDP per Capita CAD1 US CAD US
Growth rate Size
Growth rate
2007 $1,566,015 $1,457,055 100.0 $1,566,015 $1,457,055 n/a 32,927,517 n/a $47,559 2008 $1,645,875 $1,543,952 104.0 $1,582,572 $1,484,569 1.1% 33,317,662 1.2% $47,499 2009 $1,564,790 $1,370,246 101.7 $1,538,633 $1,347,341 -2.8% 33,726,915 1.2% $45,620 2010 $1,664,762 $1,616,369 104.9 $1,586,999 $1,540,867 3.1% 34,126,547 1.2% $46,503 2011 $1,762,432 $1,781,910 108.2 $1,628,865 $1,646,867 2.6% 34,483,975 1.0% $47,235
1 Data source: CANSIM 384-0038, Statistics Canada, http://www5.statcan.gc.ca/cansim/a01?lang=eng, accessed on March 1, 2013. GDP is at market prices. 2 Data source: CANSIM 384-0039, Statistics Canada, http://www5.statcan.gc.ca/cansim/a01?lang=eng, accessed on March 1, 2013. GDP is at market prices. 3 Calculated by dividing nominal GDP by the implicit price index and then multiplying by 100. 4 Data source: CANSIM 051-0001, Statistics Canada, http://www5.statcan.gc.ca/cansim/a01?lang=eng, accessed on March 1, 2013. Non-census years (2007-2010) are estimates based on the 2006 census.
Table 21: GDP (BC)
Year
Nominal GDP (in millions of dollars)
Implicit Price Index (2007 =100)2
Real GDP (in millions of dollars) Population4
Real GDP per Capita CAD1 US CAD3 US
Growth rate Size
Growth rate
2007 $196,996 $183,289 100.0 $196,996 $183,289 n/a 4,309,524 n/a $45,712 2008 $203,820 $191,198 102.3 $199,238 $186,899 1.1% 4,384,310 1.7% $45,443 2009 $195,670 $171,343 100.7 $194,310 $170,152 -2.5% 4,459,900 1.7% $43,568 2010 $208,295 $202,240 103.9 $200,476 $194,649 3.2% 4,529,508 1.6% $44,260 2011 $217,749 $220,155 105.6 $206,202 $208,481 2.9% 4,576,577 1.0% $45,056 1 Data source: CANSIM 384-0038, Statistics Canada, http://www5.statcan.gc.ca/cansim/a01?lang=eng, accessed on March 1, 2013. GDP is at market prices. 2 Data source: CANSIM 384-0039, Statistics Canada, http://www5.statcan.gc.ca/cansim/a01?lang=eng, accessed on March 1, 2013. GDP is at market prices. 3 Calculated by dividing nominal GDP by the implicit price index and then multiplying by 100. 4 Data source: CANSIM 051-0001, Statistics Canada, http://www5.statcan.gc.ca/cansim/a01?lang=eng, accessed on March 1, 2013. Non-census years (2007-2010) are estimates based on the 2006 census.

OGI-UBC Post-Games Report Appendix B (Ec08 – Gross Domestic Product)
101
Table 22: Currency Exchange Rates
Year Present value of CAD (of $1 US)
2007 1.07478127
2008 1.06601429
2009 1.14197729
2010 1.02993904
2011 0.98906920 Data source: Monthly and Annual Average Exchange Rates, Bank of Canada, http://www.bankofcanada.ca/rates/exchange/exchange-rates-in-pdf/, accessed on March 1, 2013.
Table 23: Real GDP – BC as a Share of Canada
Year
BC Share of Canada Real
GDP (%)
2007 12.6%
2008 12.6%
2009 12.6%
2010 12.6%
2011 12.7%

OGI-UBC Post-Games Report Appendix B (En01 – Water Quality)
102
En01 – Water Quality
Focus Area Purpose (as stated in 2011 OGI)
Water quality This indicator refers to possible impacts of recreational use of coastal and freshwater environments upon the health of users, and specifically on the health of the athletes competing in and on the aquatic environment.
**Quality of water discharged by Olympic and Paralympic venues
This indicator refers to quality of the water discharged by Olympic and Paralympic venues.
**This is a new OGI focus area.
Water Quality
No recreational coastal or fresh waters were used for any events for the 2010 Winter Games. The data presented are contextual and do not cover the entire OGI reporting period 2001-2013.
Fecal Coliform For the Metro Vancouver region, the maximum limit for geometric-mean fecal concentration for primary or whole body contact activities is less than or equal to 200 fecal coliform bacteria per 100 mL of recreational water based on at least five samples taken during a period not to exceed 30 days. For secondary or incidental contact activities (e.g., boating, fishing), the maximum limit is 1,000 fecal coliforms per 100 mL of recreational water. Between 2005 and 2010 in Metro Vancouver, 27/38 monitoring locations (71.1 percent) met the guidelines in every year that data were collected.11 In eight monitoring locations, the guidelines were not met during only one year, while for three monitoring locations, the guidelines were not met in multiple years. With respect to fecal coliform, most of the recreational waters met the guidelines for human safety. Eutrophication
Eutrophication is a process whereby excessive plant nutrients, such as nitrogen and phosphorus, are added to a body of water from urban areas, industry and agricultural areas. This causes ecological changes that can result in a loss of plant and animal species and have negative impacts on the use of water for human consumption and other purposes.
11 Data were retrieved from Metro Vancouver serial report titled The Greater Vancouver Sewerage & Drainage District Quality Control Annual Report (2009 and 2010). Data are only for the period May to September of each year (summer season).

OGI-UBC Post-Games Report Appendix B (En01 – Water Quality)
103
Data were available only for the years 2003 and 2006 for five monitoring stations on the Fraser River in the Metro Vancouver region (no new data since the OGI Pre-Games Report).12 At all five monitoring stations, the maximum guidelines for safety were met during the data collection periods (about 30 days around February/March in 2003 and in 2006). The maximum amount for ammonia was 17.6 mg/L at pH=7.2 and temperature=10C. The maximum amount for nitrite was 0.06 mg/L at chloride <2 mg/L.
Quality of Water Discharged by Olympic and Paralympic Venues The quality of water discharged by Olympic and Paralympic venues is a new OGI indicator. No data were available on the parameters of effluents of Olympic and Paralympic venues, such as Biological Oxygen Demand (BOD), Total Suspended Solids (TSS), and nutrient load (principally nitrogen, phosphorous, or potassium). With respect to how the water discharged by the Olympic and Paralympic venues was treated, data from the VANOC Sustainability Report 2009-10 indicated that a wastewater treatment plant was built at Whistler Olympic/Paralympic Park (wastewater treatment at other venues was not mentioned). The treatment plant was deemed to be a priority as the effluents would flow into a creek in a sensitive environment. The treatment plant was designed to meet or surpass the environmental standards at all levels of regulation (federal, provincial, and municipal). Summary and Interpretation of Water Quality Indicators
No recreational coastal or fresh waters were used for any events in the 2010 Winter Games. Nevertheless, most of the locations in the event region where water quality was monitored had met safety guidelines. Data on the quality of water discharged by Olympic and Paralympic venues were not available, although one of the venues had a wastewater treatment plant that was specially designed to meet or surpass all safety guidelines.
12 Data were retrieved from the BC Ministry of Water, Land and Air Protection report titled Water Quality in BC – Objectives Attainment (2003 and 2006).

OGI-UBC Post-Games Report Appendix B (En02 – Air Quality and GHG Emission)
104
En02 – Air Quality and GHG Emission
Focus Area Purpose (as stated in 2011 OGI)
*Air quality This indicator measures representative atmospheric outdoor pollutants in urban areas, which have short- and long-term impacts on human health and on athletes’ performances.
Greenhouse gas emissions of the Olympic and Paralympic Games
The total emissions of the Olympic and Paralympic activities are calculated on a construction (embodied carbon) world-wide basis (no limitations to national borders), including air transportation which are main components of the emissions of the Olympic and Paralympic Games. Context activities are not taken into account.
*Attribution analysis was conducted for at least one of the indicators in this focus area.
Air Quality
Concentration of Atmospheric Pollutants Using available data, comparisons were made within the Lower Mainland region of BC for the following hypothesis of impact: that the average annual concentrations of four atmospheric pollutants (NO2, SO2, O3, and PM10) would show a greater increase during construction of venues (2005-2008) and during the event year (2010) at six monitoring stations near Olympic venues (North Vancouver Mahon Park, Richmond South, Squamish, Vancouver International Airport #2, Vancouver Kitsilano, and Whistler Meadow Park) than at seven other locations in the region.
Figure 33 to Figure 36 show the average annual concentrations in µg/m3 of four atmospheric pollutants – NO2, SO2, O3, and PM10 – at selected monitoring stations in the Lower Mainland of BC Not all data were available for all stations. Stations near Olympic venues are represented on the graph using red and black solid lines. Other stations are shown using gray, dotted lines.
Between 2000 and 2011, average annual nitrogen dioxide levels showed an overall decreasing trend at all selected monitoring stations in the Lower Mainland, except at Squamish and Whistler Meadow Park where increases were observed between 2005 and 2007/2008 (see Figure 33). No unusual changes were observed at any of the monitoring stations during the event year, including the stations near Olympic venues. These data suggest that the 2010 Winter Games may have contributed to increased nitrogen dioxide levels at Squamish and Whistler during the venue construction years (supports the hypothesis of impact). However, a ‘context’ activity also coincided with the construction of Olympic venues; between 2005 and 2009 the Sea-to-Sky Highway between West Vancouver and Whistler was upgraded.13 Construction on the Sea-to-Sky highway also likely contributed to increased nitrogen dioxide levels between 2005 and 13 The Sea-to-Sky Highway upgrade was not considered a direct Olympic activity because plans to upgrade were already in the works before 2003 when it was announced that Vancouver would host the 2010 Winter Games).

OGI-UBC Post-Games Report Appendix B (En02 – Air Quality and GHG Emission)
105
2007/2008. Because no unusual increases in nitrogen dioxide were observed at stations near Olympic venues other than at Squamish and Whistler, it is concluded that a significant share of the increases at Squamish and Whistler were probably due to highway upgrades rather than to venue construction.
With respect to annual average sulphur dioxide levels, there were significant variations between the selected monitoring stations, i.e., there was no common trend across stations during the reporting period 2000-2011 (see Figure 34). Therefore, an attribution analysis was not possible. However, the sulphur dioxide levels at Squamish did appear to show an increasing trend after 2006. Ozone levels appeared to be increasing over time across the selected monitoring stations (see Figure 35). No unusual increases in ozone levels were observed at stations near Olympic venues. This finding suggests that the 2010 Winter Games did not have an impact on ozone levels between 2000 and 2011. There was an overall trend of decreasing average annual levels of PM10 across all selected monitoring stations between 2000 and 2011 (see Figure 36). Interestingly, the levels at Squamish were highest at the beginning of the reporting period and lowest at the end of the reporting period, and seemed to be especially high between 2005 and 2008. Similar to nitrogen dioxide, the unusual increase was most likely due largely to upgrades to the Sea-to-Sky Highway rather than to construction of Olympic venues. In summary, the hypothesis of Olympic impacts on four atmospheric pollutants – NO2, SO2, O3, and PM10 – from 2005-2008 and during the event year (2010) were not strongly supported by the data on annual averages.

OGI-UBC Post-Games Report Appendix B (En02 – Air Quality and GHG Emission)
106
Figure 33: Air quality (A) (nitrogen dioxide, µg/m3)
Data source: BC Air Data Archive Website, BC Ministry of Environment (envistaweb.env.gov.bc.ca), accessed August 3, 2012. Some readings were not available for some stations. The original unit of ppb of nitrogen dioxide was converted to µg/m3 using 1 ppb = 1.88 µg/m3 assuming an ambient pressure of 1 atmosphere and a temperature of 25 degrees Celsius.
Nitrogen Dioxide (NO2) Levels at Selected Monitoring Stations in the Lower Mainland, 2000-2011
0.0
10.0
20.0
30.0
40.0
50.0
60.0
70.0
2000 2001 2002 2003 2004 2005 2006 2007 2008 2009 2010 2011
Year
Mic
rogr
ams/
m3
Abbotsford Airport Walmsley RoadBurnaby Kensington ParkBurnaby SouthLangley CentralNorth Vancouver Mahon ParkPitt Meadows Meadowland SchoolPort Moody Rocky Point ParkRichmond SouthSquamishSurrey EastVancouver International Airport #2Vancouver KitsilanoWhistler Meadow Park

OGI-UBC Post-Games Report Appendix B (En02 – Air Quality and GHG Emission)
107
Figure 34: Air quality (B) (sulfur dioxide, µg/m3)
Data source: BC Air Data Archive Website, BC Ministry of Environment (envistaweb.env.gov.bc.ca), accessed August 3, 2012. Some readings were not available for some stations. The original unit of ppb of sulphur dioxide was converted to µg/m3 using 1 ppb = 2.62 µg/m3 assuming an ambient pressure of 1 atmosphere and a temperature of 25 degrees Celsius.
Sulphur Dioxide (SO2) Levels at Selected Monitoring Stations in the Lower Mainland, 2000-2011
0.0
1.0
2.0
3.0
4.0
5.0
6.0
7.0
2000 2001 2002 2003 2004 2005 2006 2007 2008 2009 2010 2011
Year
Mic
rogr
ams/
m3
Burnaby Kensington ParkBurnaby SouthLangley CentralNorth Vancouver Mahon ParkPitt Meadows Meadowland SchoolPort Moody Rocky Point ParkRichmond SouthSquamishVancouver International Airport #2Vancouver Kitsilano

OGI-UBC Post-Games Report Appendix B (En02 – Air Quality and GHG Emission)
108
Figure 35: Air quality (C) (ozone, µg/m3)
Data source: BC Air Data Archive Website, BC Ministry of Environment (envistaweb.env.gov.bc.ca), accessed August 3, 2012. Some readings were not available for some stations. The original unit of ppb of ozone was converted to µg/m3 using 1 ppb = 2.00 µg/m3 assuming an ambient pressure of 1 atmosphere and a temperature of 25 degrees Celsius.
Ozone (O3) Levels at Selected Monitoring Stations in the Lower Mainland, 2000-2011
0.0
5.0
10.0
15.0
20.0
25.0
30.0
35.0
40.0
45.0
50.0
2000 2001 2002 2003 2004 2005 2006 2007 2008 2009 2010 2011
Year
Mic
rogr
ams/
m3
Burnaby Kensington ParkBurnaby SouthLangley CentralNorth Vancouver Mahon ParkPitt Meadows Meadowland SchoolPort Moody Rocky Point ParkRichmond SouthSquamishSurrey EastVancouver International Airport #2Vancouver KitsilanoWhistler Meadow Park

OGI-UBC Post-Games Report Appendix B (En02 – Air Quality and GHG Emission)
109
Figure 36: Air quality (D) (PM10, µg/m3)
Data source: BC Air Data Archive Website, BC Ministry of Environment (envistaweb.env.gov.bc.ca), accessed August 3, 2012. Some readings were not available for some stations.
Exceedance of Air Quality Limits (Percentage of Year) near Olympic Venues Table 24 shows the maximum acceptable limits used by the BC government for air quality standards for NO2, SO2, O3, and PM10 (updated April 2009).14
14 Air quality standards adopted by the BC Government can be found at http://www.bcairquality.ca/reports/pdfs/aqotable.pdf (accessed on August 3, 2012).
Particulate Matter (PM10) Levels at Selected Monitoring Stations in the Lower Mainland, 2000-2011
0.0
2.0
4.0
6.0
8.0
10.0
12.0
14.0
16.0
18.0
2000 2001 2002 2003 2004 2005 2006 2007 2008 2009 2010 2011
Year
Mic
rogr
ams/
m3
Burnaby Kensington ParkBurnaby SouthLangley CentralNorth Vancouver Mahon ParkPitt Meadows Meadowland SchoolPort Moody Rocky Point ParkRichmond SouthSquamishSurrey EastVancouver International Airport #2Vancouver Kitsilano
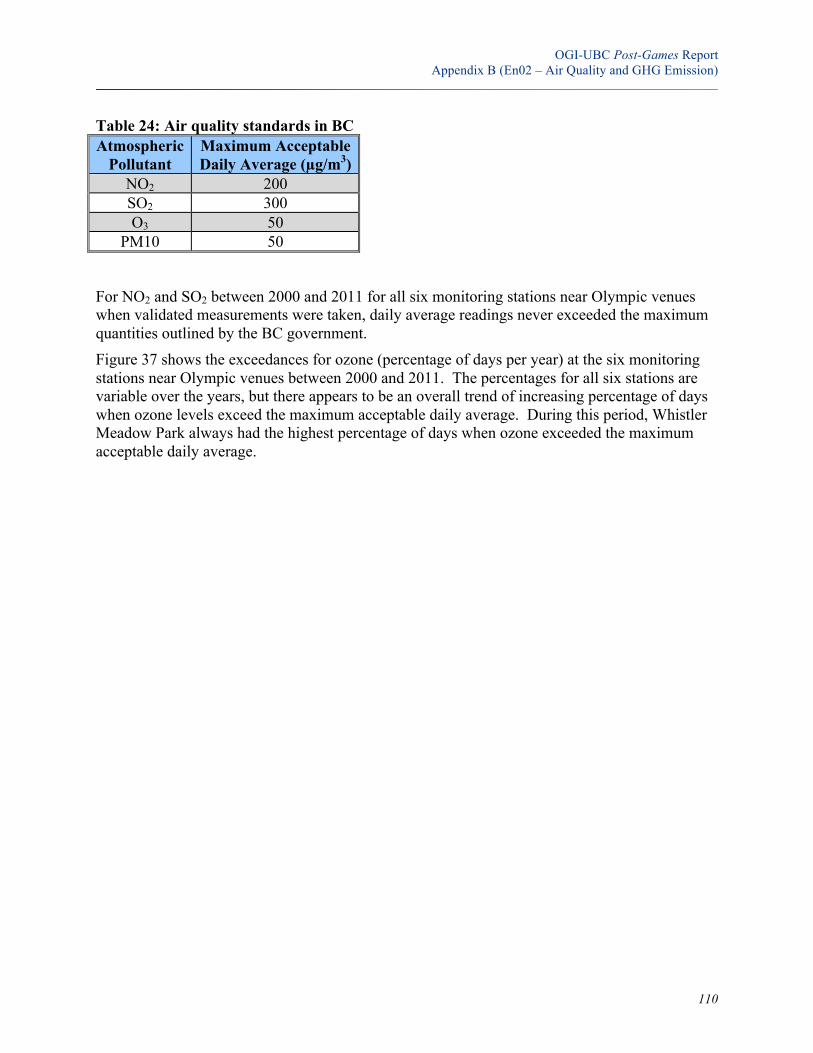
OGI-UBC Post-Games Report Appendix B (En02 – Air Quality and GHG Emission)
110
Table 24: Air quality standards in BC Atmospheric
Pollutant Maximum Acceptable Daily Average (µg/m3)
NO2 200 SO2 300 O3 50
PM10 50
For NO2 and SO2 between 2000 and 2011 for all six monitoring stations near Olympic venues when validated measurements were taken, daily average readings never exceeded the maximum quantities outlined by the BC government. Figure 37 shows the exceedances for ozone (percentage of days per year) at the six monitoring stations near Olympic venues between 2000 and 2011. The percentages for all six stations are variable over the years, but there appears to be an overall trend of increasing percentage of days when ozone levels exceed the maximum acceptable daily average. During this period, Whistler Meadow Park always had the highest percentage of days when ozone exceeded the maximum acceptable daily average.

OGI-UBC Post-Games Report Appendix B (En02 – Air Quality and GHG Emission)
111
Figure 37: Air quality (E) (ozone, exceedances)
Data source: Calculated based on data obtained from the BC Air Data Archive Website, BC Ministry of Environment (envistaweb.env.gov.bc.ca), accessed August 3, 2012. Some readings were not available for some stations. Stations in the Lower Mainland with no readings for the relevant atmospheric pollutants are excluded. The unit of ppb was converted to micrograms/m3 for nitrogen dioxide (1 ppb = 1.88 µg/m3), sulfur dioxide (1 ppb = 2.62 µg/m3), and ozone (1 ppb = 2.00 µg/m3) assuming an ambient pressure of 1 atmosphere and a temperature of 25 degrees Celsius.
For the five monitoring stations with available data (excludes Whistler Meadow Park) for the years 2000-2011, PM10 levels in most years did not exceed the maximum acceptable daily average. For any location, only 0.6 percent or less of the days exceeded the maximum acceptable daily average during only one year of duration of the reporting period: 0.3 percent in 2002 at Vancouver International Airport #2; 0.3 percent in 2003 at Richmond South; 0.3 percent in 2010 at North Vancouver Mahon Park; and 0.6 percent in 2010 at Squamish. The daily readings for exceedances at two locations in 2010 did not overlap with the Olympic or Paralympic event (February or March 2010).
Air Pollution at Key Locations during Olympic (February 12 to 28) and Paralympic (March 12 to 21) Periods
Using available data, comparisons were made at six monitoring stations near Olympic venues for the following hypothesis of impact: that the level of four atmospheric pollutants (NO2, SO2, O3, and PM10) would be consistently higher or lower than previous years during the Olympic period
Exceedances of Ozone (O3) at Selected Monitoring Stations near Olympic Venues in the Lower Mainland of B.C., 2000-2011
0.0%
5.0%
10.0%
15.0%
20.0%
25.0%
30.0%
35.0%
40.0%
2000 2001 2002 2003 2004 2005 2006 2007 2008 2009 2010 2011
Year
Perc
enta
ge o
f day
s pe
r yea
r
North Vancouver Mahon ParkRichmond SouthSquamishVancouver International Airport #2Vancouver KitsilanoWhistler Meadow Park

OGI-UBC Post-Games Report Appendix B (En02 – Air Quality and GHG Emission)
112
(February 12 to 28) and the Paralympic period (March 12 to 21). While it is anticipated that spectators would travel to Olympic venues (more pollution), public transit was encouraged and driving and parking restrictions were implemented (less pollution). A subset of the data used to determine exceedances was used to determine levels of atmospheric pollutants during the Games period. Levels of NO2, SO2, O3, and PM10 at monitoring stations near Olympic venues were quite variable over the years during both the Olympic period (February 12 to 28) and the Paralympic period (March 12 to 21) (too much data to be shown here). The levels of the four pollutants during the event year (2010) were neither consistently higher nor lower than other years. This suggests that the 2010 Winter Games did not significantly alter air pollution during the event, or at least that the availability of public transit and the implementation of driving and parking restrictions kept pollution levels normal even as people traveled around the city to get to Olympic venues.
Greenhouse Gas Emissions of the Olympic and Paralympic Games
No new data on greenhouse gas (GHG) emissions of the Olympic and Paralympic Games have been collected since the OGI Games-time Report for the 2010 Winter Games (because the event had ended). The findings presented here are from the Games-time Report. Data are broken down by sector in units of total CO2 equivalents rather than levels of six individual GHGs in the Kyoto Protocol (carbon dioxide, methane, nitrous oxide, hydrofluorocarbons, perfluorocarbon, and sulphur hexafluorides) (see Table 25).
The data show a predictably large increase in GHG emissions between August 2009 and April 2010. This period includes the staging of the 2010 Winter Games in February and March, 2010. The 2009/2010 GHG emissions were over eight times higher than the cumulative emissions for the previous four reporting periods (August 2005 to July 2009).
The largest share of the cumulative total of GHG emissions was from Spectators and Media Transportation (50.8 percent), which includes travelling to get to the Games (air) as well local travel. The second largest share of the cumulative total was from Air, Train and Car Transport for OCOG operations (28.5 percent). The combined transportation by different parties using different modes accounted for 87.5 percent of the cumulative GHG emissions from 2005 to 2010. Although emissions for Olympic Venues and Other activities increased during Games-time (2009-2010), these accounted for only 12.9 percent of the cumulative GHG emissions. In summary, the data on GHG emissions suggest that the negative impact of the Games on the environment was due mainly to transportation, a significant portion of which was travelling to get to the Games in Vancouver, Canada.

OGI-UBC Post-Games Report Appendix B (En02 – Air Quality and GHG Emission)
113
Table 25: Greenhouse gas emissions (in CO2e) of the Olympic and Paralympic Games
Sector 2005 to 20091 2009 to 20102 Cumulative
(2005 to 2010)
Proportion of Cumulative Total (%)
Olympic venues 8,729 11,087 19,816 7.1% Spectators and media transportation
0 141,129 141,129 50.8%
Olympic family transportation 0 21,688 21,688 7.8% Air, train, and car transport (OCOG operations)
17,729 61,308 79,037 28.5%
Other (e.g., Villages, Torch Relay, etc.)
2,082 13,925 16,007 5.8%
Totals 28,540 249,137 277,677 100% Data source: VANOC Sustainability Report 2009-2010. 1 The reporting period consists of four twelve-month August-to-July periods (e.g., Aug.2005-Jul.2006, etc.). 2 The reporting period is Aug.2009-Apr.2010.
Summary and Interpretation of Air quality and Greenhouse Gas Emission Indicators
During an eleven-year period (2000-2011) at thirteen monitoring stations in the Lower Mainland of BC (which included six stations near Olympic venues): NO2 levels showed an overall decreasing trend; SO2 levels were variable (no discernible trend); O3 levels showed an overall increasing trend; and PM10 levels showed an overall decreasing trend. Although higher than usual levels of some pollutants (NO2, SO2, PM10) were observed from 2005-2008 at Whistler and/or Squamish (near some Olympic venues), the increases were more likely to have been a result of highway upgrades (a context activity) than of construction of Olympic venues. In terms of exceedances of air quality standards, O3 was the only pollutant that had notable exceedances in any one year at monitoring stations near Olympic venues, especially at Whistler Meadow Park. O3 was also the only pollutant that showed an increasing trend from 2000 to 2011. Data during the Olympic period (February 12 to 28) and the Paralympic period (March 12 to 21) showed that the 2010 Winter Games did not significantly alter air pollution during the event, possibly a result of the availability of public transit and the implementation of driving and parking restrictions that countered increases in pollution levels due to traveling to and from Olympic venues. Transportation (OCOG operations, Olympic family, and spectators and media) contributed the most to the GHG emissions of the 2010 Winter Games (87.5 percent of total GHG emissions).
In summary, the hypothesis of increased air pollution due to the 2010 Winter Games from 2005-2008 (construction of venues) and during the event period/year (2010) were not strongly supported by the data.

OGI-UBC Post-Games Report Appendix B (En03 – Land Use Changes Protected Sites and Biodiversity)
114
En03 – Land Use Changes Protected Sites and Biodiversity
Focus Area Purpose (as stated in 2011 OGI)
Olympic-induced land use changes
This indicator focuses on temporary and permanent land-use changes induced by the staging of the Olympic and Paralympic Games (competition and non-competition venues).
Olympic and Paralympic venues in protected sites
This indicator measures the potential impact of Olympic venues and/or competition on or near protected sites and the measures taken to compensate these impacts.
Threatened species
This indicator focuses on the threatened species living close to Olympic venues or impacted by Olympic activities.
Olympic-induced Land Use Changes No new data are available since the OGI Games-time Report for the 2010 Winter Games; therefore the findings presented in this section are from the Games-time Report (see Table 26). All venue sites are reported as being previously existing facilities/resorts, previously harvested timber areas, or former industrial sites. While renovations on pre-existing facilities generally created minor modifications to their geographical footprint, venue construction of previous harvested timber areas and industrial sites (and even in some cases for pre-existing facilities/resorts) affected riparian habitats and led to the removal of trees. Various compensation measures were implemented on over 50 hectares of land across several venue sites during the construction phase and planned for post-Games, e.g., relocation of plant and animal species to nearby unaffected areas and restoration/revegetation. All venues are anticipated to revert back to their initial situations with some modifications (e.g., ski resorts, sport facilities) or are part of a larger community/neighbourhood multi-use development plan (e.g., new housing units in the Villages). Data on temporary land-use changes, and on other aspects of venue development, such as transportation infrastructure surrounding the venues (e.g., changes to roads, parking, transit), were not available in the Sustainability Reports.

OGI-UBC Post-Games Report Appendix B (En03 – Land Use Changes Protected Sites and Biodiversity)
115
Table 26: Olympic-induced Land Use Changes1
Initial (Pre-Games) Venue Development Impacts Compensation Measures (Anticipated) Final
Situation (Post-Games) Mountain venues Whistler Olympic/Paralympic Park
Previously harvested forest area adjacent to a former mine
Affected approximately 1.8 hectares of in-stream and riparian habitat
Construction phase : For every hectare impacted, 16 hectares were protected through extended riparian setbacks; 155,835 m 2
(15.5 hectares) was restored via revegetation Post-Games : 10,000 m 2 (1 hectare) area of creek restoration, riparian tree and shrub replanting, slope stabilization and seeding revegetation
Cross-country ski trails
Whistler Sliding Centre Previously harvested forest adjacent to alpine ski resort
Site clearing (e.g., wood waste) Construction phase : 20,370 m 2 (2 hectares) was restored via revegetation and some tree planting Post-Games : 5,000 m 2 (0.5 hectare) of seeding revegetation
Sliding sports and tourism
Whistler Creekside Existing ski trails within major ski area
Removal of riparian vegatation, clearing of old growth trees
Construction phase : Relocation of tadpoles and adult frogs; 400,000 m 2 (40 hectares) was restored, primarily in the form of seeding Post-Games : 10,000 m 2 (1 hectare) area of creek restoration, riparian tree and shrub planting and seeding revegetation
Training, racing and recreational ski trails
Cypress Mountain Previously existing ski runs Site clearing (e.g., wood waste) Construction phase : Relocation of wetland plant species to neary wetlands and seeding in a 36,000 m 2 area (3.6 hectares) Post-Games : 7,500 m 2 (0.75 hectare) area of slope stabilization and seeding revegetation
Same use as pre-Games
City venues Canada Hockey Place Previously existing facility (sports
and other events) Limited modifications to pre- existing facility
Same use as pre-Games Vancouver Olympic/Paralympic Centre
Gravel parking area, adjacent to an aging community complex
The venue replaced the aging complex (torn down), site clearing (e.g., trees)
Salvaged trees were relocated to other sites in the park, revegatation of demolished sites
Community facility (e.g., library, swimming pool, ice rink, community centre)
1 All data are from the VANOC Sustainability Reports unless otherwise noted.

OGI-UBC Post-Games Report Appendix B (En03 – Land Use Changes Protected Sites and Biodiversity)
116
Olympic and Paralympic Venues in Protected Sites No new data are available since the OGI Games-time Report for the 2010 Winter Games; therefore the findings presented in this section are from the Games-time Report. Data from the VANOC Sustainability Report 2009-2010 were for areas that were destructed permanently or temporarily by the building of venues, but not for the area where venues were built without destroying natural sites. No data were available on the compensation measures specifically implemented within or near protected areas. It should be noted that although the OGI Technical Manual defines “near protected sites” as venues being at a distance of less than 1 km from the protected sites, VANOC defined “near protected sites” as venues being at a distance of less than 3 km from protected sites.
VANOC reports that an area of 5.9 km2 (590 hectares) across six sport venues (e.g., some mountain venues), one village and one facility were within or near protected areas or areas of high biodiversity value (a distance of 3 km or less).
Initial (Pre-Games) Venue Development Impacts Compensation Measures (Anticipated) Final
Situation (Post-Games) Pacific Coliseum Previously existing facility (sports
and other events) Limited renovation to pre- existing facility, minimal increase in impervious land surface
Same use as pre-Games
Richmond Olympic Oval Previously developed brownfield site, mainly a recreational vehicle park (the surrounding riverfront area will also be developed) 2
Rezoned as a part of a Comprehensive Development District that inlcudes the Oval, hardwood trees cut
For every tree removed, a minimum of two trees were planted in and around the venue and other local parks
Multi-sport and wellness facility
UBC Thunderbird Arena Land of pre-existing ice rink facility The venue replaced the pre- existing facility
Multi-sport facility Britannia Centre (training venue)
Pre-existing ice rink Renovations to the pre- existing facility
Same use as pre-Games Trout Lake Centre (training venue)
Pre-existing public ice rink attached to a community centre
The venue replaced the pre- existing ice rink. Site clearance, e.g., removal of trees.
For every tree removed, a minimum of two trees were planted in and around the venue site
Same use as pre-Games
Killarney Centre (training venue)
Pre-existing public ice rink attached to a community centre and public aquatic centre
Redevelopment of the rink (aquatic centre remains)
For every tree removed, a minimum of two trees were planted in and around the venue site
Same use as pre-Games
Villages Vancouver Olympic/Paralympic Village
Former industrial site The Village is part of a larger redevelopment plan for the area
Ecological restoration of the shoreline and contaminated lands, creation of a significant wildlife habitat through green space and foreshore rehabilitation
Market and non-market (affordable housing units)
Whistler Olympic/Paralympic Village
Development on previously harvested timber area, adjacent to former landfill 3
Site clearing, e.g., trees Creation of an on-site wetland complex
Sport training facility and affordable housing (part of a larger eighbourhood development plan)
Whistler Atheletes' Centre Development on previously harvested timber area, adjacent to former landfill 3
Site clearing, e.g., trees Sport training facility and accommodation
Facilities BC Place Pre-existing facility (sports and
other events) Limited modifications to pre- existing facility
Same use as pre-Games Main Media Centre Pre-existing waterfront facility
(convention centre) (expansion of the facility is not directly related to the Games)
Expansion of pre-existing facility
Same use as pre-Games prior to expansion
1 All data are from the VANOC Sustainability Reports unless otherwise noted. 2 Data from a City of Richmond news release about the rezoning (http://www.richmond.ca/news/2005_city/1221_oval.htm, accessed January 24, 2011). 3 From the website of the Resort Municipality of Whistler (http://www.whistler.ca/index.php?option=com_content&task=view&id=276&Itemid=98, accessed January 24, 2011).
Olympic-induced Land-use Changes 1 (continued)

OGI-UBC Post-Games Report Appendix B (En03 – Land Use Changes Protected Sites and Biodiversity)
117
Threatened Species Data on the number of known species and the percentage of vulnerable and endangered species impacted by Olympic activities were not available. However, VANOC did note in its 2008-2009 Sustainability Report (p.47) that its environmental consultants (through the Environmental Assessment process) evaluated venue sites for at-risk species using British Columbia Conservation Data Centre (CDC) data. At venue sites where at-risk species had the potential to inhabit, VANOC conducted more in-depth studies, and where required, avoidance strategies were incorporated into venue design, and management and mitigation plans were developed and deployed in the field so as to prevent impact on key species.
Summary and Interpretation of Land Use Changes, Protected Sites and Biodiversity Indicators
Changes in land-use due to the development of Olympic venues can be categorized as one of the following – no change (similar use before, during, and after the Games), from previously harvested timber area to sport and other facilities, or from industrial/brownfield sites to sport and other facilities/amenities. Although venue development required site clearing in many cases (e.g., removal of trees), some compensation measures were implemented to minimize the negative impact on environment. An area of 5.9 km2 (590 hectares) across six sport venues (e.g., some mountain venues), one village and one facility were within or near protected areas or areas of high biodiversity value (a distance of 3 km or less). Where at-risk species were identified to have potential to exist and where required, avoidance strategies were incorporated into venue design, and management and mitigation plans were developed and deployed in the field so as to prevent impact on key species.

OGI-UBC Post-Games Report Appendix B (En04 – Olympic Venues)
118
En04 – Olympic Venues
Focus Area Purpose (as stated in 2011 OGI)
Evolution of new venues’ project
This indicator focuses on the evolution of the project from the bid phase to the reassignment or conversion post-Games. It applies to each new purpose-built venue.
Capacity of Olympic venues
This indicator focuses on the total capacity of the venues taking into account pre-existing venues, the Olympic and Paralympic mode and post-Olympic reassignment and redevelopment.
Operating and maintenance of Olympic and Paralympic venues
This indicator focuses on resources used to operate and maintain the Olympic and Paralympic sites (competition and non-competition venues).
Evolution of new venues’ project The indicator on the evolution of new venues’ project is new to OGI (introduced in 2011).

OGI-UBC Post-Games Report Appendix B (En04 – Olympic Venues)
119
Table 27 shows the six venues that were newly constructed on previously used sites, as identified in the VANOC 2005-2006 Sustainability Report (p.31). The list of venues does not include modifications or replacements to existing facilities, which were not categorized as “new.” For all new venues, environmental assessments were conducted and Environmental Management Plans (construction and operation) were implemented. The two new competition venues in Whistler were the most costly of all new (and renovated) venues. An application for LEED certification was submitted for five of the six new venues (the Whistler Olympic and Paralympic Village was part of a pilot project), and all five received at least a Silver LEED certification. All new venues have been converted for post-Games use.

OGI-UBC Post-Games Report Appendix B (En04 – Olympic Venues)
120
Table 27: Evolution of New Venues' Project
New Venue
Cost (in thousands of dollars) Development LEED Certification Post-Games Legacy
Vancouver Olympic/ Paralympic Centre
$41,386 On existing gravel parking area
Targeted Gold Conversion to multi-use community recreation facility (e.g., public library, swimming pool, ice rink, community centre)
Richmond Olympic Oval
$63,679 On previously developed brownfield site
Silver Conversion to multi-use community recreation, health and wellness facility with capacity to host speed skating competitions
Whistler Sliding Centre
$104,928 Adjacent to existing ski areas and parking lots
Gold (refrigeration plant building) (other on-site buildings adhere to similar green building design principles)
Sliding track for sport training, competition and public use
Whistler Olympic/ Paralympic Park
$122,467 In a previously harvested timber area, adjacent to a former mine site
Gold Ski trails for training, competition and public recreational use
Vancouver Olympic and Paralympic Village
$30,000 On former brownfield site
Gold, except the community centre which received Platinum
Market and affordable housing (252 units)a
Whistler Olympic and Paralympic Village
$37,500 On previously harvested timber area, adjacent to former landfill
Part of a pilot project with the Canada Green Building Council to test the new LEED Neighbourhood Development (ND) standard
Market and affordable housing (now called Cheakamus Crossing, which provides housing for about 800 local residents)b
Data sources: a) data on which venues were “new” and their development were from the VANOC 2005-2006 Sustainability Report (p.31, p.88-89); b) data on cost were obtained from the VANOC Consolidated Financial Statements (published on December 17, 2010) for the cumulative period from September 30, 2003 (incorporation) to July 31, 2010; and c) data on LEED certification and post-Games legacy were from Appendix D of the VANOC 2009-2010 Sustainability Report (any pending applications for LEED certification have been verified using the LEED Projects in Canada – last updated on January 31, 2013 – on the Canada Green Building Council website, http://www.cagbc.org/Content/NavigationMenu/Programs/LEED/ProjectProfilesandStats/default.htm, accessed on February 21, 2013). aAs checked on the City of Vancouver website, http://vancouver.ca/home-property-development/olympic-village.aspx, accessed on February 21, 2013. bAs reported in the 2010 Annual Report of the Resort Municipality of Whistler.

OGI-UBC Post-Games Report Appendix B (En04 – Olympic Venues)
121
Capacity of Olympic Venues No new data were required (or available) for this indicator since the Vancouver OGI Games-time Report; therefore, the same information is presented below as was in the Games-time Report. Note: Venue seating capacity refers to the total number of seats available, and not only the number of tickets (seats) that were available to the general public for purchase. Table 28 (Olympic) and Table 29 (Paralympic) show the spectator capacities of the venues.
Four pre-existing venues that already had spectator seating were used during the 2010 Winter Games – BC Place (both Olympic and Paralympic Games), Pacific Coliseum (Olympic Games only), UBC (both Olympic and Paralympic Games) and Canada Hockey Place (Olympic Games only). After the 2010 Winter Games, these four venues continue to maintain seating capacity and to host a variety of events. Two venues existed but did not have spectator seating (Cypress Mountain, Whistler Creekside). The spectator seating that was available at these two venues during the Games was temporary (dismantled after the Games).
Four venues were newly constructed on previous used sites (Hillcrest, Whistler Olympic/Paralympic Park, Whistler Sliding Centre, Richmond Oval). Spectator seating at these four new venues was also temporary. All venues provided seating for spectators with wheelchairs, while accessible seating for athletes and others varied across venues. Wheelchair seating was generally located in platform areas; some new platform areas were also built to accommodate guests. Mobility impaired seating was located in special areas to avoid stairs (platforms and near gates). Visually impaired seating and hearing impaired seating areas were either arranged through ticketing ahead of time (area nearest to field of play) or was subject to available “hold seating” areas at time of event (the hold and release of accessible seating to persons other than those who need it when these seats are not first sold to people with disabilities). Improvements to pre-existing seating areas (line of sight) and new seating area expansions were created for additional seating (e.g. at BC Place, UBC, and Hillcrest). The available data suggest that spectator seating capacity was greater during the 2010 Winter Games than prior to the Games, mostly due to temporary spectator seating that was added to existing venues or to newly constructed venues. Accessible seating for spectators in wheelchairs was available at all venues.

OGI-UBC Post-Games Report Appendix B (En04 – Olympic Venues)
122
Table 28: Capacity of Olympic Venues
Data source: VANOC
Anticipated post-Gamespermanent temporary permanent temporary usage
60000 - 55000 -spectators - - 132 104
athletes - - - -others - - 22 -
15713 2000 14200 -spectators - - 68 142
athletes - - - -others - - - -
5054 1800 6800 -spectators - - 59 110
athletes - - - -others - - - -
- - 5,600 - Conversion to a newspectators - - - 130 multi-purpose community
athletes - - - - and recreation complexothers - - - 10
18630 (max:
20,000)- 19300 -
spectators - - 94 -athletes - - - -others - - 20 -
- - - 12000spectators - - - 20
athletes - - - -others - - - 4
- - - 12000spectators - - - 20
athletes - - - -others - - - 4
- - - 12000spectators - - - 42
athletes - - - -others - - - 4
- - - 12000spectators - - - 88
athletes - - - -others - - - 4
- - - 12000spectators - - - 54
athletes - - - -others - - - 8
- - - 7700spectators - - - 132
athletes - - - -others - - - 4
- - - 12000spectators - - - 38
athletes - - - -others - - - 4
- - - 7600spectators - - - 94
athletes - - - -others - - - -
Initial Situation Games periodTotal spectator capacity
Richmond Oval
Total
Wheelchair
Whistler Sliding Centre
Total
Wheelchair
Whistler Creekside
Total
Wheelchair
WOP- Ski Jump
Total
Wheelchair
WOP- Cross Country
Total
Wheelchair
WOP- Biathlon
Total
Wheelchair
Cypress - Freestyle
Total
Wheelchair
Cypress - Snowboard
Total
Wheelchair
Canada Hockey Place
Total
Wheelchair
Hilcrest (Vancouver Olympic Centre)
Total
Wheelchair
UBC
Total
Wheelchair
Pacific Coliseum - Figure Skating & Short Track
Total
Wheelchair
BC Place - Opening, Closing & Victory Ceremonies
Total
Wheelchair

OGI-UBC Post-Games Report Appendix B (En04 – Olympic Venues)
123
Table 29: Capacity of Paralympic Venues
Data source: VANOC
Operating and Maintenance of Olympic and Paralympic venues
Data were available in the VANOC Sustainability Report 2009-2010 only for energy (electricity and heating) (no operational costs). As VANOC ceased operations in 2010 shortly after the Games, no new data after the Vancouver OGI Games-time Report were expected. Therefore, the data presented below is similar to the Games-time Report.
As can be seen in Table 30, the Olympic/Paralympic venues used a negligible amount of energy for electricity and heating in the pre-Games period from August 1, 2005 to July 31, 2009, compared to the period during the Winter Games, August 1, 2009 to April 30, 2010. While considerable energy was consumed during the Games, this limited data does not allow for any comments to be made about other resources (manpower) and outputs (waste and wastewater) that were needed to operate and maintain the venues.
permanent temporary permanent temporary
60000 - 55000 -spectators - - 132 172
athletes - - - -others - - 22 20
5054 1800 6800 -spectators - - 123 122
athletes - - - 54others - - - 46
- - 5600 -spectators - - - 130
athletes - - - 28others - - - 30
- - - -spectators - - - 88
athletes - - - -others - - - 4
- - - 5000spectators - - - 132
athletes - - - -others - - - 4
Whistler Creekside
Total
Wheelchair
Total spectator capacity Initial Situation Games period
WPP- Biathlon & Cross Country
Total
Wheelchair
Hilcrest (Vancouver Paraympic Centre)
Total
Wheelchair
UBC
Total
Wheelchair
BC Place - Opening
Total
Wheelchair

OGI-UBC Post-Games Report Appendix B (En04 – Olympic Venues)
124
Table 30: Operating and Maintenance of Olympic and Paralympic Venues – Energy Used (Electricity kWh and Heating GJ, 2005-2009 and 2009-2010)
Summary and Interpretation of Olympic Venues Indicators The available data suggest that strategies were used to minimize the environmental impact of the Games venues. For example, new venues were constructed on previously used sites, had undergone environmental assessments and management plans, received Silver LEED certification or higher, and have been converted for post-Games uses. Temporary spectator seating was mostly only brought in for new venues and pre-existing venues that had no prior spectator seating. The majority of energy consumption for the Games was during the Games period (much less was used during the cumulative, pre-Games period).
2009-‐20101 2005-‐20092 2009-‐2010 2005-‐2009
Venues3 150,504 213 31,474 -‐Olympic and Paralympic Cauldron -‐ -‐ 5,260 -‐Villages 51,784 11 5,601 -‐Other Facilities 228,934 584 73,081 963Total 431,222 808 115,416 963Total 2005-‐2010
Source: VANOC Sustainability Report (2009-‐2010).1 August 1, 2009 to April 30, 2010.2 August 1, 2005 to July 31, 2009.
432,030 116,379
3 VANOC did not have control of competition venues prior to the Games (other than Whistler Olympic Park and Whistler Sliding Centre) so there is no reporting from the majority of venues until VANOC took over exclusive control under the venue agreement. VANOC started reporting energy use once they had exclusive control from just prior to the Games in January until after the Games, and that date varied from facility to facility. The curling facility at Hillcrest Park was a Vancouver Park Board facility, but it was used for both Olympic curling and Paralympic curling so its reporting period is much longer (mid January to early April) than Canada Hockey Place (GM Place/Rogers Centre) which was under VANOC control for a very short period (early February to early March) given the Vancouver Canucks NHL schedule requirements.
Electricty consumption (kWh) Heating consumption (GJ)

OGI-UBC Post-Games Report Appendix B (En05 – Transport)
125
En05 – Transport
Focus Area Purpose (as stated in 2011 OGI)
Use and evolution of the public transport network
This indicator shows the evolution of public transport networks in both supply and demand and also the evolution of public transport practices.
Olympic and Paralympic induced transport
This indicator characterizes the main transport projects implemented for the Games (presented in the Candidature documentation).
Olympic and Paralympic transport impacts
Passenger and freight transport is a key part of the organization of an event like the Olympic Games. The use of Olympic transport has impacts on non-renewable resources, greenhouse gas emissions and atmospheric pollutants emissions.
Use and Evolution of the Public Transport Network Data are for travelling to work specifically (rather than for all purposes) from the 1996, 2001, and 2006 Census Long Form (for 20 percent of households) (Statistics Canada) for Vancouver, BC, and Canada.15 Beginning with the 2011 Census, the Long Form was no longer mandatory and was replaced with the voluntary National Household Survey (NHS). The question about travelling to work was retained in the NHS; however, the most recent data for 2011 has not yet been released. No data were specific to people with disabilities. Figure 38 shows that during the 10-year period, the median commute distance decreased slightly in Vancouver CMA, remained relatively constant in BC, and increased slightly in Canada. In 1996 and 2001, the median commute distance in Vancouver was greater than the medians in BC and in Canada. However, in 2006 the median commute distance in Vancouver dipped below the median commute distance in Canada. The data suggest that people in Vancouver were living closer to their place of work in 2006 than in 1996.
15 Commuting to work was included in the General Social Survey (GSS) Time Use in 2010, but not previously (1986, 1992, 1998, 2005). Like the Census, the GSS occurs every five years (approximately). Therefore, there was insufficient data to justify using the GSS for this OGI indicator.

OGI-UBC Post-Games Report Appendix B (En05 – Transport)
126
Figure 38: Median Commute Distance to Work
Data source: Census, Statistics Canada. Data are for population aged 15 years and over.
With respect to mode of transportation to work (see Figure 39) in Vancouver CMA, the car was consistently the dominant mode for most commuters (over 70 percent) in 1996, 2001, and 2006. Public transit, which was the next largest mode across all years, was considerably lower at less than 20 percent share of commuters. Given the low number of data points (only three) and data in 2001 that seemed to ‘break’ up possible trends between 1996 and 2006, no comment is made at this point in time about increases or decreases in mode of transportation to work. In order to promote public transportation in Vancouver, TransLink (the local transportation authority) has launched various initiatives aimed at reducing direct costs for people who take public transit, including: the U-Pass that have offered public and post-secondary schools students discounted transit passes began since 2003; the Employer Pass Program (EPP) that offers discounted transit annual passes to employees (25 or more employees need to enrol) (launched as a pilot in 1996); and the Sunday and Holiday Fare Card Special which permit a rider with a fare card to take five other riders for free (one other adult and up to four children).
Median Commute Distance to Work (km)
0
1
2
3
4
5
6
7
8
9
1996 2001 2006
Census Year
Med
ian
Dis
tanc
e (k
m)
Vancouver CMABCCanada

OGI-UBC Post-Games Report Appendix B (En05 – Transport)
127
Figure 39: Mode of Transportation to Work
Data source: Census, Statistics Canada. Data are for population aged 15 years and over. “Car” includes commuters as drivers and as passengers. “Other” includes motorcycle, taxi, inline skating, etc.
Olympic and Paralympic Induced Transport
No new data were expected to be available for this indicator after the Games; therefore, the information presented below is from the Games-time Report. Three transport infrastructure projects (one Olympic, two context) were implemented in the city and in the region (see Table 31). The three projects together cost a total of over $2.5 billion.
One project – the Olympic Line streetcar in Vancouver – was a temporary demonstration project for a larger Vancouver Downtown Streetcar Project. The other two projects are intended to accommodate transport for a longer-term. Both the Olympic Line (which was free) and the Canada Line were popular during the Games, and the Canada Line remains popular post-Games (100,000 rides per day is a milestone that was reached sooner than originally projected).
Mode of Transporation to Work, Vancouver CMA, 1996, 2001 and 2006
0%
10%
20%
30%
40%
50%
60%
70%
80%
90%
Census Year
Prop
ortio
n of
Com
mut
ers
to W
ork
Car 77.2% 79.2% 74.4%Public transit 14.3% 11.5% 16.5%Walking 5.8% 6.5% 6.3%Cycling 1.7% 1.9% 1.7%Other 1.5% 1.6% 2.0%
1996 2001 2006

OGI-UBC Post-Games Report Appendix B (En05 – Transport)
128
Table 31: Olympic and Paralympic Induced Transport
Olympic and Paralympic Transport Impacts No new data were expected to be available for this indicator after the Games; therefore, the information presented below is from the Games-time Report. Data on Olympic and Paralympic Transport Impacts include the Olympic Family fleet (referred to as the “Olympic fleet” for short) and a motor coach fleet. With every reporting period of the VANOC Sustainability Reports, fleet size increased and was the highest during the Games (2009-2010 reporting period), with an Olympic fleet of 4,667 vehicles and a motor coach fleet of over 1,000 vehicles (see Table 32). Exact numbers related to the transportation of accredited persons are not available, but both the Olympic vehicles and motor coaches would have been used to transport accredited persons.
Name of the project Olympic Line1 Canada Line2 Sea-to-Sky Highway Improvement Project3
Localisation of the project Vancouver - between the Olympic Village and Granville Island (a tourist attraction that also hosted some Olympic celebration events)
Vancouver-Richmond Vancouver-Whistler
Authority or private organisation owner of the project
City of Vancouver TransLink Government of BC
New or already planned project, Olympic or context activities
New project, Olympic activity (although the project is considered a demonstration project of a larger plan for a Downtown Streetcar Project)
Already planned project, context activity
Already planned project, context activity
Type of project and main characteristics
Public transport - streetcar Light rapid transit Highway, 2-4 lanes
Date of first planning 2007 - planning2008 - construction2010 - opening
2001 - planning2005 - construction2009 - opening
1999 - planning2003 - construction2009 - completion
Length of the project 1.8km 19km 65kmPeak transport capacity 60 days of operation, 18 hours per
day, every 6-10 minutes:12,000 train runs25,400 peak-day ridership
Capacity: 15,000 rides per hour Peak: 16,000 cars/day (pre-construction)
Total investments and funding sources
>$9 million:City of Vancouver - $8.5 millionCanada Mortgage and Housing Corporation - $500,000Bombardier - Streetcars and their operation
$1.9 billion ($2003):Government of Canada - $450 millionGovernment of BC - $435 millionGreater Vancouver Transportation Authority - $321 millionCity of Vancouver - $27 millionVancouver Airport Authority - $245 million
$600 million ($2002) - Government of BC
Does the project comply with accessibility criteria for people with disabilities
Accessible - 2 locations for wheelchair (or bicycle or pram)
Accessible - 4 wheelchairs per train n/a
1 Data obtained from the City of Vancouver website (http://vancouver.ca/engsvcs/transport/streetcar/index.htm) and the Bombardier website (http://www2.bombardier.com/vancouver/index.html), accessed March 9, 2011.2 Data obtained from the TransLink website (http://www.translink.ca) and the City of Vancouver website (http://vancouver.ca/engsvcs/transport/rto/canadaline/faq.htm), accessed March 9, 2011. The Canada Line website, which is no longer available was accessed November 24, 2008.3 Data obtained from the Sea-to-Sky Highway Improvement Project website (http://www.th.gov.bc.ca/seatosky/), accessed March 9, 2011.

OGI-UBC Post-Games Report Appendix B (En05 – Transport)
129
Although the total kilometers travelled by either the Olympic fleet or the motor coach fleet during the Games was not available, an article on November 9, 2010 in 24 Hours reported that the motor coach fleet was driven a combined 5.1 million kilometres to and from Vancouver from other parts of North America. Data on how far the motor coach fleet went while in Vancouver were not available.
Table 32: Olympic Fleet and Motor Coach Fleet
As an alternative to total vehicle-kilometres (which were not available), data were obtained from VANOC on fuel usage for the Olympic fleet and the motor coach fleet combined (see Table 33). The total fuel used from 2005 until March 31, 2010 was 9,012,177 litres, of which 38.5 percent was gasoline and 61.5 percent diesel fuel. Although the pre-Games period (2005-2009) was much longer than the Games-time period (Jan 1 – Mar 31, 2010), the majority of the fuel used was during Games-time. Approximately 55.5 percent, or just over 5 million litres of fuel, was used during the Games-time period, compared to 44.5 percent for the longer, pre-Games period. A total of 23,000 metric tonnes of CO2e was produced from the Olympic fleet and motor coach fleet combined.
Table 33: Olympic Fleet and Motor Coach Fleet (Combined) – Fuel Usage
In VANOC’s last financial statement (December 17, 2010) for the period September 20, 2003 to July 31, 2010, it was reported that operation of the motor coach fleet cost $92.6 million CAD, while operation of the Olympic vehicle fleet cost $43 million CAD. Although the motor coach
Reporting Period Vehicle Fleet1
Motor Coach Fleet2
2005-2006 87 n/a2006-2007 96 n/a2007-2008 127 n/a2008-2009 237 n/a2009-2010 4,667 >1,000
1 VANOC Sustainability Reports from 2005 to 2010.2 "Not So Much Green Games" by Bob Mackin in 24 Hours, November 9, 2010.
Games Time
Fuel (in litres) 2005 2006 2007 2008 20092005-2009
TotalJan. 1 to Mar.
31, 2010 Total % FuelGasoline 7,767 271,513 273,013 351,782 936,783 1,840,858 1,625,437 3,466,295 38.5%Diesel 0 1,718,025 194,901 28,439 225,002 2,166,367 3,379,515 5,545,882 61.5%Total 7,767 1,989,538 467,914 380,221 1,161,785 4,007,225 5,004,952 9,012,177 100.0%
44.5% 55.5% 100.0%
Pre-Games
1 Lessons Learned - The Official Transfer of Knowledge Report from the Engineering & Geomatics Group, VANOC Transportation Department, April 15, 2010.

OGI-UBC Post-Games Report Appendix B (En05 – Transport)
130
fleet was less than a quarter of the size of the Olympic fleet during the Games, it cost more than twice as much to operate the motor coach fleet than it did to operate the Olympic fleet.
Summary and Interpretation of Transport Indicators
Data on travelling to work suggest that people in Vancouver (host city) were living closer to their place of work in 2006 than in 1996. In 1996, 2001 and 2006, the car was consistently the dominant mode of travel to work for most commuters (over 70 percent). Public transit, which was the next largest mode across all years, was considerably lower at less than 20 percent share of commuters. In order to promote public transportation in Vancouver, TransLink (the local transportation authority) has launched various initiatives aimed at reducing direct costs for people who take public transit. Three transport infrastructure projects (one Olympic, two context) were implemented in the city and in the region in preparation for the Games, and together cost a total of over $2.5 billion. The number of vehicles used for Olympic purposes was highest during the Games (2009-2010 reporting period), with an Olympic fleet of 4,667 vehicles and a motor coach fleet of over 1,000 vehicles. The total fuel used by all these vehicles from 2005 until March 31, 2010 was 9,012,177 litres, with most of it being used during Games-time (55.5 percent of total usage). A total of 23,000 metric tonnes of CO2e was produced from these vehicles. Although the motor coach fleet was less than a quarter of the size of the Olympic fleet during the Games, it cost more than twice as much to operate the motor coach fleet ($92.6 million CAD) than it did to operate the Olympic fleet ($43 million CAD).

OGI-UBC Post-Games Report Appendix B (En06 – Energy Consumption)
131
En06 – Energy Consumption
Focus Area Purpose (as stated in 2011 OGI)
Olympic energy consumption
This indicator measures the energy consumption of the Olympic activities, broken down by source and by sector.
Olympic Energy Consumption
No new data on energy consumption for Olympic activities were anticipated after the Vancouver OGI Games-time Report. Therefore, the data presented are from the Games-time Report.
Event data on energy consumption show that two types of sources of energy were used – 53.1 percent fossil fuels (petroleum and natural gas) and 46.9 percent renewable energy (hydroelectric and biomass) (see Table 34). The trend is an increase in annual energy consumption in every successive reporting period, with the largest increase in the final reporting period (during which the Games were held). Cumulatively, hydroelectric energy was consumed the most (46.9 percent), followed by petroleum (41.6 percent); these two types of energy accounted for the majority of energy consumed (87.5 percent).
Although the data could not be broken down by sector as required, the data could be categorized as either transport or as venues and other facilities/activities. Energy consumed for transport was either from biomass (all biomass was used for transport) or from petroleum (in the form of gasoline or diesel). Of the cumulative total of 492,716 gigajoules of energy consumed from petroleum, over one half was for transport (52.9 percent, or 260,559 gigajoules). Overall, transport accounted for 22 percent of cumulative energy consumed from all sources (78 percent of energy consumed was for venues and other facilities/activities).

OGI-UBC Post-Games Report Appendix B (En06 – Energy Consumption)
132
Table 34: Olympic Energy Consumption (gigajoules)
Upon inspection of data from BC Hydro (a provincial Crown corporation and electric utility) on total energy consumption by sector between January 2009 and March 2010 in the selected Olympic municipalities, the most prominent change appears to be in the “Other/Unclassified” category (i.e., energy consumption not classified as residential, commercial, industrial or other/utility and irrigation, other/pumping, or other/streetlights) (see Table 35). Specifically, while the energy consumption totals (overall and for each sector – data not shown) remained relatively stable for the period, energy consumption categorized as “Other/Unspecified” increased suddenly starting in September 2009 in Vancouver and Richmond and two months later in Whistler, followed by an even further increase in February 2010 in Richmond (see Figure 40). While these are sizeable changes in monthly energy consumption for the “Other/Unclassified” category, the changes are not large enough to significantly affect the overall sum total of all sectors (in February 2010 when the Olympic events were held, energy consumption in the “Other/Unclassified” category constituted less than 0.5 percent of total energy consumption in the respective communities) (see Figure 41). Since the winter months of 2009 do not show similar energy consumption levels, and as the months of elevated energy consumption coincide with the time the Olympic Games took place and the period immediately prior, it is somewhat likely that the energy consumption related to Olympic activities was reflected in this category. For comparison, the January to March total unclassified energy consumption for Vancouver was more than three times higher in 2010 (1,134,086 kWh) than in 2009 (263,010 kWh). For Richmond, it was almost five times higher (1,285,517 kWh in 2010 compared to 219,630 kWh in 2009), and for Whistler it was a staggering 31 times higher (287,732 kWh in 2010 compared to 8,940 kWh in 2009). While the above conjecture cannot be formally substantiated by the data source (BC Hydro), the tentative conclusion that the staging of the Olympic Games might be at least partially responsible
2005-2006 2006-2007 2007-2008 2008-2009 2009-20101 Total
Proportion of 2005-
2010 TotalFossil fuels
Petroleum 26,855 44,874 29,196 31,634 360,157 492,716 41.6%Natural gas 0 0 3,511 17,767 115,416 136,694 11.5%Coals 0 0 0 0 0 0 0%
Nuclear energy 0 0 0 0 0 0 0%Renewable energy
Hydroelectric 14,217 14,320 33,615 61,699 431,222 555,073 46.9%Solar 0 0 0 0 0 0 0%Geothermal 0 0 0 0 0 0 0%Tidal 0 0 0 0 0 0 0%Wind 0 0 0 0 0 0 0%Biomass 0 0 0 0 113 113 0%Waste 0 0 0 0 0 0 0%
Totals 41,072 59,194 66,322 111,100 906,908 1,184,596 100.0%Source: VANOC Sustainability Reports 2005-2006, 2006-2007, 2008-2009 and 2009-2010. The reporting period for the 2009-2010 report is August to April, and for all previous reports is August to July.1 The reporting period for the 2009-2010 report is August to April, and August to July for previous reports.

OGI-UBC Post-Games Report Appendix B (En06 – Energy Consumption)
133
for the sudden uncharacteristic increase in unclassified energy consumption in Vancouver, Richmond and Whistler during the winter months 2010 seems to be supported by the data. No comment is provided on the management of scarce and non-renewable energy sources (due to a lack of data).
Table 35: Energy Consumption, Selected Communities, January 2009 to March 2010, “Other, Unclassified”1 and Totals (KWh)
Unclassified Total Unclassified Total Unclassified Total
Jan. 2009 95,487 502,498,623 77,379 186,015,722 149 49,851,070 Feb. 2009 80,724 438,429,396 68,900 161,832,898 4,186 43,187,789 Mar. 2009 86,798 462,715,447 73,351 172,516,065 4,605 42,675,160 Apr. 2009 72,657 414,109,088 59,632 157,890,589 2,488 33,949,312 May 2009 76,675 406,906,573 49,882 153,289,991 1,566 25,929,214 Jun. 2009 103,139 391,300,881 48,085 149,834,029 1,191 21,416,830 Jul. 2009 107,710 406,837,684 53,265 151,407,020 34 21,565,181
Aug. 2009 106,328 409,552,066 54,433 156,694,589 232 22,047,868 Sep. 2009 107,229 398,238,580 161,405 149,870,633 2,633 23,813,651 Oct. 2009 358,726 433,152,274 284,977 166,526,799 7,435 31,485,709 Nov. 2009 338,630 454,654,418 266,306 174,084,457 19,520 42,089,143 Dec. 2009 374,151 491,535,052 280,802 176,902,745 96,785 51,717,046 Jan. 2010 391,327 481,458,920 379,660 182,397,659 106,891 54,138,161 Feb. 2010 354,295 428,046,859 610,844 162,023,679 95,531 48,357,109 Mar. 2010 388,465 449,974,318 295,012 163,556,517 85,310 46,529,484
Source: BC Hydro.1 Energy consumption not classified as residential, commercial, industrial, or other (utility & irrigation, pumping, or streetlights).
Vancouver Richmond Whistler

OGI-UBC Post-Games Report Appendix B (En06 – Energy Consumption)
134
Figure 40: “Other/Unclassified” Energy Consumption, Selected Communities, January 2009 to March 2010 (KWh)
-‐
100,000
200,000
300,000
400,000
500,000
600,000
700,000
Jan. 200
9
Feb. 200
9
Mar. 200
9
Apr. 20
09
May 200
9
Jun. 200
9
Jul. 20
09
Aug. 200
9
Sep. 200
9
Oct. 200
9
Nov. 200
9
Dec. 200
9
Jan. 201
0
Feb. 201
0
Mar. 201
0
Vancouver
Richmond
Whistler

OGI-UBC Post-Games Report Appendix B (En06 – Energy Consumption)
135
Figure 41: Total Energy Consumption, Selected Communities, January 2009 to March 2010 (KWh)
Summary and Interpretation of Energy Consumption Indicators Just over one half of energy consumed for Olympic activities was from fossil fuels, while the rest was from renewable sources. Energy for venues and other facilities/activities accounted for the majority of energy consumed (almost 80 percent). There appears to have been a dramatic increase in energy use related to the event of the Games, as recorded by VANOC and based on the alternative data (not specific to the Olympics) from BC Hydro.
-‐
100,000,000
200,000,000
300,000,000
400,000,000
500,000,000
600,000,000Jan. 200
9Feb. 200
9Mar. 200
9Ap
r. 20
09May 200
9Jun. 200
9Jul. 20
09Au
g. 200
9Sep. 200
9Oct. 200
9No
v. 200
9De
c. 200
9Jan. 201
0Feb. 201
0Mar. 201
0
Vancouver
Richmond
Whistler

OGI-UBC Post-Games Report Appendix B (En07 – Waste and Wastewater)
136
En07 – Waste and Wastewater
Focus Area Purpose (as stated in 2011 OGI)
Solid waste production of the Olympic and Paralympic Games
The waste production (in tonnes), composition (in percentage) and final destination (in percentage) are measured for the Olympic and Paralympic activities managed by the OCOG and for the host city / region as a whole during the Olympic and Paralympic Games.
New waste and wastewater treatment facilities and major improvements
This indicator makes an inventory of all new waste and wastewater treatment facilities and final disposal facilities that have been built and improved in the period before the Olympic Games and directly after.
Solid waste production of the Olympic and Paralympic Games Data on waste production of the Olympic and Paralympic Games were obtained from the series of VANOC Sustainability Reports that included the years 2005 to 2010 (see Figure 42). Note that the 12-month reporting periods are from August 1 to July 31, except for the last reporting period, which was from August 1, 2009 to April 30, 2010 (this data includes post-Games dismantling and retrofit of venues as the Paralympic Games ended on March 12, 2010). No data are presented for waste production for the host region (vs. specific to the Games) because comparable data (similar reporting period and specifications) were not available.
The cumulative waste generated from 2005-2010 was 31,077 metric tonnes. Two peaks in total waste production were observed – one at the beginning of the reporting periods (2005-2007) and one at the end (2010). The higher total waste at the beginning was due to venue construction (primarily composting and reusing materials), while higher waste at the end (primarily recycling) was during the staging of the Games and post-Games, such as dismantling. Rates for waste diversion from landfills (including waste to energy) were reported in the VANOC Sustainability Reports. Beginning with the 2006/2007 report (a different methodology was used in the 2005/2006 report and rates were therefore not comparable), the waste diversion rates were 98 (2006/2007), 76 (2007/2008), 72 (2008/2009), and 76.8 (2009/2010) per cent. VANOC had set for itself a Games-time waste diversion target of 85 per cent, and missed the target by 8.2 per cent. To give some perspective, the waste diversion rate for Metro Vancouver was 55 per cent in 2010 (22 per cent for Canada),16 and targets have been set for Metro Vancouver for 70 per cent by 2015 and 80 percent by 2020.
16 Metro Vancouver (2010). Integrated Solid Waste and Resource Management: A Solid Waste Management Plan for the Greater Vancouver Regional District and Member Municipalities. Burnaby, BC: Metro Vancouver.

OGI-UBC Post-Games Report Appendix B (En07 – Waste and Wastewater)
137
Figure 42: Solid waste production of the Olympic and Paralympic Games (in metric tonnes)
New waste and wastewater treatment facilities and major improvements
No new waste and wastewater facilities have been built in the host regions since the Games-time Report (2011). However, project definition began in 2012 for a new Lions Gate Secondary Wastewater Treatment Plant for West Vancouver and North Vancouver to replace the existing primary treatment plant (not due to the 2010 Winter Games but rather to federal and provincial
(data from VANOC Sustainability Reports 2005/2006, 2006/2007, 2007/2008, 2008/2009, and 2009/2010)
0
2,000
4,000
6,000
8,000
10,000
12,000
Reporting period (Aug.-Jul. unless noted)
Tonn
es
Reuse 3,592 124 24 0 0Recycling 279 42 866 712 8,012Composting 2,489 10,176 19 22 931Waste-to-energy 284 355 62 62 644Disposal at gas-to-energylandfill
234 192 546
Disposal at standard landfill 0 13 79 115 1,203Incinerated hazardous waste 0 0 0 0 1Total 6,644 10,710 1,283 1,103 11,337
2005/2006 2006/2007 2007/2008 2008/2009Aug. 1, 2009
to Apr. 30, 2010

OGI-UBC Post-Games Report Appendix B (En07 – Waste and Wastewater)
138
standards).17 Because no new facilities have actually been built yet, this section is from the Games-time report.
Five waste and wastewater treatment facilities were built or upgraded between 2001 and 2010 – two in Vancouver, one in the Metro Vancouver area, and two in Whistler (see Figure 43). While the facilities in Vancouver and Metro Vancouver were not upgraded in relation to the 2010 Winter Games, the facilities in Whistler had been identified as being needed and spurred on by the Games. Indeed, the heat from the treated water was used to help heat the Whistler Athletes’ Village, which is now a neighbourhood after the Games. Therefore, the 2010 Winter Games do not appear to have affected the upgrading or constructing of waste and wastewater treatment facilities in the Vancouver area, but had spurred the construction of facilities in Whistler.
Figure 43: New or upgraded waste and wastewater treatment facilities in the host regions, 2001 to 2010
Summary and Interpretation of Waste and Wastewater Indicators The majority of the solid waste generated by the Olympic and Paralympic Games (31,077 metric tonnes) occurred at the beginning (venue construction) and at the end (during the staging of the Games and post-Games) of the reporting periods. VANOC was able to attain relatively high
17 http://www.metrovancouver.org/services/constructionprojects/wastewater/Pages/LionsGateWastewaterTreatmentPlant.aspx (accessed on October 26, 2012).
Localisation of the project
Vancouver Vancouver Metro Vancouver Whistler Whistler
Name of the facility Vancouver Landfill1
Vancouver Landfill1 Iona Sewage Treatment2
Whistler Waste Transfer Station3
Whistler Wastewater Treatment Plant3
New project or already planned project
Approved in 1999 Approved in 2001 2001 Planned Planned
Direct relation to Olympic activities or context activities
No No No Context activities Context activities
Type of treatment Solid waste Wastewater Wastewater Solid waste WastewaterDescription of project Upgrade - landfill
gas and flareUpgrade - Leachate collection and containment system
Upgrade - enhanced primary treatment assessment
New - waste compacting (transported to landfill in Washington State, U.S.) to replace the old landfill which was closed in 2007
Upgrade - composting, use of microbes (instead of chemicals), UV disinfection, and use of heat from treated water to heat (95%) the Whistler Athletes' Village
Start of construction 2000 2001 - 2006 2007End of construction 2001 2002 2001 2007 2009Average yearly treatment capacity
200 billion litres (2001)
17776 tonnes (2009) 3.9 million litres (2003)
Total investment $5,400,000 $1,355,000 $300,000 $4,750,000 $51,500,000 1 City of Vancouver Annual Report, Solid Waste Division (2002) and City of Vancouver Landfill Annual Report (2009)2 Metro Vancouver Recyling and Waste and Sewerage Divisions3 Resort Municipality of Whistler website: http://www.whistler.ca (accessed March 17, 2011)
1,225,932 tonnes (2009)

OGI-UBC Post-Games Report Appendix B (En07 – Waste and Wastewater)
139
waste diversion rates (72 to 98 per cent) throughout the reporting periods. While five waste and wastewater treatment plants were built or upgraded between 2001 and 2010 in the host regions (Vancouver, Whistler), only the two facilities in Whistler were spurred on by the 2010 Winter Games, with heat from treated water actually being used during the Games.

OGI-UBC Post-Games Report Appendix B (En08 – Life Cycle Inventory)
140
En08 – Life Cycle Inventory
Focus Area Purpose (as stated in 2011 OGI)
Life cycle inventory of Olympic and Paralympic Games
This indicator assesses the inputs and outputs of energy and materials during the different stages of the Olympic Games life-cycle.
Life Cycle Inventory of Olympic and Paralympic Games No new data were anticipated after the Vancouver OGI Games-time Report. Therefore, the data presented are from the Games-time Report. The data required for this indicator were not available and had to be developed from original research using life cycle assessment (LCA) methodology. The data were from obtained by students from an upper level undergraduate LCA course at the University of British Columbia (CIVL 498C: Whole Building Life Cycle Assessment) in collaboration with the University Sustainability Initiative. The students used the Athena Institute’s Environmental Impact Estimator (IE) LCA software to determine the cradle-to-gate impacts of the Richmond Olympic Oval and the Douglas Mitchell Thunderbird Sports Centre (DMTSC). This software references construction product life cycle inventory data from the Athena LCI Database and the US Environmental Protection Agency’s impact assessment methodology, called the Tool for the Reduction and Assessment of Chemical and other environmental Impacts (TRACI). The following reports are available:
• Life Cycle Analysis: The Richmond Olympic Oval Vancouver, British Columbia (http://www.sustain.ubc.ca/sites/sustain.ubc.ca/files/seedslibrary/Life Cycle Analysis - The Richmond Olympic Oval w cover.pdf)
• Life Cycle Assessment (LCA) Report Thunderbird Old Arena (http://www.sustain.ubc.ca/sites/sustain.ubc.ca/files/seedslibrary/Life Cycle Assessment Report - Thunderbird Old Arena w cover .pdf)
• Life Cycle Analysis (LCA) of Doug Mitchell Thunderbird Sports Centre (http://www.sustain.ubc.ca/sites/sustain.ubc.ca/files/seedslibrary/LCA of Doug Mitchell Thunderbird Sports Centre w cover.pdf)
A presentation of these studies can be found at http://www.youtube.com/user/LCADiscovery. For the presentation slides titled Whole Building Life Cycle Assessment: Three Olympic Venues Presentation Slides, go to (http://www.sustain.ubc.ca/sites/sustain.ubc.ca/files/seedslibrary/LCA Presentation w cover.pdf).
The Richmond Olympic Oval and DMTSC LCA studies were primarily developed from electronic copies of their architectural and structural drawings. Material takeoffs were developed from these drawings using OnScreen Take-Off (http://www.oncenter.com/products/ost/). To ensure accuracy, this takeoff process was complemented with site visits and communications with the venue architects. These takeoffs were input into the IE in order to assess their impacts.
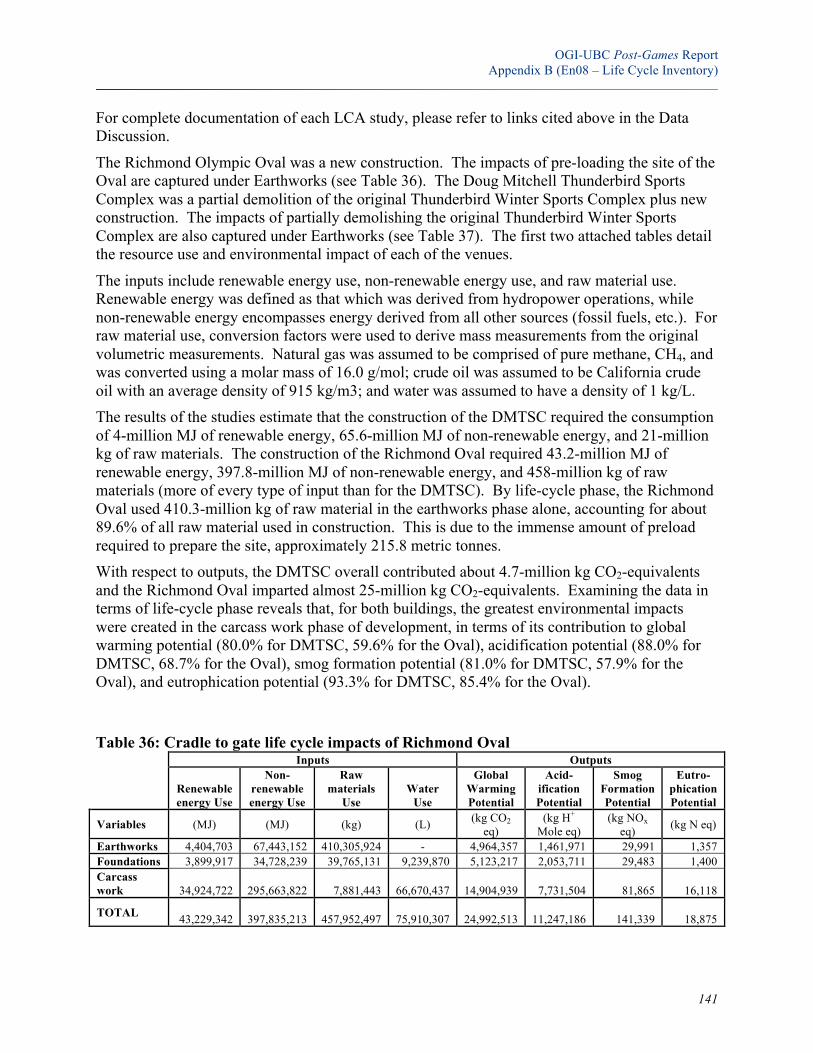
OGI-UBC Post-Games Report Appendix B (En08 – Life Cycle Inventory)
141
For complete documentation of each LCA study, please refer to links cited above in the Data Discussion.
The Richmond Olympic Oval was a new construction. The impacts of pre-loading the site of the Oval are captured under Earthworks (see Table 36). The Doug Mitchell Thunderbird Sports Complex was a partial demolition of the original Thunderbird Winter Sports Complex plus new construction. The impacts of partially demolishing the original Thunderbird Winter Sports Complex are also captured under Earthworks (see Table 37). The first two attached tables detail the resource use and environmental impact of each of the venues.
The inputs include renewable energy use, non-renewable energy use, and raw material use. Renewable energy was defined as that which was derived from hydropower operations, while non-renewable energy encompasses energy derived from all other sources (fossil fuels, etc.). For raw material use, conversion factors were used to derive mass measurements from the original volumetric measurements. Natural gas was assumed to be comprised of pure methane, CH4, and was converted using a molar mass of 16.0 g/mol; crude oil was assumed to be California crude oil with an average density of 915 kg/m3; and water was assumed to have a density of 1 kg/L. The results of the studies estimate that the construction of the DMTSC required the consumption of 4-million MJ of renewable energy, 65.6-million MJ of non-renewable energy, and 21-million kg of raw materials. The construction of the Richmond Oval required 43.2-million MJ of renewable energy, 397.8-million MJ of non-renewable energy, and 458-million kg of raw materials (more of every type of input than for the DMTSC). By life-cycle phase, the Richmond Oval used 410.3-million kg of raw material in the earthworks phase alone, accounting for about 89.6% of all raw material used in construction. This is due to the immense amount of preload required to prepare the site, approximately 215.8 metric tonnes. With respect to outputs, the DMTSC overall contributed about 4.7-million kg CO2-equivalents and the Richmond Oval imparted almost 25-million kg CO2-equivalents. Examining the data in terms of life-cycle phase reveals that, for both buildings, the greatest environmental impacts were created in the carcass work phase of development, in terms of its contribution to global warming potential (80.0% for DMTSC, 59.6% for the Oval), acidification potential (88.0% for DMTSC, 68.7% for the Oval), smog formation potential (81.0% for DMTSC, 57.9% for the Oval), and eutrophication potential (93.3% for DMTSC, 85.4% for the Oval).
Table 36: Cradle to gate life cycle impacts of Richmond Oval Inputs Outputs
Renewable energy Use
Non-renewable energy Use
Raw materials
Use Water
Use
Global Warming Potential
Acid-ification Potential
Smog Formation Potential
Eutro-phication Potential
Variables (MJ) (MJ) (kg) (L) (kg CO2 eq)
(kg H+ Mole eq)
(kg NOx eq) (kg N eq)
Earthworks 4,404,703 67,443,152 410,305,924 - 4,964,357 1,461,971 29,991 1,357 Foundations 3,899,917 34,728,239 39,765,131 9,239,870 5,123,217 2,053,711 29,483 1,400 Carcass work 34,924,722 295,663,822 7,881,443 66,670,437 14,904,939 7,731,504 81,865 16,118
TOTAL 43,229,342 397,835,213 457,952,497
75,910,307 24,992,513 11,247,186 141,339 18,875

OGI-UBC Post-Games Report Appendix B (En08 – Life Cycle Inventory)
142
Table 37: Cradle to gate life cycle impacts of Doug Mitchell Thunderbird Sports Centre. Inputs Outputs
Renewable energy
Use
Non-renewable
energy Use
Raw materials
Use Water Use
Global Warming Potential
Acid-ification Potential
Smog Formation Potential
Eutro-phication Potential
Variables (MJ) (MJ) (kg) (L) (kg CO2 eq)
(kg H+ Mole eq)
(kg NOx eq) (kg N eq)
Earthworks 3,878 852,451 215,809 - 611,042 86,454 1,715 76 Foundations 587,412 6,814,850 8,999,703 2,157,684 327,283 131,442 1,863 95 Carcass work 3,496,060 57,939,541 11,844,636 55,635,894 3,748,218 1,604,747 15,243 2,367 TOTAL 4,087,349 65,606,842 21,060,149 57,793,578 4,686,542 1,822,643 18,821 2,538
From the bill of materials (BOM) for the construction of each building, material usage can be categorized by life-cycle phase (earthworks, foundation, carcass), including estimations of construction waste. In terms of mass, the top three BOM items for the DMTSC are: 30 MPa Concrete with 35% flyash content (12.2-million kg, 70.57% of total BOM mass); concrete blocks (1.5-million kg, 8.49% of total BOM mass); and 20 MPa concrete with average flyash content (.87-million kg, 5.04% of total BOM mass). Similarly, the Richmond Oval’s top three BOM entries are: 30 MPa concrete with average flyash content (64.3-million kg, 72.92% of total BOM mass); residential steel cladding (8.9-million kg, 10.07% of total BOM mass); and 60 MPa concrete with average flyash content (4.6-million kg, 5.23% of total BOM mass). Table 38 summarizes this data in terms of general product category (Wood, Wall Covering, Metal, etc.) and life-cycle phase. This table demonstrates the significant consumption of concrete relative to other materials, by weight, in the construction of the venues. For the DMTSC, concrete accounts for 99.5% (by mass) of material used in foundation work and 64.8% (by mass) of material used in carcass work. Likewise, for the Richmond Oval, concrete accounts for 99.8% (by mass) of material used in foundation work and 65.5% of material used in carcass work.
Table 38: Construction material types consumed in construction of Doug Mitchell Thunderbird Sports Centre and Richmond Oval
Doug Mitchell Thunderbird Sports Centre Richmond Oval Earthworks Foundation Carcass Foundation Carcass
Material Category Total (kg) Demolition Wastes (kg)
Stocked (kg)
Stocked (kg) Stocked (kg) Stocked (kg)
Wood 2,386,330 159,420 0 756,934 0 1,469,977 Wall Coverings 624,189 230,683 0 169,135 0 224,372 Metal 15,377,949 1,599,722 30,045 799,116 65,726 12,883,340 Roof Materials 227,771,028 227,103,950 0 665,200 0 1,878 Masonry/Bricks 4,809,591 923,154 213 1,472,311 0 2,413,913 Concrete 86,999,088 3,345,774 6,289,139 7,119,548 36,229,124 34,015,503 Insulation 271,837 7,561 0 2,733 0 261,542 Glass 73,584 48,782 0 3,489 0 21,313 Plastics 15,175 12,862 555 1,666 0 93 Miscellaneous 619,098 9,450 0 1,083 0 608,564

OGI-UBC Post-Games Report Appendix B (En08 – Life Cycle Inventory)
143
Summary and Interpretation of Life Cycle Inventory Indicators Both inputs and outputs were larger for the Richmond Oval (which was a new building) than for the Doug Mitchell Thunderbird Sports Centre (which was partly demolished with new construction added). Except for raw materials used for the Oval, carcass work constituted the largest share of all life-cycle phases for both inputs and outputs for both venues. By weight, concrete constituted a significant share of materials used in construction of both venues.

OGI-UBC Post-Games Report Appendix B (En09 – Sustainable Sourcing)
144
En09 – Sustainable Sourcing
Focus Area Purpose (as stated in 2011 OGI)
**Procured products and services with sustainability credentials
This indicator measures the sustainability performance of the Games through its sourcing management approach.
**This is a new OGI indicator introduced in 2011.
Procured Products and Services with Sustainability Credentials
This new OGI indicator calls for data on the proportion of the supply chain that has been independently audited for environmental and/or sustainability standards. This includes products (food, building materials, office supplies) and services procured with enhanced sustainability credential or certification (Forest Stewardship Council, Marine Stewardship Council, fair-trade, organic, eco-label, fair labour practices, etc.). The required data were not available. However, VANOC did mention sustainable and ethical sourcing in its first (2005-2006) and subsequent Sustainability Reports. In the 2005-2006 Sustainability Report, VANOC reported that it had adopted on May 17, 2006 a Corporate Procurement Policy to evaluate the sustainability and ethical practices of all VANOC suppliers and licensees. VANOC had also begun to develop a Licensee Code of Conducted related to social and environmental compliance. In its 2006-2007 Sustainability Report, VANOC reported a first for an OCOG – implementation of its Buy Smart Program to ensure sustainability, ethical sourcing and Aboriginal participation considerations are applied to its procurement and licensing processes. VANOC also collaborated with the 2010 Commerce Centre to launch a web-based database for businesses to self-identify sustainability attributes and received Gold certification within the LEED Green Building Rating System for the VANOC Campus 2010 high-rise building (VANOC head office).

OGI-UBC Post-Games Report Appendix B (So01 – Political Social and Legal Apparatus)
145
So01 – Political Social and Legal Apparatus
Focus Area Purpose (as stated in 2011 OGI)
Votes connected with the Olympic Games and Paralympic Games
This indicator measures parliamentary and public votes (if the political system allows them) on any activities specific to or connected with the Olympic and Paralympic Games (including candidacy). Public votes reveal the public support for the Olympic and Paralympic Games project and the level of public engagement.
Deferment and abandonment of public policies
This indicator reveals any abandonment or delay of public policies and development projects due to competition with Olympic and Paralympic related projects. It also registers any reorientation of public policies caused by the hosting of the Games.
Pressure groups Pressure groups (a political or social movement taking part in the political arena directly or indirectly) are used to gauge the involvement of civil society in public affairs and the possible emergence of new public issues.
Votes Connected with the Olympic Games and Paralympic Games Parliamentary votes are measured in the form of Olympic-related bills that are introduced and/or passed. Data on votes by political party and the number of votes were not available. A search for the key word “Olympic” was conducted for parliamentary/council records of the Parliament of Canada, the Legislative Assembly of British Columbia, and the City Council of Vancouver. A search on August 24, 2012 returned no new results since January 26, 2011, which was when the last search was conducted for the OGI Games-time Report (in fact, no new Olympic-related bills or by-laws had been introduced since 2010, and there was only one in 2010). Therefore, the same table (see Table 39) and interpretations that were presented in the Games-time Report are also presented here. A lack of Olympic-related bills or by-laws after the 2010 Winter Games suggests that political support in the form of parliamentary votes stops after the event (political support may be expressed in other ways).
Most of the 13 bills and by-laws shown in Table 39 (1 Canada, 9 BC, 4 Vancouver) were passed, except for Bills M211 and M213 in BC, which had only gone through a first reading (in BC, a Bill or proposed legislation is enacted only after it passes a third reading). The issues voted on by public authorities pertained to Olympic and Paralympic trademarks, arts-related funding, funding to various regions in BC to invest in Olympic legacies, freedom of information, liquor licensing, and municipal-level regulations.
During the bid stage, the City of Vancouver conducted a plebiscite in February 2003 to gauge public support for the City’s participation in hosting the Games. The plebiscite was consultative rather than legally binding on the government of Vancouver. Of the eligible voters in the City of Vancouver, 46 percent voted. Of those who voted, the majority (64 percent) were in favour (36 percent opposed).

OGI-UBC Post-Games Report Appendix B (So01 – Political Social and Legal Apparatus)
146
In summary, the three levels of public authorities and those who voted in the Vancouver plebiscite appeared largely to show support for the 2010 Winter Games. What these findings are unable to show is who (political party) did not support the Games. On the other hand, the Vancouver plebiscite did show that 34 percent of those who voted opposed the city’s participation in hosting the Games.
Table 39: Votes connected with the Olympic and Paralympic Games
Official Title Year DescriptionCanada House Government Bills 1
Bill C-47: Olympic and Paralympic Marks Act
2007 An Act respecting the protection of marks related to the Olympic Games and the Paralympic Games and protection against certain misleading business associations and making a related amendment to the Trade-marks Act.
B.C. Bills 2
Bill 23: Miscellaneous Statutes Amendment Act (No. 2), 2001
2001 The Olympics-related change (one of many changes to various Acts) is the addition of the Olympic Arts Fund as a special account under the Special Accounts and Appropiation and Control Act. The Olympic Arts Fund was designed to ensure that B.C.’s arts and cultural organizations have a role to play and are showcased as part of the 2010 Olympic and Paralympic Winter Games.
Bill 59: Northern Development Initiative Trust Act
2004 To create an account that may support investments in "Olympic opportunities" (amongst other legacy areas) in northern B.C.
Bill 7: North Island Coast Development Initiative Trust Act
2005 To create an account that may support investments in "Olympic opportunities" (amongst other legacy areas) in the North Island Coast of B.C.
Bill 8: Southern Interior Development Initiative Trust Act
2005 To create an account that may support investments in "Olympic opportunities" (amongst other legacy areas) in the Southern Interior of B.C.
Bill 2: Budget Measures Implementation Act
2008 The Olympics-related change (one of many changes) is that the Special Accounts and Appropiation and Control Act was revised to state that the Olympic Arts Fund special account will be continued as the Arts Legacy Fund Sub-account. (see Bill 23 above).
M213: Freedom of Information and Protection of Privacy Amendment Act, 2008
2008 Private Members' Bill (first reading only, May 20, 2008) to add VANOC as a "public body" as defined in the Freedom of Information and Protection of Privacy Act to make public bodies more open and accountable by providing the public with a legislated right of access to government records; and to protect individuals' right to personal privacy by prohibiting the unauthorized collection, use or disclosure of individuals' personal information by public bodies.
Bill 17: Public Safety and Solicitor General (Gift Card Certainty) Statutes Amendment Act, 2008
2008 The Olympics-related changes (one of many to various Acts) are additions to the Liquor Control and Licensing Act regarding Olympic/Paralympic liquor licensing.
M211: Open Goverment Act, 2010 2010 Private Members' Bill (1st reading only, June 2, 2010) to add VANOC as a "public body" as defined in the Freedom of Information and Protection of Privacy Act. (see M213 above)
Votes Connected with the Olympic Games and Paralympic Games
1 Search for the key word "Olympic" in bills from January 17, 1994 to August 24, 2012 of the Parliament of Canada (http://www.parl.gc.ca/common/index.asp?language=E, accessed August 24, 2012).2 Search for the key word "Olympic" in bills from 1992 to 2012 of the Legislative Assembly of B.C. (http://www.leg.bc.ca/, accessed August 24, 2012).

OGI-UBC Post-Games Report Appendix B (So01 – Political Social and Legal Apparatus)
147
Deferment and Abandonment of Public Policies
Official parliamentary minutes and archives of the Government of British Columbia from 1998 to the end of the 2010 Olympic and Paralympic Games (March 21, 2010) were accessed (to update the last search conducted to the end of 2009 for the Games-time Report). Archives of by-laws of the governments of the City of Vancouver and the Resort Municipality of Whistler from 1998 to March 21, 2010 were also accessed. Moves in new directions were detected by a search of the relevant governments’ websites for policies and projects between 1998 and August 30, 2012 that were explicitly stated as being newly created to take advantage of the 2010 Winter Games. This latter search was extended beyond 2010 because governments may still take advantage of the Games after the event itself is over, for example to promote tourism. Based on the official minutes and archives from 1998 to March 21, 2010, no public policies were recorded as having been abandoned or deferred in favour of the 2010 Winter Games for any of the governments (BC, Vancouver, or Whistler). However, a significant number of public policies and projects (51) were explicitly stated as being newly created between 1998 and August 30, 2012 to take advantage of the 2010 Winter Games (see Table 40). Both the governments of Vancouver and BC continued to create new policies/projects shortly before the Games in 2009 as well as post-Games, for example to promote local volunteerism and continued business and tourism.
Official Title Year DescriptionVancouver By-laws 3
By-law no. 8619: Olympic Winter Games & Paralympic Plebiscite By-law
2002 To undertake a plebiscite regarding the 2010 Olympic Winter Games and Paralympics Winter Games, to amend the Election Procedures By-law, and to repeal the Voting Divisions By-law.
By-law no. 9697: 2010 Winter Games Sign Designation and Relaxation By-law
2008 Regarding designation of a special event and relaxations of the Sign By-law for the Vancouver 2010 Olympic and Paralympic Winter Games
By-law no. 9747: 2010 Winter Games Building By-law Relaxation By-law
2008 To relax Building By-law No. 9419 regarding the regulation of special event facilities for the Vancouver 2010 Olympic and Paralympic Winter Games
By-laws no. 9836, 9843, 9908 and 9962: Vancouver 2010 Olympic and Paralympic Winter Games By-law
2009 Relates to buildings, city-land regulation, graffiti, licenses, noise control, signs, street distribution of publications, street and traffic, ticket offences, vehicles for hire, zoning and development, and offences and penalties and enforcement.
Vancouver public vote 4
Plebiscite: Olympic Vote 2003 "Do you support or do you oppose the City of Vancouver's participation in hosting the 2010 Olympic Winter Games and Paralympic Winter Games?YES, I support the City of Vancouver's participation.NO, I oppose the City of Vancouver's participation."
3 Search for key word "Olympic" in the by-laws of the City of Vancouver (http://vancouver.ca/bylaw_wa/, accessed August 24, 2012). Excludes housekeeping amendment by-laws.4 From the City of Vancouver website on the Olympic Vote Process (http://vancouver.ca/ctyclerk/olympicvote/olympicindex.htm, accessed January 26, 2011 but no longer available as of August 24, 2012).
Votes Connected with the Olympic Games and Paralympic Games (continued)

OGI-UBC Post-Games Report Appendix B (So01 – Political Social and Legal Apparatus)
148
Table 40: Policies and projects created to take advantage of the 2010 Winter Games
Public Policy Government Year2010 Legacies Now British Columbia,
Vancouver, and Whistler12000
Shared Legacies Agreement British Columbia1 2002Multi-party Agreement for the 2010 Winter Olympic and Paralympic Games British Columbia,
Vancouver, and Whistler12002
Aboriginal Youth Sport Legacy Fund British Columbia1 20022010 Vision for British Columbians with Disabilities British Columbia and
Vancouver2003
Olympic Youth Legacy for Physical Activity, Sport, Culture, and the Arts (renamed in 2004 as Get Out!)
Vancouver 2003
Ensuring Vancouver's Olympic and Paralympic Legacy Vancouver 2003Spirit of BC British Columbia1 2004Whistler Museum Masterplan Whistler 20042010 Commerce Centre British Columbia 2004Whistler2020 Whistler 2004ActNow BC British Columbia1 2005Podium Canada (includes Own the Podium) British Columbia1 2005SportsFunder British Columbia1 2006Active Communities Vancouver Vancouver1 2006Project Civil City Vancouver 2006Olympic Legacy Affordable Housing (Memorandum of Understanding) British Columbia1 20062010 Garden Plots by 2010 Vancouver1 2006Celebration Plaza Whistler1 20062010 Speakers' Bureau British Columbia1 20062010 Olympic and Paralympic Winter Games Strategic Plan Vancouver 2006BC Explorer British Columbia1 2006BC-Canada Place Pavilion British Columbia 2006Arts Partners in Creative Development British Columbia and
Vancouver12007
Host a City Happening Community Grant Program Vancouver 2007South East False Creek Olympic Village Community Benefits Agreement Vancouver1 2007
2010 Business Summits British Columbia1 20072010 Winter Games Economic Opportunities Delivery Plan Vancouver 2007Legacy Reserve Fund Vancouver 2007Community Land Bank Agreement British Columbia and
Whistler12007
2010 Winter Games Sign Designation & Relaxation Bylaw 9687 Vancouver 2008The Olympic Line - Vancouver 2010's Streetcar (Downtown Streetcar 2010 Demonstration Project)
Vancouver1 2008
Athletes' Village Loan Authorization Bylaw No. 1831 Whistler 2008Investing in the Dream: 2010 Winter Games Budget Whistler 2008Taxation Exemption for Not-For-Profit Oganizations Bylaw Whister 20082010 International Media Centre British Columbia 2008BC Regional Innovation Chair in Tourism and Sustainable Rural Development
British Columbia1 2008
British Columbia Showcase at Robson Square British Columbia 2008Share the Excitement! British Columbia 2008Olympic and Paralympic Public Art Program Vancouver 20082010 Winter Games Building By-law Relaxation By-law 9747 Vancouver1 20082010 Winter Games Strategic Framework Whistler 2008Olympic and Paralympic Liquor License Whistler 2008BC Stories British Columbia1 2008Zoning Amendment Bylaw (Temporary Use Permits) No. 1877, 2008 Whistler 2009Greenest City Vancouver 2009BC GeoTrek 2009 British Columbia1 2009Metro Vancouver Commerce 2010 Business Program Vancouver1 20092010 Sports and Arts Legacy British Columbia 2010Gaining The Edge: A Five-Year Strategy for Tourism in British Columbia British Columbia 2011Vancouver Volunteer Corps Vancouver 2012
Policies and Projects Explicitly Created to Take Advantage of the 2010 Winter Games
1 With external partner(s) - governmental or non-governmental.

OGI-UBC Post-Games Report Appendix B (So01 – Political Social and Legal Apparatus)
149
Pressure Groups Data were available for the city, region, and country for pressure groups that oppose or monitor the Olympic Games, or try to raise public attention to an issue by using media coverage of the Games. No data were available on the size of membership in these groups.
Of the six pressure groups presented (see Table 41), three opposed the 2010 Winter Games (The Anti-Poverty Committee, No 2010, and the Olympic Resistance Network). Two other groups (2010 Watch and IOCC) were dedicated to critically monitoring whether promises made in relation to the Games were being fulfilled, or whether civil rights and liberties were being limited or encroached upon by Games-related activities. The sixth pressure group, PETA, is international and leveraged the Games to promote one of their issues, specifically the banning of baby seal hunts. Seal hunts were linked to the Games when Canadian politicians pushed for a motion to use seal products in official Olympic Games uniforms to protest an European Union ban on seal products that could impact Canadian hunters and exporters of seal products (VANOC decided that the uniforms would not contain sealskin or fur). Of the six groups, only the IOCC and PETA still had a working website as on August 30, 2012 (PETA was not created in response to the Games), and when last checked on March 21, 2013, only PETA still had a working website.
Table 41: Pressure groups
Location Group Description
Vancouver Region
The Anti-Poverty Committee (APC)
A group of citizens who actively protested against the 2010 Winter Games, for example via the "Homes Not Games" campaign that funding for affordable housing should not be reallocated to support the Games.
2010 Watch The group defines itself as the only truly independent watchdog of the 2010 Winter Games. It posted articles and discussions online that criticized the Games.
No 2010: No 2010 Olympics on Stolen Native Land
A militant group of activists in the Vancouver area that protests the Olympics in a somewhat radical fashion, seemingly organized and backed by First Nations, although no direct responsibility has been taken by the latter.
Impact on Community Coalition (IOCC)
An independent organization dedicated to ensuring that environmental, social, transportation, housing, economic and civil rights issues associated with the Vancouver/Whistler 2010 Olympic Games are addressed from a community perspective.

OGI-UBC Post-Games Report Appendix B (So01 – Political Social and Legal Apparatus)
150
Location Group Description
Olympic Resistance Network
A local group of activists who opposed the Olympics and pushed for social and environmental justice using tactics such as shutting down traffic and creating a tent city to highlight homelessness.
Canada People for the Ethical Treatment of Animals (PETA)
An international animal rights organization focusing on localized animal welfare issues. Their "Stop the Slaughter" campaign for Vancouver 2010 involves utilizing media coverage to leverage the Games for the banning of baby seal hunts.
Summary and Interpretation of Political, Social and Legal Apparatus Indicators The three levels of government (Canada, BC, and Vancouver), based on votes in session and policies and projects created, largely supported the 2010 Winter Games. In Vancouver, citizens who voted in a 2003 plebiscite also largely supported the Games, but a sizable share of citizens (34 percent) opposed. Opposition to the Games was also reflected by several active pressure groups, most of which appear to have become defunct since the Games.
After the Games, both the governments of BC and Vancouver continued to create new policies/projects to leverage the Games, for purposes such as promoting volunteering and continued business and tourism.

OGI-UBC Post-Games Report Appendix B (So02 – Accessibility of Public Buildings and Venues)
151
So02 – Accessibility of Public Buildings and Venues
Focus Area Purpose (as stated in 2011 OGI)
Compliance of public building with accessibility criteria
The indicator assesses the adaptation of critical public buildings in the host city in order to provide people with disabilities with an unobstructed, equitable and dignified access to the required services.
Compliance of Olympic venues with accessibility criteria
This indicator evaluates the extent to which Olympic and Paralympic Games’ venue construction (including both competition and non-competition sites) was made accessible for the Games, and the extent to which they remained as such in their post-Games usage.
Compliance of Public Building with Accessibility Criteria
There are several categories of people with disabilities: wheelchair user; mobility impaired; visually impaired; hearing impaired; and mentally impaired.
Data were not available on the rate of compliance of host city buildings (administration offices, post offices, police offices, social services, hospitals, and airports) in meeting basic accessibility criteria. Accessibility building standards are outlined in the publications National Building Code of Canada (latest version is 2010) and the British Columbia Building Code (latest version is 2006). The publications are available for a fee (not free). The government of Vancouver continues to make its administrative and other civic buildings accessible. For example, all 24 community centres in Vancouver have wheelchair accessible bathrooms. As another example, all three civic (indoor) theatres provide hearing aid receivers and binoculars at the main lobby coat check.
Compliance of Olympic Venues with Accessibility Criteria This section is from the Games-time Report (2011). The required data were available, except for the category “mentally impaired,” of which there was in general no mention of additional services, and the final situation (Games legacy) for some categories.
At Games-time, all venues were accessible (no data were available for the category “mentally impaired). All venues allowed guide dogs on the premises and supplied assistive hearing devices and wheelchairs, although quantities of loan items were limited. It should also be noted that accessibility provisions (e.g. parking, entrances, washrooms, concessions, seating) vary between venues.
For the final situation (Games legacy), data were not available for easier (wheelchair) access, wheelchair loan, and/or loan of hearing devices, and/or guide dogs in many of venues at the time of the Games-time Report.

OGI-UBC Post-Games Report Appendix B (So02 – Accessibility of Public Buildings and Venues)
152
Figure 44: Compliance of Olympic Venues with Accessibility Criteria
Summary and Interpretation of Accessibility of Public Buildings and Venues Indicators
Although data on the rate of compliance of public buildings for accessibility were unavailable, the general direction has been to make such buildings more accessible over time. With respect to Olympic venues (in cases where data were available), the venues complied with accessibility criteria for the various categories of disability at Games-time and remained compliant with accessibility criteria at the final situation, except for one venue (Cypress Mountain).
Games-time Final1
Games-time Final1
Games-time Final1
Games-time Final1
Olypic GamesBC Place Stadium yes yes yes yes yes DNAA2 yes DNAACanada Hockey Place yes yes yes DNAA yes DNAA yes noVancouver Olympic Centre yes yes yes yes yes yes yes DNAAPacific Coliseum yes yes yes no yes yes yes DNAAUBC Thunderbird Arena yes yes yes DNAA yes yes yes DNAAWhistler Sliding Centre yes DNAA yes DNAA yes DNAA yes DNAAWhistler Creekside yes yes yes yes yes some3 yes DNAAWhistler Olympic Park yes DNAA yes DNAA yes DNAA yes DNAAWhistler Medals Plaza yes DNAA yes DNAA yes DNAA yes DNAARichmond Olympic Oval yes yes yes some3 yes DNAA yes DNAACypress Mountain yes some3 yes no yes yes yes no
Paralympic GamesVancouver Paralympic Centre yes yes yes yes yes yes yes DNAAUBC Thunderbird Arena yes yes yes DNAA yes yes yes DNAAWhistler Creekside yes yes yes yes yes some3 yes DNAAWhistler Paralympic Park yes DNAA yes DNAA yes DNAA yes DNAABC Place yes yes yes yes yes DNAA yes DNAAWhistler Medals Plaza yes DNAA yes DNAA yes DNAA yes DNAA1 'Final' refers to the legacy after the Games, i.e., whether the accessibility is permanent.2 DNAA stands for data not available or accessible.3 'Some' means that some credit is given for minimal accessible provisions such as seating or one sign-language interpreter volunteer.
Wheelchair users Mobility impaired Visually impaired Hearing impaired

OGI-UBC Post-Games Report Appendix B (So03 – Public Opinion and Consultation)
153
So03 – Public Opinion and Consultation
Focus Area Purpose (as stated in 2011 OGI)
*Opinion polls This indicator measures the satisfaction, dissatisfaction and image of the Olympic and Paralympic Games, as well as their subjective influence.
Consultation with stakeholders
The term stakeholders covers any group with particular expectations, characteristics and/or interest in particular topics (pressure groups, environment, social or economic) related to the Olympic and Paralympic Games. This indicator gathers information on initiatives to consult with stakeholders.
*Attribution analysis was conducted (before-after).
Opinion Polls No new data are available since the OGI Games-time Report; the findings and Figure 45 to Figure 65 in this section are from the Games-time Report. Synovate, a global market research company, was contracted by OGI-UBC to conduct two opinion polls – one before the 2010 Winter Games and one after the Games. The data (summaries and figures shown below) were provided by Synovate. The pre-Games poll was conducted in December 2009. A follow-up poll, with a special focus on Paralympics, was conducted April 27 to May 6, 2010. Canadian residents aged 19+ from Synovate’s ViewsNet’s Global Opinion Panel were emailed invitations to the online poll. Of the 5,959 panel members invited to the pre-Games poll, a total of 1,602 participated (response rate of 27 percent). Of the 9,684 panel members invited to the post-Games poll, a total of 2,474 participated (response rate of 26 percent). The samples were stratified by region to allow for additional analysis of BC. Results were weighted by age, gender and region to match the actual composition of the Canadian adult population. A difference of 4 percentage points between the pre-Games and post-Games results is generally required to be considered statistically significant at 95% level of confidence; a larger shift is required when comparing results by region (6 for BC, 10 for Alberta, Saskatchewan/Manitoba and the Atlantic Provinces, 7 for Ontario, 8 for Quebec and 42 for the Territories). Data from the pre-Games poll show that support for hosting the 2010 Winter Games in Vancouver/Whistler had increased among Canadian residents, with 70 percent reporting that they were somewhat or very supportive in December 2009 (vs. 53 percent in 2003 based on recall) (see Figure 45). In BC, while support for the Games had remained stable, opposition had grown, rising from 23 percent who recalled opposing the Games in 2003 to 30 percent in 2009. BC residents outside of Metro Vancouver expressed the strongest opposition (36 percent). Among Canadian residents who recalled changing their stance from their initial position, the tendency has been to become more, rather than less, supportive. In BC, equal proportions moved in both directions. The top reason that Canadians gave for increasing their support was because of home pride in having the Games in Canada/BC/Vancouver (see Figure 46), while BC residents most commonly said they may as well make the best of it, since the decision to host the 2010 Winter

OGI-UBC Post-Games Report Appendix B (So03 – Public Opinion and Consultation)
154
Games had already been made (see Figure 47). The perception that the Games cost too much and that the money should be spent elsewhere mentioned most by those who became less supportive, particularly among BC residents outside of Metro Vancouver. Three-quarters of Canadian residents in December 2009 believed that hosting the Games would benefit Canada as a whole, which far outweighed those who believed the impact would be negative (5 percent) (see Figure 48). When asked about the impact that hosting the Games would have on BC as a whole, BC residents believed that the impact on the province would be positive rather than negative by a ratio of 2:1. However, BC residents from outside of Metro Vancouver held a more negative outlook in this regard. Anywhere from 41 percent to 50 percent of Canadians credited the Games with public initiatives that help people with disabilities, specifically, increasing the accessibility of buildings, sidewalks and public spaces, specialized programs and training for athletes with disabilities, and government support (see Figure 49). Most of the remaining residents felt that the Games had yet to make an impact on these three aspects. Fewer Canadians believed that the Games had a positive impact on them personally (see Figure 50). Specifically, anywhere from 32 percent to 40 percent felt that the Games had increased their awareness/appreciation of amateur winter sports, their knowledge of sports for people with disabilities, and their overall acceptance of people with disabilities. Among employers, a marginally lower proportion said that their willingness to hire people with disabilities had increased (23 percent among Canadian employers). BC residents were the least likely to acknowledge that the 2010 Winter Games had any positive impacts on public initiatives for people with disabilities or in personal attitudes and awareness. This was likely due to stronger opposition in BC against hosting the Games in Vancouver/Whistler, which may make dissenting residents reluctant to recognize changes benefitting people with disabilities brought on by the 2010 Winter Games.
In 2010 (post-Games), perceptions of the impact of the Paralympic Games on Canada as a whole had improved dramatically since December 2009 (see Figure 52). Except in Quebec, Canadians were much more likely in 2010 than they were in 2009 to believe that the Games had a “very positive” impact (55 percent vs. 38 percent). BC residents were twice as likely in December 2009 to believe the Games have had a “very positive” effect on the province (45 percent) than they were in April-May 2010 (post-Games) (23 percent); much of this shift in attitude can probably be attributed to Metro Vancouver, where the Games were held (see Figure 53). About one half of Canadians (49 percent) expressed an interest in the Paralympic Games at the time they were held (see Figure 54), while just slightly fewer (43 percent) said they watched or attended a Paralympic event (see Figure 55). Understandably, participation was higher in Metro Vancouver than elsewhere in Canada. Less than one half of Canadians believed that the Paralympic Games had a positive impact on employment opportunities for people with disabilities (see Figure 56). Four out of ten Canadians who are employers claimed that their willingness to hire people with disabilities had increased as a result of the Paralympic Games, compared to less than one quarter who said that they were willing to do so prior to the Paralympic Games.
A majority of Canadians in all regions believed that the Paralympic Games had led to more positive portrayals of people with disabilities in the media (66 percent) and had increased the social status of people with disabilities (57 percent) (see Figure 57). While a majority of Canadians believed that their public perception of people with disabilities had improved as a

OGI-UBC Post-Games Report Appendix B (So03 – Public Opinion and Consultation)
155
result of the Paralympic Games, they were less likely to feel that the Games had contributed to the social support and integration of people with disabilities (see Figure 58). The 2010 Paralympic Games were more likely to be seen as having encouraged people with disabilities to participate in sports than to have increased their access to sports and recreational activities (see Figure 59). The 2010 Paralympic Games faced by them. Canadians with a disability and able-bodied Canadians who regularly interact with someone living with a disability tended to have more favourable views than their counterparts regarding the positive public and personal impacts for people with disabilities that resulted from hosting the 2010 Paralympic Games (see Figure 60 to Figure 63). In summary, although there was some dissatisfaction with the 2010 Winter Games, Canadians were generally positive and supportive of the Games and believed that the Games would lead to benefits for Canada overall and for its provinces (with some notable differences in Quebec and BC outside of Metro Vancouver). Canadians also generally believed that the 2010 Paralympic Games had increased awareness of acceptance of people with disabilities. The 2010 Paralympic Games were more likely to be seen as having encouraged people with disabilities to participate in sports than to have increased their access to sports and recreational activities.
Figure 45: Opinion Polls (A) - Pre-Games (December 2009)

OGI-UBC Post-Games Report Appendix B (So03 – Public Opinion and Consultation)
156
Figure 46: Opinion Polls (B) - Pre-Games (December 2009)
Figure 47: Opinion Polls (C) - Pre-Games (December 2009)

OGI-UBC Post-Games Report Appendix B (So03 – Public Opinion and Consultation)
157
Figure 48: Opinion Polls (D) - Pre-Games (December 2009)

OGI-UBC Post-Games Report Appendix B (So03 – Public Opinion and Consultation)
158
Figure 49: Opinion Polls (E) - Pre-Games (December 2009)
Figure 50: Opinion Polls (F) - Pre-Games (December 2009)

OGI-UBC Post-Games Report Appendix B (So03 – Public Opinion and Consultation)
159
Figure 51: Opinion Polls (G) - Pre-Games (December 2009)
Figure 52: Opinion Polls (H) - Post-Games (April 27 to May 6, 2010)

OGI-UBC Post-Games Report Appendix B (So03 – Public Opinion and Consultation)
160
Figure 53: Opinion Polls (I) - Post-Games (April 27 to May 6, 2010)
Figure 54: Opinion Polls (J) - Post-Games (April 27 to May 6, 2010)

OGI-UBC Post-Games Report Appendix B (So03 – Public Opinion and Consultation)
161
Figure 55: Opinion Polls (K) - Post-Games (April 27 to May 6, 2010)
Figure 56: Opinion Polls (L) - Post-Games (April 27 to May 6, 2010)

OGI-UBC Post-Games Report Appendix B (So03 – Public Opinion and Consultation)
162
Figure 57: Opinion Polls (M) - Post-Games (April 27 to May 6, 2010)
Figure 58: Opinion Polls (N) - Post-Games (April 27 to May 6, 2010)

OGI-UBC Post-Games Report Appendix B (So03 – Public Opinion and Consultation)
163
Figure 59: Opinion Polls (O) - Post-Games (April 27 to May 6, 2010)
Figure 60: Opinion Polls (P) - Post-Games (April 27 to May 6, 2010)

OGI-UBC Post-Games Report Appendix B (So03 – Public Opinion and Consultation)
164
Figure 61: Opinion Polls (Q) - Post-Games (April 27 to May 6, 2010)
Figure 62: Opinion Polls (R) - Post-Games (April 27 to May 6, 2010)

OGI-UBC Post-Games Report Appendix B (So03 – Public Opinion and Consultation)
165
Figure 63: Opinion Polls (S) - Post-Games (April 27 to May 6, 2010)

OGI-UBC Post-Games Report Appendix B (So03 – Public Opinion and Consultation)
166
Figure 64: Opinion Polls (T) - Post-Games (April 27 to May 6, 2010)

OGI-UBC Post-Games Report Appendix B (So03 – Public Opinion and Consultation)
167
Figure 65: Opinion Polls (U) - Post-Games (April 27 to May 6, 2010)
Consultation with Stakeholders
No new data are available since the OGI Games-time Report; the findings and Table 42 in this section are from the Games-time Report. Data from VANOC were available only for the organizing committee for the years 2008, 2009, and 2010. VANOC was the originator of all the consultations described below. These seven groups should be distinguished from those listed in So3 (see page 70), which outlined groups that were protesting or monitoring the Games (but not necessarily consulted).
At the city level, VANOC consulted with one group named the Inner-city Working Group (ICWG). The ICWG is comprised of AccessWORKS, Building Opportunities with Business, Fast-Track to Employment Coalition, The Tradeworks Training Society and ACCESS. VANOC consulted with the ICWG 25 times between 2008 and 2010 (with only one meeting in 2010).
At the provincial level, VANOC consulted with six groups: the Environmental Non-Government Organization (ENGO) Dialogue Group; Sustainability Practitioners; VANOC Workforce; the Four Host First Nations (FHFN); National Aboriginal Groups; and Aboriginal Employment and Training Organizations (AETO). There were 107 consultation meetings with these groups in 2008 (46 percent of them with AETO, and about a quarter each with FHFN and the National Aboriginal Groups). In 2009, there were 69 consultations, again the largest number with AETO

OGI-UBC Post-Games Report Appendix B (So03 – Public Opinion and Consultation)
168
(about 40 percent). In 2010, there were 104 consultation meetings, of which the largest number was with the National Aboriginal Groups (nearly half of all meetings) and about 40 percent with AETO. The ENGO Dialogue Group is comprised of 19 groups: Westcoast Environmental Law; CityGreen; David Suzuki Foundation; The Land Conservancy; Ecotrust Canada; AWARE; City Farmer; Sierra Club of Canada – BC Chapter; Western Canada Wilderness Committee; BCSEA; SmartGrowth; Better Environmentally Sound Transportation; Georgia Strait Alliance; ForestEthics; Recycling Council of BC; Pembina Institute; WWF Canada; The Nature Conservancy of Canada – BC Chapter; and ForEd BC. The National Aboriginal Organizations group is made up of the Assembly of First Nations, Inuit Tapiriit Kanatami, and the Metis National Council/Metis Nation of BC The Four Host First Nations are the Lil’wat Nation, the Musqueam Nation, the Squamish Nation, and the Tsleil-waututh Nation. In addition to VANOC, it should be noted that the Province of British Columbia (a public authority) and the 2010 Vancouver Bid Corporation (the candidacy committee) also consulted with Squamish First Nations and Lil'wat Nation. The consultations led to the November 2002 signing of the Shared Legacies Agreement, which outlines a package of legacies and benefits for the Nations related to the 2010 Winter Games, including land for economic development opportunities, skills training, funding for constructing the Squamish Lil'wat Cultural Centre, and legacy housing (from the Olympic Village) (see http://www.slcc.ca/). This 2002 Agreement extends the partnership that was formalized in March 2001 with the Protocol Agreement between the two Nations to cooperate with each other with respect to economic opportunities, establish a clear First Nation presence in their traditional territory, and protect their respective Aboriginal rights and title. In 2008, the AETO included the Province of BC – Ministry of Small Business, Technology and Economic Development, the Aboriginal Human Resource Development Council, ACCESS, the First Nations Employment Society, the Metis Nation of BC, the 2010 Commerce Centre, the Osoyoos Indian Band Development Corporation, and the Indian and Northern Affairs Canada. In 2009 and 2010, these organizations were joined also by 2010 Winter Games corporate sponsors and suppliers Coca-Cola, BC Hydro, Molson, Deloitte, GE, RBC and Nike. Data showed that the organizing committee originated consultations with specific groups on a variety of subjects between 2008 and 2010. What remains largely unclear is how these consultations initiated by VANOC may have (if at all) transformed the social customs of these groups (which was what this indicator was intended to show). Although data on the consultation practices of the public authorities and the candidacy committee were generally not available, a 2002 formal agreement between two First Nations, the Province, and the 2010 Bid Corporation extends the partnership that was formalized between the two First Nations in 2001.

OGI-UBC Post-Games Report Appendix B (So03 – Public Opinion and Consultation)
169
Table 42: Consultation with Stakeholders
Summary and Interpretation of Public Opinion and Consultation Indicators
Although there was some dissatisfaction with the 2010 Winter Games, Canadians were generally positive and supportive of the Games and believed that the Games would lead to benefits for Canada overall and for its provinces (with some notable differences in Quebec and BC outside of Metro Vancouver). Canadians also generally believed that the 2010 Paralympic Games had increased awareness of acceptance of people with disabilities. The 2010 Paralympic Games were more likely to be seen as having encouraged people with disabilities to participate in sports than to have increased their access to sports and recreational activities. The organizing committee (VANOC) originated consultations with specific groups on a variety of subjects between 2008 and 2010. Although data on the consultation practices of the public authorities and the candidacy committee were generally not available, a 2002 formal agreement between two First Nations, the Province, and the 2010 Bid Corporation extends the partnership that was formalized between the two First Nations in 2001.
Group Number and Name Number of consult-ns Subjects Covered Number of
consult-ns Subjects Covered Number of consult-ns Subjects Covered
Vancouver
1 Inner City Working
Group 13 1
Recruitment and economic opportunities for priority populations; Feedback on Sustainability reporting
11 2 Recruitment and economic opportunities for priority populations; Feedback on Sustainability reporting
1 Feedback on Sustainability Reporting from one Inner-City Representative
Metro Vancouver
1 ENGO Dialogue Group (22 ENGO's) 4
Climate Change, Waste, Biodiversity Feedback on Sustainability Reporting
4 Climate Change, Waste, Biodiversity Feedback on Sustainability Reporting
1 Feedback on Sustainability Reporting from one ENGO Representative
2 Sustainability Practiitioners 1 Feedback on
Sustainability Reporting 1 Feedback on Sustainability Reporting 1
Feedback on Sustainability Reporting from two SUS Practitioners
3 VANOC Workforce 1 Feedback on Sustainability Reporting 1 Feedback on
Sustainability Reporting 1 Feedback on Sustainability Reporting from one Workforce Member
4 Four Host First Nations 27
Feedback on Sustainability Reporting (1) Regular meetings with FHFN Society (biweekly) (26)
27
Feedback on Sustainability Reporting (1) Regular meetings with FHFN Society (biweekly) (26)
11
Feedback on Sustainability Reporting from one FHFN Representative (1) Regular meetings with FHFN Society (biweekly) ended Dec 2009 (10)
5 National Aboriginal Groups 25 Aboriginal Participation in
the Games 14 Aboriginal Participation in the Games 50 Aboriginal Participation in
the Games
6 Aboriginal
employment and training
organizations 49 Aboriginal Participation in
the Games 22 Aboriginal Participation in the Games 40 Aboriginal Participation in
the Games Total 107 69 104
1 12 monthly meetings and 1 report meeting. 2 10 monthly meetings and 1 report meeting.
Consultation with Specific Groups by Subject and Frequency, 2008-2010 2008 2009 2010

OGI-UBC Post-Games Report Appendix B (So04 – Promotion and Participation of Minority Groups)
170
So04 – Promotion and Participation of Minority Groups
Focus Area Purpose (as stated in 2011 OGI)
Participation of minorities in the Games
This indicator describes the participation of minority groups in the organizational structure of the OCOG: position in the OCOG itself, Olympic and Paralympic activities, related jobs and volunteers.
Promotion of minorities and indigenous population
This indicator describes the actions undertaken by the OCOG, or Olympic delivery partners (related organizations), to promote minorities, indigenous populations, people with disabilities, women, youth, seniors and equity seeking groups in the lead-up to and during the Olympic and Paralympic Games.
*Perception about people with disabilities in society
There is evidence that attending and/or watching disabled sports competition and the Paralympic Games has a major positive impact in regards to the image and the position of people with disabilities in society. This indicator will capture this impact.
*Attribution analysis was conducted (before-after).
Participation of Minorities in the Games
No new data are anticipated after the Vancouver OGI Games-time Report. Therefore, the data presented are from the Games-time Report.
Data were available only for the participation of minorities as paid employees of VANOC based on self-identification in a voluntary survey; only percentages were provided in the VANOC Sustainability Reports and percentages were not broken down by Olympic activities and Paralympic activities. No data were available on the participation of minorities on the Board of Directors of VANOC, nor as volunteers for the 2010 Winter Games. The percentage of women occupying jobs inside VANOC has been more or less stable during the four years under study (2006-2010), on par with that of men, with the exception in 2008-2009 when only 43 percent of such jobs were occupied by women (see Table 43). The percentage of Aboriginal participation in VANOC jobs decreased rapidly in 2008-2009, from 11-13 percent in the first two years, to 1-3 percent in the last two periods. The percentage of jobs occupied by members of a visible minority increased by the end of the reporting periods to about 10 percent. The proportion of VANOC jobs occupied by people with disabilities was less than one percent for the better part of the four-year period under study, with the exception of 2007-2008 when more than 9 percent of such jobs were occupied by persons with disabilities. The increase in the percentage of jobs occupied by persons with disabilities in 2007-2008 coincided with a comparable decrease in the percentage of jobs occupied by members of a visible minority in 2007-2008; which was then boosted in the following year to its highest level (possibly at the expense of participation by Aboriginals and persons with disabilities).

OGI-UBC Post-Games Report Appendix B (So04 – Promotion and Participation of Minority Groups)
171
Table 43: Participation of Minorities in Olympic and Paralympic Games, 2006 to 2010 (Paid Employees Only)
Promotion of Minorities and Indigenous Population
No new data are anticipated after the Vancouver OGI Games-time Report. Therefore, the data presented are from the Games-time Report.
The data relate only to programs that aimed to educate the public (i.e., change mentalities and negative perceptions of minorities and indigenous populations) and promote to the public that minorities and indigenous populations are valued members of society. Many other plans and programs, although equally important, are not included for this indicator because they are not directed at the public; these other plans and programs are OCOG-operations-related plans (e.g., VANOC hiring practices, procurement, etc.), venue development plans (e.g., accessibility), and sport participation and other skills-based programs for minorities and indigenous populations. A total of 13 educational and promotional programs related to minorities and indigenous populations and aimed at the general public were implemented through VANOC (9 programs) and 2010 Legacies Now (4 programs) (see Table 44). 2010 Legacies Now was created in 2000 by the Provincial Government and the Vancouver 2010 Bid Corporation to support Vancouver’s bid for the 2010 Winter Games. Since then, the role of 2010 Legacies Now, which is a not-for-profit organization, has expanded to focus on developing community legacies from the 2010 Winter Games. Specifically, 2010 Legacies Now aims to use an inclusive approach to strengthen sport and recreation, healthy living, literacy, accessibility and volunteerism. The list of programs shows the range of educational and promotional programs in terms of their purpose, duration, reach, and cost, which were all quite varied (and thus not compared against each other or summed). While there were 13 programs related to raising awareness of and promoting minorities and indigenous populations, many more plans, strategies and practices (not listed here) were implemented to improve sport participation (and other skills) for minorities and indigenous populations. The creation of all the aforementioned plans, whether listed here or not, suggests that efforts were made by the OCOG (and a related organization) to raise awareness of, promote, and enhance the skills of minorities and indigenous populations. The effectiveness of these plans in changing public perceptions of minorities and indigenous populations remains largely unevaluated.
Jobs inside VANOC occupied by minorities
membersWomen Aboriginal Visible
Minority
Persons with a
disability
2006-2007 50.0% 13.0% 8.1% 0.4%2007-2008 53.0% 11.0% 3.0% 9.3%2008-2009 43.0% 3.0% 10.8% 0.6%2009-2010 50.0% 1.0% 9.0% 0.8%
Source: Annual VANOC Sustainability Reports

OGI-UBC Post-Games Report Appendix B (So04 – Promotion and Participation of Minority Groups)
172
Table 44: Promotion of Minorities and Indigenous Populations
Data sources: VANOC and 2010 Legacies Now
Perception about People with Disabilities in Society No new data were available since the Vancouver OGI Games-time Report. The perceptions about people with disabilities in society are covered in the indicator group So03 on Public Opinion and Consultation (see page 153). (Canadians generally believed that the 2010 Paralympic Games had increased awareness of acceptance of people with disabilities. The 2010
Program Name Description Duration Type Reach CostVANOC
Paralympic School Day
Activities to create awareness and understanding in schools about persons with a disability
May 2006 to Nov. 10, 2009
Educational 73 schools, 7,500 students
$60,000
Ticket to Inspiration Reduced price tickets ($5) for school groups to attend the Paralympic Games
Mar. 15 to 19, 2010
Promotional 30,000 students & teachers attended
$181,000
2010 Aboriginal Pavilion and Business Showcase
Showcase of First Nations, Inuit and Metis cultures Feb. 1 to 28, 2010 Promotional >300,000 visitors $2.5 million in programming
($3.5 for construction)
Find Your Passion in Sport
Poster series showcasing six young Aboriginal athletes, their sports and their languages, and online lesson starters over VANOC's web-based education portal (vancouver2010.com/edu).
Mar. 2007 and Mar. 2009
(posters), online lessons Mar. 2009 to 2010
Promotional DNAA $300,000
Canadian Olympic School Program
Includes Olympic stories (e.g., Aboriginals and people with disabilities) for grades 2 to 12 - promoted on VANOC's web-based education portal (program also includes other activities)
Ongoing (a Canadian Olympic
Committee program)
Promotional >65,000 members as of Mar. 2010, 25% of
the 6 million page views during the Games were via
VANOC's web-based education portal
$721,000(2007 to 2010)
Cultural Olympiads 2008, 2009 and 2010
Festivals showcasing art and culture of Aboriginal peoples, persons with a disability, inner-city organizations, francophone organizations, and other cultures present with the Canadian population
Feb. 2008, Feb. 2009, and Jan. 22 to Mar. 21, 2010
Promotional Visitors:2008: 163,1282009: 283,773
2010: 6,017,576
$84,970,829 (2008 to 2010)
Aboriginal Sport Gallery at B.C. Sports Hall of Fame
Physical collection and celebration of Aboriginal sport and athletes in BC, including a travelling exhibit that toured communities across B.C.
Jun. 2008 ongoing
Promotional DNAA $140,000
Vancouver 2010 Indigenous Youth Gathering
Hosting young adult Aboriginal role models and emerging leaders aged 19 to 29 years old from across Canada, including leadership development, Olympic Truce, sport, venues tours, interaction with athletes, and an opportunity to perform at the Olympic Opening Ceremonies
Jan. 30th to Feb. 14th, 2010
Promotional >300 Aboriginal Youth participants, >3 billion
viewers of the Opening Ceremonies
$4 million
Venues Aboriginal Art Program
Showcasing of First Nations, Inuit and Métis works of art during the 2010 Winter Games - these works have been permanently installed in Olympic and Paralympic venues and will remain as a legacy of the Games
Jun. 2008 to Mar. 2010, ongoing
Promotional >90 Aboriginal artists participated, visitors to Games venues
$3.5 million
2010LegaciesNowAccessible Tourism - Accessibility Rating
Tourism businesses can participate in an accessibility assessment and receive recommendations to improve accessibility
Ongoing Educational 3,600 business assessed
$343,000
Accessible Playgrounds Project
To build three accessible playgrounds in Vancouver, Whistler, and Richmond
2010 ongoing Promotional DNAA $1,200,000
Measuring Up Grants program to help communities assess and improve local accessibility and inclusion for persons with disabilities and others
2006 ongoing Educational 88 communities Up to $25,000 per grant
Virtual Voices Village Mentorship program for students with disabilities to develop writing and journalism skills, with the students' work posted to the Virtual Voices Village online community
Students' work from Games-time still available on
the online community as of
Feb. 9, 2011
Promotional DNAA $183,560

OGI-UBC Post-Games Report Appendix B (So04 – Promotion and Participation of Minority Groups)
173
Paralympic Games were more likely to be seen as having encouraged people with disabilities to participate in sports than to have increased their access to sports and recreational activities.)
Summary and Interpretation of Promotion and Participation of Minority Groups Indicators Efforts were made by VANOC to engage and promote minority groups. Members of minority groups were hired as VANOC employees during the four-year reporting period. In addition, a total of 13 educational and promotional programs related to minorities and indigenous populations and aimed at the general public were implemented through VANOC (9 programs) and 2010 Legacies Now (4 programs) to raise awareness of, promote, and enhance the skills of minorities and indigenous populations. The perceptions about people with disabilities in society are covered in the indicator group So03 on Public Opinion and Consultation. (Canadians generally believed that the 2010 Paralympic Games had increased awareness of acceptance of people with disabilities. The 2010 Paralympic Games were more likely to be seen as having encouraged people with disabilities to participate in sports than to have increased their access to sports and recreational activities.)

OGI-UBC Post-Games Report Appendix B (So05 – Human Development)
174
So05 – Human Development
Focus Area Purpose (as stated in 2011 OGI)
Poverty and social exclusion
This indicator provides a summary of poverty and social exclusion in the host city and region.
Educational level To assess the educational situation in the host city and region.
Crime rates To assess crimes rates within the host city and region.
Health This indicator provides a summary of health-related data for the city and the region.
Nutrition This indicator assesses the food and nutrients intake and the quality of the food supply.
None of the Human Development indicators are anticipated to be significantly impacted by the 2010 Winter Games.
Poverty and Social Exclusion The four OGI indicators for poverty and social exclusion are the same indicators that comprise the United Nations (UN) Human Poverty Index for industrial countries (HPI-2). In 1997, the UN introduced the HPI for developing countries (HPI-1) in its annual Human Development Report. Industrialized countries (HPI-2) were added in 1998. The four composite indicators of HPI-2 and the dimensions that they measure (shown in parentheses) are:
• Probability at birth of not surviving to age 60 (%) (reflects longevity); • The percentage of adults (aged 16 - 65) lacking functional literacy skills (reflects
knowledge); • The percentage of people living below the income poverty line, i.e., less than 50% of the
median personal disposable income (reflects a decent standard of living); and • The rate of long-term unemployment of 12 months or more as percentage of the labour force
(reflects social exclusion).
In 2010, the UN replaced the HPI with the Multidimensional Poverty Index (MPI), which is also reported in the annual UN Human Development Report. Although the MPI measures similar dimensions to the HPI, the MPI is comprised of 10 indicators; therefore, the MPI is significantly different enough from the HPI that they cannot be compared.
The HPI-2 value is a mathematical aggregate measure of human poverty represented by the four composite indicators. A higher value (%) indicates greater poverty. The data for the HPI-2 value and the four composite indicators for Canada are shown in Figure 66 (regional level data were not available). Note that the report year does not necessarily coincide with the data collection year; the UN used the most recent data without reporting the actual year. Therefore,

OGI-UBC Post-Games Report Appendix B (So05 – Human Development)
175
rather than looking at data from year to year, the data are roughly compared between the beginning (1998) and the end (2009) of the reporting years. The HPI-2 value for Canada began at 12 per cent and was lower (around 11 per cent) towards the end. Three of the composite indicators were higher at the beginning than at the end, which suggests a reduction in poverty represented by these measures: the probability at birth of not surviving to age 60 dropped from around 9 per cent to 7.3 per cent; the illiteracy rate dropped from 16.6 per cent to 14.4 per cent, and the rate of long-term unemployment dropped from 1.3 per cent to around 0.5 per cent. The fourth indicator – the percentage of people living below the income poverty line – showed greater fluctuation and some higher percentages later (above 12 per cent) compared to the beginning (11.7 per cent).
Overall, poverty in Canada as represented by the HPI-2 appeared to decrease slightly over the report years 1998-2009.
Figure 66: Poverty and Social Exclusion
Data source: The data are from the UN Human Development Reports from 1998 to 2009. Annual data for countries were not always available; therefore, the report year does not necessarily coincide with the data collection year (the UN selected the most recent data during a range of years, but did not report a specific year for each country).
Educational Level Data for three educational levels – no degree, secondary education, and tertiary education – between 1986 and 2006 are shown for Canada (see Figure 67), BC (see Figure 68), and
Human Poverty Index (HPI-2) for Canada:Composite Indicators and HPI-2 Value, 1998 to 2009
0
2
4
6
8
10
12
14
16
18
1998 1999 2000 2001 2002 2003 2004 2005 2006 2007/2008 2009
Report Year(the most recent data are used; data years are not specified)
Perc
enta
ge (%
)
Not suriving to age 60 (%)Illiteracy (%)Low income (%)Long-term unemployment (%)HPI-2 Value (%)

OGI-UBC Post-Games Report Appendix B (So05 – Human Development)
176
Vancouver CMA (see Figure 69, no data for the year 1986). Data for 2011 were not available at the time of analysis (November 8, 2012).
For each of the three educational levels, similar trends are seen for Canada, for BC, and for Vancouver CMA between 1986 and 2006. The proportion of the population with no degree, certificate or diploma shows a decreasing trend, the proportion with tertiary education shows an increasing trend, while the proportion with secondary education fluctuated without an obvious increasing or decreasing overall trend. In other words, the population in Canada, in BC, and in Vancouver CMA were overall more educated in 2006 than 20 years ago in 1986. Looking at Canada and at BC for the year 2006, the proportion of the population with no degree, certificate or diploma had dropped to about 20 per cent (from just under 50 per cent in 1986), while the proportion with tertiary education had risen to over 50 per cent (from about 33 per cent in 1986) (no data were available for 1986 for Vancouver CMA).
Figure 67: Educational Level (A)
Data source: Statistics Canada.
Educational Level in Canada, Census Data, 1986-2006
0%
10%
20%
30%
40%
50%
60%
70%
1986 1991 1996 2001 2006
Census Year
Perc
enta
ge o
f Tot
al
No Degree, Certificate or DiplomaSecondary EducationTertiary Education

OGI-UBC Post-Games Report Appendix B (So05 – Human Development)
177
Figure 68: Educational Level (B)
Data source: Statistics Canada.
Figure 69: Educational Level (C)
Data source: Statistics Canada. Data were not obtained for the census year 1986.
Educational Level in B.C., Census Data, 1986-2006
0%
10%
20%
30%
40%
50%
60%
70%
1986 1991 1996 2001 2006
Census Year
Perc
enta
ge o
f Tot
al
No Degree, Certificate or DiplomaSecondary EducationTertiary Education
Educational Level in Vancouver CMA, Census Data, 1991-2006
0%
10%
20%
30%
40%
50%
60%
70%
1986 1991 1996 2001 2006
Census Year
Perc
enta
ge o
f Tot
al
No Degree, Certificate or DiplomaSecondary EducationTertiary Education

OGI-UBC Post-Games Report Appendix B (So05 – Human Development)
178
Data for adult literacy rates were collected using different instruments that had evolved over time, including the 1994 International Adult Literacy Survey (IALS), the 2003 International Adult Literacy and Skills Survey (IALSS), and the 2011 Programme for the International Assessment of Adult Competencies, Canadian Component (PIAAC) (data not available yet). Therefore, data may not be compared across all years. However, the data do provide an indication of literacy rates in the adult population.
Data from the report on the 2003 IALSS18 show that the percentage who scored at or above the “desired” level of competence to cope with the increasing skill demands of the emerging knowledge and information economy were: 52 per cent for prose literacy (text); 51 per cent for document literacy (e.g., tables, etc.); 45 per cent for numeracy; and 28 per cent for problem solving. The IALSS report concluded that there had been little improvement in literacy proficiency since 1994 (on prose and document literacy and numeracy, which could be compared; problem solving, however, was not included in the 1994 IALS). In other words, between 1994 and 2003, about one half or more (depending on the type of literacy) of the Canadian population were considered unable to cope well with the demands of the knowledge and information economy.
Crime Rates
Between 1998 and 2011, similar trends in the incidence of crime were observed in Canada (see Figure 70), in BC (see Figure 71), and in Vancouver (see Figure 72). First, total incidence of crime (all violations) appeared to decrease beginning around 2004/2005, most likely due to a decrease in property crime. Violent crime against persons appeared relatively stable with a possible decline in recent years (after 2008/2009), while ‘other’ violations (aggregate of e.g., counterfeiting, traffic offences, weapons offences, etc.) appeared to be on the rise since 1998.
18 (2005). Building on our Competencies: Canadian Results of the International Adult Literacy and Skills Survey. Ottawa, Canada: Human Resources and Skills Development Canada and Statistics Canada.

OGI-UBC Post-Games Report Appendix B (So05 – Human Development)
179
Figure 70: Crime rates (A)
Data source: Statistics Canada, CANSIM 252-0051 (http://www5.statcan.gc.ca/cansim/a47, accessed on November 16, 2012).
Incidence of Crime in Canada, 1998-2011
0
500,000
1,000,000
1,500,000
2,000,000
2,500,000
3,000,000
1998 1999 2000 2001 2002 2003 2004 2005 2006 2007 2008 2009 2010 2011
Year
Num
ber o
f inc
iden
ts
Violent criminal violationsProperty crime violationsOther violationsTotal, all violations

OGI-UBC Post-Games Report Appendix B (So05 – Human Development)
180
Figure 71: Crime rates (B)
Data source: Statistics Canada, CANSIM 252-0051 (http://www5.statcan.gc.ca/cansim/a47, accessed on November 16, 2012).
Incidence of Crime in BC, 1998-2011
0
100,000
200,000
300,000
400,000
500,000
600,000
1998 1999 2000 2001 2002 2003 2004 2005 2006 2007 2008 2009 2010 2011
Year
Num
ber o
f inc
iden
ts
Violent criminal violationsProperty crime violationsOther violationsTotal, all violations

OGI-UBC Post-Games Report Appendix B (So05 – Human Development)
181
Figure 72: Crime rates (C)
Data source: Statistics Canada, CANSIM 252-0051 (http://www5.statcan.gc.ca/cansim/a47, accessed on November 16, 2012).
Health
Birth Rate Between 2000 and 2010, the crude birth rate (live births per 1,000 population) was variable in both Canada and BC, with an increase beginning in 2005/2006 but showing a decrease in 2010 (see Figure 73). The crude birth rate in BC (range of 9.6 to 10.2) was consistently lower than for Canada overall (range of 10.5 to 11.3).
Incidence of Crime in Vancouver, 1998-2011
0
50,000
100,000
150,000
200,000
250,000
300,000
1998 1999 2000 2001 2002 2003 2004 2005 2006 2007 2008 2009 2010 2011
Year
Num
ber o
f inc
iden
ts
Violent criminal violationsProperty crime violationsOther violationsTotal, all violations

OGI-UBC Post-Games Report Appendix B (So05 – Human Development)
182
Figure 73: Birth rate
Data source: Statistics Canada, CANSIM 102-4505 (http://www5.statcan.gc.ca/cansim/a47, accessed November 16, 2012).
Life Expectancy at Birth Data on life expectancy are based on rolling three-year ranges. Between 1992/1994 and 2007/2009, life expectancy at birth increased consistently overall and for both sexes in both Canada and in BC. Life expectancy at birth in BC was consistently higher than in Canada, although the numbers between BC and Canada were quite close. The life expectancy for females was also consistently higher than for males in both Canada and in BC, but the gap between the sexes decreased over time, with a gap of about 6 years in 1992/1994 and about 4.5 years in 2007/2009.
Crude Birth Rate (Live Births per 1,000 Population) in Canada and in BC, 2000-2010
8.5
9
9.5
10
10.5
11
11.5
2000 2001 2002 2003 2004 2005 2006 2007 2008 2009 2010
Year
Cru
de b
irth
rate
CanadaBC

OGI-UBC Post-Games Report Appendix B (So05 – Human Development)
183
Figure 74: Life Expectancy at Birth (A)
Data source: Statistics Canada, CANSIM 102-0512 (http://www5.statcan.gc.ca/cansim/a26, accessed November 16, 2012).
Life Expectancy at Birth for Canada, 1992/1994 to 2007/2009
70
72
74
76
78
80
82
84
1992
/1994
1993
/1995
1994
/1996
1995
/1997
1996
/1998
1997
/1999
1998
/2000
1999
/2001
2000
/2002
2001
/2003
2002
/2004
2003
/2005
2004
/2006
2005
/2007
2006
/2008
2007
/2009
Three-year Period
Num
ber o
f Yea
rs E
xpec
ted
to L
ive
Both sexes Males Females

OGI-UBC Post-Games Report Appendix B (So05 – Human Development)
184
Figure 75: Life Expectancy at Birth (B)
Data source: Statistics Canada, CANSIM 102-0512 (http://www5.statcan.gc.ca/cansim/a26, accessed November 16, 2012).
Healthy life expectancy (HALE) Health-adjusted life expectancy (HALE) is the number of years in full health that an individual can expect to live given the current morbidity and mortality conditions. Similar to data for life expectancy at birth, health-adjusted life expectancy (HALE) between 2000/2002 and 2005/2007: 1) increased in both Canada and in BC; 2) was consistently higher in BC than in Canada; and 3) was consistently higher in females than in males (see Table 45).
Table 45: Healthy life expectancy (HALE) 2000/2002 2005/2007 Canada Males 67.5 68.9 Females 69.9 71.2 BC Males 68.1 69.6 Females 70.4 72.3 Data source: Statistics Canada, CANSIM 102-0122 (http://www5.statcan.gc.ca/cansim/a47, accessed November 16, 2012).
Life Expectancy at Birth for BC, 1992/1994 to 2007/2009
70
72
74
76
78
80
82
84
1992
/1994
1993
/1995
1994
/1996
1995
/1997
1996
/1998
1997
/1999
1998
/2000
1999
/2001
2000
/2002
2001
/2003
2002
/2004
2003
/2005
2004
/2006
2005
/2007
2006
/2008
2007
/2009
Three-year Period
Num
ber o
f Yea
rs E
xpec
ted
to L
ive
Both sexes Males Females

OGI-UBC Post-Games Report Appendix B (So05 – Human Development)
185
Infant Mortality Rate under Five Years of Age
In Canada between 1996 and 2011, the infant mortality rate under 5 years of age decreased overall, from 6.8 deaths per 1,000 live births in 1996 to 5.6 deaths per 1,000 live births in 2011.
Figure 76: Infant Mortality Rate under 5 Years of Age
Data source: World Bank, Databank (http://data.worldbank.org/country/canada?display=default, accessed November 27, 2012).
Mortality by Cause
Figure 77 shows the mortality rate (number of deaths per 100,000 population) for all causes and broken down by the top five causes for Canada (shown on the left) and for BC (on the right) from 2000-2009. For Canada, the all-causes mortality rate fluctuated but appeared relatively stable (a range of 698.6 to 716.2 deaths per 100,000 population). For BC, however, the all-causes mortality rate appeared to be increasing slightly overall during the reporting period, from 676.5 in 2000 to a peak of 732.1 in 2008, and dropping to 704.9 in 2009. For both Canada and BC, the top six causes of mortality were: major cardiovascular diseases (decreasing slightly overall; malignant neoplasms (increasing slightly overall); all other causes (specified disease categories) (increasing slightly overall); residual diseases (not one of the specified disease
Infant Mortality Rate under 5 Years of Age
0.0
1.0
2.0
3.0
4.0
5.0
6.0
7.0
8.0
1996 1997 1998 1999 2000 2001 2002 2003 2004 2005 2006 2007 2008 2009 2010 2011
Year
Mor
talit
y R
ate
per 1
,000
Liv
e B
irths

OGI-UBC Post-Games Report Appendix B (So05 – Human Development)
186
categories) (increasing slightly overall); chronic lower respiratory diseases (fluctuated without an apparent trend); and accidents (unintentional injuries) (fluctuated without an apparent trend).
Figure 77: Mortality by Cause
Data source: Statistics Canada, CANSIM 102-0552 (http://www5.statcan.gc.ca/cansim/a47, accessed November 27, 2012).
Morbidity Rate
Age-standardized morbidity rates from 2003-2011 for selected conditions – obesity, arthritis, high blood pressure, asthma, chronic obstructive pulmonary disease (COPD), and diabetes – are shown in Figure 78 (Canada) and Figure 79 (BC). For all selected conditions, morbidity rates were consistently lower for BC than for Canada. The rates of being overweight or obese, which were over 40 per cent, were consistently at least three times higher than the rates for the other five selected conditions for both Canada and BC.
Mortality for Canada (All Causes), 2000-2009
0.0
100.0
200.0
300.0
400.0
500.0
600.0
700.0
800.0
2000 2001 2002 2003 2004 2005 2006 2007 2008 2009
Year
Num
ber o
f dea
ths
per 1
00,0
00 p
opul
atio
n
Mortality for BC (All Causes), 2000-2009
0.0
100.0
200.0
300.0
400.0
500.0
600.0
700.0
800.0
2000 2001 2002 2003 2004 2005 2006 2007 2008 2009
Year
Num
ber o
f dea
ths
per 1
00,0
00 p
opul
atio
n
Mortality by Cause for Canada, 2000-2009
0.0
50.0
100.0
150.0
200.0
250.0
300.0
2000 2001 2002 2003 2004 2005 2006 2007 2008 2009
Year
Num
ber o
f dea
ths
per 1
00,0
00 p
opul
atio
n
Major cardiovascular diseasesMalignant neoplasmsResidual diseases (uncategorized)Chronic lower respiratory diseasesAccidents (unintentional injuries)All other causes
Mortality by Cause for BC, 2000-2009
0.0
50.0
100.0
150.0
200.0
250.0
300.0
2000 2001 2002 2003 2004 2005 2006 2007 2008 2009
Year
Num
ber o
f dea
ths
per 1
00,0
00 p
opul
atio
n
Major cardiovascular diseasesMalignant neoplasmsResidual diseases (uncategorized)Chronic lower respiratory diseasesAccidents (unintentional injuries)All other causes

OGI-UBC Post-Games Report Appendix B (So05 – Human Development)
187
Figure 78: Morbidity Rate (A)
Data source: Statistics Canada, Canadian Community Health Survey, CANSIM 105-0503, age-standardized rates (http://www5.statcan.gc.ca/cansim/a47, accessed November 30, 2012). Data were not collected in 2004 and 2006.
Selected Morbidity Rates for Canada, 2003-2011
0
10
20
30
40
50
60
2003 2004 2005 2006 2007 2008 2009 2010 2011
Year
Age
-sta
ndar
dize
d m
orbi
dity
rate
Overweight or obese (18 years+)
Arthritis
High blood pressure
Asthma
Chronic obstructive pulmonarydisease (COPD)Diabetes

OGI-UBC Post-Games Report Appendix B (So05 – Human Development)
188
Figure 79: Morbidity Rate (B)
Data source: Statistics Canada, Canadian Community Health Survey, CANSIM 105-0503, age-standardized rates (http://www5.statcan.gc.ca/cansim/a47, accessed November 30, 2012). Data were not collected in 2004 and 2006.
Hospitalization Rate
Figure 80 shows that the age-standardized, inpatient hospitalization rates from 1994-1995 to 2010-2011 were similar between Canada and BC. The rates showed an overall decreasing trend over time for both Canada and BC, from rates of over 10,000 in 1994-1995 to rates of less than 8,000 in 2010-2011.
Selected Morbidity Rates for BC, 2003-2011
0
10
20
30
40
50
60
2003 2004 2005 2006 2007 2008 2009 2010 2011
Year
Age
-sta
ndar
dize
d m
orbi
dity
rate
Overweight or obese (18 years+)
Arthritis
High blood pressure
Asthma
Chronic obstructive pulmonarydisease (COPD)Diabetes

OGI-UBC Post-Games Report Appendix B (So05 – Human Development)
189
Figure 80: Hospitalization rate
Data source: Canadian Institute for Health Information (CIHI) (https://secure.cihi.ca/estore/productSeries.htm?pc=PCC526, accessed November 30, 2012). Data were not collected from 1996-1997 to 2002-2003.
Prevalence of People Who are Overweight or Obese The prevalence of people aged 12 years and older who were overweight or obese is shown for Canada (see Figure 81) and BC (see Figure 82) between 2003 and 2011. The rates were generally lower for BC than for Canada across all age groups. The data for BC are more variable, but the data for Canada suggest the proportion of people who are overweight or obese has been increasing slightly between 2003 (49.4 per cent) and 2011 (52.1 per cent). The data for Canada also suggest that the prevalence of people who are overweight or obese increases with age (group) until 64 years of age, with a slightly lower prevalence for those who are aged 65 years or older.
Age-standardized Inpatient Hospitalization Rate for Canada and for BC, 1995-1996 to 2010-2011
0
2,000
4,000
6,000
8,000
10,000
12,000
1995-1996
1996-1997
1997-1998
1998-1999
1999-2000
2000-2001
2001-2002
2002-2003
2003-2004
2004-2005
2005-2006
2008-2009
2009-2010
2010-2011
Year
Age
-sta
ndar
dize
d ra
te p
er 1
00,0
00 p
opul
atio
n
CanadaBC

OGI-UBC Post-Games Report Appendix B (So05 – Human Development)
190
Figure 81: Overweight or Obese (A)
Data source: Statistics Canada, CANSIM 105-0501 (http://www5.statcan.gc.ca/cansim/a47, accessed November 30, 2012). Data were not collected in 2004 and 2006.
Prevalence of People Who are Overweight or Obese in Canada, 2003-2011
0
10
20
30
40
50
60
70
2003 2004 2005 2006 2007 2008 2009 2010 2011
Year
Prop
ortio
n of
pop
ulat
ion
Total, all ages12 to 19 years 20 to 34 years 35 to 44 years 45 to 64 years 65 years and over

OGI-UBC Post-Games Report Appendix B (So05 – Human Development)
191
Figure 82: Overweight or Obese (B)
Data source: Statistics Canada, CANSIM 105-0501 (http://www5.statcan.gc.ca/cansim/a47, accessed November 30, 2012). Data were not collected in 2004 and 2006. *Data for the years 2007, 2008, and 2010 should be used with caution.
Nutrition
Daily per Capita Calorie Intake Data on calorie intake was collected in 2004 for the Canadian Community Health Survey (CCHS) (Statistics Canada) as part of a Nutrition focus; data were not collected in subsequent cycles of the CCHS. The data are shown in Table 46. For every age group, males on average consumed more calories per day than females. In both males and females, the most calories were consumed on average in the age group 12-19 years, and average calorie intake per day decreased with each older age group.
Prevalence of People Who are Overweight or Obese in BC, 2003-2011
0
10
20
30
40
50
60
70
2003 2005 2007 2008 2009 2010 2011
Year
Prop
ortio
n of
pop
ulat
ion
Total, all ages12 to 19 years*20 to 34 years 35 to 44 years 45 to 64 years 65 years and over

OGI-UBC Post-Games Report Appendix B (So05 – Human Development)
192
Table 46: Calorie intake (kcal) for Canada in 2004, by sex Age Group Males Females
5-11 years 2,041 (includes both sexes) 12-19 years 2,806 2,047 20-39 years 2,660 1,899 40-64 years 2,345 1,757 65 years or older 1,948 1,544 Data source: Garriguet D (2006). Overview of Canadians' Eating Habits. Ottawa, Canada: Statistics Canada. Catalogue no. 82-620-MIE — No. 2.
Protein in Diet
Data on the percentage of calories from protein are from the 2004 Canadian Community Health Survey, Nutrition focus (one-time) (see Table 47). Beginning with the age group 9-13 years, the percentage of calories from protein in both males and females was higher with each older age group, with a peak at 51-70 years and then less for those aged 71 years or older. Males from 9-50 years consumed more calories from protein than did females; after 51 years of age, however, the pattern was reversed, i.e., females consumed more calories from protein than did males.
The acceptable range for protein is 10-30 percent of calories for children and adolescents, and 10-35 per cent of calories for adults. The data suggest that both males and females of all age groups were within the acceptable range for protein consumption.
Table 47: Protein (per cent of calories)* Age Group Males Females
4-8 years 14.3 (includes both sexes) 9-13 years 14.6 14.0 14-18 years 15.2 14.4 19-30 years 15.6 15.5 31-50 years 16.8 16.6 51-70 years 17.0 17.1 71 years or older 16.4 16.6 Data source: Garriguet D (2006). Overview of Canadians' Eating Habits. Ottawa, Canada: Statistics Canada. Catalogue no. 82-620-MIE — No. 2. *Excludes the territories. Excludes women who were pregnant or breastfeeding.
Consumption of Key Foods Data on the consumption of key foods (vegetables and fruit, milk products, meat and alternatives, and grain products) are from the 2004 Canadian Community Health Survey, Nutrition focus (one-time) (see Table 48).
The Canada Food Guide (in 2004) recommended a minimum of five daily servings of vegetables and fruit for people of all ages. The averages shown in Table 48 suggest that Canadians consumed low amounts of vegetables and fruit. For example, children and adolescents on

OGI-UBC Post-Games Report Appendix B (So05 – Human Development)
193
average consumed less than the recommended five servings, and some adults (e.g., females aged 19-30 years) consumed below the recommended minimum as well.
The Canada Food Guide (in 2004) recommended two to three daily servings of milk products for children aged 4-9 years; three to four servings for adolescents aged 10-16 years; and two to four servings for people aged 17 or older. Only young children (4-8 years) met the recommended daily consumption.
The Canada Food Guide (in 2004) suggested two to three daily servings of meat and alternatives (100-300 grams of cooked meat) for all ages. On average, Canadians in all age groups consumed the recommended amount of meat and alternatives. The Canada Food Guide (in 2004) recommended 5-12 servings of grain products a day for all ages. Except for females aged 31 years or older, this recommendation was met in all other groups by age and sex.
In summary, the data suggest that in 2004, Canadians of all ages consumed the recommended servings of meat and alternatives per day, but varied in meeting the recommended daily amounts in the other three food groups (vegetables and fruit, milk products, and grain products).
Table 48: Consumption of key foods*^
Age Group Sex
Vegetables and Fruit (servings)
Milk Products (servings)
Meat and Alternatives
(grams)
Grain Products (servings)
4-8 years Both sexes 4.18 2.31^ 118^ 5.76^ 9-13 years Male 4.53 2.55 176^ 7.09^
Female 4.40 2.08 130^ 5.92^ 14-18 years Male 4.87 2.64 229^ 7.98^
Female 4.45 1.82 136^ 5.74^ 19-30 years Male 5.36^ 1.95 247^ 7.32^
Female 4.67 1.64 145^ 5.19^ 31-50 years Male 5.26^ 1.62 254^ 6.64^
Female 4.92 1.52 169^ 4.87 51-70 years Male 5.68^ 1.37 241^ 5.74^
Female 5.24^ 1.28 174^ 4.66 71 years or older
Male 5.03^ 1.36 189^ 5.59^ Female 4.76 1.24 140^ 4.47
Data source: Garriguet D (2006). Overview of Canadians' Eating Habits. Ottawa, Canada: Statistics Canada. Catalogue no. 82-620-MIE — No. 2. *Excludes the territories. Excludes women who were pregnant or breastfeeding. ^Meets the minimum recommended daily consumption in the Canada Food Guide in 2004 (the Food Guide has been updated since then, i.e., the current recommended minimum may differ from that in 2004).
Consumption of Alcohol
Data on the consumption of alcohol (five drinks or more on one occasion at least once during the past month) were from the Canadian Community Health Survey for Canada from 2003-2011

OGI-UBC Post-Games Report Appendix B (So05 – Human Development)
194
(data on average daily alcohol consumption were not available) – see Figure 83. Five drinks or more on one occasion exceeds the first Canadian recommended guidelines for low-risk alcohol consumption for special occasions.19 The percentage of both males and females aged 12 years or over who consumed five drinks or more on one occasion at least once during the past month appeared to be increasing after 2008, with the highest levels in 2011 during the reporting period (2003-2011). Overall, more than twice the percentage of males than females exceeded the 2011 Canadian guidelines for low-risk alcohol consumption.
19 See Canada’s Low-Risk Alcohol Drinking Guidelines, which was approved by Health Canada in November 2011 (http://www.ccsa.ca/eng/priorities/alcohol/canada-low-risk-alcohol-drinking-guidelines/Pages/default.aspx, accessed December 5, 2012).

OGI-UBC Post-Games Report Appendix B (So05 – Human Development)
195
Figure 83: Consumption of alcohol
Data source: Statistics Canada, CANSIM 105-0501, Canadian Community Health Survey (CCHS) (http://www5.statcan.gc.ca/cansim/a26, accessed December 5, 2012). Data were not collected in 2004 and 2006.
Quality Control of Drinking Water Data on quality control of drinking water from three sources were available for the Metro Vancouver region from 2008-2011 (see Table 49). No overall pattern was observed in the data, i.e., fluctuations were observed within sources and differences were observed between sources. However, zero percent of samples having turbidity were observed in at least one source in 2010 and in 2011, which suggests that the quality of drinking water appeared to have improved in the latter years.
Consumption of Alcohol, Five or More Drinks on One Occasion at Least Once in the Past Month for Population Aged 12 Years or Older
in Canada, 2003-2011
0
5
10
15
20
25
30
2003 2004 2005 2006 2007 2008 2009 2010 2011
Year
Perc
enta
ge o
f pop
ulat
ion
Both sexes Males Females

OGI-UBC Post-Games Report Appendix B (So05 – Human Development)
196
Table 49: Quality control of drinking water (percent of days with average daily turbidity >1 NTU)
Source 2008 2009 2010 2011 Capilano* 2 3 0 0 Seymour** 2 17 4 0 Coquitlam*** 8 3 0.3 0.5 Data source: The Greater Vancouver Water District Quality Control Annual Report (published by Metro Vancouver) for the years 2008-2011. *In service for 314 days in 2008, 366 days in 2009, 140 days in 2010, and 148 days in 2011. **In service for 352 days in 2008, all of 2009, all of 2010, and all of 2011. ***In service for all of 2008, 2009, 2010, and 2011.
Summary and Interpretation of Human Development Indicators
Most of the Human Development indicators suggested improvements in Canada, BC, and/or Vancouver (depending on the availability of data) overall and/or in latter years, with respect to:
• Poverty and social exclusion; • Educational level; • Crime rate; • Crude birth rate (live births per 1,000 population); • Life expectancy at birth; • Healthy Life Expectancy (HALE); • Infant mortality rate under five years of age (per 1,000 population); • Hospitalization rate; and • Quality control of drinking water. Other Human Development indicators suggested little to no improvement, mixed findings (some progress, some retrogression), or had insufficient data to gauge progress or retrogression in Canada, BC, and/or Vancouver (depending on the availability of data):
• Adult literacy rate; • Mortality; • Morbidity; • Calorie intake; • Protein in diet (on average, Canadians were within the acceptable range); and • Consumption of key foods (some Canadians were not meeting the minimum daily
requirements).
Other Human Development indicators suggested retrogression in Canada, BC, and/or Vancouver (depending on the availability of data) overall and/or in latter years:
• Prevalence of people who are overweight or obese; and • Alcohol consumption (five drinks or more on one occasion at least once in the past month). In summary, progress in Human Development in Canada was observed for both social indicators and health-related indicators, while little progress, and in some cases retrogression, were observed mostly for health-related indicators (and one social indicator – adult literacy rate).

OGI-UBC Post-Games Report Appendix B (So06 – Culture)
197
So06 – Culture
Focus Area Purpose (as stated in 2011 OGI)
Host City cultural activities
This indicator refers to various types of cultural leisure activities such as cinema, theatre, opera, music, art and architecture.
Olympic cultural programme
This indicator assesses the importance given to art and culture in the Olympic and Paralympic project. In addition, it provides information on Indigenous and/or local art and culture participation.
Olympic and Paralympic educational activities
The organization of the Olympic and Paralympic Games is often accompanied by educational activities in the field of sport (and other related fields such as environmental protection, Olympic history, etc.). This indicator measures the scope of such initiatives. This encompasses educational activities undertaken by the OCOG and external bodies
Host City Cultural Activities
Data on the types of cultural activities and their total attendance in Vancouver were not available (this was also the case at the time the Vancouver OGI Pre-Games Report was produced).
Olympic Cultural Programme
No new data were anticipated after the Vancouver OGI Games-time Report. Therefore, the presented data are from the Games-time Report. Detailed data from VANOC were available for the year 2010 only (see Table 50). Data for the Cultural Olympiads in 2008 and in 2009 are given as totals (not by event) (see Table 51).
The cultural programme for the Games in 2010 included 149 events. In total, 6,015,736 people visited these events. This number excludes Endlessly Traversed Landscapes, a visual arts exhibition consisting of 43 works presented on a variety of outdoor (or more technically out-of-home) display spaces in very high traffic areas such as transit shelters, subway station walls and subway trains; it is estimated that this exhibition generated between 2 and 5 million “engaged impressions” during the 70 days the works were on display. The total budget for cultural programme events for 2010 was $56,420,129 (note that for Border Zones and Water’s Edge Festival, full budget information was unavailable and the amount the Cultural Olympiad contributed to the presentations was used in the calculation of the total; in addition, no data were available on the budget for events at the 2010 Aboriginal Pavilion that showcased Aboriginal culture and was visited by over 242,000 people during the 17 days of the Olympic Games). The events in 2010 were visited on average by 40,647 people (excluding the Endlessly Traversed Landscapes), and had an average budget of $381,217 (excluding the Aboriginal Pavilion). Additionally, it should be noted that the Cultural Olympiad Digital Edition (CODE) creatively engaged people across Canada and around the world using digital technology. CODE is an online portrait of the host country that was created from 10,000 photo and text contributions by

OGI-UBC Post-Games Report Appendix B (So06 – Culture)
198
Canadians who wanted to welcome the world. People from 185 countries spent the equivalent of 550 days on the site. CODE Motion Pictures shared the work of Canadian filmmakers to an estimated audience of 3.3 million and CODE Screen 2010 presented more than 100 Canadian visual artists in an online gallery. The number of contributors to and viewers of CODE are not reflected in the attached tables. Similarly, the outdoor light installation titled “Vectorial Elevation” by Canadian artist Rafael Lozano-Hemmer was viewed by an online audience of 200,000 from 160 countries with 22,000 people worldwide actually participating in the artwork by sending in designs via the web, in addition to the estimated 750,000 people in Vancouver reported in the attached table. Overall, information about the Cultural Olympiad was accessed online via more than 3 million page views. Information about the Cultural Olympiad was also downloadable through the Official Mobile Spectator Guide, which was the number one mobile app in Canada during the Games with 1 million downloads to mobile devices.
Finally, at the country level, the cultural program included two music tours: John Wort Hannam and Spring Breakup with an estimated 400 visitors in attendance and a budget of $27,580, and Jenn Grant and Jason Plumb and The Willing with an estimated 1,440 visitors and a budget of $97,842.
In 2009, a total of 283,773 people visited events of the cultural programme in the city of Vancouver, with total budget of $21,215,350 for the events. In 2008, there were 163,128 people and a total budget of $7,334,350. Cumulatively, $84,970,829 was spent on the Cultural Olympiads, with a total of 6,462,637 visitors.
Although detailed data were available only for the 2010 Cultural Olympiad, the totals across the three Cultural Olympiads suggest both an increase in budget for the events and an increase in the number of people attending the events. Based on budget and attendance, increasing importance appeared to be given to the cultural field in the lead up to the 2010 Winter Games, with the greatest activity during the Games.

OGI-UBC Post-Games Report Appendix B (So06 – Culture)
199
Table 50: Olympic Cultural Programme (2010 Only)
Event People Budget
Art Under Foot 8,600 $30,000Edward Curtis Project 1,129 $169,624Spoken World 325 $20,500Son of Chamber Symphony 297 $60,591Wild at Art 1,300 $12,000Spirit of Place: Beijing, Vancouver & London Young Artists Exhibition-Olympic Themes 5,000 $34,400Backstory: Nuuchaanulth Ceremonial Curtains and the Work of Ki-‐ke-‐in 4,764 $284,422MONSTER 903 $36,000Beyond Eden 11,464 $542,727Laurie Anderson: Delusion 2,938 $216,987Where the Blood Mixes 19,218 $72,790Glocal Urban Screen 150,000 $595,157The Only Animal 2,902 $451, 638Quilt of Belonging 9,477 $83,873Blue Dragon 10,747 $1,200,000Canada Code Photo Project 62 $10,694Ice Age 2010 550 $245,000Drum and Light Festival 417 $29,000Erotic Anguish of Don Juan 267 $46,205Marathonologue 168 $86,700Art of Craft 6,028 $364,928Quantum Bhangra 1,352 $151,184Nixon in China 9,873 $1,924,840First Nations / Second Nature 3,100 $32,100Clamour and Toll 209 $7,896Syndicate of Public Speakers 40 $5,003Ginger Goodwin Way 650 $20,0002010 Vancouver International Dance Festival 3,981 $349,020Sewing Our Traditions 1,824 $57,799HIVE 3 2,066 $223,548Before & After 10,000 $13,367Altered 60 $42,503Spine 1,499 $352,230An Invitation to an Infiltration 1,442 $100,110Symphony of a Thousand: Mahler's Symphony No. 8 5,312 $381,667DBR/VSO: A Voodoo Valentine 1,855 $114,673Vancouver Symphony with Adrian Anantawan 1,052 $64,759Abandon Normal Devices (AND) 150 $16,250CODE Live at W2 (Fearless City Mobile; OMG I’m on DOT TV; Untold Histories: Presence of the Land) 4,000 $49,500Nevermore 7,286 $165,531Rimini Protokoll “Best Before” 1,151 $41,914Fear of Flight 570 $94,784BASH'd 830 $26,719Elephant Wake 576 $22,353Underneath Lintel 540 $31,350ARC 318 $27,560Balkan Beat Box 500 $26,370Compagnie Marie Chouinard 1,183 $85,856Kidd Pivot 1,351 $68,484
Continued on next page
Cultural Programme, Vancouver, 2010

OGI-UBC Post-Games Report Appendix B (So06 – Culture)
200
Event People Budget
Sursaut Dance - Surrey Arts Centre 252 $8,655Sursaut Dance -‐ Centennial Theatre 303 $10,078China 938 $37,142Kamp 597 $58,426Passion of Joan of Arc 358 $40,448Poetics: a ballet brut 565 $59,736White Cabin 510 $35,965The Candahar 6,879 $165,000High Performance: Evolution and Innovation in Canadian Design 8,760 $77,509Mississippi Sheiks 772 $47,793New Forms Festival and Code Live Presents 631 $26,750DANCE MARATHON 530 $82,232Les 16e Rendez-vous du cinema québécois et francophone de Vancouver 3,311 $191,393Paradise Garden 11,727 $166,336Rick: The Rick Hansen Story 3,237 $356,650Jason de Haan: Life After Doomsday 2,575 $15,618Talking Stick Festival 2010 1,248 $300,000Arthur Renwick: Masks 16,065 $50,000Reece Terris, Western Front Front – Another False Front 7,200 $61,270The National Dance Company of Korea: The Scent of Spring 2,273 $165,000Out from Under: Disability, History and Things to Remember 4,000 $5,000Configurations 351 $30,000Phoenix 2,628 $115,865STREB: Raw 1,050 $87,348Steve Earle and Joel Plaskett 2,074 $101,370Majumder/Cullen/Payne 1,890 $109,264CODE Live: Mike Relm 544 $35,406Cloud Gate Dance Theatre 3,180 $312,717The Passion of Russia 2,457 $69,765Tono 1,492 $112,580CODE Live: Kid Koala 599 $40,312CODE Live: Jamming the Networks 528 $37,391Dance Canada Dance 3,778 $531,280City and Colour 2,732 $122,367Sound Gallery 81 $14,433Spirit of Uganda 1,803 $100,495Maria Pages Flamenco Republic 1,434 $129,518New Songs: New Voices 444 $39,703Feist 2,606 $250,540CODE Live: Bell Orchestre 471 $31,019Hal Willner 4,379 $501,200Tanya Tagaq: Tuusalangna 234 $29,337Amir Koushkani & Rahim Alhaj 221 $32,387CODE Live: Martyn/2562/Deadbeat 684 $31,044Stars 2,514 $98,927CODE Live: Chromeo 688 $40,383Umalali: Garafuna Women's Project 230 $20,702Moscow State Choir 1,036 $10,014Continued on next page
Cultural Programme, Vancouver, 2010 (Continued)

OGI-UBC Post-Games Report Appendix B (So06 – Culture)
201
Event People Budget
KNAAN & Tinariwen 2,618 $114,376Body & Soul 794 $78,031Gomez 1,393 $127,602Nathan & The Deep Dark Woods 233 $24,042U theatre - Sound of the Ocean 2,013 $140,290Paul Plimley Trio 182 $17,228Chai Found Music Workshop 296 $15,998NAC Made in Canada 785 $116,845Alice and Other Heroes 474 $44,093Martha Wainwright & Jorane 754 $61,549Hilario Duran 568 $51,724Raphael Saadiq & India.Arie 1,542 $189,680Culture Shock: Video Interventions at the QET 4,800 $40,000Fire with Fire 50,000 $60,000Endlessly Traversed Landscapes DNAA $175,000Etienne Zack: Name, Medium, Size, Year 2,500 $56,000Trimpin: Sheng High 3,000 $30,000Gwenael Belanger: Tournis 10,000 $25,000Metcalfe/Lewis: IKONS 2,500 $108,174Yukon Souvenir 60,000 $31,000Ed Pien: Tracing Night 4,532 $25,000GOLD RUSH! Art, Bars, & Speculation 624 $10,000World Tea Party 4,038 $45,882BRIGHT LIGHT (CODE) 109,713 $376,059Vectorial Elevations 750,000 $840,000Michael Lin: A Modest Veil 832,500 $365,487CUE: Artists’ Videos 1,136,700 $326,645Visceral Bodies 171,671 $217,432Place de la Francophonie 200,000 $3,100,000LiveCity Vancouver (two locations Celebration Site Olympics and Paralympics) 408,722 $18,000,000Richmond O-Zone (Celebration Site Olympics only) 333,333 $7,900,000Surrey 2010 Celebration Site (Olympics only) 181,930 $3,695,000Whistler Live (Celebration Site Olympics and Paralympics) 904,000 $3,668,000Aboriginal Pavilion 10,800 DNAACODE Live 1, 2 and 3 65,000 $1,801,420Border Zones 36,814 $25,000Vancouver as the Centre of the World 115,500 $18,136LunarFest 150,000 $50,000Raven Stole the Sun 680 $8,600Drowning Girls 1,202 $10,000Rain 4,585 $75,000A Celebration of Creativity 9,840 $25,000Juste pour Rire de Vancouver 2010 2,831 $40,000Water’s Edge Festival 1,120 $20,000Inbody: MOA Global Dialogue 155 $25,000NiX 2,902 $226,000The Fiddle and The Drum 4,303 $175,000Continued on next page
Cultural Programme, Vancouver, 2010 (Continued)

OGI-UBC Post-Games Report Appendix B (So06 – Culture)
202
Table 51: Olympic Cultural Programme (Summary)
Olympic and Paralympic Educational Activities No post-Games data were anticipated for Olympic and Paralympic educational activities. Therefore, the presented data are from the Vancouver OGI Games-time Report. Data available from VANOC provide only an overview of educational activities and the number of individuals reached. No further specifics were available (e.g., global budget, percentage of VANOC budget).
VANOC created six major Olympic and Paralympic Educational Activities to engage with visitors on the topics of education and sport: Vancouver2010.com/edu; Sharing the Dream; Paralympic School Days; Fyicanada.ca; Studentslive.ca; and LiveCity Education Program. Most of these programs were web-based applications, and the number of unique visitors to these web pages is available. The Vancouver2010.com/edu website was an interactive bilingual e-magazine and portal that provided education resources in the areas of sport, culture, and sustainability. Between December 2007 and the end of March 2010, 281,293 unique visitors viewed the website. Educational activities included storytelling workshops (1,624 teachers and 25,900 students across Canada), a showcase of projects (200 classes across Canada), student reporter programs (50 schools, 14 teachers, and 64 students across Canada), and podcasts of university lecturers (34 academics and 28 universities across Canada).
The “Sharing the Dream” Program, which was started by the BC Ministry of Education, provided lesson starters to assist teachers in formulating lesson plans, a “Student Reporter” Guide to assist students in reporting on the goings on of the Olympic and Paralympic Games, and a guide to celebrating Paralympic school week. The website had approximately 1,600,000 page views between October 2008 and March 2010.
Event People BudgetIn Situ 3,000 $65,000Coastal Jazz - Winterruption 1,525 $32,500Arts Umbrella: Kinesphere 600 $10,000Coastal Jazz - Club 2010 479 $15,000Room to Make your Peace 10,000 $87,000
Cultural Programme, Vancouver, 2010 (Continued)
Year Budget Visitors2008 $7,334,350 163,1282009 $21,216,350 283,7732010 $56,420,129 6,015,736
Cultural ProgramsSummary 2008 to 2010

OGI-UBC Post-Games Report Appendix B (So06 – Culture)
203
“Paralympic School Days” was another cornerstone to the Olympic Educational Activity platform. Seventy-three schools and 27,500 students had the opportunity to listen to inspirational speeches by Paralympic athletes, try out different types of Paralympic sport equipment, and improve their knowledge about Paralympians.
Fyicanada.ca was a web community for Canadian teenagers that highlighted video interviews with torchbearers and other Olympic activities that were taking place during the Games.
Studentslive.ca was a joint project of the West Vancouver School District, the British Columbia Educational Leadership Council and VANOC. The website used social media to connect students to the Games by enabling them to participate in a range of media activities, which included filing articles, capturing videos and conducting interviews with young people before, during and after events. The LiveCity Education Program provided a one-hour live show featuring bilingual personalities as emcees, Olympic and Paralympic Athlete presentations, live sport competition on giant screens, and live entertainment from across Canada; 9,516 students attended Live City during the Olympic Games and 751 attended during the Paralympic Games.
Summary and Interpretation of Culture Indicators Based on budget and attendance, increasing importance appeared to be given to the cultural field in the lead up to the 2010 Winter Games, with the greatest activity during the Games. A variety of educational activities, including those with a special focus on the Paralympics, were implemented by VANOC and others, which suggests a catalytic role of the organization of the Games in the field of education.

OGI-UBC Post-Games Report Appendix B (So07 – Sport for All and Elite Sport)
204
So07 – Sport for All and Elite Sport
Focus Area Purpose (as stated in 2011 OGI)
Sport and physical activities
This indicator has two objectives – to assess the level of sports practice in the city and region and to monitor its evolution over time.
Physical education and school sport
This indicator illustrates the importance given to physical education and extra-curricular sport in school, based on the premise that sport is an integral part of education. It assesses the role of schools in encouraging sport participation and the percentage of students who practice extra-curricular sport at school facilities.
Sport facilities This indicator shows the sporting capacity and dynamism of the city/region in terms of its facilities (the distinction between the different types of facilities reveals the orientation of the region’s sport and assesses the outcome of sports policies focusing on either professional sport and/or sport for all).
Top level sportsmen and women
Top-level sportsmen and women are often put forward as the successful outcomes of sports policies and federations. The number of top-level sportsmen and women support this. Paralympic champions are also considered role models and inspiring examples. Additional information regarding talent development programmes and career programmes should be included.
*Major sporting events hosted
This indicator assesses the local/regional/country organization of major sporting events, including the energy, time and money invested in such projects.
**Results at the Olympic and Paralympic Games and World Championships
This indicator takes into account the results of the country’s athletes in the Olympic and Paralympic Games (both Winter and Summer Games, if participating), and World Championships in Olympic and Paralympic sports. It includes results in Games held prior to the election of the host city and in subsequent editions.
*This indicator is anticipated to show increases after the event, but data were not available. **This indicator is anticipated to show increases (during the event or after) and will be analyzed with respect to attribution (Games impact).
Sport and physical activities Sport Club Participation
The only data on sport club participation (e.g., associations, school clubs, multi-sport associations) that were available are reported in a Statistics Canada report titled Sport

OGI-UBC Post-Games Report Appendix B (So07 – Sport for All and Elite Sport)
205
Participation in Canada, 2005,20 which was based on data from the Sport Supplement to the General Social Survey.
In 2005, 17.5 percent of Canadians aged 15 years and over reported belonging to a sport club, local community league, or local/regional amateur sport organization (see Table 52); this number was slightly less than the 19 percent reported in the previous survey in 1998. In 2005, a slightly higher proportion of males (17.6 percent) than females (17.3 percent) belonged to sport clubs. Although the relative proportions between sexes varied across age groups, the highest rate of sport club participation for both sexes was in the age group 15-18 years.
Table 52: Sport Club Participation (2005 Data)
Total Population (thousands)
Number Belonging to Clubs Total
(thousands) Male
(thousands) Female
(thousands) Total 26,106 4,558 (17.5%) 2,264 (17.6%) 2,294 (17.3%) 15-18 years old 1,796 475 (26.5%) 266 (28.9%) 209 (23.9%) 19-24 years old 2,567 472 (18.4%) 251 (19.1%) 221 (17.6%) 25-34 years old 4,365 781 (17.9%) 370 (16.8%) 411 (19.0%) 35-54 years old 9,942 2,004 (20.2%) 923 (18.6%) 1,080 (21.7%) 55 years and over 7,436 826 (11.1%) 453 (13.1%) 372 (9.4%) Data source: Ifedi F (2008). Sport Participation in Canada, 2005. Ottawa, Canada: Statistics Canada. Sports clubs include sports clubs, local community leagues or other local/regional amateur sport organizations. The percentage is calculated using the total Canadian population aged 15 years and older for each designated category.
Participation in Commercial Settings
The indicator on sport participation in commercial settings (e.g., members in sports clubs and fitness centres) is new to OGI (introduced in 2011). No data were available for this indicator.
Disabled Sportsmen and Sportswomen The indicator on disabled sportsmen and sportswomen is new to OGI (introduced in 2011). No data were available on the number of disabled sportsmen and sportswomen in Canada. Participation of Young People in Sports Activities
The indicator on participation of young people in sport activities is new to OGI (introduced in 2011). The only available data for this indicator were in a Statistics Canada report titled Kids’ Sports,21 which was based on data from the General Social Survey for 1992 and 2005.
20 Ifedi F (2008). Sport Participation in Canada, 2005. Ottawa, Canada: Statistics Canada. 21 Clark W (2008). Kids’ Sports. Ottawa, Canada: Statistics Canada.

OGI-UBC Post-Games Report Appendix B (So07 – Sport for All and Elite Sport)
206
Overall, the participation of young people in sports activities was lower in 2005 (56 percent) than in 1992 (66 percent) (see Table 53); this difference was statistically significant. In general, a higher proportion of females than males participated in sports activities in both 1992 and 2005. A higher proportion of 11-14 year olds than 5-10 year olds participated in sports activities in both 1992 and 2005 (see Table 54). However, the rates of participation in both age groups were significantly less in 2005 than in 1992.
Table 53: Participation of Young People in Sports Activities (A) Sex 1992 2005
Both 66% 56% a Boys 49% 45% Girls 57% 51% a Data source: Clark W (2008). Kids’ Sports. Ottawa, Canada: Statistics Canada. aData from 2005 is statistically significant from data from 1992 (p<0.05).
Table 54: Participation of Young People in Sports Activities (B) Age Group 1992 2005
5-10 years old 53% 47%a 11-14 years old 64% 55%a Data source: Clark W (2008). Kids’ Sports. Ottawa, Canada: Statistics Canada. aData from 2005 is statistically significant from data from 1992 (p<0.05).
Active and Inactive (Sedentary) Behaviour of the Population
The indicator active and inactive (sedentary) behaviour of the population is new to OGI (introduced in 2011).
Between 1994 and 2007 for both Canada and BC, the overall trend has been an increase in the proportion of the population that is active and a decrease in the proportion of those who are inactive (see Figure 84). The proportion of the population that is active has consistently been higher for BC (49.0 to 58.1 percent) than for Canada (39.4 to 51.0 percent).

OGI-UBC Post-Games Report Appendix B (So07 – Sport for All and Elite Sport)
207
Figure 84: Active and Inactive (Sedentary) Behaviour of the Population
Data source: CANSIM 105-4033, Statistics Canada (http://www5.statcan.gc.ca/cansim/a01?lang=eng, accessed January 11, 2013). The data are for the population aged 12 years and over. “Active” means either physically active or moderately active. A small percentage of respondents did not state whether they were active or inactive; these are not included in the chart. a Data were generally collected every two years, except for a three-year gap between 2000 and 2003. A straight line has been drawn (imputed) between the data points for 2000 and 2003.
Physical education and school sport
In Canada, education is under provincial jurisdiction and the curriculum is overseen by the province. Therefore, the grade level to which physical education is mandatory varies. In BC
Leisure-time, Physically Active and Inactive, Aged 12 Years and Over, Canada and BC, 1994-2007a
0%
10%
20%
30%
40%
50%
60%
1994 1995 1996 1997 1998 1999 2000 2001 2002 2003 2004 2005 2006 2007
Year
Perc
enta
ge o
f Pop
ulat
ion
Active, CanadaInactive, CanadaActive, BCInactive, BC

OGI-UBC Post-Games Report Appendix B (So07 – Sport for All and Elite Sport)
208
(and thus Vancouver and Whistler), physical education is mandatory from kindergarten to grade 10, with a recommendation by the BC Ministry of Education that 10 percent of the total instructional time for each school year be allotted for physical education.22
Sport facilities There are no directories or local statistics for Vancouver that comprehensively capture the number of sports facilities by type and their availability for professional sport or open for all.
Top level sportsmen and women Data on top level athletes are for the Canadian Olympic Committee’s Athlete Excellence Fund (AEF), which was first distributed in 2008.23 The AEF provides Canadian athletes with performance awards on a four-year cycle: Year 1 – top five in the world – $5,000; Year 2 – top five in the world – $5,000; Year 3 – top four in the world – $5,000; and Year 4 (Olympic year) – Olympic Games, Gold medal – $20,000, Silver medal – $15,000, Bronze medal – $10,000. Table 55 shows the number of awards won between 2008 and 2011. Because of the four-year cycle where different criteria are applied in different years and the limited amount of data, no analysis for trends could be conducted.
Table 55: Top level sportsmen and women
Year Number of
Awards 2008* 34 2009 132 2010** 120 2011 116 * Summer Olympics year and the year in which the awards began being distributed ** Winter Olympics year
The federal government of Canada funds a Sport Support Program (SSP) that includes a variety of initiatives associated with the delivery of the Canadian Sport Policy (http://www.pch.gc.ca/eng/1267385942671, accessed on January 31, 2013). The SSP aims to develop athletes and coaches at the highest international levels, provide sound technically-based
22 BC Ministry of Education, Physical Education Curriculum Documents. http://www.bced.gov.bc.ca/irp/subject.php?lang=en&subject=Physical_Education (accessed on January 25, 2013). 23 The data on the Athlete Excellence Fund differs from the data that were presented on the top 16 athletes who participated in the Athlete Assistance Program in the OGI Pre-Games Report. The previous specialized data were not able to be obtained for the OGI Post-Games Report for Vancouver. Therefore, the previous data and the data presented in the current report for this indicator could not be compared.

OGI-UBC Post-Games Report Appendix B (So07 – Sport for All and Elite Sport)
209
sport programming for all athletes, increase the number of Canadians from all segments of society involved in sport, and advance Canadian interests and values in Canada and abroad. Funding is provided to eligible organizations (not directly to individual athletes) for programming that supports the goals of the Canadian Sport Policy. The talent development initiative24 that is supported under SSP is Own the Podium (OTP). OTP supports Canada's National Sport Organizations (NSOs) to implement their technical programs in their goal to increase medal counts by Canadian athletes at Olympic and Paralympic Summer and Winter Games. OTP is funded by various governments, corporate partners, and the Canadian sport community. Since OTP was launched in January 2005 (ongoing as on February 1, 2013), the cumulative budget has been $341,634,173.25
Major sporting events hosted
Even at the time that the OGI Pre-Games Report for Vancouver was being prepared, there was a lack of data that was specific to the hosting of major sporting events in Vancouver. This still remains the case. (The hypothesis is that the 2010 Games would lead to more major sporting events being hosted after the 2010 Games.)
Results at the Olympic and Paralympic Games and World Championships
Using the available data, the following hypothesis was tested: that more medals are won when Canada hosts the Winter Games (1988 and 2010) than when Canada does not host the Winter Games (all other years). Possible factors include a home advantage and the motivation for Canada, as a whole, to work harder to maintain a positive image as a host country (for example, by supporting more athletes to participate in the Games). Table 56 shows the number of athletes, number of medals, and medals per athlete26 for all Olympic Winter Games since 1924. In 1988 in Calgary, Canada did not appear to enjoy a host advantage – Canada ranked twelfth overall and won five medals (0.045 medals per athlete). In 2010 in Vancouver, Canada won a record 26 medals, had a record number of 202 athletes participating (0.129 medals per athlete), and ranked third overall. Although the records for the 2010 Winter Games suggest that Canada seemed to enjoy a home advantage, a closer look at historical data suggests that the records broken during the 2010 Winter Games are part of a trend since 1988, in which both the number of medals and the rank had been steadily increasing with each consecutive Olympic Winter Game. The number of participating athletes and medals per
24 Other funding assistance programs are also available, such as the Athlete Assistance Program. However, these support living, education, and special needs for individuals who wish to pursue a career as a top athlete (i.e., not for talent development per se). 25 Own the Podium website, Summer and Winter Historical Comparisons, http://ownthepodium.org/Funding.aspx, accessed on February 1, 2013. 26 Calculations such as medals per athlete should be read with caution, as it does not take into account the number of sport disciplines or the number of individual vs. team athletes.

OGI-UBC Post-Games Report Appendix B (So07 – Sport for All and Elite Sport)
210
athlete had generally increased as well (although not as steadily). Since 1988, various federal sport initiatives have been launched that promote sport for all in Canada (e.g., sport is overseen by the Department of Canadian Heritage that was established in 1993), and specifically for top level athletes (e.g., Own the Podium, 2005).27
Table 56: Results for Canada at Olympic Winter Games
Year Location
Number of Athletes Medal Count
Rank
Medals per
Athlete Total Male Female Gold Silver Bronze Total 1924 Chamonix 12 11 1 1 0 0 1 9 0.083 1928 St. Moritz 23 20 3 1 0 0 1 6 0.043 1932 Lake Placid 42 38 4 1 1 5 7 3 0.167
1936 Garmisch-Partenkirchen 29 22 7 0 1 0 1 9 0.034
1948 St. Moritz 28 24 4 2 0 1 3 8 0.107 1952 Oslo 39 31 8 1 0 1 2 9 0.051
1956 Cortina d'Ampezzo 35 27 8 0 1 2 3 9 0.086
1960 Squaw Valley 44 34 10 2 1 1 4 8 0.091
1964 Innsbruck 55 43 12 1 0 2 3 10 0.055 1968 Grenoble 70 55 15 1 1 1 3 14 0.043 1972 Sapporo 47 29 18 0 1 0 1 17 0.021 1976 Innsbruck 59 38 21 1 1 1 3 11 0.051 1980 Lake Placid 59 41 18 0 1 1 2 13 0.034 1984 Sarajevo 67 47 20 2 1 1 4 9 0.060 1988 Calgary 112 82 30 0 2 3 5 12 0.045 1992 Albertville 108 79 29 2 3 2 7 9 0.065 1994 Lillehammer 95 66 29 3 6 4 13 6 0.137 1998 Nagano 144 81 63 6 5 4 15 5 0.104
2002 Salt Lake City 150 85 65 7 3 7 17 4 0.113
2006 Turin 191 108 83 7 10 7 24 3 0.126 2010 Vancouver 202 114 88 14 7 5 26 3 0.129 Data source: Collated from Olympic Winter Games, Canadian Olympic Committee, http://www.olympic.ca, accessed on February 7, 2013.
27 For a detailed analysis of the contribution of government initiatives to athlete participation and performance, please refer to the Vancouver OGI Pre-Games Report.

OGI-UBC Post-Games Report Appendix B (So07 – Sport for All and Elite Sport)
211
Summary and Interpretation of Sport for All and Elite Sport Indicators Limited, cross-sectional data at two points in time (2005 and in the 1990s) suggest that sport participation may have decreased in Canadians aged 15 years and over (in sports clubs) and in Canadian youth aged 5-14 years (in sports activities). However, longer-term data from 1994 to 2007 suggest that more Canadians aged 12 and over were becoming physically active over time. The discrepancy between decreasing sport participation and increasing physical activity suggest that Canadians may be participating in physical activities that are not considered to be “sport” (at least up to 2005). In Canada, education is under provincial jurisdiction and the curriculum is overseen by the province. In BC (and thus Vancouver and Whistler), physical education is mandatory from kindergarten to grade 10, with a recommendation by the BC Ministry of Education that 10 percent of the total instructional time for each school year be allotted for physical education.
Based on data on the Athlete Excellence Fund, over 115 athletes per year from 2008 to 2011 were top four or five in the world. Since 2005, Own the Podium has been supporting talent development to increase medal counts by Canadian athletes at Olympic and Paralympic Summer and Winter Games, with a cumulative budget of $341,634,173 (as checked on February 1, 2013). Although the records broken at the 2010 Winter Games suggest that Canada seemed to enjoy a home advantage, a closer look at historical data suggests that the records broken during the 2010 Winter Games are part of a trend since 1988, in which both the number of medals and the rank had been steadily increasing with each consecutive Olympic Winter Game. Since 1988, various federal sport initiatives have been launched that promote sport for all in Canada, and specifically for top level athletes (e.g., Own the Podium).

OGI-UBC Post-Games Report Appendix B (So08 – Anti-doping Controls)
212
So08 – Anti-doping Controls
Focus Area Purpose (as stated in 2011 OGI)
National anti-doping programme
This indicator measures and describes anti-doping controls in the country and the sanctions taken against athletes and federations having committed an anti-doping rules violation.
National Anti-Doping Programme Data are from the Canadian Centre for Ethics in Sport (CCES) that manages the Canadian Anti-Doping Program (CADP) in compliance with the World Anti-Doping Code. From 1999 to 2003, the CCES published data by calendar year. However, beginning in 2004, the CCES published data by fiscal year (April to March cycle). Therefore, data for the two different types of reporting periods (calendar and fiscal) are not comparable; the analysis is for the period 2004-2005 to 2011-2012. The number of tests conducted on athletes appeared to increase overall from 2004-2005 to 2011-2012 (with some fluctuations) (see Figure 85). During the same period, both the number of infractions and the share of infractions among tests varied without showing strong increasing trends (see Figure 86). The share of infractions among tests remained relatively low at less than 1 per cent, except in the fiscal year 2004-2005.
Figure 85: Canadian Anti-Doping Program (A) (Testing)
Data source: Collated from Anti-Doping, Statistics, Canadian Centre for Ethics in Sport, http://www.cces.ca/en/statistics, accessed on February 8, 2013. Testing statistics are for the Canadian Anti-Doping Program only (does not include contract, fee-for-service). Data are for calendar years 1999 to 2003, and for fiscal years (April to March cycle) from April 1, 2004 to September 30, 2012 (data for January to March 2004 was not published). The above chart does not include data from April 1, 2012 to September 30, 2012 (incomplete fiscal year).
Canadian Anti-Doping Program Testing, 1999 to 2003 (Calendar Year)
0
500
1000
1500
2000
2500
3000
3500
1999 2000 2001 2002 2003
Year (Calendar)
Num
ber o
f Tes
ts
Canadian Anti-Doping Program Testing, 2004 to 2012 (Fiscal Year, April to March Cycle)
0
500
1000
1500
2000
2500
3000
3500
2004-2005 2005-2006 2006-2007 2007-2008 2008-2009 2009-2010 2010-2011 2011-2012
Year (Fiscal)
Num
ber o
f Tes
ts

OGI-UBC Post-Games Report Appendix B (So08 – Anti-doping Controls)
213
Figure 86: Canadian Anti-Doping Program (B) (Infractions)
Data source: Collated from Anti-Doping, Statistics, Canadian Centre for Ethics in Sport, http://www.cces.ca/en/statistics, accessed on February 8, 2013. Testing statistics are for the Canadian Anti-Doping Program only (does not include contract, fee-for-service). Data are for calendar years 1999 to 2003, and for fiscal years (April to March cycle) from April 1, 2004 to September 30, 2012 (data for January to March 2004 was not published). The above chart does not include data from April 1, 2012 to September 30, 2012 (incomplete fiscal year).
Data on the number of infractions were available for all years; however, detailed data on sanctions were only available from 2003 on. Table 57 shows the 10 sports for which there were more than 5 infractions across all years, and the length of the sanctions for infractions beginning in 2003 and after. Most of the sanctions were of less than 5 years duration or were warnings and/or reprimands. Table 58 lists the sports for which there were 1 to 5 infractions across all years. Table 59 lists the sports for which there were no infractions across all years.
Canadian Anti-Doping Program, Infractions, 1999 to 2003 (Calendar Year)
0
5
10
15
20
25
30
35
1999 2000 2001 2002 2003
Year (Calendar)
Num
ber o
f Inf
ract
ions
Canadian Anti-Doping Program, Infractions, 2004 to 2012 (Fiscal Year)
0
5
10
15
20
25
30
35
2004-2005 2005-2006 2006-2007 2007-2008 2008-2009 2009-2010 2010-2011 2011-2012
Year (Fiscal)
Num
ber o
f Inf
ract
ions
Canadian Anti-Doping Program, Infractions (%), 1999 to 2003 (Calendar Year)
0.0%
0.5%
1.0%
1.5%
2.0%
1999 2000 2001 2002 2003
Year (Calendar)
Infra
ctio
ns/T
ests
(%)
Canadian Anti-Doping Program, Infractions (%), 2004 to 2012 (Fiscal Year)
0.0%
0.5%
1.0%
1.5%
2.0%
2004-2005 2005-2006 2006-2007 2007-2008 2008-2009 2009-2010 2010-2011 2011-2012
Year (Fiscal)
Infra
ctio
ns/T
ests
(%)

OGI-UBC Post-Games Report Appendix B (So08 – Anti-doping Controls)
214
Table 57: Anti-Doping Infractions (A) (More than 5 Infractions)
Sport
Number of Infractions
(1999 to Sep. 2012)
Sanctions (2003 and on only)
Life 10-yrs+ 5-9-yrs 1-4-yrs <1-yr
Warning and/or
Reprimand CIS (Canadian Interuniversity Sport): Football
42 0 0 0 22 2 16
Canadian Junior Football 41 0 0 0 10 14 12
Athletics 17 0 0 0 3 4 3 Cycling 14 2 1 0 5 1 3 CCAA (Canadian Colleges Athletic Association): Football
12 0 0 0 1 1 10
Weightlifting 11 0 0 0 3 0 0 Boxing 9 1 1 0 4 0 3 Water Polo 8 0 0 0 3 0 5 Bobsleigh 7 1 0 0 3 1 0 Bodybuilding 7 0 0 0 3 0 1
Data source: Collated from Anti-Doping, Statistics, Canadian Centre for Ethics in Sport, http://www.cces.ca/en/statistics, accessed on February 8, 2013. Testing statistics are for the Canadian Anti-Doping Program only (does not include contract, fee-for-service). Data are for calendar years 1999 to 2003, and for fiscal years (April to March cycle) from April 1, 2004 to September 30, 2012 (data for January to March 2004 was not published). The above chart does not include data from April 1, 2012 to September 30, 2012 (incomplete fiscal year). Detailed data on sanctions were not available before 2003 (1999 to 2002). The number of tests varies across type of sport and year.
Table 58: Anti-Doping Infractions (B) (Less than 5 Infractions) Number of Infractions Sport
4 Junior Hockey, Wrestling 3 CIS: Basketball, CIS: Ice Hockey, Colleges: Football, Speed Skating, Taekwondo, Wheelchair:
Basketball, Wheelchair: Rugby 2 CCAA: Soccer, Duathlon, Equestrian, Judo, Rugby, Triathlon 1 Alpine Skiing, Biathlon, Canoe / Kayak, CIAU: Football, CIS: Field Hockey, CIS: Soccer, CIS:
Volleyball, CIS: Wrestling, CCAA: Basketball, Curling, Ice Hockey, Karate, Lacrosse, Raquetball, Rowing, Sailing, Sledge Hockey, Soccer, Volleyball, Water Skiing, n/a
Data source: Collated from Anti-Doping, Statistics, Canadian Centre for Ethics in Sport, http://www.cces.ca/en/statistics, accessed on February 8, 2013. Testing statistics are for the Canadian Anti-Doping Program only (does not include contract, fee-for-service). Data are for calendar years 1999 to 2003, and for fiscal years (April to March cycle) from April 1, 2004 to September 30, 2012 (data for January to March 2004 was not published). The above chart does not include data from April 1, 2012 to September 30, 2012 (incomplete fiscal year). Detailed data on sanctions were not available before 2003 (1999 to 2002). The number of tests varies across type of sport and year.
Table 59: Anti-Doping (C) - No Infractions (1999 to September 2012) Alpine Skiing - IPC Cricket Ringette

OGI-UBC Post-Games Report Appendix B (So08 – Anti-doping Controls)
215
Archery Cross Country Skiing Roller Sports - Speed Athletics - IPC Cross Country Skiing - IPC Rowing - Adaptive Badminton Cycling - IPC Rugby - 7-a-side Baseball Disabled Sports Shooting Basketball Diving Skeleton Blind: Cycling Fencing Ski Jumping Boccia Field Hockey Skiing - IPC Nordic Bowling Figure Skating Snowboarding Canoe / Kayak - Flatwater Football Softball Canoe / Kayak - Slalom Freestyle Skiing Speed Skating - Short Track Canoeing Goalball Squash CIAU: Basketball Gymnastics - Artistic Swimming CIAU: Cross Country Running Gymnastics - Rhythmic Swimming - IPC CIAU: Ice Hockey Gymnastics - Trampoline Synchronized Swimming CIAU: Rugby Gymnastics - Tumbling Table Tennis CIAU: Soccer Handball Team Handball CIAU: Swimming Inline Hockey Ten Pin Bowling CIAU: Track & Field Judo - IBSA Tennis CIAU: Wrestling Lawn Bowls Volleyball - Beach CIS: Athletics Life Saving Wheelchair: Archery CIS: Cross Country Luge Wheelchair: Athletics CIS: Rugby Modern Pentathlon Wheelchair: Curling CIS: Swimming Netball Wheelchair: Fencing CIS: Track & Field Nordic Combined Wheelchair: Tennis CCAA: Badminton Pentathlon Yachting CCAA: Volleyball Powerlifting
Data source: Collated from Anti-Doping, Statistics, Canadian Centre for Ethics in Sport, http://www.cces.ca/en/statistics, accessed on February 8, 2013. Testing statistics are for the Canadian Anti-Doping Program only (does not include contract, fee-for-service). Data are for calendar years 1999 to 2003, and for fiscal years (April to March cycle) from April 1, 2004 to September 30, 2012 (data for January to March 2004 was not published). The above chart does not include data from April 1, 2012 to September 30, 2012 (incomplete fiscal year). Detailed data on sanctions were not available before 2003 (1999 to 2002). The number of tests varies across type of sport and year.
Summary and Interpretation of Anti-doping Controls Indicators
Between 2004-2005 to 2011-2012 (fiscal year, April to March cycle), the number of tests conducted on athletes appeared to increase overall, while the number of infractions and the share of infractions among tests varied without showing strong increasing trends. The share of infractions among tests remained relatively low at less than 1 per cent (except in the fiscal year 2004-2005). More than 5 infractions across all years occurred for 10 sports, with most sanctions (data for 2003 and on only) lasting less than 5 years or being warnings and/or reprimands. Few or no infractions occurred in most sports that were tested.

OGI-UBC Post-Games Report Appendix B (So09 – Olympic Induced Housing)
216
So09 – Olympic Induced Housing
Focus Area Purpose (as stated in 2011 OGI)
Olympic induced housing
This indicator measures, in quantitative terms, the net increase in housing related to the Olympic and Paralympic Games. It measures the total net floor area of residential housing built or renovated directly (Olympic Village(s) and Media Village(s)) or indirectly (housing planned within urban regeneration or new developments linked to the Olympic Games).
Olympic Induced Housing The only permanent Olympic-induced housing was at the Olympic and Paralympic Villages (in Vancouver and in Whistler). No residential floor area was lost in order to develop the two Villages, as the Vancouver Village was built on a previous industrial site and the Whistler Village was built on a previous landfill site. No data on new residential floor area were available for either of the Villages. The Vancouver Village is part of a larger, city development project for an area known as Southeast False Creek. The Vancouver Village has been converted to about 1,100 residential units.28 The Whistler Village is part of a new neighbourhood known as Cheakamus Crossing, and includes 20 town homes and approximately 30 fully accessible condos.29
28 Olympic Village, City of Vancouver website, http://vancouver.ca/home-property-development/olympic-village.aspx, accessed on March 7, 2013. 29 Whistler Athletes’ Village, Resort Municipality of Whistler website, http://www.whistler.ca/2010-games/venues/whistler-athletes-village, accessed on March 7, 2013.

OGI-UBC Post-Games Report Appendix B (So10 – Media and the Host City Image)
217
So10 – Media and the Host City Image
Focus Area Purpose (as stated in 2011 OGI)
Host city’s media image
The aim of this indicator is to assess perceptions on the pre- and post-Olympic image of the city, region and country through a quantitative analysis of the media. Monitoring the indicator throughout the phases of the Olympic and Paralympic project and until three years post-Games will reveal the influence of the Games on this image.
Host City’s Media Image No new data were available since the Vancouver OGI Games-time Report (unable to obtain post-Games data using the same methodology as before). Therefore, the data presented here are from the Games-time Report. (However, a possible hypothesis would be that the Games would improve the media image of the Host City, especially when it is first announced that the city will host the Games, during the Games, and shortly after the Games.) A list of articles was obtained from IOC Media Services, which compiled a representative panel of the world’s media (60 articles) from February 9, 2010 to March 8, 2010 for the purpose of creating a press synthesis for the IOC Coordination Commission of the Olympic Games. The articles themselves were then retrieved by the OGI-UBC team and assigned one of the following ratings that represent their tone, use of themes, and framing of issues relevant to the host city, region, and country (see Table 60 for composite ratings across news sources): 1 = Exceedingly negative (e.g., “worst Games ever”)
2 = Negative (e.g., “increasing criticism) 3 = Neutral
4 = Positive (e.g., “bringing the city to life”) 5 = Exceedingly positive (e.g., “greatest ambiance”)
The articles did not mention people with disabilities (note: the 2010 Paralympics Winter Games were from March 12 to March 21, 2010).
International news media coverage of the Olympic Games viewed the death of Georgian luger Nodar Kumaritashvili as a tragedy, with a few allusions to track safety (negative). Around the world, positive news articles brought attention to the unrivaled ambiance and enthusiasm of Canadians. The British press was highly critical of Vancouver’s efforts, calling the 2010 Olympics the “worst ever,” focusing heavily on weather conditions, a technical glitch in the opening ceremony, and issues of canceled tickets. Articles surrounding the conclusion of the Games were largely positive, drawing attention to Canada’s Olympic successes and the unrivaled atmosphere in Vancouver. While early reports drew negative attention to Vancouver’s organizational capabilities, the articles towards the end of the Olympic Games report the experience as a much more positive one.

OGI-UBC Post-Games Report Appendix B (So10 – Media and the Host City Image)
218
Table 60: Host City's Media Image
Source Type Country Language Circulation1Number of
ArticlesComposite
RatingNorth America
Associated Press Wire Service USA English DNAA 5 3.4Boston Globe Newspaper USA English 222,6832 3 5.0The Economist Newspaper USA English 137,1153 1 2.0The Huffington Post News website USA English DNAA 1 3.0Los Angeles Tmes Newspaper USA English 600,4492 2 3.5The New York Times Newspaper USA English 876,6832 2 3.5The Philadelphia Inquirer Newspaper USA English 342,3612 2 3.5Reuters Wire Service USA English DNAA 9 3.7Sports Illustrated Magazine USA English 535,3794 1 2.0USA Today Newspaper USA English 1,830,5942 3 4.3The Wall Street Journal Newspaper USA English 2061,1422 1 3.0The Washington Post Newspaper USA English 545,3452 2 3.5
32 3.6Europe
Agence France Presse Wire Service France French DNAA 7 3.1BBC Sport Broadcast UK English DNAA 1 4.0Daily Mail Newspaper UK English 2,002,3785 1 3.0The Daily Telegraph Newspaper UK English 658,1725 3 2.7Die Welt Newspaper Germany German 254,7856 1 4.0Financial Times Newspaper UK English 383,0677 1 2.0Frankfurter Rundschau Newspaper Germany German 150,1008 1 4.0The Guardian Newspaper UK English 273,3845 3 2.3Independent on Sunday Newspaper UK English 100,9015 1 2.0L'Equipe Newspaper France French 473,7319 1 3.0Le Temps Newspaper Switzerland French 45,50610 1 5.0The Times Newspaper UK English 479,6265 3 2.0
24 2.9Australia
The Age Newspaper Australia English 190,10011 2 3.0The Australian Newspaper Australia English 136,26811 2 1.5
4 2.0Total 60 3.3
1 All sources were accessed in January 2011.
4 Audit Bureau of Circulations for January to December 2010: http://www.huffingtonpost.com/2010/08/09/the-20-biggest-magazines_n_676017.html#s124664&title=13_Sports_Illustrated.
3 Audit Bureau of Circulations for January to December 2010: http://www.huffingtonpost.com/2010/08/12/the-biggest-news-magazine_n_680468.html#s126027&title=undefined.
9 Association Pour La Controle de la Diffusion des Medias for 2010: http://www.ojd.com.
2 Audit Bureau of Circulations, March to September 2010: http://abcas3.accessabc.com/ecirc/newstitlesearchus.asp.
5 Audit Bureau of Circulations, July to December 2010: http://www.telegraph.co.uk/multimedia/archive/01809/ABC-DEC-2010_1809909a.pdf.
7 Audit Bureau of Circulations, January AVG 2011: http://www.pressgazette.co.uk/story.asp?sectioncode=1&storycode=46681&c=1.
10 REMP for 2009: http://www.eidosmedia.com/EN/Page/Uuid/779809e4-002b-11df-8263-73ec7e0d6bd2/01_LeTemps_mobile.xml.
6 MA Pressemedien for 2010: http://www.publicitas.com/de/austria/media-news/news-detail/?PARAM1=43873.
8 PressEurop for 2009: http://www.presseurop.eu/en/content/source-information/556-frankfurter-rundschau.
11 Audit Bureau of Circulations, July to September 2010: http://media.crikey.com.au/wp-content/uploads/2010/11/circulation.pdf.

OGI-UBC Post-Games Report Appendix B (So11 – Professional Sport Education for People with Disabilities)
219
So11 – Professional Sport Education for People with Disabilities
Focus Area Purpose (as stated in 2011 OGI)
Professional sport education for people with disabilities
This indicator measures the number of people with qualifications, according to national standards, certified to provide physical education and sports services to people with disabilities and/or athletes. The indicator also measures the quantity and type of courses available in this field.
Professional Sport Education for People with Disabilities
In Canada, certification for all types of coaches (community sport, competition, and instruction) is through the National Coaching Certification Program (NCCP) that is delivered in partnership with the federal and provincial/territorial governments and national and provincial/territorial sport organizations. There is no certification specific to coaching sport for people with disabilities. However, the Coaching Association of Canada (www.coach.ca) has published a resource manual titled Coaching Athletes with a Disability (2005). The purpose of the manual is to “provide grassroots coaches who have never worked with athletes with a disability with basic information, guidelines, and tips that will assist in creating conditions for effective participation and inclusion.” The non-technical manual focuses primarily on aspects that are likely to be encountered by all coaches, regardless of the sport or the disability, and includes: stages coaches may go through when working for the first time with an athlete with a disability; first contact; communication and interaction; inclusion and integration; accessibility; and words of advice from the experts. The manual suggests that coaches can obtain more technically oriented information through National Sport Organizations or organizations that offer specific programs for athletes with a disability.

OGI-UBC Post-Games Report Appendix C (So12 – Health and Safety)
220
So12 – Health and Safety
Focus Area Purpose (as stated in 2011 OGI)
Health and safety This indicator measures whether health and safety management practices are resulting in fewer health and safety incidents during all phases of the Olympic and Paralympic Games.
Health and Safety This is a new OGI indicator introduced in 2011. Data are from VANOC and relate to any VANOC venue or other operational site and employees, volunteers, and contractors. Between August 1, 2005 and March 31, 2010, a total of 128 health and safety incidents were reported to WorkSafeBC (Workers’ Compensation Board of BC).30 No trend is apparent in the number of reported incidents over time (the number of reported incidents is more likely to be related to the intensity of construction and operations than to the course of time). None of the reported incidents led to loss of life or limb (fatal or serious incidents).
Table 61: Number of Workplace Health and Safety Incidents Reported to WorkSafeBC
Reporting Period1
Number of Reported Incidents
Total Lost-time
Injury
Potential to Result in
Injury Structural
Failure Loss of Life or
Limb 2005-20062 1 n/a3 n/a3 n/a3 n/a3 2006-20074 18 10 7 1 n/a3 2007-20084 43 27 16 0 0 2008-20094 17 n/a3 n/a3 n/a3 0 2009-20104,5 49 n/a3 n/a3 n/a3 0 1 The reporting period for 2009-2010 was from August 1, 2009 to April 30, 2010. The reporting cycle for all previous reports was from August 1 to July 31 of the following year. 2 Detailed data were not available for 2005-2006, although the VANOC Sustainability Report 2005-2006 (p.48) mentioned one serious work-related injury at the Richmond Olympic Oval site. 3 “N/a” means that detailed information on this aspect of the data was not provided for that reporting period, e.g., data were not available for external contractors on lost-time. 4 Data source: VANOC Sustainability Report 2009-2010 (p.17). 5 Data for the reporting period 2009-2010 was only for up to the end of March 31, 2010, based on reports filed with WorkSafeBC as at April 28, 2010.
30 Not all accidents require reporting
g to WorkSafeBC. The following accidents are required to be reported – any accident that: 1) resulted in serious injury to or the death of a worker; 2) involved a major structural failure or collapse of a building, bridge, tower, crane, hoist, temporary construction support system or excavation; 3) involved the major release of a hazardous substance; or 4) was an incident required by regulation to be reported.

OGI-UBC Post-Games Report Appendix C: OGI Methodology
221
Appendix C: OGI Methodology By Robert VanWynsberghe
Preamble: The following is an excerpt from a paper entitled The Olympic Games Impact (OGI) study for the 2010 Winter Olympic Games: Strategies for evaluating sport mega-events’ contribution to sustainability by Robert VanWynsberghe PhD. VanWynsberghe is the lead researcher on the 2010 edition of OGI. This excerpt presents the OGI critiques that exist in the sport mega-events impacts literature. It then explains how the 2010 OGI researchers have addressed the methodological critiques by: i) connecting indicator data to public policy objectives; ii) positing a provisional means to create a sustainability standard and; iii) comparing changes in the indicator data in the Host to non-Host jurisdictions. This excerpt is attached in Appendix because these strategies are of interest to future prospective Olympic Host cities, researchers of mega-events and their impacts, and practitioners who evaluate urban sustainability. INTRODUCTION In 2008, the Vancouver Organizing Committee for the Olympic and Paralympic Winter Games (VANOC) contracted the University of British Columbia (UBC) as an independent research institution to execute the OGI study beyond the baseline report (which was prepared by the Fraser Basin Council31). Part of the initial research involved finding and analyzing methodological critiques of OGI in the literature. The following is a summary of these critiques. It is not meant to suggest that all the critiques are equally valid. Indeed some appear to reflect pre-existing biases, including a puzzling “this is too complex” epistemological stance; however, all were included in the spirit of dialogue. OGI is new and, on authorial note, the IOC is open to its being improved. Dialogue is also critical to the numerous international sport organizations that are seeking bids that promise efforts to evaluate impacts to enhance sustainability in the Host region.
The first critique is that the 12 years (i.e., 9 years pre-event and 3 years post-event) of data gathered for the OGI study is not long enough to measure longer-term impacts of the event (Kirkup and Major, 2006; Mangan, 2008), which may take as long as 10-15 years to appear (Leonardsen, 2007; Gratton and Preuss, 2008). The Technical Manual specifies that the study ends three years after the Games and suggests that Hosts can independently measure Games impact after the OGI study ends and no-one has done this longitudinal follow up. The second critique is that the OGI study, by not drawing on qualitative data, cannot be used to understand the local social construction of reality (local perceptions and experiences) (Leonardsen, 2007). Broadly speaking, indicators may be viewed as “quantities that reveal qualities” (Cobb and Rixford, 1998, p.14), that for Leonardsen, suggests that the data for the OGI indicators are 31 The Fraser Basin Council is a non-governmental, not-for-profit, non-partisan organization whose mandate is to ensure that the social, economic, and environmental sustainability of the Fraser Basin area in British Columbia will be protected into the future. Vancouver/Whistler, which hosted the 2010 Olympic Games, is part of the Fraser Basin area.

OGI-UBC Post-Games Report Appendix C: OGI Methodology
222
numerical and quantitative and, therefore, not qualitative. The Technical Manual does not explicitly outline how qualitative data may be used in the OGI study. The third critique acknowledges the fact that attributing impact remains a challenge (Leonardsen, 2007). The OGI Technical Manual acknowledges that “identifying and attributing direct causality to the Games is very difficult and complex” (p.26), but does not suggest a method for dealing with attribution such as adequacy, plausibility or probability assessment. The fourth critique is that the OGI study does not take into consideration impacts beyond the spatial limits of the Host, for example, of another adjacent locale or country; however, the methodological challenge to undertake such research is acknowledged (Leonardsen, 2007). In the OGI study, the spatial boundaries are local, regional, provincial (or state) and national. The fifth critique is that the OGI study does not assess sustainability in a comprehensive or integrated way (Holden, MacKenzie and VanWynsberghe, 2008). Unlike most studies of mega-event impacts that focus on a single sphere of activity (economic, environmental, or socio-cultural), the OGI study includes all three spheres. Integration would not take away from any analysis or appreciation of a category of impacts (e.g., social). What is meant by integration is perhaps best understood in considering the possibility of a trajectory of types of impacts where, for example, social impacts tend to be experienced before the event, that is, during the planning and building phases of the event. This kind of knowledge would be important to mitigating negative impacts. However, the Technical Manual does not outline how social impacts X or Y can be integrated together to offer an overall analysis of Games impacts in relation to sustainability.
The experience of conducting the OGI study for the 2010 Games provides two new critiques. The first (and sixth overall) is that the OGI study lacks a sustainability ‘standard’ against which an evaluation of the impacts of the Games can be undertaken. In the OGI study, the indicators reflect, to use Green and Kreuters’ language, “objects of interest” (e.g., energy use), while the standard of acceptability is sustainability. The critique is that while the Games aim to reach a “standard of acceptability” (i.e., they aim to be sustainable), they lack explicit and specific statements about the amount and timing of improvement that would indicate when the Games were indeed reaching that standard of being sustainable. In other words, without a sustainability standard, evaluation is impossible because the “objects of interest” cannot be compared against a “standard of acceptability.” The seventh and final critique is that the OGI Technical Manual does not outline how Host context can be incorporated into data analysis and interpretation. Various researchers have reported evidence that suggests that Host context, such as infrastructure (Gratton, Shibli and Coleman, 2006, Liao and Pitts, 2006) and sense of community (Smith, 2009), may affect impacts (Leonardsen, 2007; Dolles and Söderman, 2008). However, these same researchers provide little guidance on how to incorporate Host context into data analysis and interpretation. The OGI Technical Manual also provides little guidance, yet does acknowledge Host context through its context indicators. In sum, a variety of critiques have been made in the literature about the OGI study. These include assertions that OGI involve more time, geography and qualitative data. Indicting OGI on claims of comprehensiveness are plausibly related to a lack of knowledge about what a sport

OGI-UBC Post-Games Report Appendix C: OGI Methodology
223
mega-events can impact and how.32 The following three sections attempt to address the foregoing critiques. The individual sections are not aligned with particular critiques, but match with multiple ones. The key focus is on OGI’s main challenge in showing that the Games are responsible for changes in the Host and whether the Games can be considered sustainable or not. Attribution is the ability of the analysis to distinguish between the contribution of an intervention (or event) to observed outcomes vs. the contribution of external factors, bias, or chance (Habicht, Victora and Vaughan, 1999). Through a process of eliminating potential factors, the goal is to reduce uncertainty over how much, if any, the event contributed to the observed impacts
Assessing the Attribution of Host Context through Leveraging
In the 2010 pre-Games report (OGI pre-Games Report on 2010 Olympic and Paralympic Winter Games, 2009), a technique that reviewed government efforts to use the Games for public policy purposes was established. The original purpose of this strategy was to select a subset of indicators that were predisposed to be affected by the Olympic Games due to efforts aimed at producing change. We entitled this technique “bundling”. Subsequent data analysis (VanWynsberghe, Derom and Maurer, 2012) invoked sport management’s burgeoning concept of leveraging to provide a more powerful tool for explaining host context as an intervening factor in the Games’ impacts. It should be explained that the bundling approach also has its basis in arguments presented in the mega-events literature that longer-term impacts of mega-events will only occur if there is a relevant, long-term, well planned, and effectively managed effort to produce impacts (Kirkup and Major, 2006; Liao and Pitts, 2006; Muñoz, 2006). Together bundling and leveraging argue that change can be more expected to happen when there is a driving force intended to produce change rather than in the absence of such a force. An example is government, who is a stakeholder that intentionally attempts to leverage the Games to achieve educational, health or environmental goals. Leveraging sport mega-events are an emergent research area and there is a dearth of research on government and others’ efforts at, “[B]eing proactive in planning for the creation of specific event benefits for the host community” (O’Brien and Chalip, 2007 p. 320). In 2006, Chalip generated an exploratory framework of leveraging that theorizes that sport mega-events generate powerful resources, for which novel strategies can be designed to make use of. Understood in terms of the Olympic Games, the crux of Chalip’s theoretical framework is that phenomena that are central and unique to the Olympics, such as the sense of solidarity that accompanies the once in a lifetime nature of the event will bring to the fore social values of civic pride, individual character development, and athletic competition. Leveraging is used to theorize the municipal, provincial and federal governments’ efforts to activate the economic and social resources of hosting the Games to achieve public policy objectives. These leveraging efforts are important to Games attribution because changes in indicator-related trends can be linked to the Games via the leveraging efforts.
32 This is, of course, related to a lack of understanding about sport mega-events’ constitutive elements. There is a critical need for these properties to receive elucidation.

OGI-UBC Post-Games Report Appendix C: OGI Methodology
224
Studying leveraging for the pre-Games report, led to the discovery and analysis of fifty government initiatives across three levels of government (City of Vancouver, Province of British Columbia, and Government of Canada) between 1998 (when it was announced that Vancouver would bid for the 2010 Games) and 2008 (when the research was conducted) that were explicitly stated to be leveraging the Games (OGI pre-Games Report on 2010 Olympic and Paralympic Winter Games, 2009). Using these initiatives as a basis, those OGI indicators that would most likely be affected by these policy initiatives were identified. The next step involved bundling together the OGI indicators that were i) thematically interrelated and ii) targeted by multiple initiatives. This bundling method can also be found in similar work of Kasanko et al. (2005), who used five sets of indicators (one to three indicators per set) to study sustainability in fifteen European cities. They argued that, while indicators have their strengths and weaknesses, when used in parallel they enable a more thorough tool for analysis (c.f. Taylor, 2005).
In terms of the indicator data, the bundling/leveraging technique cannot guarantee that the OGI indicators being used as outcome measures of a policy are the best ones available. Rather, these particular indicators are used because OGI prescribed them. It must also be understood that just because a set of OGI indicators are brought together and entitled something (e.g., community engagement) does not mean that the concept of community engagement is completely analyzable in all its dimensions. For example, protest might be an important element of community engagement, but there is no guarantee that it is prescribed in the Technical Manual or collected in the Host region.
An illustrative example of the bundling strategy involved was a socio-cultural bundle entitled “Progress in elite amateur sport in Canada” (OGI pre-Games Report on 2010 Olympic and Paralympic Winter Games, 2009). This bundle combines the following three OGI indicators: So19 Results at the Olympic/Paralympic Games and World Championships; So16 Top-Level Sportsmen and Women, and So18 World and Continental Championships. As a package, these three indicators measure national and regional changes in the athletic development of Canadians in the Games era. The context for this bundle are government initiatives like Own the Podium and Podium Canada whose collective objective is to achieve excellence in Canadian sports. For example, in 2006, Canadian athletes won a record of 24 medals, 7 medals more than the previous Winter Games in 2002. This record was three years after Vancouver was selected as a host city, and two years after Own the Podium was launched. A plausible inference is that this increase in medals is in part a result of the Canadian Governments’ initiatives (Own the Podium and Podium Canada) that aim to improve athletes’ performance at the upcoming Games in 2010. Figure 1 reveals that the trend continued in 2010 with more medals, including 14 gold, which doubled the previous Canadian record of 7. To investigate the plausibility of this hypothesis, we compared the increase of seven medals between the two consecutive Games of 2002 and 2006 relative to the number of athletes, (i.e., were more medals won because there more athletes?). While there were only three more Canadian athletes at the 2002 Games than at the 1998 Games, there were 38 more athletes at Turin in 2006 than at the previous Games. A calculation of medals per athlete suggests that the increase in medals in 2006 over 2002 was not simply a result of an increase in the number of competing athletes. While there was an increase in medals per athlete of approximately 0.011 between 1998 and 2002, the increase between 2002 and 2006 is 36 percent larger, at 0.015 medals per athlete. Data for total medal count per sport discipline for Canada similarly suggest

OGI-UBC Post-Games Report Appendix C: OGI Methodology
225
that the increase in medals was not simply due to a larger number of competing athletes. Canadian athletes won 1.6 medals per discipline in 2006, compared to 1.25 medals per discipline in 1998 (an increase of nearly 30 percent for the eight year period). The research ascertained, using the bundling technique that the overall rise in Canadian medals over the past three Olympic Winter Games is virtually all due to an improved performance of female athletes. In Turin in 2006, Canadian women won an impressive count of 16 medals (compared to 8 in Nagano in 1998 and 9.533 in Salt Lake City in 2002), while Canadian men won 8 medals, which was half as many as women athletes that year (men won 7 medals in 1998 and 7.5 medals in 2002). The medals count per female athlete has steadily increased from 0.13 in 1998, to 0.14 in 2002, to 0.18 in 2006. At the same time, the performance of male athletes remained stable at approximately 0.07-0.08 medals per male athlete. This difference between male and female athletes does not appear to be related to an increased female-to-male ratio of participation in the Olympic Games. If anything, the number of male athletes increased more than that of females between the last Games in 2006 and the Games prior in 2002. Again, however, it should be noted that if male athletes participate (and win) more in team sports than female athletes do, this difference in performance by gender might be less pronounced. Overall, the data show a definite increase in medals won by Canadian athletes at Olympic Winter Games between the years of 1998 and 2006.
Bundling helps identify impacts that are more likely to happen because they were induced by government efforts that identified local priorities (rather than by happenstance). Bundling also helps to locate hard to find impacts, delimit the number of possible contextual factors to investigate, amplify impacts found, and detect impacts in a sea of indicators. It is further reasonable to suggest that leveraging the sport mega-event for sustainability is a precursor for detecting some impacts that identify change towards sustainability in the Host and beyond. From a practical perspective, it is feasible to obtain and review government policy documents and thereby detect outcome measures of the impact of the 2010 Games. What might be more exciting is the possibility that the presence of IOC policy in the form of OGI might encourage prospective hosts to introduce leveraging initiatives (i.e., policies, but also programs, projects and pilots) that increase sustainable practices.
Addressing Attribution through a BACI method We chose a modified version of the before-and-after-control-impact method (BACI;) that has been used to assess the environmental impacts of unplanned incidences (or events) (cf., Manly, 2001). The BACI method compares the location where the event takes place with ‘control’ locations that are as similar as possible to the place where the event happens. BACI addresses the critique that vertical and horizontal comparisons, and therefore the attribution of impact, remain a challenge, including for the OGI study. BACI is akin to health’s cohort or case control studies. Cohort studies compare the treatment group with another group that has not been affected by the condition and case control studies compare patients who already have a specific condition with
33 In 2002, Canada won a mixed-pairs skating competition, hence the half medal.

OGI-UBC Post-Games Report Appendix C: OGI Methodology
226
people who do not. The use of BACI comparisons in our analysis helps reduce the level of expected uncertainty in attributing impact (or lack of impact) to the 2010 Winter Games. The chosen control locations serve as a natural ‘baseline’ against which the event site is compared. The general idea of the BACI method is to establish a change in the difference between the event and control locations, before and after the event. The BACI method uses a two-stage process for comparing the event site with a control site. The first stage looks at trends and divergences between the event site and the control site (ideally measured at several points in time) before the event takes place; these reflect ‘normal’ conditions (no event). The second stage looks at divergence between the event site and the control site after the event (again ideally measured at different points in time) and compares this with divergence between the sites before the event. If the post-event divergence between sites is deemed sufficiently large compared to the pre-event, ‘normal’ divergence between sites, and no alternative explanations for the divergence are found (e.g., unforeseeable dynamic changes that affect one site but not the other), it is possible to conclude that, with varying degrees of certainty, the observed post-event divergence may have been caused, at least in part, by the event. Thus it is important to recognize that attributing impact to the Olympic Games is a matter of informed judgment – not proof of cause – that depends on the magnitude of the observed change and the plausibility of alternative explanations.
For the 2010 pre-Games analysis (OGI pre-Games Report on 2010 Olympic and Paralympic Winter Games, 2009), the event whose impact was being investigated was the selection of Vancouver as an Olympic Games Host in 2003. Thus, ‘before’ the event means pre-2003, while ‘after’ the event means post-2003.
Regarding the control component of the BACI method, the control locations for the city of Vancouver (a city in western Canada) were the western Canadian cities of Victoria, Calgary, and Edmonton. Additionally, trends were analyzed at four levels – city, region, province, and country. These scales were those prescribed in the Technical Manual. Using Western Canadian locales for comparison allowed us to control to some degree variations in political structure, geography, and economic variations. The control location for the region of Metro Vancouver was the Greater Toronto Area, which is also an urban and growing regional district with relatively similar issues (e.g., homelessness). The control location for the province of British Columbia was the province of Alberta (and occasionally Ontario), which is also a resource-based economy with lots of urban growth and in-migrations. The control location for the country of Canada was where possible, the U.S.A. The BACI technique is illustrated in the 2010 pre-Games report in the indicator “Dynamic of Service Activities” which measures the economic attractiveness of a country – whether it is a net exporter or importer of services, and the relative significance of the net balance of services as a proportion of the gross domestic product (GDP). Net data for the five-year period 2001-2006 found that Canada was a net service importer, i.e., more imports than exports, while the U.S. (control site) was a net service exporter; however, the lack of available itemized data on specific services that might be affected by the Games, such as tourism, prevented disentangling potential Games impacts for this indicator. At the end of the five-year period (2006), Canada had an even larger negative net balance than previous years during that period. The analysis was unable to isolate any potential effect of the Olympic Games on this net balance from alternative

OGI-UBC Post-Games Report Appendix C: OGI Methodology
227
explanations such as the Canadian dollar being particularly strong relative to the U.S. dollar during 2006, thus making Canada an unattractive place in terms of foreign tourist spending.34
By using BACI, we were able to compare pre- and post-event differences between the event in question and control sites. BACI permitted us to work towards reducing uncertainty over attribution. BACI generally worked well when data were available and displayed larger differences between event and control sites. These conditions however, were not always present. The two challenges to using BACI to reduce uncertainty over attribution were a lack of available data and an inability to exclude alternative explanations about impact. With respect to the feasibility of using BACI, comparative data were not always available to conduct a BACI analysis and some data were easier to find than others. Conducting a BACI analysis also requires additional time that may not have been anticipated (or planned); the OGI Technical Manual does not specify that comparative analyses be conducted. Despite these challenges, the BACI method helped decrease uncertainty over impact attribution.
Addressing Attribution through a Scorecard Approach In order to attribute Games’ impacts to changes in sustainability, a scorecard was conceived for the pre-Games report (OGI pre-Games Report on 2010 Olympic and Paralympic Winter Games, 2009). Benchmarking is a related term, (cf. Behr and Cierjacks, 2010), but the term scorecard is employed here to emphasize the developmental and experimental aspects of this endeavour. The idea is scores are assigned to individual indicators and these scores were “rolled up” into the aforementioned bundles, and then spheres (economic, environmental, and socio-cultural) in order to produce an overall impact (see OGI Technical Report). At the indicator level, three scores are determined: an impact score (magnitude and direction of change); a reliability score; and a ‘conclusivity’ score (researcher’s level of confidence in the reported outcomes). These three scores are then mathematically aggregated to yield attribution scores for bundles, spheres and overall impact. At the aggregate levels (bundle, sphere, and overall impact), reliability and conclusivity were again determined. These were averages of their respective sub-levels, while impact score is a weighted average that simultaneously takes into account both the reliability and conclusivity of its sub-levels. Each of the bundled indicators is assigned a reliability weight that ranges from 0.2 to 1.035 and reflects our assessment of the data in both quality and availability. Using reliability weights allows us to correct for overestimating impact due to imperfect data. Conclusivity uses a binary rating (either 0 or 1) and reflects whether or not the outcome/conclusion of impact can be trusted based on the data and indicator specifications. A conclusivity rating of 0 for an indicator assigned by the researchers means that no conclusion has
34 Note that this situation is not the same as registering change that we conclusively show had nothing to do with the Olympic Games (i.e., finding change that the Olympic Games had nothing to do with – or were highly unlikely to have anything to do with). In contrast, in the case described above we simply lacked enough information to allow us to conclude decisively one way or the other (i.e., impact attribution was impossible). 35 Although a reliability weight of zero (data that are completely unreliable) is theoretically possible, these data would in practice not be analyzed.

OGI-UBC Post-Games Report Appendix C: OGI Methodology
228
been reached after analyzing the data.36 (Mathematically, a conclusivity score of 0 removes the impact score of that indicator from further aggregation. This is a conservative solution that precludes biasing the overall impact.) A conclusivity rating of 1 means that some conclusion is offered (i.e., we feel confident enough to offer a conclusion), but should not be interpreted as a ‘100 percent certainty’ in that conclusion (which is impossible to reach given the methodological nature of our analysis).
The scorecard approach outlines a method for integrating analyses of indicators, bundles, and spheres to arrive at a conclusion about the overall impact of the 2010 Games that is based on the reliability of data and the ability to make conclusions about attribution (conclusivity). The scorecard addresses the critique that the OGI study, as outlined in the Technical Manual, does not detail how an integrative analysis could be conducted. For the pre-Games report, for example, the indicator Size of Companies was assigned an impact score of 1, a reliability weight of 0.8, and a conclusivity score of 1. This means that some positive change in the Size of Companies can be attributed to the Olympic Games based on reliable data and confidence about the conclusion. Overall, the Olympic Games are, at the pre-Games stage in 2010, making a slight positive Games impact (0.4). The slightly positive impact was mostly due to the economic and socio-cultural spheres. The Games have had a weak positive impact on the social-cultural sphere. For the environmental sphere, reliable data attests that indicators in this sphere have been mostly unaffected, or minimally affected in a negative way (again, with sufficient conclusivity). Finally, the Games appear to have had a marginally positive impact on the economic sphere. CONCLUSIONS AND IMPLICATIONS An analysis of OGI and its critiques suggest that OGI has the potential to become a summative evaluation tool that increases knowledge concerning attribution. The three strategies (bundling, BACI, scorecard) described in the paper could be used to address the methodological challenges of OGI. Bundling/leveraging combines indicators that circumscribe a specific impact area with the policies designed to mediate them provides a more powerful basis on which to make recommendation on the plausibility of hypothesizing, testing, and uncovering Games impact. BACI reduces uncertainty over attribution and, in facilitating comparisons with other like regions, provides clues about Host region’s logic for seeking a sport mega-event. The scorecard approach makes it possible to assign ratings of reliability and conclusivity with little difficulty, and calculate scores using an automated mathematical formula. The scorecard appears to offer one technique for establishing a sustainability standard for the current edition, which can, in turn, be compared over editions. Confidence in supporting a revised OGI evaluation tool is partially derived from the 2012 pre-Games OGI report (OGI pre-Games Report on 2012 Olympic and Paralympic Summer Games, 2010). The OGI researchers for London 2012 borrowed from and endorsed the 2010 model in rating their indicators according to relevance, impact, and confidence in conclusion. In addition, the product of combining these scores produced a sustainability score for each indicator and a final sustainability score by the London research team. 36 In practical terms, this means that either further data or re-specification of the indicator could be used to resolve the problem, but at the current stage assessing Olympic Games impact for that indicator is impossible.

OGI-UBC Post-Games Report Appendix C: OGI Methodology
229
The relevance criterion is an innovative idea that moves OGI in an important direction. Relevance weights the possibility of a Games effect on the indicator data in light of the 2012 legacy promises (OGI pre-Games Report on 2012 Olympic and Paralympic Summer Games, 2010, p. 14-15). London 2012 is considered to be an example of legacy planning (Girginov and Hills, 2008; Girginov and Hills, 2009; Bloyce & Smith, 2010). Legacies are seen as long-term, planned, and evaluated (Furrer, 2002; Taylor and Edmondson, 2007; Gratton and Preuss, 2008). It should be noted that some leveraging advocates question the existence of legacy planning (Chalip, 2006; O’Brien and Chalip, 2007). For 2012, legacy promises have been made explicit and focus on transforming parts of London, encouraging physical activity, including sport, volunteering, and the showcasing of London as an inclusive and open city as regards tourism and other businesses. The clarity of the legacy promises makes it possible for the 2012 OGI group to include the legacy promises as a moderating factor in the Games impacting the Host region. In terms of future research, linking trends in OGI indicator data and legacy planning offer exciting possibilities for more comprehensive theory of sport mega-events that could, in turn, inform a more ambitious OGI and enhance the analysis of mega-events (Coalter, 2004). The evidence generated would allow future research to know that the relationship among context and impacts are important factors in a locally meaningful evaluation of the impact of events according to a sustainability standard. In addition, as of yet, there is no visual depiction of these types of relationships. As a result, questions remain about how and to what degree host contexts affect the type, direction, and magnitude of impacts, and about what factors, such as planned legacies (vs. assumed legacies), moderate these relationships. Predictably, given the above, Girginov and Hills (2008) point out that there is a dearth of information on the actual process of envisioning, framing, and implementing Olympic legacies; however there are two frameworks (Hiller, 1998; Preuss, 2007), which are useful because they eschew the simple categorizations of impact into the three spheres of sustainability. Hiller’s framework (1998) distinguishes three types of linkages, or effects, of mega-events – forward linkages (effects caused by the event), backward linkages (background objectives that rationalize the event), and parallel linkages (side effects that are residual to the event itself and not directly under the control of event organizers). Forward linkages tend to dominate the literature because they are the first to be identified and are often represented in quantifiable terms; however, it is the backward and parallel linkages that speak to the kinds of policy consolidation efforts that provide a more balanced and comprehensive perspective of impacts.
Future efforts should also include Preuss’ framework (2007), which presents a “legacy cube” that situates impacts (infrastructure, knowledge, image, emotions, networks, culture) in an intersection of three dimensions of mega sport legacy – planned/unplanned, positive/negative, and tangible/intangible. The legacy cube can be used for a particular time and space (e.g., planned infrastructure impacts that are positive and tangible in 2010 in Vancouver), but several legacy cubes would need to be considered for different times and spaces.
REFERENCES
Behr, F. and Cierjacks, A., 2010. Benchmarking in event management – a sustainability approach, Paper presented at the Global Events Congress IV: Events and Festivals Research: State of the Art, Leeds, Paper retrieved from (14 June 2012)

OGI-UBC Post-Games Report Appendix C: OGI Methodology
230
Chalip, L. (2006). Towards social leverage of sport events. Journal of Sport & Tourism, 11(2), 109-127.
Cobb, C.W. and Rixford, C., 1998. Lessons Learned from the History of Social Indicators. San Francisco, CA: Redefining Progress.
Coalter, F. (2004). London 2012: a sustainable sporting legacy? In A. Vigor & M. Mean (Eds.), After the goldrush: a sustainable Olympics for London (pp. 93-108). London, UK: Institute for Public Policy Research and Demos.
Dolles, H. and Söderman, S., 2008. Mega-Sporting Events in Asia -- Impacts on Society, Business and Management: An Introduction. Asian Business & Management, 7(2), pp. 147.
Furrer, P., 2002. Sustainable Olympic Games. A dream or a reality? Bollettino della Società Geografica Italiana, Serie XII, 7(4), pp. 1-31.
Girginov, V., & Hills, L. 2008. A sustainable sports legacy: creating a link between the London Olympics and sports participation. International Journal of the History of Sport, 25(14), 2091-2116.
Girginov, V. and Hills, L., 2009. The political process of constructing a sustainable London Olympics sports development legacy. International Journal of Sport Policy, 1(2), pp. 161-181.
Gratton, C. and Preuss, H., 2008. Maximizing Olympic Impacts by Building Up Legacies. The International Journal of the History of Sport, 25(14), pp. 1922-1938.
Gratton, C., Shibli, S. and Coleman, R., 2006. The economic impact of major sport events: A review of ten events in the UK. The Sociological Review, 54(s2), pp. 41-58.
Green, L.W. and Kreuter, M., W., 2005. Epidemiological Diagnosis: Health, Behavioral, and Environmental Assessments. Health Program Planning: An Educational and Ecological Approach. 4 ed. New York, NY: The McGraw-Hill Companies, Inc., pp. 78-145.
Habicht, J.P., Victora, C.G. and Vaughan, J.P., 1999. Evaluation designs for adequacy, plausibility and probability of public health programme performance and impact. International journal of epidemiology, 28(1), pp. 10-18.
Hiller, H., 1998. Assessing the Impact of Mega-events: A Linkage Model’. Current Issues in Tourism 1(1), pp. 45–57.
Holden, M., MacKenzie, J. and VanWynsberghe, R., 2008. Vancouver’s promise of the world’s first Sustainable Olympic Games. Environment and Planning C: Government and Policy, 26(5), pp. 882-905.
Kasanko, M., Barredo, J.I., Lavalle, C., Sagris, V. And Genovese, E., 2005. Towards Urban Un-sustainability in Europe?: An Indicator-based Analysis, 45th Congress of the European Regional

OGI-UBC Post-Games Report Appendix C: OGI Methodology
231
Science Association. Land Use and Water Management in a Sustainable Network Society, August 23-27 2005.
Kirkup, N. and Major, B., 2006. Doctoral Foundation Paper: The Reliability of Economic Impact Studies of the Olympic Games: A Post-Games Study of Sydney 2000 and Considerations for London 2012. Journal of Sport Tourism, 11(3/4), pp. 275-296.
Leonardsen, D., 2007. Planning of Mega Events: Experiences and Lessons. Planning Theory & Practice, 8(1), pp. 11.
Liao, H. and Pitts, A., 2006. A brief historical review of Olympic urbanization. International Journal of the History of Sport, 23(7), pp. 1232.
Mangan, J.A., 2008. Prologue: Guarantees of Global Goodwill: Post-Olympic Legacies – Too Many Limping White Elephants? International Journal of the History of Sport, 25(14), pp. 1869 AB.
Manly, B.F.J., 2001. Statistics for Environmental Science and Management. Boca Raton, FL: Chapman & Hall/CRC.
Muñoz, F., 2006. Olympic urbanism and Olympic villages: Planning strategies in Olympic host cities, London 1908 to London 2012. The Sociological Review, 54(s2), pp. 175-187.
O’Brien, D., & Chalip, L. (2007). Sport events and strategic leveraging: Pushing towards the triple bottom line. In A.G. Woodside, & D. Martin (Eds.), Tourism Management:Analysis, Behavior, and Strategy (pp. 318-338). Cambridge, UK: CAB International.
Olympic Games Impact Study: pre-Games Report on 2012 Olympic and Paralympic Summer Games, 2010. London: University of East London and the Thames Gateway Institute for Sustainability Available from: http://www.uel.ac.uk/sri/projects/index.htm [Accessed 15 June 2012] Olympic Games Impact study: pre-Games Report on the 2010 Olympic and Paralympic Winter Games, 2009. Vancouver: The University of British Columbia Available from: https://circle.ubc.ca/handle/2429/38240 [Accessed 15 June 2012]
Olympic Games Impact study: pre-Games Technical Report on the 2010 Olympic and Paralympic Winter Games, 2009. Vancouver: The University of British Columbia Available from: http://css.ubc.ca/projects/olympic-games-impact-study/ogi-reports/ [Accessed 30 June 2013] Preuss, H. (2007). The conceptualization and measurement of mega sport event legacies. Journal of Sport & Tourism, 12(3-4), pp. 207-227.

OGI-UBC Post-Games Report Appendix C: OGI Methodology
232
Taylor, P.G., Wiesenthal, T. and Mourelatou, A., 2005. Energy and environment in the European Union: An indicator-based analysis. Natural Resources Forum, 29(4), pp. 360-376.
VanWynsberghe, R. Derom, I. and Maurer E., 2012. Leveraging the 2010 Olympic Games: "Sustainability" in a City of Vancouver initiative. International Journal of Policy Research in Tourism, Leisure & Events: DOI: 10.1080/19407963.2012.662618. Whitson, D., & Horne, J. (2006). Underestimated costs and overestimated benefits?: Comparing the outcomes of sports mega-events in Canada and Japan. The Sociological Review, 54(s2), 73–89.