oman - muscat economy hotels market gap · oman - muscat economy hotels –market ... tourism...
TRANSCRIPT

Accelerating success.
OMAN - MUSCAT
ECONOMY HOTELS – MARKET GAP
NOVEMBER 2013
2013 | OMAN | ECONOMY HOTELS
TABLE OF CONTENTS
Executive Summary 3
Tourism Economics 4
Hospitality Market Overview 5
Oman Economy Hotels 6
Market Focus: Muscat 7
Economy Hotel Outlook 8
3 | COLLIERS INTERNATIONAL HOTELS
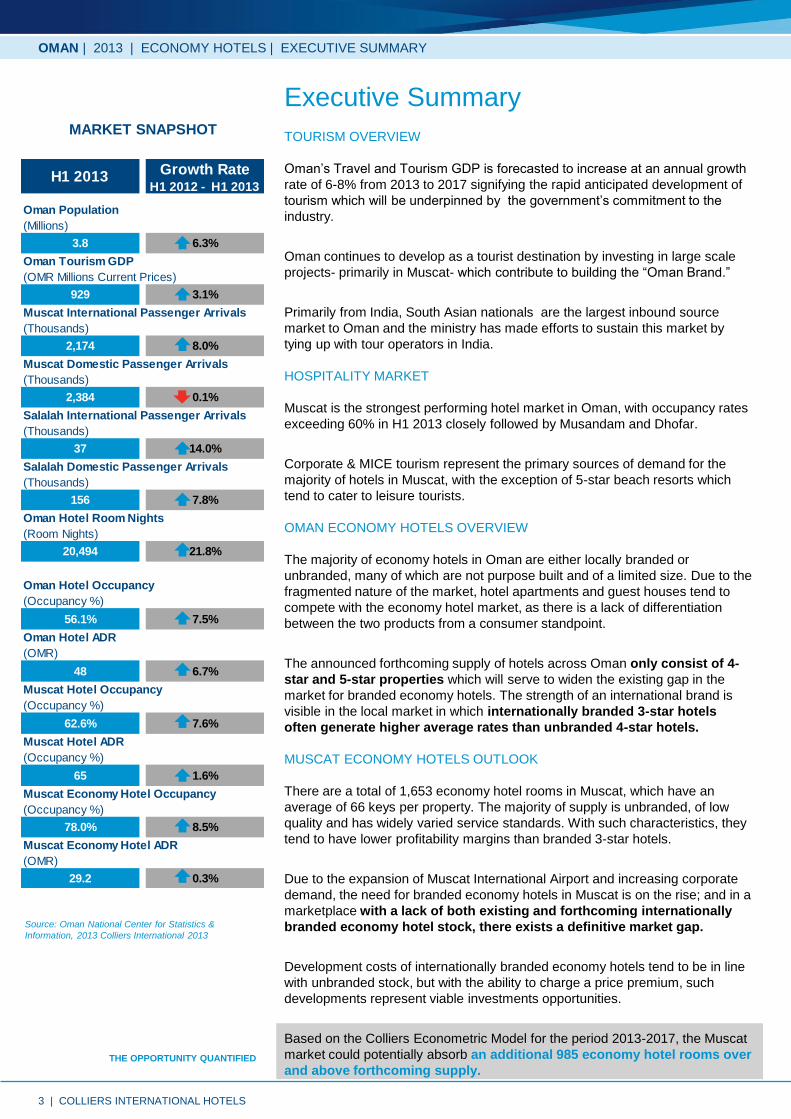
H1 2013Growth Rate
H1 2012 - H1 2013
Oman Population
(Millions)
3.8 6.3%
Oman Tourism GDP
(OMR Millions Current Prices)
929 3.1%
Muscat International Passenger Arrivals
(Thousands)
2,174 8.0%
Muscat Domestic Passenger Arrivals
(Thousands)
2,384 0.1%
Salalah International Passenger Arrivals
(Thousands)
37 14.0%
Salalah Domestic Passenger Arrivals
(Thousands)
156 7.8%
Oman Hotel Room Nights
(Room Nights)
20,494 21.8%
Oman Hotel Occupancy
(Occupancy %)
56.1% 7.5%
Oman Hotel ADR
(OMR)
48 6.7%
Muscat Hotel Occupancy
(Occupancy %)
62.6% 7.6%
Muscat Hotel ADR
(Occupancy %)
65 1.6%
Muscat Economy Hotel Occupancy
(Occupancy %)
78.0% 8.5%
Muscat Economy Hotel ADR
(OMR)
29.2 0.3%
TOURISM OVERVIEW
Oman’s Travel and Tourism GDP is forecasted to increase at an annual growth
rate of 6-8% from 2013 to 2017 signifying the rapid anticipated development of
tourism which will be underpinned by the government’s commitment to the
industry.
Oman continues to develop as a tourist destination by investing in large scale
projects- primarily in Muscat- which contribute to building the “Oman Brand.”
Primarily from India, South Asian nationals are the largest inbound source
market to Oman and the ministry has made efforts to sustain this market by
tying up with tour operators in India.
HOSPITALITY MARKET
Muscat is the strongest performing hotel market in Oman, with occupancy rates
exceeding 60% in H1 2013 closely followed by Musandam and Dhofar.
Corporate & MICE tourism represent the primary sources of demand for the
majority of hotels in Muscat, with the exception of 5-star beach resorts which
tend to cater to leisure tourists.
OMAN ECONOMY HOTELS OVERVIEW
The majority of economy hotels in Oman are either locally branded or
unbranded, many of which are not purpose built and of a limited size. Due to the
fragmented nature of the market, hotel apartments and guest houses tend to
compete with the economy hotel market, as there is a lack of differentiation
between the two products from a consumer standpoint.
The announced forthcoming supply of hotels across Oman only consist of 4-
star and 5-star properties which will serve to widen the existing gap in the
market for branded economy hotels. The strength of an international brand is
visible in the local market in which internationally branded 3-star hotels
often generate higher average rates than unbranded 4-star hotels.
MUSCAT ECONOMY HOTELS OUTLOOK
There are a total of 1,653 economy hotel rooms in Muscat, which have an
average of 66 keys per property. The majority of supply is unbranded, of low
quality and has widely varied service standards. With such characteristics, they
tend to have lower profitability margins than branded 3-star hotels.
Due to the expansion of Muscat International Airport and increasing corporate
demand, the need for branded economy hotels in Muscat is on the rise; and in a
marketplace with a lack of both existing and forthcoming internationally
branded economy hotel stock, there exists a definitive market gap.
Development costs of internationally branded economy hotels tend to be in line
with unbranded stock, but with the ability to charge a price premium, such
developments represent viable investments opportunities.
Based on the Colliers Econometric Model for the period 2013-2017, the Muscat
market could potentially absorb an additional 985 economy hotel rooms over
and above forthcoming supply.
OMAN | 2013 | ECONOMY HOTELS | EXECUTIVE SUMMARY
Executive SummaryMARKET SNAPSHOT
Source: Oman National Center for Statistics &
Information, 2013 Colliers International 2013
THE OPPORTUNITY QUANTIFIED

4 | COLLIERS INTERNATIONAL HOTELS
OMAN | 2013 | ECONOMY HOTELS | TOURISM ECONOMICS
TOURISM CONTRIBUTION TO GDP
•The direct contribution from the Travel and Tourism sector (monetary input
from hotels, travel agents, airlines, restaurants, tourist leisure industries and
transportation services) to Oman’s GDP in 2012 was 3.1%. The World Travel &
Tourism Council (WTTC) forecasts an annual growth of 6-8% until 2017.
CAPITAL INVESTMENT
•The WTTC indicated that capital investments in Travel and Tourism amounted
to OMR 364 mn in 2012. Investments are expected to grow annually by 8.6%
on average until 2017, which will contribute to building the ‘Oman brand’ as a
destination.
•There has been a large influx of large scale projects such as The Wave,
Imagine Project, Muscat Plaza and the Seeb Seafront in Muscat which will act
as catalysts to stimulate inbound demand.
DOMESTIC AND FOREIGN SPENDING
•According to the WTTC, domestic tourism spending and foreign visitor
spending represent 54.5% and 45.5% of direct Travel & Tourism GDP
respectively. Domestic spending is forecasted to grow by 12.2% in 2013.
•Oman’s government has taken initiatives to further develop its infrastructure
and simplify the visa process for inbound tourists which is expected to fuel
foreign visitor spending.
INBOUND SOURCE MARKETS
•Business Monitor International has found that the Asian market is the largest
source of international arrivals in Oman, as visitation from this region accounts
for 34.4% of overall visitation. Within this segment, Indian nationals account for
72.3% of Asian visitation. Visitation from Asia is forecast to rise to from 34.4.%
of total visitation to 41.3% by 2017.
•As India is one of the leading sources of arrivals into Muscat, IndiGo Airlines
has launched a 4-time a week schedule from Mumbai to Oman’s capital. BMI
forecasts the number of Indian inbound tourists to grow from 232,000 in 2012 to
384,000 in 2017, representing an annual growth of 10.6%
•After Asia, the European market represents the next largest source market,
followed by the Middle East, Egypt and North Americans respectively. Low cost
carriers within the region such as FlyDubai and Air Arabia increase the
accessibility of Oman for neighboring GCC countries.
•Oman Air has launched direct services to numerous European cities in 2012,
as arrivals from Europe are expected to increase by 4.3% between 2013 and
2017, during which total visitation is expected to increase by 18%.
Tourism Economics
Source: WTTC, 2013
DOMESTIC SPENDING VS FOREIGN
SPENDING, 2012
Source: WTTC, 2013
CAPITAL INVESTMENT IN TRAVEL &
TOURISM, 2012(a) – 2017 (f)
Source: WTTC, 2013
TOURISM CONTRIBUTION TO GDP,
2012(a) – 2017 (f)
Source: Business Monitor International, 2013
OMAN INBOUND TOURISM BY
NATIONALITY, 2012
34.4%
20.3%
31.8%
5.3%
7.8%
0.4%
Asia Middle EastEurope AfricaNorth America Latin America
45.5%
54.5%
Foreign Visitor Spending
Domestic Tourism Spending
893
929
1,0
02
1,0
90
1,1
79
1,2
74
2.8%
2.9%
3.0%
3.1%
3.2%
3.3%
3.4%
-
200
400
600
800
1,000
1,200
1,400
2012 (a) 2013(f) 2014(f) 2015(f) 2016(f) 2017(f)
YOY Growth % Direct Tourism Contribution (OMR millions)
364
387 414 452 4
96 5
50
0
100
200
300
400
500
600
2012 (a) 2013(f) 2014(f) 2015(f) 2016(f) 2017(f)
Capital Investment in Travel & Tourism (OMR millions)

5 | COLLIERS INTERNATIONAL HOTELS
4548
2327
52.2%
56.1%
20%
25%
30%
35%
40%
45%
50%
55%
60%
0
10
20
30
40
50
60
H1 2012 H1 2013
ADR (OMR) RevPAR (OMR) Occupancy
OMAN | 2013 | ECONOMY HOTELS | HOSPITALITY MARKET OVERVIEW
INBOUND ARRIVALS
•In 2011, Oman received 220 cruise visits and over 200,000 cruise passenger
arrivals to the three main ports: Muscat, Dhofar and Musandam. Oman‘s
reputation as a cruise destination is growing and expansions are being made to
convert the Sultan Qaboos port of Muscat into a cruise passenger terminal,
resulting in increased leisure tourism in the abovementioned cities.
•Inbound tourists grew at a steady pace of 6.2% annually, from 2007 to 2012, with
projected annual growth rates of 5.0% until 2017. Going forward, demand growth
is primarily expected to stem from the Asian submarket, which is anticipated to
achieve 9.0% annual growth.
•The Muscat and Salalah International airports are under expansion to
accommodate growing passengers arrivals. By the end of July 2013, Salalah
International Airport witnessed annual international tourist increases of 14% and
domestic arrivals growth of 7.8%. Euromonitor forecasts passenger movements in
Salalah to reach 1 million by 2014.
•The international passenger arrivals at Muscat International Airport increased by
8.1% by July 2013 while domestic remained constant compared to the same time
last year. The overall annual capacity of Oman’s airports will reach 12 million
passengers after completion.
OMAN HOTELS KEY PERFORMANCE INDICATORS
Muscat is the strongest performing hotel market in Oman, with occupancy rates
exceeding 60% in H1 2013, closely followed by Musandam and Dhofar.
Occupancy rates show significant growth in H1 2013 as compared to the same
time last year.
•Unbranded 4-star hotels in Muscat attain lower average rates than branded 3-star
hotels, due to service inconsistency and perceived low quality. In 2012, the
branded three star hotels were able to achieve a 15% premium in average rate on
unbranded 4 star hotels.
•Oman experienced a sharp downturn in hotel occupancy rates between 2010 and
2011 due to the Arab Spring. However, hotel performance recovered in 2012 with
occupancy rates increasing by 10.2% from the previous year, resulting in higher
room rates and overall RevPAR.
•Occupancy performance H1 2013 shows significant growth when compared to
the rates at the same time the previous year, indicating higher Travel & Tourism
contribution to GDP
Hospitality Market Overview
OMAN HOTEL PERFORMANCE
2009 – H1 2013
Source: Colliers International, 2013; Ministry of Tourism, 2013
OMAN INBOUND TOURISM GROWTH
FORECAST
Source: Oman National Center for Statistics &
Information, 2013
Source: Business Monitor International, 2013
OMAN PASSENGER ARRIVALS,
H1 2012 - H1 2013
39 4038
47
19 2016
25
49.0%51.1%
43.4%
53.6%
20%
25%
30%
35%
40%
45%
50%
55%
60%
0
5
10
15
20
25
30
35
40
45
50
2009 2010 2011 2012
ADR (OMR) RevPAR (OMR) Occupancy
2,0122,174
210 21032 37 144 156
0
500
1,000
1,500
2,000
2,500
H1 2012 H1 2013 H1 2012 H1 2013
International Passenger Arrival ('000)
Domestic Passenger Arrival ('000)
Muscat Airport Salalah Airport
2,0
53
2,1
35
2,2
31
2,3
42
2,4
71
2,6
17
0
500
1,000
1,500
2,000
2,500
3,000
2012 2013 2014 2015 2016 2017
No. of Trips ('000)

6 | COLLIERS INTERNATIONAL HOTELS
DEVELOPMENT OF ECONOMY HOTELS
•The Economy Hotels business model typically tends to maximize room stock,
which is the main income-generating asset with the largest operating profit
percentage, and minimize areas that are less profitable (i.e. gyms, lobbies, non-
essential seating areas etc.)
•Economy hotels are categorized by room standardization and a consistent
pricing strategy. They are generally limited to one room category, thereby
allowing a maximum room capacity given limited Gross Floor Area (GFA) due
to the absence of suites. This type of hotel typically offers standardized
bedroom layout and facilities
ECONOMY HOTEL SUPPLY
•Colliers research indicates that 25 economy hotels currently operate in Muscat,
of which only 3 are internationally branded (Ramee Dream & Al Bhajah, Ibis and
Tulip Inn). This segment of 2- and 3-star hotels have an average of 66 keys,
limiting the potential economies of scale achieved in larger properties.
•At 175 keys, the Ibis Muscat has the highest key count in the economy hotel
market and as such is able to achieve operational efficiencies not seen in
smaller hotels.
•The Dhofar region, in which Salalah captures most of the tourist market, is
dominated by one star hotels and hotel apartments which do not offer the same
services or product offering as internationally branded economy hotels.
Although six economy hotels exist in the local market, they are all unbranded
properties.
•Oman has a combined total of 50 economy hotels which does not included
Guesthouses and Serviced Apartments. Currently both lodging options compete
against unbranded economy hotels as there is a lack of differentiation between
the three products from a consumer standpoint. The majority of unbranded local
supply is of relatively low quality, which presents an opportunity for
internationally branded economy to drive high average rates through product
leadership.
•Of the 35 new hotels scheduled to open in the next five years throughout
Oman, not one of them will be an economy hotel. This represents a clear
market gap for a quality internationally branded economy hotel offering.
ECONOMY HOTELS KEY PERFORMANCE INDICATORS
•The occupancy rate of Oman’s economy hotels (3-star and 2-star) was 44% in
2010, which declined to 41% in 2011 due regional unrest. However, the rate
escalated to 47% in the first quarter of 2013.
•Colliers’ International forecasts the occupancy rate is likely to reach 48% in
2013 owing to increasing visitation and strong oil and non-oil based economic
activity in the region.
OMAN | 2013 | ECONOMY HOTELS | OMAN ECONOMY HOTELS
CURRENT HOTEL SUPPLY
OMAN Q3 2013
ANNOUNCED FORTHCOMING HOTEL
SUPPLY IN OMAN, 2013-2017
Source: Colliers International, 2013
OMAN ECONOMY HOTEL OCCUPANCY,
2010 – H1 2013
51%
49%
50%
51% 5
7%
37%
33%
33%
35% 39%
0%
10%
20%
30%
40%
50%
60%
2010 2011 2012 H1 2012 H1 2013
3-Star 2-Star
Source: Ministry of Tourism, 2012; Colliers International, 2013
Oman Economy Hotels
16
30
2327
43
5-star 4-star 3-star 2-star 1-star
Source: Colliers International, 2013
25
10
5-star 4-star

7 | COLLIERS INTERNATIONAL HOTELS
ECONOMY HOTELS SUPPLY
•Muscat has 25 economy hotels, which are composed of thirteen 3-star and
twelve 2-star hotels, with a combined count of 1,653 rooms.
•20% of all economy hotels in Muscat are branded, 8% locally branded and
72% are unbranded.
•Only 8% of 2 Star, and 31% of three star properties in Muscat are
internationally branded which represents a supply gap in the market for
internationally branded economy hotels.
•Unbranded properties in Muscat offer more facilities and F&B outlets than
internationally branded ones, which has downward pressure on profitability, as
there are far smaller margins to be found ancillary revenue streams (such as
F&B revenue) than in rooms revenue.
UPCOMING ECONOMY HOTELS SUPPLY
•As of November 2013, 6,616 hotel rooms and service apartments are currently
in the pipeline for Muscat in the next five years as confirmed by hotel
developers. All of forthcoming hotel supply is in the 4 and 5 stars segments.
•No internationally branded economy hotels have been announced to
open in the coming years, representing a clear supply gap in the market.
MUSCAT ECONOMY HOTELS KEY PERFORMANCE INDICATORS
•The Occupancy of Muscat’s economy hotels grew at an annual growth rate of
5.9% from 2009 to 2012, along with the rise of average rate of these properties
at 2.8% for the same period.
•As a result of increasing increased visitation to Muscat, economy hotels have
experienced strong key performance indicators, with RevPAR growing from
OMR 17.8 in 2009 to forecasted OMR 23.4 in 2013.
•Muscat’s internationally branded economy hotels capture a higher average rate
in relation to the local or unbranded properties, attaining a rate premium of 15%
against the unbranded 3 star properties.
MUSCAT ECONOMY HOTEL MARKET SEGMENTATION
•MICE tourism accounted for 8% of inbound tourism in 2011. With the
development of The Oman Convention and Exhibition Centre, the MICE sector
is expected to grow to 12%-15% from 2014 in cities such as Muscat, Salalah
and Musandam.
•The corporate tourism captures the highest market segment for all hotels in
Muscat except for 5-star resorts which attracts a larger portion of leisure
tourism.
OMAN | 2013 | ECONOMY HOTELS | MARKET FOCUS: MUSCAT
Source: Colliers International, 2013
MUSCAT ECONOMY HOTEL
PERFORMANCE, 2009 – 2013(F)
62%18%
12%
8%
1%
Corporate GovernmentLeisure FIT/Walk InAirline
MUSCAT MARKET SEGMENTATION,
2013
Source: Colliers International, 2013
8,147 8,40310,021
11,661
14,451
256 1,618
1,640
2,790
312
8,40310,021
11,661
14,451
14,763
0
2,000
4,000
6,000
8,000
10,000
12,000
14,000
16,000
2013 2014 2015 2016 2017Existing Supply Addition to Supply
ANNOUNCED UPCOMING SUPPLY, 2013
Source: Colliers International, 2013
27.1 27.7
29.1 29.2 30.2
17.8 17.3 18.6
20.9
23.4 65.5%
62.4%63.8%
71.4%
77.5%
50%
55%
60%
65%
70%
75%
80%
10
15
20
25
30
35
2009 2010 2011 2012 2013(f)
ADR (OMR) RevPAR (OMR) Occupancy %
Market Focus: MuscatBRANDED VS UNBRANDED, MUSCAT
31%
8%20%
15%
8%
54%
92%
72%
0%
10%
20%
30%
40%
50%
60%
70%
80%
90%
100%
3-star 2-star Total
Internationally Branded Locally Branded Unbranded
Source: Colliers International, 2013
8 | COLLIERS INTERNATIONAL HOTELS
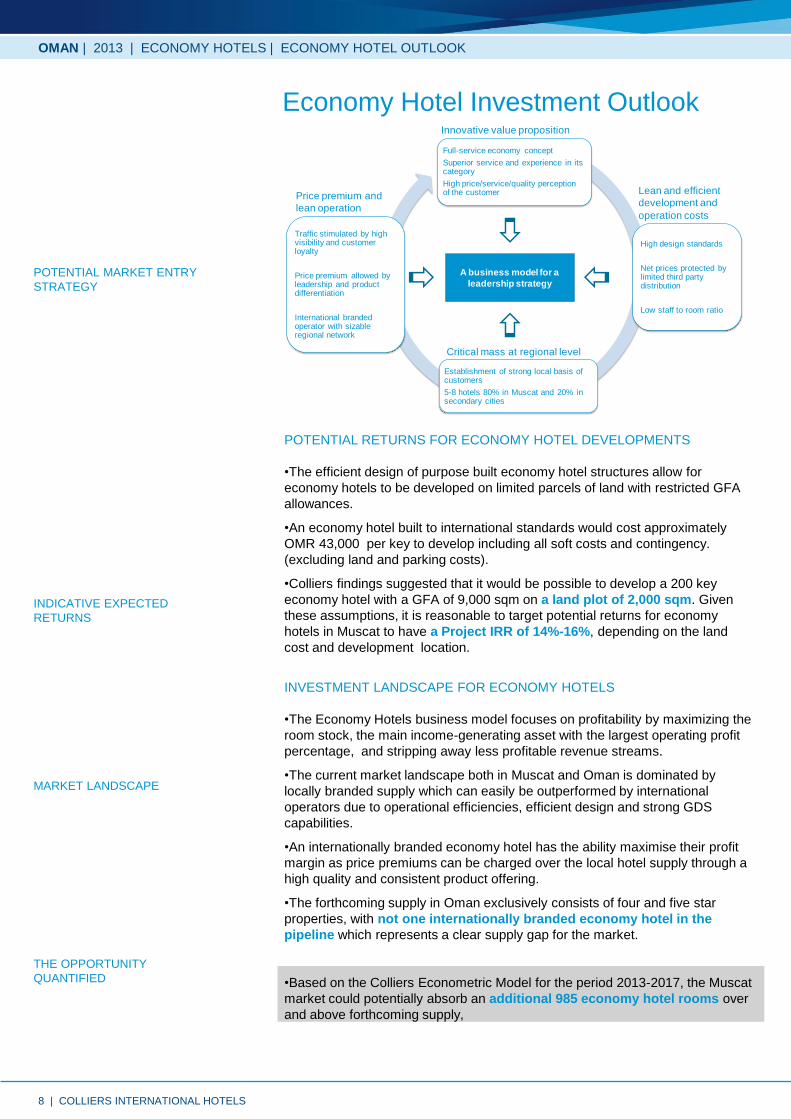
POTENTIAL RETURNS FOR ECONOMY HOTEL DEVELOPMENTS
•The efficient design of purpose built economy hotel structures allow for
economy hotels to be developed on limited parcels of land with restricted GFA
allowances.
•An economy hotel built to international standards would cost approximately
OMR 43,000 per key to develop including all soft costs and contingency.
(excluding land and parking costs).
•Colliers findings suggested that it would be possible to develop a 200 key
economy hotel with a GFA of 9,000 sqm on a land plot of 2,000 sqm. Given
these assumptions, it is reasonable to target potential returns for economy
hotels in Muscat to have a Project IRR of 14%-16%, depending on the land
cost and development location.
INVESTMENT LANDSCAPE FOR ECONOMY HOTELS
•The Economy Hotels business model focuses on profitability by maximizing the
room stock, the main income-generating asset with the largest operating profit
percentage, and stripping away less profitable revenue streams.
•The current market landscape both in Muscat and Oman is dominated by
locally branded supply which can easily be outperformed by international
operators due to operational efficiencies, efficient design and strong GDS
capabilities.
•An internationally branded economy hotel has the ability maximise their profit
margin as price premiums can be charged over the local hotel supply through a
high quality and consistent product offering.
•The forthcoming supply in Oman exclusively consists of four and five star
properties, with not one internationally branded economy hotel in the
pipeline which represents a clear supply gap for the market.
•Based on the Colliers Econometric Model for the period 2013-2017, the Muscat
market could potentially absorb an additional 985 economy hotel rooms over
and above forthcoming supply,
OMAN | 2013 | ECONOMY HOTELS | ECONOMY HOTEL OUTLOOK
Economy Hotel Investment Outlook
POTENTIAL MARKET ENTRY
STRATEGY
Innovative value proposition
Full-service economy concept
Superior service and experience in its category
High price/service/quality perception of the customer
High design standards
Net prices protected by limited third party distribution
Low staff to room ratio
Establishment of strong local basis of customers
5-8 hotels 80% in Muscat and 20% in secondary cities
Traffic stimulated by high visibility and customer loyalty
Price premium allowed by leadership and product differentiation
International branded operator with sizable regional network
A business model for a
leadership strategy
Critical mass at regional level
Lean and efficient
development and
operation costs
Price premium and
lean operation
INDICATIVE EXPECTED
RETURNS
MARKET LANDSCAPE
THE OPPORTUNITY
QUANTIFIED

The information contained herein has been obtained
from sources deemed reliable. While every reasonable
effort has been made to ensure its accuracy, we cannot
guarantee it. No responsibility is assumed for any
inaccuracies. Readers are encouraged to consult their
professional advisors prior to acting on any of the
material contained in this report.
COLLIERS INTERNATIONAL MIDDLE EAST
Colliers International has been providing leading advisory services in the Middle East
and North Africa region since 1996, in Saudi Arabia since 2004. Regarded as the largest
and most experienced firm in the region, Colliers International’s expertise covers
Hospitality, Residential, Commercial, Retail, Education and Healthcare sectors together
with master planning solutions, serviced from the five regional offices.
Colliers Research Services Group is recognized as a knowledge leader in the real
estate industry, providing clients with valuable market intelligence to support business
decisions. Colliers research analysts provide multi-level support across all property
types, ranging from data collection to comprehensive market analysis.
COLLIERS INTERNATIONAL HOTELS
Colliers International Hospitality division is a global network of specialist consultants in
hotel, resort, marina, golf, leisure an spa sectors, dedicated to providing strategic
advisory services to owners, developers and government institutions to extract best
values from projects and assets. The foundation of our service is the hands-on
experience of our team combined with the intelligence and resources of global practice.Through effective management of the hospitality process, Colliers delivers tangible
financial benefits to clients. With offices in Dubai, Abu Dhabi, Jeddah, Riyadh and Cairo,
Colliers International Hotels combines global expertise with local market knowledge.
SERVICE AT A GLANCE
The team can advise throughout the key phases and lifecycle of project:
• Destination/Tourism/Resort/Brand Strategy
• Market and Financial Feasibility Study
• Development Consultancy & Highest and Best Use Analysis
• Operator Search, Selection and Contract Negotiation
• Pre-Opening Budget Analysis and Operational Business Plan
• Owner Representative/Asset Management/Lenders Asset Monitoring
• Site and Asset Investment Sale and Acquisition/Due Diligence
• RICS Valuations for Finance Purposes and IPOs
OUR REGIONAL EXPERIENCE
• Strategic Advisory and Hospitality Capital Valuation for more than 32,400 keys with a
total asset value in excess of AED29.4 Billion
• Hotel Operator Search, Selection and Contract Negotiation in excess of 7,200 keys
with client savings averaging AED10.4 million
• In excess of 17,258 keys proposed within Highest & Best Use, Market & Financial
Feasibility Studies for Hotels, Resorts & Serviced Apartments
• Highest & Best Use, Market & Financial Feasibility Studies for Hotels & Serviced
Apartments with a total estimated net asset value in excess of AED 36.2 Billion
• In Excess of 921 Hotel Keys under Asset Management as Owner’s Representative
482 offices in 62 countries on 6 continents
• $2 billion in annual revenue
• 1.12 billion square feet under
management
• 13,505 employees
• $71.2 billion total transaction value
COLLIERS INTERNATIONAL HOTELS:
P O Box 71591
Dubai
United Arab Emirates
Filippo Sona
Director | Head of Hotels | MENA Region
MAIN +971 4 453 7400
MOBILE +971 55 899 6102
EMAIL [email protected]
OMAN | 2013 | ECONOMY HOTELS
www.colliers.com

Accelerating success.www.colliers.com