ommissione di vigilanza sui fondi ensione - … commissione di vigilanza sui fondi pensione main...
TRANSCRIPT

COVIP COMMISSIONE DI VIGILANZA SUI FONDI PENSIONE
MAIN DATA ON
SUPPLEMENTARY PENSION FUNDS IN ITALY
(UPDATE: END OF 2016)

Symbols and conventions
In the following tables:
- the phenomenon does not occur
…. the phenomenon occurs but the value is not known
.. the value is known but is nil or less than half the final digit shown
Further data and information could be found in the 2016 COVIP Annual Report (“Relazione Annuale 2016”), available on COVIP
website (http://www.covip.it/wp-content/files_mf/1496920360RelazioneAnnuale2016.pdf).
Data are also available on .xsls format on COVIP website (http://www.covip.it/wp-content/files_mf/1501247702Tavole_Relazione_Annuale_2016.xlsx; and http://www.covip.it/wp-content/uploads/Tavole-
Dati_Singoli_Fondi_2016.xlsx).

1
At the end of 2016, Italian pension funds counted 7.8 millions of members, increasing by 7.6
per cent with respect to the previous year; total assets under management reached €151.3
billion, 7.8 per cent higher than 2015.
Assets held by pension funds amounted to 9 per cent of GDP and to 3.6 per cent of household
financial assets.
Number of pension funds
At the end of 2016, pension funds were 452 in total: 36 contractual pension funds, 43 open
pension funds, 78 “new” PIPs, 294 pre-existing pension funds; the total includes FONDINPS (see
the Glossary).
The number of pension funds decreased continuously in recent years. Despite this process, the
number of small-sized funds was still high: only 15 pension funds counted more than 100,000
members, while more than half of pension funds (most of them were pre-existing pension funds)
had less than 1,000 members.
Membership
At the end of 2016, Italian pension funds totaled 7.8 millions of members: 2.6 million were
members of contractual pension funds, 1.3 million of open pension funds, 2.9 million of “new”
PIPs, 650,000 of pre-existing pension funds and approximately 411,000 of “old” PIPs.
Taking into account multiple adhesions (about 620,000 cases), the actual number of members
was 7.170 million. The participation rate was 27.8 per cent of the labour force.
Out of the overall members, 5.8 million were employees and 2 million self-employed workers.
In 2016, the growth rate of members was 7.6 per cent. The increase was 7.4 per cent for
contractual pension funds, 9.5 open pension funds and 10.3 per cent for “new” PIPs. In
particular, contractual pension funds continued to benefit from the introduction of the
mandatory enrolment of workers in the construction sector as part of the collective agreement
between employers’ and employees’ associations. These funds have seen a significant increase
in membership, although assets have grown to a less extent, mainly because of the lack of
employer contribution.
Total assets and contributions
In 2016, total pension fund assets increased by 7.8 per cent to €151.3 billion, as a result of €7.3
billion of net contributions and €3.6 billion of net returns.
Total assets rose by 8.0 per cent (€45.9 billion) for contractual pension funds, 9.5 per cent
(€17.1 billion) for open pension funds, 18.2 per cent (€23.7 billion) for “new” PIPs, and 4.0 per
cent (€57.5 billion) for pre-existing pension funds; assets held by “old” PIPs increased by 2.2
per cent (€6.9 billion).

2
Gross contributions amounted to €14.2 billion, 60 per cent of which referred to occupational
pension funds. The flow of the TFR (see Glossary) paid into pension funds amounted to €5.7
billion (equal to 40 per cent of total contributions); it remained stable compared to the previous
year.
Gross outflows were €6.9 billion: benefits amounted to €2.7 billion, out of which lump-sums
were €2 billion and annuities €700 million; early withdrawals summed up to €3.6 billion; the
remaining outflows were related to “old” PIPs.
Returns and costs
Returns of pension funds, net of costs and taxes, were on average 2.7 per cent for contractual
pension funds and 2.2 per cent for open pension funds. Among the “new” PIPs, unit-linked
products returned 3.6 per cent while with-profit products 2.1 per cent. The TFR revaluation, net
of tax, was 1.5 per cent.
Equity sub-funds delivered higher returns compared to other investment options: 4.4 per cent
for contractual pension funds, 3.2 per cent for open pension funds and 6.0 per cent for unit-
linked “new” PIPs.
In a longer period of time (2008-2016) the annual rate of returns, net of costs and taxes, was
3.4 per cent for contractual pension funds, 2.9 per cent for open pension funds. Within “new”
PIPs, unit-linked products returned 3 per cent and with-profit products 2.2 per cent.
The wide dispersion of rate of returns among pension funds mainly reflects the heterogeneity
of costs across different kinds of pension funds.
For a representative member, with a holding period of 10 years, the average Synthetic Cost
Indicator (SCI - calculated according to a common methodology set by COVIP- see Glossary)
is 0.4 per cent for contractual pension funds, 1.3 per cent for open pension funds and 2.2 per
cent for “new” PIPs. It is worth noting that PIPs, despite their higher costs, continue to account
for a large share of new adhesions, thanks to their extensive sales network and their
remuneration mechanisms.
Asset allocation
At the end of 2016, pension fund assets were mainly invested in debt securities (61 per cent),
mostly government bonds; about 16.3 per cent of assets were invested in equities and 13.5 per
cent in mutual funds. Domestic investments accounted for 29.5 per cent of total assets (€34.6
billion), most of which were government bonds. Investments in securities issued by Italian
companies were limited: €3.4 billion (3 per cent of total assets) of which €2.3 billion were
bonds and the remaining equities.

3
Tables
Table 1
Private Pension System. Main statistics. (end-2016 data; assets in millions of euros)
Number of
Pension Funds Members(1)
Percentage
Changes Assets
Percentage
Changes
Contractual Pension Funds 36 2,597,022 7.4 45,931 8.0
Open Pension Funds 43 1,258,979 9.5 17,092 10.8
Pre-existing Pension Funds 294 653,971 1.3 57,538 4.0
autonomous 187 640,757 55,068
non autonomous 108 13,214 2,470
“New” PIPs 78 2,869,477 10.3 23,711 18.2
Total(2) 452 7,416,762 8.2 144.347 8.2
“Old” PIPs 411,242 6,931 2.2
Total(2) 7,787,488 7.6 151,278 7.8
(1) Data may include double counting referred to members adhering to more than one pension fund.
(2) FONDINPS is included.

4
Table 2
Private Pension System. Distribution of pension funds by assets. (end-2016 data; assets in millions of euros)
Size classes
(assets)
Contractual
Pension Funds
Open
Pension Funds “New” PIPs
Pre-existing
Pension Funds Total(1)
Number Assets Number Assets Number Assets Number Assets Number Assets
> 5,000 2 15,788 - - - - 1 10,174 3 25,962
2,501 to 5,000 1 3,313 1 3,285 3 10,599 3 10,494 8 27,690
1,001 to 2,500 10 15,869 3 3,855 3 6,049 9 14,015 25 39,787
501 to 1,000 11 8,537 10 6,860 2 1,444 9 6,097 32 22,938
101 to 500 9 2,197 11 2,423 20 4,254 54 12,447 94 21,321
25 to 100 3 227 11 599 16 989 62 3,249 93 5,138
1 to 24 - - 7 71 33 376 108 1,054 148 1,501
< 1 - - - - 1 - 48 9 49 9
Total 36 45,931 43 17,092 78 23,711 294 57,538 452 144,347
(1) FONDINPS is included.
Table 3
Private Pension System. Distribution of pension funds by members. (end-2016 data)
Size classes
(members)
Contractual
Pension Funds
Open Pension
Funds “New” PIPs"
Pre-existing
Pension Funds Total(1)
Number Members Number Members Number Members Number Members Number Members
> 100,000 6 1,612,808 2 451,876 7 2,087,866 - - 15 4,152,550
50,001 to 100,000 7 448,390 6 366,233 3 238,947 2 144,452 18 1,198,022
200,001 to 50,000 11 434,296 9 301,485 8 234,262 7 197,300 36 1,204,656
10,001 to 20,000 3 38,024 6 85,533 10 162,068 3 44,704 22 330,329
1,001 to 10,000 9 63,504 16 51,691 32 138,325 65 234,812 122 488,332
100 to 1,000 - - 4 2,161 16 7,875 70 31,076 90 41,112
< 100 - - - - 2 134 147 1,627 149 1,761
Total 36 2,597,022 43 1,258,979 78 2,869,477 294 653,971 452 7,416,762
(1) FONDINPS is included.

5
Table 4
Private Pension System. Participation rate. (end-2016 data)
Actual members (1) Labour force
Participation
rate (%)
Private pension funds’ system 7,170,000 25,770,000 27.8
Eligible members Actively contributing
members (2) Employment
Participation
rate (%)
Employees 4,653,897 17,310,000 26.9
Self-employed workers 1,160,665 5,447,000 21.3
Total 5,814,562 22,757,000 25.6
(1) The total does not include multiple adhesions.
(2) The total does not include members who did not actively contribute to a pension plan in 2016.
Table 5
Private Pension System. Members by professional category. (end-2016 data)
Type of pension funds Employees Self-employed
workers Total
Contractual Pension Funds 2,591,196 5,826 2,597,022
Open Pension Funds 655,831 603,148 1,258,979
Pre-existing Pension Funds 632,654 21,317 653,971
“New” PIPs 1,756,115 1,113,362 2,869,477
“Old” PIPs 143,166 268,076 412,242
Total(1) 5,788,432 1,999,056 7,787,488
(1) FONDINPS is included.

6
Table 6
Private Pension System. Members, workforce and participation rate by age groups(1). (end-2015 data)
(1) Members as percentage of the labour force on the left-hand scale of the y-axis; members and labour force in thousands of units on the right-hand scale of the y-axis.
0
200
400
600
800
1.000
1.200
1.400
1.600
0
10
20
30
40
50
15-24 25-34 35-44 45-54 55-64 65 and over
Men
Women
Participation rate Men
Participation rate Women

7
Table 7
Private Pension System. Participation rate by regions. (end-2015 data; members as a percentage of the labour force)

8
Table 8
Private Pension System. Members by age groups. (end-2015 data; percentage composition)
Age groups
Contractual
Pension
Funds
Open
Pension
Funds
Pre-existing
Pension
Funds
“New”
PIPs Total(1)
< 25 1.8 6.8 1 4.9 3.6
25 - 34 13.1 13 8.2 16.9 13.7
35 - 44 29.3 26.6 24.2 26.2 26.9
45 - 54 36.2 31.9 36.8 28.8 32.6
55 - 64 19 19 26.3 20.2 20.6
> 65 0.7 2.7 3.4 3 2.7
Total 100 100 100 100 100
Memory item:
Average age 45.9 45.1 48.9 45.1 46.1
(1) Members of “Old” PIPs are included.
Table 9
Pension Funds and “New” PIPs. Members by investment sub-funds and age groups. (end-2015 data; per cent)
0
10
20
30
40
50
60
70
80
90
100
under
25
25-29 30-34 35-39 40-44 45-49 50-54 55-59 60-64 65 and
over
Guaranteed
Bond
Balanced
Equity

9
Table 10
Private Pension System. Members by regions. (end-2015 data; percentage composition)
Contractual
Pension Funds
Open
Pension Funds
Pre-existing
Pension Funds
“New” PIPs
Total
Piemonte 8.2 9.0 9.1 8.6 8.6
Valle d’Aosta 0.5 0.2 0.4 0.2 0.3
Lombardia 21.3 20.7 30.9 18.1 20.8
Liguria 2.4 3.4 2.4 2.9 2.8
North-West Italy 32.4 33.3 42.7 29.9 32.8
Veneto 10.1 10.0 8.0 11.2 10.4
Trentino-Alto Adige 5.7 5.3 1.7 1.5 3.5
Friuli-Venezia Giulia 2.1 3.3 2.5 2.8 2.6
Emilia-Romagna 8.5 9.4 9.1 8.4 8.7
North-East Italy 26.4 27.9 21.3 24.0 25.2
Toscana 6.6 9.6 5.9 7.6 7.4
Umbria 1.5 1.5 1.0 2.0 1.6
Marche 2.1 2.9 1.9 3.5 2.8
Lazio 8.7 6.6 12.3 8.1 8.4
Central Italy 18.8 20.7 21.1 21.3 20.3
Abruzzo 2.2 1.3 1.3 2.2 2.0
Molise 0.4 0.3 0.2 0.6 0.5
Campania 6.1 4.5 4.0 5.9 5.6
Puglia 4.2 3.7 3.1 5.4 4.5
Basilicata 0.9 0.7 0.3 0.9 0.8
Calabria 1.7 2.0 1.1 2.3 1.9
Sicilia 4.7 4.3 3.3 5.6 4.9
Sardegna 2.0 1.3 1.3 2.0 1.8
Southern Italy and Islands 22.3 18.0 14.6 24.8 22.0
Total 100.0 100.0 100.0 100.0 100.0

10
Table 11
Private Pension System. Members by professional category, age and gender. (end-2015 data; percentage composition)
Age groups Self-employed workers Employees Total
Male Female Total Male Female Total Male Female Total
< 25 0.9 1.5 1.1 2.2 1.3 1.8 3.4 3.8 3.6
25 to 34 6.6 8.6 7.2 15.1 14.6 14.9 13.5 14.0 13.7
35 to 44 22.9 25.9 23.8 27.9 30.8 29.0 26.0 28.3 26.9
45 to 54 35.2 35.1 35.2 33.4 34.4 33.8 32.5 32.9 32.6
55 to 64 26.9 24.6 26.2 19.8 18.1 19.2 21.4 19.3 20.6
> 65 7.5 4.4 6.5 1.6 0.8 1.3 3.3 1.7 2.7
Total 100.0 100.0 100.0 100.0 100.0 100.0 100.0 100.0 100.0
Memory item:
Gender composition 70.2 29.8 100.0 63.1 36.9 100.0 62.7 37.3 100.0
Average age 50.2 48.5 49.7 45.8 45.6 45.7 46.4 45.5 46.1

11
Table 12
Private Pension System. Members by professional category, region and gender. (end-2015 data; percentage composition)
Regions Self-employed workers Employees Total
Male Female Total Male Female Total Male Female Total
Piemonte 7.7 8.6 8.0 8.3 9.6 8.7 8.2 9.2 8.6
Valle d’Aosta 0.3 0.3 0.3 0.3 0.5 0.4 0.3 0.4 0.3
Lombardia 17.3 17.4 17.4 21.5 22.3 21.8 20.6 20.9 20.8
Liguria 3.4 4.3 3.7 2.6 2.6 2.6 2.7 2.8 2.8
North-West Italy 28.7 30.6 29.3 32.7 34.9 33.5 31.8 33.4 32.4
Veneto 9.8 9.0 9.5 10.4 10.7 10.5 10.3 10.4 10.4
Trentino-Alto Adige 2.2 2.0 2.2 3.3 4.3 3.7 3.3 4.0 3.5
Friuli-Venezia Giulia 2.2 2.4 2.3 2.5 2.8 2.6 2.5 2.8 2.6
Emilia-Romagna 9.4 9.8 9.5 8.1 9.7 8.7 8.3 9.2 8.7
North-East Italy 23.6 23.2 23.5 24.3 27.6 25.5 24.4 26.4 25.2
Toscana 9.7 10.1 9.8 6.6 7.4 6.9 7.2 7.8 7.4
Umbria 2.0 2.1 2.0 1.5 1.5 1.5 1.7 1.6 1.6
Marche 3.6 3.4 3.6 2.6 2.8 2.6 2.8 2.9 2.8
Lazio 7.2 8.2 7.5 8.7 8.7 8.7 8.3 8.6 8.4
Central Italy 22.5 23.8 22.9 19.4 20.4 19.7 20.0 20.9 20.3
Abruzzo 1.9 2.0 1.9 2.1 1.8 2.0 2.0 1.9 2.0
Molise 0.5 0.5 0.5 0.5 0.4 0.4 0.5 0.4 0.5
Campania 6.8 5.4 6.4 6.2 3.9 5.4 6.2 4.5 5.6
Puglia 5.5 4.5 5.2 4.8 3.3 4.3 4.9 3.9 4.5
Basilicata 1.0 0.9 0.9 0.8 0.6 0.8 0.8 0.7 0.8
Calabria 2.6 2.3 2.5 1.8 1.4 1.7 2.0 1.8 1.9
Sicilia 5.2 4.4 5.0 5.5 4.1 5.0 5.3 4.3 4.9
Sardegna 1.8 2.1 1.9 1.9 1.7 1.8 1.8 1.8 1.8
Southern Italy and Islands 25.2 22.3 24.3 23.6 17.1 21.2 23.6 19.3 22.0
Total 100.0 100.0 100.0 100.0 100.0 100.0 100.0 100.0 100.0
12
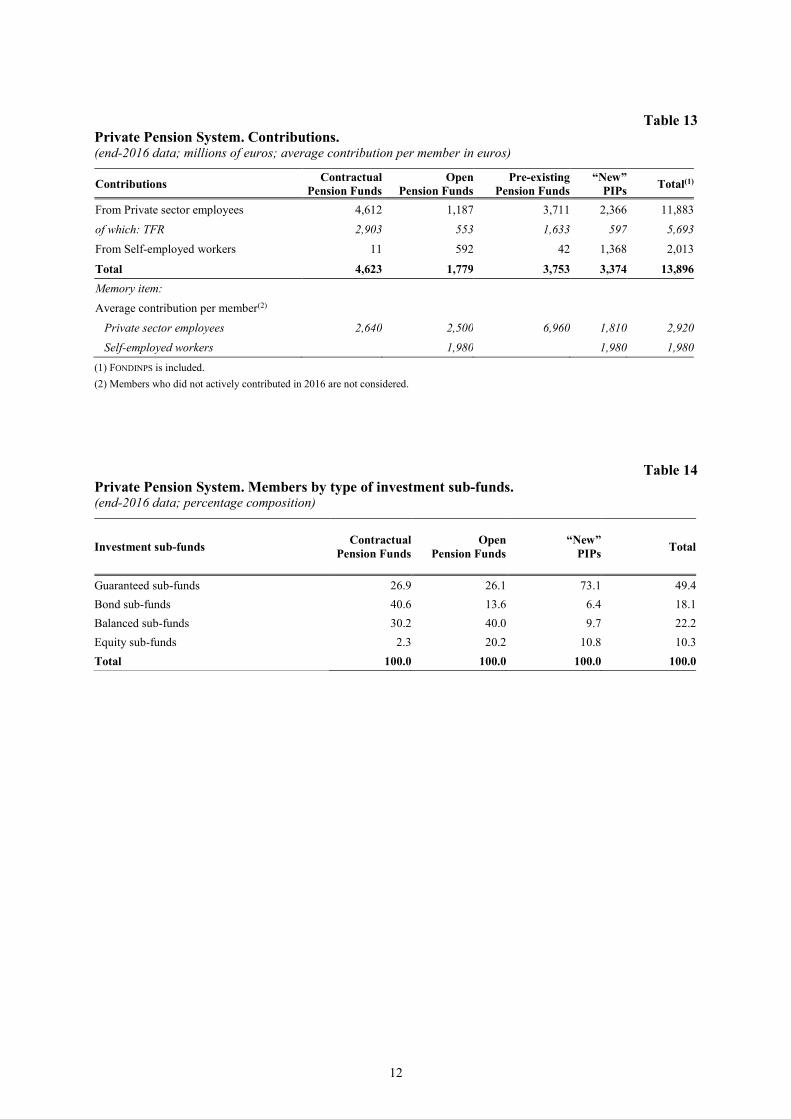
Table 13
Private Pension System. Contributions. (end-2016 data; millions of euros; average contribution per member in euros)
Contributions Contractual
Pension Funds
Open
Pension Funds
Pre-existing
Pension Funds
“New”
PIPs Total(1)
From Private sector employees 4,612 1,187 3,711 2,366 11,883
of which: TFR 2,903 553 1,633 597 5,693
From Self-employed workers 11 592 42 1,368 2,013
Total 4,623 1,779 3,753 3,374 13,896
Memory item:
Average contribution per member(2)
Private sector employees 2,640 2,500 6,960 1,810 2,920
Self-employed workers 1,980 1,980 1,980
(1) FONDINPS is included.
(2) Members who did not actively contributed in 2016 are not considered.
Table 14
Private Pension System. Members by type of investment sub-funds. (end-2016 data; percentage composition)
Investment sub-funds Contractual
Pension Funds
Open
Pension Funds
“New”
PIPs
Total
Guaranteed sub-funds 26.9 26.1 73.1 49.4
Bond sub-funds 40.6 13.6 6.4 18.1
Balanced sub-funds 30.2 40.0 9.7 22.2
Equity sub-funds 2.3 20.2 10.8 10.3
Total 100.0 100.0 100.0 100.0

13
Table 15
Private Pension System. Portfolio allocation and domestic assets. (end-2016 data, millions of euros; per cent)
Contractual
Pension Funds
Open
Pension Funds
Pre-existing
Pension
Funds (1)
“New” PIPs Total(2)
% % % % %
Cash and deposit 2,556 5.6 1,480 8.7 2,265 7.5 1,205 5.0 7,511 6.4
Sovereign bonds 25,532 55.6 6,886 40.3 9,952 32.8 12,129 50.8 54,554 46.5
of which: domestic 12,036 26.2 4,154 24.3 5,343 17.6 9,554 40.0 31,137 26.5
Other debt securities 6,175 13.4 997 5.8 4,058 13.4 5,760 24.1 17,000 14.5
of which: domestic 490 1.1 173 1.0 492 1.6 1,131 4.7 2,288 2.0
Equities 8,667 18.9 3,154 18.5 4,817 15.9 2,443 10.2 19,081 16.3
of which: domestic 472 1.0 237 1.4 265 0.9 153 0.6 1,127 1.0
UCITS 3,063 6.7 4,546 26.6 6,165 20.3 2,068 8.7 15,846 13.5
of which: real estate 24 .. 3 .. 1,473 4.9 142 0.6 1,642 1.4
Real estate - - - - - 7.5 - - 2,261 1.9
Other assets and liabilities -62 -0.1 30 0.2 812 2.7 280 1.2 1,060 0.9
Total 45,931 100.0 17,092 100.0 30,330 100.0 23,885 100.0 117,313 100.0
of which: domestic 12,998 28.3 4,564 26.7 6,100 20.1 10,838 45.4 34,552 29.5
Memory item:
Equity exposure (3) 22.9 41.3 23.6 18.2 24.8
(1) Data are referred to autonomous pension funds.
(2) FONDINPS is included.
(3) The “Look-through principle” has been applied to the mutual fund investments.

14
Table 16
Pension Funds and “New” PIPs. Net rates of return(1).
(per cent)
2008 2009 2010 2011 2012 2013 2014 2015 2016
Contractual Pension Funds
neneeennenegoziali -6.3 8.5 3.0 0.1 8.2 5.4 7.3 2.7 2.7
Guaranteed Sub-funds 3.1 4.6 0.2 -0.5 7.7 3.1 4.6 1.9 0.8
Bond Sub-funds 1.6 2.9 0.4 1.7 3.0 1.2 1.2 0.5 0.2
Mixed Bond sub-funds -3.9 8.1 3.6 1.1 8.1 5.0 8.1 2.7 3.2
Balanced Sub-funds -9.4 10.4 3.6 -0.6 9.2 6.6 8.5 3.2 3.2
Equity Sub.funds -24.5 16.1 6.2 -3.0 11.4 12.8 9.8 5.0 4.4
Open Pension Funds -14.0 11.3 4.2 -2.4 9.1 8.1 7.5 3.0 2.2
Guaranteed Sub-funds 1.9 4.8 0.7 -0.3 6.6 2.0 4.3 0.9 0.7
Bond Sub-funds 4.9 4.0 1.0 1.0 6.4 0.8 6.9 0.9 1.3
Mixed Bond sub-funds -2.2 6.7 2.6 0.4 8.0 3.6 8.0 2.2 1.4
Balanced Sub-funds -14.1 12.5 4.7 -2.3 10.0 8.3 8.7 3.7 2.7
Equity Sub.funds -27.6 17.7 7.2 -5.3 10.8 16.0 8.7 4.2 3.2
“New” PIPs
Traditional life policies
proprooopropro 3.1 3.1 3.2 3.2 3.3 3.2 2.9 2.5 2.1
Unit linked -21.9 14.5 4.7 -5.2 7.9 10.9 6.8 3.2 3.6
Bond Sub-funds 2.4 3.7 0.6 0.8 4.9 -0.3 3.3 0.6 0.4
Balanced Sub-funds -8.3 7.8 2.5 -3.5 6.4 5.8 8.2 1.9 1.5
Equity Sub-funds -32.4 20.6 6.7 -7.9 9.6 17.2 7.2 4.5 6.0
Memory Item:
TFR Revaluation Rate 2.7 2.0 2.6 3.5 2.9 1.7 1.3 1.2 1.5
(1) Rates of return are net of costs and taxes. Net rates of return of PIP are calculated according to the standardized methodology defined by COVIP.

15
Table 17
Pension Funds and “New” PIPs. Compounded average net annual rates of return(1). (per cent)
31.12.2015-
31.12.2016
31.12.2014-
31.12.2016
31.12.2013-
31.12.2016
31.12.2011-
31.12.2016
31.12.2006-
31.12.2016
31.12.1999-
31.12.2016
1 year 2 years 3 years 5 years 10 years 17 years
Contractual Pension Funds 2.7 2.7 4.2 5.2 3.3 3.1
Guaranteed sub-funds 0.8 1.3 2.4 3.6 - -
Bond sub-funds 0.2 0.4 0.6 1.2 1.5 -
Mixed Bond sub-funds 3.2 2.9 4.6 5.4 3.7 -
Balanced sub-funds 3.2 3.2 4.9 6.1 3.6 -
Equity sub-funds 4.4 4.7 6.4 8.6 3.3 -
Contractual Pension Funds 2.2 2.6 4.2 5.9 2.6 1.9
Guaranteed sub-funds 0.7 0.8 1.9 2.9 2.3 2.5
Bond sub-funds 1.3 1.1 3.0 3.2 2.9 3.0
Mixed bond sub-funds 1.4 1.8 3.8 4.6 3.0 3.1
Balanced sub-funds 2.7 3.2 5.0 6.6 3.1 2.4
Equity sub-funds 3.2 3.7 5.3 8.5 2.5 1.3
“New” PIPs
Traditional Life Policies 2.1 2.3 2.5 2.8 - -
Unit linked 3.6 3.4 4.5 6.4 - -
Bond sub-funds 0.4 0.5 1.4 1.8 - -
Balanced sub-funds 1.5 1.7 3.8 4.7 - -
Equity sub-funds 6.0 5.2 5.9 8.8 - -
Memory Item:
TFR Revaluation Rate 1.5 1.4 1.4 1.7 2.3 2.5
(1) Rates of return are net of costs and taxes. Net PIPs’ rates of return are calculated according to the standardised methodology defined by
COVIP.

16
Table 18
Pension Funds and “New” PIPs. Syntetic Cost Indicator(1). (end-2016 data; per cent)
Syntetic Cost Indicator (SCI)
2 years 5 year 10 years 35 years
Contractual Pension Funds (average) 1.0 0.6 0.4 0.3
Minimum 0.5 0.3 0.2 0.1
Maximum 3.0 1.4 0.9 0.6
Open Pension Funds (average) 2.3 1.5 1.3 1.2
Minimum 0.9 0.7 0.5 0.1
Maximum 5.1 3.4 2.8 2.4
“New” PIPs (average) 3.9 2.7 2.2 1.8
Minimum 1.0 0.9 0.6 0.4
Maximum 6.5 4.9 4.1 3.5
(1) Simple average.
Table 19
Pension Funds and “New” PIPs. Synthetic Cost Indicator (10 years). (end-2015 data; per cent; assets in millions of euros)
0,0
0,5
1,0
1,5
2,0
2,5
3,0
3,5
4,0
ISC
10
yea
rs
Assets (log scale)
Contractual pension funds
Open pension funds
PIP
755 10.00020 500 3.0001.0001 200

17
Table 20
Pension Funds and “New” PIPs. Synthetic Cost Indicator by investment sub-funds(1). (end-2016 data; per cent)
Investment sub-funds Syntetic Cost Indicator (SCI)
2 years 5 years 10 years 35 years
Guaranteed sub-funds
Contractual Pension Funds 1.1 0.6 0.5 0.3
Open Pension Funds 2.3 1.4 1.2 1.1
“New” PIPs(2) 3.7 2.4 1.9 1.4
Bond sub-funds
Contractual Pension Funds 1.0 0.5 0.4 0.2
Open Pension Funds 2.0 1.3 1.1 0.9
“New” PIPs 3.5 2.4 2.0 1.6
Balanced sub-funds
Contractual Pension Funds 1.0 0.5 0.4 0.2
Open Pension Funds 2.4 1.6 1.4 1.3
“New” PIPs 3.6 2.6 2.3 2.0
Equity sub-funds
Contractual Pension Funds 1.2 0.6 0.4 0.2
Open Pension Funds 2.8 1.9 1.7 1.6
“New” PIPs 4.5 3.2 2.7 2.3
(1) Synthetic Cost Indicators are calculated as a simple average of the indicators referred to each investment sub-fund.
(2) Traditional Life Insurance Policies.
Table 21
Pension Funds and “New” PIPs(1). Synthetic Cost Indicator (10 years) by investment sub-fund(2). (end 2016 data; per cent)
(1) Traditional Life Insurance Policies.
(2) The graph displays SCI of all sub-funds, classified according to the sub-funds’ investment categories (guaranteed, bond, balanced
or equity sub-funds). The graph also displays, for each sub-funds’ investment category, the average SCI for each category of pension
funds (contractual and open pension funds and PIPs).

18
Table 22
Contractual Pension Funds. Members by professional category. (end-2016 data)
Type of pension funds Number of
pension funds
Employees Self-employed
workers Total
Private
sector
Public
sector
Company and group of companies pension funds 8 300,053 - - 300,053
Industry-wide pension funds 25 1,977,644 139,518 5,539 2,122,701
Regional pension funds 3 123,037 50,944 287 174,268
Total 36 2,400,734 190,462 5,826 2,597,022
Table 23
Contractual Pension Funds. Members and assets by type of investment sub-funds. (end-2016 data)
Investment sub-funds Number of sub-funds
Members -
percentage
composition
Assets-
percentage composition
2015 2016 2015 2016 2015 2016
Guaranteed sub-funds 37 36 26.1 26.9 14.7 14.8
Bond sub-funds 3 3 8.9 8.7 7.0 7.0
Mixed bond sub-funds 20 20 32.3 31.9 41.8 41.3
Balanced sub-funds 33 33 30.5 30.2 33.3 33.5
Equity sub-funds 14 14 2.2 2.3 3.3 3.4
Total 107 106 100.0 100.0 100.0 100.0

19
Table 24
Contractual Pension Funds. Assets by type of financial intermediaries. (end period data; millions of euros, per cent)
Financial intermediaries
Number
of financial
intermediaries
Number
of mandates
Assets under
management
2015 2016
2015 2016 2015 2016
% %
Domestic financial intermediaries
Insurances 5 5 32 30 6,707 15.6 7,231 15.6
Asset management companies 14 13 113 115 15,922 37.1 17,582 38.0
Investment companies - - - - - - - -
Banks 2 2 12 16 2,249 5.2 2,887 6.2
Total 21 20 157 161 24,878 57.9 27,700 59.8
Other EU financial intermediaries 22 23 102 97 18,086 42.1 18,623 40.2
Total 43 43 259 258 42,964 100.0 46,323 100.0
Memory Item:
Assets directly managed by pension funds 43 71
Total assets 43,007 46,394

20
Table 25
Contractual Pension Funds. Main data. (end-2016 data)
Name of the pension fund Members Percentage
change
Potential
Members (1)
Participation
rate (%)
Assets
(millions of euros)
FONCHIM 149,103 2.1 191,500 77.9 5,578
FONDENERGIA 42,288 5.5 49,800 84.9 2,000
QUADRI E CAPI FIAT 11,802 1.4 17,800 66.3 563
COMETA 398,767 -0.9 1,000,000 39.9 10,210
FONDOSANITA' 5,539 7.8 804,000 0.7 157
SOLIDARIETA' VENETO 51,340 3.9 891,000 5.8 1,059
PREVIAMBIENTE 49,531 0.5 250,000 19.8 922
ALIFOND 47,270 0.0 248,000 19.1 1,299
LABORFONDS 115,760 1.3 245,000 47.2 2,375
COOPERLAVORO 72,201 0.3 349,300 20.7 944
FOPEN 44,222 -0.7 45,000 98.3 1,909
PEGASO 31,032 1.1 50,000 62.1 915
PREVICOOPER 30,739 -1.2 74,600 41.2 751
TELEMACO 59,201 -0.2 150,000 39.5 1,707
ARCO 30,059 -4.1 232,050 13.0 575
FONCER 14,048 -0.9 29,600 47.5 426
FONDAPI 52,168 20.8 500,000 10.4 685
PREVIMODA 58,377 0.1 400,000 14.6 1,084
CONCRETO 6,158 -2.9 9,500 64.8 183
FONTE 205,317 2.9 2,500,000 8.2 3,313
BYBLOS 34,333 9.4 200,000 17.2 766
GOMMAPLASTICA 49,108 0.9 100,000 49.1 1,170
MEDIAFOND 2,698 0.4 8,500 31.7 96
PREVAER 12,174 6.4 31,000 39.3 401
FILCOOP 9,374 -2.1 160,000 5.9 112
EUROFER 36,274 0.1 90,000 40.3 933
PREVEDI 643,355 26.7 570,000 112.9 573
PRIAMO 58,132 0.9 130,000 44.7 1,348
FOPADIVA 7,168 3.7 28,000 25.6 133
FONDOPOSTE 96,971 -0.1 134,400 72.2 1,918
ESPERO 100,506 0.7 1,200,000 8.4 910
ASTRI 8,796 2.3 15,000 58.6 257
AGRIFONDO 8,637 0.8 330,000 2.6 79
PREV.I.LOG. 8,537 0.8 100,000 8.5 143
PERSEO SIRIO 39,440 84.2 1,571,400 2.5 52
FONDAEREO 6,597 -4.3 8,700 75.8 384
TOTAL: 36 2,597,022 27.4 45,931
(1) Estimated data provided by pension funds.

21
Table 26
Open Pension Funds. Market Structure. (end period data, percentage composition)
2015 2016
Number of financial
intermediaries
Number of
Funds/
Sub-funds
Members
(%)
Assets
(%)
Number of
financial
intermediaries
Number
of
Funds/
Sub-
funds
Members
(%)
Assets
(%)
Type of financial intermediaries:
Insurances 28 40 62.9 58.4 26 33 62.9 57.3
Banks 1 1 2.1 2.8 1 1 2.3 3.0
Asset managment
companies 9 9 35.0 38.8 9 9 34.8 39.7
Investment companies - - - - - - - -
Total 38 50 100.0 100.0 36 43 100.0 100,0
Memory Item:
Open Pension Funds managed by the 5 larger
financial conglomerates (in terms of members)
14 61.2 60.7 13 61.2 60.0
Investment sub-funds
Guaranteed sub funds 66 28.6 24.9 48 26.1 23.1
Bond sub-funds 25 4.2 3.5 26 4.3 3.4
Mixed Bond sub-funds 24 7.7 7.5 27 9.3 9.9
Balanced sub-funds 61 38.4 38.2 54 40.0 38.4
Equity sub-funds 48 21.1 25.9 41 20.2 25.2
Total 224 100.0 100.0 196 100.0 100.0
Investment sub-funds by asset size
> 100 millions of euros 42 68.8 69.9
10 to 100 millions of euros 116 29.6 28.4
< 10 million of euros 66 1.6 1.7

22
Table 27
Open Pension Funds. Main data. (end-2016 data)
Name of the pension fund Name of the
promoting company Members
Assets
(millions of
euros)
ARCA PREVIDENZA ARCA SGR 178,752 3,284.6
IL MIO DOMANI INTESA SANPAOLO VITA 273,124 1,751.9
FIDEURAM FIDEURAM VITA 50,531 1,072.8
PREVIGEN GLOBAL GENERALI ITALIA 50,954 1,030.8
PREVIRAS (1) ALLIANZ ASSICURAZIONI 58,974 896.9
SECONDAPENSIONE AMUNDI SGR 37,065 812.4
UNIPOL PREVIDENZA UNIPOLSAI 43,124 807.6
PREVID-SYSTEM INTESA SANPAOLO VITA 34,591 799.4
AXAMPS PREVIDENZA PER TE AXA MPS VITA 69,694 668.9
ARTI E MESTIERI ANIMA SGR 44,132 643.6
AZIMUT PREVIDENZA AZIMUT SGR 34,257 585.1
PLURIFONDS ITAS 56,345 575.0
UNICREDIT PIONEER SGR 34,905 560.9
RAIFFEISEN CASSA CENTRALE RAIFFEISEN 28,980 510.1
AUREO BCC RISPARMIO & PREVIDENZA SGR 79,735 472.1
INSIEME ALLIANZ ASSICURAZIONI 18,527 331.5
EURORISPARMIO PREVIDENZA SELLA SGR 23,613 263.3
AZIONE DI PREVIDENZA HDI ASSICURAZIONI 20,818 216.5
AZUR PREVIDENZA (2) CREDEMVITA 15,179 216.5
TESEO REALE MUTUA ASSICURAZIONI 11,890 196.9
AXAMPS PREVIDENZA AZIENDA AXA MPS VITA 15,420 165.1
PREVIGEST FUND MEDIOLANUM MEDIOLANUM FONDI 4,669 164.8
UBI PREVIDENZA AVIVA ASSICURAZIONI VITA 11,628 154.1
ALMEGLIO ALLEANZA ASSICURAZIONI 12,889 122.5
PROGRAMMA OPEN GROUPAMA ASSICURAZIONI 6,566 119.4
SOLUZIONE PREVIDENTE HELVETIA VITA ASSICURAZIONI 8,077 85.4
CATTOLICA GESTIONE
PREVIDENZA CATTOLICA ASSICURAZIONI 7,531 80.3
GIUSTINIANO INTESA SANPAOLO VITA 2,533 68.1
BIM VITA BIM VITA ASSICURAZIONI 1,477 66.1
AVIVA AVIVA SPA 3,665 65.3
ZED OMNIFUND ZURICH INSURANCE ASSICURAZIONI 2,268 59.7
UNICREDIT CREDITRAS VITA 2,504 44.5
UNICREDIT CREDITRAS VITA 2,504 44.5
RISPARMIO & PREVIDENZA CATTOLICA PREVIDENZA 3,065 37.9
ZURICH CONTRIBUTION ZURICH INVEST ASSICURAZIONI 1,808 33.4
CREDIT VITA CREDIT AGRICOLE VITA 2,312 32.2
RISPARMIO & PREVIDENZA CATTOLICA PREVIDENZA 3,065 37.9
ZURICH CONTRIBUTION ZURICH INVEST ASSICURAZIONI 1,808 33.4
CREDIT VITA CREDIT AGRICOLE VITA 2,312 32.2
AXA AXA ASSICURAZIONI 1,792 25.6
VITTORIA FORMULA LAVORO VITTORIA ASSICURAZIONI 1,288 19.0
PREVISUISSE NATIONALE SUISSE ASSICURAZIONI 1,007 12.0
BAP PENSIONE BANCASSURANCE POPOLARI 1,129 10.9
MELOGRANO ASSIMOCO VITA 686 9.0
POPOLARE VITA POPOLARE VITA 532 7.5
HELVETIA DOMANI HELVETIA VITA ASSICURAZIONI 387 6.2
PENSPLAN PROFI PENSPLAN INVEST 556 6.0
Total
1,261,483
17,136

23
Table 28
“New” PIPs. Market structure. (end period data; percentage composition)
2015 2016
Number of “New” PIPs 78 78
Number of Insurance companies 37 37
Members Assets Members Assets
Investment lines
Traditional Life Policies 73.4 73.8 73.1 74.2
Unit-linked 26.6 26.2 26.9 25.8
Bond investment lines 6.7 4.5 6.4 4.1
Balanced investment lines 8.8 8.1 9.7 8.2
Equity investment lines 11.1 13.6 10.8 13.4
Total 100.0 100.0 100.0 100.0
Investment lines by assets size
> 100 millions of euros 85.8 87.3 87.3 88.9
10 to 100 millions of euro 10.8 11.3 10.2 10.1
< 10 millions of euros 3.4 1.4 2.5 1.0
Memory Item:
PIPs of the 5 larger insurance undertakings (in terms of members) 83.1 80.6 80.9 81.7

24
Table 29
“New” PIP. Main data. (end-2016 data)
Name of the pension
fund
Name of the
promoting company Members
Assets
(millions of
euros)
POSTA PREVIDENZA POSTE VITA 870,684 4,708.9
TAXBENEFIT NEW MEDIOLANUM VITA 168,602 3,027.3
ALLEATA PREVIDENZA ALLEANZA ASSICURAZIONI 438,320 2,862.8
VALORE PENSIONE GENERALI ITALIA 195,932 2,394.7
INA ASSITALIA PRIMO GENERALI ITALIA 191,733 2,114.4
ORIZZONTE PREVIDENZA ALLIANZ 105,142 1,539.7
VIPENSIONO ZURICH INVESTMENTS LIFE 62,281 856.3
GENERAFUTURO GENERALI ITALIA 117,453 587.8
BG PREVIDENZA ATTIVA GENERTELLIFE 23,329 429.6
AXA MPS PREVIDENZA ATTIVA AXA MPS ASSICURAZIONI VITA 93,160 414.3
IL MIO FUTURO INTESA SANPAOLO VITA 83,506 337.0
UNIPOL FUTURO PRESENTE UNIPOLSAI ASS 35,104 300.4
PIP PROGETTO PENSIONE INTESA SANPAOLO VITA 14,328 293.0
AXA PROGETTO PENSIONE PIU' AXA ASSICURAZIONI 20,697 276.5
CENTO STELLE REALE REALE MUTUA ASS 18,916 248.2
FUTURO ATTIVO GENERTELLIFE 28,234 221.0
PENSIONLINE GENERTELLIFE 23,906 197.8
POPOLARE VITA PENSIONE SICURA POPOLARE VITA 42,674 189.3
FONDIARIA PIU PENSIONE UNIPOLSAI ASSICURAZIONI 18,874 176.3
VIVIPENSIONE GENERALI ITALIA 15,758 168.8
PIANO PENSIONISTICO BAYERISCHE T4036 ERGO PREVIDENZA 33,570 150.1
INTEGRAZIONEPENSIONISTICAAURORA UNIPOLSAI ASSICURAZIONI 17,406 145.5
PROGRAMMA PENSIONE ZURICH INVESTMENTS LIFE 8,102 139.8
POPOLARE VITA PREVIDENZA POPOLARE VITA 13,975 120.6
CATTOLICAPREVIDENZAPERLAPENSIONE CATTOLICA ASSICURAZIONI 19,721 119.2
FUTURO PER TE ERGO PREVIDENZA 541 118.7
CENTO STELLE TAXPLAN REALE MUTUA ASSICURAZIONI 8,228 107.3
VITA&PREVIDENZA SANPAOLO PIU' INTESA SANPAOLO VITA 6,318 101.0
MILANO PIU PENSIONE UNIPOLSAI ASSICURAZIONI 7,131 86.1
PIANO PENSIONISTICO BAYERISCHE T4026 ERGO PREVIDENZA 19,939 84.0
HELVETIA AEQUA HELVETIA VITA 7,757 81.2
PIP VITTORIA VITTORIA ASSICURAZIONI 11,948 81.0
AVIVA TOP PENSION AVIVA 3,778 75.6
MIA PENSIONE AXA ASSICURAZIONI 11,203 72.1
NG - NUOVA GENERAZIONE ERGO PREVIDENZA 8,245 68.4
AXA MPS PREVIDENZA PERSONALE AXA MPS ASSICURAZIONI VITA 4,838 68.1
FEELGOOD ITALIANA ASSICURAZIONI 8,453 66.5
PLANNER ITALIANA ASSICURAZIONI 6,927 64.0
DOMANI SICURO PLUS UNIQA PREVIDENZA 3,903 51.6
PROGRAMMA PER TE GROUPAMA ASSICURAZIONI 7,198 45.0
CATTOLICA PREVIDENZA PROGETTO
PENSIONE BIS CATTOLICA ASSICURAZIONI 4,306 41.0
BNL PIANOPENSIONE CARDIF VITA 3,225 38.9
PREVINEXT PLATINUM LOMBARDA VITA 2,442 32.8
PROGRESSIVE PENSION PLAN ARCA VITA 1,573 32.3
SARA MULTISTRATRATEGY SARA VITA 1,598 23.2
MODUS BCC VITA 2,353 22.3
PREVIDENZA HDI HDI ASSICURAZIONI 2,191 22.3
PIANO SASA UNIPOLSAI ASSICURAZIONI 2,029 22.0

25
Name of the pension
fund
Name of the
promoting company Members
Assets
(millions of
euros)
LIBERO DOMANI SARA VITA 2,694 21.1
PUNTALTO CATTOLICA ASSICURAZIONI 1,292 20.9
CREDIT AGRICOLE VITA PENSIONE PIU CREDIT AGRICOLE VITA 2,403 20.8
CBA PREVIDENZA CBA VITA 3,730 20.7
UNICREDIT PREVIDENZA CRV CREDITRAS VITA 3,180 20.5
PROGETTO PENSIONE SICURA UNIQA LIFE 5,729 20.5
CREDIT AGRICOLE VITA PROGETTO
PREVIDENZA CREDIT AGRICOLE VITA 4,222 20.4
DOMANI SICURO UNIQA PREVIDENZA 801 16.0
ELIOS PREVID 2007 ANTONVENETA VITA 1,125 15.9
TAX QUALIFIED ANNUITY III PRAMERICA LIFE 1,878 13.6
GROUPAMA GROUPAMA ASSICURAZIONI 917 13.3
OUVERTURE 2007 BANCASSURANCE POPOLARI 946 13.0
EUROVITA FUTURO EUROVITA ASSICURAZIONI 83 10.1
UNICREDIT PENSIONE CNP CNP UNICREDIT VITA 1,527 9.9
PREVIPIU HELVETIA VITA 639 6.5
BAPCRESCENDOPREVIDENTE BANCASSURANCE POPOLARI 742 5.4
SENIORVITA VALORE FUTURO CNP UNICREDIT VITA 400 4.6
STILNOVO ERGO PREVIDENZA 608 4.0
UNICREDI FUTURO AVIVA AVIVA 491 3.8
PIANO PENSIONISTICO BAYERISCHE T4046 ERGO PREVIDENZA 26,748 3.8
PENSIONE SICURA NEW HELVETIA VITA 285 3.7
GUARDO AVANTI NEW CATTOLICA ASSICURAZIONI 189 3.2
PREVINEXT LOMBARDA VITA 167 3.1
NUOVA PENSIONE GENERTELLIFE 179 3.0
PENSIONE SICURA HELVETIA VITA 338 2.6
AVIVA AVIVA 1,285 1.7
ERGO ERGO PREVIDENZA 494 1.6
ARC LIFE LINE UNIQA PREVIDENZA 138 1.5
PRO FUTURO AVIVA VITA 51 1.0
FUTURO PENSIONE ZURICH INVESTMENTS LIFE 8,665 0.0
Total 2,869,477 23,711.2

26
Table 30
Pre-existing Pension Funds. Number of pension funds. (end-2016 data)
Pension fund regime Type of pension funds
Total Autonomous Non-autonomous
Defined contribution pension funds 149 3 152
of which: pension funds which pay annuities directly 5 - 5
Defined benefit pension funds 17 91 108
Hybrid pension funds 21 13 34
Total 187 107 294
Table 31
Pre-existing Pension Funds. Assets. (end period data; millions of euros)
2015 2016
Autonomous pension funds 52,267 55,068
Non-autonomous pension funds 3,032 2,470
internal to banks 2,598 2,050
internal to insurance undertakings 28 25
internal to non-financial institutions 407 395
Total 55,299 57,538
Of which:
Technical provisions within insurance companies 23,273 24,770
Table 32
Autonomous Pre-existing Pension Funds. Type of asset management. (end period data; percentage composition)
2015 2016
Assets directly managed by pension funds 22.8 23.4
Assets managed by financial intermediaries 31.3 30.8
Technical provision within insurance companies 45.9 45.8
Total 100.0 100.0

27
Table 33
Autonomous Pre-existing Pension Funds(1). Main data. (end 2016 data)
Name of the pension fund Regime Members Beneficiaries
Assets
(millions of
euros)
PREVINDAI - FONDO PENSIONE DC 80,206 3,538 10,174
FONDO PENSIONE A CONTRIBUZIONE DEFINITA DEL GRUPPO INTESA SANPAOLO
DC 64,246 197 4,768
FONDO PENSIONE PER IL PERSONALE DELLE AZIENDE DEL GRUPPO
UNICREDIT MIX 36,860 11,921
3,133
FONDO DI PREVIDENZA PER I DIRIGENTI DI AZIENDE COMMERCIALI
E DI SPEDIZIONE E TRASPORTO MARIO NEGRI DC 33,729 5,615
2,593
FONDO PENSIONE NAZIONALE PER IL PERSONALE DELLE BANCHE DI CREDITO COOPERATIVO / CASSE RURALI ED ARTIGIANE
DC 31,307 118 2,098
PREVIP FONDO PENSIONE DC 26,486 151 2,066
FONDO PENSIONE PREVIBANK DC 25,625 196 1,942
FONDO PENSIONI PER IL PERSONALE CARIPLO MIX 5,301 3,765 1,869
FONDO PENSIONE COMPLEMENTARE PER I DIPENDENTI DELLA
BANCA MONTE DEI PASCHI DI SIENA S.P.A. DIVENUTI TALI DALL'1.1.1991
DC 21,976 32 1,398
FONDO PENSIONE PER IL PERSONALE DELL'EX BANCA DI ROMA MIX 9,115 15,734 1,244
FONDO PENSIONI DEL PERSONALE DEL GRUPPO BNL / BNP PARIBAS ITALIA
MIX 16,089 1,517 1,228
FONDO PENSIONE PER GLI AGENTI PROFESSIONISTI DI
ASSICURAZIONE MIX 21,317 10,998 1,159
CASSA DI PREVIDENZA INTEGRATIVA PER IL PERSONALE DELL'ISTITUTO BANCARIO S. PAOLO DI TORINO
DB 5,978 6,490 1,011
FONDO PENSIONE DEI DIPENDENTI DELLE SOCIETA' DEL GRUPPO
GENERALI DC 17,129 664 988
CASSA DI PREVIDENZA AZIENDALE PER IL PERSONALE DEL MONTE
DEI PASCHI DI SIENA. MIX 4,414 2,713 958
PREVIGEN, CASSA DI PREVIDENZA INTEGRATIVA PER I DIPENDENTI DELLE AZIENDE CONVENZIONATE - FONDO PENSIONE
DC 9,457 247 859
FONDO PENSIONE DI PREVIDENZA BIPIEMME DC 7,682 26 599
FONDO PENSIONE DEL GRUPPO UBI BANCA, DELLA BANCA POPOLARE DI BERGAMO E DELLE ALTRE SOCIETA' CONTROLLATE
DC 8,478 180 562
FONDO PENSIONE COMPLEMENTARE DEI GIORNALISTI ITALIANI DC 11,486 4 558
FONDO PENSIONI PER IL PERSONALE DEL GRUPPO BANCO POPOLARE
MIX 8,046 50 540
FONDO PENSIONE COMPLEMENTARE PER IL PERSONALE DEL
BANCO DI NAPOLI MIX 492 5,904 529
FONDO PENSIONE GRUPPO CARIPARMA CREDIT AGRICOLE DC 8,092 4 504
FONDO PENSIONE CAIMOP DC 9,150 108 474
FONDO PENSIONI PER IL PERSONALE DELLA EX CASSA DI RISPARMIO DI TORINO - BANCA CRT S.P.A.
MIX 2,082 2,851 474
FONDO PENSIONE PER IL PERSONALE DELLA DEUTSCHE BANK S.P.A. DC 4,294 244 413
FONDO PENSIONE PER I DIPENDENTI IBM DC 5,958 50 392
CASSA DI PREVIDENZA DEI DIPENDENTI DEL GRUPPO CREDITO
EMILIANO - FONDO PENSIONE DC 5,672 4 333
PREVINDAPI - FONDO PENSIONE PER I DIRIGENTI E I QUADRI SUPERIORI DELLA PICCOLA E MEDIA INDUSTRIA
DC 3,942 117 318
CASSA DI PREVIDENZA - FONDO PENSIONE DEI DIPENDENTI DELLA
RAI RADIOTELEVISIONE ITALIANA SOCIETÀ PER AZIONI E DELLE ALTRE SOCIETA' DEL GRUPPO RAI
DC 7,385 1 316
FONDO PENSIONE CASSA DI PREVIDENZA DEI DIPENDENTI DI
SOCIETÀ DEL GRUPPO FONDIARIA-SAI DC 4,181 19 311
FONDO PENSIONE COMPLEMENTARE PER IL PERSONALE DELL'EX GRUPPO BANCA POPOLARE DI NOVARA - GRUPPO BANCO
POPOLARE
DC 3,913 196 308
FONDO PENSIONE DEI DIPENDENTI DELLE IMPRESE DEL GRUPPO UNIPOL
DC 5,598 19 304
FONDO PENSIONE COMPLEMENTARE DEI LAVORATORI DI SOCIETA' DEL GRUPPO UBI ADERENTI
DC 4,646 157 296
FONDO INTEGRATIVO DI PREVIDENZA MONTEDISON - FONDO
PENSIONE DC 7,301 - 282

28
Name of the pension fund Regime Members Beneficiaries
Assets
(millions of
euros)
FONDO PENSIONE PREVILABOR DC 5,945 - 184
FONDO PENSIONE DELLE SOCIETA' ESERCIZI AEROPORTUALI -
FONSEA CD 5,049 2 180
FONDO PENSIONI PER IL PERSONALE DELLA CASSA CENTRALE DI
RISPARMIO V.E. PER LE PROVINCE SICILIANE - PALERMO DB 3,929 170 154
FONDO NAZIONALE DI PREVIDENZA PER I LAVORATORI DEI
GIORNALI QUOTIDIANI FIORENZO CASELLA MIX 6,960 15,081 67
Total 539,516 89,083
45,585
Other “old” pension funs 101,241 13,544 9,483
Autonomous pension funds 640,757 102,627 55,067.8
Non autonomous pension funds 13,214 15,735 2,469.8
Total 653,971 118,362 57,537.6
(1) “Old” pension funds with more than 4.000 members and beneficiaries (they represent 80 per cent of the total market).

29
Table 34
Private Pension System. Time series. (end period data)
Years Contractual
Pension Funds
Open
Pension Funds
Pre-existing
Pension Funds “New” PIPs “Old” PIPs Total(1)
Number of pension funds
1999 33 88 618 - - 739
2000 42 99 578 - - 719
2001 41 102 575 - - 718
2002 44 95 554 - - 693
2003 42 96 510 - - 648
2004 41 92 494 - - 627
2005 43 89 455 - - 587
2006 42 84 448 - - 574
2007 42 81 433 72 - 629
2008 41 81 411 75 - 609
2009 39 76 391 75 - 582
2010 38 69 375 76 - 559
2011 38 67 363 76 - 545
2012 39 59 361 76 - 536
2013 39 58 330 81 - 509
2014 38 56 323 78 - 496
2015 36 50 304 78 - 469
2016 36 43 294 78 - 452
Members of pension funds
1999 701,127 136,305 573,256 - - 1,410,688
2000 877,523 223,032 591,555 - - 1,692,110
2001 984,567 287,251 687,482 - 201,108 2,160,408
2002 1,021,186 337,600 679,603 - 357,313 2,395,702
2003 1,042,381 364,604 671,474 - 508,757 2,587,216
2004 1,062,907 382,149 666,841 - 628,176 2,740,073
2005 1,155,168 407,022 657,117 - 744,023 2,963,330
2006 1,219,372 440,486 643,986 - 880,380 3,184,224
2007 1,988,639 747,264 680,746 486,017 703,400 4,560,164
2008 2,043,509 795,605 676,994 701,819 674,332 4,850,782
2009 2,040,150 820,385 673,039 893,547 654,376 5,055,284
2010 2,010,904 848,415 668,625 1,160,187 610,098 5,272,579
2011 1,994,280 881,311 664,731 1,451,995 573,336 5,536,554
2012 1,969,771 913,913 662,162 1,794,835 534,816 5,848,727
2013 1,950,552 984,584 654,537 2,134,038 505,110 6,203,673
2014 1,944,276 1,057,038 645,371 2,356,674 467,255 6,447,186
2015 2,419,103 1,150,132 645,612 2,600,790 433,753 7,234,858
2016 5,597,022 1,258,979 653,971 2,869,477 411,242 7,787,488
- to be continued -

30
- continues– Table 34
Years Contractual
Pension Funds
Open
Pension Funds
Pre-existing Pension
Funds “New” PIPs “Old” PIPs Total(1)
Assets (millions of euros)
1999 544 234 19,859 - - 20,637
2000 1,190 552 21,269 - - 23,011
2001 2,256 943 29,578 - 193 32,970
2002 3,264 1,230 29,531 - 617 34,642
2003 4,543 1,731 30,057 - 1,278 37,609
2004 5,881 2,230 30,617 - 2,150 40,878
2005 7,615 2,954 33,400 - 3,338 47,307
2006 9,257 3,527 34,246 - 4,546 51,576
2007 11,599 4,298 36,054 1,020 4,770 57,747
2008 14,092 4,663 35,906 1,958 4,667 61,302
2009 18,757 6,269 39,813 3,397 5,569 73,827
2010 22,384 7,533 42,007 5,229 5,980 83,167
2011 25,272 8,364 43,818 7,196 5,996 90,687
2012 30,174 10,078 47,972 9,813 6,273 104,363
2013 34,504 11,990 50,398 13,014 6,499 116,465
2014 39,644 13,980 54,033 16,369 6,850 130,941
2015 42,546 15,430 55,299 20,056 6,950 140,351
2016 45,931 17,092 57,538 23,711 6,931 151,278 (1) FONDINPS is included.
Table 35
Private Pension System. Rates of returns. Time series(1). (per cent)
Years Contractual
Pension Funds
Open
Pension Funds
“New” PIPs
Traditional Life
Policies
“New” PIPs
United-linked
TFR
revaluation rate
1999 - 24.0 - - 3.1
2000 3.5 2.9 - - 3.5
2001 -0.5 -5.6 - - 2.9
2002 -3.4 -13.1 - - 3.1
2003 5.0 5.7 - - 2.8
2004 4.6 4.3 - - 2.5
2005 7.5 11.5 - - 2.6
2006 3.8 2.4 - - 2.4
2007 2.1 -0.4 - - 3.1
2008 -6.3 -14.0 3.1 -21.9 2.7
2009 8.5 11.3 3.1 14.5 2.0
2010 3.0 4.2 3.2 4.7 2.6
2011 0.1 -2.4 3.2 -5.2 3.5
2012 8.2 9.1 3.3 7.9 2.9
2013 5.4 8.1 3.2 10.9 1.7
2014 7.3 7.5 2.9 6.8 1.3
2015 2.7 3.0 2.5 3.2 1.2
2016 2.7 2.2 2.1 3.6 1.5
(1) Rates of return are net of costs and taxes (under the legislation in force). Net rates of return of PIPs are calculated according to the
standardised methodology defined by COVIP.

31
GLOSSARY
Contractual Pension Funds (CPFs): they are established through collective bargaining
between employers’ associations and trade unions that may be negotiated at the levels of
company or group of companies, of industrial or economic sector, as well as with reference to
specific geographical areas. CPFs only support occupational pension plans and have legal
personality (i.e. there is a legal separation between the pension fund and the sponsor).
FONDINPS: the pension fund foreseen by Law no. 243 of 2004 (see below) and laid down by
Legislative Decree no. 252 of 2005 (see below). FONDINPS receives contributions from tacit
adhesions in case the collective bargaining did not indicate any contractual pension fund where
to invest silent members’ contributions.
Open Pension Funds (OPFs): they are promoted by banks, insurance companies, asset
management companies. They support both occupational and personal plans. They do not have
legal personality; nonetheless, their assets are required to be separated with respect to those of
the financial company managing them.
“New” PIPs: individual pension plans realised through life insurance contracts, instituted after
the entry into force of Legislative Decree no. 252 of 2005. They are subject to the same rules
applied to new pension funds with respect to members’ rights, portability and transparency.
Offered by insurance companies, they only support personal plans. They do not have legal
personality; nonetheless, their assets are required to be separated with respect to those of the
insurance company sponsoring them. They could be with-profit (traditional policies) or unit-
linked policies.
“Old” PIPs: individual pension plans realized through life insurance contracts, instituted
before the entry into force of Legislative Decree no. 252 of 2005. They are not allowed to collect
new members.
Pre-existing Pension Funds (Old Pension Funds): they were already operating before the
entry into force of Legislative Decree no. 124 of 1993. They are both autonomous and non-
autonomous (book reserves); they are structured as defined contribution and defined benefit
schemes (they are not open to new members).
Pre-existing pension funds continue operating without substantial changes, as they do not have
to apply all the rules provided for pension funds instituted after 1993; in particular, they can
directly manage their assets and invest in real estate.
Synthetic Cost Indicator (SCI): an indicator aimed at easily communicating all the costs
charged on a member (over the accumulation phase) in percentage of the assets of his individual
account. The SCI has to be computed according to a methodology defined by COVIP, which is
common for all the different kinds of pension funds. SCI of each investment option has to be
displayed on the information document to be made available to members (Informazioni chiave
per l’Aderente) and on COVIP website (http://www.covip.it/isc_dinamico).

32
TFR (Trattamento di fine rapporto) – the TFR is a sort of severance pay scheme that the
employer has to pay to the employee in the case of dismissal or retirement. With this aim, the
employer sets aside 6.91 per cent of the gross salary of the employee on a monthly basis. The
accrued stock of TFR, which is accounted as a book reserve in the balance sheet of the
employer, appreciates on an annual basis according to a CPI-linked formula.
* * *
Legislative Decree no. 124 of 1993: first piece of legislation that defined tasks and powers of
the Pension Funds Supervisory Authority (Commissione di Vigilanza sui Fondi Pensione –
COVIP) and regulated the establishment and operation of new pension funds (contractual
pension funds and open pension funds – see above). These pension funds are set up on a
voluntary basis, they have to be funded and based on the defined contribution method. Before
the entry into force of Legislative Decree, pre-existing pension funds (see above) were already
operating.
Legislative Decree no. 252 of 2005: this is the masterpiece of the pension funds sector’s
legislation. It provided that private employees enrolled for the first time in their working life
have to choose where to transfer their TFR in a pension plan or to keep it in their company. In
case of no active choice by the employee after a six-month period, the TFR is automatically
paid into an occupational pension fund (typically, the industry-wide occupational fund or to
Fondinps – see above). A less risky portfolio is set as the default option for tacit adhesion. On
the basis of the provisions of the collective agreements, the employees can decide to add further
contributions in order to get matching contributions from the employers. Additional voluntary
contributions are allowed as well particular emphasis is given to transparency and
comparability between all kinds of pension plans.