ommundsen, marius loen
TRANSCRIPT
UPHEAVAL BUCKLING OF BURIED PIPELINES
Master thesis at the University of Stavanger
Marius Loen Ommundsen
Stavanger, 29th
of June 2009
Upheaval buckling simulation from an experiment
Upheaval Buckling of Buried Pipelines Master of Science Thesis
___________________________________________________________________________
The University of Stavanger / IKM Ocean Design ii
Summary
This thesis is divided into two parts. The first part consists of an introduction to theory and
design aspects regarding the subject of thermal buckling with main focus on buried pipelines.
The second part introduces the reader to the experiments performed in this thesis, including
the analytical tests performed in ANSYS followed by a presentation of the derived results.
Analysis of the results, conclusions and recommendations for further work is presented in the
final chapter.
A lifting experiment was performed to detect and analyze the resistance provided by different
soils. Upheaval buckling experiments were performed to detect a general behavior of a pipe in
different upheaval buckling scenarios.
Several scenarios regarding upheaval buckling were tested including;
- Upheaval buckling over an imperfection with gravel, sand and clay as cover
respectively
- Upheaval buckling with a trenched pipe without cover in granular soils
- Creep scenario simulating a pipeline going in and out of service while buried in clay
- Upheaval buckling with various imperfection heights while buried in clay
Most of the experiments provided interesting results, and some unforeseen happenings with
the experiments in clay led to tough challenges. This also made some of the intended
objectives for the thesis hard to fulfill.
All performed experiments are presented graphically in the appendix. A CD with videos from
the experiments, analytical calculation summaries and measured data is attached to this thesis
available for external overview and verification.
It is recommended that you watch the video before reading.

Upheaval Buckling of Buried Pipelines Master of Science Thesis
___________________________________________________________________________
The University of Stavanger / IKM Ocean Design iii
Preface
This thesis has been written in the spring of 2009 as the final examination before achieving
my master degree in Offshore Systems – Marine and Subsea Technology at the University of
Stavanger. The thesis has been defined in cooperation with IKM Ocean Design, Forus. The
assembling and construction of the test rig was performed at the concrete lab at the University
of Stavanger. The experiments were carried out at a barn at Nærbø, which during this period
functioned as a test laboratory. IKM Ocean design provided office space at their location,
where most of the writing and the analytical part of the thesis was performed.
During this period employees at the University of Stavanger and IKM Ocean Design has
given useful advice and guidance to help me with the thesis. I have also received help from
friends and family as some parts of the experiments could not be carried out alone. Persons
who deserve a great thank you are;
Employees at the University of Stavanger;
Professor Ove Tobias Gudmestad who has been my supervisor. He has given valuable
guidance on design of the test rig, performing of the experiments and given
continuously feedback on the writing of the report during the whole progression of the
thesis.
John Grønli, teacher, who has helped with funds and introduced me to the concrete lab
where geotechnical tests were performed. He ordered the polycarbonate plates used in
the test rig. He has also given useful advice on performing the experiments and
preparation of the clay.
Ahmad Yaseen Amith, teacher, for teaching me how to use the measuring equipment
and mounting of strain gauges, scaling the load cell, using the Catman software and
the Spider 8 amplifier.
Samdar Kakay, employee, for being a great support as we both worked in the concrete
lab with separate projects. He has also given me valuable guidance on how to perform
geotechnical measures of the soils.
Employees at IKM Ocean Desing;
Engineering manager Per Nystrøm for providing funds and office space, guidance on
performing experiments and defining relevant problems.
Kristin Sandvik, engineer, for advice on how to design the test rig, as she had
experience in performing similar experiments. [4]
Ingar Stava, engineer, for useful advice on performing the experiments and advice on
mounting the strain gauges. He was also present at one of the first experiments carried
out.
Norman Vikse, engineer for introducing me into the scripts used for analytical
calculations in ANSYS. He has used a lot of his time helping me with the analysis.
Line Newermann, engineer, for helping me getting the analysis running.

Upheaval Buckling of Buried Pipelines Master of Science Thesis
___________________________________________________________________________
The University of Stavanger / IKM Ocean Design iv
Juan Giong, engineer, for suggestions to get the analysis running properly.
All employees at IKM Ocean Design`s location for showing interest in the thesis.
Stavanger 29.06.09
Marius Loen Ommundsen
Upheaval Buckling of Buried Pipelines Master of Science Thesis
___________________________________________________________________________
The University of Stavanger / IKM Ocean Design v
Contents
Summary ............................................................................................................................... ii
Preface ................................................................................................................................. iii
Contents .................................................................................................................................v
Nomenclature and abbreviations ......................................................................................... viii
Table of figures ......................................................................................................................x
List of tables ....................................................................................................................... xiii
1. Introduction ....................................................................................................................1
2. Objectives .......................................................................................................................2
3. Buried pipelines ..............................................................................................................3
3.1 Purpose of burying pipelines .........................................................................................3
3.2 Installation ....................................................................................................................3
3.2.1 Jetting ....................................................................................................................4
3.2.2 Mechanical cutting .................................................................................................4
3.3 Cover ............................................................................................................................4
3.3.1 Cohesive soil ..........................................................................................................4
4. Upheaval Buckling Theory .............................................................................................6
4.1 General .........................................................................................................................6
4.2 Upheaval buckling failure modes ..................................................................................7
4.3 Driving force ................................................................................................................7
4.3.1 Derivation of driving force .....................................................................................7
4.3.2 Effective expansion force in DNV codes ................................................................9
4.4 Strategies for analysis of upheaval buckling movements [3] ........................................ 11
4.4.1 Strategy 1: Deriving universal design curve.......................................................... 11
4.4.2 Strategy 2: External force required to hold the pipe in position ............................. 13
4.5 Measurements preventing upheaval buckling .......................................................... 14
4.5.1 Uplift resistance in non cohesive soils .................................................................. 15
4.5.2 Uplift resistance in cohesive soils ......................................................................... 16
4.5.2.1 Local failure mode ............................................................................................ 16
4.5.2.2 Global failure mode ........................................................................................... 17
4.6 Brief look at upheaval buckling design according to Det Norske Veritas ..................... 18
4.6.1 Step 1: Specific cover design ................................................................................ 20
4.6.2 Step 2: Minimum cover design ............................................................................. 22
Upheaval Buckling of Buried Pipelines Master of Science Thesis
___________________________________________________________________________
The University of Stavanger / IKM Ocean Design vi
4.6.3 Step 3: Specification of cover ............................................................................... 23
4.6.4 Step 4: Pipe integrity check ...................................................................................... 24
5. Experiment ................................................................................................................... 25
5.1.1 Pipe ...................................................................................................................... 25
5.1.2 Material properties for Copper pipe ...................................................................... 25
5.1.3 Geometric parameters .......................................................................................... 25
5.1.4 Hydraulic cylinder and jack .................................................................................. 25
5.2 Measuring equipment .................................................................................................. 26
5.2.1 Loadcell ............................................................................................................... 26
5.2.2 Strain gauges ........................................................................................................ 26
5.2.3 Spider 8 ................................................................................................................ 28
5.2.4 PC with Catman software ..................................................................................... 28
5.2.5 Geonor H60 hand-held vane tester........................................................................ 29
5.2.6 Speedy Moisture Tester ........................................................................................ 29
5.2.7 Balance scale and cylinder ................................................................................... 30
5.2.8 Metric measure .................................................................................................... 30
5.2.9 Reel ..................................................................................................................... 31
5.3 Experiment description ............................................................................................... 32
5.3.1 Lifting test............................................................................................................ 32
5.3.2 Upheaval buckling test ......................................................................................... 35
5.3.2.1 Upheaval buckling tests description ................................................................... 35
5.3.2.2 Orientation of measuring points ......................................................................... 36
5.4 Soil data ...................................................................................................................... 41
5.4.1 Gravel .................................................................................................................. 41
5.4.2 Sand used in experiments ..................................................................................... 42
5.4.3 Clay used in experiments...................................................................................... 43
6. Finite element method – analysis .................................................................................. 44
6.1 Preprocessing .............................................................................................................. 44
6.2 Solution ...................................................................................................................... 44
6.3 Post processing ........................................................................................................... 44
7. Results .......................................................................................................................... 45
7.1. Results from lifting tests ............................................................................................ 45
7.1.1 Results from lifting tests in gravel ........................................................................ 45
Upheaval Buckling of Buried Pipelines Master of Science Thesis
___________________________________________________________________________
The University of Stavanger / IKM Ocean Design vii
7.1.2 Results from lifting in sand .................................................................................. 46
7.1.3 Results from lifting in clay ................................................................................... 47
7.1.4 Ratio between diameter and resistance ................................................................. 48
7.2 Results from upheaval buckling tests .......................................................................... 49
7.2.1 General behavior of pipe in experiments .............................................................. 49
7.2.2 Results from buckling experiments without cover ................................................ 52
7.2.3 Max axial force in upheaval buckling experiments ............................................... 54
7.2.4 Length of exposed pipe and vertical deflection ..................................................... 55
7.2.5 Strain in pipe with various cover heights .............................................................. 58
7.2.6 Creep tests in clay ................................................................................................ 60
7.2.7 Various imperfections with clay as cover ............................................................. 62
7.3 Comparison of experimental - and analytical results.................................................... 64
7.3.1 ANSYS results from upheaval buckling tests in gravel ......................................... 65
7.3.2 ANSYS results from upheaval buckling in sand ................................................... 67
7.3.3 ANSYS results from upheaval buckling in clay – 33mm imperfection .................. 69
7.3.4 ANSYS results from upheaval buckling in clay – 18mm imperfection .................. 71
8. Analysis of results......................................................................................................... 73
8.1 Lifting experiment ...................................................................................................... 73
8.2 Upheaval buckling experiment .................................................................................... 74
8.2.1 Upheaval buckling results in gravel ...................................................................... 74
8.2.2 Upheaval buckling results in sand ........................................................................ 74
8.2.3 Upheaval buckling results in clay ......................................................................... 74
8.2.4 Creep test ............................................................................................................. 75
8.2.5 Various imperfections in clay ............................................................................... 75
8.3 Analysis of ANSYS results ......................................................................................... 75
8.3.1 Gravel as cover .................................................................................................... 75
8.3.2 Sand as cover ....................................................................................................... 75
8.3.3 Clay as cover........................................................................................................ 76
8.4 Sources of errors ......................................................................................................... 76
8.5 Conclusions ................................................................................................................ 77
8.6 Suggestions for further work ....................................................................................... 78
References ............................................................................................................................ 79
Appendix……………………………………………………………………………………..80.

Upheaval Buckling of Buried Pipelines Master of Science Thesis
___________________________________________________________________________
The University of Stavanger / IKM Ocean Design viii
Nomenclature and abbreviations
Abbrevations
ROV Remotely Operated Vehicle
DNV Det Norske Veritas
ULS Ultimate Limit State
FEM Finite Element Method
OD Outside diameter
ID Inside diamter
1D One times Diameter cover height
2D Two times Diameter cover height
Nomenclature
𝜍𝐻 = Circumferential stress
𝑝 = Internal pressure
𝑅 = Radius
𝑡 = wall thickness
휀𝐿 = Longitudinal strain
𝐸 = Young`s modulus
𝑠𝐿 = Longitudinal stress
𝛼 = Linear thermal expansion coefficient
𝜃 = Change in temperature
𝜈 = Poisson`s ratio = 0.3
𝑆0 = Effective axial force
𝐻 = Residual lay tension
Δ𝑝𝑖 = Internal pressure difference compared to as laid.
𝐴𝑖 = Internal area
𝜐 = Poisson`s Ratio
𝐴𝑠 = Area of the steel
∆𝑇 = Temperature increase compared to temperature during installation
y = height
x = horizontal distance
H = imperfection height
L = imperfection length
q = Total download (including resistance from cover if buried and own weight)
F = Flexural rigidity
P = Longitudinal compressive forced
Rm = Mean radius between external and internal radius
𝑞′ = Uplift resistance
𝛾 = Submerged weight of soil
𝐻 = Height from top of pipe to seabed surface (top of cover)
𝐷 = Total diameter including coating
𝑓 = Uplift coefficient determined experimentally
𝛾 ′ = Submerged weight of soil
𝜙 = Frictional angle
𝐾 = Lateral earth pressure coefficient accounting for increased stress in vertical
direction
𝑁𝑐 = Theoretical bearing capacity coefficient
Upheaval Buckling of Buried Pipelines Master of Science Thesis
___________________________________________________________________________
The University of Stavanger / IKM Ocean Design ix
𝜂 = Empirical factor based on field tests
𝑠𝑢 = Undrained shear strength at centre of pipe
𝑟 = Roughness factor for pipe
𝑠 𝑢 = Average undrained shear strength from centre of pipe to top of cover
γUR = Safety factor
ζconfiguration = Accuracy of surveys
𝑇 𝑘𝐵𝐸 = Temperature at which failure occurs whit best estimate downward stiffness
𝑇𝑓𝑎𝑖𝑙𝑢𝑟𝑒 = Temperature at which failure occurs
𝑝𝑙𝑖 = Local incidental pressure
𝑅𝑐 = Sand and rock uplift resistance
𝛾𝑈𝑅 = Safety factor
𝑘𝐵𝐸 = Best estimate downward stiffness
𝑇 𝑘𝐿𝐵 = Temperature at which failure occur whit lower bound downward stiffness
𝑘𝐿𝐵 = Lower bound downward stiffness
𝛿 = Prop imperfection
𝑇𝑅𝑑 = Design resistance equivalent failure temperature
𝑇𝑅𝑑 = Design resistance equivalent failure temperature
Hmin, = Minimum cover height
Rmin = Minimum soil resistance
Hspec , = Specified cover height
Rspec = Specified soil resistance
For figure 4.5
y = height of arbitrary profile
x = horizontal distance
P = Longitudinal force
S = Shear force
q = External vertical force per unit length
Upheaval Buckling of Buried Pipelines Master of Science Thesis
___________________________________________________________________________
The University of Stavanger / IKM Ocean Design x
Table of figures
Figure 3.1 Cross section of buried pipeline [1] ...................................................................3
Figure 3.3 Schematic display of backfill options [2] ...........................................................4
Figure 4.1 Buried pipe in compression ...............................................................................6
Figure 4.2 Effective axial force in pipe wall with free and fixed ends [7] .......................... 10
Figure 4.3 Effective axial force in a short straight pipeline [7] ......................................... 10
Figure 4.4 Universal design curve [4] ............................................................................... 12
Figure 4.5 Element dx for deriving external force qdx ...................................................... 13
Figure 4.6 Dimensions for pipe cover [1] ......................................................................... 15
Figure 4.7 Uplift resistance in clay – local failure mode ................................................... 16
Figure 4.8 Uplift resistance in clay – global failure mode ................................................. 17
Figure 4.9 Structural design flow chart [1] ....................................................................... 18
Figure 4.10 Deriving design resistance equivalent failure temperature, TRd [1] ................ 20
Figure 5.1 Enerpac hydraulic cylinder and jack ................................................................ 26
Figure 5.2 Load cell mounted on the end of the piston rod of the hydraulic pump. ............ 26
Figure 5.3 Schematic guide for mounting of SG wires to 15 pin socket for single
directional strain gauges. ...................................................................................................... 27
Figure 5.4 Strain gauges mounted on dummy and the pipe used for experiment, 15 pin
socket in the back. ................................................................................................................ 27
Figure 5.5 Schematic view of mounting for torsion strain gauges. ........................................ 28
Figure 5.6 Spider 8 data acquisition amplifier................................................................... 28
Figure 5.7 Geonor H-60 hand-held vane tester ................................................................. 29
Figure 5.8 Speedy moisture tester ..................................................................................... 29
Figure 5.9 Pipe exposed after experiment and metric measurer to detect the vertical
deflection. ....................................................................................................... 30
Figure 5.10 Reel used to lift the pipe .............................................................................. 31
Figure 5.11 The lifting test rig ........................................................................................ 32
Upheaval Buckling of Buried Pipelines Master of Science Thesis
___________________________________________________________________________
The University of Stavanger / IKM Ocean Design xi
Figure 5.12 Edge cross section of lifting system ............................................................. 33
Figure 5.13 Deriving lifting force per meter .................................................................... 34
Figure 5.14 Upheaval buckling test rig............................................................................ 35
Figure 5.15 Edge cross section of pipe and gravel showing the prop imperfection .......... 36
Figure 5.16 Positions where strain gauges are mounted on the pipe used for clay, sand and
gravel............................................................................................................. 37
Figure 5.17 The blue line indicates the curvature of the pipe during the experiments ...... 37
Figure 5.18 Strain gauge configurations for the backup pipe ........................................... 38
Figure 5.19 Pipe exposed post buckling .......................................................................... 38
Figure 5.20 Load distribution from overlaid soil ............................................................. 39
Figure 5.21 Grain size distribution curve for gravel. ....................................................... 41
Figure 5.22 Grain size distribution curve for sand. .......................................................... 42
Figure 5.23 Grain size distribution curve for clay ........................................................... 43
Figure 7.1 Resistance in gravel ......................................................................................... 45
Figure 7.2 Resistance in sand ........................................................................................... 46
Figure 7.3 Resistance in clay ............................................................................................ 47
Figure 7.4 Resistance for 10mm pipe ............................................................................... 48
Figure 7.5 Resistance for 22mm pipe ............................................................................... 48
Figure 7.6 Resistance for 28mm pipe ............................................................................... 48
Figure 7.7 Results from a random experiment .................................................................. 49
Figure 7.8 Curvature variation post until max force .......................................................... 50
Figure 7.9 Curvature variation post max force .................................................................. 50
Figure 7.10 Load versus strain ........................................................................................ 51
Figure 7.11 Buckling of trenched pipe ............................................................................ 52
Figure 7.12 Max axial force in upheaval buckling experiments ...................................... 54
Figure 7.13 Curvature of exposed length - 10mm gravel cover ....................................... 55
Figure 7.14 Curvature of exposed length - 20mm gravel cover ....................................... 55
Upheaval Buckling of Buried Pipelines Master of Science Thesis
___________________________________________________________________________
The University of Stavanger / IKM Ocean Design xii
Figure 7.15 Curvature of exposed pipe - 40mm gravel cover .......................................... 56
Figure 7.16 Curvature of exposed length - 10mm sand cover .......................................... 56
Figure 7.17 Curvature of exposed length - 20mm sand cover .......................................... 57
Figure 7.18 Curvature of exposed length - 40mm sand cover .......................................... 57
Figure 7.19 Curvature of pipe – red lines indicating sagbend and overbend positions...... 58
Figure 7.20 Measured strains at center of pipe above the imperfection ............................ 58
Figure 7.21 Measured strains at sagbend 1 ...................................................................... 59
Figure 7.22 Measured strains at sagbend 2 ...................................................................... 60
Figure 7.23 Creep scenario experiment measures ............................................................ 60
Figure 7.24 Measured strain pre and post loading in creep test ........................................ 61
Figure 7.25 Axial strain comparison for pipe covered with gravel at overbend ................ 65
Figure 7.26 Axial strain comparison for pipe covered with 20mm gravel ........................ 65
Figure 7.27 Axial strain comparison for pipe covered with 40mm gravel ........................ 66
Figure 7.28 Axial strain comparison for pipe covered with sand ..................................... 67
Figure 7.29 Axial strain comparison for pipe covered with sand at sagbend 1 ................ 67
Figure 7.30 Axial strain comparison for pipe covered sand at sagbend 2 ......................... 68
Figure 7.31 Axial strain comparison for pipe covered with clay at overbend – 33mm
imperfection................................................................................................... 69
Figure 7.32 Axial strain comparison for pipe covered with clay at sagbend 1 - 33mm
imperfection................................................................................................... 69
Figure 7.33 Axial strain comparison for pipe covered with clay at sagbend 2 – 33mm
imperfection................................................................................................... 70
Figure 7.34 Axial strain comparison for pipe covered clay at center of pipe – 18mm
imperfection................................................................................................... 71
Figure 7.35 Axial strain comparison for pipe covered with clay at sagbend 1 – 18mm
imperfection................................................................................................... 71
Figure 7.36 Axial strain comparison for pipe covered with clay at sagbend 2 – 18mm
imperfection................................................................................................... 72
Figure 8.1 Cross section of buried pipe and soil column ................................................... 73
Upheaval Buckling of Buried Pipelines Master of Science Thesis
___________________________________________________________________________
The University of Stavanger / IKM Ocean Design xiii
List of tables
Table 4-1 Governing pipe integrity check [1] ........................................................................ 24
Table 5-1 Enerpac RC 1014 specifications ............................................................................ 25
Table 5-2 Different cover heights for the lifting experiments ................................................ 33
Table 5-3 Density calculation for gravel ............................................................................... 41
Table 5-4 Test matrix for gravel ........................................................................................... 39
Table 5-5 Density calculation for sand ................................................................................. 42
Table 5-6 Test matrix for sand .............................................................................................. 40
Table 5-7 Test matrix for clay ............................................................................................... 40
Table 7-1 Resistance in gravel .............................................................................................. 45
Table 7-2 Resistance in sand ................................................................................................. 46
Table 7-3 Resistance in clay ................................................................................................. 47
Table 7-4 Results from no cover experiments ....................................................................... 52
Table 7-5 Results from trench experiments ........................................................................... 53
1. Introduction
In the offshore industry, submarine pipelines are used to transport hydrocarbons from a
production facility to a receiving terminal. Pipelines can in some cases be buried under the
seabed due to stability issues, risk of impact with fishing gear and due to other causes.
When production starts through a pipeline, internal temperature and pressure will rise. The
temperature increase will lead to thermal expansion of the steel. A pipeline will be restrained
variously along the routing due to soil friction, and the temperature rise will result in axial
compressive forces in the pipe. As a response to the longitudinal compressive force
interacting with local curvature of the pipe, global buckling may occur.
A pipeline can buckle downwards in a free span, sideways on the seabed or upwards for
buried pipelines. Vertical buckling of a pipeline is called upheaval buckling, and the direction
of the buckle is upwards because this is the way of least resistance. If a vertical buckle leads
the pipe into exposure on the seabed, this is a severe problem. An expensive and time
consuming operation is needed to re cover the pipe at this location. If the buckle damages the
pipeline, this part must be replaced before re covering takes place.
Upheaval Buckling of Buried Pipelines Master of Science Thesis
___________________________________________________________________________
The University of Stavanger / IKM Ocean Design 2
2. Objectives
This thesis will deal with upheaval buckling of buried pipelines. Some theory behind the
phenomenon of upheaval buckling is covered, and two types of experiments are carried out,
where one is simulating an upheaval buckling occurrence in different soil conditions, and the
other is a lifting experiment to detect the resistance in different soil materials. The purpose of
this lifting experiment is to compare the resistance in different soil materials used as cover for
buried pipelines. A 10 mm, a 22 mm and a 28 mm outside diameter Copper pipe will be
buried in a test box with clay, gravel and sand as cover materials separately. Further the pipe
will be lifted out of the mass by wires and a rotating reel. The forces needed to lift out the
pipe will be measured by load cells, and a comparison of the forces will be performed for the
different cover materials. Additional points with this experiment is to try to document the
angle of the rupture lines in the cover materials, as well as finding a ratio between the
resistance in the cover material, and the pipe diameter.
The upheaval buckling tests are performed with different cover materials and different cover
heights. In order to make the pipe buckle, a hydraulic pump will push on the front end of the
pipe, while the pipe is constrained at the counter end. The axial force from the pump will lead
the pipe into compression. The pipe will have a slight vertical curvature initially to trigger the
buckle upwards. The axial force will be increased continuously until the pipe has broken
trough the surface of the cover material. A load cell will be attached to the hydraulic pump to
measure the axial force. Strain gauges will be attached at certain positions of the pipe to
monitor strain in the pipe. Further the vertical deflection of the pipe will be measured. Tests
will be performed with various cover heights. As for the lifting experiments the materials used
will be sand, gravel and clay. By the monitored strain at different locations the behavior of the
pipe will be studied. The capabilities of the different soils to prevent the pipe from buckling
will be decided by the axial force needed to make the pipe buckle. In addition a creep scenario
simulating a pipeline going in and out of service will be performed. Two imperfection heights
are also used for the experiments in clay, to find a relation between the imperfection height
and axial force.
Analytical calculations of the experiments will be performed using the finite element method
software ANSYS. The purpose for the analytical analysis is to compare the results with the
derived test data gathered from the experiments.
Upheaval Buckling of Buried Pipelines Master of Science Thesis
___________________________________________________________________________
The University of Stavanger / IKM Ocean Design 3
3. Buried pipelines
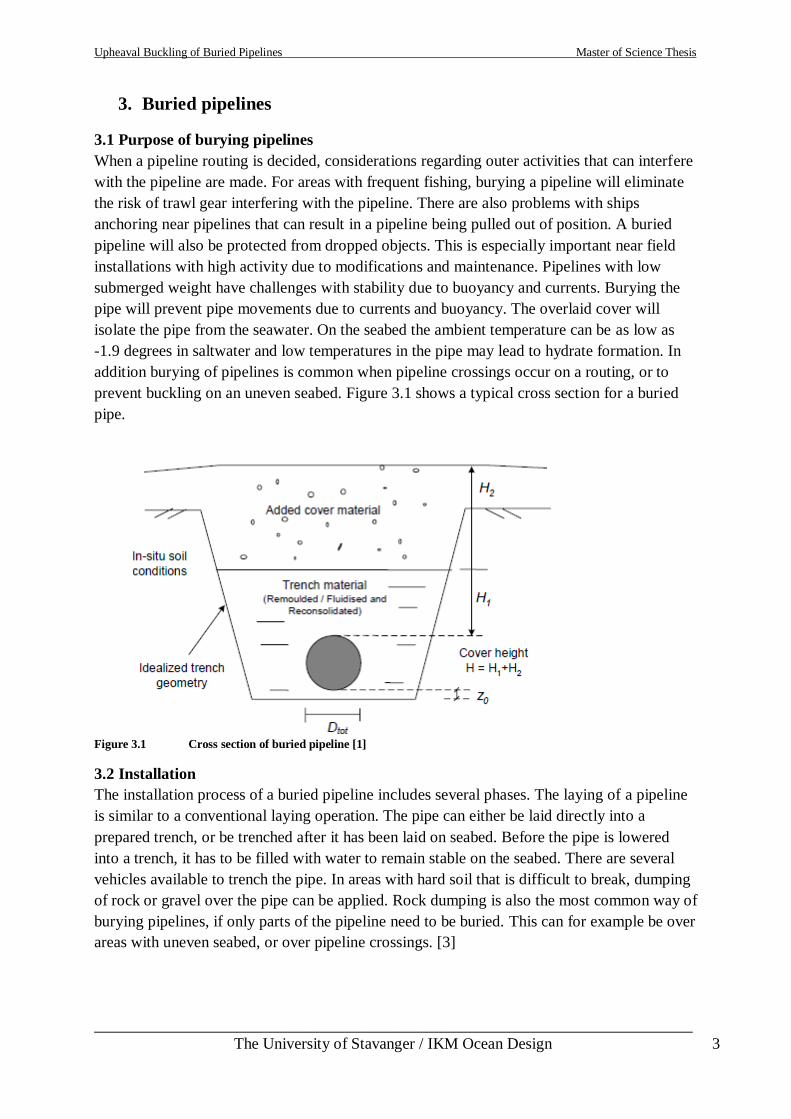
3.1 Purpose of burying pipelines
When a pipeline routing is decided, considerations regarding outer activities that can interfere
with the pipeline are made. For areas with frequent fishing, burying a pipeline will eliminate
the risk of trawl gear interfering with the pipeline. There are also problems with ships
anchoring near pipelines that can result in a pipeline being pulled out of position. A buried
pipeline will also be protected from dropped objects. This is especially important near field
installations with high activity due to modifications and maintenance. Pipelines with low
submerged weight have challenges with stability due to buoyancy and currents. Burying the
pipe will prevent pipe movements due to currents and buoyancy. The overlaid cover will
isolate the pipe from the seawater. On the seabed the ambient temperature can be as low as
-1.9 degrees in saltwater and low temperatures in the pipe may lead to hydrate formation. In
addition burying of pipelines is common when pipeline crossings occur on a routing, or to
prevent buckling on an uneven seabed. Figure 3.1 shows a typical cross section for a buried
pipe.
Figure 3.1 Cross section of buried pipeline [1]
3.2 Installation
The installation process of a buried pipeline includes several phases. The laying of a pipeline
is similar to a conventional laying operation. The pipe can either be laid directly into a
prepared trench, or be trenched after it has been laid on seabed. Before the pipe is lowered
into a trench, it has to be filled with water to remain stable on the seabed. There are several
vehicles available to trench the pipe. In areas with hard soil that is difficult to break, dumping
of rock or gravel over the pipe can be applied. Rock dumping is also the most common way of
burying pipelines, if only parts of the pipeline need to be buried. This can for example be over
areas with uneven seabed, or over pipeline crossings. [3]
Upheaval Buckling of Buried Pipelines Master of Science Thesis
___________________________________________________________________________
The University of Stavanger / IKM Ocean Design 4
3.2.1 Jetting
A jetting system consists of a jetting vehicle and an assisting vehicle or barge. The jetting
vehicle can typically be a ROV, remotely operated vehicle that receives power and signals
through an umbilical from an assisting vessel. The vehicle flushes the seabed through jets
with a high pressure fluid stream, eroding the seabed. Sand pumps are applied to move the
spoil. The vehicle straddles the pipeline with one leg on each side and it is possible to perform
several passes to reach a desired trench depth [3].
3.2.2 Mechanical cutting
A mechanical cutting machine has mounted equipment that can pick out the soil under the
pipe. The machine is equipped with dredge pumps that suck the soil and ejects it to a
suggested side. The machine can transport itself by wheels, and the orientation of the cutting
blades can decide the angle of the slope sides of the trench [3].
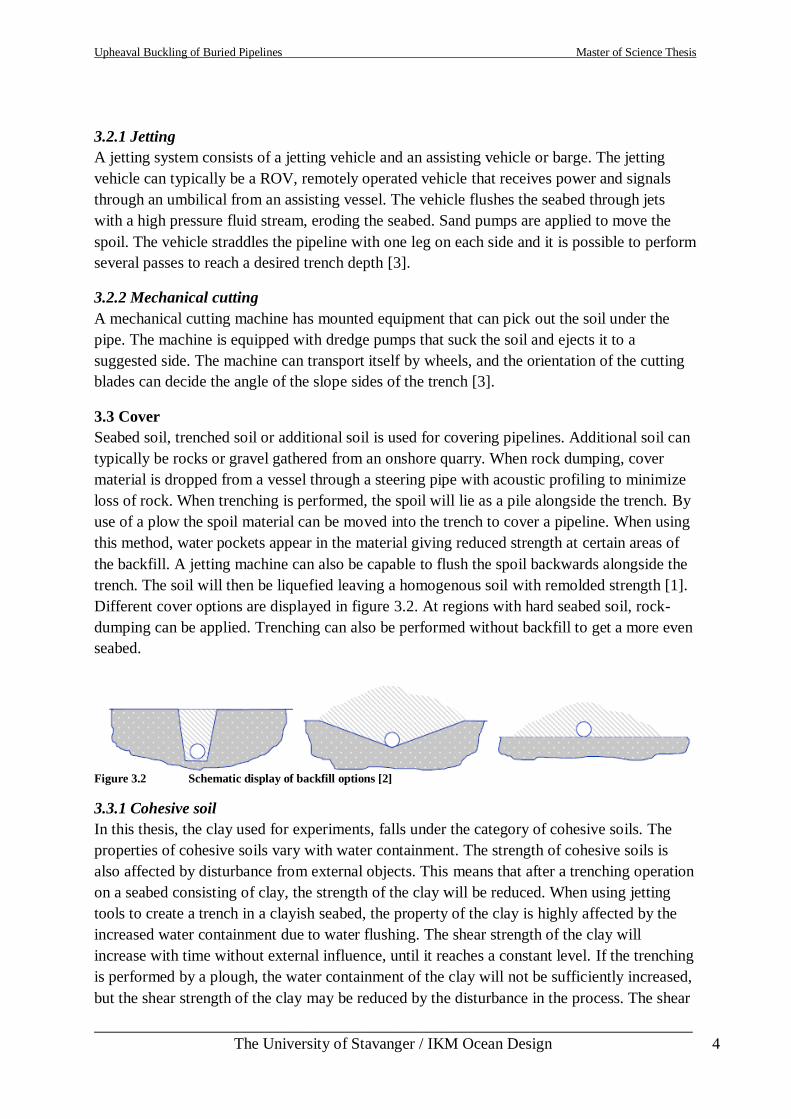
3.3 Cover
Seabed soil, trenched soil or additional soil is used for covering pipelines. Additional soil can
typically be rocks or gravel gathered from an onshore quarry. When rock dumping, cover
material is dropped from a vessel through a steering pipe with acoustic profiling to minimize
loss of rock. When trenching is performed, the spoil will lie as a pile alongside the trench. By
use of a plow the spoil material can be moved into the trench to cover a pipeline. When using
this method, water pockets appear in the material giving reduced strength at certain areas of
the backfill. A jetting machine can also be capable to flush the spoil backwards alongside the
trench. The soil will then be liquefied leaving a homogenous soil with remolded strength [1].
Different cover options are displayed in figure 3.2. At regions with hard seabed soil, rock-
dumping can be applied. Trenching can also be performed without backfill to get a more even
seabed.
Figure 3.2 Schematic display of backfill options [2]
3.3.1 Cohesive soil
In this thesis, the clay used for experiments, falls under the category of cohesive soils. The
properties of cohesive soils vary with water containment. The strength of cohesive soils is
also affected by disturbance from external objects. This means that after a trenching operation
on a seabed consisting of clay, the strength of the clay will be reduced. When using jetting
tools to create a trench in a clayish seabed, the property of the clay is highly affected by the
increased water containment due to water flushing. The shear strength of the clay will
increase with time without external influence, until it reaches a constant level. If the trenching
is performed by a plough, the water containment of the clay will not be sufficiently increased,
but the shear strength of the clay may be reduced by the disturbance in the process. The shear
Upheaval Buckling of Buried Pipelines Master of Science Thesis
___________________________________________________________________________
The University of Stavanger / IKM Ocean Design 5
strength of the clay will generally regain, depending on the consolidation process, but the
uplift resistance is not reliable shortly after a jetting process [1].
Upheaval Buckling of Buried Pipelines Master of Science Thesis
___________________________________________________________________________
The University of Stavanger / IKM Ocean Design 6
4. Upheaval Buckling Theory
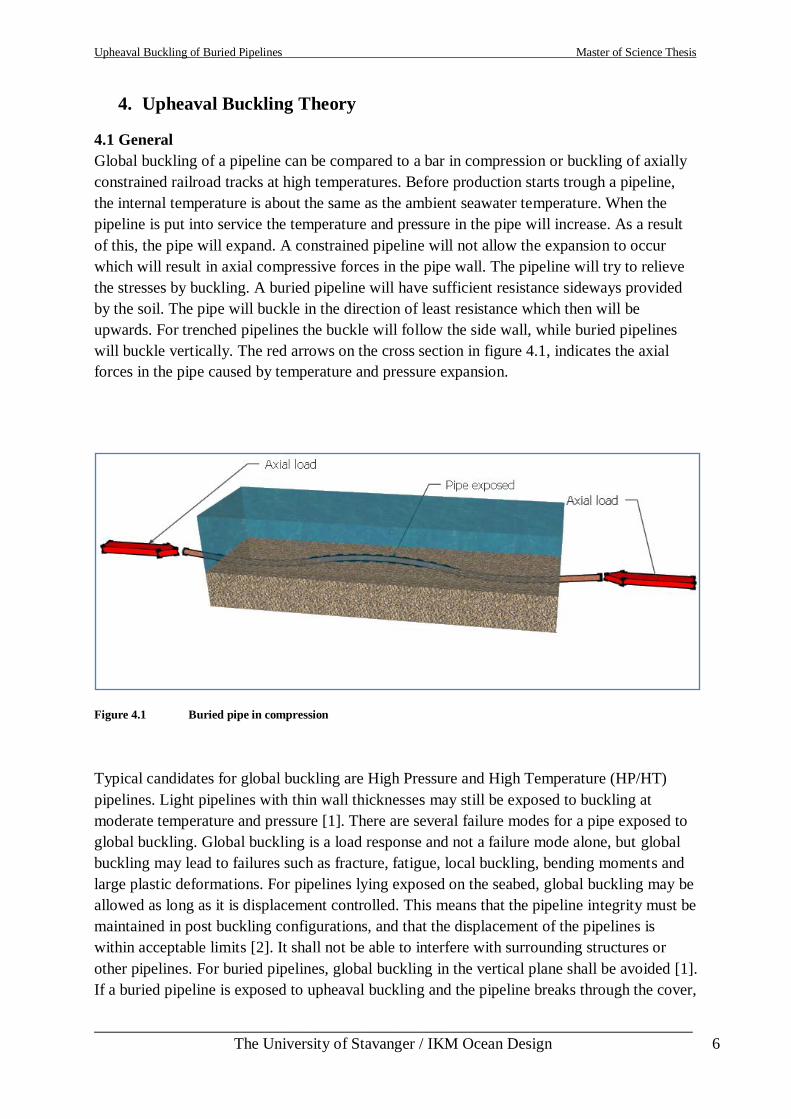
4.1 General
Global buckling of a pipeline can be compared to a bar in compression or buckling of axially
constrained railroad tracks at high temperatures. Before production starts trough a pipeline,
the internal temperature is about the same as the ambient seawater temperature. When the
pipeline is put into service the temperature and pressure in the pipe will increase. As a result
of this, the pipe will expand. A constrained pipeline will not allow the expansion to occur
which will result in axial compressive forces in the pipe wall. The pipeline will try to relieve
the stresses by buckling. A buried pipeline will have sufficient resistance sideways provided
by the soil. The pipe will buckle in the direction of least resistance which then will be
upwards. For trenched pipelines the buckle will follow the side wall, while buried pipelines
will buckle vertically. The red arrows on the cross section in figure 4.1, indicates the axial
forces in the pipe caused by temperature and pressure expansion.
Figure 4.1 Buried pipe in compression
Typical candidates for global buckling are High Pressure and High Temperature (HP/HT)
pipelines. Light pipelines with thin wall thicknesses may still be exposed to buckling at
moderate temperature and pressure [1]. There are several failure modes for a pipe exposed to
global buckling. Global buckling is a load response and not a failure mode alone, but global
buckling may lead to failures such as fracture, fatigue, local buckling, bending moments and
large plastic deformations. For pipelines lying exposed on the seabed, global buckling may be
allowed as long as it is displacement controlled. This means that the pipeline integrity must be
maintained in post buckling configurations, and that the displacement of the pipelines is
within acceptable limits [2]. It shall not be able to interfere with surrounding structures or
other pipelines. For buried pipelines, global buckling in the vertical plane shall be avoided [1].
If a buried pipeline is exposed to upheaval buckling and the pipeline breaks through the cover,
Upheaval Buckling of Buried Pipelines Master of Science Thesis
___________________________________________________________________________
The University of Stavanger / IKM Ocean Design 7
there are additional failure modes for such a scenario. The protection provided from the cover
is lost, and if the curvature of the buckle leaves a gap between the pipe and seabed, a free span
is formed. The pipeline may then be vulnerable to fatigue due to vortex induced vibrations at
this region. If a buckle leads a pipeline into exposure on the seabed, the simplest solution
would be to stabilize the pipeline at its new position. This can be done by covering the
exposed part, for example by rock dumping. However if the integrity of the pipeline is
reduced and the pipe wall is overstressed, this may lead to rupture. Then the damaged part
will have to be replaced, before stabilizing it again [3].
4.2 Upheaval buckling failure modes
Failure modes for buried pipelines exposed on seabed due to upheaval buckling are:
- fracture
- fatigue
- local buckling
- plastic deformations
- bending moment and stress
Failures caused by pipe being exposed are;
- interference with fishing gear
- damage due to dropped objects
- damage due to anchoring
- temperature drop leading to hydrate formation in the pipe
- instability due to currents and buoyancy
- vortex induced vibrations
- fatigue
4.3 Driving force
4.3.1 Derivation of driving force
This derivation of the driving force for upheaval and lateral buckling is based on a thin walled
tube idealization [3]. For situations with no external pressure circumferential stress, ζH, is
statically determined and given by equation 4.1;
𝜍𝐻 =𝑝𝑅
𝑡 (4.1)
where;
𝜍𝐻 = Circumferential stress
𝑝 = Internal pressure
𝑅 = Radius
𝑡 = wall thickness
The longitudinal strain along the pipeline is given by the relationship between stress and
strain for linear elastic isotropic material as in equation 4.2;
Upheaval Buckling of Buried Pipelines Master of Science Thesis
___________________________________________________________________________
The University of Stavanger / IKM Ocean Design 8
휀𝐿 =1
𝐸 −𝜈𝜍𝐻 + 𝜍𝐿 + 𝛼𝜃 (4.2)
휀𝐿 = Longitudinal strain
𝐸 = Young`s modulus
𝑠𝐿 = Longitudinal stress
𝛼 = Linear thermal expansion coefficient
𝜃 = Change in temperature
𝜈 = Poisson`s ratio = 0.3
The longitudinal stress ζL is not statically determined. It depends on the level that the
longitudinal movement is constrained. If there is no movement the longitudinal strain is equal
to zero.
εL = 0 (4.3)
The longitudinal stress is derived from equation 4.1, 4.2 and 4.3 and is given as equation 4.4:
𝜍𝐿 =𝑣𝑝𝑅
𝑡− 𝐸𝛼𝜃 (4.4)
The longitudinal stress occurs in the pipe wall. The cross section of a pipe wall is given as
2𝜋𝑅𝑡. The longitudinal force in the pipe wall will then be;
2πRtσH = 2νπR2p − 2π RtEαθ (4.5)
An additional component of the longitudinal force is given by the pipe contents pressure. The
cross section of the contents is πR2. The longitudinal stress in the contents is –p if counting
tension positive. The longitudinal force in the contents will therefore be;
−𝜋𝑅2𝑝 (4.6)
By adding equations 4.5 and 4.6 we get an expression for the longitudinal force will be given
as equation 4.7;
− 1 − 2𝜈 𝜋𝑅2𝑝 − 2𝜋 𝑅𝑡𝐸𝛼𝜃 (4.7)
The first term of the equation involves the pressure, while the second term involves
temperature. The pressure p and temperature θ are for most cases positive, which gives both
terms a negative value and therefore compressive. As the two terms are independent this
suggests that pressure alone can lead to upheaval buckling. This has been confirmed in
laboratory experiments and by field experience. If an external pressure is present in the
environment for which the pipeline is to be placed, p can be replaced by the difference in
internal pressure pi and external pressure pe. A pipeline may have been through events before
production start that has impact on the initial condition of the pipe. The tension introduced by
laying and pressure testing should be accounted for.
Upheaval Buckling of Buried Pipelines Master of Science Thesis
___________________________________________________________________________
The University of Stavanger / IKM Ocean Design 9
4.3.2 Effective expansion force in DNV codes
The driving force for global buckling as introduced in equation 4.7 is given in the DNV
codes, DNV-RP-F110 [1] and DNV-OS-F101 [4] as the effective axial force. The equation
has been modified in the codes and is in the form of equation 4.8.
𝑆0 = 𝐻 − Δ𝑝𝑖 ∙ 𝐴𝑖 1 − 2 ∙ 𝜐 − 𝐴𝑠 ∙ 𝐸 ∙ 𝛼 ∙ ∆𝑇 (4.8)
where;
𝑆0 = Effective axial force
𝐻 = Residual lay tension
Δ𝑝𝑖 = Internal pressure difference compared to as laid.
𝐴𝑖 = Internal area
𝜐 = Poisson`s Ratio
𝐴𝑠 = Area of the steel
𝐸 = Young`s modulus
𝛼 = Thermal expansion coefficient
∆𝑇 = Temperature increase compared to temperature during installation
Equation 4.8 for the effective axial force has here included a term H that involves the tension
introduced by laying the pipe. The equation does not include the tension introduced by
external pressure difference, which may be sufficient in deep waters. The tension from
external pressure is introduced as the pipe is being laid and may be incorporated in the term
for residual lay tension. The difference in internal pressure will not be affected by external
pressure as the pipe goes into service, but the actual internal pressure in the pipeline will be
lower if external pressure is subtracted.
The effective axial force in a pipe will vary in the longitudinal direction. For a pipe with free
ends, the force will be larger in the central region of the pipe, while it will be zero in the ends.
Expansion occurs from the virtual anchor points to the pipeline end. Between the virtual
anchor points a pipeline with free ends is fully restrained. This means that there is no
displacement of the pipe relative to the soil and fulfils equation 4.3 which says that no
longitudinal strain occurs. [3].
The effective axial force in a pipeline with fixed ends will decrease slightly from the inlet
point to the end. As the pipeline is restrained no relative movement with seabed will occur,
and the effective axial force will be close to or at the level of fully constrained along the
whole length. The slight reduction can be explained by temperature variation in the pipeline,
due to cooling from the ambient seawater. While pipelines with free ends are more proposed
to buckle in the region between the anchor points, a fixed pipeline may be equally exposed to
global buckling during the whole routing. Figure 4.2 and figure 4.3 on the nest page describes
the variation in the effective axial force.
Upheaval Buckling of Buried Pipelines Master of Science Thesis
___________________________________________________________________________
The University of Stavanger / IKM Ocean Design 10
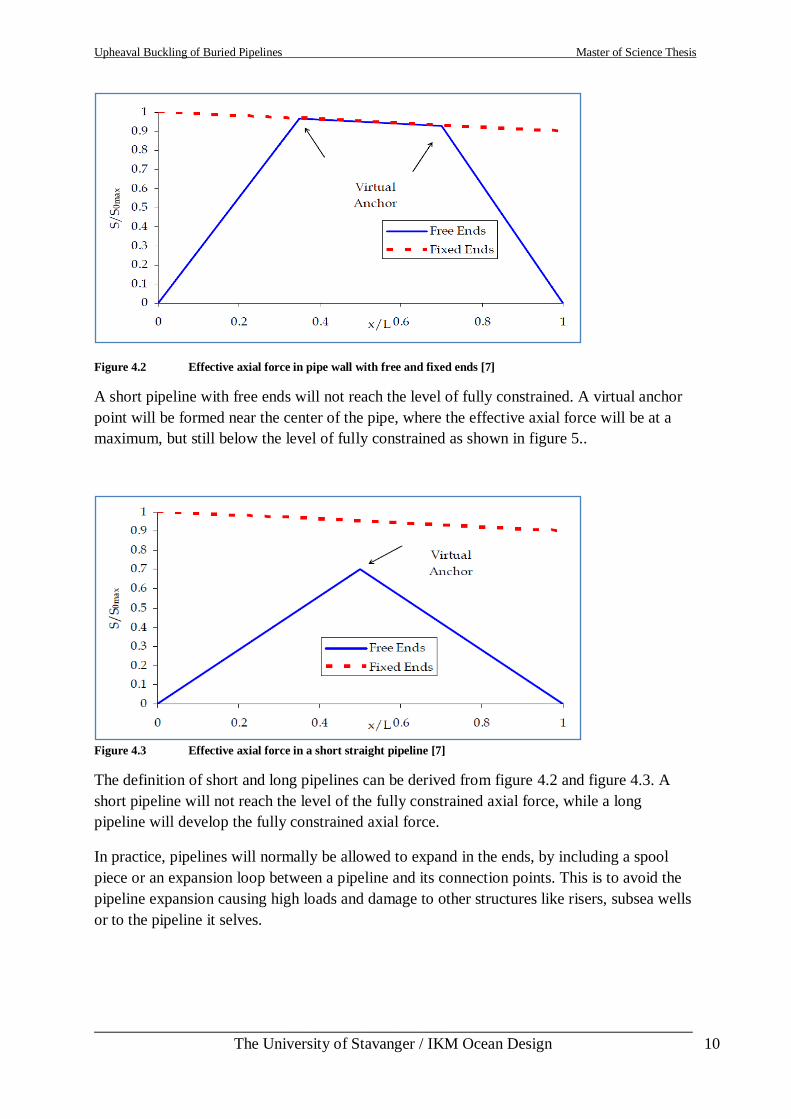
Figure 4.2 Effective axial force in pipe wall with free and fixed ends [7]
A short pipeline with free ends will not reach the level of fully constrained. A virtual anchor
point will be formed near the center of the pipe, where the effective axial force will be at a
maximum, but still below the level of fully constrained as shown in figure 5..
Figure 4.3 Effective axial force in a short straight pipeline [7]
The definition of short and long pipelines can be derived from figure 4.2 and figure 4.3. A
short pipeline will not reach the level of the fully constrained axial force, while a long
pipeline will develop the fully constrained axial force.
In practice, pipelines will normally be allowed to expand in the ends, by including a spool
piece or an expansion loop between a pipeline and its connection points. This is to avoid the
pipeline expansion causing high loads and damage to other structures like risers, subsea wells
or to the pipeline it selves.
Upheaval Buckling of Buried Pipelines Master of Science Thesis
___________________________________________________________________________
The University of Stavanger / IKM Ocean Design 11
4.4 Strategies for analysis of upheaval buckling movements [3]
4.4.1 Strategy 1: Deriving universal design curve
The first strategy presented is further developed by Hobbs [6] from railway track buckling
researches performed earlier by Martinet [7] and Kerr [8]. He considered how the conditions
under which an initially straight pipeline could remain in equilibrium as a raised loop, when
considering longitudinal movement towards the loop from both sides. A perfectly straight
pipeline will according to structural mechanics terms have an infinite buckling force coupled
with and infinite degree of imperfection sensitivity. The central feature of the problem is the
imperfection of the seabed that the pipeline lays on. Further different profile imperfections
where described by a height, length and a mathematically defined shape. Equation 4.9
describes a sinusoidal profile imperfection.
𝑦 = 12 𝐻 1 − cos 2𝜋𝑥
𝐿 0 < 𝑥 < 𝐿 (4.9)
where;
y = height
x = horizontal distance
H = imperfection height
L = imperfection length
Analysis determined the conditions where a pipeline can become unstable and lift away from
the profile. This idea was developed in detail deriving a universal design curve, in terms of
two parameters. A dimensionless download parameter Фq is given as equation 4.10;
𝜙𝑞 =𝑞𝐹
𝐻𝑃2 (4.10)
where;
q = Total download (including resistance from cover if buried, and the pipe weight)
F = Flexural rigidity, see equation 4.12.
P = Longitudinal compressive forced
The second parameter derived was a dimensionless length given as equation 4.11;
𝜙𝐿 = 𝐿 𝑃
𝐹 (4.11)
Upheaval Buckling of Buried Pipelines Master of Science Thesis
___________________________________________________________________________
The University of Stavanger / IKM Ocean Design 12
The flexural rigidity is depending on the mean radius R, wall thickness t and Young`s
modulus E and is given by.
𝐹 = 𝜋𝑅𝑚3𝑡𝐸 (4.12)
where;
Rm = Mean radius between external and internal radius
t = Wall thickness
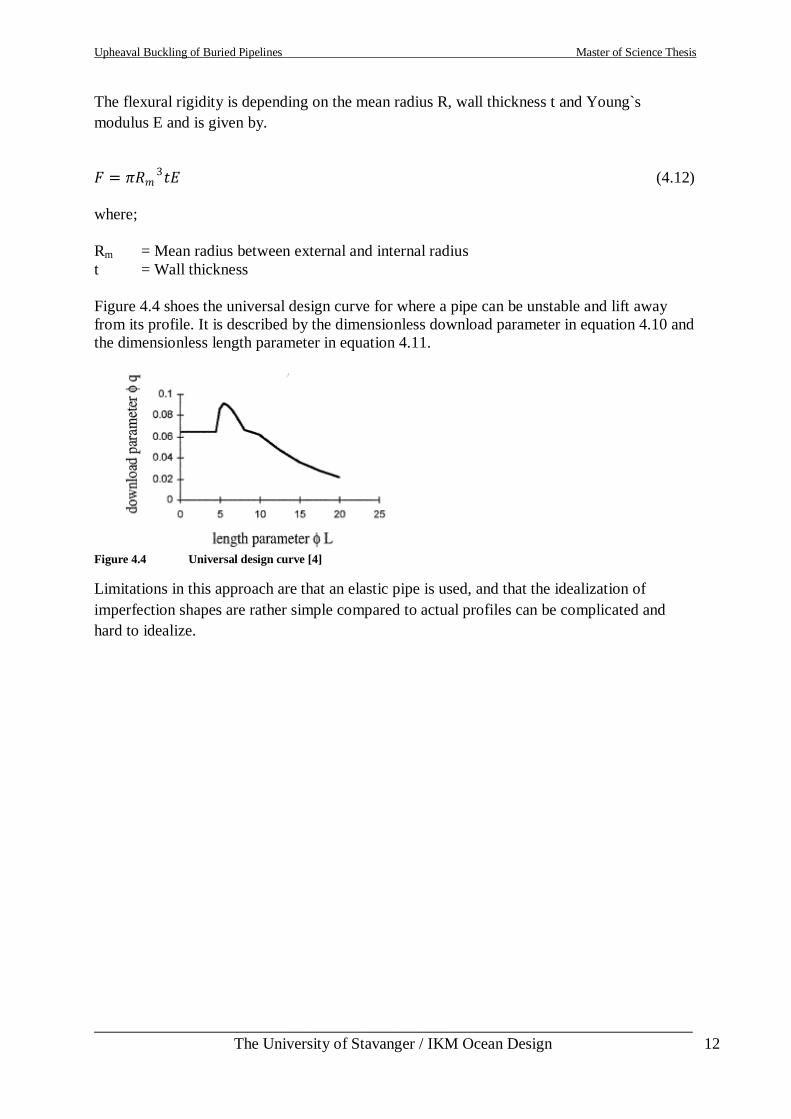
Figure 4.4 shoes the universal design curve for where a pipe can be unstable and lift away
from its profile. It is described by the dimensionless download parameter in equation 4.10 and
the dimensionless length parameter in equation 4.11.
Figure 4.4 Universal design curve [4]
Limitations in this approach are that an elastic pipe is used, and that the idealization of
imperfection shapes are rather simple compared to actual profiles can be complicated and
hard to idealize.
Upheaval Buckling of Buried Pipelines Master of Science Thesis
___________________________________________________________________________
The University of Stavanger / IKM Ocean Design 13
4.4.2 Strategy 2: External force required to hold the pipe in position as production starts
This strategy looks on the possibilities to decide what external force is required to hold a pipe
in position as production starts and the longitudinal force increases, if the initial profile of the
pipe is known either by calculation or measuring.
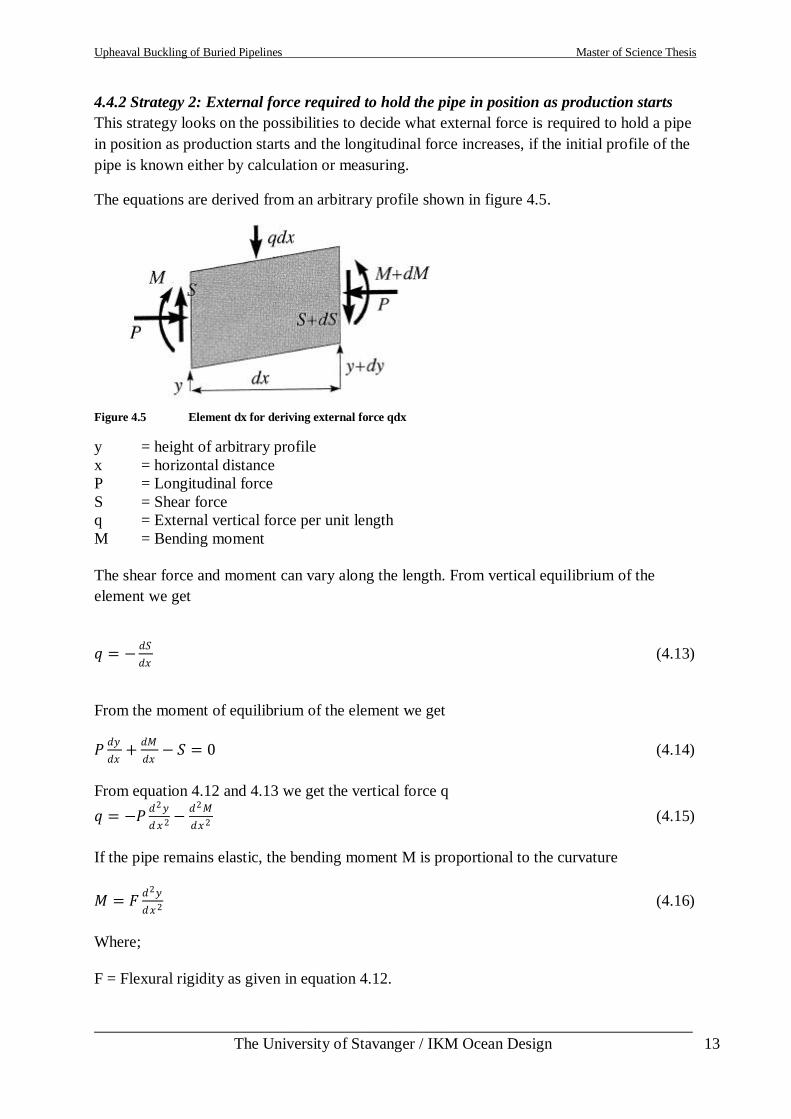
The equations are derived from an arbitrary profile shown in figure 4.5.
Figure 4.5 Element dx for deriving external force qdx
y = height of arbitrary profile
x = horizontal distance
P = Longitudinal force
S = Shear force
q = External vertical force per unit length
M = Bending moment
The shear force and moment can vary along the length. From vertical equilibrium of the
element we get
𝑞 = −𝑑𝑆
𝑑𝑥 (4.13)
From the moment of equilibrium of the element we get
𝑃𝑑𝑦
𝑑𝑥+
𝑑𝑀
𝑑𝑥− 𝑆 = 0 (4.14)
From equation 4.12 and 4.13 we get the vertical force q
𝑞 = −𝑃𝑑2𝑦
𝑑𝑥2 −𝑑2𝑀
𝑑𝑥2 (4.15)
If the pipe remains elastic, the bending moment M is proportional to the curvature
𝑀 = 𝐹𝑑2𝑦
𝑑𝑥2 (4.16)
Where;
F = Flexural rigidity as given in equation 4.12.
Upheaval Buckling of Buried Pipelines Master of Science Thesis
___________________________________________________________________________
The University of Stavanger / IKM Ocean Design 14
From equation 4.15 and 4.16 we get
𝑞 = −𝑃𝑑2𝑦
𝑑𝑥2 − 𝐹𝑑4𝑦
𝑑𝑥4 (4.17)
In equations 4.17 and 4.15, the first term is a product of the curvature and the longitudinal
force P. The curvature 𝑑2𝑦
𝑑𝑥2 is negative where the pipe tends to push upwards, and requires a
positive value of q to push it down. It is possible to determine the forces needed to hold the
pipe in place from these two equations based on the pipeline profile. A more complex analysis
is required to determine how the pipe moves and becomes unstable and jumps into a new
position.
4.5 Measurements preventing upheaval buckling
The occurrence of an upheaval buckle is highly depending on the smoothness of the seabed
profile. Suggestions of an imperfection height of 0,3 meter has been made as a design basis,
but depending on the seabed soil, this is not rational [3]. Documentation of the seabed profile
is essential and can be gathered from surveys performed by ROVs, divers or other available
equipment. Choosing a routing that involves a smoother seabed and performing intervention
by trenching the areas with peaks is a good option. A well documented seabed profile both
before and after the pipe is laid, is important when designing acquired cover.
Reducing the driving force, equation 4.7, can be done in several ways. The highest
contribution to the force is normally expected to come from the temperature term. This term
involves the area of the steel, which can be modified by reducing the wall thickness t. The
reduction of t will also affect the flexural rigidity F, equation 4.12. It has turned out that the
improvement that comes from reducing the driving force more than outweighs the effect of
reducing the flexural rigidity F [3]. However design strategies today have several reasons for
optimized wall thickness design such as the rates for steel. The temperature can also be
modified by decreasing the design temperature by coolers, heat exchangers or cooling loops
that allow fluid to be cooled by heat transfer to the sea.
If the mentioned measurements are not enough to prevent upheaval buckling the pipeline must
be buried. The cover options have previously been presented in chapter 3.3. There are
different strategies to when it comes to covering a pipeline. A practical solution can be to
cover the whole length, but this is not very economical. Covering at certain intervals can also
be done. The most economical situation is to locate critical overbends, where an upheaval
buckle might initiate, and apply cover at these locations. The operation of locating the areas
that require cover includes a thoroughly performed survey operation, in order to find the
locations later on when cover is to be applied.
Upheaval Buckling of Buried Pipelines Master of Science Thesis
___________________________________________________________________________
The University of Stavanger / IKM Ocean Design 15
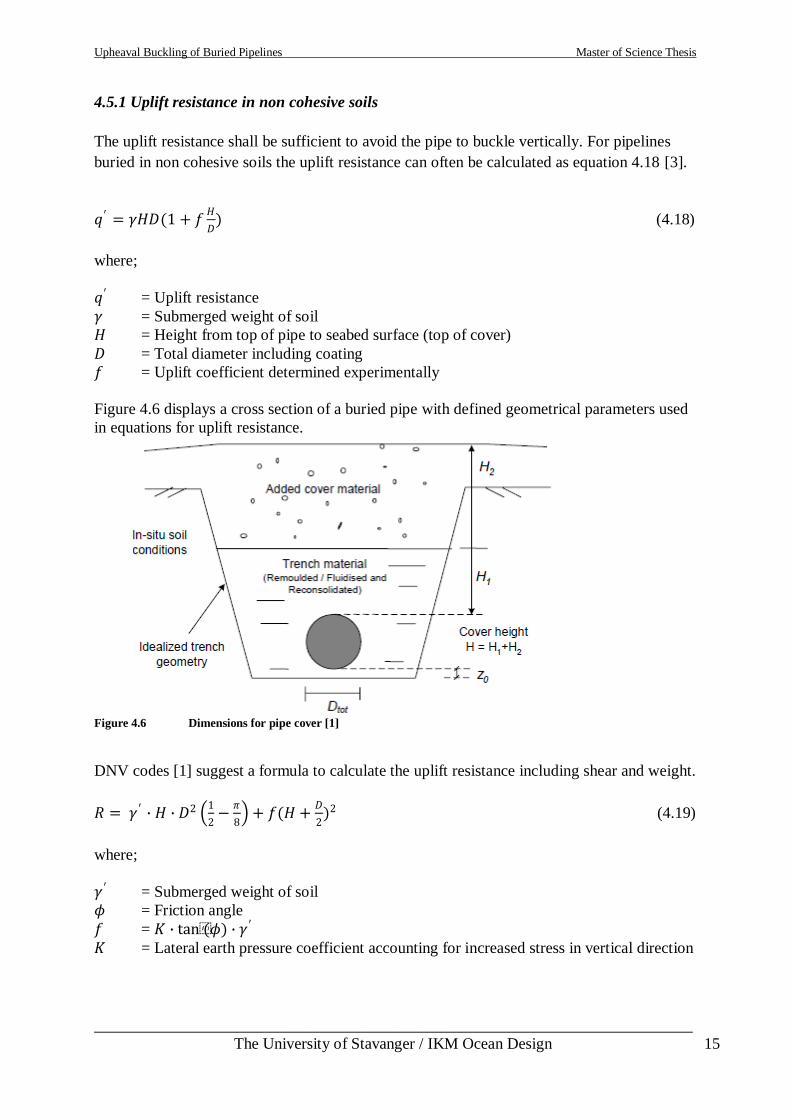
4.5.1 Uplift resistance in non cohesive soils
The uplift resistance shall be sufficient to avoid the pipe to buckle vertically. For pipelines
buried in non cohesive soils the uplift resistance can often be calculated as equation 4.18 [3].
𝑞′ = 𝛾𝐻𝐷(1 + 𝑓𝐻
𝐷) (4.18)
where;
𝑞′ = Uplift resistance
𝛾 = Submerged weight of soil
𝐻 = Height from top of pipe to seabed surface (top of cover)
𝐷 = Total diameter including coating
𝑓 = Uplift coefficient determined experimentally
Figure 4.6 displays a cross section of a buried pipe with defined geometrical parameters used
in equations for uplift resistance.
Figure 4.6 Dimensions for pipe cover [1]
DNV codes [1] suggest a formula to calculate the uplift resistance including shear and weight.
𝑅 = 𝛾 ′ ∙ 𝐻 ∙ 𝐷2 1
2−
𝜋
8 + 𝑓(𝐻 +
𝐷
2)2 (4.19)
where;
𝛾 ′ = Submerged weight of soil
𝜙 = Friction angle
𝑓 = 𝐾 ∙ tan(𝜙) ∙ 𝛾 ′ 𝐾 = Lateral earth pressure coefficient accounting for increased stress in vertical direction
Upheaval Buckling of Buried Pipelines Master of Science Thesis
___________________________________________________________________________
The University of Stavanger / IKM Ocean Design 16
4.5.2 Uplift resistance in cohesive soils
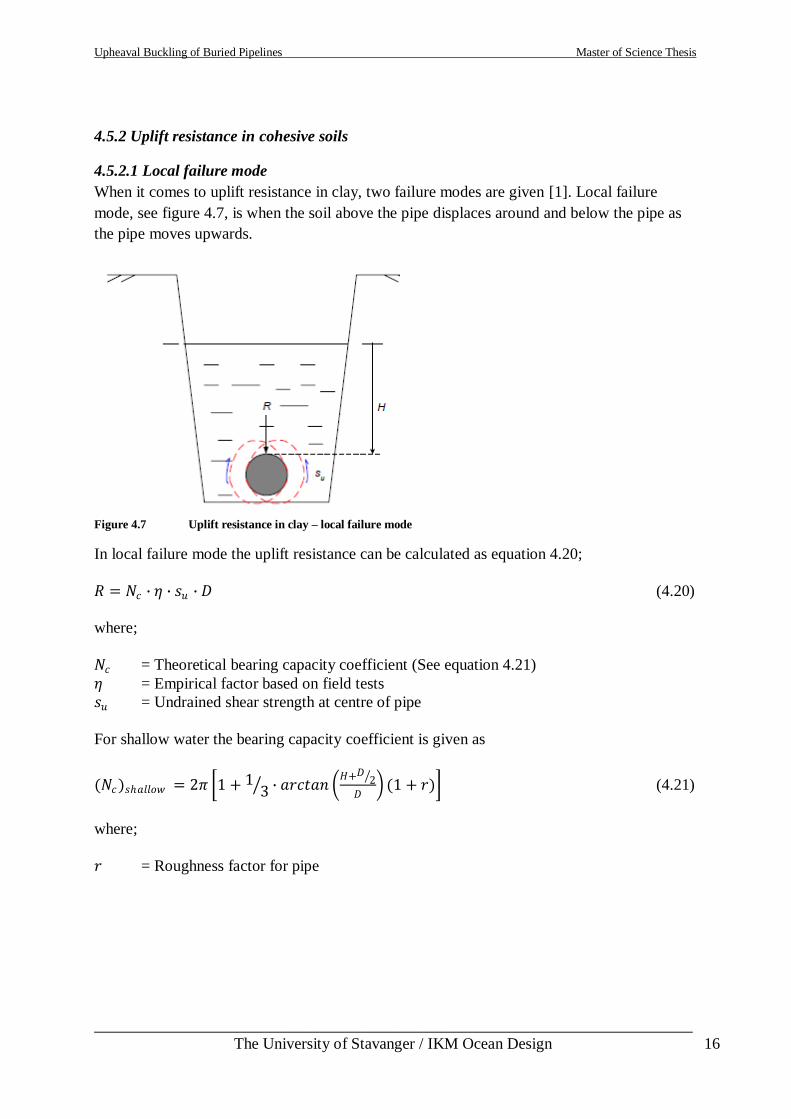
4.5.2.1 Local failure mode
When it comes to uplift resistance in clay, two failure modes are given [1]. Local failure
mode, see figure 4.7, is when the soil above the pipe displaces around and below the pipe as
the pipe moves upwards.
Figure 4.7 Uplift resistance in clay – local failure mode
In local failure mode the uplift resistance can be calculated as equation 4.20;
𝑅 = 𝑁𝑐 ∙ 𝜂 ∙ 𝑠𝑢 ∙ 𝐷 (4.20)
where;
𝑁𝑐 = Theoretical bearing capacity coefficient (See equation 4.21)
𝜂 = Empirical factor based on field tests
𝑠𝑢 = Undrained shear strength at centre of pipe
For shallow water the bearing capacity coefficient is given as
(𝑁𝑐)𝑠𝑎𝑙𝑙𝑜𝑤 = 2𝜋 1 + 13 ∙ 𝑎𝑟𝑐𝑡𝑎𝑛
𝐻+𝐷 2
𝐷 (1 + 𝑟) (4.21)
where;
𝑟 = Roughness factor for pipe
Upheaval Buckling of Buried Pipelines Master of Science Thesis
___________________________________________________________________________
The University of Stavanger / IKM Ocean Design 17
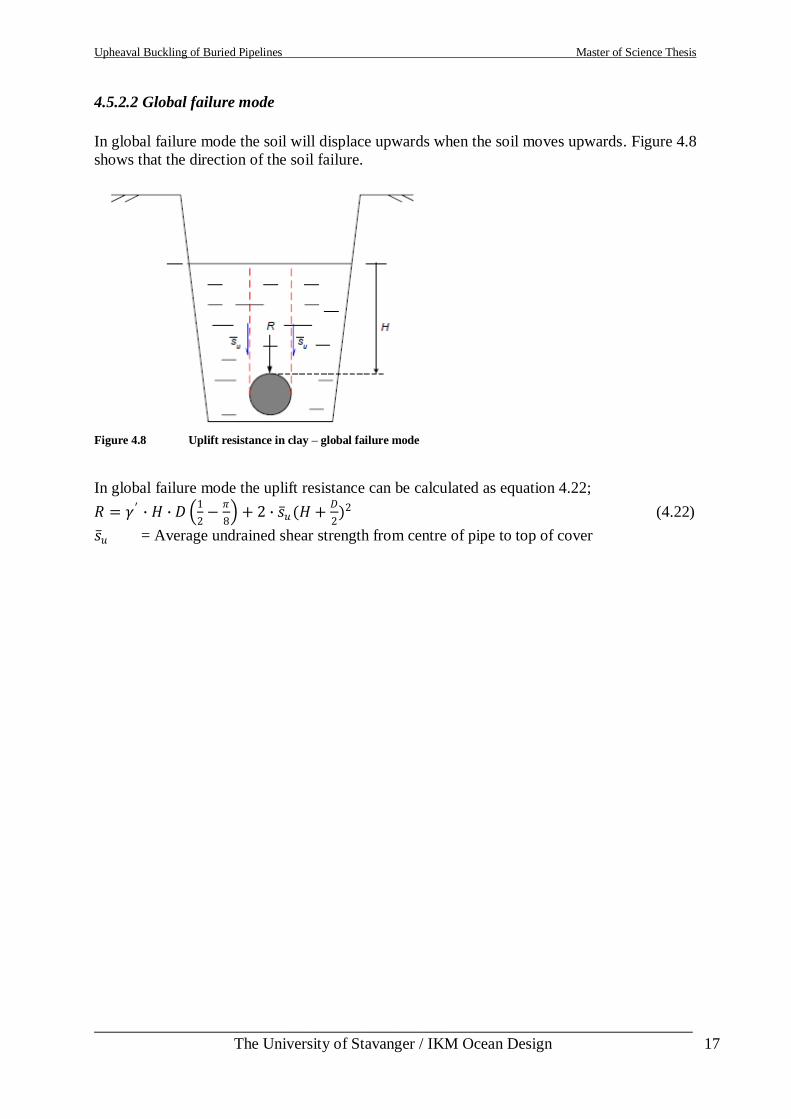
4.5.2.2 Global failure mode
In global failure mode the soil will displace upwards when the soil moves upwards. Figure 4.8
shows that the direction of the soil failure.
Figure 4.8 Uplift resistance in clay – global failure mode
In global failure mode the uplift resistance can be calculated as equation 4.22;
𝑅 = 𝛾 ′ ∙ 𝐻 ∙ 𝐷 1
2−
𝜋
8 + 2 ∙ 𝑠 𝑢(𝐻 +
𝐷
2)2 (4.22)
𝑠 𝑢 = Average undrained shear strength from centre of pipe to top of cover
Upheaval Buckling of Buried Pipelines Master of Science Thesis
___________________________________________________________________________
The University of Stavanger / IKM Ocean Design 18
4.6 Brief look at upheaval buckling design according to Det Norske Veritas
On the subject of global buckling of high pressure high temperature pipelines Det Norske
Veritas, DNV, has developed the recommended practice DNV-RP-F110, Global Buckling of
Submarine Pipelines – Structural Design due to High Temperature/High Pressure [1]. The RP
gives criteria to avoid upheaval buckling from occurring, by designing sufficient cover
providing enough resistance for pipelines to remain in place. Upheaval buckling may be
acceptable if the integrity of the pipe is maintained in post buckling condition, but the RP
gives no procedures in performing integrity check for pipelines at this state. Therefore
upheaval buckling is considered as an ultimate limit state, ULS, in the recommended practice.
An upheaval buckle is a violation to the design premise and thus safety factors must be in
coordination with an annual probability of occurrence at Pf < 10-4
/year. This is for Safety
Medium Class according to the DNV Offshore Standard DNV-OS-F101, submarine pipeline
standard [4].
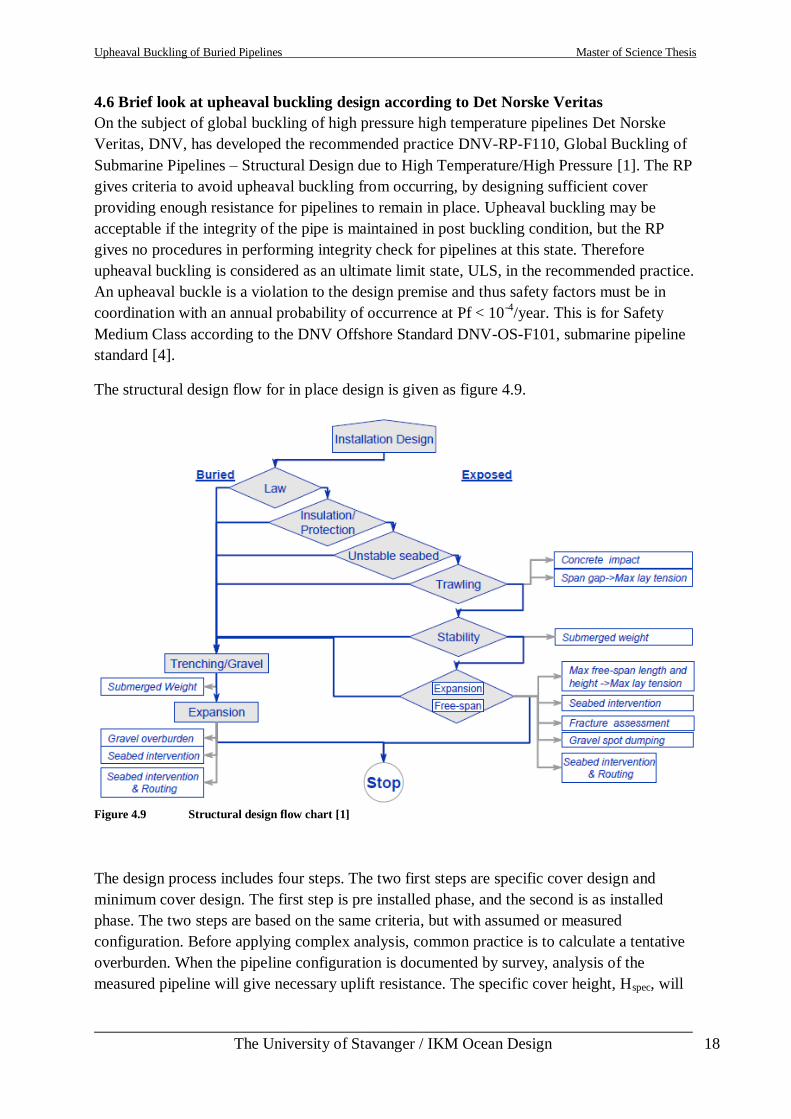
The structural design flow for in place design is given as figure 4.9.
Figure 4.9 Structural design flow chart [1]
The design process includes four steps. The two first steps are specific cover design and
minimum cover design. The first step is pre installed phase, and the second is as installed
phase. The two steps are based on the same criteria, but with assumed or measured
configuration. Before applying complex analysis, common practice is to calculate a tentative
overburden. When the pipeline configuration is documented by survey, analysis of the
measured pipeline will give necessary uplift resistance. The specific cover height, Hspec, will
Upheaval Buckling of Buried Pipelines Master of Science Thesis
___________________________________________________________________________
The University of Stavanger / IKM Ocean Design 19
vary with the curvature of the pipe, pressure and temperature. The downward stiffness may
also be taken into account, when the uplift resistance is high.
Because of the uncertainties in surveys a minimum cover resistance shall be determined by
running analysis with a prop shape imperfection depending on the level of accuracy of the
surveys.
The design process for buried pipelines is organized in the following steps:
1) Specific cover design
- Initial configuration
- Soil resistance modeling
- Upheaval buckling design criterion
2) Minimum cover design
3) Specification of cover
4) Pipe integrity check.
The design is mainly based on the design temperature. The design temperature is normally
given by a client and a pipeline engineering company has normally no option to modify the
given design temperature. The design approach is based on designing a sufficient cover by
performing analysis, for the given design temperature. A further description of the steps in the
design process follows.
Upheaval Buckling of Buried Pipelines Master of Science Thesis
___________________________________________________________________________
The University of Stavanger / IKM Ocean Design 20
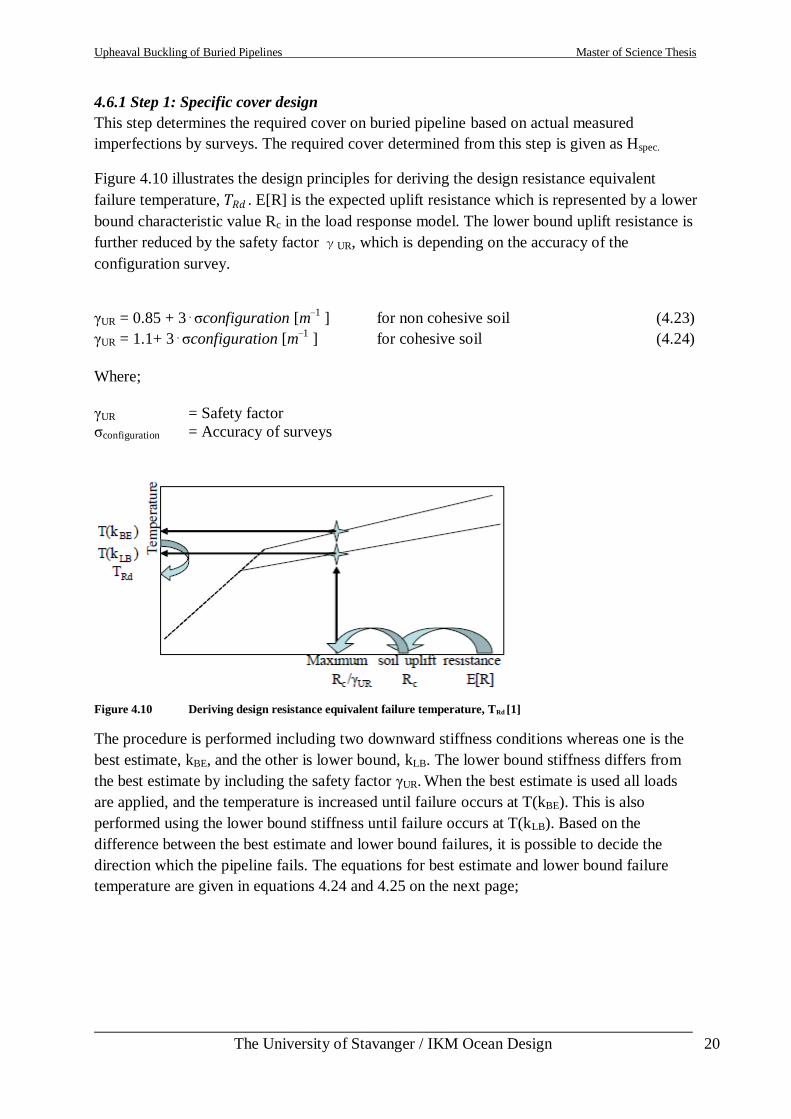
4.6.1 Step 1: Specific cover design
This step determines the required cover on buried pipeline based on actual measured
imperfections by surveys. The required cover determined from this step is given as Hspec.
Figure 4.10 illustrates the design principles for deriving the design resistance equivalent
failure temperature, 𝑇𝑅𝑑 . E[R] is the expected uplift resistance which is represented by a lower
bound characteristic value Rc in the load response model. The lower bound uplift resistance is
further reduced by the safety factor γUR, which is depending on the accuracy of the
configuration survey.
γUR = 0.85 + 3⋅ζconfiguration [m−1 ] for non cohesive soil (4.23)
γUR = 1.1+ 3⋅ζconfiguration [m−1 ] for cohesive soil (4.24)
Where;
γUR = Safety factor
ζconfiguration = Accuracy of surveys
Figure 4.10 Deriving design resistance equivalent failure temperature, TRd [1]
The procedure is performed including two downward stiffness conditions whereas one is the
best estimate, kBE, and the other is lower bound, kLB. The lower bound stiffness differs from
the best estimate by including the safety factor γUR. When the best estimate is used all loads
are applied, and the temperature is increased until failure occurs at T(kBE). This is also
performed using the lower bound stiffness until failure occurs at T(kLB). Based on the
difference between the best estimate and lower bound failures, it is possible to decide the
direction which the pipeline fails. The equations for best estimate and lower bound failure
temperature are given in equations 4.24 and 4.25 on the next page;
Upheaval Buckling of Buried Pipelines Master of Science Thesis
___________________________________________________________________________
The University of Stavanger / IKM Ocean Design 21
𝑇 𝑘𝐵𝐸 = 𝑇𝑓𝑎𝑖𝑙𝑢𝑟𝑒 (𝑝𝑙𝑖 ,𝑅𝑐
𝛾𝑈𝑅,𝑘𝐵𝐸) (4.25)
where;
𝑇 𝑘𝐵𝐸 = Temperature at which failure occur whit best estimate downward stiffness
𝑇𝑓𝑎𝑖𝑙𝑢𝑟𝑒 = Temperature at which failure occur
𝑝𝑙𝑖 = Local incidental pressure
𝑅𝑐 = Sand and rock uplift resistance
𝛾𝑈𝑅 = Safety factor
𝑘𝐵𝐸 = Best estimate downward stiffness
𝑇 𝑘𝐿𝐵 = 𝑇𝑓𝑎𝑖𝑙𝑢𝑟𝑒 (𝑝𝑙𝑖 ,𝑅𝑐
𝛾𝑈𝑅, 𝑘𝐿𝐵) (4.26)
Where;
𝑇 𝑘𝐿𝐵 = Temperature at which failure occur whit lower bound downward stiffness
𝑘𝐿𝐵 = Lower bound downward stiffness
If T(kLB) is close to T(kBE) – The pipeline will fail upwards implying that its limited by the
uplift resistance and located on the dashed line in figure 4.10.
If T(kLB) is different from T(kBE) – The initial soil failure is downward eventually causing the
pipeline upward penetration. This implies that it is limited by downward stiffness conditions
and is located on the solid lines to the left in figure 4.10.
The temperature at which the soil fails and upheaval buckling occurs, TRd, is calculated as;
𝑇𝑅𝑑 =3∙𝑇 𝑘𝐿𝐵 −𝑇 𝑘𝐵𝐸
2 (4.27)
Where;
𝑇𝑅𝑑 = Design resistance equivalent failure temperature
Upheaval Buckling of Buried Pipelines Master of Science Thesis
___________________________________________________________________________
The University of Stavanger / IKM Ocean Design 22
The equation for calculating the design load temperature includes an axial effective load
factor of γUF.
𝑇𝑆𝑑 = 𝑇𝑑 ∙ 𝛾𝑈𝐹 +[∆𝑝𝑖 ∙𝐴𝑖∙ 1−2∙𝜐 −𝐻]
𝐴𝑠∙𝐸∙𝛼∙ (𝛾𝑈𝐹 − 1) (4.28)
Where;
𝑇𝑆𝑑 = Design load equivalent temperature
𝛾𝑈𝐹 = Axial effective load factor; 𝛾𝑈𝐹 =
1.00 𝑓𝑜𝑟 𝑛𝑜𝑟𝑚𝑎𝑙 𝑠𝑎𝑓𝑒𝑡𝑦 𝑐𝑙𝑎𝑠𝑠 1.15 𝑓𝑜𝑟 𝑚𝑒𝑑𝑖𝑢𝑚 𝑠𝑎𝑓𝑒𝑡𝑦 𝑐𝑙𝑎𝑠𝑠1.30 𝑓𝑜𝑟 𝑖𝑔 𝑠𝑎𝑓𝑒𝑡𝑦 𝑐𝑙𝑎𝑠𝑠
∆𝑝𝑖 = Internal pressure difference compared to as laid
𝐴𝑖 = Internal area of pipe
𝜈 = Poisson`s ratio
𝐻 = Residual lay tension
𝐴𝑠 = Area of steel
𝐸 = Young`s modulus
𝛼 = Thermal expansion coefficient
The design load equivalent temperature shall be lower than the design resistance equivalent
failure temperature.
𝑇𝑆𝑑 < 𝑇𝑅𝑑
If the criterion is not fulfilled, the cover or the configuration must be modified and the
analysis must be performed again.
This step will give a specific cover height for sand and rock, Hspec , or specific soil resistance
for clay, Rspec.
4.6.2 Step 2: Minimum cover design
The minimum cover design shall be derived using a prop shape imperfection. This allows for
undetected imperfections due to accuracy of survey equipment to be accounted for in analysis.
What separates the minimum cover design from the specific cover design is that the uplift
resistance / cover height is determined from the prop shape imperfection, δf, meaning that the
pipeline is resting on an imperfection. This can be analyzed in a finite element model by
lowering the pipe onto a single contact point, with the distance δ f above the seabed. The
height of the prop shape, δf, shall be put equal to one standard deviation of the accuracy from
the surveys, previously defined as ζconfiguration. See equation xx.
𝛿𝑓=𝑚𝑎𝑥 𝜍𝑐𝑜𝑛𝑓𝑖𝑔𝑢𝑟𝑎𝑡𝑖𝑜𝑛 0.025𝑚 (4.29)
The safety factor related to upward soil resistance, γUR, is here reduced by setting the
ζconfiguration as zero.
γUR = 0.85 + 3⋅ζconfiguration [m−1 ] for non cohesive soil (4.30)
γUR = 1.1+ 3⋅ζconfiguration [m−1 ] for cohesive soil (4.31)
Upheaval Buckling of Buried Pipelines Master of Science Thesis
___________________________________________________________________________
The University of Stavanger / IKM Ocean Design 23
Besides this the principle of running the analysis follows the same pattern as for the specific
cover design, and we end up with a minimum cover height, Hmin, for sand and rock, or
minimum soil resistance, Rmin for clay
4.6.3 Step 3: Specification of cover
If granular mass like sand or rock is used for cover, the resulting cover height shall be taken
from step one or two as the maximum of the specific or minimum cover height.
𝐻(𝐾𝑝) ≥ 𝑀𝑎𝑥[𝐻𝑠𝑝𝑒𝑐 (𝐾𝑝),𝐻𝑚𝑖𝑛 (𝐾𝑝)] (4.32)
Kp = Kilometer post
The resulting cover resistance for clay shall be taken as the maximum of the specific soil
resistance, Rspec and the minimum soil resistance, Rmin.
𝑅(𝐾𝑝) ≥ 𝑀𝑎𝑥[𝑅𝑠𝑝𝑒𝑐 (𝐾𝑝) 𝑅𝑚𝑖𝑛 (𝐾𝑝)] (4.33)
When constructing the cover an additional margin may be added to account for uncertainties.
At least two surveys shall be performed after the cover is in place. Calculating the average of
the surveys can be applied, to get the general cover resistance / cover height. The cover
heights derived from the surveys shall independently be verified by the procedures in step 1.
𝐻 𝐾𝑝 =1
𝑛[𝐻1 𝐾𝑝 + 𝐻2 𝐾𝑝 + ⋯+ 𝐻𝑛 ] (4.34)
𝑅 𝐾𝑝 =1
𝑛[𝑅1 𝐾𝑝 + 𝑅2 𝐾𝑝 + ⋯+ 𝑅𝑛 ] (4.35)
Depending on the number of surveys the safety factors can be reduced. The TRd however
remains the same for each survey.
𝛾𝑈𝑅 = 0.85 + 3⋅𝜍𝑐𝑜𝑛𝑓𝑖𝑔𝑢𝑟𝑎𝑡𝑖𝑜𝑛
𝑛 [𝑚−1 ] for non cohesive soil (4.36)
𝛾𝑈𝑅 = 1.1 + 3⋅𝜍𝑐𝑜𝑛𝑓𝑖𝑔𝑢𝑟𝑎𝑡𝑖𝑜𝑛
𝑛 [𝑚−1 ] for cohesive soils (4.37)
The minimum cover height can be calculated for an imperfection height of;
𝛿𝑓 = (𝜍𝑐𝑜𝑛𝑓𝑖𝑔𝑢𝑟𝑎𝑡𝑖𝑜𝑛
𝑛) (4.38)
The final cover resistance / cover height for n surveys is taken as the maximum of the specific
and the minimum cover height.
𝐻(𝐾𝑝) ≥ 𝑀𝑎𝑥[𝐻 (𝐾𝑝),𝐻𝑚𝑖𝑛 (𝐾𝑝)] (4.39)
𝑅(𝐾𝑝) ≥ 𝑀𝑎𝑥[𝑅 (𝐾𝑝) 𝑅𝑚𝑖𝑛 (𝐾𝑝)] (4.40)
Upheaval Buckling of Buried Pipelines Master of Science Thesis
___________________________________________________________________________
The University of Stavanger / IKM Ocean Design 24
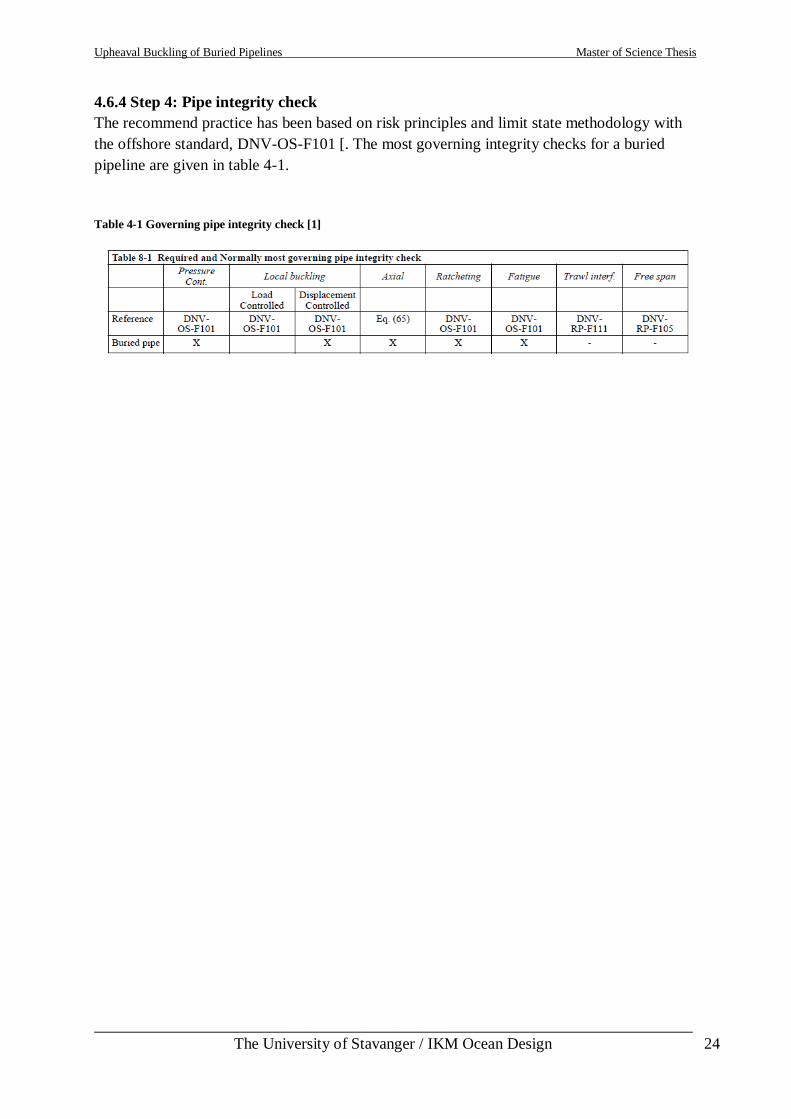
4.6.4 Step 4: Pipe integrity check
The recommend practice has been based on risk principles and limit state methodology with
the offshore standard, DNV-OS-F101 [. The most governing integrity checks for a buried
pipeline are given in table 4-1.
Table 4-1 Governing pipe integrity check [1]
Upheaval Buckling of Buried Pipelines Master of Science Thesis
___________________________________________________________________________
The University of Stavanger / IKM Ocean Design 25
5. Experiment
5.1.1 Pipe
The pipe used for this experiment is a 10 mm outside diameter copper pipe. A further
description of the actual pipe follows.
5.1.2 Material properties for Copper pipe
Tensile strength, ζt: min 310 N/mm2
Yield strength, ζy: min 280 N/mm2
Young`s Modulus, E: 1.2E11 N/m2
Density, ρ: 8.94 kg/dm3
Poissons`s ratio, ν: 0.3
Coefficient of Linear Thermal Expansion, α: 17E-6
5.1.3 Geometric parameters
Outer diameter, OD: 10 mm
Inner diameter, ID: 8 mm
Wall thickness, T: 1 mm
Second moment of area cross-section, I: 2.89E-10 m4
Steel area, As: 2.83E-5 m2
Length of pipe, l: 6 m
Total weight of 6 meter pipe, w: 1.517 kg
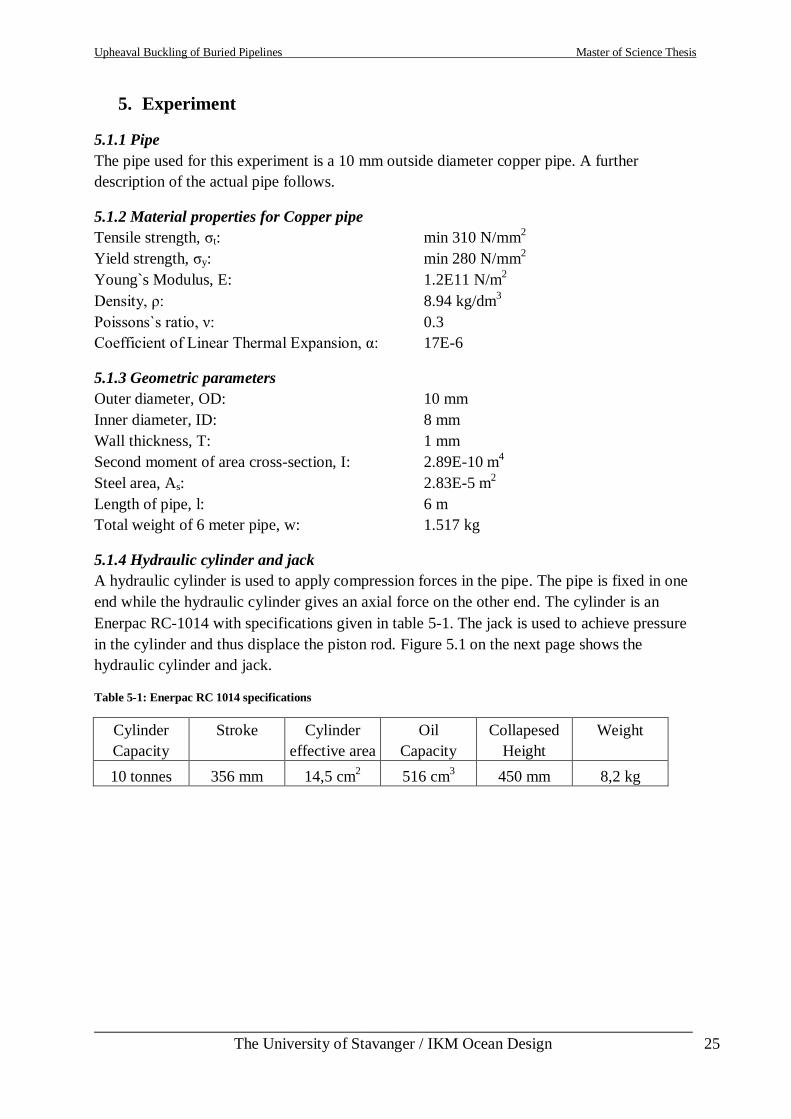
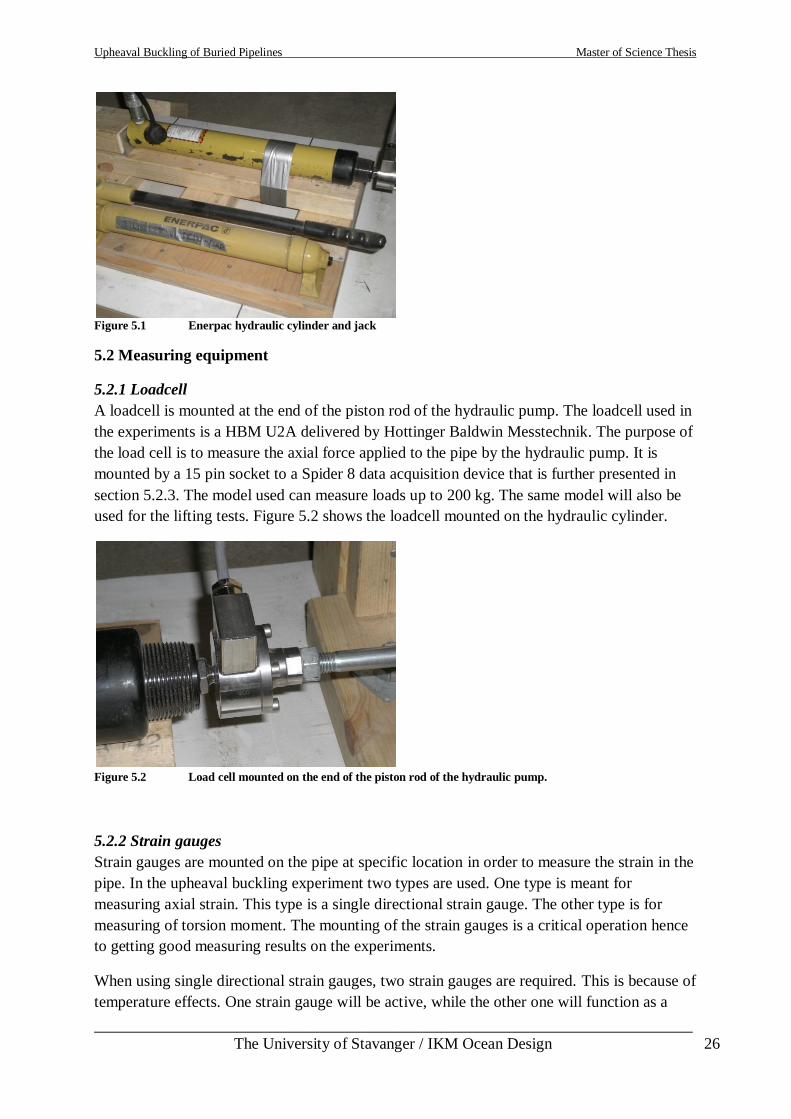
5.1.4 Hydraulic cylinder and jack
A hydraulic cylinder is used to apply compression forces in the pipe. The pipe is fixed in one
end while the hydraulic cylinder gives an axial force on the other end. The cylinder is an
Enerpac RC-1014 with specifications given in table 5-1. The jack is used to achieve pressure
in the cylinder and thus displace the piston rod. Figure 5.1 on the next page shows the
hydraulic cylinder and jack.
Table 5-1: Enerpac RC 1014 specifications
Cylinder Stroke Cylinder Oil Collapesed Weight
Capacity effective area Capacity Height
10 tonnes 356 mm 14,5 cm2 516 cm
3 450 mm 8,2 kg
Upheaval Buckling of Buried Pipelines Master of Science Thesis
___________________________________________________________________________
The University of Stavanger / IKM Ocean Design 26
Figure 5.1 Enerpac hydraulic cylinder and jack
5.2 Measuring equipment
5.2.1 Loadcell
A loadcell is mounted at the end of the piston rod of the hydraulic pump. The loadcell used in
the experiments is a HBM U2A delivered by Hottinger Baldwin Messtechnik. The purpose of
the load cell is to measure the axial force applied to the pipe by the hydraulic pump. It is
mounted by a 15 pin socket to a Spider 8 data acquisition device that is further presented in
section 5.2.3. The model used can measure loads up to 200 kg. The same model will also be
used for the lifting tests. Figure 5.2 shows the loadcell mounted on the hydraulic cylinder.
Figure 5.2 Load cell mounted on the end of the piston rod of the hydraulic pump.
5.2.2 Strain gauges
Strain gauges are mounted on the pipe at specific location in order to measure the strain in the
pipe. In the upheaval buckling experiment two types are used. One type is meant for
measuring axial strain. This type is a single directional strain gauge. The other type is for
measuring of torsion moment. The mounting of the strain gauges is a critical operation hence
to getting good measuring results on the experiments.
When using single directional strain gauges, two strain gauges are required. This is because of
temperature effects. One strain gauge will be active, while the other one will function as a
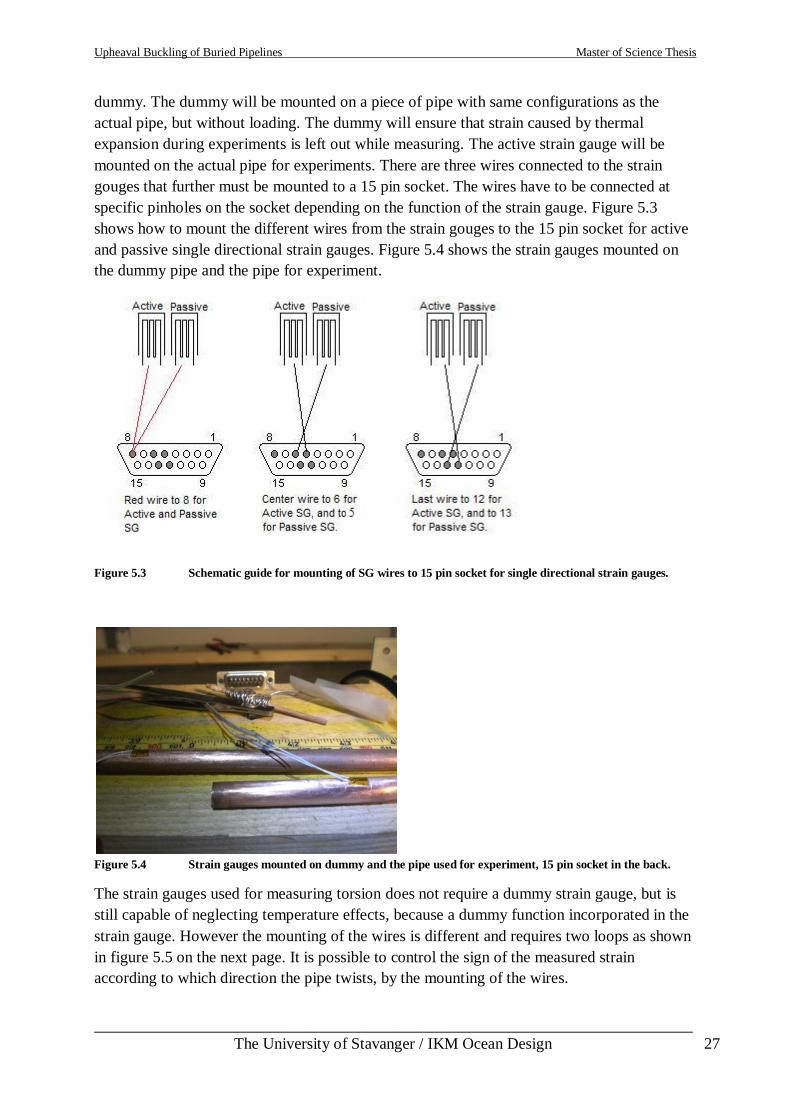
Upheaval Buckling of Buried Pipelines Master of Science Thesis
___________________________________________________________________________
The University of Stavanger / IKM Ocean Design 27
dummy. The dummy will be mounted on a piece of pipe with same configurations as the
actual pipe, but without loading. The dummy will ensure that strain caused by thermal
expansion during experiments is left out while measuring. The active strain gauge will be
mounted on the actual pipe for experiments. There are three wires connected to the strain
gouges that further must be mounted to a 15 pin socket. The wires have to be connected at
specific pinholes on the socket depending on the function of the strain gauge. Figure 5.3
shows how to mount the different wires from the strain gouges to the 15 pin socket for active
and passive single directional strain gauges. Figure 5.4 shows the strain gauges mounted on
the dummy pipe and the pipe for experiment.
Figure 5.3 Schematic guide for mounting of SG wires to 15 pin socket for single directional strain gauges.
Figure 5.4 Strain gauges mounted on dummy and the pipe used for experiment, 15 pin socket in the back.
The strain gauges used for measuring torsion does not require a dummy strain gauge, but is
still capable of neglecting temperature effects, because a dummy function incorporated in the
strain gauge. However the mounting of the wires is different and requires two loops as shown
in figure 5.5 on the next page. It is possible to control the sign of the measured strain
according to which direction the pipe twists, by the mounting of the wires.
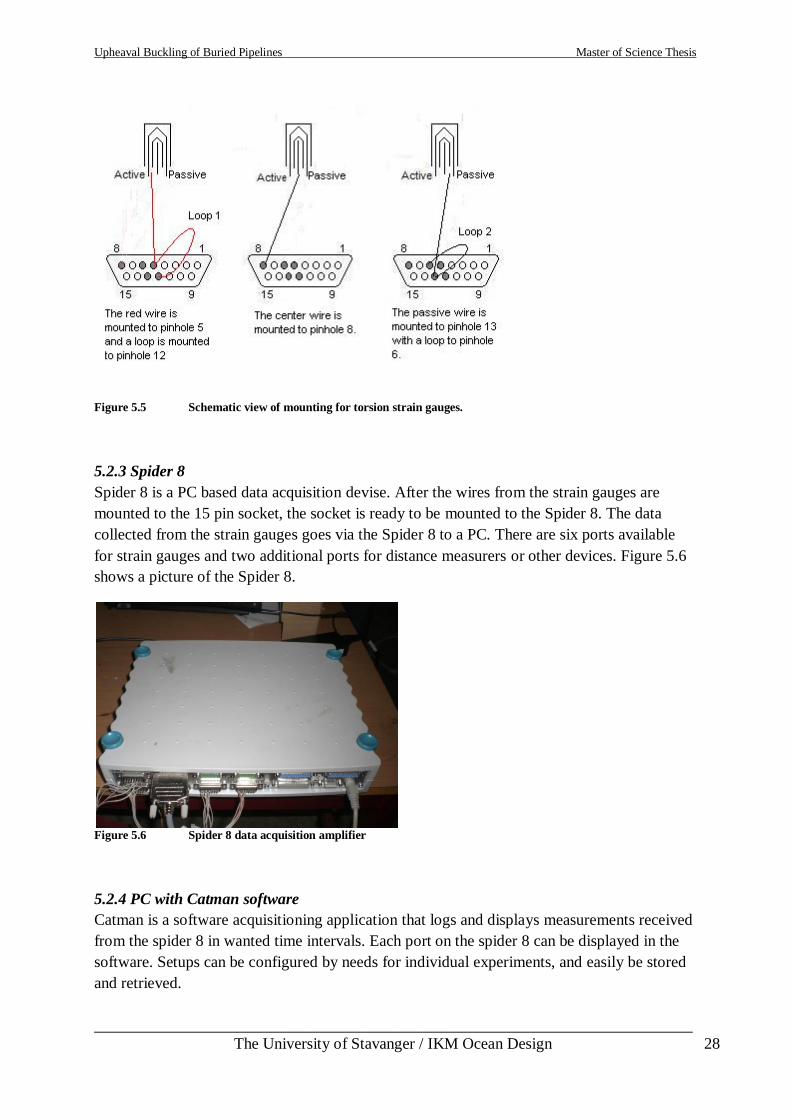
Upheaval Buckling of Buried Pipelines Master of Science Thesis
___________________________________________________________________________
The University of Stavanger / IKM Ocean Design 28
Figure 5.5 Schematic view of mounting for torsion strain gauges.
5.2.3 Spider 8
Spider 8 is a PC based data acquisition devise. After the wires from the strain gauges are
mounted to the 15 pin socket, the socket is ready to be mounted to the Spider 8. The data
collected from the strain gauges goes via the Spider 8 to a PC. There are six ports available
for strain gauges and two additional ports for distance measurers or other devices. Figure 5.6
shows a picture of the Spider 8.
Figure 5.6 Spider 8 data acquisition amplifier
5.2.4 PC with Catman software
Catman is a software acquisitioning application that logs and displays measurements received
from the spider 8 in wanted time intervals. Each port on the spider 8 can be displayed in the
software. Setups can be configured by needs for individual experiments, and easily be stored
and retrieved.
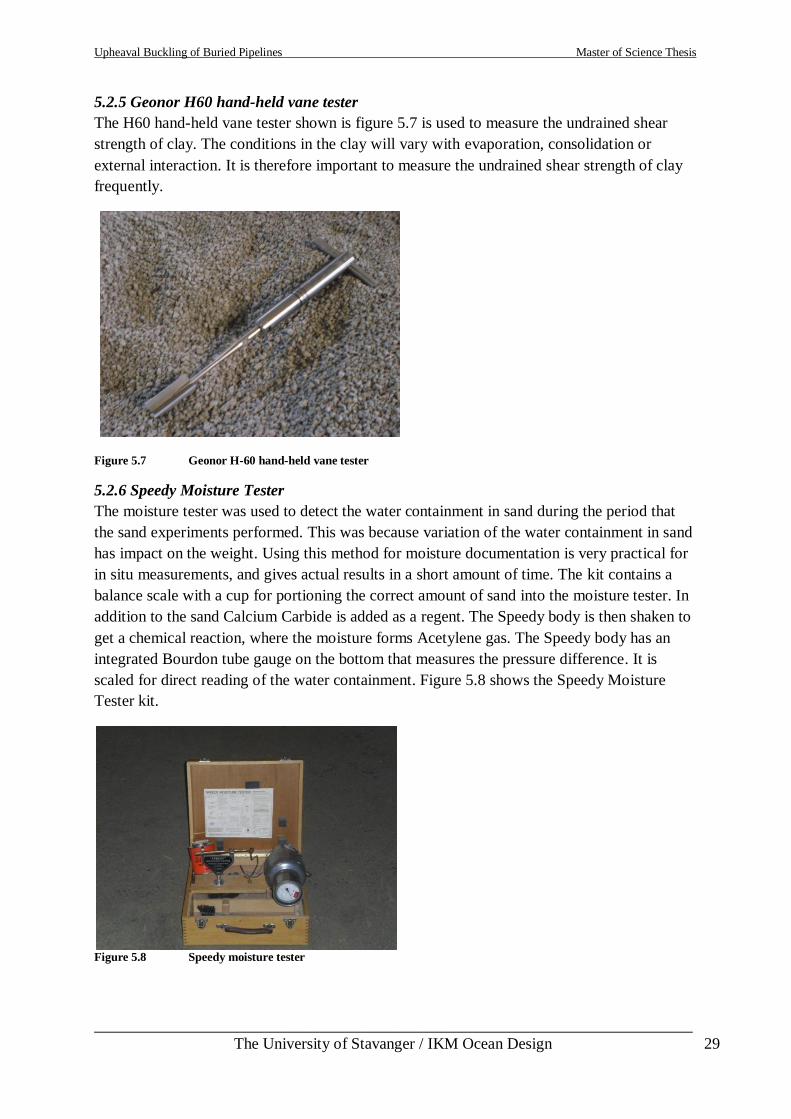
Upheaval Buckling of Buried Pipelines Master of Science Thesis
___________________________________________________________________________
The University of Stavanger / IKM Ocean Design 29
5.2.5 Geonor H60 hand-held vane tester
The H60 hand-held vane tester shown is figure 5.7 is used to measure the undrained shear
strength of clay. The conditions in the clay will vary with evaporation, consolidation or
external interaction. It is therefore important to measure the undrained shear strength of clay
frequently.
Figure 5.7 Geonor H-60 hand-held vane tester
5.2.6 Speedy Moisture Tester
The moisture tester was used to detect the water containment in sand during the period that
the sand experiments performed. This was because variation of the water containment in sand
has impact on the weight. Using this method for moisture documentation is very practical for
in situ measurements, and gives actual results in a short amount of time. The kit contains a
balance scale with a cup for portioning the correct amount of sand into the moisture tester. In
addition to the sand Calcium Carbide is added as a regent. The Speedy body is then shaken to
get a chemical reaction, where the moisture forms Acetylene gas. The Speedy body has an
integrated Bourdon tube gauge on the bottom that measures the pressure difference. It is
scaled for direct reading of the water containment. Figure 5.8 shows the Speedy Moisture
Tester kit.
Figure 5.8 Speedy moisture tester
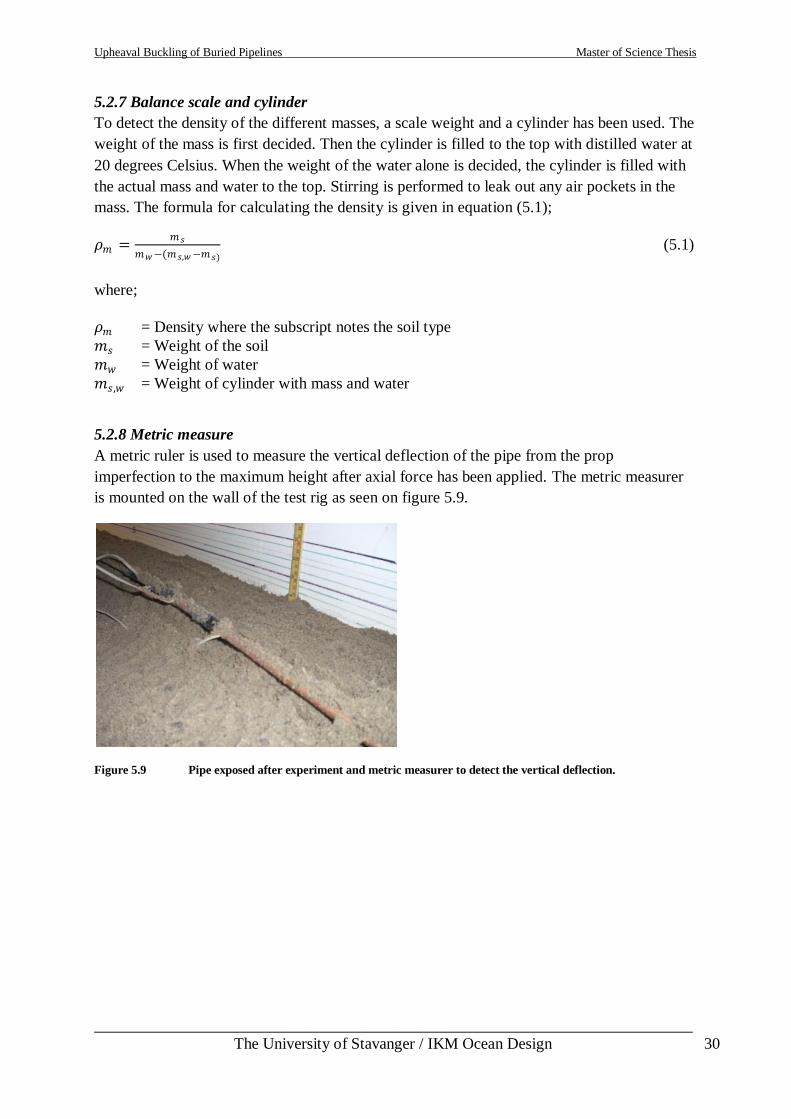
Upheaval Buckling of Buried Pipelines Master of Science Thesis
___________________________________________________________________________
The University of Stavanger / IKM Ocean Design 30
5.2.7 Balance scale and cylinder
To detect the density of the different masses, a scale weight and a cylinder has been used. The
weight of the mass is first decided. Then the cylinder is filled to the top with distilled water at
20 degrees Celsius. When the weight of the water alone is decided, the cylinder is filled with
the actual mass and water to the top. Stirring is performed to leak out any air pockets in the
mass. The formula for calculating the density is given in equation (5.1);
𝜌𝑚 =𝑚𝑠
𝑚𝑤−(𝑚𝑠,𝑤−𝑚𝑠) (5.1)
where;
𝜌𝑚 = Density where the subscript notes the soil type
𝑚𝑠 = Weight of the soil
𝑚𝑤 = Weight of water
𝑚𝑠,𝑤 = Weight of cylinder with mass and water
5.2.8 Metric measure
A metric ruler is used to measure the vertical deflection of the pipe from the prop
imperfection to the maximum height after axial force has been applied. The metric measurer
is mounted on the wall of the test rig as seen on figure 5.9.
Figure 5.9 Pipe exposed after experiment and metric measurer to detect the vertical deflection.
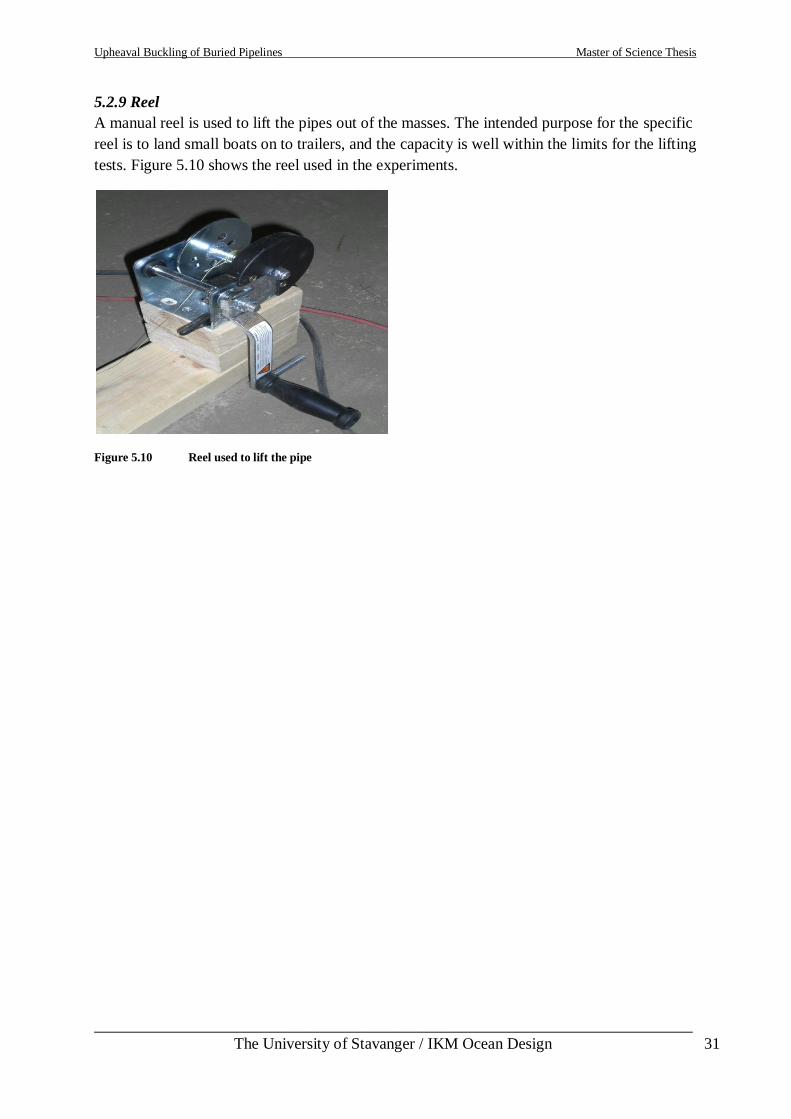
Upheaval Buckling of Buried Pipelines Master of Science Thesis
___________________________________________________________________________
The University of Stavanger / IKM Ocean Design 31
5.2.9 Reel
A manual reel is used to lift the pipes out of the masses. The intended purpose for the specific
reel is to land small boats on to trailers, and the capacity is well within the limits for the lifting
tests. Figure 5.10 shows the reel used in the experiments.
Figure 5.10 Reel used to lift the pipe
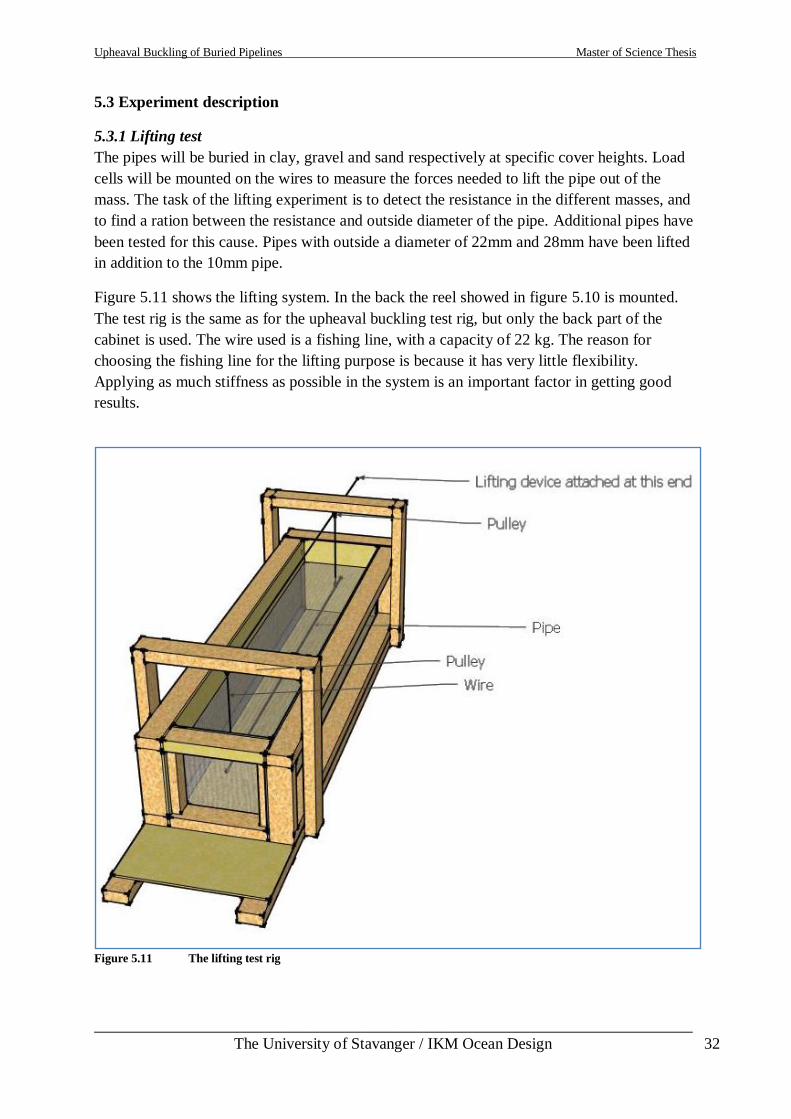
Upheaval Buckling of Buried Pipelines Master of Science Thesis
___________________________________________________________________________
The University of Stavanger / IKM Ocean Design 32
5.3 Experiment description
5.3.1 Lifting test
The pipes will be buried in clay, gravel and sand respectively at specific cover heights. Load
cells will be mounted on the wires to measure the forces needed to lift the pipe out of the
mass. The task of the lifting experiment is to detect the resistance in the different masses, and
to find a ration between the resistance and outside diameter of the pipe. Additional pipes have
been tested for this cause. Pipes with outside a diameter of 22mm and 28mm have been lifted
in addition to the 10mm pipe.
Figure 5.11 shows the lifting system. In the back the reel showed in figure 5.10 is mounted.
The test rig is the same as for the upheaval buckling test rig, but only the back part of the
cabinet is used. The wire used is a fishing line, with a capacity of 22 kg. The reason for
choosing the fishing line for the lifting purpose is because it has very little flexibility.
Applying as much stiffness as possible in the system is an important factor in getting good
results.
Figure 5.11 The lifting test rig
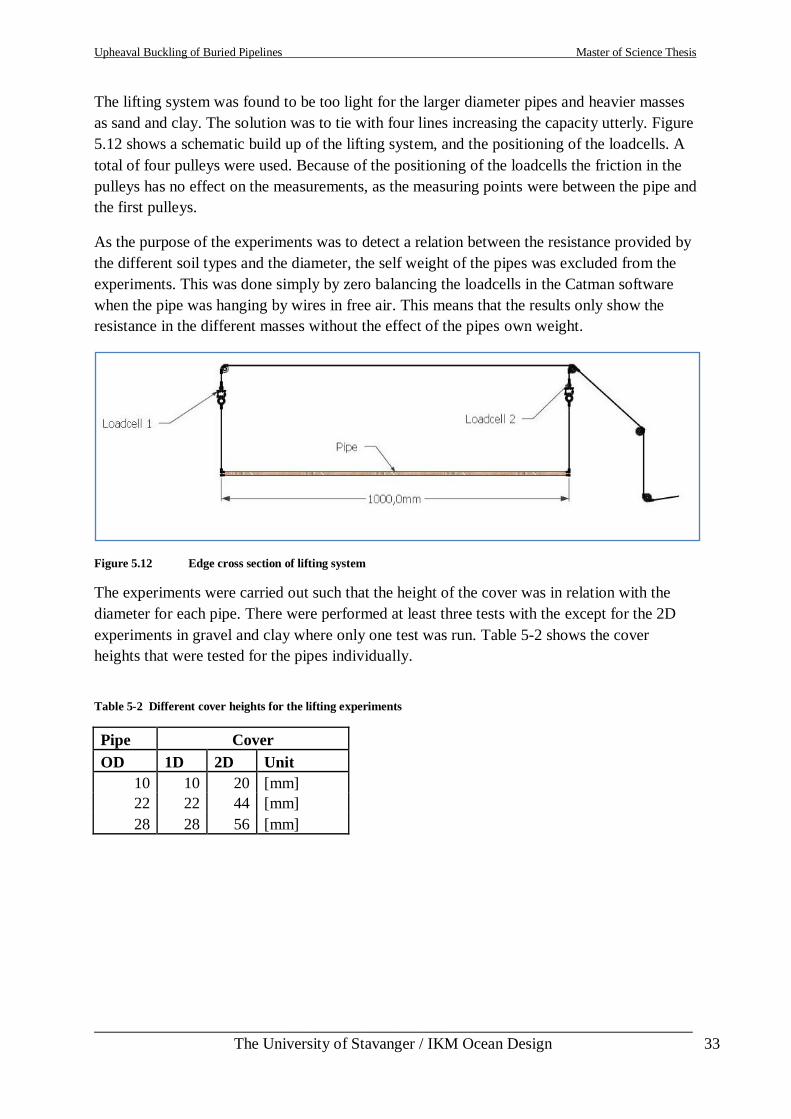
Upheaval Buckling of Buried Pipelines Master of Science Thesis
___________________________________________________________________________
The University of Stavanger / IKM Ocean Design 33
The lifting system was found to be too light for the larger diameter pipes and heavier masses
as sand and clay. The solution was to tie with four lines increasing the capacity utterly. Figure
5.12 shows a schematic build up of the lifting system, and the positioning of the loadcells. A
total of four pulleys were used. Because of the positioning of the loadcells the friction in the
pulleys has no effect on the measurements, as the measuring points were between the pipe and
the first pulleys.
As the purpose of the experiments was to detect a relation between the resistance provided by
the different soil types and the diameter, the self weight of the pipes was excluded from the
experiments. This was done simply by zero balancing the loadcells in the Catman software
when the pipe was hanging by wires in free air. This means that the results only show the
resistance in the different masses without the effect of the pipes own weight.
Figure 5.12 Edge cross section of lifting system
The experiments were carried out such that the height of the cover was in relation with the
diameter for each pipe. There were performed at least three tests with the except for the 2D
experiments in gravel and clay where only one test was run. Table 5-2 shows the cover
heights that were tested for the pipes individually.
Table 5-2 Different cover heights for the lifting experiments
Pipe Cover
OD 1D 2D Unit
10 10 20 [mm]
22 22 44 [mm]
28 28 56 [mm]
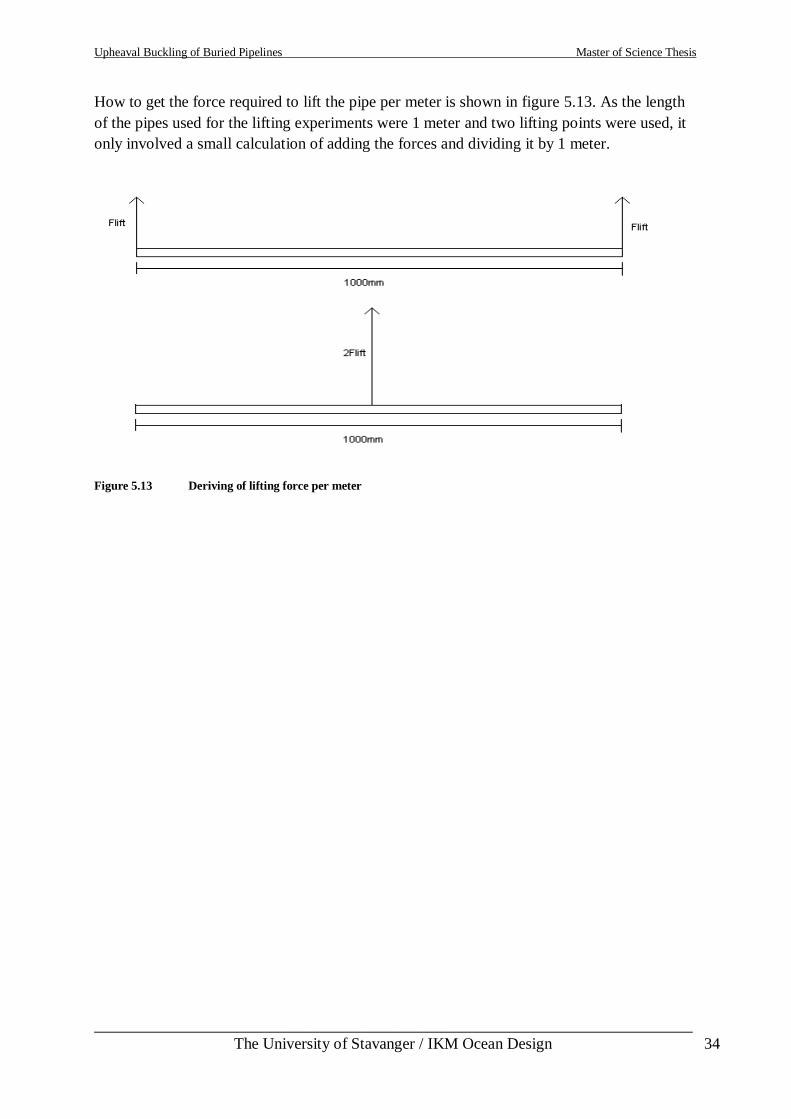
Upheaval Buckling of Buried Pipelines Master of Science Thesis
___________________________________________________________________________
The University of Stavanger / IKM Ocean Design 34
How to get the force required to lift the pipe per meter is shown in figure 5.13. As the length
of the pipes used for the lifting experiments were 1 meter and two lifting points were used, it
only involved a small calculation of adding the forces and dividing it by 1 meter.
Figure 5.13 Deriving of lifting force per meter
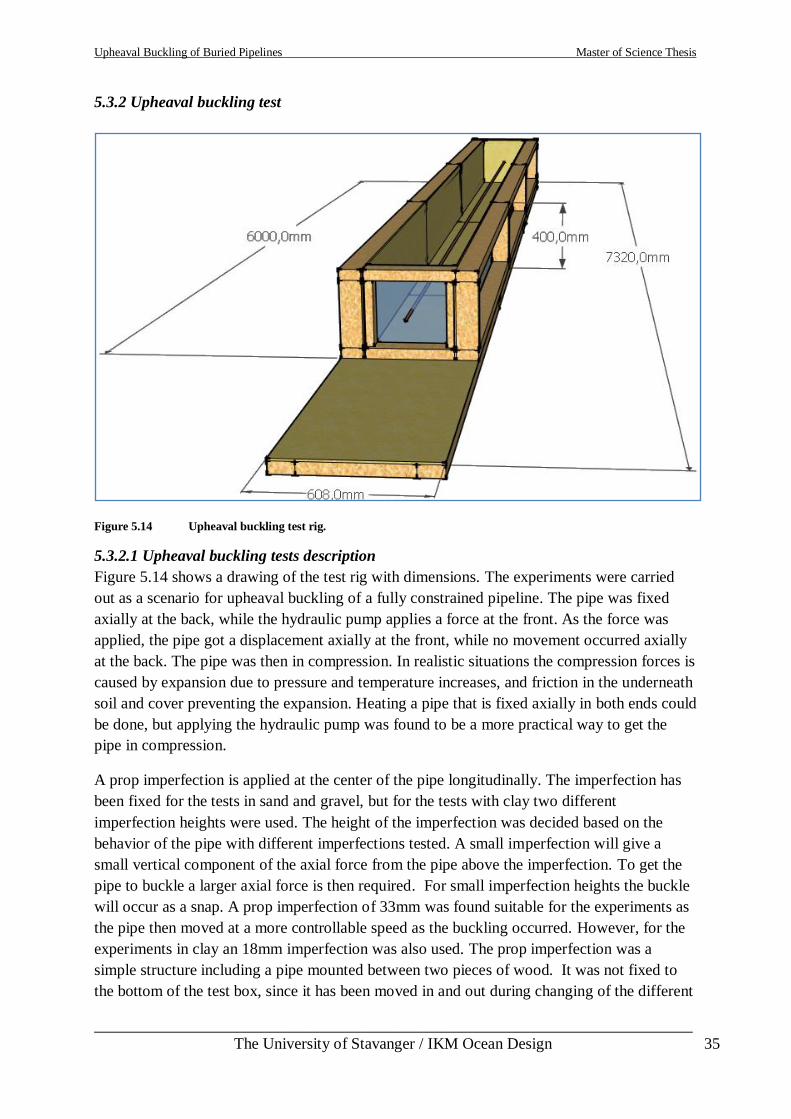
Upheaval Buckling of Buried Pipelines Master of Science Thesis
___________________________________________________________________________
The University of Stavanger / IKM Ocean Design 35
5.3.2 Upheaval buckling test
Figure 5.14 Upheaval buckling test rig.
5.3.2.1 Upheaval buckling tests description
Figure 5.14 shows a drawing of the test rig with dimensions. The experiments were carried
out as a scenario for upheaval buckling of a fully constrained pipeline. The pipe was fixed
axially at the back, while the hydraulic pump applies a force at the front. As the force was
applied, the pipe got a displacement axially at the front, while no movement occurred axially
at the back. The pipe was then in compression. In realistic situations the compression forces is
caused by expansion due to pressure and temperature increases, and friction in the underneath
soil and cover preventing the expansion. Heating a pipe that is fixed axially in both ends could
be done, but applying the hydraulic pump was found to be a more practical way to get the
pipe in compression.
A prop imperfection is applied at the center of the pipe longitudinally. The imperfection has
been fixed for the tests in sand and gravel, but for the tests with clay two different
imperfection heights were used. The height of the imperfection was decided based on the
behavior of the pipe with different imperfections tested. A small imperfection will give a
small vertical component of the axial force from the pipe above the imperfection. To get the
pipe to buckle a larger axial force is then required. For small imperfection heights the buckle
will occur as a snap. A prop imperfection of 33mm was found suitable for the experiments as
the pipe then moved at a more controllable speed as the buckling occurred. However, for the
experiments in clay an 18mm imperfection was also used. The prop imperfection was a
simple structure including a pipe mounted between two pieces of wood. It was not fixed to
the bottom of the test box, since it has been moved in and out during changing of the different
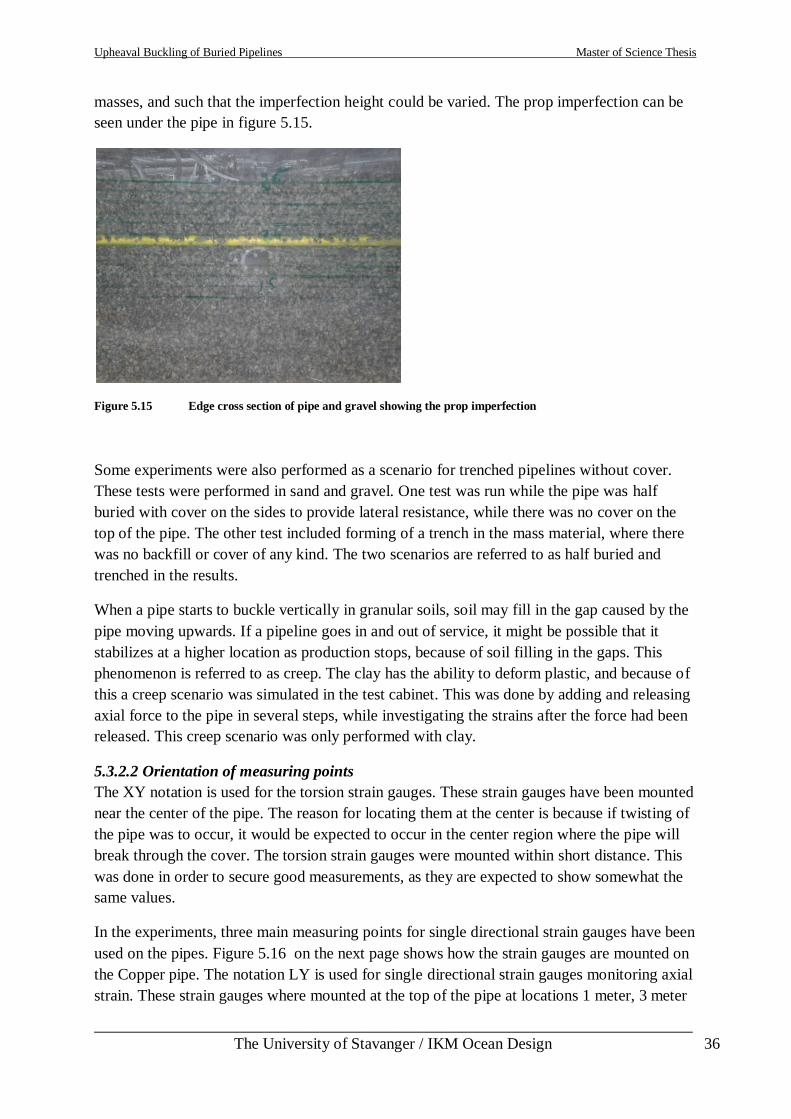
Upheaval Buckling of Buried Pipelines Master of Science Thesis
___________________________________________________________________________
The University of Stavanger / IKM Ocean Design 36
masses, and such that the imperfection height could be varied. The prop imperfection can be
seen under the pipe in figure 5.15.
Figure 5.15 Edge cross section of pipe and gravel showing the prop imperfection
Some experiments were also performed as a scenario for trenched pipelines without cover.
These tests were performed in sand and gravel. One test was run while the pipe was half
buried with cover on the sides to provide lateral resistance, while there was no cover on the
top of the pipe. The other test included forming of a trench in the mass material, where there
was no backfill or cover of any kind. The two scenarios are referred to as half buried and
trenched in the results.
When a pipe starts to buckle vertically in granular soils, soil may fill in the gap caused by the
pipe moving upwards. If a pipeline goes in and out of service, it might be possible that it
stabilizes at a higher location as production stops, because of soil filling in the gaps. This
phenomenon is referred to as creep. The clay has the ability to deform plastic, and because of
this a creep scenario was simulated in the test cabinet. This was done by adding and releasing
axial force to the pipe in several steps, while investigating the strains after the force had been
released. This creep scenario was only performed with clay.
5.3.2.2 Orientation of measuring points
The XY notation is used for the torsion strain gauges. These strain gauges have been mounted
near the center of the pipe. The reason for locating them at the center is because if twisting of
the pipe was to occur, it would be expected to occur in the center region where the pipe will
break through the cover. The torsion strain gauges were mounted within short distance. This
was done in order to secure good measurements, as they are expected to show somewhat the
same values.
In the experiments, three main measuring points for single directional strain gauges have been
used on the pipes. Figure 5.16 on the next page shows how the strain gauges are mounted on
the Copper pipe. The notation LY is used for single directional strain gauges monitoring axial
strain. These strain gauges where mounted at the top of the pipe at locations 1 meter, 3 meter
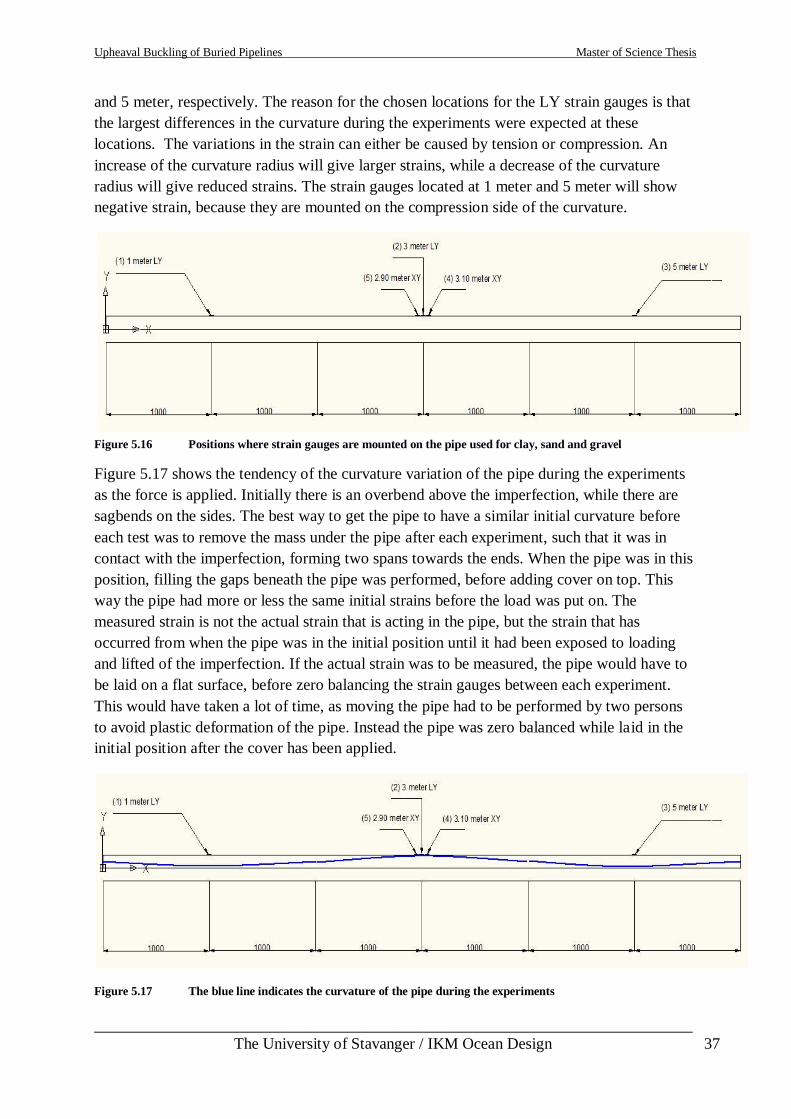
Upheaval Buckling of Buried Pipelines Master of Science Thesis
___________________________________________________________________________
The University of Stavanger / IKM Ocean Design 37
and 5 meter, respectively. The reason for the chosen locations for the LY strain gauges is that
the largest differences in the curvature during the experiments were expected at these
locations. The variations in the strain can either be caused by tension or compression. An
increase of the curvature radius will give larger strains, while a decrease of the curvature
radius will give reduced strains. The strain gauges located at 1 meter and 5 meter will show
negative strain, because they are mounted on the compression side of the curvature.
Figure 5.16 Positions where strain gauges are mounted on the pipe used for clay, sand and gravel
Figure 5.17 shows the tendency of the curvature variation of the pipe during the experiments
as the force is applied. Initially there is an overbend above the imperfection, while there are
sagbends on the sides. The best way to get the pipe to have a similar initial curvature before
each test was to remove the mass under the pipe after each experiment, such that it was in
contact with the imperfection, forming two spans towards the ends. When the pipe was in this
position, filling the gaps beneath the pipe was performed, before adding cover on top. This
way the pipe had more or less the same initial strains before the load was put on. The
measured strain is not the actual strain that is acting in the pipe, but the strain that has
occurred from when the pipe was in the initial position until it had been exposed to loading
and lifted of the imperfection. If the actual strain was to be measured, the pipe would have to
be laid on a flat surface, before zero balancing the strain gauges between each experiment.
This would have taken a lot of time, as moving the pipe had to be performed by two persons
to avoid plastic deformation of the pipe. Instead the pipe was zero balanced while laid in the
initial position after the cover has been applied.
Figure 5.17 The blue line indicates the curvature of the pipe during the experiments
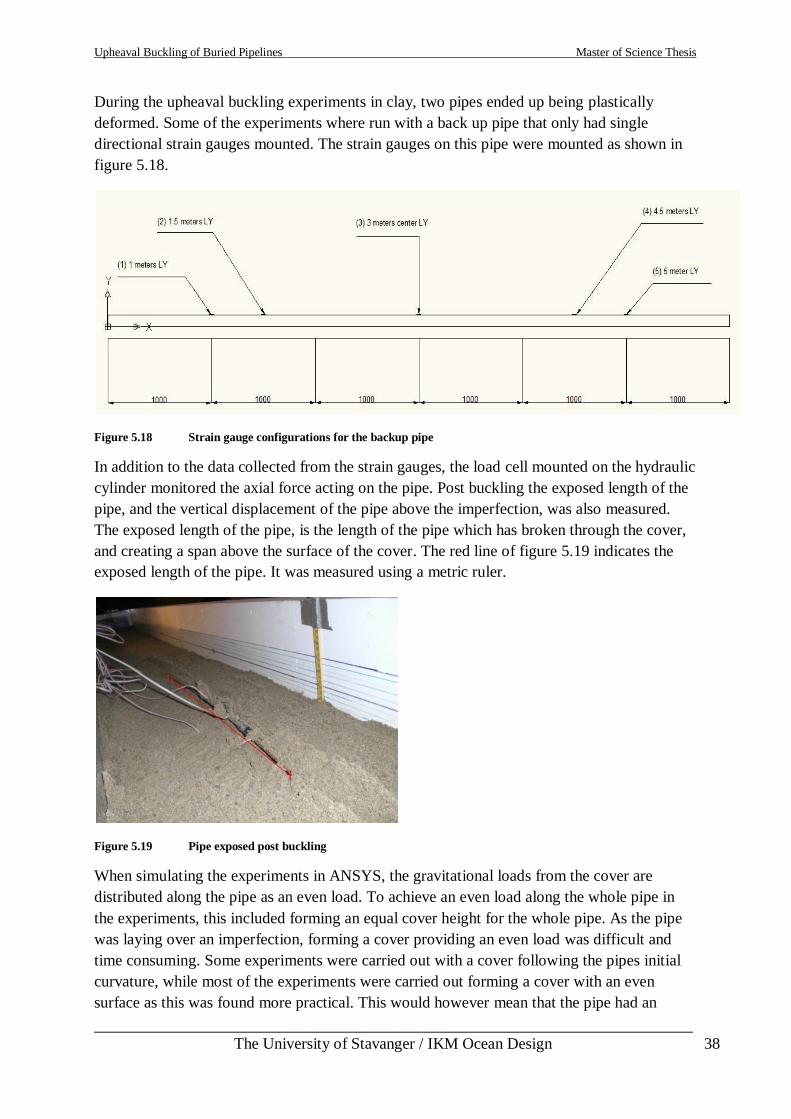
Upheaval Buckling of Buried Pipelines Master of Science Thesis
___________________________________________________________________________
The University of Stavanger / IKM Ocean Design 38
During the upheaval buckling experiments in clay, two pipes ended up being plastically
deformed. Some of the experiments where run with a back up pipe that only had single
directional strain gauges mounted. The strain gauges on this pipe were mounted as shown in
figure 5.18.
Figure 5.18 Strain gauge configurations for the backup pipe
In addition to the data collected from the strain gauges, the load cell mounted on the hydraulic
cylinder monitored the axial force acting on the pipe. Post buckling the exposed length of the
pipe, and the vertical displacement of the pipe above the imperfection, was also measured.
The exposed length of the pipe, is the length of the pipe which has broken through the cover,
and creating a span above the surface of the cover. The red line of figure 5.19 indicates the
exposed length of the pipe. It was measured using a metric ruler.
Figure 5.19 Pipe exposed post buckling
When simulating the experiments in ANSYS, the gravitational loads from the cover are
distributed along the pipe as an even load. To achieve an even load along the whole pipe in
the experiments, this included forming an equal cover height for the whole pipe. As the pipe
was laying over an imperfection, forming a cover providing an even load was difficult and
time consuming. Some experiments were carried out with a cover following the pipes initial
curvature, while most of the experiments were carried out forming a cover with an even
surface as this was found more practical. This would however mean that the pipe had an
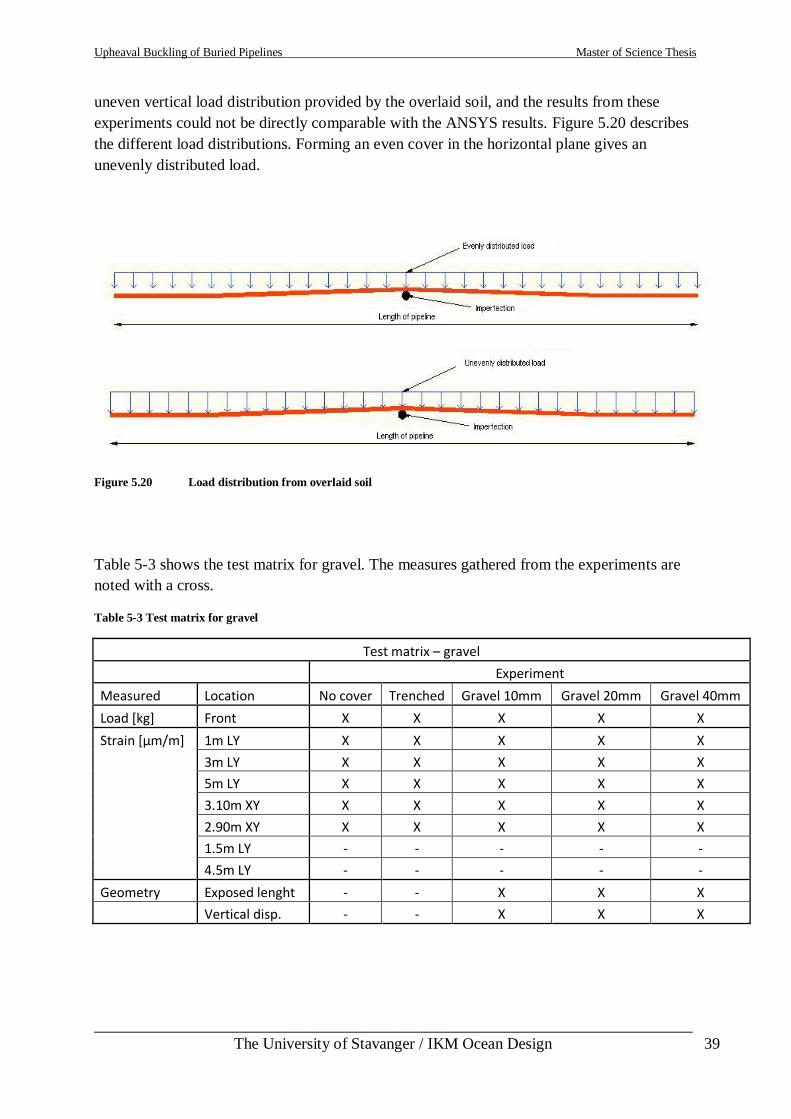
Upheaval Buckling of Buried Pipelines Master of Science Thesis
___________________________________________________________________________
The University of Stavanger / IKM Ocean Design 39
uneven vertical load distribution provided by the overlaid soil, and the results from these
experiments could not be directly comparable with the ANSYS results. Figure 5.20 describes
the different load distributions. Forming an even cover in the horizontal plane gives an
unevenly distributed load.
Figure 5.20 Load distribution from overlaid soil
Table 5-3 shows the test matrix for gravel. The measures gathered from the experiments are
noted with a cross.
Table 5-3 Test matrix for gravel
Test matrix – gravel
Experiment
Measured Location No cover Trenched Gravel 10mm Gravel 20mm Gravel 40mm
Load [kg] Front X X X X X
Strain [µm/m] 1m LY X X X X X
3m LY X X X X X
5m LY X X X X X
3.10m XY X X X X X
2.90m XY X X X X X
1.5m LY - - - - -
4.5m LY - - - - -
Geometry Exposed lenght - - X X X
Vertical disp. - - X X X
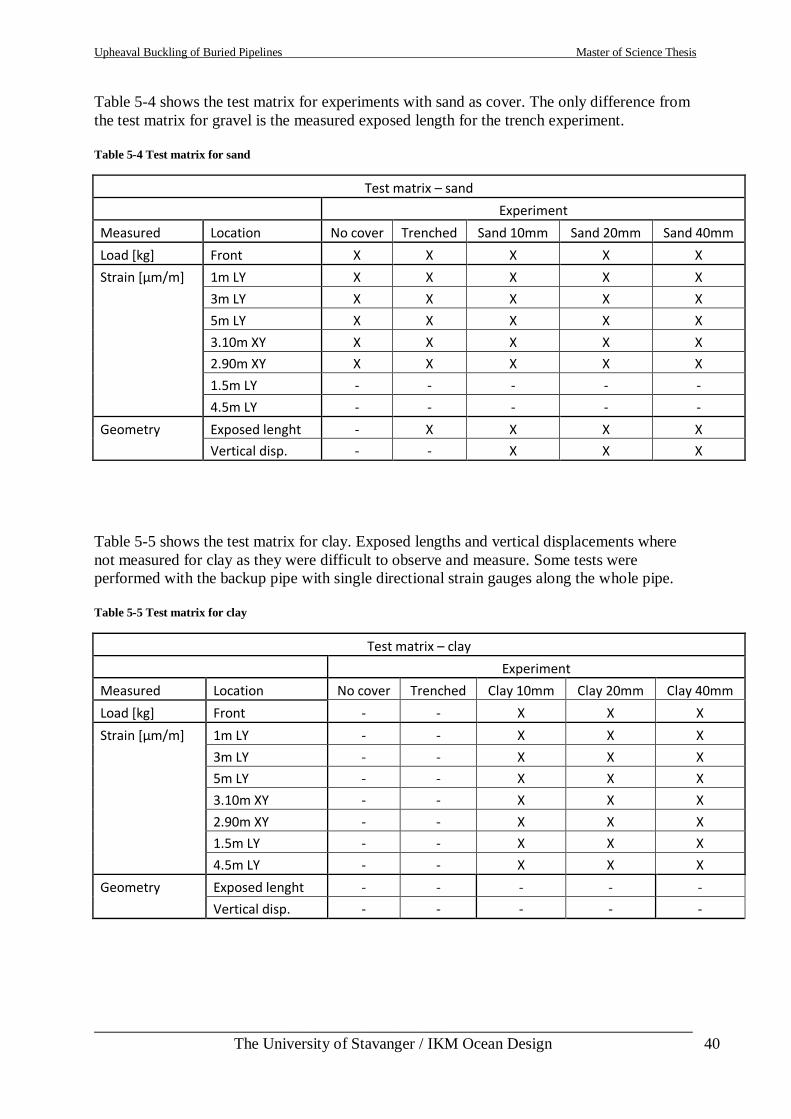
Upheaval Buckling of Buried Pipelines Master of Science Thesis
___________________________________________________________________________
The University of Stavanger / IKM Ocean Design 40
Table 5-4 shows the test matrix for experiments with sand as cover. The only difference from
the test matrix for gravel is the measured exposed length for the trench experiment.
Table 5-4 Test matrix for sand
Test matrix – sand
Experiment
Measured Location No cover Trenched Sand 10mm Sand 20mm Sand 40mm
Load [kg] Front X X X X X
Strain [µm/m] 1m LY X X X X X
3m LY X X X X X
5m LY X X X X X
3.10m XY X X X X X
2.90m XY X X X X X
1.5m LY - - - - -
4.5m LY - - - - -
Geometry Exposed lenght - X X X X
Vertical disp. - - X X X
Table 5-5 shows the test matrix for clay. Exposed lengths and vertical displacements where
not measured for clay as they were difficult to observe and measure. Some tests were
performed with the backup pipe with single directional strain gauges along the whole pipe.
Table 5-5 Test matrix for clay
Test matrix – clay
Experiment
Measured Location No cover Trenched Clay 10mm Clay 20mm Clay 40mm
Load [kg] Front - - X X X
Strain [µm/m] 1m LY - - X X X
3m LY - - X X X
5m LY - - X X X
3.10m XY - - X X X
2.90m XY - - X X X
1.5m LY - - X X X
4.5m LY - - X X X
Geometry Exposed lenght - - - - -
Vertical disp. - - - - -
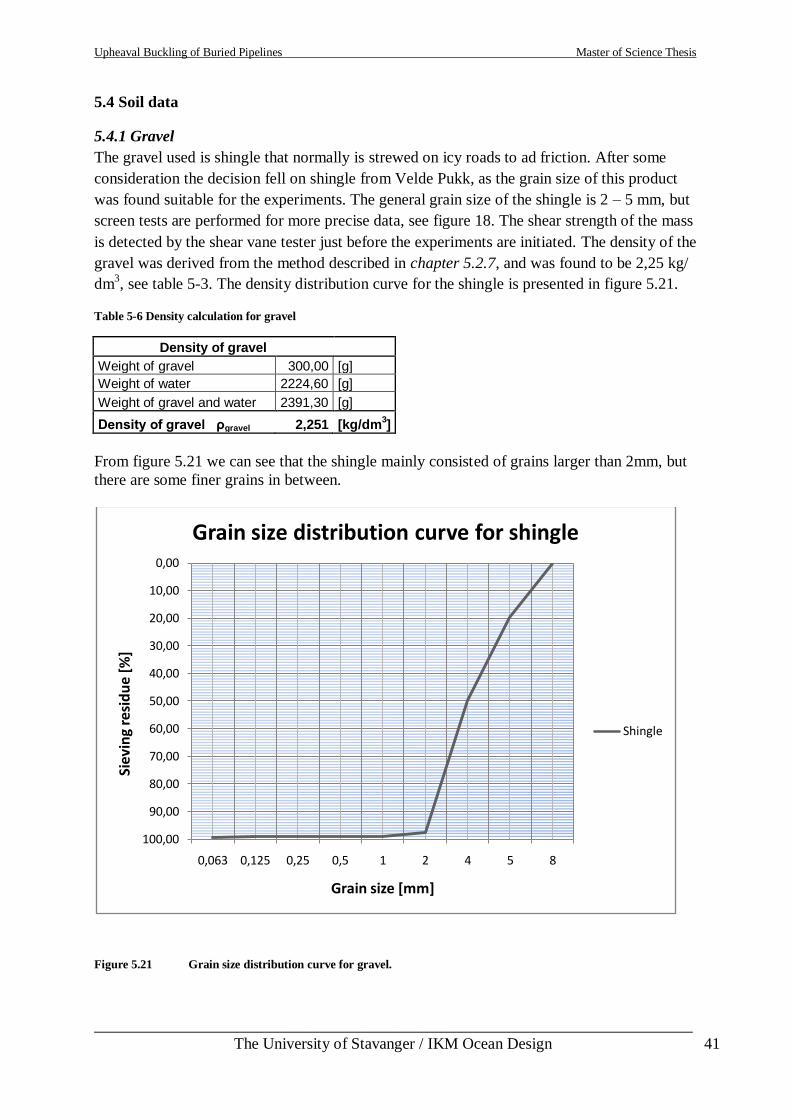
Upheaval Buckling of Buried Pipelines Master of Science Thesis
___________________________________________________________________________
The University of Stavanger / IKM Ocean Design 41
5.4 Soil data
5.4.1 Gravel
The gravel used is shingle that normally is strewed on icy roads to ad friction. After some
consideration the decision fell on shingle from Velde Pukk, as the grain size of this product
was found suitable for the experiments. The general grain size of the shingle is 2 – 5 mm, but
screen tests are performed for more precise data, see figure 18. The shear strength of the mass
is detected by the shear vane tester just before the experiments are initiated. The density of the
gravel was derived from the method described in chapter 5.2.7, and was found to be 2,25 kg/
dm3, see table 5-3. The density distribution curve for the shingle is presented in figure 5.21.
Table 5-6 Density calculation for gravel
Density of gravel
Weight of gravel 300,00 [g]
Weight of water 2224,60 [g]
Weight of gravel and water 2391,30 [g]
Density of gravel ρgravel 2,251 [kg/dm3]
From figure 5.21 we can see that the shingle mainly consisted of grains larger than 2mm, but
there are some finer grains in between.
Figure 5.21 Grain size distribution curve for gravel.
0,00
10,00
20,00
30,00
40,00
50,00
60,00
70,00
80,00
90,00
100,00
854210,50,250,1250,063
Siev
ing
resi
du
e [%
]
Grain size [mm]
Grain size distribution curve for shingle
Shingle
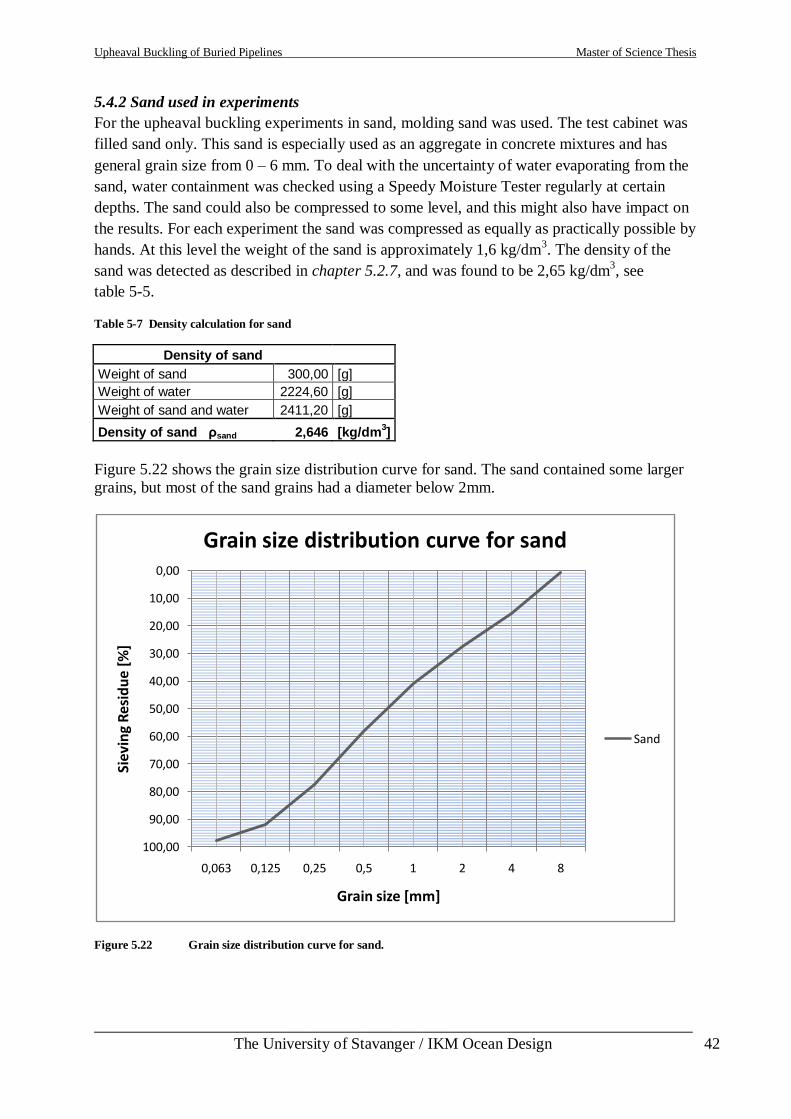
Upheaval Buckling of Buried Pipelines Master of Science Thesis
___________________________________________________________________________
The University of Stavanger / IKM Ocean Design 42
5.4.2 Sand used in experiments
For the upheaval buckling experiments in sand, molding sand was used. The test cabinet was
filled sand only. This sand is especially used as an aggregate in concrete mixtures and has
general grain size from 0 – 6 mm. To deal with the uncertainty of water evaporating from the
sand, water containment was checked using a Speedy Moisture Tester regularly at certain
depths. The sand could also be compressed to some level, and this might also have impact on
the results. For each experiment the sand was compressed as equally as practically possible by
hands. At this level the weight of the sand is approximately 1,6 kg/dm3. The density of the
sand was detected as described in chapter 5.2.7, and was found to be 2,65 kg/dm3, see
table 5-5.
Table 5-7 Density calculation for sand
Density of sand
Weight of sand 300,00 [g]
Weight of water 2224,60 [g]
Weight of sand and water 2411,20 [g]
Density of sand ρsand 2,646 [kg/dm3]
Figure 5.22 shows the grain size distribution curve for sand. The sand contained some larger
grains, but most of the sand grains had a diameter below 2mm.
Figure 5.22 Grain size distribution curve for sand.
0,00
10,00
20,00
30,00
40,00
50,00
60,00
70,00
80,00
90,00
100,00
84210,50,250,1250,063
Siev
ing
Res
idu
e [%
]
Grain size [mm]
Grain size distribution curve for sand
Sand
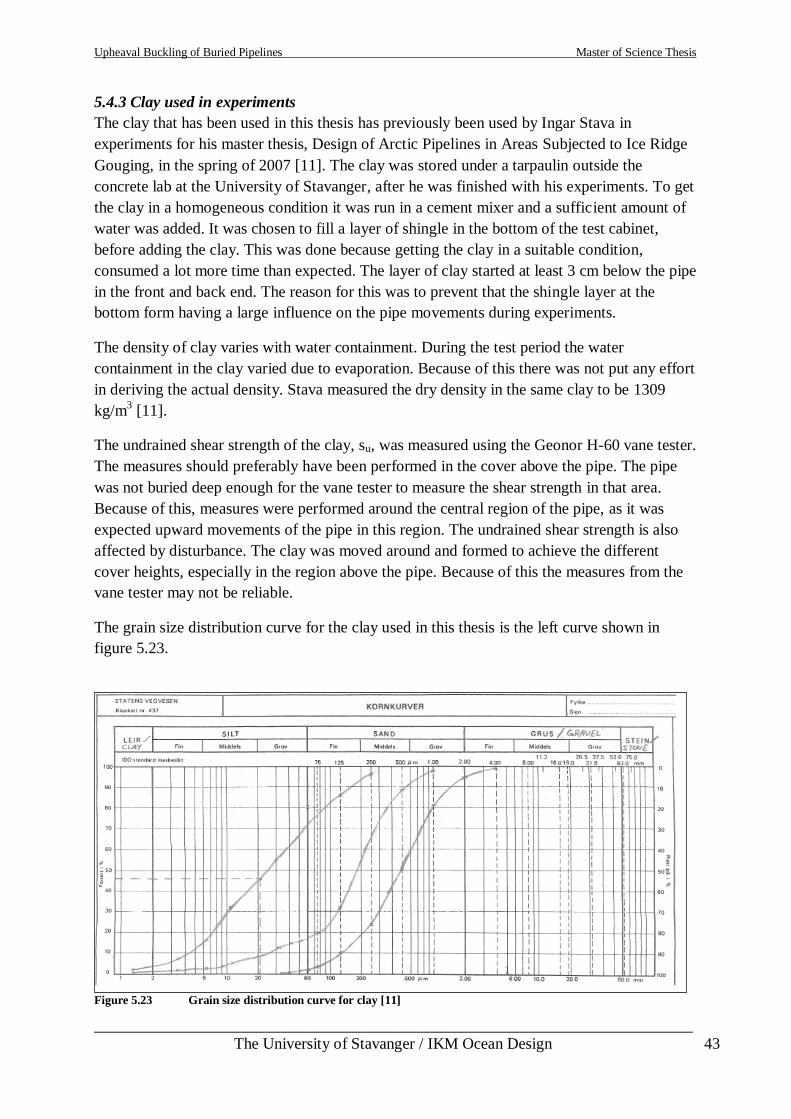
Upheaval Buckling of Buried Pipelines Master of Science Thesis
___________________________________________________________________________
The University of Stavanger / IKM Ocean Design 43
5.4.3 Clay used in experiments
The clay that has been used in this thesis has previously been used by Ingar Stava in
experiments for his master thesis, Design of Arctic Pipelines in Areas Subjected to Ice Ridge
Gouging, in the spring of 2007 [11]. The clay was stored under a tarpaulin outside the
concrete lab at the University of Stavanger, after he was finished with his experiments. To get
the clay in a homogeneous condition it was run in a cement mixer and a sufficient amount of
water was added. It was chosen to fill a layer of shingle in the bottom of the test cabinet,
before adding the clay. This was done because getting the clay in a suitable condition,
consumed a lot more time than expected. The layer of clay started at least 3 cm below the pipe
in the front and back end. The reason for this was to prevent that the shingle layer at the
bottom form having a large influence on the pipe movements during experiments.
The density of clay varies with water containment. During the test period the water
containment in the clay varied due to evaporation. Because of this there was not put any effort
in deriving the actual density. Stava measured the dry density in the same clay to be 1309
kg/m3 [11].
The undrained shear strength of the clay, su, was measured using the Geonor H-60 vane tester.
The measures should preferably have been performed in the cover above the pipe. The pipe
was not buried deep enough for the vane tester to measure the shear strength in that area.
Because of this, measures were performed around the central region of the pipe, as it was
expected upward movements of the pipe in this region. The undrained shear strength is also
affected by disturbance. The clay was moved around and formed to achieve the different
cover heights, especially in the region above the pipe. Because of this the measures from the
vane tester may not be reliable.
The grain size distribution curve for the clay used in this thesis is the left curve shown in
figure 5.23.
Figure 5.23 Grain size distribution curve for clay [11]
Upheaval Buckling of Buried Pipelines Master of Science Thesis
___________________________________________________________________________
The University of Stavanger / IKM Ocean Design 44
6. Finite element method – analysis
In this thesis the practical experiments have also been simulated using Pipeline Simulator,
developed by IKM Ocean Design. The Pipe Simulator is a program based on the general
purpose finite element package ANSYS. ANSYS is a large scale general purpose computer
program used to solve several classes of engineering problems. The program is fully validated
and used within several engineering areas including pipeline and risers analysis. The method
used in the program is the matrix displacement of analysis based upon finite element
idealization. It uses the wave front direct solution method for the system of linear equations
developed from the matrix displacement method.
There are two ways of working with the ANSYS program. One way is to use the Graphics
user interface, GUI, which has a graphical layout as conventional Windows programs. It
displays a main menu tree where you can navigate through the different modules to run
analysis, and a graphic window for displaying optional parts of the model. The other way is to
write codes in command files that can be read into the program. When using codes it is
possible to prepare scripts for a certain problem, such that input values like geometry and
material properties can be changed for solving similar problems with different material
properties or geometry. The Pipe Simulator is an example of a pre programmed script.
There are three phases to go through when working with ANSYS.
6.1 Preprocessing
The first phase is the preprocessing. In this phase the problem is defined by means of
geometry and material properties. Geometry can be created manually or read in from for
example computer aided design programs, CAD, or digital terrain models, DTM, based on
surveys. The geometry is meshed into suitable sized elements, which are given an element
type based on a degree of freedom set and material properties inputs suitable for the analysis.
Data that is required for the calculation of the element matrix that cannot be determined from
the node location or the given material properties are input as “real constants”. For pipe
elements typically real constants can be inner diameter, outer diameter and thickness. Element
types, material properties and real constants are normally defined before creating the
geometry.
6.2 Solution
In this phase loads are applied. There are six categories of loads which are DOF constraints,
forces, surface loads, body loads, inertia loads and coupled field loads. The loads can either be
applied on the solid model, keypoints, lines, and areas or on the finite element model, nodes
and elements. It is possible to specify different load steps, where different loads can be
applied and solved. When all loads and constraints are applied and loadstep configurations are
set, the solution calculations can be run.
6.3 Post processing
In post processing the desired results from the solutions can be gathered. From the solutions
there can be obtained contour displays, deformed shapes, and tabular listings for each
loadstep.
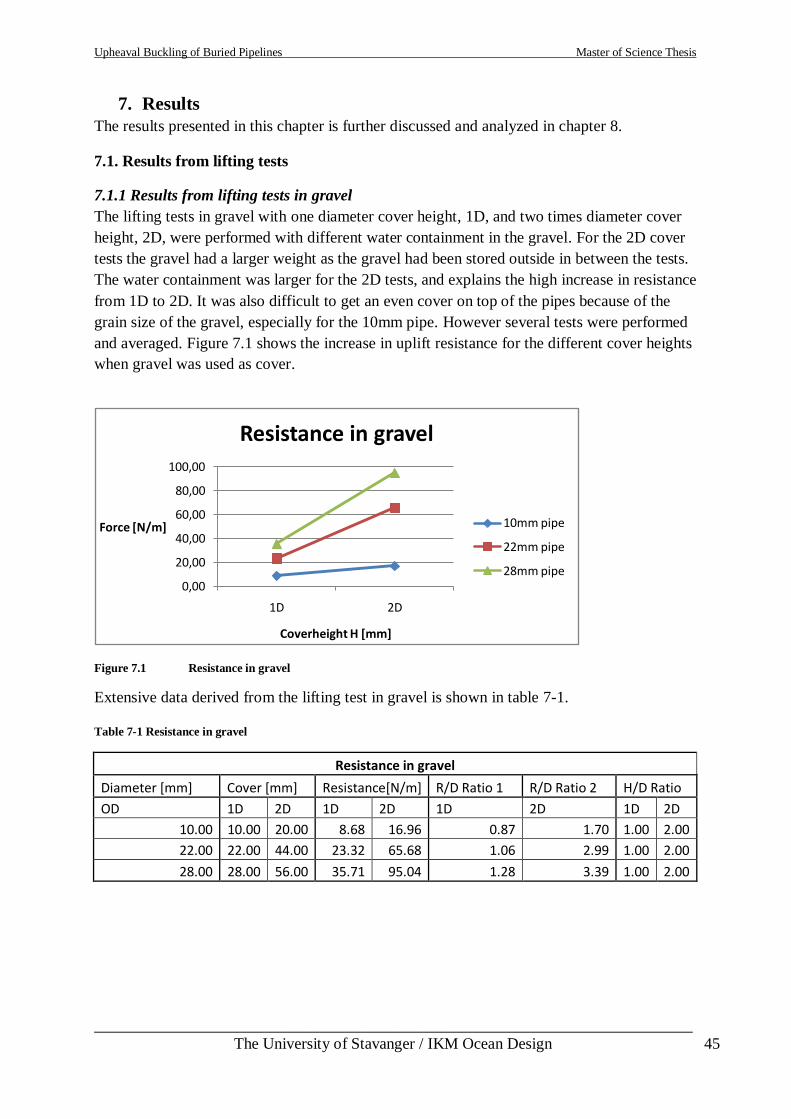
Upheaval Buckling of Buried Pipelines Master of Science Thesis
___________________________________________________________________________
The University of Stavanger / IKM Ocean Design 45
7. Results
The results presented in this chapter is further discussed and analyzed in chapter 8.
7.1. Results from lifting tests
7.1.1 Results from lifting tests in gravel
The lifting tests in gravel with one diameter cover height, 1D, and two times diameter cover
height, 2D, were performed with different water containment in the gravel. For the 2D cover
tests the gravel had a larger weight as the gravel had been stored outside in between the tests.
The water containment was larger for the 2D tests, and explains the high increase in resistance
from 1D to 2D. It was also difficult to get an even cover on top of the pipes because of the
grain size of the gravel, especially for the 10mm pipe. However several tests were performed
and averaged. Figure 7.1 shows the increase in uplift resistance for the different cover heights
when gravel was used as cover.
Figure 7.1 Resistance in gravel
Extensive data derived from the lifting test in gravel is shown in table 7-1.
Table 7-1 Resistance in gravel
Resistance in gravel
Diameter [mm] Cover [mm] Resistance[N/m] R/D Ratio 1 R/D Ratio 2 H/D Ratio
OD 1D 2D 1D 2D 1D 2D 1D 2D
10.00 10.00 20.00 8.68 16.96 0.87 1.70 1.00 2.00
22.00 22.00 44.00 23.32 65.68 1.06 2.99 1.00 2.00
28.00 28.00 56.00 35.71 95.04 1.28 3.39 1.00 2.00
0,00
20,00
40,00
60,00
80,00
100,00
1D 2D
Force [N/m]
Coverheight H [mm]
Resistance in gravel
10mm pipe
22mm pipe
28mm pipe
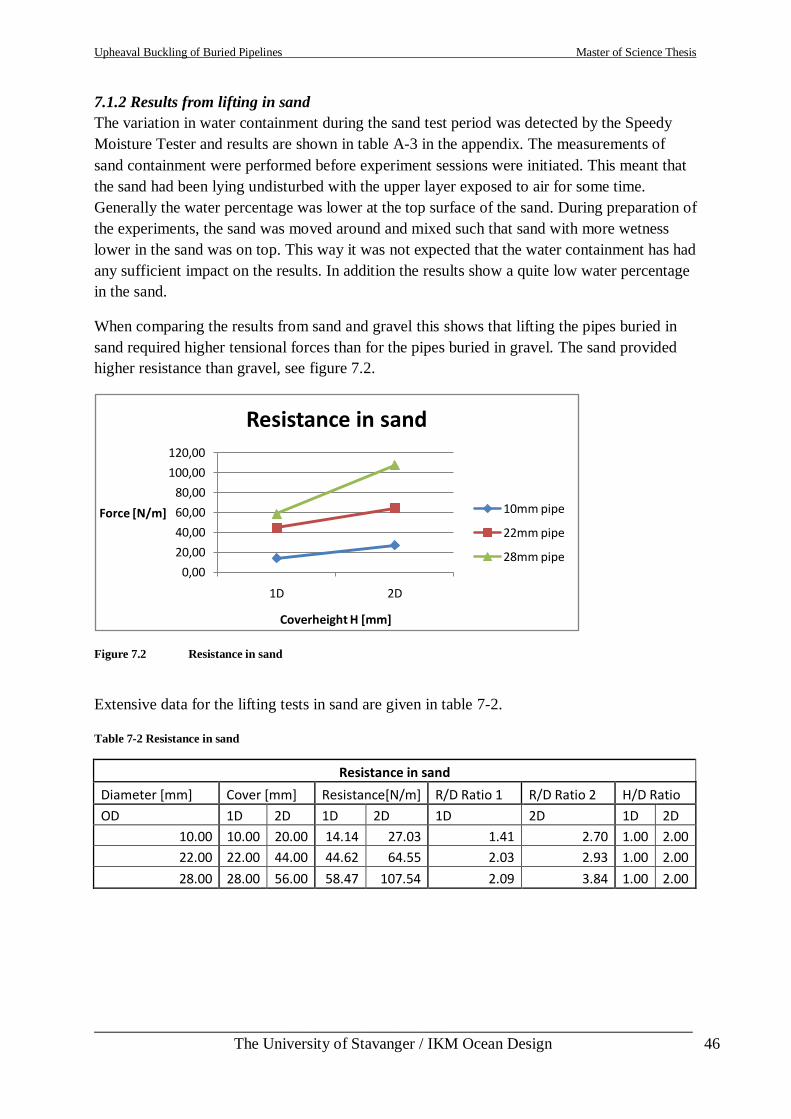
Upheaval Buckling of Buried Pipelines Master of Science Thesis
___________________________________________________________________________
The University of Stavanger / IKM Ocean Design 46
7.1.2 Results from lifting in sand
The variation in water containment during the sand test period was detected by the Speedy
Moisture Tester and results are shown in table A-3 in the appendix. The measurements of
sand containment were performed before experiment sessions were initiated. This meant that
the sand had been lying undisturbed with the upper layer exposed to air for some time.
Generally the water percentage was lower at the top surface of the sand. During preparation of
the experiments, the sand was moved around and mixed such that sand with more wetness
lower in the sand was on top. This way it was not expected that the water containment has had
any sufficient impact on the results. In addition the results show a quite low water percentage
in the sand.
When comparing the results from sand and gravel this shows that lifting the pipes buried in
sand required higher tensional forces than for the pipes buried in gravel. The sand provided
higher resistance than gravel, see figure 7.2.
Figure 7.2 Resistance in sand
Extensive data for the lifting tests in sand are given in table 7-2.
Table 7-2 Resistance in sand
Resistance in sand
Diameter [mm] Cover [mm] Resistance[N/m] R/D Ratio 1 R/D Ratio 2 H/D Ratio
OD 1D 2D 1D 2D 1D 2D 1D 2D
10.00 10.00 20.00 14.14 27.03 1.41 2.70 1.00 2.00
22.00 22.00 44.00 44.62 64.55 2.03 2.93 1.00 2.00
28.00 28.00 56.00 58.47 107.54 2.09 3.84 1.00 2.00
0,00
20,00
40,00
60,00
80,00
100,00
120,00
1D 2D
Force [N/m]
Coverheight H [mm]
Resistance in sand
10mm pipe
22mm pipe
28mm pipe
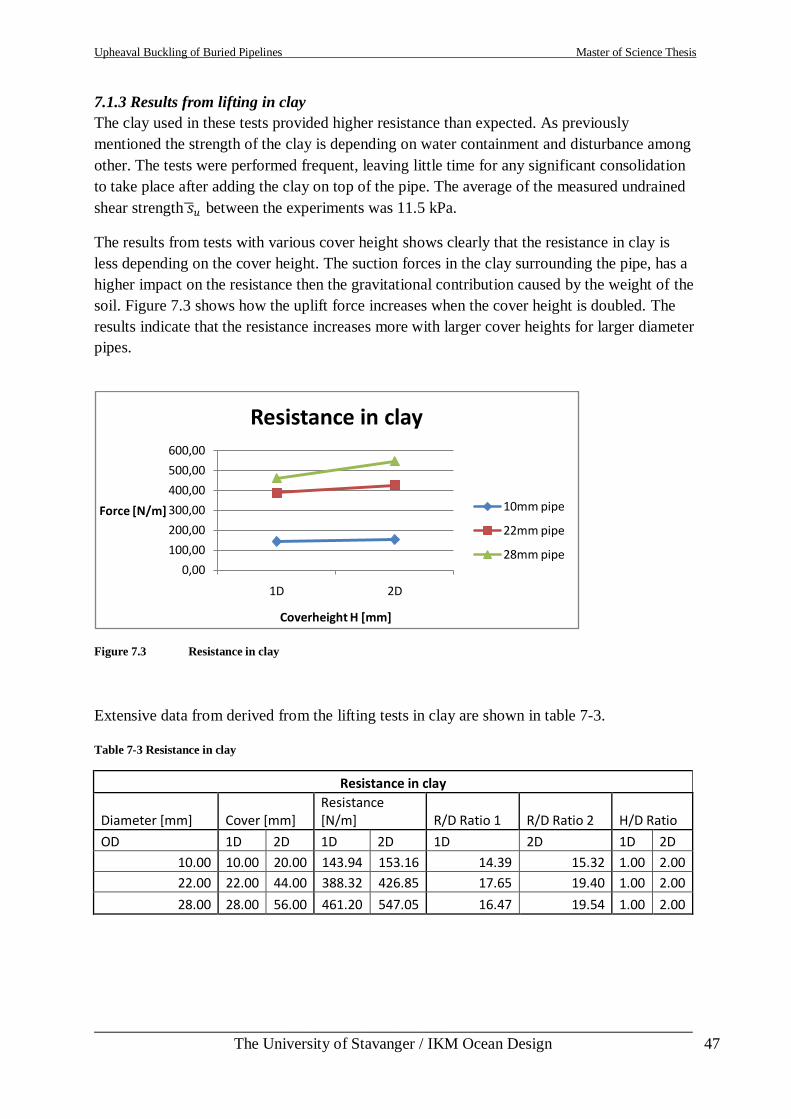
Upheaval Buckling of Buried Pipelines Master of Science Thesis
___________________________________________________________________________
The University of Stavanger / IKM Ocean Design 47
7.1.3 Results from lifting in clay
The clay used in these tests provided higher resistance than expected. As previously
mentioned the strength of the clay is depending on water containment and disturbance among
other. The tests were performed frequent, leaving little time for any significant consolidation
to take place after adding the clay on top of the pipe. The average of the measured undrained
shear strength 𝑠 𝑢 between the experiments was 11.5 kPa.
The results from tests with various cover height shows clearly that the resistance in clay is
less depending on the cover height. The suction forces in the clay surrounding the pipe, has a
higher impact on the resistance then the gravitational contribution caused by the weight of the
soil. Figure 7.3 shows how the uplift force increases when the cover height is doubled. The
results indicate that the resistance increases more with larger cover heights for larger diameter
pipes.
Figure 7.3 Resistance in clay
Extensive data from derived from the lifting tests in clay are shown in table 7-3.
Table 7-3 Resistance in clay
Resistance in clay
Diameter [mm] Cover [mm] Resistance [N/m] R/D Ratio 1 R/D Ratio 2 H/D Ratio
OD 1D 2D 1D 2D 1D 2D 1D 2D
10.00 10.00 20.00 143.94 153.16 14.39 15.32 1.00 2.00
22.00 22.00 44.00 388.32 426.85 17.65 19.40 1.00 2.00
28.00 28.00 56.00 461.20 547.05 16.47 19.54 1.00 2.00
0,00
100,00
200,00
300,00
400,00
500,00
600,00
1D 2D
Force [N/m]
Coverheight H [mm]
Resistance in clay
10mm pipe
22mm pipe
28mm pipe
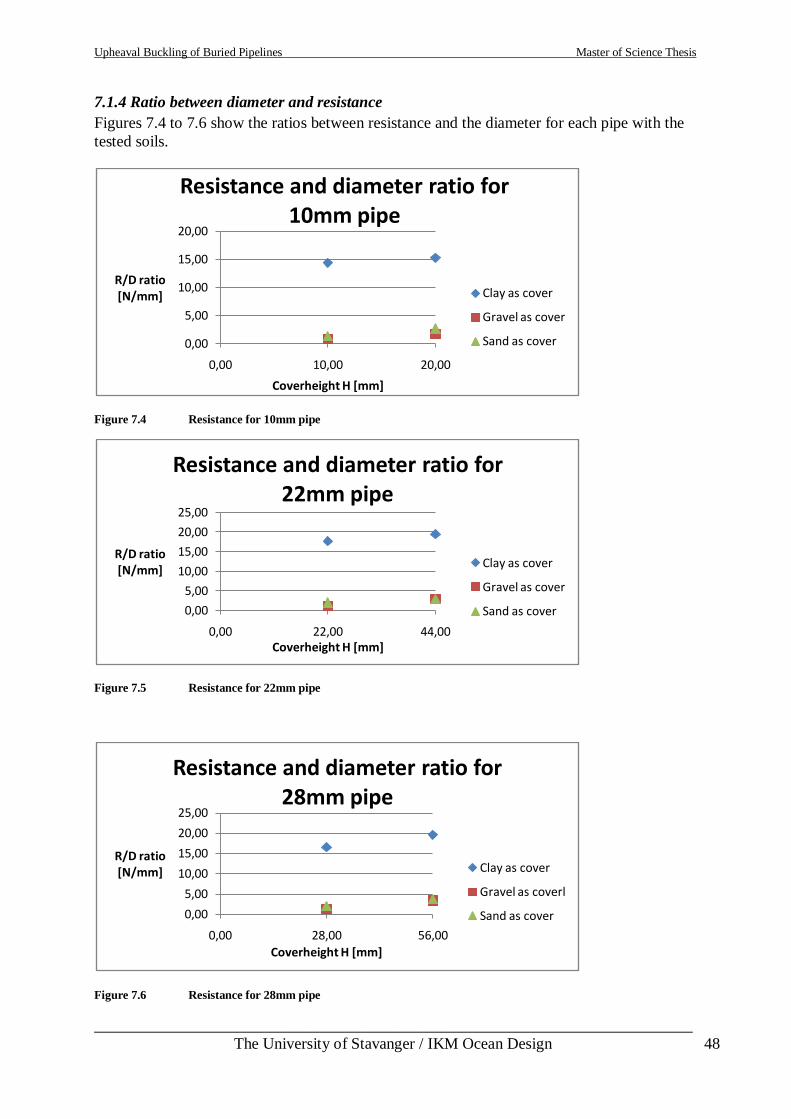
Upheaval Buckling of Buried Pipelines Master of Science Thesis
___________________________________________________________________________
The University of Stavanger / IKM Ocean Design 48
7.1.4 Ratio between diameter and resistance
Figures 7.4 to 7.6 show the ratios between resistance and the diameter for each pipe with the
tested soils.
Figure 7.4 Resistance for 10mm pipe
Figure 7.5 Resistance for 22mm pipe
Figure 7.6 Resistance for 28mm pipe
0,00
5,00
10,00
15,00
20,00
0,00 10,00 20,00
R/D ratio[N/mm]
Coverheight H [mm]
Resistance and diameter ratio for 10mm pipe
Clay as cover
Gravel as cover
Sand as cover
0,00
5,00
10,00
15,00
20,00
25,00
0,00 22,00 44,00
R/D ratio[N/mm]
Coverheight H [mm]
Resistance and diameter ratio for 22mm pipe
Clay as cover
Gravel as cover
Sand as cover
0,00
5,00
10,00
15,00
20,00
25,00
0,00 28,00 56,00
R/D ratio[N/mm]
Coverheight H [mm]
Resistance and diameter ratio for 28mm pipe
Clay as cover
Gravel as coverl
Sand as cover
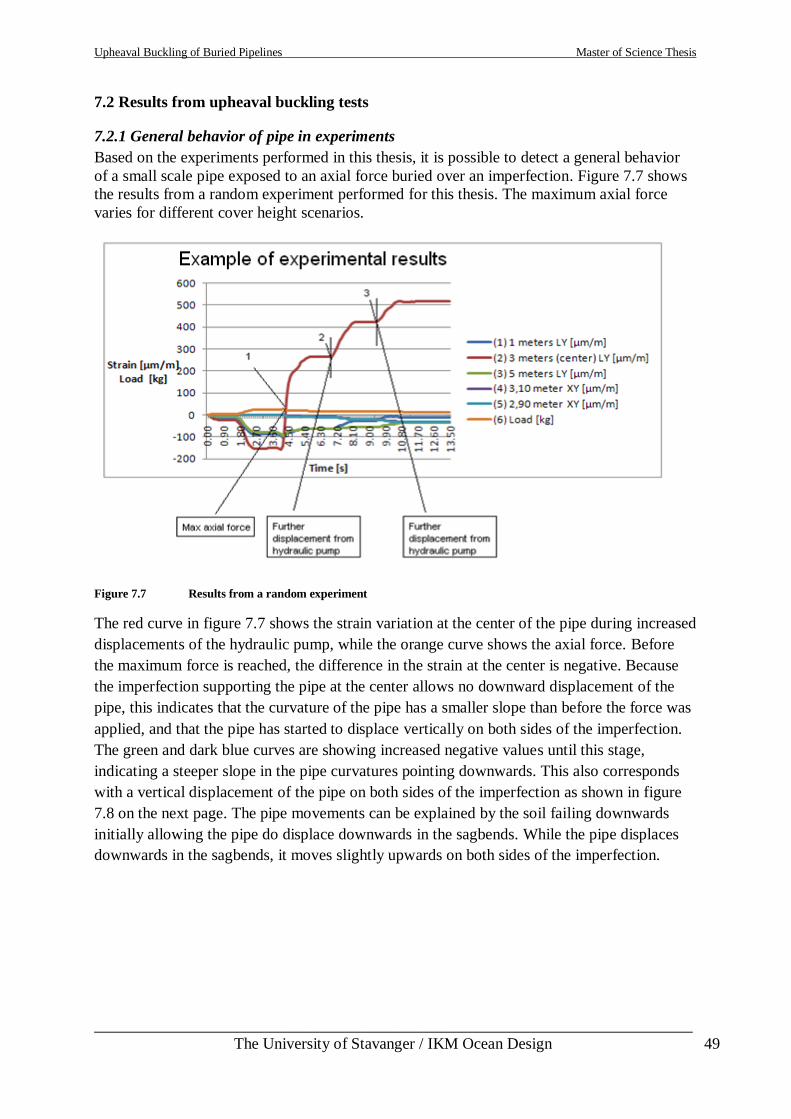
Upheaval Buckling of Buried Pipelines Master of Science Thesis
___________________________________________________________________________
The University of Stavanger / IKM Ocean Design 49
7.2 Results from upheaval buckling tests
7.2.1 General behavior of pipe in experiments
Based on the experiments performed in this thesis, it is possible to detect a general behavior
of a small scale pipe exposed to an axial force buried over an imperfection. Figure 7.7 shows
the results from a random experiment performed for this thesis. The maximum axial force
varies for different cover height scenarios.
Figure 7.7 Results from a random experiment
The red curve in figure 7.7 shows the strain variation at the center of the pipe during increased
displacements of the hydraulic pump, while the orange curve shows the axial force. Before
the maximum force is reached, the difference in the strain at the center is negative. Because
the imperfection supporting the pipe at the center allows no downward displacement of the
pipe, this indicates that the curvature of the pipe has a smaller slope than before the force was
applied, and that the pipe has started to displace vertically on both sides of the imperfection.
The green and dark blue curves are showing increased negative values until this stage,
indicating a steeper slope in the pipe curvatures pointing downwards. This also corresponds
with a vertical displacement of the pipe on both sides of the imperfection as shown in figure
7.8 on the next page. The pipe movements can be explained by the soil failing downwards
initially allowing the pipe do displace downwards in the sagbends. While the pipe displaces
downwards in the sagbends, it moves slightly upwards on both sides of the imperfection.
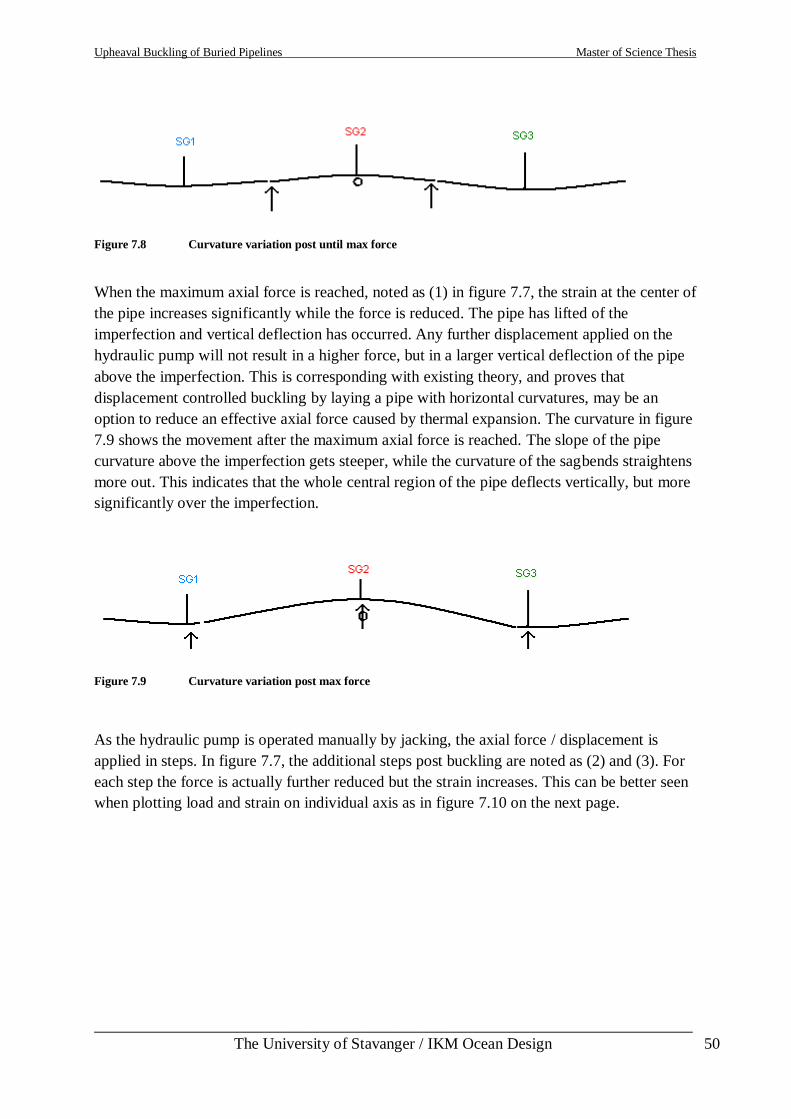
Upheaval Buckling of Buried Pipelines Master of Science Thesis
___________________________________________________________________________
The University of Stavanger / IKM Ocean Design 50
Figure 7.8 Curvature variation post until max force
When the maximum axial force is reached, noted as (1) in figure 7.7, the strain at the center of
the pipe increases significantly while the force is reduced. The pipe has lifted of the
imperfection and vertical deflection has occurred. Any further displacement applied on the
hydraulic pump will not result in a higher force, but in a larger vertical deflection of the pipe
above the imperfection. This is corresponding with existing theory, and proves that
displacement controlled buckling by laying a pipe with horizontal curvatures, may be an
option to reduce an effective axial force caused by thermal expansion. The curvature in figure
7.9 shows the movement after the maximum axial force is reached. The slope of the pipe
curvature above the imperfection gets steeper, while the curvature of the sagbends straightens
more out. This indicates that the whole central region of the pipe deflects vertically, but more
significantly over the imperfection.
Figure 7.9 Curvature variation post max force
As the hydraulic pump is operated manually by jacking, the axial force / displacement is
applied in steps. In figure 7.7, the additional steps post buckling are noted as (2) and (3). For
each step the force is actually further reduced but the strain increases. This can be better seen
when plotting load and strain on individual axis as in figure 7.10 on the next page.
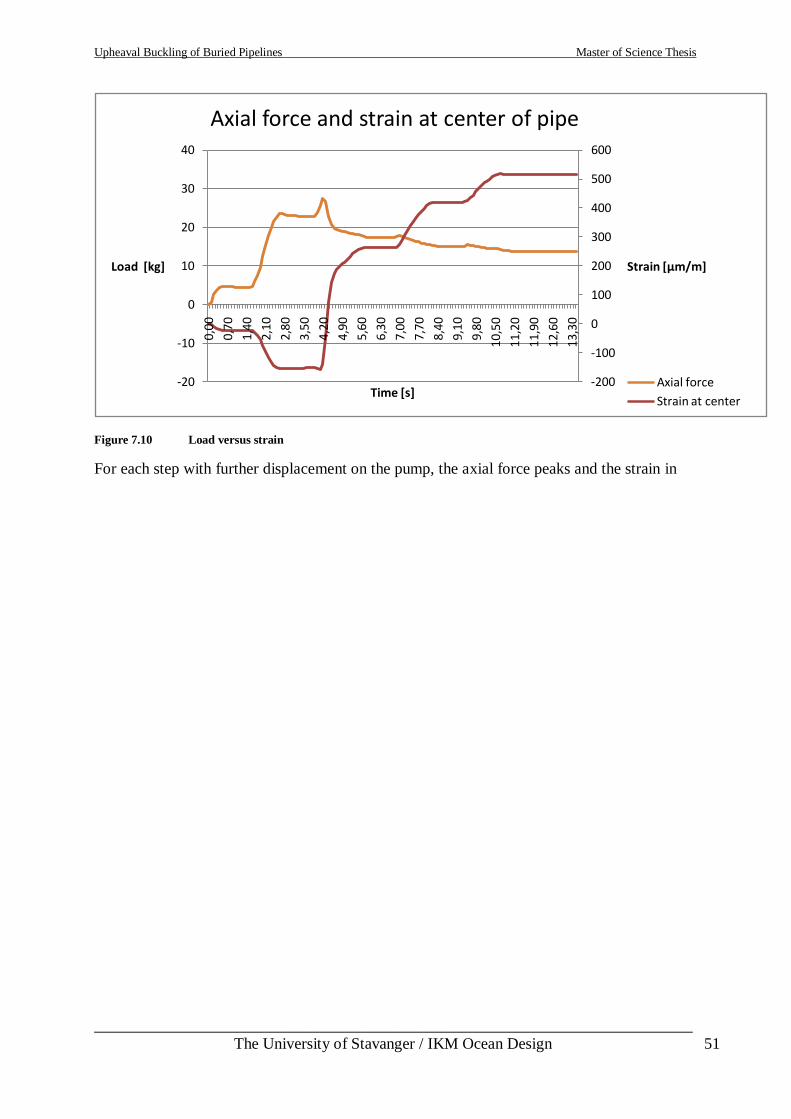
Upheaval Buckling of Buried Pipelines Master of Science Thesis
___________________________________________________________________________
The University of Stavanger / IKM Ocean Design 51
Figure 7.10 Load versus strain
For each step with further displacement on the pump, the axial force peaks and the strain in
-200
-100
0
100
200
300
400
500
600
-20
-10
0
10
20
30
40
0,00
0,70
1,40
2,10
2,80
3,50
4,20
4,90
5,60
6,30
7,00
7,70
8,40
9,10
9,80
10,5
0
11,2
0
11,9
0
12,6
0
13,3
0
Strain [µm/m]Load [kg]
Time [s]
Axial force and strain at center of pipe
Axial force
Strain at center
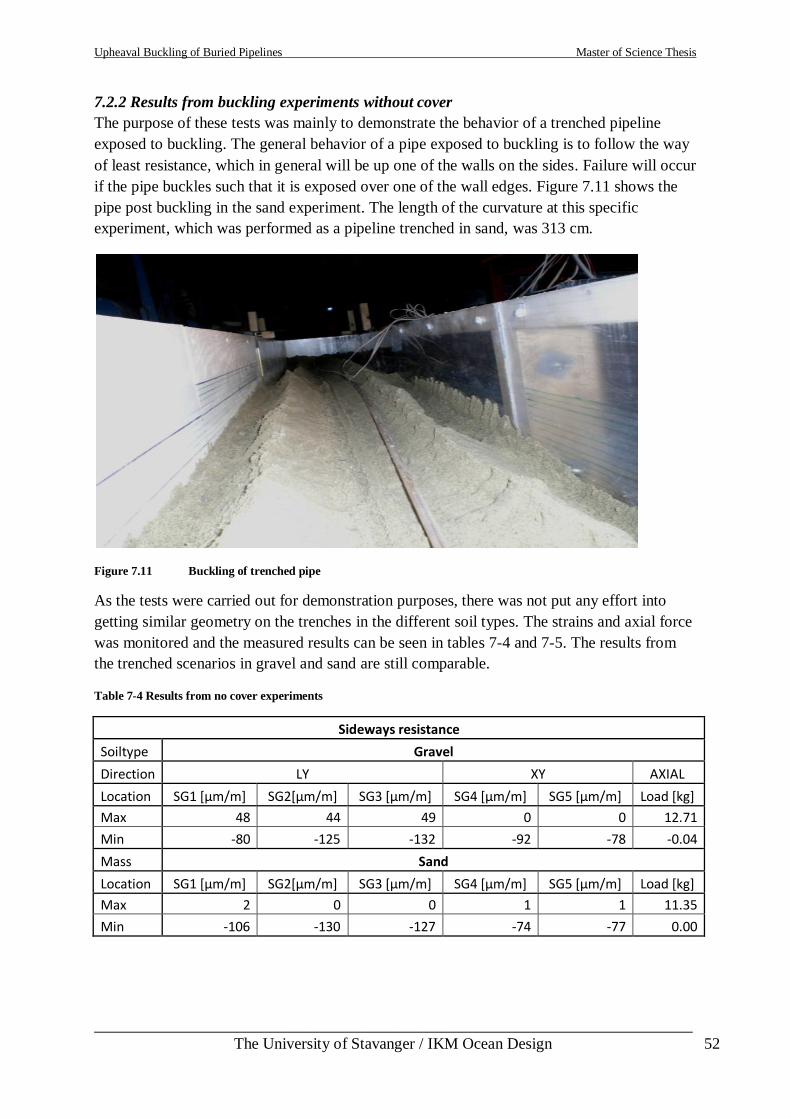
Upheaval Buckling of Buried Pipelines Master of Science Thesis
___________________________________________________________________________
The University of Stavanger / IKM Ocean Design 52
7.2.2 Results from buckling experiments without cover
The purpose of these tests was mainly to demonstrate the behavior of a trenched pipeline
exposed to buckling. The general behavior of a pipe exposed to buckling is to follow the way
of least resistance, which in general will be up one of the walls on the sides. Failure will occur
if the pipe buckles such that it is exposed over one of the wall edges. Figure 7.11 shows the
pipe post buckling in the sand experiment. The length of the curvature at this specific
experiment, which was performed as a pipeline trenched in sand, was 313 cm.
Figure 7.11 Buckling of trenched pipe
As the tests were carried out for demonstration purposes, there was not put any effort into
getting similar geometry on the trenches in the different soil types. The strains and axial force
was monitored and the measured results can be seen in tables 7-4 and 7-5. The results from
the trenched scenarios in gravel and sand are still comparable.
Table 7-4 Results from no cover experiments
Sideways resistance
Soiltype Gravel
Direction LY XY AXIAL
Location SG1 [μm/m] SG2[μm/m] SG3 [μm/m] SG4 [μm/m] SG5 [μm/m] Load [kg]
Max 48 44 49 0 0 12.71
Min -80 -125 -132 -92 -78 -0.04
Mass Sand
Location SG1 [μm/m] SG2[μm/m] SG3 [μm/m] SG4 [μm/m] SG5 [μm/m] Load [kg]
Max 2 0 0 1 1 11.35
Min -106 -130 -127 -74 -77 0.00
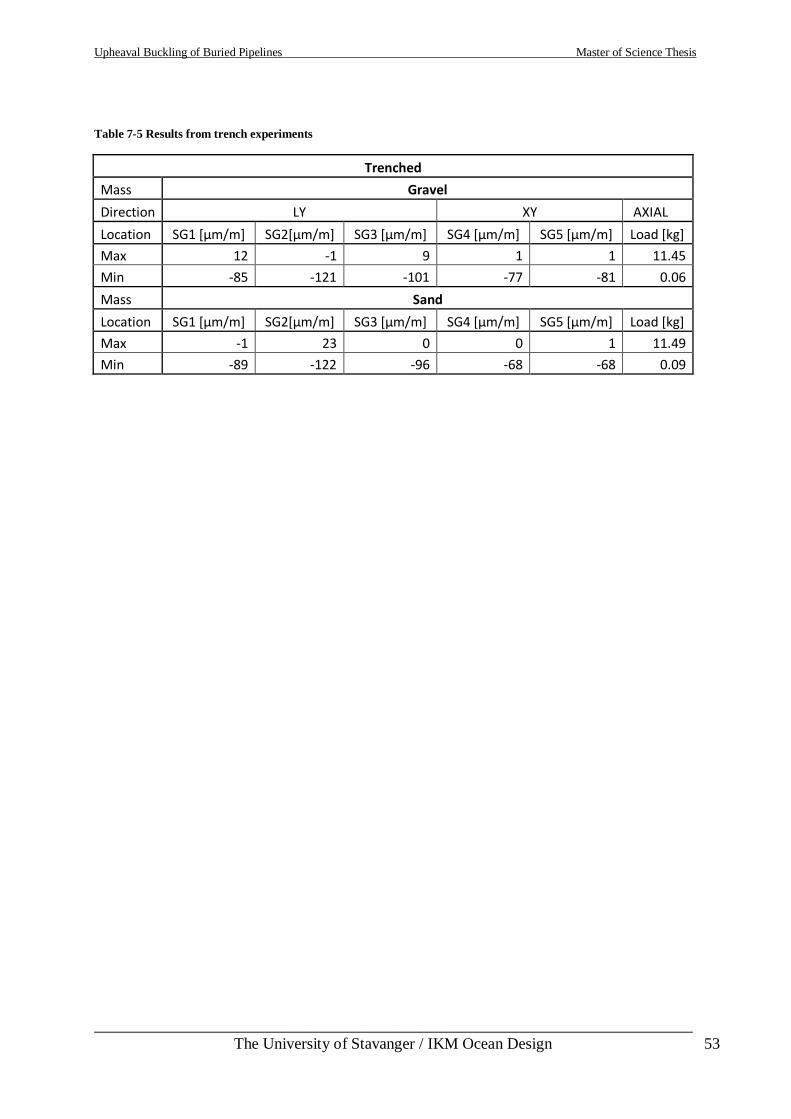
Upheaval Buckling of Buried Pipelines Master of Science Thesis
___________________________________________________________________________
The University of Stavanger / IKM Ocean Design 53
Table 7-5 Results from trench experiments
Trenched
Mass Gravel
Direction LY XY AXIAL
Location SG1 [μm/m] SG2[μm/m] SG3 [μm/m] SG4 [μm/m] SG5 [μm/m] Load [kg]
Max 12 -1 9 1 1 11.45
Min -85 -121 -101 -77 -81 0.06
Mass Sand
Location SG1 [μm/m] SG2[μm/m] SG3 [μm/m] SG4 [μm/m] SG5 [μm/m] Load [kg]
Max -1 23 0 0 1 11.49
Min -89 -122 -96 -68 -68 0.09
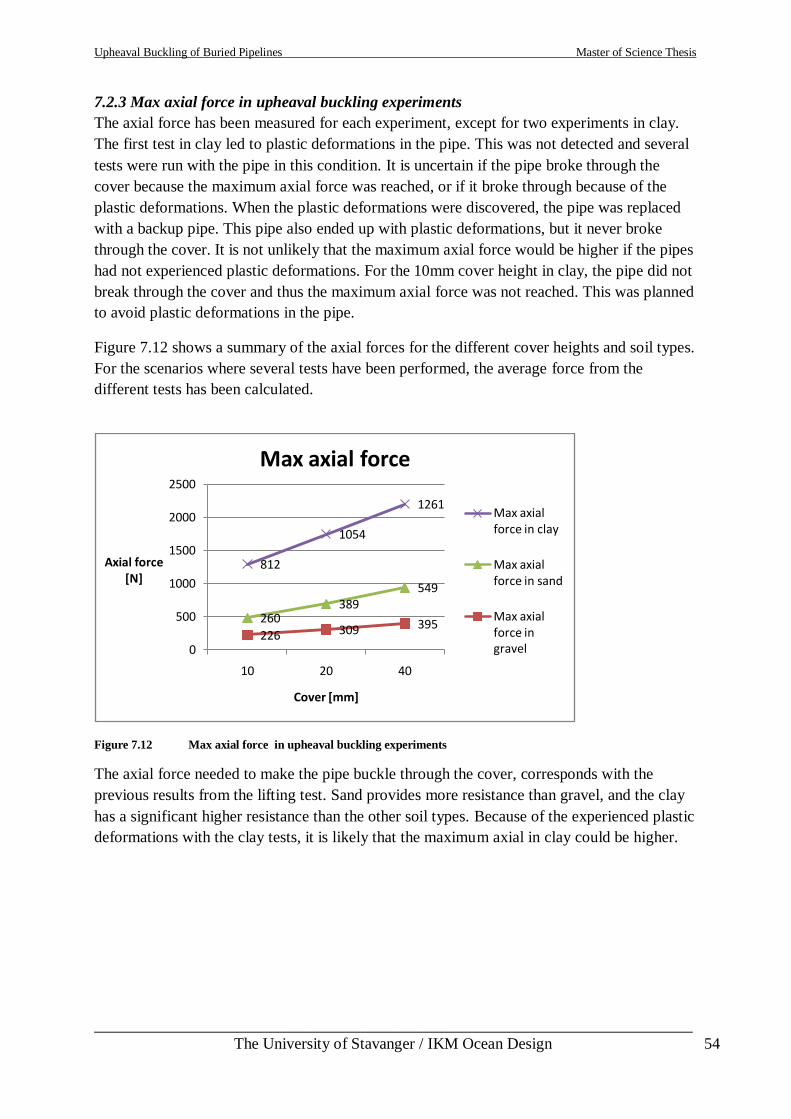
Upheaval Buckling of Buried Pipelines Master of Science Thesis
___________________________________________________________________________
The University of Stavanger / IKM Ocean Design 54
7.2.3 Max axial force in upheaval buckling experiments
The axial force has been measured for each experiment, except for two experiments in clay.
The first test in clay led to plastic deformations in the pipe. This was not detected and several
tests were run with the pipe in this condition. It is uncertain if the pipe broke through the
cover because the maximum axial force was reached, or if it broke through because of the
plastic deformations. When the plastic deformations were discovered, the pipe was replaced
with a backup pipe. This pipe also ended up with plastic deformations, but it never broke
through the cover. It is not unlikely that the maximum axial force would be higher if the pipes
had not experienced plastic deformations. For the 10mm cover height in clay, the pipe did not
break through the cover and thus the maximum axial force was not reached. This was planned
to avoid plastic deformations in the pipe.
Figure 7.12 shows a summary of the axial forces for the different cover heights and soil types.
For the scenarios where several tests have been performed, the average force from the
different tests has been calculated.
Figure 7.12 Max axial force in upheaval buckling experiments
The axial force needed to make the pipe buckle through the cover, corresponds with the
previous results from the lifting test. Sand provides more resistance than gravel, and the clay
has a significant higher resistance than the other soil types. Because of the experienced plastic
deformations with the clay tests, it is likely that the maximum axial in clay could be higher.
226 309 395260389
549
812
1054
1261
0
500
1000
1500
2000
2500
10 20 40
Axial force[N]
Cover [mm]
Max axial force
Max axial force in clay
Max axial force in sand
Max axial force in gravel
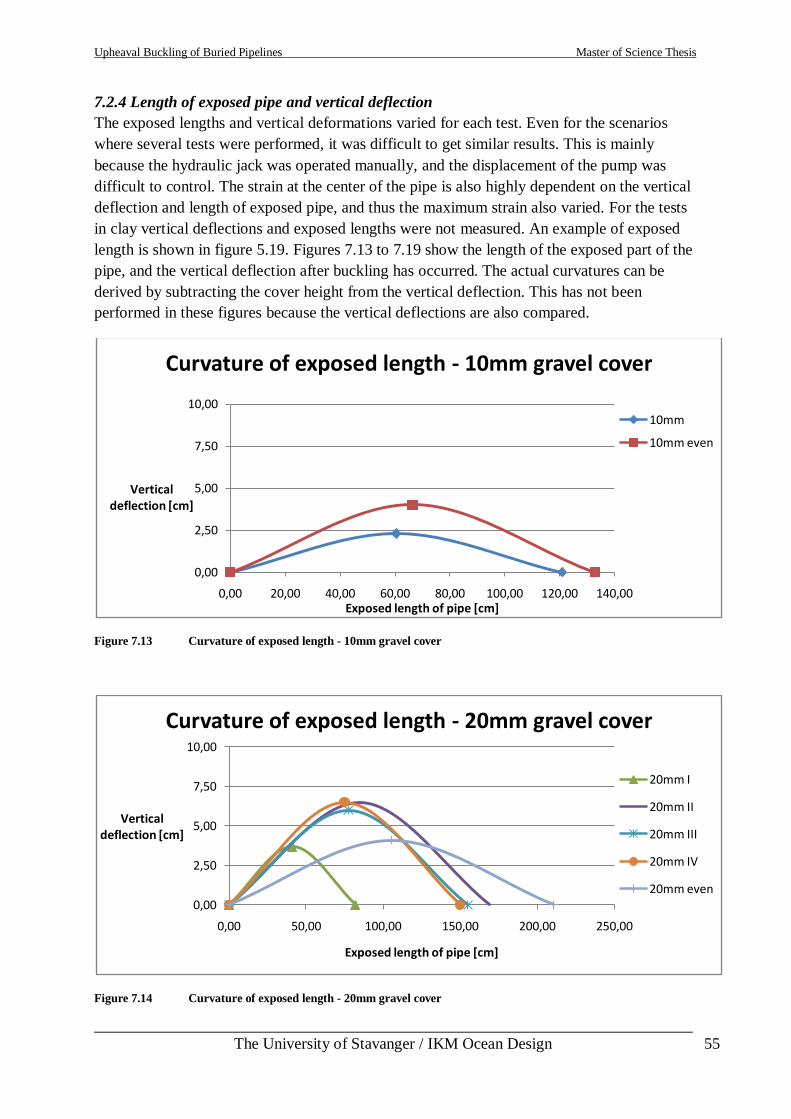
Upheaval Buckling of Buried Pipelines Master of Science Thesis
___________________________________________________________________________
The University of Stavanger / IKM Ocean Design 55
7.2.4 Length of exposed pipe and vertical deflection
The exposed lengths and vertical deformations varied for each test. Even for the scenarios
where several tests were performed, it was difficult to get similar results. This is mainly
because the hydraulic jack was operated manually, and the displacement of the pump was
difficult to control. The strain at the center of the pipe is also highly dependent on the vertical
deflection and length of exposed pipe, and thus the maximum strain also varied. For the tests
in clay vertical deflections and exposed lengths were not measured. An example of exposed
length is shown in figure 5.19. Figures 7.13 to 7.19 show the length of the exposed part of the
pipe, and the vertical deflection after buckling has occurred. The actual curvatures can be
derived by subtracting the cover height from the vertical deflection. This has not been
performed in these figures because the vertical deflections are also compared.
Figure 7.13 Curvature of exposed length - 10mm gravel cover
Figure 7.14 Curvature of exposed length - 20mm gravel cover
0,00
2,50
5,00
7,50
10,00
0,00 20,00 40,00 60,00 80,00 100,00 120,00 140,00
Verticaldeflection [cm]
Exposed length of pipe [cm]
Curvature of exposed length - 10mm gravel cover
10mm
10mm even
0,00
2,50
5,00
7,50
10,00
0,00 50,00 100,00 150,00 200,00 250,00
Vertical deflection [cm]
Exposed length of pipe [cm]
Curvature of exposed length - 20mm gravel cover
20mm I
20mm II
20mm III
20mm IV
20mm even
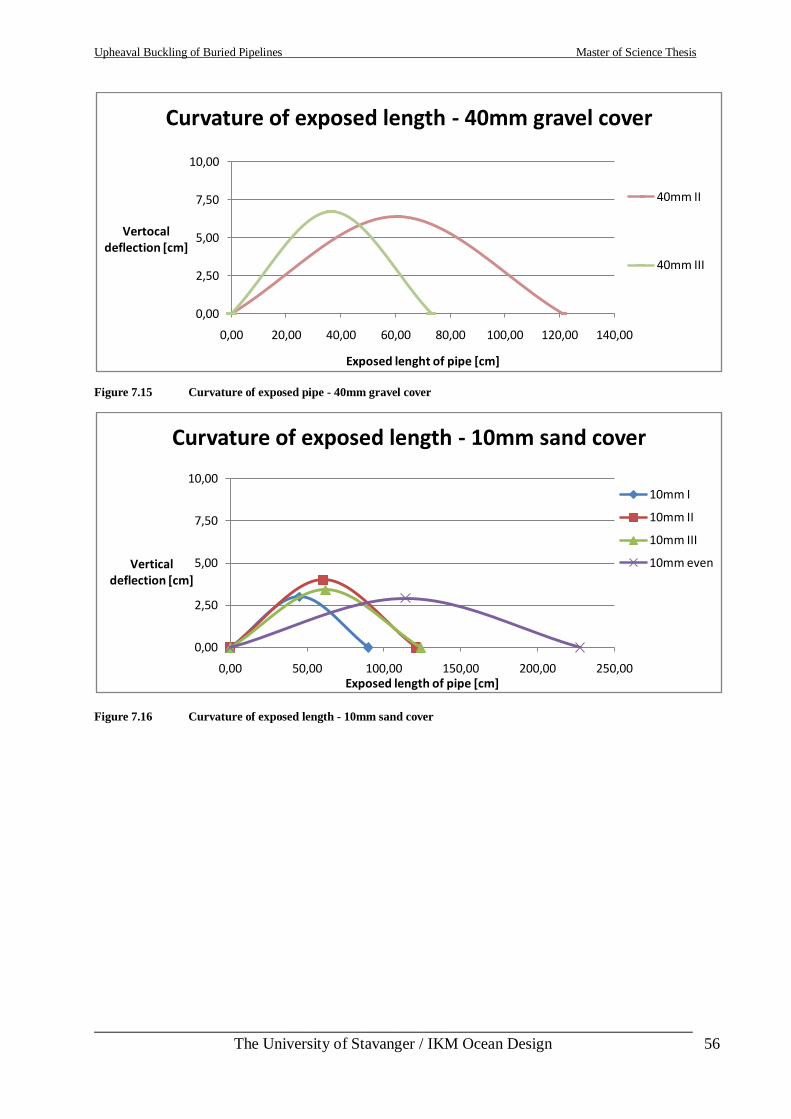
Upheaval Buckling of Buried Pipelines Master of Science Thesis
___________________________________________________________________________
The University of Stavanger / IKM Ocean Design 56
Figure 7.15 Curvature of exposed pipe - 40mm gravel cover
Figure 7.16 Curvature of exposed length - 10mm sand cover
0,00
2,50
5,00
7,50
10,00
0,00 20,00 40,00 60,00 80,00 100,00 120,00 140,00
Vertocaldeflection [cm]
Exposed lenght of pipe [cm]
Curvature of exposed length - 40mm gravel cover
40mm II
40mm III
0,00
2,50
5,00
7,50
10,00
0,00 50,00 100,00 150,00 200,00 250,00
Verticaldeflection [cm]
Exposed length of pipe [cm]
Curvature of exposed length - 10mm sand cover
10mm I
10mm II
10mm III
10mm even
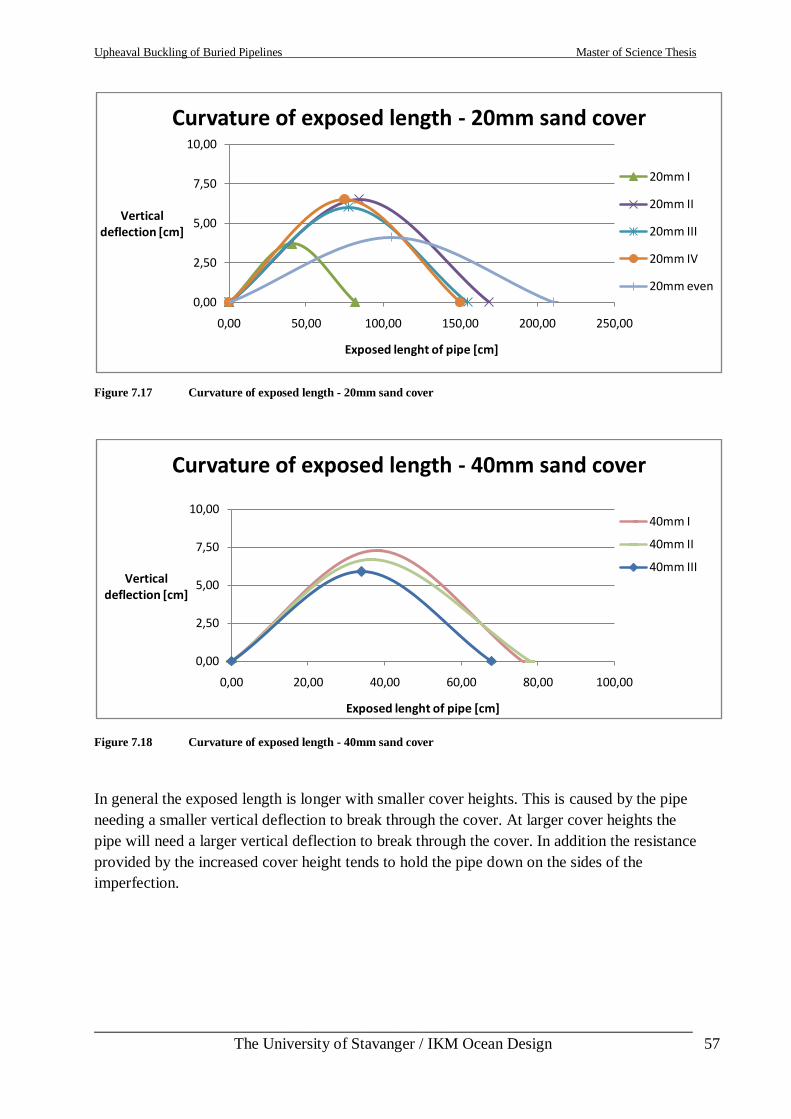
Upheaval Buckling of Buried Pipelines Master of Science Thesis
___________________________________________________________________________
The University of Stavanger / IKM Ocean Design 57
Figure 7.17 Curvature of exposed length - 20mm sand cover
Figure 7.18 Curvature of exposed length - 40mm sand cover
In general the exposed length is longer with smaller cover heights. This is caused by the pipe
needing a smaller vertical deflection to break through the cover. At larger cover heights the
pipe will need a larger vertical deflection to break through the cover. In addition the resistance
provided by the increased cover height tends to hold the pipe down on the sides of the
imperfection.
0,00
2,50
5,00
7,50
10,00
0,00 50,00 100,00 150,00 200,00 250,00
Vertical deflection [cm]
Exposed lenght of pipe [cm]
Curvature of exposed length - 20mm sand cover
20mm I
20mm II
20mm III
20mm IV
20mm even
0,00
2,50
5,00
7,50
10,00
0,00 20,00 40,00 60,00 80,00 100,00
Verticaldeflection [cm]
Exposed lenght of pipe [cm]
Curvature of exposed length - 40mm sand cover
40mm I
40mm II
40mm III
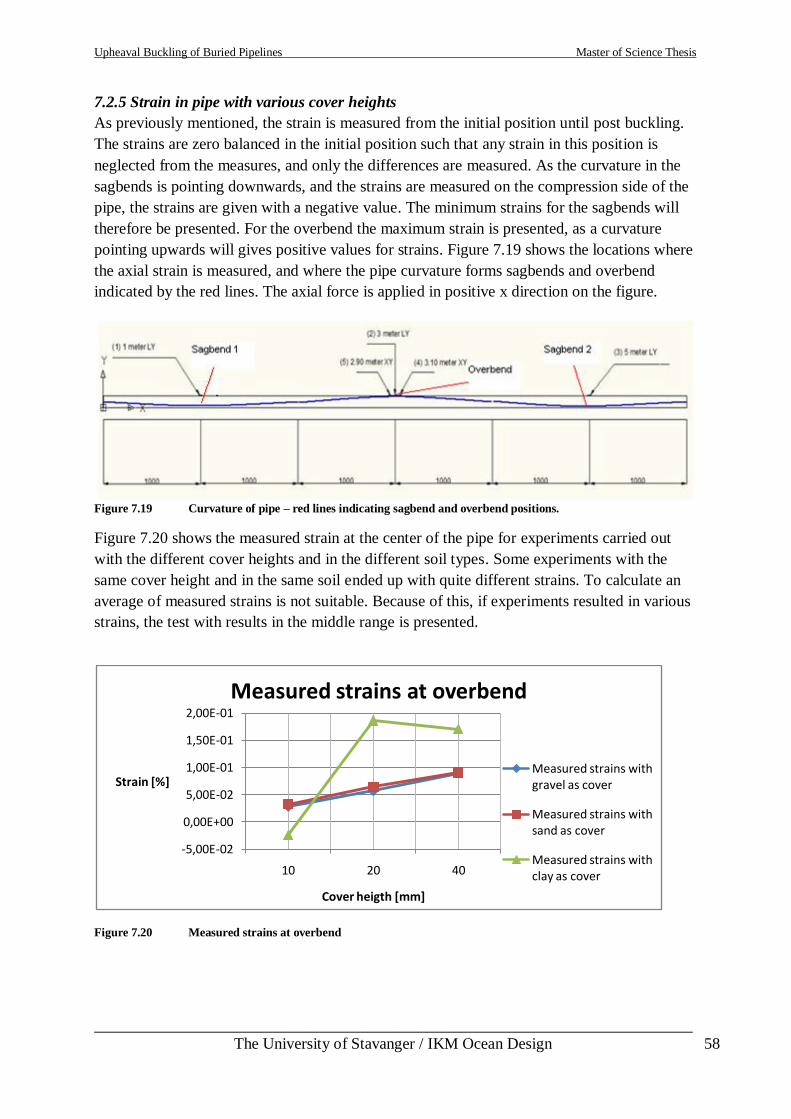
Upheaval Buckling of Buried Pipelines Master of Science Thesis
___________________________________________________________________________
The University of Stavanger / IKM Ocean Design 58
7.2.5 Strain in pipe with various cover heights
As previously mentioned, the strain is measured from the initial position until post buckling.
The strains are zero balanced in the initial position such that any strain in this position is
neglected from the measures, and only the differences are measured. As the curvature in the
sagbends is pointing downwards, and the strains are measured on the compression side of the
pipe, the strains are given with a negative value. The minimum strains for the sagbends will
therefore be presented. For the overbend the maximum strain is presented, as a curvature
pointing upwards will gives positive values for strains. Figure 7.19 shows the locations where
the axial strain is measured, and where the pipe curvature forms sagbends and overbend
indicated by the red lines. The axial force is applied in positive x direction on the figure.
Figure 7.19 Curvature of pipe – red lines indicating sagbend and overbend positions.
Figure 7.20 shows the measured strain at the center of the pipe for experiments carried out
with the different cover heights and in the different soil types. Some experiments with the
same cover height and in the same soil ended up with quite different strains. To calculate an
average of measured strains is not suitable. Because of this, if experiments resulted in various
strains, the test with results in the middle range is presented.
Figure 7.20 Measured strains at overbend
-5,00E-02
0,00E+00
5,00E-02
1,00E-01
1,50E-01
2,00E-01
10 20 40
Strain [%]
Cover heigth [mm]
Measured strains at overbend
Measured strains with gravel as cover
Measured strains with sand as cover
Measured strains with clay as cover
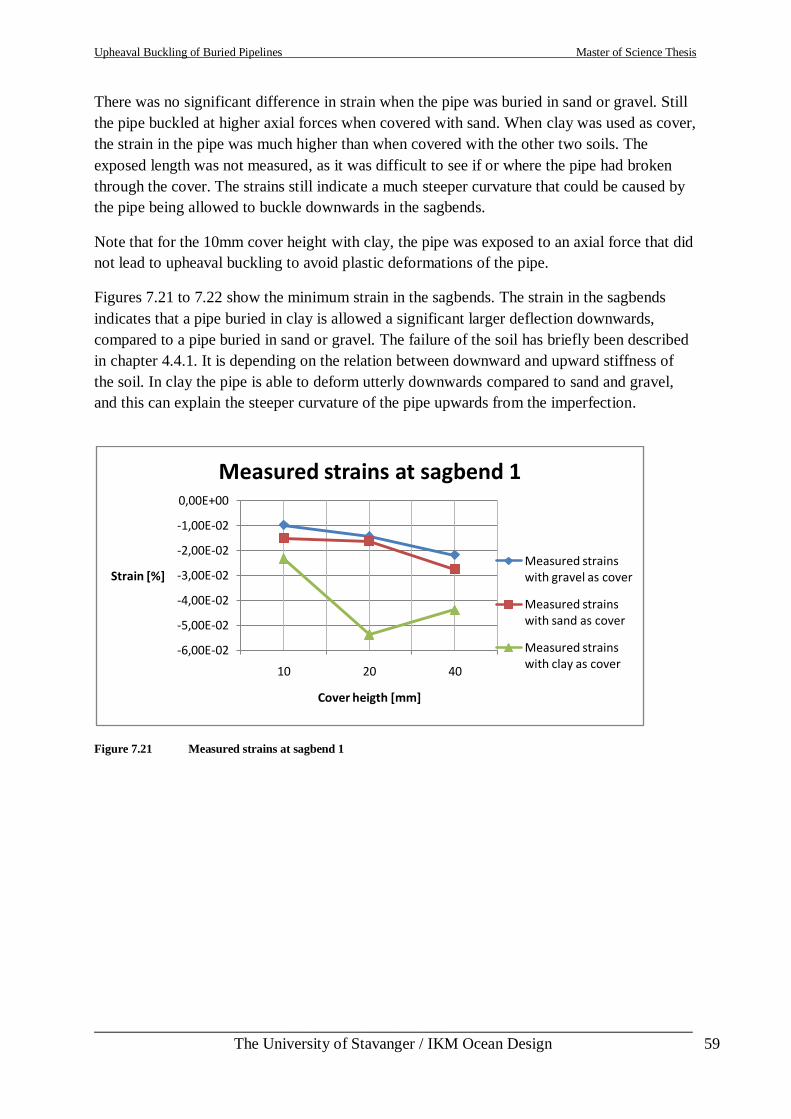
Upheaval Buckling of Buried Pipelines Master of Science Thesis
___________________________________________________________________________
The University of Stavanger / IKM Ocean Design 59
There was no significant difference in strain when the pipe was buried in sand or gravel. Still
the pipe buckled at higher axial forces when covered with sand. When clay was used as cover,
the strain in the pipe was much higher than when covered with the other two soils. The
exposed length was not measured, as it was difficult to see if or where the pipe had broken
through the cover. The strains still indicate a much steeper curvature that could be caused by
the pipe being allowed to buckle downwards in the sagbends.
Note that for the 10mm cover height with clay, the pipe was exposed to an axial force that did
not lead to upheaval buckling to avoid plastic deformations of the pipe.
Figures 7.21 to 7.22 show the minimum strain in the sagbends. The strain in the sagbends
indicates that a pipe buried in clay is allowed a significant larger deflection downwards,
compared to a pipe buried in sand or gravel. The failure of the soil has briefly been described
in chapter 4.4.1. It is depending on the relation between downward and upward stiffness of
the soil. In clay the pipe is able to deform utterly downwards compared to sand and gravel,
and this can explain the steeper curvature of the pipe upwards from the imperfection.
Figure 7.21 Measured strains at sagbend 1
-6,00E-02
-5,00E-02
-4,00E-02
-3,00E-02
-2,00E-02
-1,00E-02
0,00E+00
10 20 40
Strain [%]
Cover heigth [mm]
Measured strains at sagbend 1
Measured strains with gravel as cover
Measured strains with sand as cover
Measured strains with clay as cover
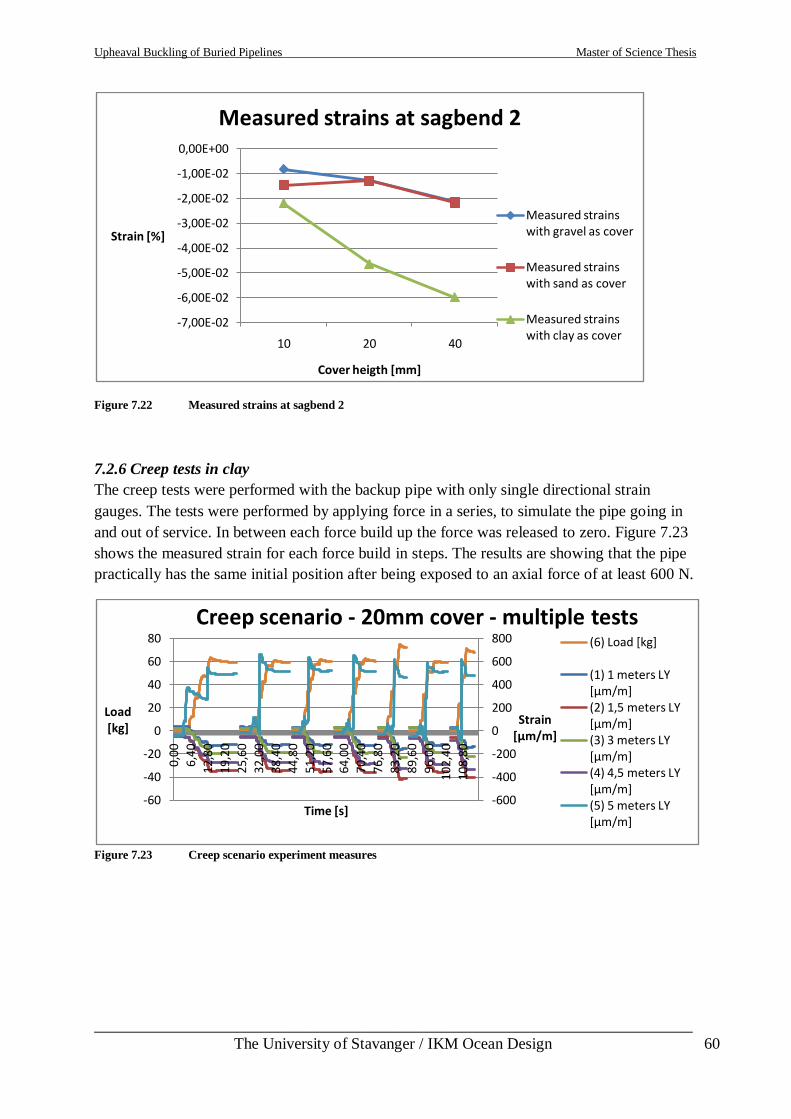
Upheaval Buckling of Buried Pipelines Master of Science Thesis
___________________________________________________________________________
The University of Stavanger / IKM Ocean Design 60
Figure 7.22 Measured strains at sagbend 2
7.2.6 Creep tests in clay
The creep tests were performed with the backup pipe with only single directional strain
gauges. The tests were performed by applying force in a series, to simulate the pipe going in
and out of service. In between each force build up the force was released to zero. Figure 7.23
shows the measured strain for each force build in steps. The results are showing that the pipe
practically has the same initial position after being exposed to an axial force of at least 600 N.
Figure 7.23 Creep scenario experiment measures
-7,00E-02
-6,00E-02
-5,00E-02
-4,00E-02
-3,00E-02
-2,00E-02
-1,00E-02
0,00E+00
10 20 40
Strain [%]
Cover heigth [mm]
Measured strains at sagbend 2
Measured strains with gravel as cover
Measured strains with sand as cover
Measured strains with clay as cover
-600
-400
-200
0
200
400
600
800
-60
-40
-20
0
20
40
60
80
0,0
0
6,4
0
12,
80
19,
20
25,
60
32,
00
38,
40
44,
80
51,
20
57,
60
64,
00
70,4
0
76,
80
83,
20
89,
60
96,
00
10
2,4
0
108,
80
Strain [µm/m]
Load [kg]
Time [s]
Creep scenario - 20mm cover - multiple tests (6) Load [kg]
(1) 1 meters LY [µm/m] (2) 1,5 meters LY [µm/m] (3) 3 meters LY [µm/m] (4) 4,5 meters LY [µm/m] (5) 5 meters LY [µm/m]
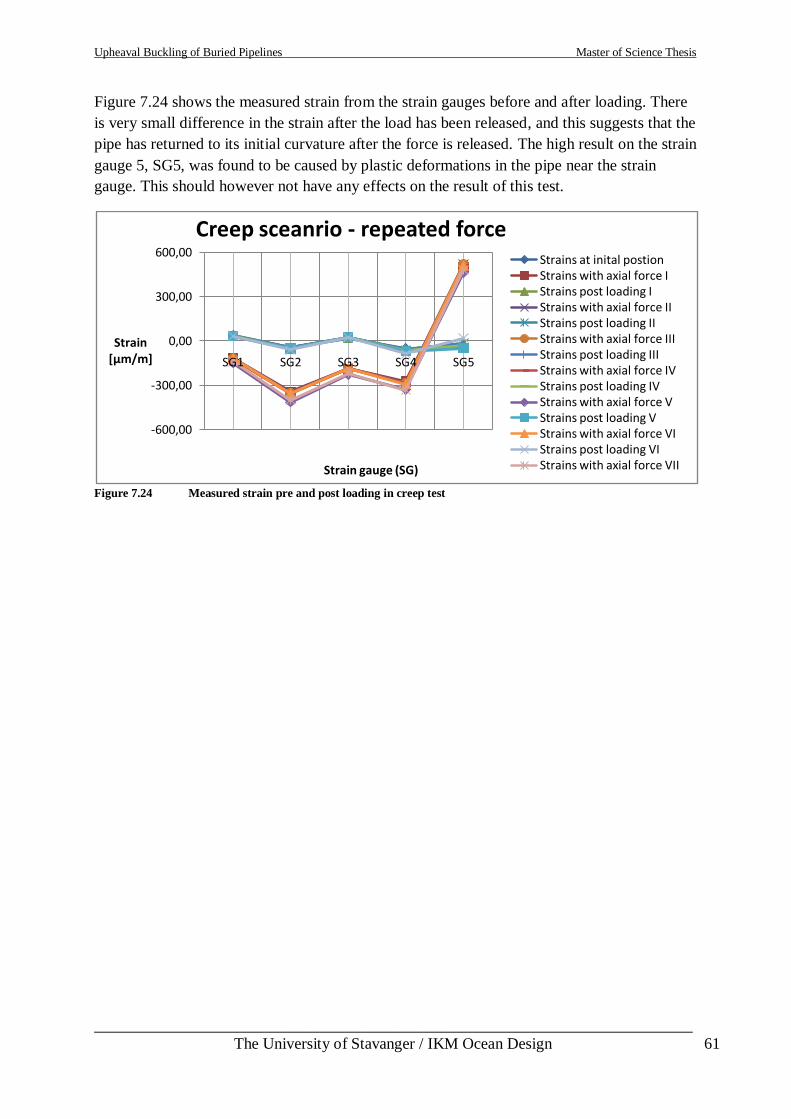
Upheaval Buckling of Buried Pipelines Master of Science Thesis
___________________________________________________________________________
The University of Stavanger / IKM Ocean Design 61
Figure 7.24 shows the measured strain from the strain gauges before and after loading. There
is very small difference in the strain after the load has been released, and this suggests that the
pipe has returned to its initial curvature after the force is released. The high result on the strain
gauge 5, SG5, was found to be caused by plastic deformations in the pipe near the strain
gauge. This should however not have any effects on the result of this test.
Figure 7.24 Measured strain pre and post loading in creep test
-600,00
-300,00
0,00
300,00
600,00
SG1 SG2 SG3 SG4 SG5
Strain [µm/m]
Strain gauge (SG)
Creep sceanrio - repeated forceStrains at inital postionStrains with axial force IStrains post loading IStrains with axial force IIStrains post loading IIStrains with axial force IIIStrains post loading IIIStrains with axial force IVStrains post loading IVStrains with axial force VStrains post loading VStrains with axial force VIStrains post loading VIStrains with axial force VII
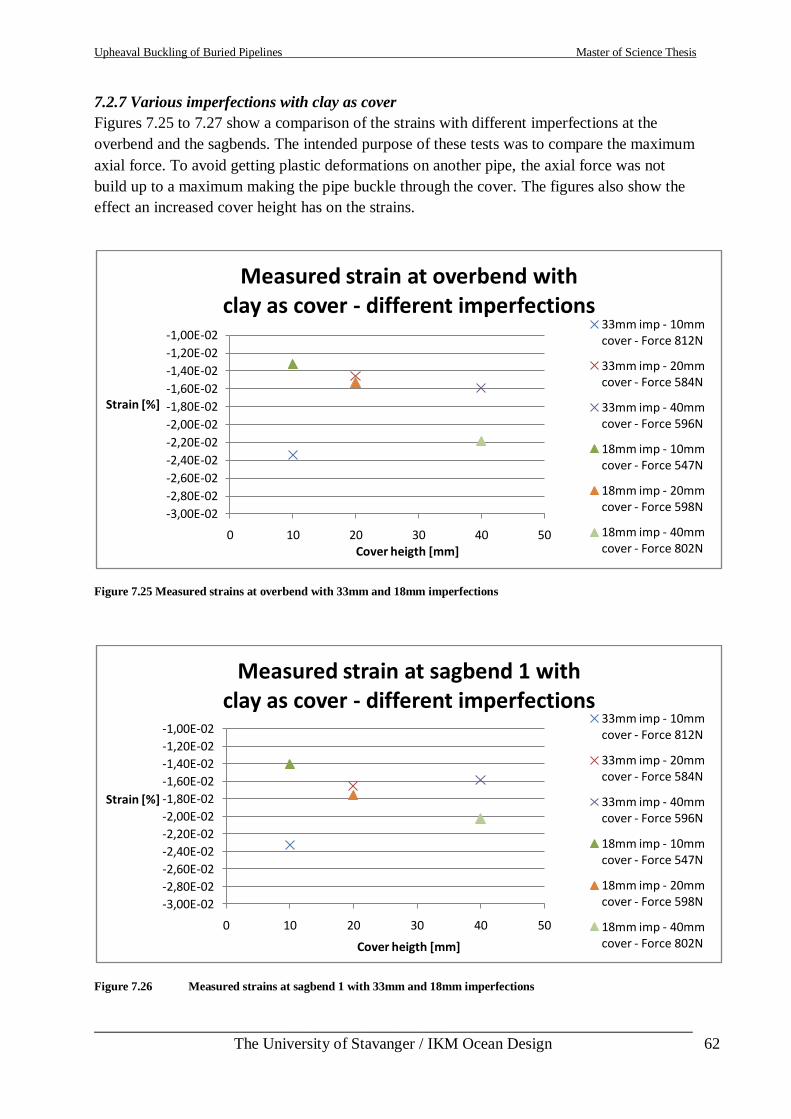
Upheaval Buckling of Buried Pipelines Master of Science Thesis
___________________________________________________________________________
The University of Stavanger / IKM Ocean Design 62
7.2.7 Various imperfections with clay as cover
Figures 7.25 to 7.27 show a comparison of the strains with different imperfections at the
overbend and the sagbends. The intended purpose of these tests was to compare the maximum
axial force. To avoid getting plastic deformations on another pipe, the axial force was not
build up to a maximum making the pipe buckle through the cover. The figures also show the
effect an increased cover height has on the strains.
Figure 7.25 Measured strains at overbend with 33mm and 18mm imperfections
Figure 7.26 Measured strains at sagbend 1 with 33mm and 18mm imperfections
-3,00E-02
-2,80E-02
-2,60E-02
-2,40E-02
-2,20E-02
-2,00E-02
-1,80E-02
-1,60E-02
-1,40E-02
-1,20E-02
-1,00E-02
0 10 20 30 40 50
Strain [%]
Cover heigth [mm]
Measured strain at overbend withclay as cover - different imperfections
33mm imp - 10mm cover - Force 812N
33mm imp - 20mm cover - Force 584N
33mm imp - 40mm cover - Force 596N
18mm imp - 10mm cover - Force 547N
18mm imp - 20mm cover - Force 598N
18mm imp - 40mm cover - Force 802N
-3,00E-02
-2,80E-02
-2,60E-02
-2,40E-02
-2,20E-02
-2,00E-02
-1,80E-02
-1,60E-02
-1,40E-02
-1,20E-02
-1,00E-02
0 10 20 30 40 50
Strain [%]
Cover heigth [mm]
Measured strain at sagbend 1 withclay as cover - different imperfections
33mm imp - 10mm cover - Force 812N
33mm imp - 20mm cover - Force 584N
33mm imp - 40mm cover - Force 596N
18mm imp - 10mm cover - Force 547N
18mm imp - 20mm cover - Force 598N
18mm imp - 40mm cover - Force 802N
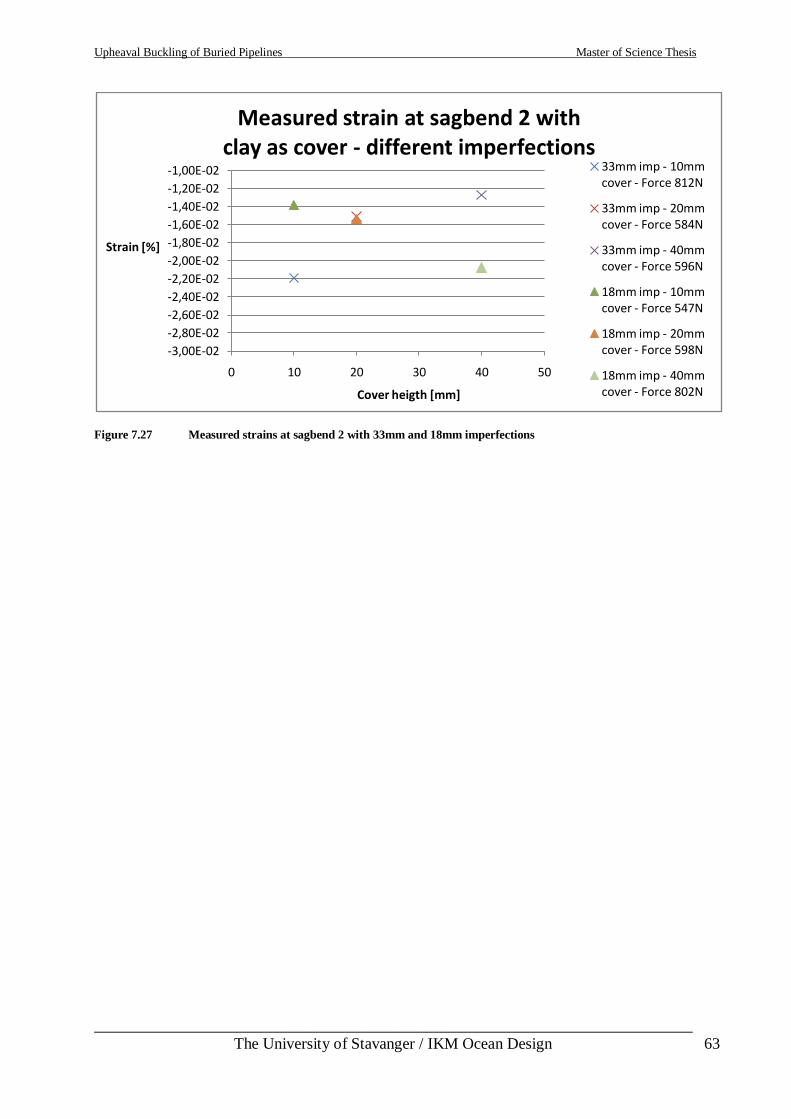
Upheaval Buckling of Buried Pipelines Master of Science Thesis
___________________________________________________________________________
The University of Stavanger / IKM Ocean Design 63
Figure 7.27 Measured strains at sagbend 2 with 33mm and 18mm imperfections
-3,00E-02
-2,80E-02
-2,60E-02
-2,40E-02
-2,20E-02
-2,00E-02
-1,80E-02
-1,60E-02
-1,40E-02
-1,20E-02
-1,00E-02
0 10 20 30 40 50
Strain [%]
Cover heigth [mm]
Measured strain at sagbend 2 withclay as cover - different imperfections
33mm imp - 10mm cover - Force 812N
33mm imp - 20mm cover - Force 584N
33mm imp - 40mm cover - Force 596N
18mm imp - 10mm cover - Force 547N
18mm imp - 20mm cover - Force 598N
18mm imp - 40mm cover - Force 802N
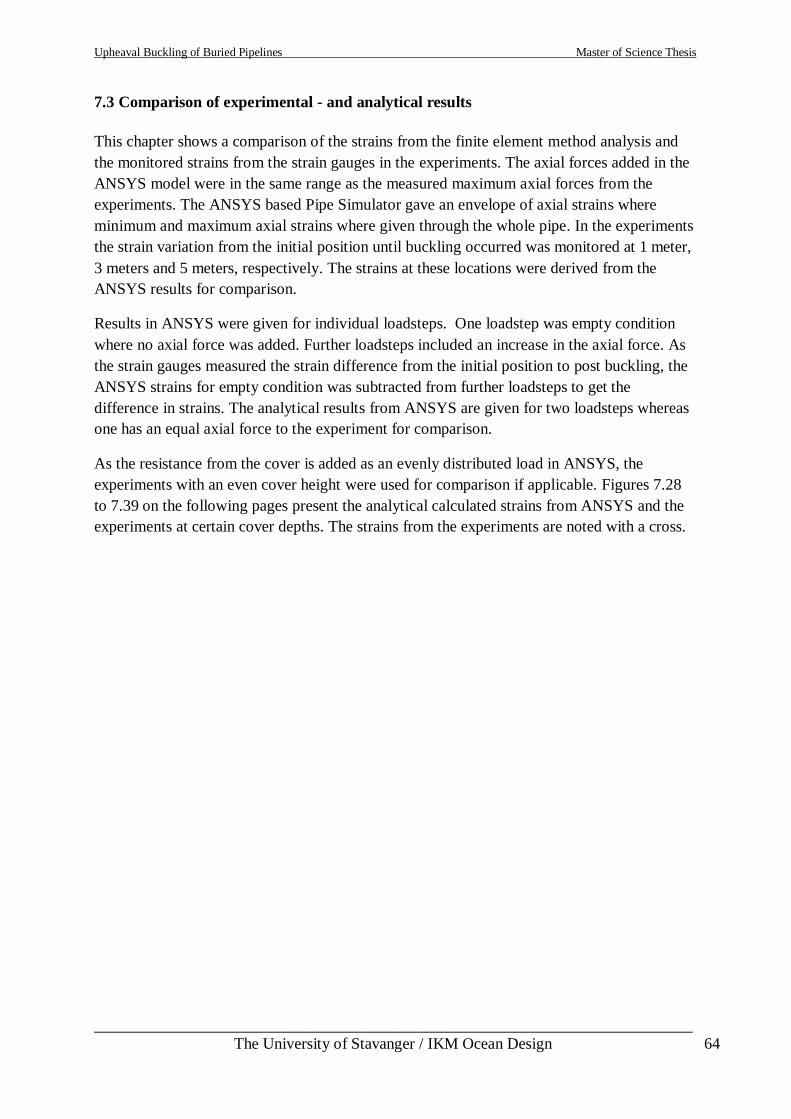
Upheaval Buckling of Buried Pipelines Master of Science Thesis
___________________________________________________________________________
The University of Stavanger / IKM Ocean Design 64
7.3 Comparison of experimental - and analytical results
This chapter shows a comparison of the strains from the finite element method analysis and
the monitored strains from the strain gauges in the experiments. The axial forces added in the
ANSYS model were in the same range as the measured maximum axial forces from the
experiments. The ANSYS based Pipe Simulator gave an envelope of axial strains where
minimum and maximum axial strains where given through the whole pipe. In the experiments
the strain variation from the initial position until buckling occurred was monitored at 1 meter,
3 meters and 5 meters, respectively. The strains at these locations were derived from the
ANSYS results for comparison.
Results in ANSYS were given for individual loadsteps. One loadstep was empty condition
where no axial force was added. Further loadsteps included an increase in the axial force. As
the strain gauges measured the strain difference from the initial position to post buckling, the
ANSYS strains for empty condition was subtracted from further loadsteps to get the
difference in strains. The analytical results from ANSYS are given for two loadsteps whereas
one has an equal axial force to the experiment for comparison.
As the resistance from the cover is added as an evenly distributed load in ANSYS, the
experiments with an even cover height were used for comparison if applicable. Figures 7.28
to 7.39 on the following pages present the analytical calculated strains from ANSYS and the
experiments at certain cover depths. The strains from the experiments are noted with a cross.
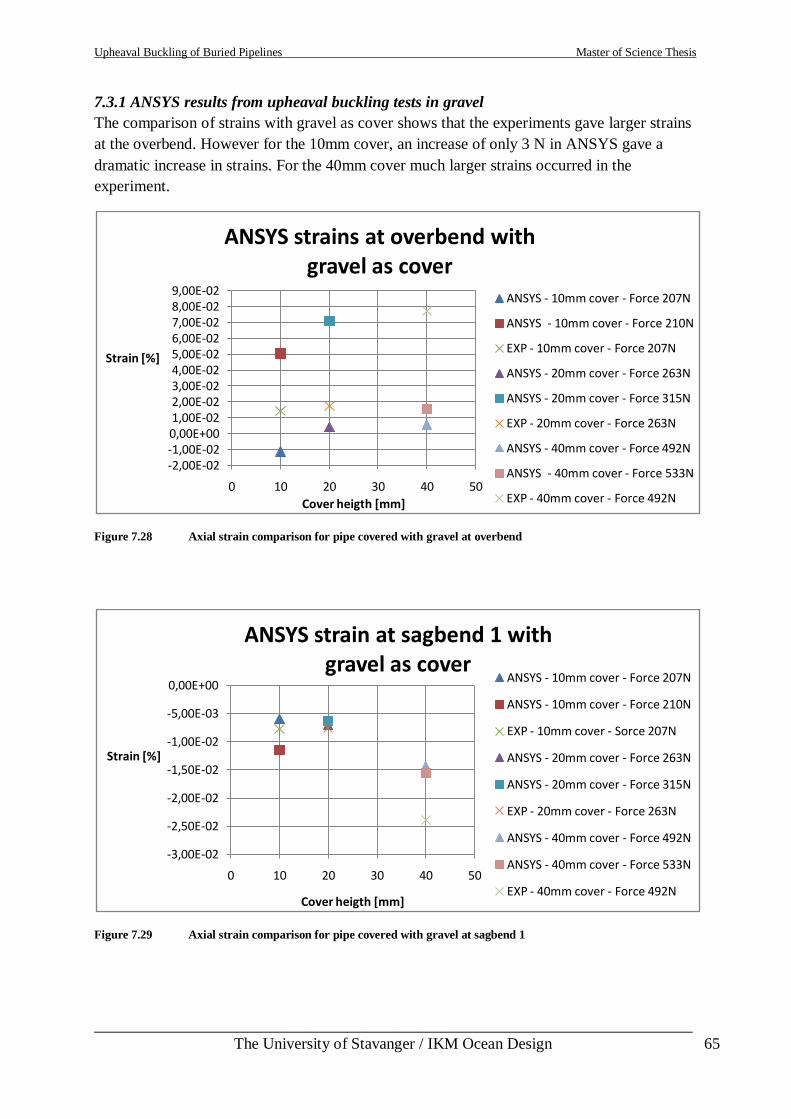
Upheaval Buckling of Buried Pipelines Master of Science Thesis
___________________________________________________________________________
The University of Stavanger / IKM Ocean Design 65
7.3.1 ANSYS results from upheaval buckling tests in gravel
The comparison of strains with gravel as cover shows that the experiments gave larger strains
at the overbend. However for the 10mm cover, an increase of only 3 N in ANSYS gave a
dramatic increase in strains. For the 40mm cover much larger strains occurred in the
experiment.
Figure 7.28 Axial strain comparison for pipe covered with gravel at overbend
Figure 7.29 Axial strain comparison for pipe covered with gravel at sagbend 1
-2,00E-02-1,00E-020,00E+001,00E-022,00E-023,00E-024,00E-025,00E-026,00E-027,00E-028,00E-029,00E-02
0 10 20 30 40 50
Strain [%]
Cover heigth [mm]
ANSYS strains at overbend withgravel as cover
ANSYS - 10mm cover - Force 207N
ANSYS - 10mm cover - Force 210N
EXP - 10mm cover - Force 207N
ANSYS - 20mm cover - Force 263N
ANSYS - 20mm cover - Force 315N
EXP - 20mm cover - Force 263N
ANSYS - 40mm cover - Force 492N
ANSYS - 40mm cover - Force 533N
EXP - 40mm cover - Force 492N
-3,00E-02
-2,50E-02
-2,00E-02
-1,50E-02
-1,00E-02
-5,00E-03
0,00E+00
0 10 20 30 40 50
Strain [%]
Cover heigth [mm]
ANSYS strain at sagbend 1 withgravel as cover
ANSYS - 10mm cover - Force 207N
ANSYS - 10mm cover - Force 210N
EXP - 10mm cover - Sorce 207N
ANSYS - 20mm cover - Force 263N
ANSYS - 20mm cover - Force 315N
EXP - 20mm cover - Force 263N
ANSYS - 40mm cover - Force 492N
ANSYS - 40mm cover - Force 533N
EXP - 40mm cover - Force 492N
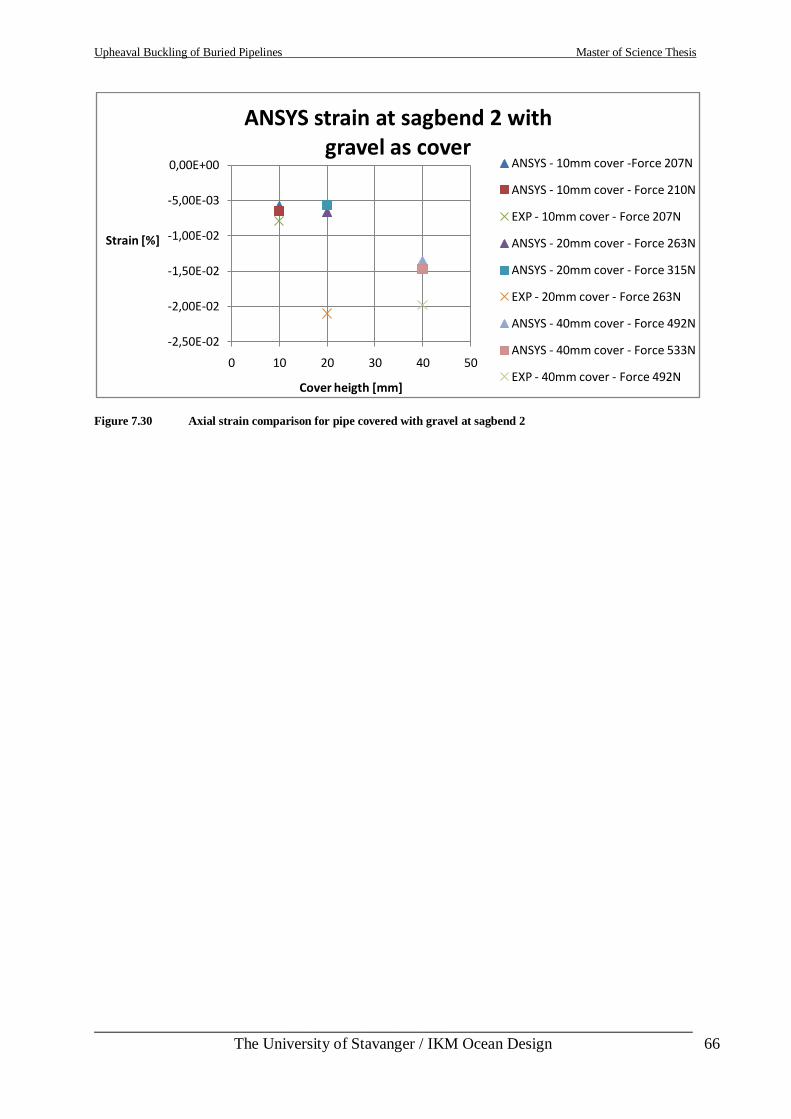
Upheaval Buckling of Buried Pipelines Master of Science Thesis
___________________________________________________________________________
The University of Stavanger / IKM Ocean Design 66
Figure 7.30 Axial strain comparison for pipe covered with gravel at sagbend 2
-2,50E-02
-2,00E-02
-1,50E-02
-1,00E-02
-5,00E-03
0,00E+00
0 10 20 30 40 50
Strain [%]
Cover heigth [mm]
ANSYS strain at sagbend 2 withgravel as cover
ANSYS - 10mm cover -Force 207N
ANSYS - 10mm cover - Force 210N
EXP - 10mm cover - Force 207N
ANSYS - 20mm cover - Force 263N
ANSYS - 20mm cover - Force 315N
EXP - 20mm cover - Force 263N
ANSYS - 40mm cover - Force 492N
ANSYS - 40mm cover - Force 533N
EXP - 40mm cover - Force 492N
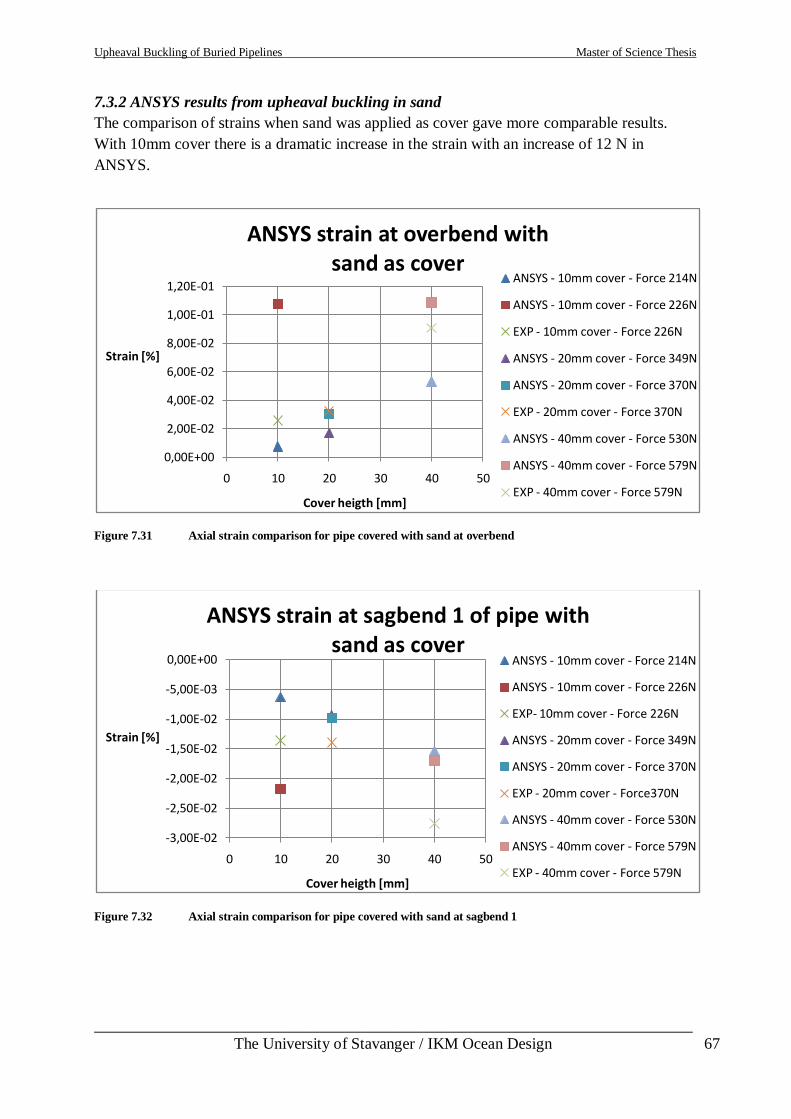
Upheaval Buckling of Buried Pipelines Master of Science Thesis
___________________________________________________________________________
The University of Stavanger / IKM Ocean Design 67
7.3.2 ANSYS results from upheaval buckling in sand
The comparison of strains when sand was applied as cover gave more comparable results.
With 10mm cover there is a dramatic increase in the strain with an increase of 12 N in
ANSYS.
Figure 7.31 Axial strain comparison for pipe covered with sand at overbend
Figure 7.32 Axial strain comparison for pipe covered with sand at sagbend 1
0,00E+00
2,00E-02
4,00E-02
6,00E-02
8,00E-02
1,00E-01
1,20E-01
0 10 20 30 40 50
Strain [%]
Cover heigth [mm]
ANSYS strain at overbend withsand as cover
ANSYS - 10mm cover - Force 214N
ANSYS - 10mm cover - Force 226N
EXP - 10mm cover - Force 226N
ANSYS - 20mm cover - Force 349N
ANSYS - 20mm cover - Force 370N
EXP - 20mm cover - Force 370N
ANSYS - 40mm cover - Force 530N
ANSYS - 40mm cover - Force 579N
EXP - 40mm cover - Force 579N
-3,00E-02
-2,50E-02
-2,00E-02
-1,50E-02
-1,00E-02
-5,00E-03
0,00E+00
0 10 20 30 40 50
Strain [%]
Cover heigth [mm]
ANSYS strain at sagbend 1 of pipe withsand as cover
ANSYS - 10mm cover - Force 214N
ANSYS - 10mm cover - Force 226N
EXP- 10mm cover - Force 226N
ANSYS - 20mm cover - Force 349N
ANSYS - 20mm cover - Force 370N
EXP - 20mm cover - Force370N
ANSYS - 40mm cover - Force 530N
ANSYS - 40mm cover - Force 579N
EXP - 40mm cover - Force 579N
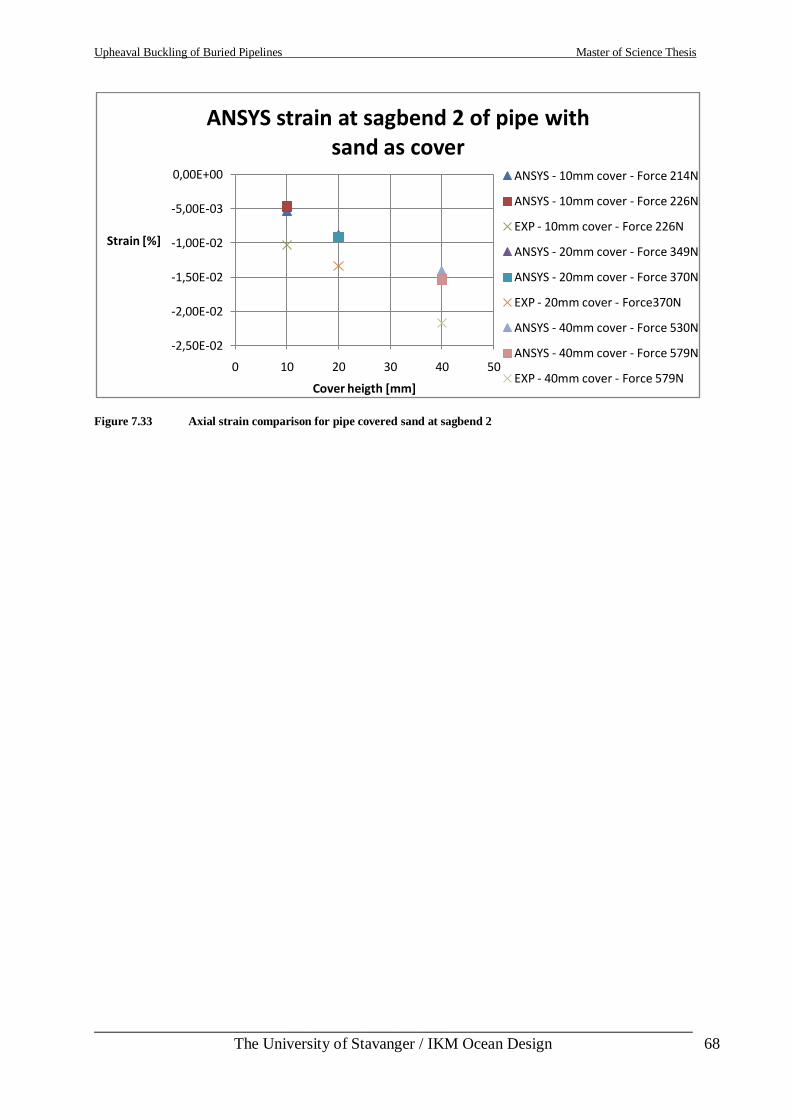
Upheaval Buckling of Buried Pipelines Master of Science Thesis
___________________________________________________________________________
The University of Stavanger / IKM Ocean Design 68
Figure 7.33 Axial strain comparison for pipe covered sand at sagbend 2
-2,50E-02
-2,00E-02
-1,50E-02
-1,00E-02
-5,00E-03
0,00E+00
0 10 20 30 40 50
Strain [%]
Cover heigth [mm]
ANSYS strain at sagbend 2 of pipe withsand as cover
ANSYS - 10mm cover - Force 214N
ANSYS - 10mm cover - Force 226N
EXP - 10mm cover - Force 226N
ANSYS - 20mm cover - Force 349N
ANSYS - 20mm cover - Force 370N
EXP - 20mm cover - Force370N
ANSYS - 40mm cover - Force 530N
ANSYS - 40mm cover - Force 579N
EXP - 40mm cover - Force 579N
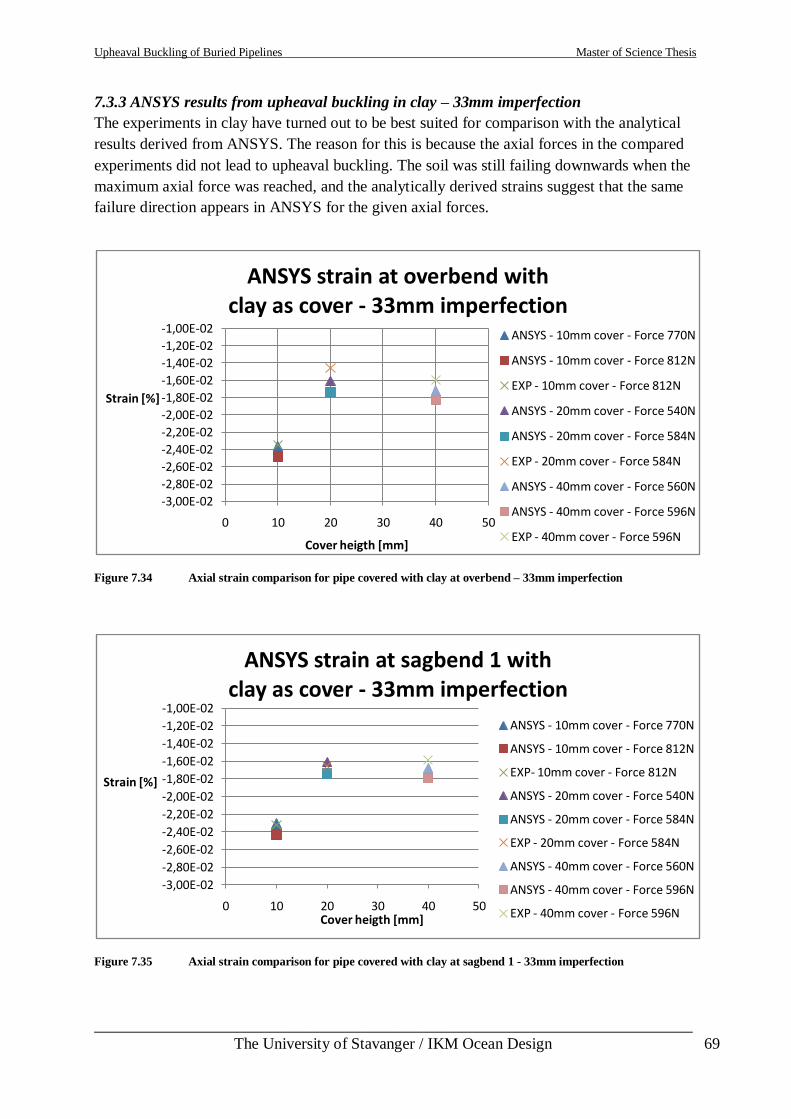
Upheaval Buckling of Buried Pipelines Master of Science Thesis
___________________________________________________________________________
The University of Stavanger / IKM Ocean Design 69
7.3.3 ANSYS results from upheaval buckling in clay – 33mm imperfection
The experiments in clay have turned out to be best suited for comparison with the analytical
results derived from ANSYS. The reason for this is because the axial forces in the compared
experiments did not lead to upheaval buckling. The soil was still failing downwards when the
maximum axial force was reached, and the analytically derived strains suggest that the same
failure direction appears in ANSYS for the given axial forces.
Figure 7.34 Axial strain comparison for pipe covered with clay at overbend – 33mm imperfection
Figure 7.35 Axial strain comparison for pipe covered with clay at sagbend 1 - 33mm imperfection
-3,00E-02
-2,80E-02
-2,60E-02
-2,40E-02
-2,20E-02
-2,00E-02
-1,80E-02
-1,60E-02
-1,40E-02
-1,20E-02
-1,00E-02
0 10 20 30 40 50
Strain [%]
Cover heigth [mm]
ANSYS strain at overbend withclay as cover - 33mm imperfection
ANSYS - 10mm cover - Force 770N
ANSYS - 10mm cover - Force 812N
EXP - 10mm cover - Force 812N
ANSYS - 20mm cover - Force 540N
ANSYS - 20mm cover - Force 584N
EXP - 20mm cover - Force 584N
ANSYS - 40mm cover - Force 560N
ANSYS - 40mm cover - Force 596N
EXP - 40mm cover - Force 596N
-3,00E-02
-2,80E-02
-2,60E-02
-2,40E-02
-2,20E-02
-2,00E-02
-1,80E-02
-1,60E-02
-1,40E-02
-1,20E-02
-1,00E-02
0 10 20 30 40 50
Strain [%]
Cover heigth [mm]
ANSYS strain at sagbend 1 withclay as cover - 33mm imperfection
ANSYS - 10mm cover - Force 770N
ANSYS - 10mm cover - Force 812N
EXP- 10mm cover - Force 812N
ANSYS - 20mm cover - Force 540N
ANSYS - 20mm cover - Force 584N
EXP - 20mm cover - Force 584N
ANSYS - 40mm cover - Force 560N
ANSYS - 40mm cover - Force 596N
EXP - 40mm cover - Force 596N
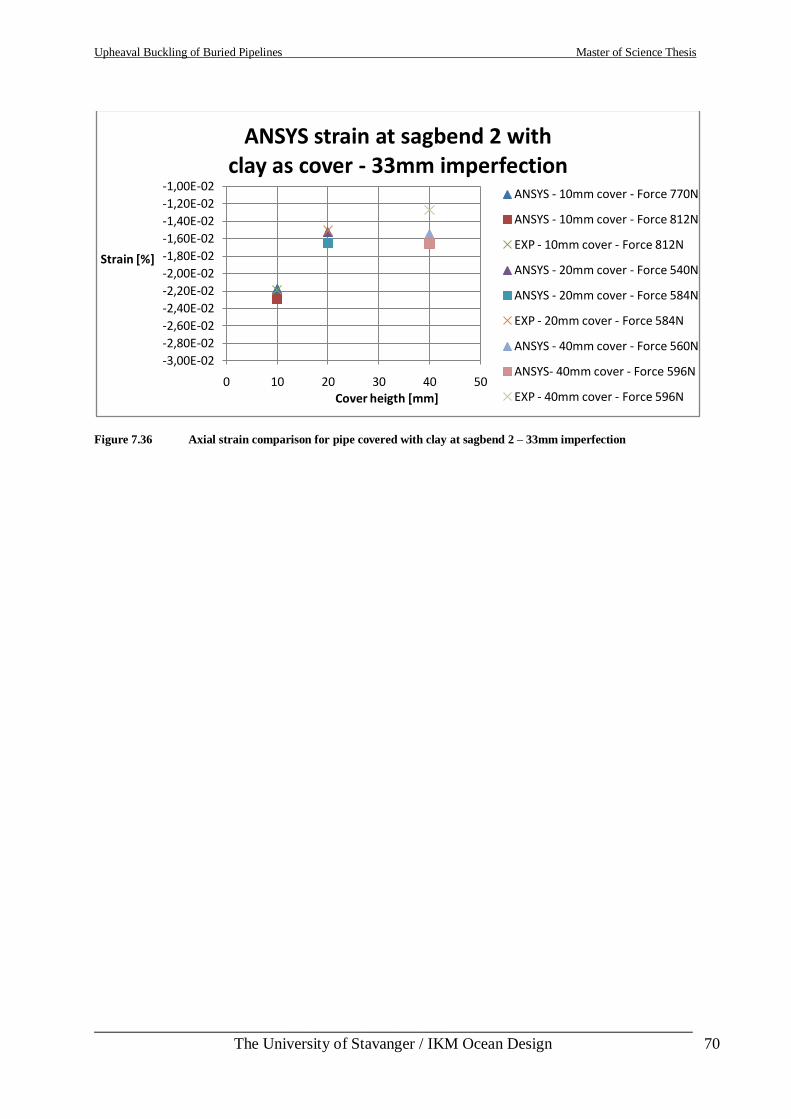
Upheaval Buckling of Buried Pipelines Master of Science Thesis
___________________________________________________________________________
The University of Stavanger / IKM Ocean Design 70
Figure 7.36 Axial strain comparison for pipe covered with clay at sagbend 2 – 33mm imperfection
-3,00E-02
-2,80E-02
-2,60E-02
-2,40E-02
-2,20E-02
-2,00E-02
-1,80E-02
-1,60E-02
-1,40E-02
-1,20E-02
-1,00E-02
0 10 20 30 40 50
Strain [%]
Cover heigth [mm]
ANSYS strain at sagbend 2 withclay as cover - 33mm imperfection
ANSYS - 10mm cover - Force 770N
ANSYS - 10mm cover - Force 812N
EXP - 10mm cover - Force 812N
ANSYS - 20mm cover - Force 540N
ANSYS - 20mm cover - Force 584N
EXP - 20mm cover - Force 584N
ANSYS - 40mm cover - Force 560N
ANSYS- 40mm cover - Force 596N
EXP - 40mm cover - Force 596N
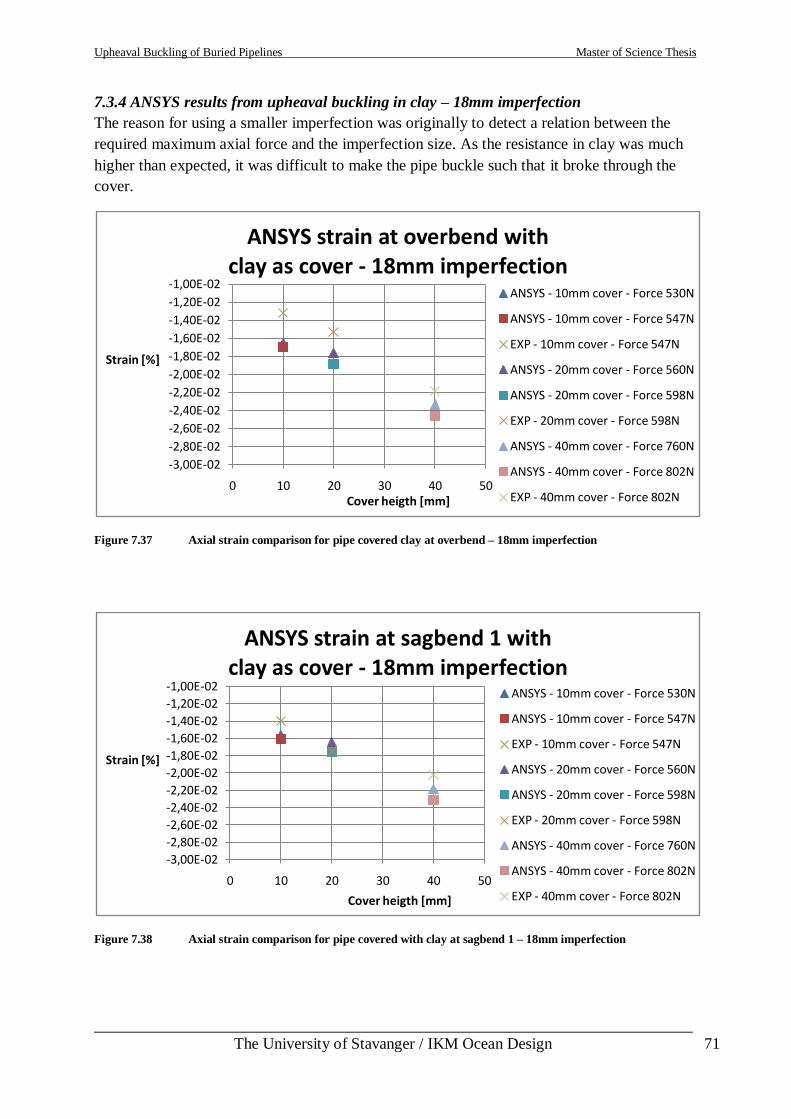
Upheaval Buckling of Buried Pipelines Master of Science Thesis
___________________________________________________________________________
The University of Stavanger / IKM Ocean Design 71
7.3.4 ANSYS results from upheaval buckling in clay – 18mm imperfection
The reason for using a smaller imperfection was originally to detect a relation between the
required maximum axial force and the imperfection size. As the resistance in clay was much
higher than expected, it was difficult to make the pipe buckle such that it broke through the
cover.
Figure 7.37 Axial strain comparison for pipe covered clay at overbend – 18mm imperfection
Figure 7.38 Axial strain comparison for pipe covered with clay at sagbend 1 – 18mm imperfection
-3,00E-02
-2,80E-02
-2,60E-02
-2,40E-02
-2,20E-02
-2,00E-02
-1,80E-02
-1,60E-02
-1,40E-02
-1,20E-02
-1,00E-02
0 10 20 30 40 50
Strain [%]
Cover heigth [mm]
ANSYS strain at overbend withclay as cover - 18mm imperfection
ANSYS - 10mm cover - Force 530N
ANSYS - 10mm cover - Force 547N
EXP - 10mm cover - Force 547N
ANSYS - 20mm cover - Force 560N
ANSYS - 20mm cover - Force 598N
EXP - 20mm cover - Force 598N
ANSYS - 40mm cover - Force 760N
ANSYS - 40mm cover - Force 802N
EXP - 40mm cover - Force 802N
-3,00E-02
-2,80E-02
-2,60E-02
-2,40E-02
-2,20E-02
-2,00E-02
-1,80E-02
-1,60E-02
-1,40E-02
-1,20E-02
-1,00E-02
0 10 20 30 40 50
Strain [%]
Cover heigth [mm]
ANSYS strain at sagbend 1 withclay as cover - 18mm imperfection
ANSYS - 10mm cover - Force 530N
ANSYS - 10mm cover - Force 547N
EXP - 10mm cover - Force 547N
ANSYS - 20mm cover - Force 560N
ANSYS - 20mm cover - Force 598N
EXP - 20mm cover - Force 598N
ANSYS - 40mm cover - Force 760N
ANSYS - 40mm cover - Force 802N
EXP - 40mm cover - Force 802N
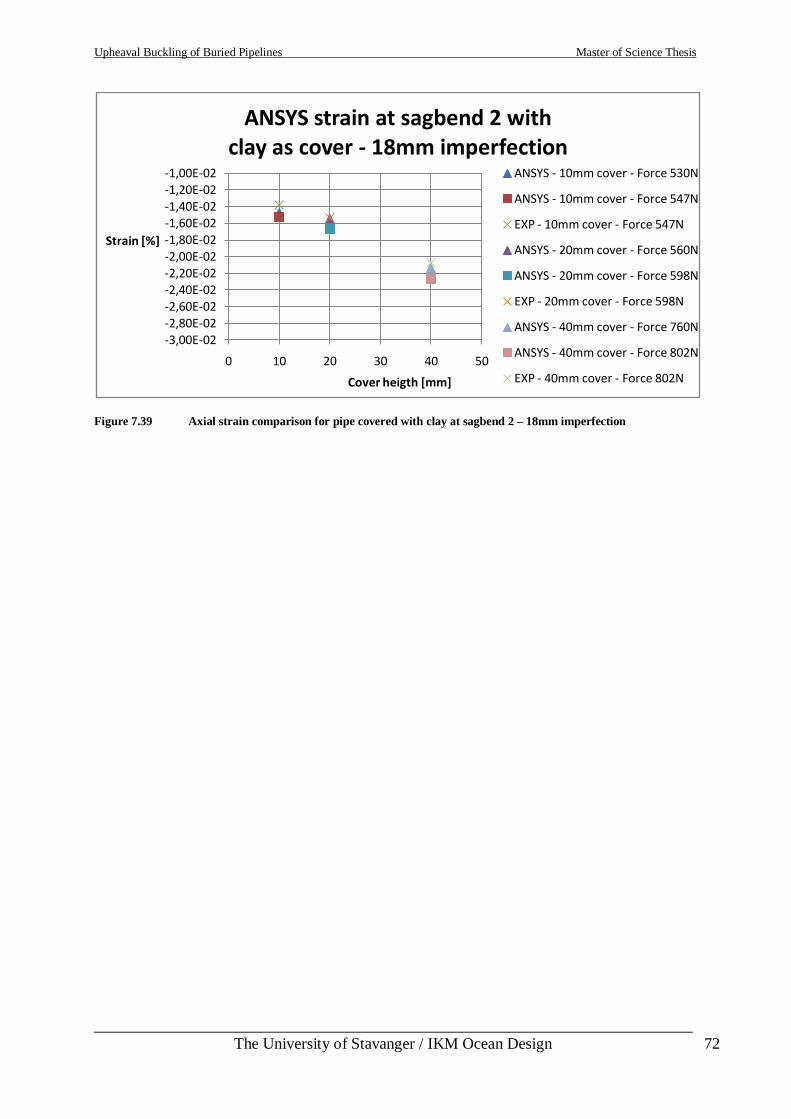
Upheaval Buckling of Buried Pipelines Master of Science Thesis
___________________________________________________________________________
The University of Stavanger / IKM Ocean Design 72
Figure 7.39 Axial strain comparison for pipe covered with clay at sagbend 2 – 18mm imperfection
-3,00E-02-2,80E-02-2,60E-02-2,40E-02-2,20E-02-2,00E-02-1,80E-02-1,60E-02-1,40E-02-1,20E-02-1,00E-02
0 10 20 30 40 50
Strain [%]
Cover heigth [mm]
ANSYS strain at sagbend 2 withclay as cover - 18mm imperfection
ANSYS - 10mm cover - Force 530N
ANSYS - 10mm cover - Force 547N
EXP - 10mm cover - Force 547N
ANSYS - 20mm cover - Force 560N
ANSYS - 20mm cover - Force 598N
EXP - 20mm cover - Force 598N
ANSYS - 40mm cover - Force 760N
ANSYS - 40mm cover - Force 802N
EXP - 40mm cover - Force 802N
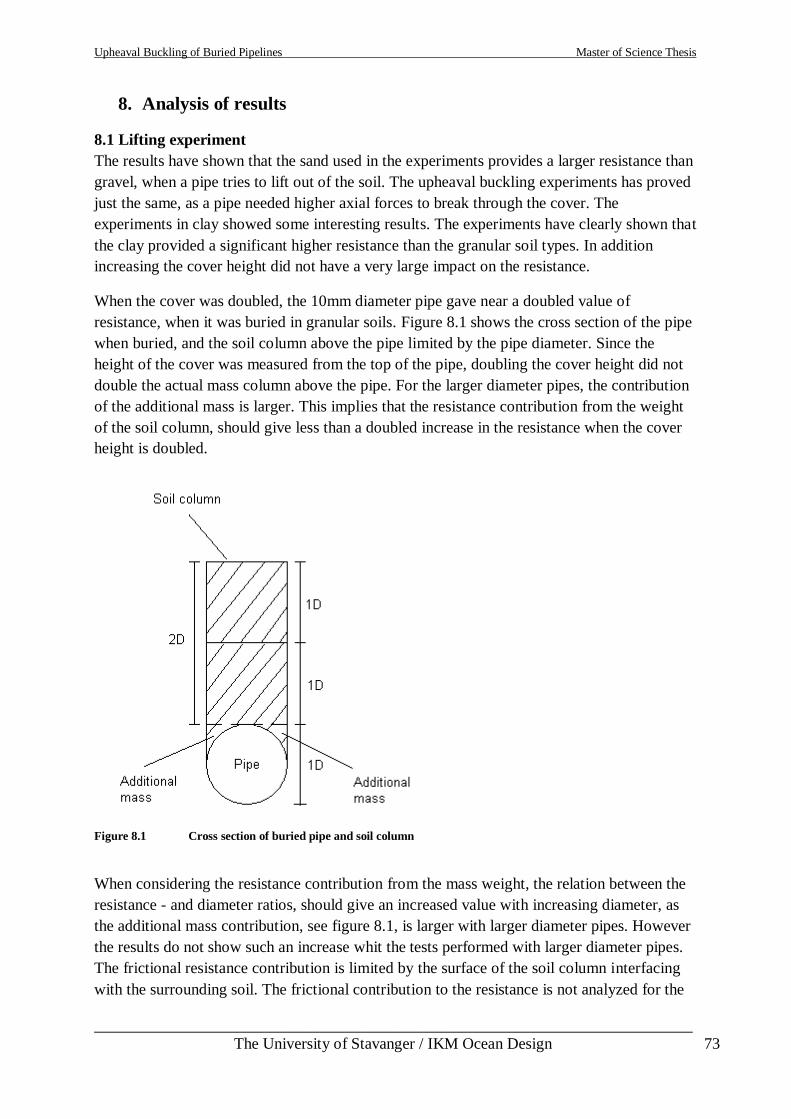
Upheaval Buckling of Buried Pipelines Master of Science Thesis
___________________________________________________________________________
The University of Stavanger / IKM Ocean Design 73
8. Analysis of results
8.1 Lifting experiment
The results have shown that the sand used in the experiments provides a larger resistance than
gravel, when a pipe tries to lift out of the soil. The upheaval buckling experiments has proved
just the same, as a pipe needed higher axial forces to break through the cover. The
experiments in clay showed some interesting results. The experiments have clearly shown that
the clay provided a significant higher resistance than the granular soil types. In addition
increasing the cover height did not have a very large impact on the resistance.
When the cover was doubled, the 10mm diameter pipe gave near a doubled value of
resistance, when it was buried in granular soils. Figure 8.1 shows the cross section of the pipe
when buried, and the soil column above the pipe limited by the pipe diameter. Since the
height of the cover was measured from the top of the pipe, doubling the cover height did not
double the actual mass column above the pipe. For the larger diameter pipes, the contribution
of the additional mass is larger. This implies that the resistance contribution from the weight
of the soil column, should give less than a doubled increase in the resistance when the cover
height is doubled.
Figure 8.1 Cross section of buried pipe and soil column
When considering the resistance contribution from the mass weight, the relation between the
resistance - and diameter ratios, should give an increased value with increasing diameter, as
the additional mass contribution, see figure 8.1, is larger with larger diameter pipes. However
the results do not show such an increase whit the tests performed with larger diameter pipes.
The frictional resistance contribution is limited by the surface of the soil column interfacing
with the surrounding soil. The frictional contribution to the resistance is not analyzed for the
Upheaval Buckling of Buried Pipelines Master of Science Thesis
___________________________________________________________________________
The University of Stavanger / IKM Ocean Design 74
results, but it is probable that it should follow the same pattern as for the weight contribution,
as a doubled cover height does not double the height of the soil column. Based on these
considerations the results derived from the experiments are uncertain, as they do not show
results in accordance with the considerations. Table 8.1 shows the calculated relation between
the derived resistance and diameter ratio, R/D ratio.
Table 8-1 Relation between R/D ratios with increased diameter
(R/D Ratio 1) / (R/D Ratio 2)
OD Gravel Sand Clay
10mm 0.51 0.52 0.94
22mm 0.36 0.69 0.91
28mm 0.38 0.54 0.84
8.2 Upheaval buckling experiment
The upheaval buckling experiments was the main task for this thesis. The measurements
performed during these experiments, has given some interesting results.
8.2.1 Upheaval buckling results in gravel
All the experiments in gravel with the various cover heights led the pipe into an upheaval
buckle that broke through the cover. In general the strains indicated a slight failure in the soil
below the pipe, before the soil failed upwards above the imperfection. The exposed length of
the pipe and the vertical deflection above the imperfection varied clearly with the cover
height. The gravel used in these experiments had the least capability to prevent upheaval
buckling from occurring.
8.2.2 Upheaval buckling results in sand
The experiments with the pipe buried in sand, showed a similar pipe behavior compared to
when the pipe was buried in gravel. All the measures except for the axial load where in
somewhat in the same range. As a larger axial force was needed to make the pipe buckle
through the cover, the sand proved to be more applicable to prevent the pipe from buckling.
8.2.3 Upheaval buckling results in clay
Performing the upheaval buckling tests in clay, turn out to be a great challenge. Several pipes
ended up being plastically deformed. The experiments gave a vertical deflection above the
imperfection that was smaller or in the same range as the previous experiments with granular
masses, but the strain at the location was much higher. After looking further into the results, a
probable cause for the plastic deformations in the pipes turned out to be the soil failing
downwards significantly under the pipe in the sagbends.
The pipes that ended up with plastic deformations were not useable for further experiments.
As the strain gauges mounted on these pipes only could be mounted once, these were also of
no use. Because of this further experiments were carried with precaution, as mounting of new
strain gauges demanded a lot of time, and a limited amount was available. The new approach
Upheaval Buckling of Buried Pipelines Master of Science Thesis
___________________________________________________________________________
The University of Stavanger / IKM Ocean Design 75
was to add a certain axial force to the pipe with various cover heights, but without trying to
make the pipe buckle.
When the pipe was buried in clay, it was exposed to axial forces above 1 kN without breaking
through the cover. Based on this observation, it was assumed that the clay was the best option
when it comes to preventing the pipe from buckling vertically. As the plastic deformations
were detected, the assumption had to be reconsidered. It is beyond doubt that the clay
provided more resistance upwards, but the pipe was still able to move enough to get plastic
deformations, without breaking through the cover. This implied that the downward stiffness in
the soil must also be taken into consideration, as the pipe deforms downwards in the sagbends
until it is prevented for further deflection.
8.2.4 Creep test
The creep test performed in clay showed that the pipe regained its initial position after being
exposed to an axial force, even after being exposed to an axial force a numerous times. The
time aspect is clearly discussable, as the forces were applied for a relatively short amount of
time. The axial force in the creep tests was in the range of 600 to 800 N.
8.2.5 Various imperfections in clay
A series of experiments were carried out for each cover height with two different
imperfections. The imperfection heights were 18mm and 33mm. Because of the experience
with two pipes ending up with plastic deformations, the main objectives for these tests were
not fulfilled. The goal was to compare the maximum axial force for each cover height with the
various imperfections and find a relation between the maximum axial force and imperfection
height. The maximum axial force is reached as the pipe starts to buckle significantly upwards,
but to avoid another pipe getting plastic deformations, it was not tried to achieve a
displacement on the hydraulic pump sufficient for the axial force to build up to its maximum.
Because of this a comparison of the axial force was not performed. The occurrence of a
vertical buckle is highly depending on the profile of the seabed. Trenching and seabed
intervention are commonly used methods to even out the seabed. When choosing a pipeline
routing, avoiding areas with an uneven seabed is common practice. Performing tests with
different imperfections in granular soils, should give comparable results, and is an area of
interest that could be investigated further.
8.3 Analysis of ANSYS results
8.3.1 Gravel as cover
The ANSYS results with 10mm gravel cover buckled at practically the same axial force as for
the experiments. There was documented a dramatic increase in the strains when the axial
force was increased from 207 N to 210 N. In the experiment with a 10mm even formed cover
height the maximum axial force was 207N. For the other cover heights the experiments gave
higher strains when an equal axial force was added in ANSYS.
8.3.2 Sand as cover
As for the ANSYS results in gravel, the 10mm sand cover was close to the results in the sand
experiment with 10mm even loading. An increase of 12 N gave very large strains compared to
Upheaval Buckling of Buried Pipelines Master of Science Thesis
___________________________________________________________________________
The University of Stavanger / IKM Ocean Design 76
the strains in the experiment. For the 20mm and 40mm cover heights ANSYS gave larger
strains, which should be expected as safety factors was included in the calculations.
8.3.3 Clay as cover
The analysis with clay as cover gave similar results to the experiments for each scenario. The
experiments for comparison were performed without the pipe breaking through the cover. The
problem with the analysis has been to compare the strains in a post buckling configuration, as
the maximum axial force in the analysis was not reduced after buckling had occurred.
However, the results show that the analytical model gave comparable results before buckling
had occurred.
8.4 Sources of errors
The lifting experiments gave uncertain results. There are several points to be made regarding
the uncertainties. The lifting experiments were carried out with a manually operated reel,
making it hard to pull the pipe with an even velocity. The resistance might be depending on
the rotation speed of the reel as the reel controls the vertical velocity of the pipe. Sources of
errors from the lifting experiment can be;
- Different lifting speed when pulling the pipe out of the soil
- Uneven cover height, especially for small cover heights
- Pipe not laying perfectly straight in relation to the load cells above
- Wear and tear of the lifting wires
- Various conditions in the soil
The upheaval buckling tests showed variations in the results, when performing tests with
same cover height. There can be several causes for this, but the main cause might be
difference in the initial positions. Especially in clay, forming the cover was hard work, and
might have led the pipe out of its initial position. Sources of errors in the upheaval buckling
experiments can be;
- Difference in initial position
- Inaccurate mounting of strain gauges
- Uneven formed cover
- Time difference when increasing axial force
- Various soil conditions
The results from the analytical calculations in ANSYS should have been comparable with the
tests. There can be a number of reasons for the differences in the analytical and practical
results. Preparing simulations in ANSYS is a time demanding process, and it is often difficult
to detect errors in the model. It is likely that the actual experiments have not been performed
properly. Some reasons for the various results in the experiments and simulations can be;
- The seabed in ANSYS was defined with equal downward stiffness along the whole
seabed. In the experiments, no downward movement was allowed below the
imperfection.
- The pipe element used in ANSYS was based on thin walled theory. The relation
between diameter and wall thickness might have been too small.
Upheaval Buckling of Buried Pipelines Master of Science Thesis
___________________________________________________________________________
The University of Stavanger / IKM Ocean Design 77
- The preprogrammed script is normally used for full scale analysis. The small
dimensions on the experiment might have been misread by the program during the
analysis.
- Wrong input values.
- Incorrect soil data.
8.5 Conclusions
The experiments performed in this thesis have shown some interesting results. Some of the
claims need further analysis to be verified. The general behavior based on the small scale
experiment may not be directly comparable to a full scale situation. From the results it is
possible to draw some conclusions.
Based on the results from the lifting tests and comparison of the different soils, conclusions
are;
- Clay provides a significantly higher resistance compared to granular soils
- The resistance provided by clay is less depending on the cover height
- Burying a pipe in clay requires a lower cover height to provide sufficient resistance
compared to granular soils
The results from the upheaval buckling experiments have verified the previous conclusions.
Based on the analysis of the general behavior from the upheaval buckling experiments, it is
possible to claim that;
- A pipe laying over an imperfection forming sagbends will initially try to deflect
downwards in the sagbends.
This claim might be verified by performing tests with a hard surface below the pipe allowing
no downward movement at all and investigating the strains at the overbend.
A suggested reason for the pipes getting plastic deformations when buried in clay is that the
clay allows a pipe more downward deflection in the sagbends. The clay has larger capabilities
when it comes to providing resistance compared to the granular soils, but observations have
proven certain weaknesses. When buckling occurred in granular soils, the pipe experienced
less deformation before the buckle was initiated. A pipe buried in clay might more likely be
exposed to deflections that can lead to plastic deformations and other failures, without leading
the pipe into exposure on the seabed. This can make it difficult to detect occurrences of
upheaval buckling and damages in the pipe. Including a hard foundation under a pipeline in
areas with soft seabed might reduce such movements.
The creep tests showed that a pipe buried in clay is capable of regaining its initial position
after being deformed. This subject needs further investigation with higher axial forces and
longer time intervals in order to draw any conclusion.
The experiments with various imperfections failed to give the intended results. Suggestions
for modifying the tests are given.
Upheaval Buckling of Buried Pipelines Master of Science Thesis
___________________________________________________________________________
The University of Stavanger / IKM Ocean Design 78
The results from the analytical simulation in ANSYS have not given comparable results.
Further investigation of input values regarding soil parameters and of the model in general is
needed to ensure that the experiments are simulated properly. However the analytical results
were comparable before buckling occurred.
8.6 Suggestions for further work
The lifting tests were not the main task for this thesis. There are several ways to improve the
lifting system used for this thesis. By including an automatic lifting devise and a distance
measurer in the system, one could;
- Compare different uplift velocities impact on the resistance
- Apply a constant lifting force on the pipe while buried in clay for a longer period of
time
- Derive a relation between resistance and the vertical distance the pipe has moved
The upheaval buckling tests with various imperfections failed to give a relation between
maximal axial force and imperfection height. Performing the tests in granular soils should not
lead to problems with a pipe getting plastically deformed. The problems with plastic
deformations in pipes might be avoided by applying a hard surface under the pipe. Analyzing
downward movement in sagbends with a hard surface below the pipe could be performed. The
creep tests could very well be performed in granular soils. The creep tests in clay could also
be performed where a pipe is exposed to loading for longer periods. Suggestions for further
work are;
- Performing experiments with various imperfections in granular soils
- Performing creep tests in granular soils
- Performing creep tests with longer loading intervals in clay
- Applying a stiff bottom surface under the pipe when clay is used as cover
- Performing buckling tests with different trench scenarios
The test cabinet built for the purpose of the experiments in this thesis is well suited for the
suggested experiments for further investigation.
Upheaval Buckling of Buried Pipelines Master of Science Thesis
___________________________________________________________________________
The University of Stavanger / IKM Ocean Design 79
References
[1] DNV-RP-F110, Global Buckling of Submarine Pipelines – Structural Design due to High
Temperature/High Pressure. Det Norske Veritas, Recommended Practice, October 2007.
[2] Global Buckling, DNV Pipeline Technology Course. Presentation, IKM Ocean Desgn,
Forus, 2008.
[3] Palmer, A. C., King R. A., Subsea Pipeline Engineering. PennWell Corporation, 2004,
p379-413.
[4] DNV-OS-F101, Submarine Pipeline Systems. Det Norske Veritas, Offshore Standard,
October 2007.
[5] Carr, M., Bruton, D., Leslie, D., Lateral Buckling and Pipeline Walking, a Challenge for
Hot Pipelines. Offshore Pipeline Technology Conference, Amsterdam, 2003.
[6] Hobbs, R. E., In Service Buckling of Heated Pipelines. ASCE Journal of Transportation
Engineering 110, p175-189.
[7] Martinet, A. Flambement des Voies Sans Joints sur Ballast et Rails de Grande Longueur
(Buckling of Jointless Track on Ballast and Long Rails). Revue Generale des Chemins de Fer
55/2, p212-230.
[8] Kerr, A. D., On the Stability Track in the Vertical Plane. Rail International 9, September
1979, p759-768
[9] Sandvik, K., Thermal Buckling of Pipelines on Uneven Seabed. Master thesis, University
of Stavanger, 2006.
[10] Halvorsen, F., Buckling Behaviour of Pipelines on Uneven Seabed. Master thesis,
University of Stavanger, 2000.
[11] Stava, I., Design of Arctic Offshore Pipelines in Areas Subjected to Ice Ridge Gouging.
Master Thesis, University of Stavanger, 2007.
Appendix
Table of contents
Table of figures ......................................................................................................................... III
A. Geotechnical measures ......................................................................................................VII
B. Upheaval buckling results .................................................................................................. IX
B.1 Upheaval buckling experiments in gravel ........................................................................ IX
B.1.1 Upheaval buckling with no cover .............................................................................. IX
B.1.2 Upheaval buckling in gravel with10mm cover ........................................................... X
B.1.3 Upheaval buckling in gravel with 20 mm cover ........................................................ XI
B.1.4 Upheaval buckling in gravel with 40mm cover ...................................................... XIII
B.2 Upheaval buckling in sand ............................................................................................ XV
B.2.1 Upheaval buckling in sand without cover................................................................ XV
B.2.2 Upheaval buckling in sand with 10mm cover ......................................................... XVI
B.2.3 Upheaval buckling in sand with 20mm cover ...................................................... XVIII
B.2.4 Upheaval buckling in sand with 40mm cover .......................................................... XX
B.3 Upheaval buckling in clay ........................................................................................... XXII
B.3.1 20mm cover – plastic deformation in pipe ............................................................ XXII
B.3.2 40mm cover – plastic deformation in pipe .......................................................... XXIV
B.3.3 10mm – 40mm cover – elastic deformation. Regular prop imperfection ................XXV
B.3.4 10mm – 40mm cover. Reduced prop imperfection. ............................................ XXVII
B.3.5 Creep experiment in clay with 20mm cover ...................................................... XXVIII
C. Lifting experiment results ............................................................................................ XXIX
C.4 Lifting experiments in gravel ..................................................................................... XXIX
C.4.1 10mm OD copper pipe with 10mm overburden .................................................. XXIX
C.4.2 10mm OD Copper pipe with 20mm overburden ....................................................XXX
C.4.3 22mm OD Copper pipe with 22mm overburden .................................................. XXXI
C.4.4 22mm OD Copper pipe with 44mm overburden ................................................. XXXII
C.4.5 28mm OD Copper pipe with 28mm overburden ................................................ XXXIII
C.4.6 28mm OD Copper pipe with 56mm overburden ............................................... XXXIV
C.5 Lifting experiments in sand ...................................................................................... XXXV
C.5.1 10mm OD Copper pipe with 10mm overburden ................................................. XXXV
Upheaval Buckling of Buried Pipelines Master of Science Thesis
___________________________________________________________________________
The University of Stavanger / IKM Ocean Design II
C.5.2 10mm OD Copper pipe with 2D overburden .................................................... XXXVI
C.5.3 22mm OD Copper pipe with 22mm overburden ............................................. XXXVIII
C.5.4 22mm OD Copper pipe with 44mm overburden ............................................... XXXIX
C.5.4 28mm OD Copper pipe with 28mm overburden ..................................................... XLI
C.5.4 28mm OD Copper pipe with 56mm overburden .................................................... XLII
C.6 Lifting experiments in clay .......................................................................................... XLV
C.6.1 10mm OD copper pipe with 10mm overburden .................................................... XLV
C.6.2 10mm OD copper pipe with 20mm overburden ................................................... XLVI
C.6.3 22mm OD copper pipe with 22mm overburden ................................................. XLVII
C.6.4 22mm OD copper pipe with 44mm overburden ................................................ XLVIII
C.6.5 28mm OD copper pipe with 28mm overburden ................................................... XLIX
C.6.6 28mm OD copper pipe with 28mm overburden ........................................................ LI
Upheaval Buckling of Buried Pipelines Master of Science Thesis
___________________________________________________________________________
The University of Stavanger / IKM Ocean Design III
Table of figures
Figure B.1 Upheaval buckling in gravel with no cover .............................................................. IX
Figure B.2 Upheaval buckling with pipe trenched in gravel ...................................................... IX
Figure B.3 Upheaval buckling in gravel with 10mm cover ......................................................... X
Figure B.4 Upheaval buckling in gravel with 10mm even cover................................................. X
Figure B.5 Upheaval buckling in gravel with 20mm cover I ..................................................... XI
Figure B.6 Upheaval buckling in gravel with 20mm cover II .................................................... XI
Figure B.7 Upheaval buckling in gravel with 20mm cover III ..................................................XII
Figure B.8 Upheaval buckling in gravel with 20mm cover IV ..................................................XII
Figure B.9 Upheaval buckling in gravel with 20mm even cover............................................. XIII
Figure B.10 Upheaval buckling in gravel with 40mm cover I ................................................. XIII
Figure B.11 Upheaval buckling in gravel with 40mm cover II ................................................ XIV
Figure B.12 Upheaval buckling in gravel with 40mm cover III .............................................. XIV
Figure B.13 Upheaval buckling in gravel with 40mm cover IV ................................................ XV
Figure B.14 Upheaval buckling in sand with no cover ............................................................ XV
Figure B.15 Upheaval buckling when trenched in sand .......................................................... XVI
Figure B.16 Upheaval buckling in sand with 10mm even cover ........................................... XVIII
Figure B.17 Upheaval buckling in sand with 10mm cover I ................................................... XVI
Figure B.18 Upheaval buckling in sand with 10mm cover II ................................................. XVII
Figure B.19 Upheaval buckling in sand with 10mm cover III ................................................ XVII
Figure B.20 Upheaval buckling in sand with 20mm even cover .......................................... XVIII
Figure B.21 Upheaval buckling in sand with 20mm cover I .................................................... XIX
Figure B.22 Upheaval buckling in sand with 20mm cover II .................................................. XIX
Figure B.23 Upheaval buckling in sand with 20mm cover III.................................................. XX
Figure B.24 Upheaval buckling in sand with 40mm cover I .................................................... XX
Figure B.25 Upheaval buckling in sand with 40mm cover II .................................................. XXI
Upheaval Buckling of Buried Pipelines Master of Science Thesis
___________________________________________________________________________
The University of Stavanger / IKM Ocean Design IV
Figure B.26 Upheaval buckling in sand with 40mm cover III................................................. XXI
Figure B.27 Upheaval buckling in clay with 20mm cover I - Plastic deformation................... XXII
Figure B.28 Upheaval buckling in clay with 20mm cover II - Plastic deformation ................. XXII
Figure B.29 Upheaval buckling in clay with 20mm cover III - Plastic deformation .............. XXIII
Figure B.30 Upheaval buckling in clay with 20mm cover IV - Plastic deformation .............. XXIII
Figure B.31 Upheaval buckling in clay with 40mm cover I - Plastic deformation................. XXIV
Figure B.32 Upheaval buckling in clay with 40mm cover II - Plastic deformation ............... XXIV
Figure B.33 Upheaval buckling in clay with 40mm cover III - Plastic deformation ................XXV
Figure B.34 Upheaval buckling in clay with 10mm cover I - Elastic deformation ..................XXV
Figure B.35 Upheaval buckling in clay with 20mm cover I - Elastic deformation ................ XXVI
Figure B.36 Upheaval buckling in clay with 40mm cover I - Elastic deformation ................ XXVI
Figure B.37 Upheaval buckling in clay with 10mm cover and 20mm imperfection - Elastic
deformation ........................................................................................................................ XXVII
Figure B.38 Upheaval buckling in clay with 20mm cover and 20mm imperfection - Elastic
deformation ........................................................................................................................ XXVII
Figure B.39 Upheaval buckling in clay with 40mm cover and 20mm imperfection - Elastic
deformation ....................................................................................................................... XXVIII
Figure B.40 Creep scenario - 20mm cover - multiple tests ................................................. XXVIII
Figure C.1 Lift in gravel - 10mm 1D cover I ........................................................................ XXIX
Figure C.2 Lift in gravel - 10mm 1D cover II....................................................................... XXIX
Figure C.3 Lift in gravel - 10mm 1D cover III .......................................................................XXX
Figure C.4 Lift in gravel - 10mm 2D cover I ..........................................................................XXX
Figure C.5 Lift in gravel - 22mm 1D cover I ........................................................................ XXXI
Figure C.6 Lift in gravel - 22mm 1D cover II ...................................................................... XXXI
Figure C.7 Lift in gravel - 22mm 1D cover III .................................................................... XXXII
Figure C.8 Lift in gravel - 22mm 2D cover I ....................................................................... XXXII
Figure C.9 Lift in gravel - 28mm 1D cover I .................................................................. XXXIII
Figure C.10 Lift in gravel - 28mm 1D cover II ............................................................. XXXIII
Upheaval Buckling of Buried Pipelines Master of Science Thesis
___________________________________________________________________________
The University of Stavanger / IKM Ocean Design V
Figure C.11 Lift in gravel - 28mm 1D cover III ........................................................... XXXIV
Figure C.12 Lift in gravel - 28mm 2D cover I ............................................................. XXXIV
Figure C.13 Lift in sand - 10mm 1D cover I .................................................................. XXXV
Figure C.14 Lift in sand - 10mm 1D cover II ................................................................. XXXV
Figure C.15 Lift in sand - 10mm 1D cover III ............................................................. XXXVI
Figure C.16 Lift in sand - 10mm 2D cover I ................................................................ XXXVI
Figure C.17 Lift in sand - 10mm 2D cover II .............................................................. XXXVII
Figure C.18 Lift in sand - 10mm 2D cover III ............................................................ XXXVII
Figure C.19 Lift in sand - 22mm 1D cover I .............................................................. XXXVIII
Figure C.20 Lift in sand - 22mm 1D cover II ............................................................. XXXVIII
Figure C.21 Lift in sand - 22mm 1D cover III ............................................................. XXXIX
Figure C.22 Lift in sand - 22mm 2D cover I ................................................................ XXXIX
Figure C.23 Lift in sand - 22mm 2D cover II ....................................................................... XL
Figure C.24 Lift in sand - 22mm 2D cover III ..................................................................... XL
Figure C.25 Lift in sand - 28mm 1D cover I ...................................................................... XLI
Figure C.26 Lift in sand - 28mm 1D cover II ..................................................................... XLI
Figure C.27 Lift in sand - 28mm 1D cover III .................................................................. XLII
Figure C.28 Lift in sand - 28mm 2D cover I ..................................................................... XLII
Figure C.29 Lift in sand - 28mm 2D cover II ................................................................... XLIII
Figure C.30 Lift in sand - 28mm 2D cover III ................................................................. XLIII
Figure C.31 Lift in sand - 28mm 2D cover IV ................................................................. XLIV
Figure C.32 Lift in sand - 28mm 2D cover V .................................................................. XLIV
Figure C.33 Lift in clay - 10mm 1D cover I ...................................................................... XLV
Figure C.34 Lift in clay - 10mm 1D cover II .................................................................... XLV
Figure C.35 Lift in clay - 10mm 1D cover III .................................................................. XLVI
Figure C.36 Lift in clay - 10mm 2D cover I ..................................................................... XLVI
Figure C.37 Lift in clay - 22mm 1D cover I ................................................................... XLVII
Upheaval Buckling of Buried Pipelines Master of Science Thesis
___________________________________________________________________________
The University of Stavanger / IKM Ocean Design VI
Figure C.38 Lift in clay - 22mm 1D cover II ................................................................. XLVII
Figure C.39 Lift in clay - 22mm 1D cover III ............................................................... XLVIII
Figure C.40 Lift in clay - 22mm 2D cover I .................................................................. XLVIII
Figure C.41 Lift in clay - 28mm 1D cover I ..................................................................... XLIX
Figure C.42 Lift in clay - 28mm 1D cover II ................................................................... XLIX
Figure C.43 Lift in clay - 28mm 1D cover III ........................................................................ L
Figure C.44 Lift in clay - 28mm 1D cover IV ........................................................................ L
Figure C.45 Lift in clay - 28mm 2D cover I .......................................................................... LI
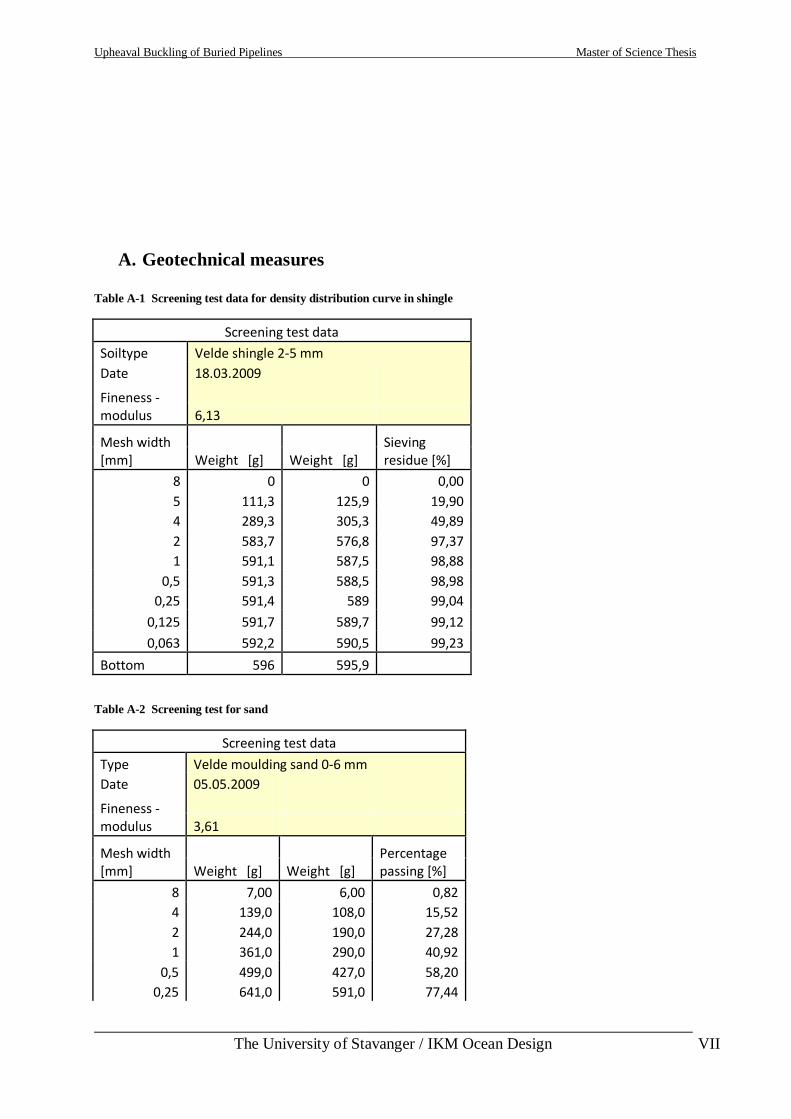
Upheaval Buckling of Buried Pipelines Master of Science Thesis
___________________________________________________________________________
The University of Stavanger / IKM Ocean Design VII
A. Geotechnical measures
Table A-1 Screening test data for density distribution curve in shingle
Screening test data
Soiltype Velde shingle 2-5 mm
Date 18.03.2009
Fineness -modulus
6,13
Mesh width [mm] Weight [g] Weight [g]
Sieving residue [%]
8 0 0 0,00
5 111,3 125,9 19,90
4 289,3 305,3 49,89
2 583,7 576,8 97,37
1 591,1 587,5 98,88
0,5 591,3 588,5 98,98
0,25 591,4 589 99,04
0,125 591,7 589,7 99,12
0,063 592,2 590,5 99,23
Bottom 596 595,9
Table A-2 Screening test for sand
Screening test data
Type Velde moulding sand 0-6 mm
Date 05.05.2009
Fineness -modulus
3,61
Mesh width [mm] Weight [g] Weight [g]
Percentage passing [%]
8 7,00 6,00 0,82
4 139,0 108,0 15,52
2 244,0 190,0 27,28
1 361,0 290,0 40,92
0,5 499,0 427,0 58,20
0,25 641,0 591,0 77,44
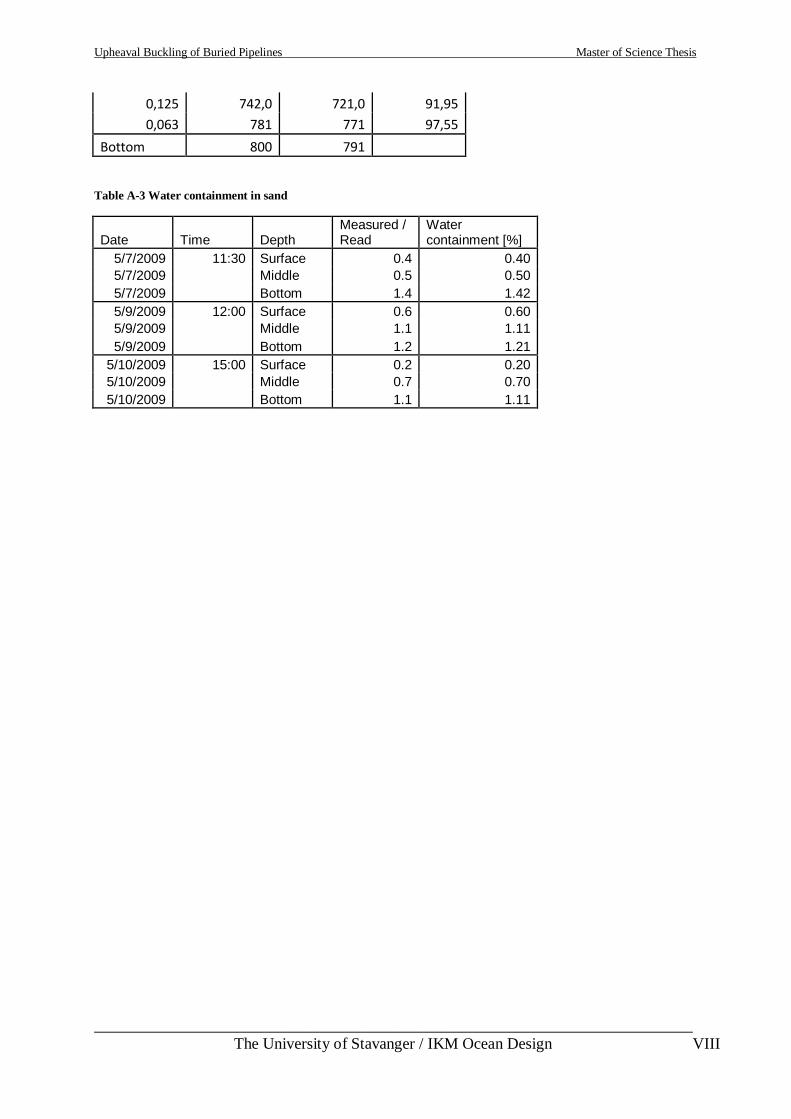
Upheaval Buckling of Buried Pipelines Master of Science Thesis
___________________________________________________________________________
The University of Stavanger / IKM Ocean Design VIII
0,125 742,0 721,0 91,95
0,063 781 771 97,55
Bottom 800 791
Table A-3 Water containment in sand
Date Time Depth Measured / Read
Water containment [%]
5/7/2009 11:30 Surface 0.4 0.40
5/7/2009 Middle 0.5 0.50
5/7/2009 Bottom 1.4 1.42
5/9/2009 12:00 Surface 0.6 0.60
5/9/2009 Middle 1.1 1.11
5/9/2009 Bottom 1.2 1.21
5/10/2009 15:00 Surface 0.2 0.20
5/10/2009 Middle 0.7 0.70
5/10/2009 Bottom 1.1 1.11
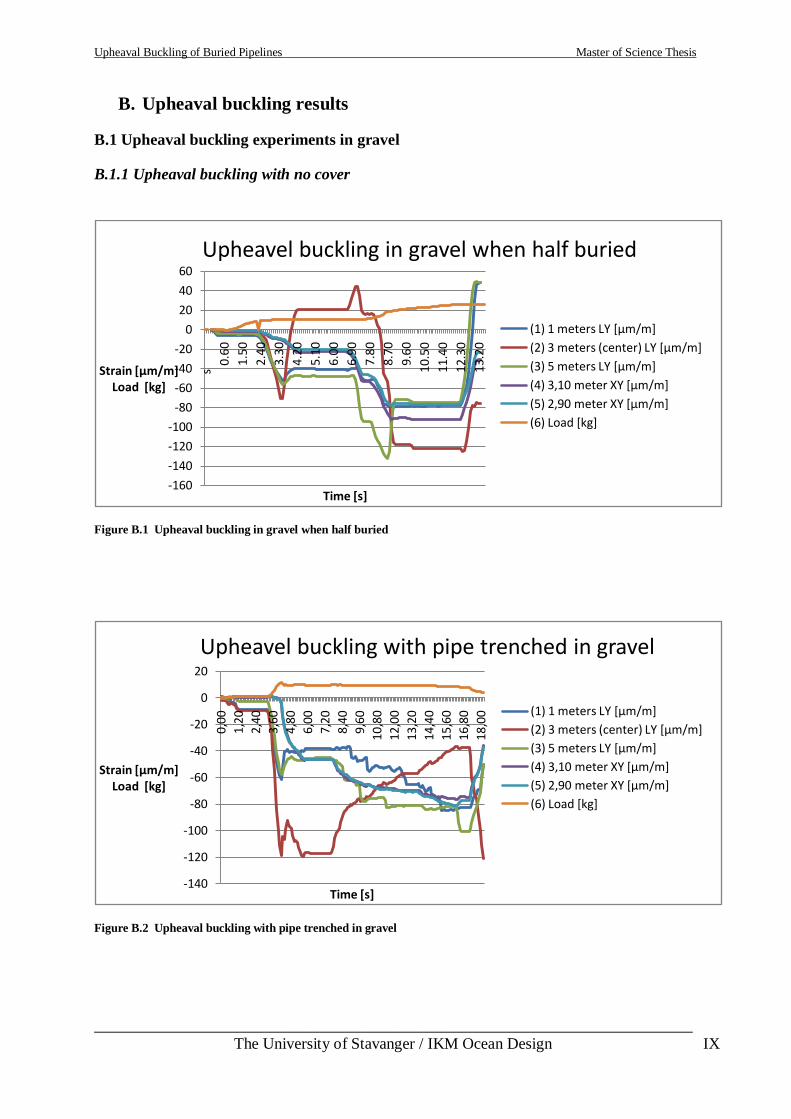
Upheaval Buckling of Buried Pipelines Master of Science Thesis
___________________________________________________________________________
The University of Stavanger / IKM Ocean Design IX
B. Upheaval buckling results
B.1 Upheaval buckling experiments in gravel
B.1.1 Upheaval buckling with no cover
Figure B.1 Upheaval buckling in gravel when half buried
Figure B.2 Upheaval buckling with pipe trenched in gravel
-160
-140
-120
-100
-80
-60
-40
-20
0
20
40
60
s
0.60
1.50
2.40
3.30
4.20
5.10
6.00
6.90
7.80
8.70
9.60
10.5
0
11.4
0
12.3
0
13.2
0
Strain [µm/m]Load [kg]
Time [s]
Upheavel buckling in gravel when half buried
(1) 1 meters LY [µm/m]
(2) 3 meters (center) LY [µm/m]
(3) 5 meters LY [µm/m]
(4) 3,10 meter XY [µm/m]
(5) 2,90 meter XY [µm/m]
(6) Load [kg]
-140
-120
-100
-80
-60
-40
-20
0
20
0,0
0
1,2
0
2,40
3,6
0
4,8
0
6,0
0
7,2
0
8,4
0
9,6
0
10,8
0
12
,00
13
,20
14
,40
15
,60
16
,80
18
,00
Strain [µm/m]Load [kg]
Time [s]
Upheavel buckling with pipe trenched in gravel
(1) 1 meters LY [µm/m]
(2) 3 meters (center) LY [µm/m]
(3) 5 meters LY [µm/m]
(4) 3,10 meter XY [µm/m]
(5) 2,90 meter XY [µm/m]
(6) Load [kg]
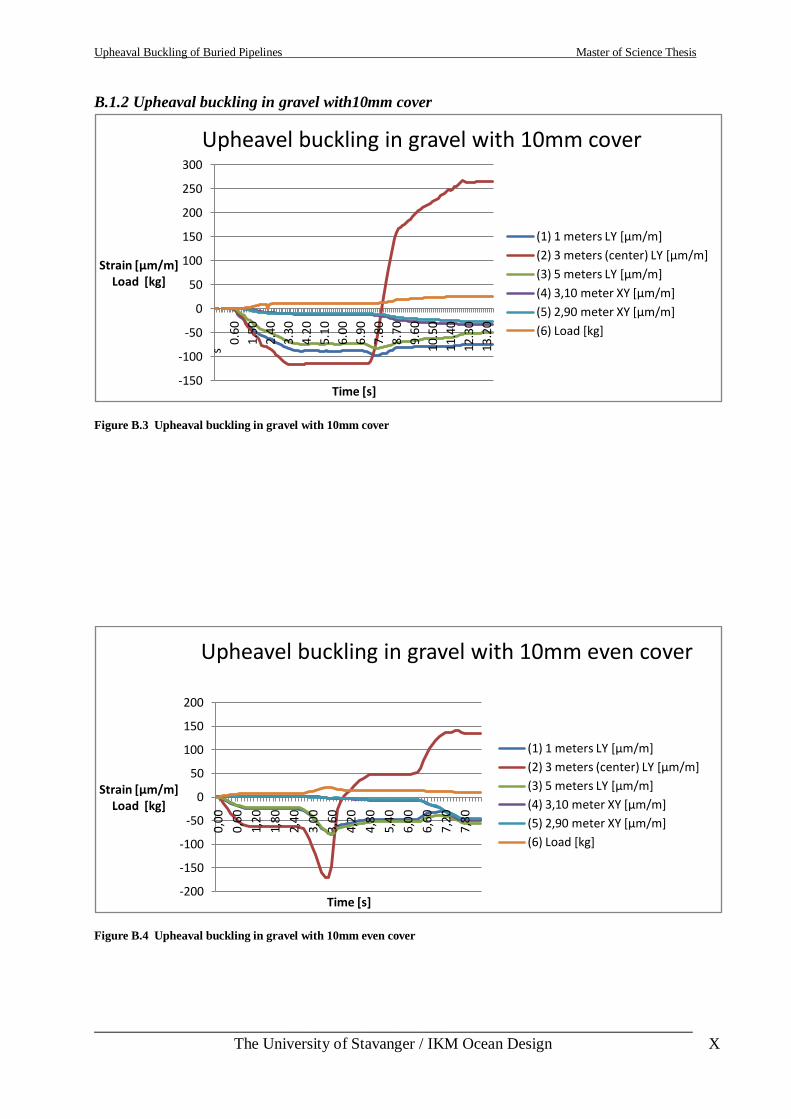
Upheaval Buckling of Buried Pipelines Master of Science Thesis
___________________________________________________________________________
The University of Stavanger / IKM Ocean Design X
B.1.2 Upheaval buckling in gravel with10mm cover
Figure B.3 Upheaval buckling in gravel with 10mm cover
Figure B.4 Upheaval buckling in gravel with 10mm even cover
-150
-100
-50
0
50
100
150
200
250
300
s
0.60
1.50
2.40
3.30
4.20
5.10
6.00
6.90
7.80
8.70
9.60
10.5
0
11.4
0
12.3
0
13.2
0
Strain [µm/m]Load [kg]
Time [s]
Upheavel buckling in gravel with 10mm cover
(1) 1 meters LY [µm/m]
(2) 3 meters (center) LY [µm/m]
(3) 5 meters LY [µm/m]
(4) 3,10 meter XY [µm/m]
(5) 2,90 meter XY [µm/m]
(6) Load [kg]
-200
-150
-100
-50
0
50
100
150
200
0,0
0
0,60
1,2
0
1,8
0
2,4
0
3,0
0
3,6
0
4,2
0
4,8
0
5,4
0
6,0
0
6,60
7,20
7,8
0
Strain [µm/m]Load [kg]
Time [s]
Upheavel buckling in gravel with 10mm even cover
(1) 1 meters LY [µm/m]
(2) 3 meters (center) LY [µm/m]
(3) 5 meters LY [µm/m]
(4) 3,10 meter XY [µm/m]
(5) 2,90 meter XY [µm/m]
(6) Load [kg]
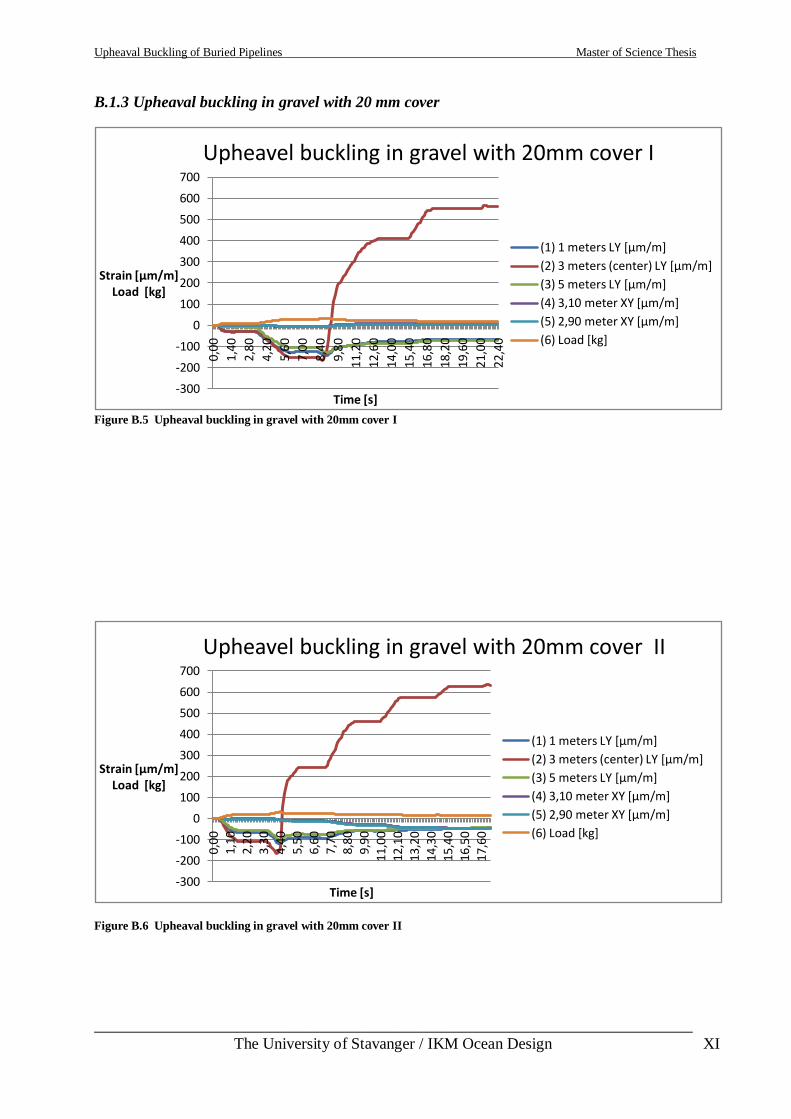
Upheaval Buckling of Buried Pipelines Master of Science Thesis
___________________________________________________________________________
The University of Stavanger / IKM Ocean Design XI
B.1.3 Upheaval buckling in gravel with 20 mm cover
Figure B.5 Upheaval buckling in gravel with 20mm cover I
Figure B.6 Upheaval buckling in gravel with 20mm cover II
-300
-200
-100
0
100
200
300
400
500
600
700
0,00
1,40
2,80
4,20
5,60
7,00
8,40
9,80
11,2
0
12,6
0
14,0
0
15,4
0
16,8
0
18,2
0
19,6
0
21,0
0
22,4
0
Strain [µm/m]Load [kg]
Time [s]
Upheavel buckling in gravel with 20mm cover I
(1) 1 meters LY [µm/m]
(2) 3 meters (center) LY [µm/m]
(3) 5 meters LY [µm/m]
(4) 3,10 meter XY [µm/m]
(5) 2,90 meter XY [µm/m]
(6) Load [kg]
-300
-200
-100
0
100
200
300
400
500
600
700
0,0
0
1,1
0
2,20
3,3
0
4,4
05,
50
6,6
07,
70
8,8
0
9,9
0
11,0
012
,10
13,2
0
14,3
015
,40
16,5
017
,60
Strain [µm/m]Load [kg]
Time [s]
Upheavel buckling in gravel with 20mm cover II
(1) 1 meters LY [µm/m]
(2) 3 meters (center) LY [µm/m]
(3) 5 meters LY [µm/m]
(4) 3,10 meter XY [µm/m]
(5) 2,90 meter XY [µm/m]
(6) Load [kg]
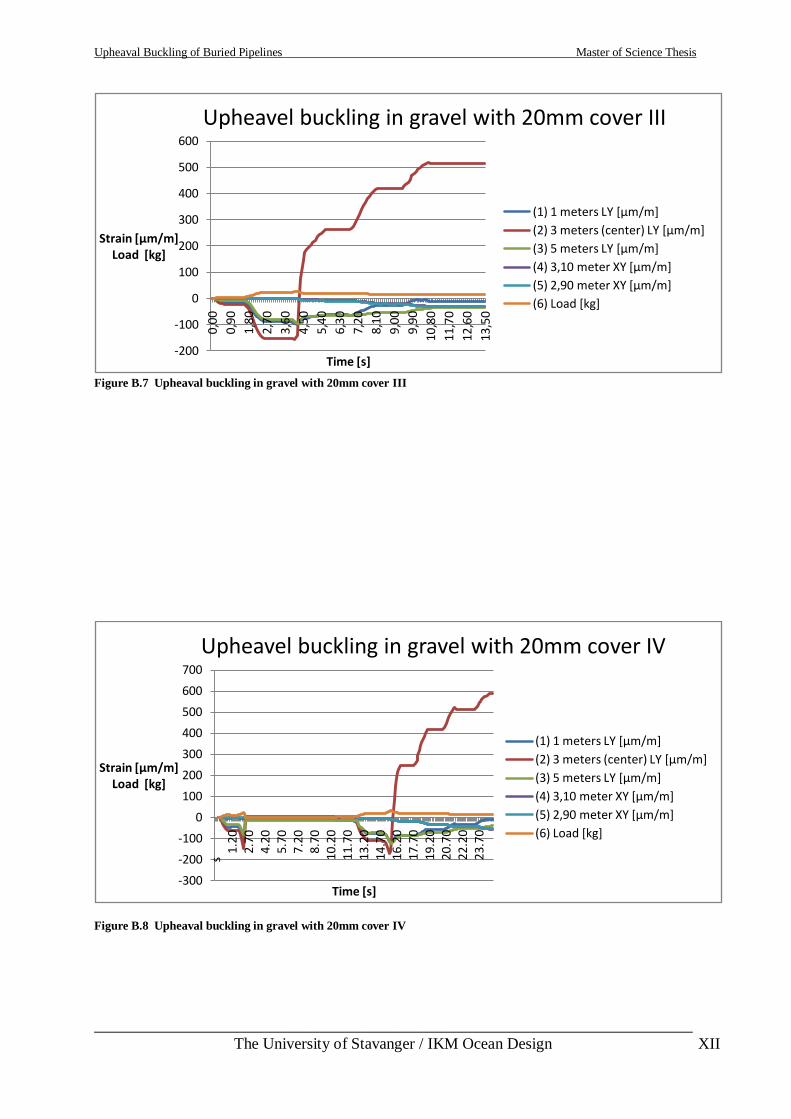
Upheaval Buckling of Buried Pipelines Master of Science Thesis
___________________________________________________________________________
The University of Stavanger / IKM Ocean Design XII
Figure B.7 Upheaval buckling in gravel with 20mm cover III
Figure B.8 Upheaval buckling in gravel with 20mm cover IV
-200
-100
0
100
200
300
400
500
600
0,00
0,90
1,80
2,70
3,60
4,50
5,40
6,30
7,20
8,10
9,00
9,90
10,8
0
11,7
0
12,6
0
13,5
0
Strain [µm/m]Load [kg]
Time [s]
Upheavel buckling in gravel with 20mm cover III
(1) 1 meters LY [µm/m]
(2) 3 meters (center) LY [µm/m]
(3) 5 meters LY [µm/m]
(4) 3,10 meter XY [µm/m]
(5) 2,90 meter XY [µm/m]
(6) Load [kg]
-300
-200
-100
0
100
200
300
400
500
600
700
s
1.2
02.
70
4.2
05.
70
7.2
08.
7010
.20
11.7
013
.20
14.7
016
.20
17.7
019
.20
20.7
022
.20
23.7
0
Strain [µm/m]Load [kg]
Time [s]
Upheavel buckling in gravel with 20mm cover IV
(1) 1 meters LY [µm/m]
(2) 3 meters (center) LY [µm/m]
(3) 5 meters LY [µm/m]
(4) 3,10 meter XY [µm/m]
(5) 2,90 meter XY [µm/m]
(6) Load [kg]
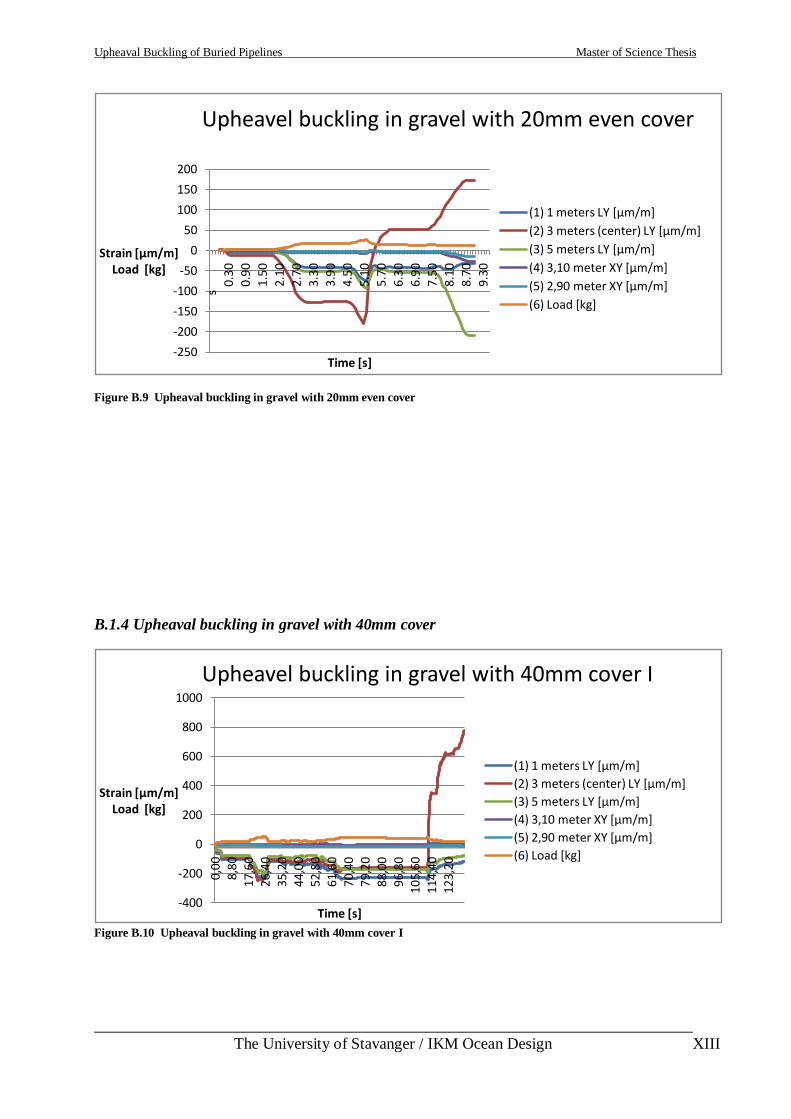
Upheaval Buckling of Buried Pipelines Master of Science Thesis
___________________________________________________________________________
The University of Stavanger / IKM Ocean Design XIII
Figure B.9 Upheaval buckling in gravel with 20mm even cover
B.1.4 Upheaval buckling in gravel with 40mm cover
Figure B.10 Upheaval buckling in gravel with 40mm cover I
-250
-200
-150
-100
-50
0
50
100
150
200
s
0.30
0.90
1.50
2.10
2.70
3.30
3.90
4.50
5.10
5.70
6.30
6.90
7.50
8.10
8.70
9.30
Strain [µm/m]Load [kg]
Time [s]
Upheavel buckling in gravel with 20mm even cover
(1) 1 meters LY [µm/m]
(2) 3 meters (center) LY [µm/m]
(3) 5 meters LY [µm/m]
(4) 3,10 meter XY [µm/m]
(5) 2,90 meter XY [µm/m]
(6) Load [kg]
-400
-200
0
200
400
600
800
1000
0,00
8,8
017
,60
26,4
035
,20
44,0
052
,80
61,6
070
,40
79,2
088
,00
96,8
010
5,6
011
4,4
012
3,2
0
Strain [µm/m]Load [kg]
Time [s]
Upheavel buckling in gravel with 40mm cover I
(1) 1 meters LY [µm/m]
(2) 3 meters (center) LY [µm/m]
(3) 5 meters LY [µm/m]
(4) 3,10 meter XY [µm/m]
(5) 2,90 meter XY [µm/m]
(6) Load [kg]
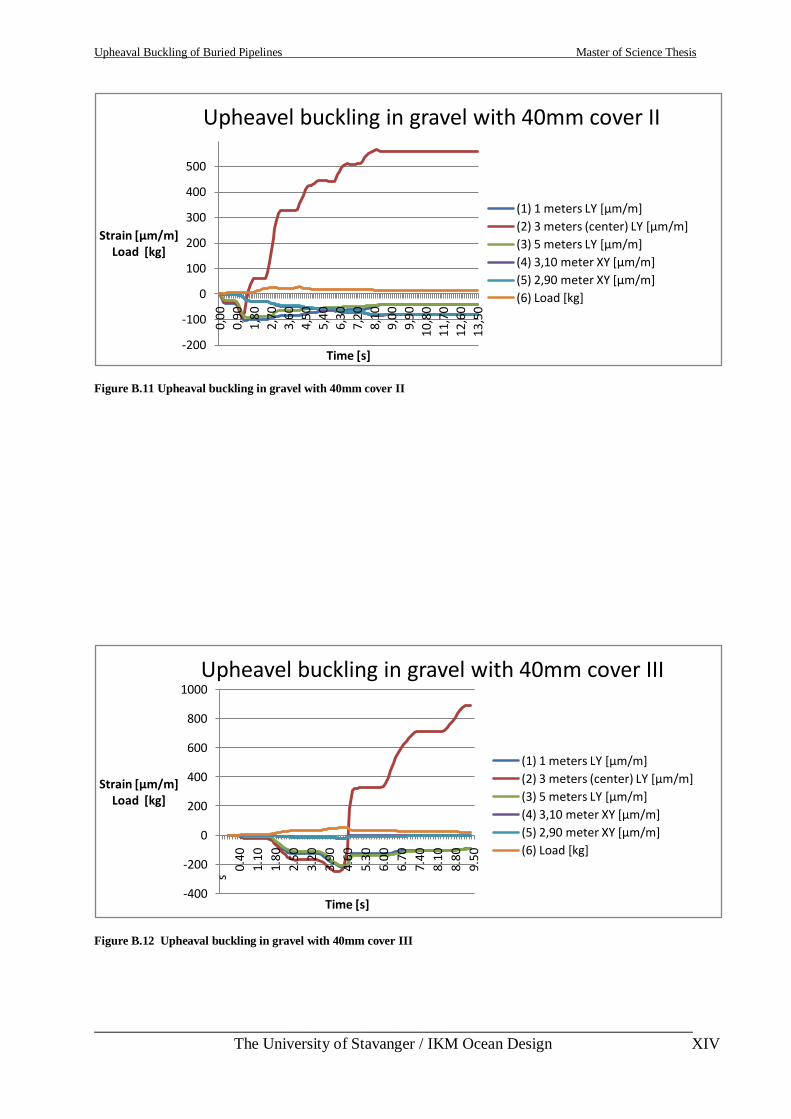
Upheaval Buckling of Buried Pipelines Master of Science Thesis
___________________________________________________________________________
The University of Stavanger / IKM Ocean Design XIV
Figure B.11 Upheaval buckling in gravel with 40mm cover II
Figure B.12 Upheaval buckling in gravel with 40mm cover III
-200
-100
0
100
200
300
400
500
0,00
0,90
1,80
2,70
3,60
4,50
5,40
6,30
7,20
8,10
9,00
9,90
10,8
0
11,7
0
12,6
0
13,5
0
Strain [µm/m]Load [kg]
Time [s]
Upheavel buckling in gravel with 40mm cover II
(1) 1 meters LY [µm/m]
(2) 3 meters (center) LY [µm/m]
(3) 5 meters LY [µm/m]
(4) 3,10 meter XY [µm/m]
(5) 2,90 meter XY [µm/m]
(6) Load [kg]
-400
-200
0
200
400
600
800
1000
s
0.40
1.1
0
1.80
2.5
0
3.20
3.9
0
4.60
5.3
0
6.00
6.7
0
7.40
8.1
0
8.80
9.5
0
Strain [µm/m]Load [kg]
Time [s]
Upheavel buckling in gravel with 40mm cover III
(1) 1 meters LY [µm/m]
(2) 3 meters (center) LY [µm/m]
(3) 5 meters LY [µm/m]
(4) 3,10 meter XY [µm/m]
(5) 2,90 meter XY [µm/m]
(6) Load [kg]

Upheaval Buckling of Buried Pipelines Master of Science Thesis
___________________________________________________________________________
The University of Stavanger / IKM Ocean Design XV
Figure B.13 Upheaval buckling in gravel with 40mm cover IV
B.2 Upheaval buckling in sand
B.2.1 Upheaval buckling in sand without cover
Figure B.14 Upheaval buckling in sand when half buried
-200
-100
0
100
200
300
400
500
s
1.20
2.70
4.20
5.70
7.20
8.70
10.2
0
11.7
0
13.2
0
14.7
0
16.2
0
17.7
0
19.2
0
20.7
0
22.2
0
23.7
0
Strain [µm/m]Load [kg]
Time [s]
Upheaval buckling in gravel with 40mm cover IV
(1) 1 meters LY [µm/m]
(2) 3 meters (center) LY [µm/m]
(3) 5 meters LY [µm/m]
(4) 3,10 meter XY [µm/m]
(5) 2,90 meter XY [µm/m]
(6) Load [kg]
-140
-120
-100
-80
-60
-40
-20
0
20
0,0
0
0,9
0
1,8
0
2,7
0
3,6
0
4,5
0
5,4
0
6,3
0
7,2
0
8,1
0
9,0
0
9,90
10
,80
11
,70
12
,60
Strain [µm/m]Load [kg]
Time [s]
Upheaval buckling in sand when half buried
(1) 1 meters LY [µm/m]
(2) 3 meters (center) LY [µm/m]
(3) 5 meters LY [µm/m]
(4) 3,10 meter XY [µm/m]
(5) 2,90 meter XY [µm/m]
(6) Load [kg]
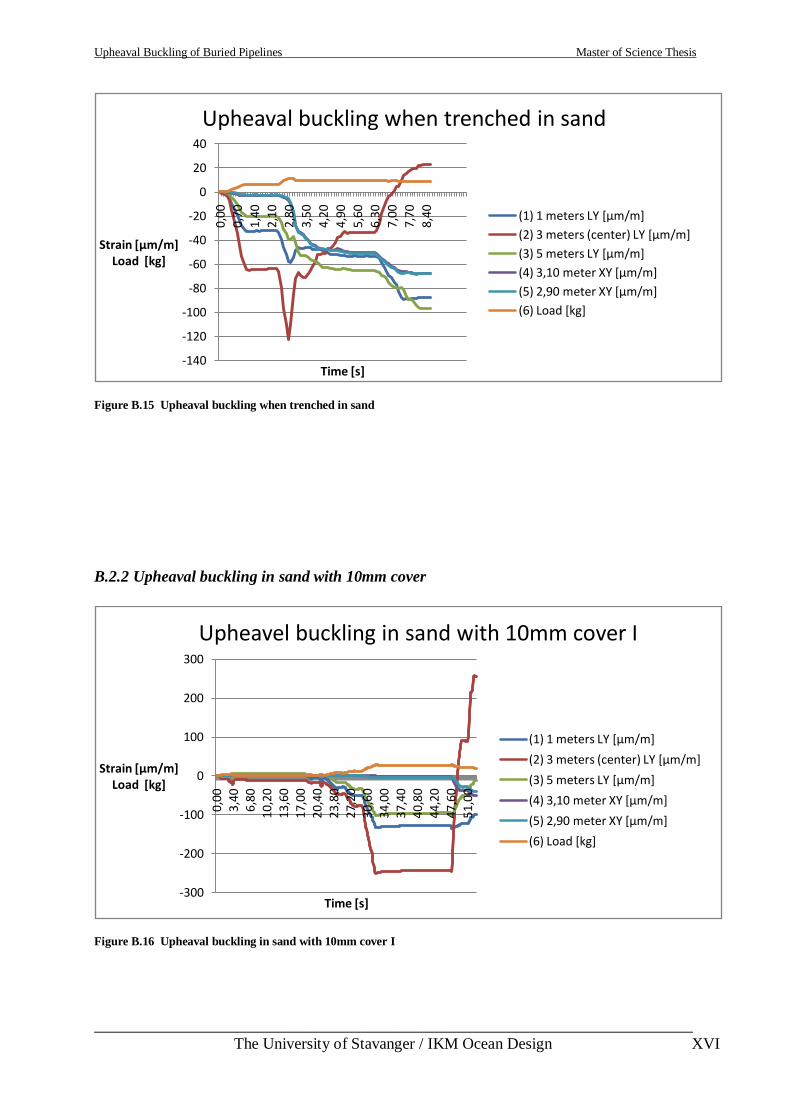
Upheaval Buckling of Buried Pipelines Master of Science Thesis
___________________________________________________________________________
The University of Stavanger / IKM Ocean Design XVI
Figure B.15 Upheaval buckling when trenched in sand
B.2.2 Upheaval buckling in sand with 10mm cover
Figure B.16 Upheaval buckling in sand with 10mm cover I
-140
-120
-100
-80
-60
-40
-20
0
20
40
0,00
0,70
1,40
2,10
2,80
3,50
4,20
4,90
5,60
6,30
7,00
7,70
8,40
Strain [µm/m]Load [kg]
Time [s]
Upheaval buckling when trenched in sand
(1) 1 meters LY [µm/m]
(2) 3 meters (center) LY [µm/m]
(3) 5 meters LY [µm/m]
(4) 3,10 meter XY [µm/m]
(5) 2,90 meter XY [µm/m]
(6) Load [kg]
-300
-200
-100
0
100
200
300
0,00
3,4
06,
80
10,2
0
13,6
017
,00
20,4
023
,80
27,2
0
30,6
034
,00
37,4
040
,80
44,2
047
,60
51,0
0
Strain [µm/m]Load [kg]
Time [s]
Upheavel buckling in sand with 10mm cover I
(1) 1 meters LY [µm/m]
(2) 3 meters (center) LY [µm/m]
(3) 5 meters LY [µm/m]
(4) 3,10 meter XY [µm/m]
(5) 2,90 meter XY [µm/m]
(6) Load [kg]
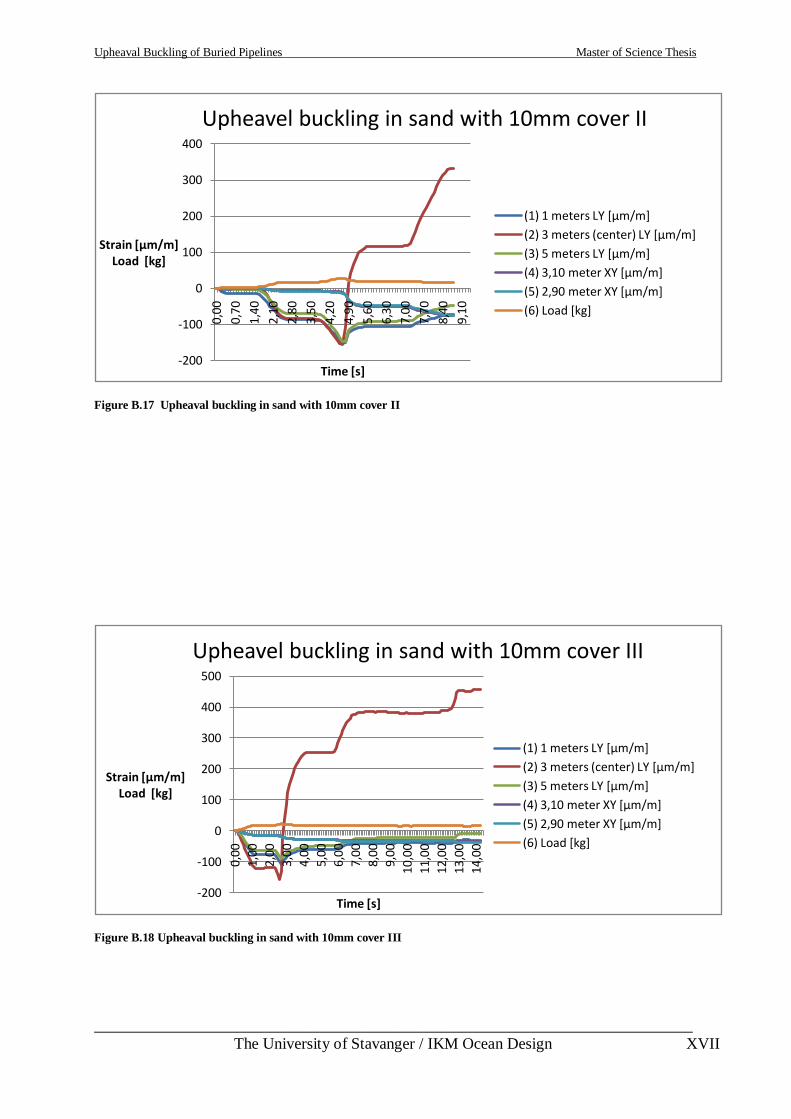
Upheaval Buckling of Buried Pipelines Master of Science Thesis
___________________________________________________________________________
The University of Stavanger / IKM Ocean Design XVII
Figure B.17 Upheaval buckling in sand with 10mm cover II
Figure B.18 Upheaval buckling in sand with 10mm cover III
-200
-100
0
100
200
300
400
0,00
0,70
1,40
2,10
2,80
3,50
4,20
4,90
5,60
6,30
7,00
7,70
8,40
9,10
Strain [µm/m]Load [kg]
Time [s]
Upheavel buckling in sand with 10mm cover II
(1) 1 meters LY [µm/m]
(2) 3 meters (center) LY [µm/m]
(3) 5 meters LY [µm/m]
(4) 3,10 meter XY [µm/m]
(5) 2,90 meter XY [µm/m]
(6) Load [kg]
-200
-100
0
100
200
300
400
500
0,00
1,0
0
2,0
0
3,00
4,0
0
5,0
0
6,0
0
7,0
0
8,0
0
9,0
0
10
,00
11
,00
12
,00
13
,00
14,0
0
Strain [µm/m]Load [kg]
Time [s]
Upheavel buckling in sand with 10mm cover III
(1) 1 meters LY [µm/m]
(2) 3 meters (center) LY [µm/m]
(3) 5 meters LY [µm/m]
(4) 3,10 meter XY [µm/m]
(5) 2,90 meter XY [µm/m]
(6) Load [kg]
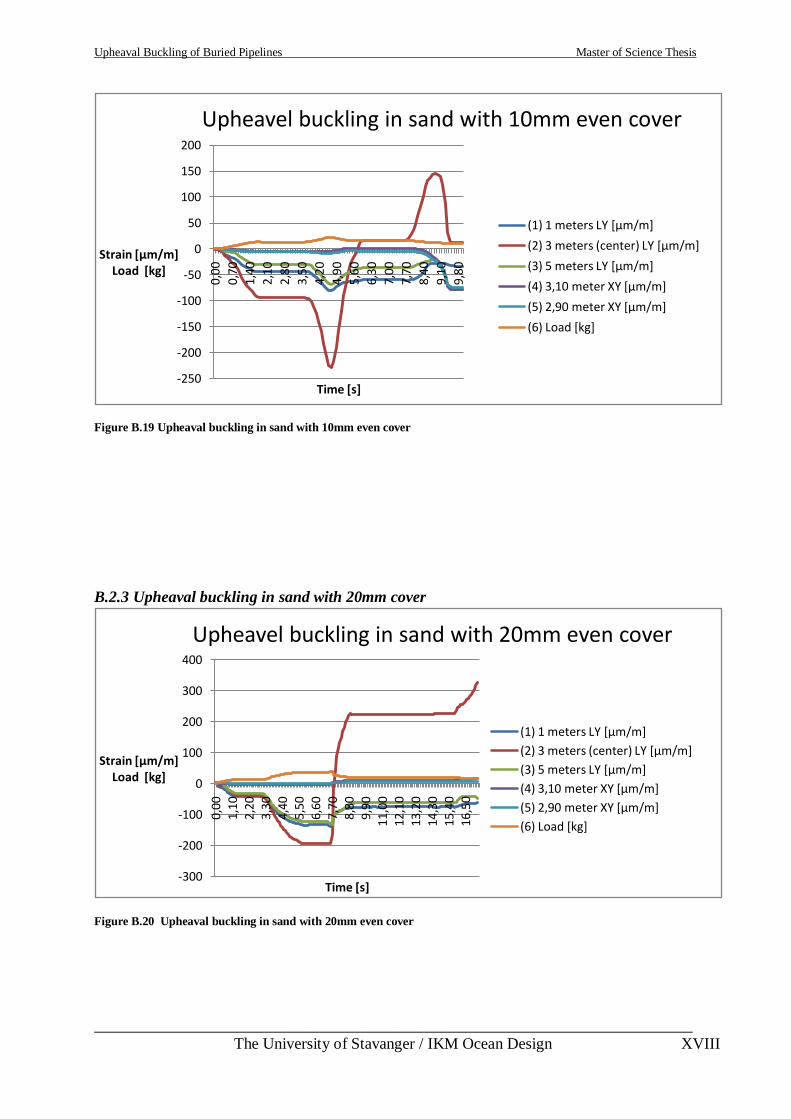
Upheaval Buckling of Buried Pipelines Master of Science Thesis
___________________________________________________________________________
The University of Stavanger / IKM Ocean Design XVIII
Figure B.19 Upheaval buckling in sand with 10mm even cover
B.2.3 Upheaval buckling in sand with 20mm cover
Figure B.20 Upheaval buckling in sand with 20mm even cover
-250
-200
-150
-100
-50
0
50
100
150
200
0,00
0,70
1,40
2,10
2,80
3,50
4,20
4,90
5,60
6,30
7,00
7,70
8,40
9,10
9,80
Strain [µm/m]Load [kg]
Time [s]
Upheavel buckling in sand with 10mm even cover
(1) 1 meters LY [µm/m]
(2) 3 meters (center) LY [µm/m]
(3) 5 meters LY [µm/m]
(4) 3,10 meter XY [µm/m]
(5) 2,90 meter XY [µm/m]
(6) Load [kg]
-300
-200
-100
0
100
200
300
400
0,00
1,1
02
,20
3,3
04
,40
5,50
6,6
07
,70
8,8
09
,90
11,0
01
2,1
01
3,2
01
4,3
01
5,4
016
,50
Strain [µm/m]Load [kg]
Time [s]
Upheavel buckling in sand with 20mm even cover
(1) 1 meters LY [µm/m]
(2) 3 meters (center) LY [µm/m]
(3) 5 meters LY [µm/m]
(4) 3,10 meter XY [µm/m]
(5) 2,90 meter XY [µm/m]
(6) Load [kg]
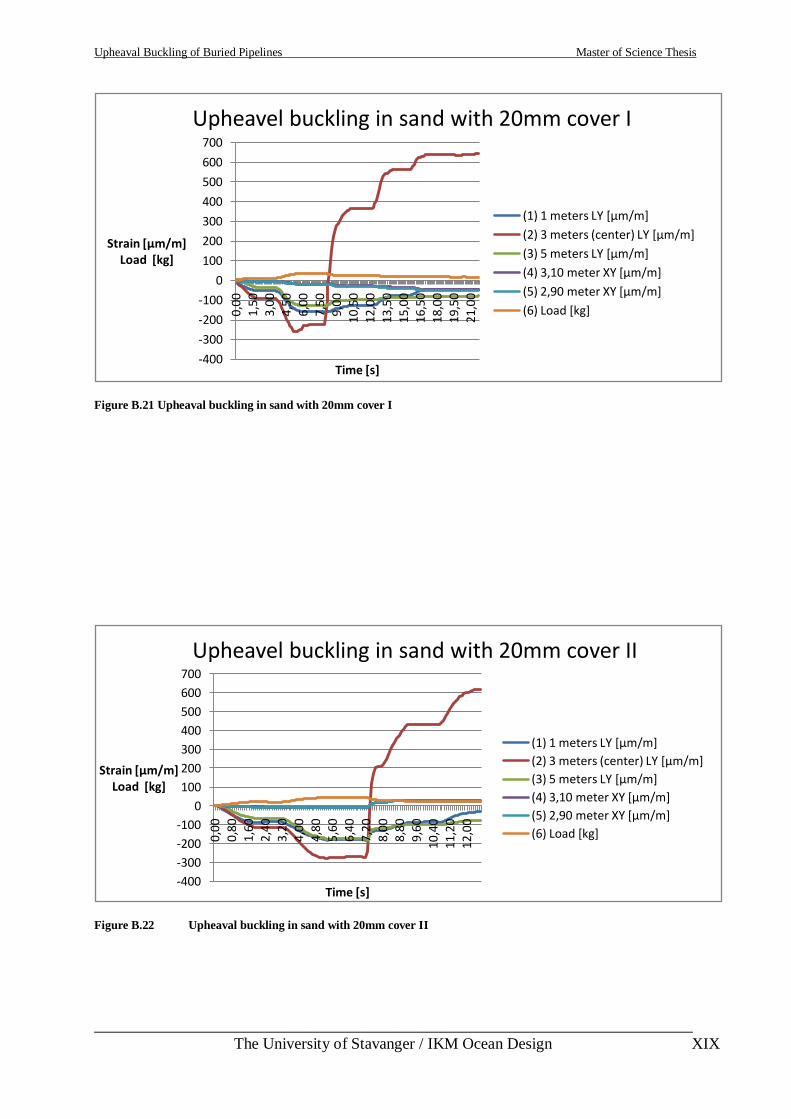
Upheaval Buckling of Buried Pipelines Master of Science Thesis
___________________________________________________________________________
The University of Stavanger / IKM Ocean Design XIX
Figure B.21 Upheaval buckling in sand with 20mm cover I
Figure B.22 Upheaval buckling in sand with 20mm cover II
-400
-300
-200
-100
0
100
200
300
400
500
600
700
0,00
1,50
3,00
4,50
6,00
7,50
9,00
10,5
012
,00
13,5
0
15,0
0
16,5
0
18,0
019
,50
21,0
0
Strain [µm/m]Load [kg]
Time [s]
Upheavel buckling in sand with 20mm cover I
(1) 1 meters LY [µm/m]
(2) 3 meters (center) LY [µm/m]
(3) 5 meters LY [µm/m]
(4) 3,10 meter XY [µm/m]
(5) 2,90 meter XY [µm/m]
(6) Load [kg]
-400
-300
-200
-100
0
100
200
300
400
500
600
700
0,0
0
0,8
0
1,6
0
2,4
0
3,20
4,00
4,8
0
5,6
0
6,4
0
7,2
0
8,0
0
8,8
0
9,6
0
10,4
0
11,2
0
12,0
0
Strain [µm/m]Load [kg]
Time [s]
Upheavel buckling in sand with 20mm cover II
(1) 1 meters LY [µm/m]
(2) 3 meters (center) LY [µm/m]
(3) 5 meters LY [µm/m]
(4) 3,10 meter XY [µm/m]
(5) 2,90 meter XY [µm/m]
(6) Load [kg]
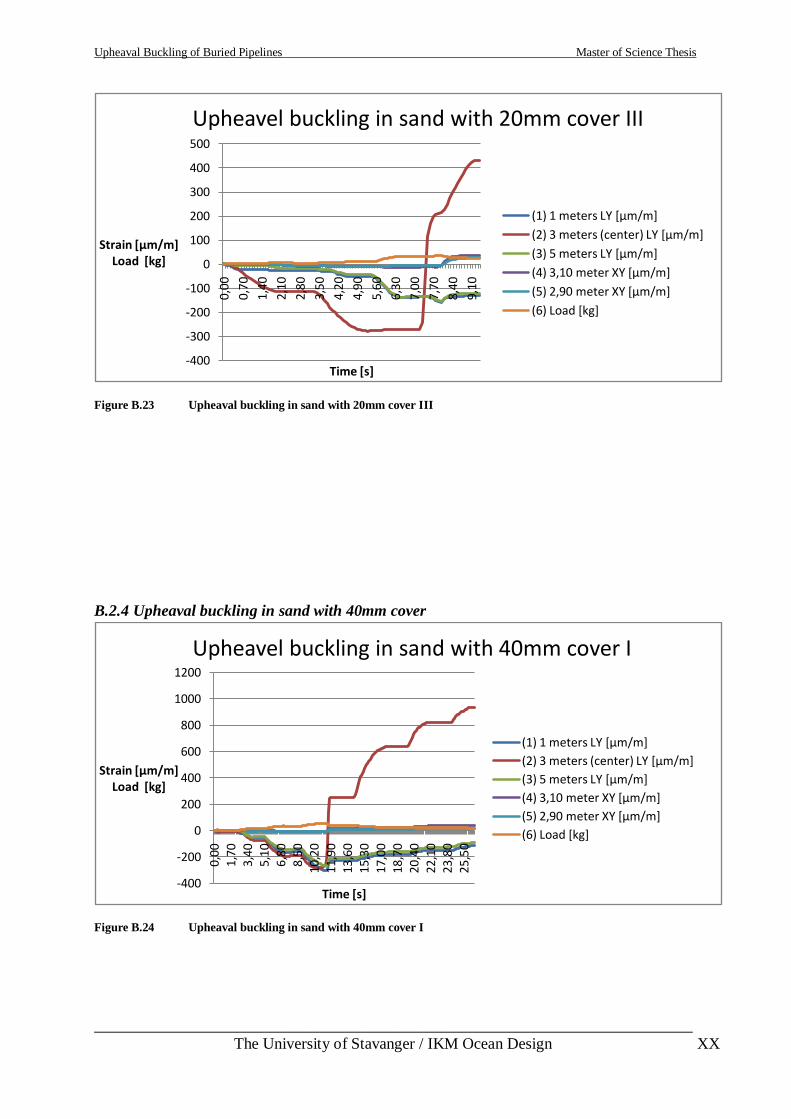
Upheaval Buckling of Buried Pipelines Master of Science Thesis
___________________________________________________________________________
The University of Stavanger / IKM Ocean Design XX
Figure B.23 Upheaval buckling in sand with 20mm cover III
B.2.4 Upheaval buckling in sand with 40mm cover
Figure B.24 Upheaval buckling in sand with 40mm cover I
-400
-300
-200
-100
0
100
200
300
400
500
0,00
0,70
1,40
2,10
2,80
3,50
4,20
4,90
5,60
6,30
7,00
7,70
8,40
9,10
Strain [µm/m]Load [kg]
Time [s]
Upheavel buckling in sand with 20mm cover III
(1) 1 meters LY [µm/m]
(2) 3 meters (center) LY [µm/m]
(3) 5 meters LY [µm/m]
(4) 3,10 meter XY [µm/m]
(5) 2,90 meter XY [µm/m]
(6) Load [kg]
-400
-200
0
200
400
600
800
1000
1200
0,0
01,
70
3,4
05,
10
6,8
08,
50
10,2
011
,90
13,6
015
,30
17,0
018
,70
20,4
022
,10
23,8
025
,50
Strain [µm/m]Load [kg]
Time [s]
Upheavel buckling in sand with 40mm cover I
(1) 1 meters LY [µm/m]
(2) 3 meters (center) LY [µm/m]
(3) 5 meters LY [µm/m]
(4) 3,10 meter XY [µm/m]
(5) 2,90 meter XY [µm/m]
(6) Load [kg]
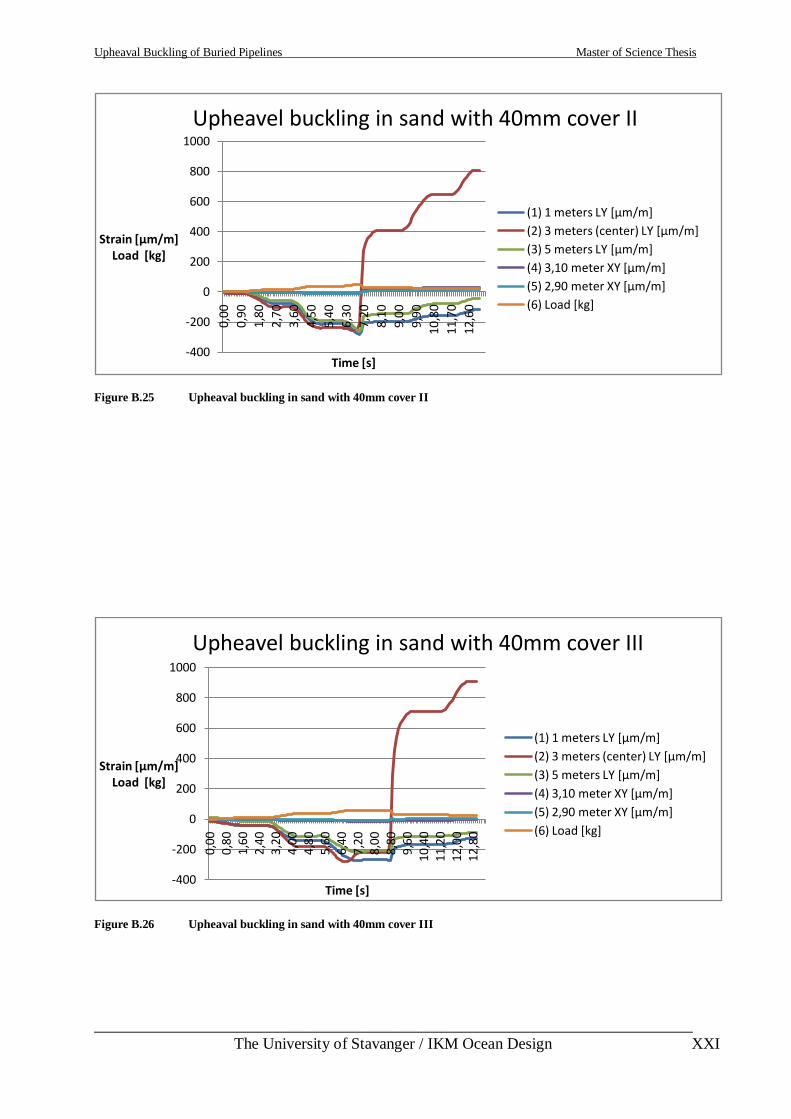
Upheaval Buckling of Buried Pipelines Master of Science Thesis
___________________________________________________________________________
The University of Stavanger / IKM Ocean Design XXI
Figure B.25 Upheaval buckling in sand with 40mm cover II
Figure B.26 Upheaval buckling in sand with 40mm cover III
-400
-200
0
200
400
600
800
1000
0,00
0,90
1,80
2,70
3,60
4,50
5,40
6,30
7,20
8,10
9,00
9,90
10,8
0
11,7
0
12,6
0
Strain [µm/m]Load [kg]
Time [s]
Upheavel buckling in sand with 40mm cover II
(1) 1 meters LY [µm/m]
(2) 3 meters (center) LY [µm/m]
(3) 5 meters LY [µm/m]
(4) 3,10 meter XY [µm/m]
(5) 2,90 meter XY [µm/m]
(6) Load [kg]
-400
-200
0
200
400
600
800
1000
0,0
00,
80
1,6
02,
40
3,2
04,
00
4,8
05,
60
6,4
07,
20
8,0
08,
80
9,6
010
,40
11,2
012
,00
12,8
0
Strain [µm/m]Load [kg]
Time [s]
Upheavel buckling in sand with 40mm cover III
(1) 1 meters LY [µm/m]
(2) 3 meters (center) LY [µm/m]
(3) 5 meters LY [µm/m]
(4) 3,10 meter XY [µm/m]
(5) 2,90 meter XY [µm/m]
(6) Load [kg]
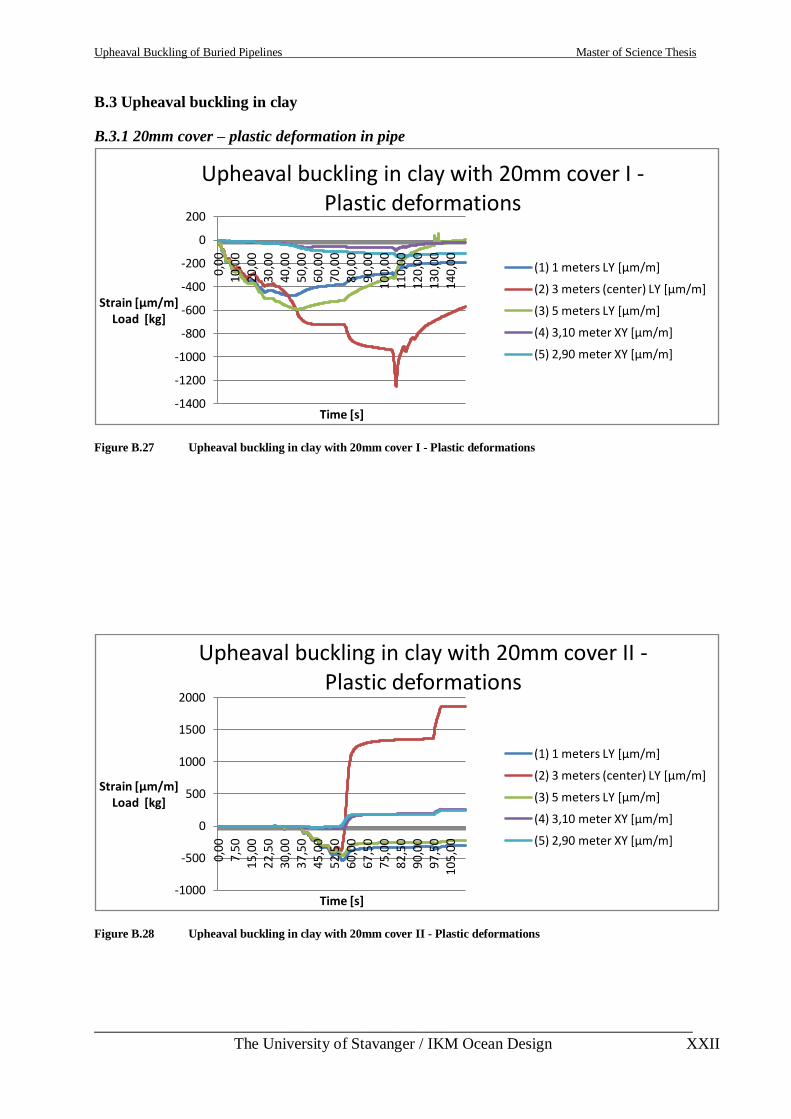
Upheaval Buckling of Buried Pipelines Master of Science Thesis
___________________________________________________________________________
The University of Stavanger / IKM Ocean Design XXII
B.3 Upheaval buckling in clay
B.3.1 20mm cover – plastic deformation in pipe
Figure B.27 Upheaval buckling in clay with 20mm cover I - Plastic deformations
Figure B.28 Upheaval buckling in clay with 20mm cover II - Plastic deformations
-1400
-1200
-1000
-800
-600
-400
-200
0
2000,
0010
,00
20,0
030
,00
40,0
050
,00
60,0
070
,00
80,0
090
,00
100,
0011
0,00
120,
0013
0,00
140,
00
Strain [µm/m]Load [kg]
Time [s]
Upheaval buckling in clay with 20mm cover I -Plastic deformations
(1) 1 meters LY [µm/m]
(2) 3 meters (center) LY [µm/m]
(3) 5 meters LY [µm/m]
(4) 3,10 meter XY [µm/m]
(5) 2,90 meter XY [µm/m]
-1000
-500
0
500
1000
1500
2000
0,0
07,
50
15,0
02
2,5
030
,00
37,
50
45,
00
52,
50
60,
00
67,
50
75,
00
82,
50
90,
00
97,5
010
5,0
0
Strain [µm/m]Load [kg]
Time [s]
Upheaval buckling in clay with 20mm cover II -Plastic deformations
(1) 1 meters LY [µm/m]
(2) 3 meters (center) LY [µm/m]
(3) 5 meters LY [µm/m]
(4) 3,10 meter XY [µm/m]
(5) 2,90 meter XY [µm/m]
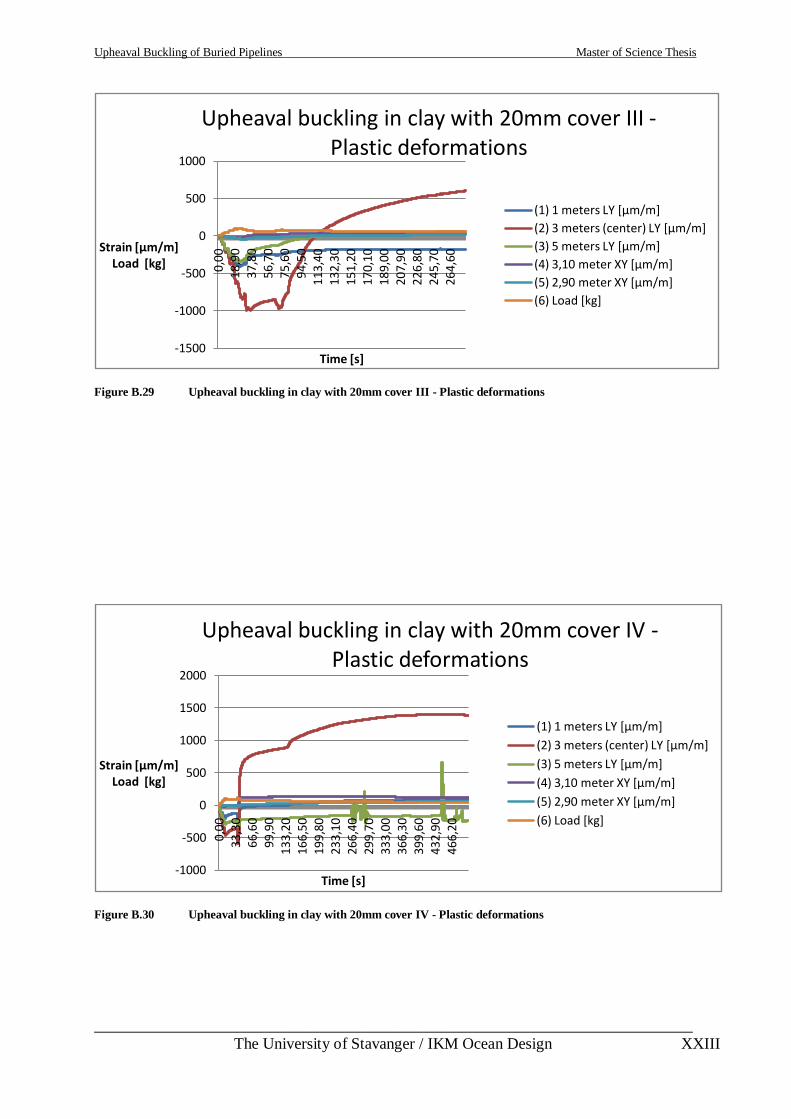
Upheaval Buckling of Buried Pipelines Master of Science Thesis
___________________________________________________________________________
The University of Stavanger / IKM Ocean Design XXIII
Figure B.29 Upheaval buckling in clay with 20mm cover III - Plastic deformations
Figure B.30 Upheaval buckling in clay with 20mm cover IV - Plastic deformations
-1500
-1000
-500
0
500
1000
0,00
18,9
037
,80
56,7
075
,60
94,5
011
3,40
132,
3015
1,20
170,
1018
9,00
207,
9022
6,80
245,
7026
4,60
Strain [µm/m]Load [kg]
Time [s]
Upheaval buckling in clay with 20mm cover III -Plastic deformations
(1) 1 meters LY [µm/m]
(2) 3 meters (center) LY [µm/m]
(3) 5 meters LY [µm/m]
(4) 3,10 meter XY [µm/m]
(5) 2,90 meter XY [µm/m]
(6) Load [kg]
-1000
-500
0
500
1000
1500
2000
0,00
33
,30
66
,60
99
,90
133
,20
166
,50
199
,80
233
,10
266
,40
299,
703
33,0
03
66,3
03
99,6
04
32,9
04
66,2
0
Strain [µm/m]Load [kg]
Time [s]
Upheaval buckling in clay with 20mm cover IV -Plastic deformations
(1) 1 meters LY [µm/m]
(2) 3 meters (center) LY [µm/m]
(3) 5 meters LY [µm/m]
(4) 3,10 meter XY [µm/m]
(5) 2,90 meter XY [µm/m]
(6) Load [kg]
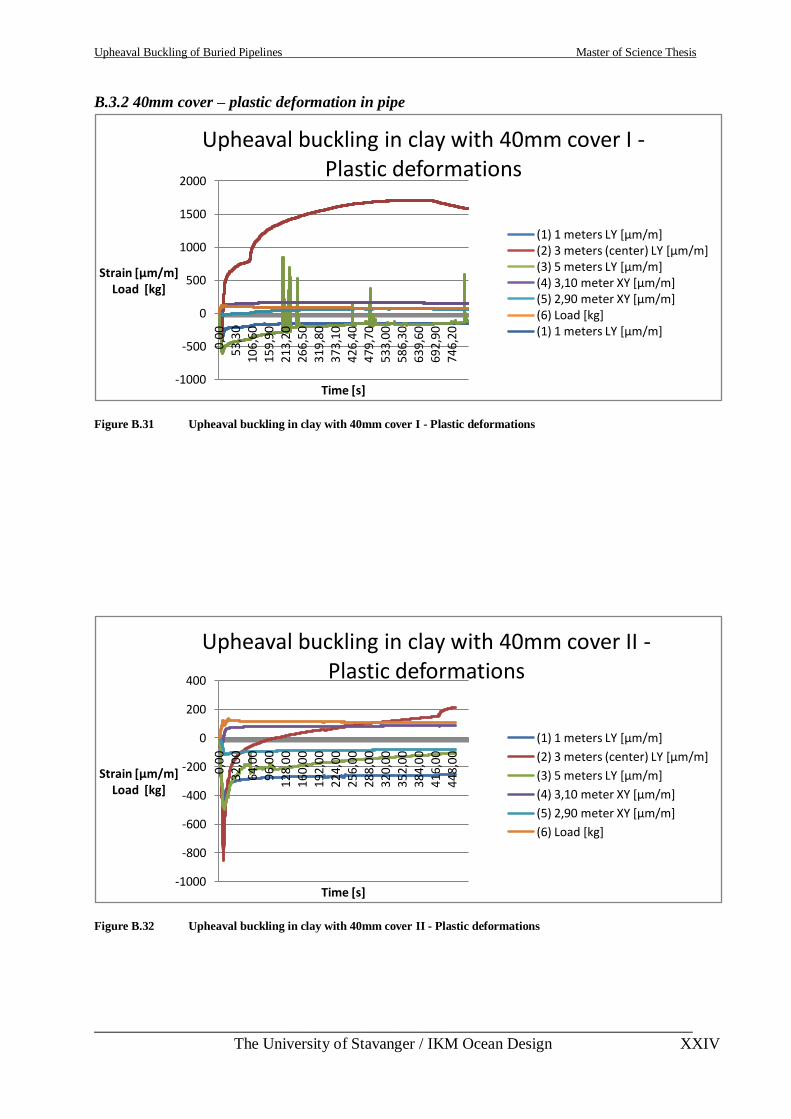
Upheaval Buckling of Buried Pipelines Master of Science Thesis
___________________________________________________________________________
The University of Stavanger / IKM Ocean Design XXIV
B.3.2 40mm cover – plastic deformation in pipe
Figure B.31 Upheaval buckling in clay with 40mm cover I - Plastic deformations
Figure B.32 Upheaval buckling in clay with 40mm cover II - Plastic deformations
-1000
-500
0
500
1000
1500
2000
0,00
53,3
010
6,60
159,
9021
3,20
266,
5031
9,80
373,
1042
6,40
479,
7053
3,00
586,
3063
9,60
692,
9074
6,20
Strain [µm/m]Load [kg]
Time [s]
Upheaval buckling in clay with 40mm cover I -Plastic deformations
(1) 1 meters LY [µm/m] (2) 3 meters (center) LY [µm/m] (3) 5 meters LY [µm/m] (4) 3,10 meter XY [µm/m] (5) 2,90 meter XY [µm/m] (6) Load [kg] (1) 1 meters LY [µm/m]
-1000
-800
-600
-400
-200
0
200
400
0,00
32,
00
64,
00
96,0
012
8,0
016
0,0
019
2,00
224
,00
256
,00
288,
0032
0,0
035
2,0
038
4,0
041
6,0
044
8,0
0
Strain [µm/m]Load [kg]
Time [s]
Upheaval buckling in clay with 40mm cover II -Plastic deformations
(1) 1 meters LY [µm/m]
(2) 3 meters (center) LY [µm/m]
(3) 5 meters LY [µm/m]
(4) 3,10 meter XY [µm/m]
(5) 2,90 meter XY [µm/m]
(6) Load [kg]
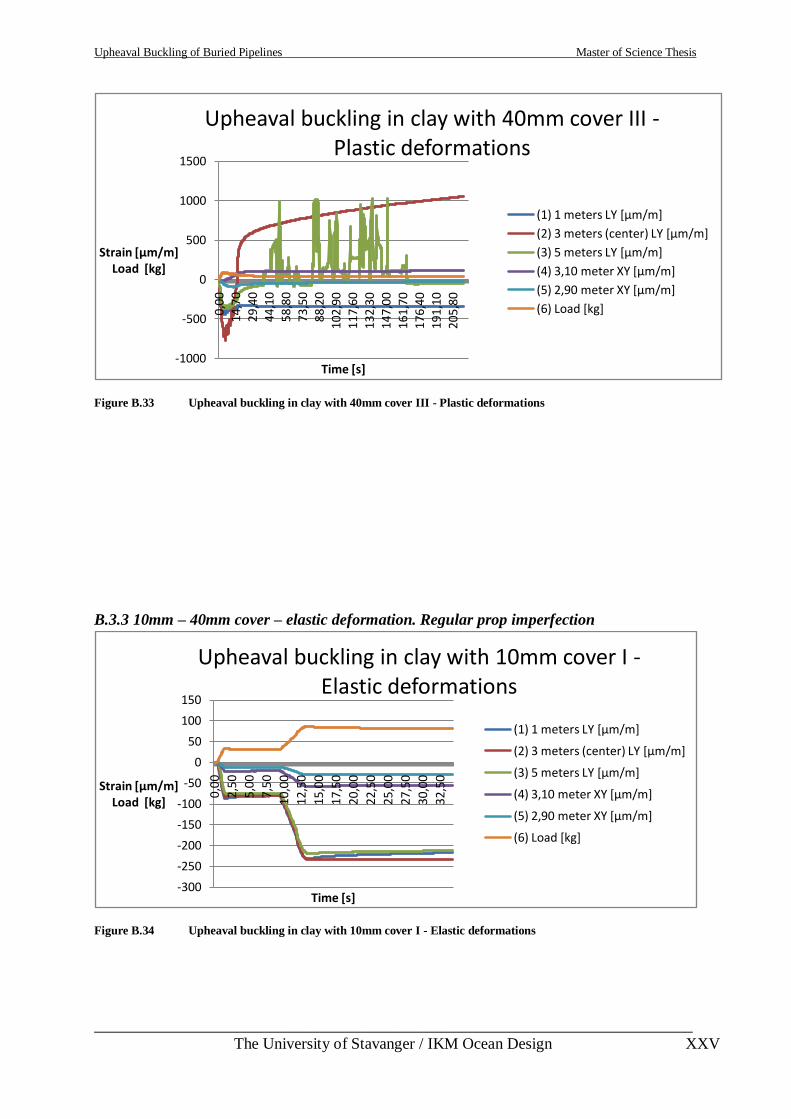
Upheaval Buckling of Buried Pipelines Master of Science Thesis
___________________________________________________________________________
The University of Stavanger / IKM Ocean Design XXV
Figure B.33 Upheaval buckling in clay with 40mm cover III - Plastic deformations
B.3.3 10mm – 40mm cover – elastic deformation. Regular prop imperfection
Figure B.34 Upheaval buckling in clay with 10mm cover I - Elastic deformations
-1000
-500
0
500
1000
1500
0,00
14,7
029
,40
44,1
058
,80
73,5
088
,20
102,
9011
7,60
132,
3014
7,00
161,
7017
6,40
191,
1020
5,80
Strain [µm/m]Load [kg]
Time [s]
Upheaval buckling in clay with 40mm cover III -Plastic deformations
(1) 1 meters LY [µm/m]
(2) 3 meters (center) LY [µm/m]
(3) 5 meters LY [µm/m]
(4) 3,10 meter XY [µm/m]
(5) 2,90 meter XY [µm/m]
(6) Load [kg]
-300
-250
-200
-150
-100
-50
0
50
100
150
0,0
0
2,5
0
5,0
0
7,50
10,
00
12,
50
15,
00
17,
50
20,
00
22,
50
25,
00
27,
50
30,0
0
32,
50
Strain [µm/m]Load [kg]
Time [s]
Upheaval buckling in clay with 10mm cover I -Elastic deformations
(1) 1 meters LY [µm/m]
(2) 3 meters (center) LY [µm/m]
(3) 5 meters LY [µm/m]
(4) 3,10 meter XY [µm/m]
(5) 2,90 meter XY [µm/m]
(6) Load [kg]
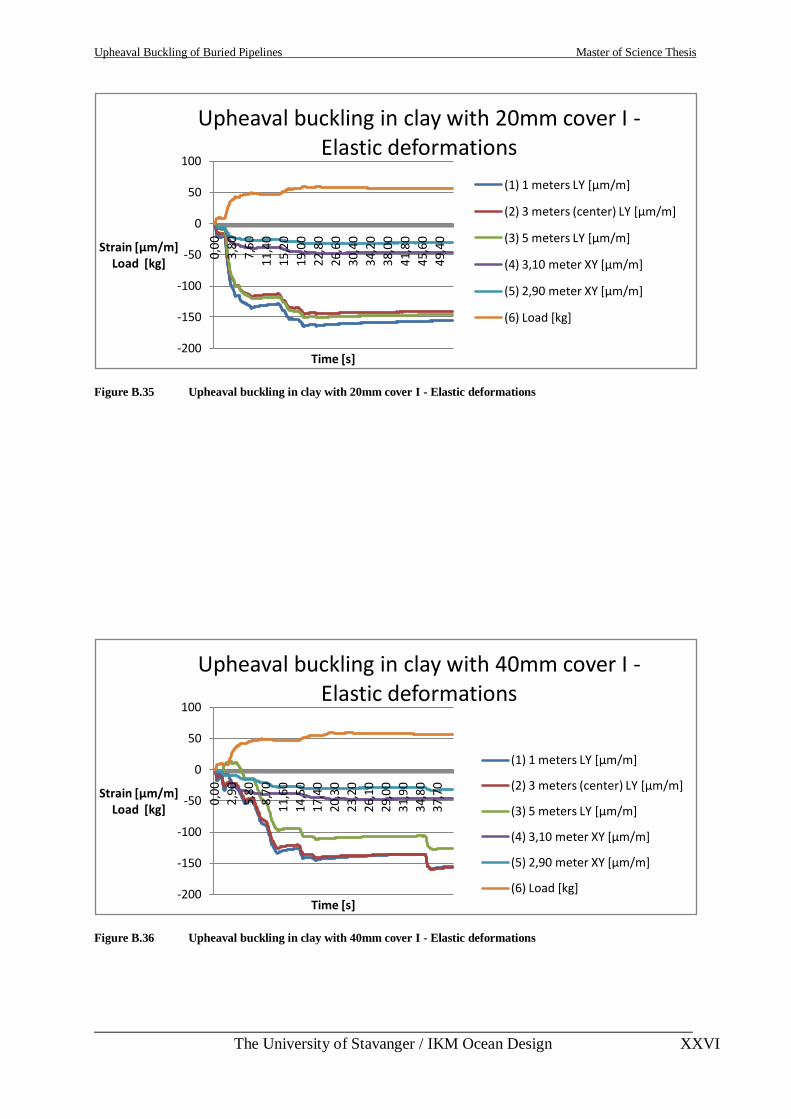
Upheaval Buckling of Buried Pipelines Master of Science Thesis
___________________________________________________________________________
The University of Stavanger / IKM Ocean Design XXVI
Figure B.35 Upheaval buckling in clay with 20mm cover I - Elastic deformations
Figure B.36 Upheaval buckling in clay with 40mm cover I - Elastic deformations
-200
-150
-100
-50
0
50
100
0,00
3,80
7,60
11,4
0
15,2
0
19,0
0
22,8
0
26,6
0
30,4
0
34,2
0
38,0
0
41,8
0
45,6
0
49,4
0
Strain [µm/m]Load [kg]
Time [s]
Upheaval buckling in clay with 20mm cover I -Elastic deformations
(1) 1 meters LY [µm/m]
(2) 3 meters (center) LY [µm/m]
(3) 5 meters LY [µm/m]
(4) 3,10 meter XY [µm/m]
(5) 2,90 meter XY [µm/m]
(6) Load [kg]
-200
-150
-100
-50
0
50
100
0,0
0
2,9
0
5,8
0
8,7
0
11,6
0
14,5
0
17,4
0
20,3
0
23,2
0
26,1
0
29,0
0
31,9
0
34,8
0
37,7
0
Strain [µm/m]Load [kg]
Time [s]
Upheaval buckling in clay with 40mm cover I -Elastic deformations
(1) 1 meters LY [µm/m]
(2) 3 meters (center) LY [µm/m]
(3) 5 meters LY [µm/m]
(4) 3,10 meter XY [µm/m]
(5) 2,90 meter XY [µm/m]
(6) Load [kg]
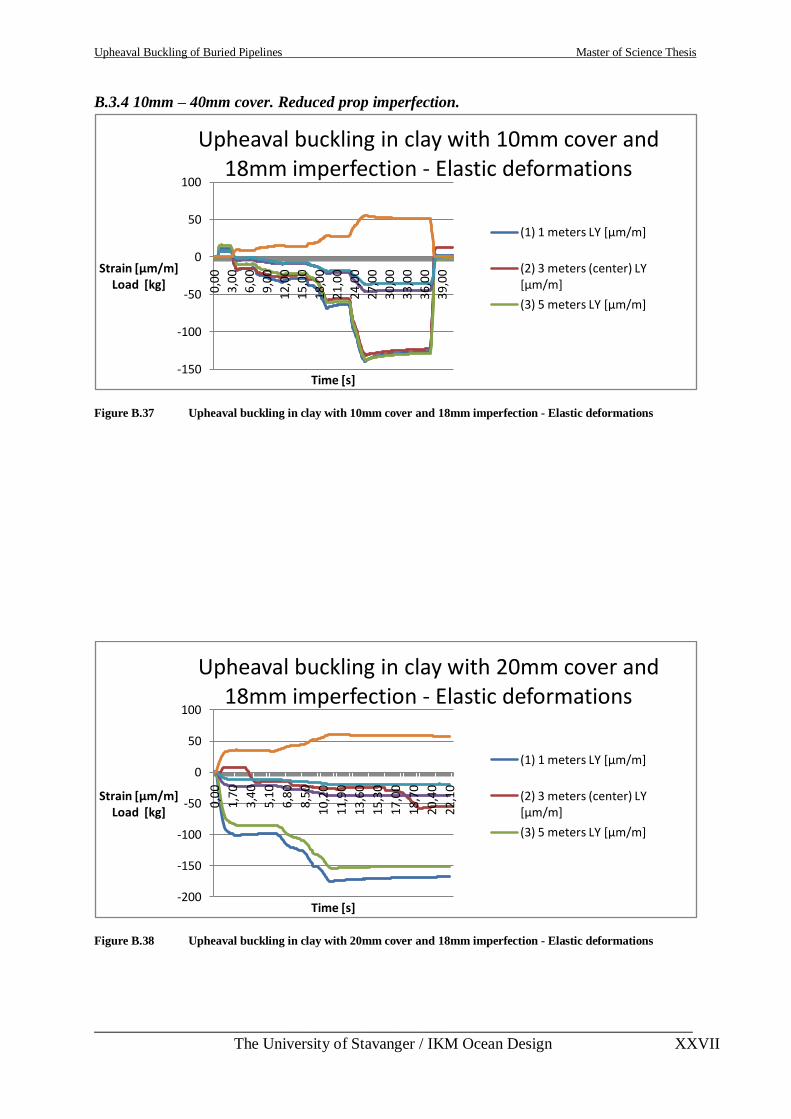
Upheaval Buckling of Buried Pipelines Master of Science Thesis
___________________________________________________________________________
The University of Stavanger / IKM Ocean Design XXVII
B.3.4 10mm – 40mm cover. Reduced prop imperfection.
Figure B.37 Upheaval buckling in clay with 10mm cover and 18mm imperfection - Elastic deformations
Figure B.38 Upheaval buckling in clay with 20mm cover and 18mm imperfection - Elastic deformations
-150
-100
-50
0
50
100
0,00
3,00
6,00
9,00
12,0
0
15,0
0
18,0
0
21,0
0
24,0
0
27,0
0
30,0
0
33,0
0
36,0
0
39,0
0Strain [µm/m]Load [kg]
Time [s]
Upheaval buckling in clay with 10mm cover and 18mm imperfection - Elastic deformations
(1) 1 meters LY [µm/m]
(2) 3 meters (center) LY [µm/m]
(3) 5 meters LY [µm/m]
-200
-150
-100
-50
0
50
100
0,00
1,70
3,40
5,10
6,80
8,50
10
,20
11
,90
13
,60
15
,30
17
,00
18
,70
20
,40
22
,10
Strain [µm/m]Load [kg]
Time [s]
Upheaval buckling in clay with 20mm cover and 18mm imperfection - Elastic deformations
(1) 1 meters LY [µm/m]
(2) 3 meters (center) LY [µm/m]
(3) 5 meters LY [µm/m]
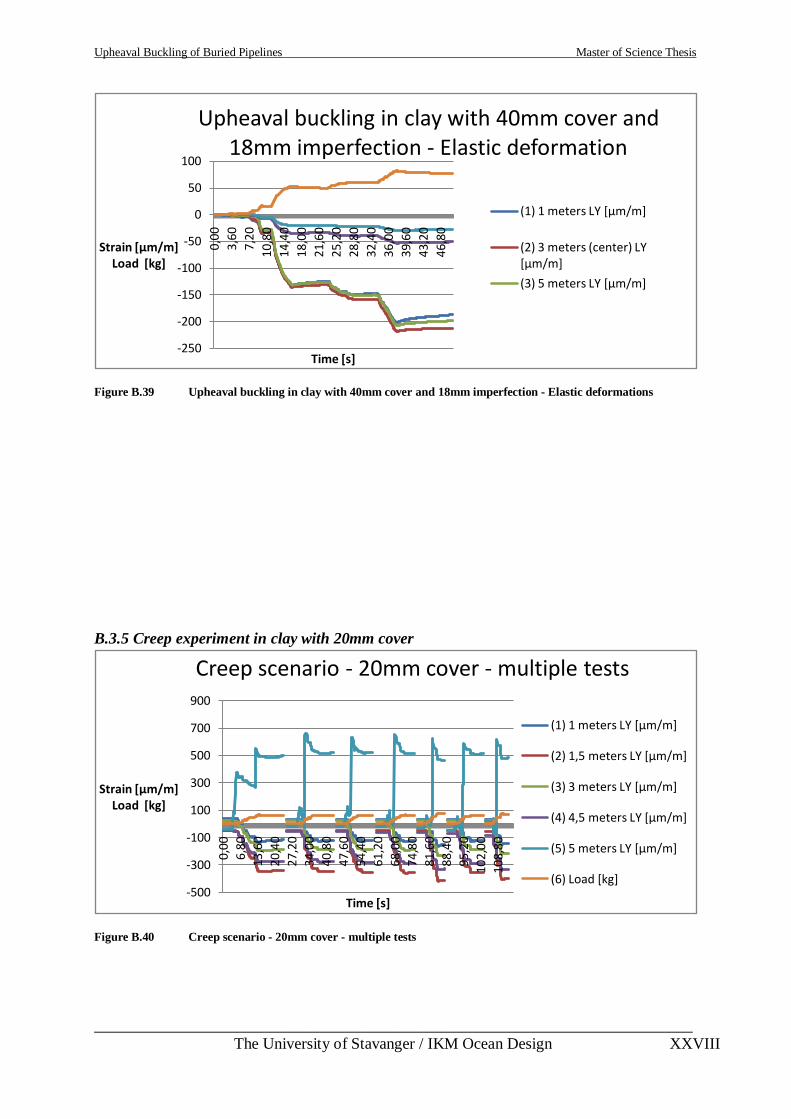
Upheaval Buckling of Buried Pipelines Master of Science Thesis
___________________________________________________________________________
The University of Stavanger / IKM Ocean Design XXVIII
Figure B.39 Upheaval buckling in clay with 40mm cover and 18mm imperfection - Elastic deformations
B.3.5 Creep experiment in clay with 20mm cover
Figure B.40 Creep scenario - 20mm cover - multiple tests
-250
-200
-150
-100
-50
0
50
100
0,00
3,60
7,20
10,8
0
14,4
0
18,0
0
21,6
0
25,2
0
28,8
0
32,4
0
36,0
0
39,6
0
43,2
0
46,8
0
Strain [µm/m]Load [kg]
Time [s]
Upheaval buckling in clay with 40mm cover and 18mm imperfection - Elastic deformation
(1) 1 meters LY [µm/m]
(2) 3 meters (center) LY [µm/m]
(3) 5 meters LY [µm/m]
-500
-300
-100
100
300
500
700
900
0,0
0
6,8
0
13,6
0
20,4
0
27,2
0
34,0
0
40,8
0
47,6
0
54,4
0
61,2
0
68,0
0
74,8
0
81,6
0
88,4
0
95,2
0
10
2,00
10
8,80
Strain [µm/m]Load [kg]
Time [s]
Creep scenario - 20mm cover - multiple tests
(1) 1 meters LY [µm/m]
(2) 1,5 meters LY [µm/m]
(3) 3 meters LY [µm/m]
(4) 4,5 meters LY [µm/m]
(5) 5 meters LY [µm/m]
(6) Load [kg]
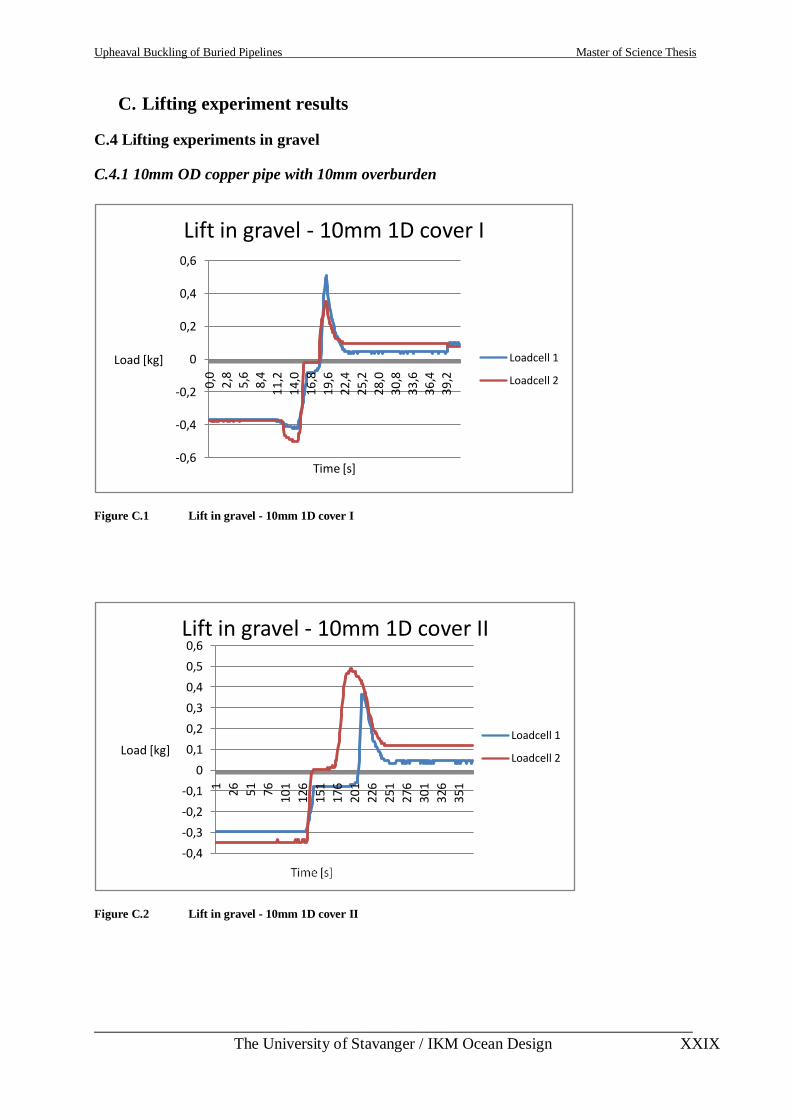
Upheaval Buckling of Buried Pipelines Master of Science Thesis
___________________________________________________________________________
The University of Stavanger / IKM Ocean Design XXIX
C. Lifting experiment results
C.4 Lifting experiments in gravel
C.4.1 10mm OD copper pipe with 10mm overburden
Figure C.1 Lift in gravel - 10mm 1D cover I
Figure C.2 Lift in gravel - 10mm 1D cover II
-0,6
-0,4
-0,2
0
0,2
0,4
0,6
0,0
2,8
5,6
8,4
11,2
14,0
16,8
19,6
22,4
25,2
28,0
30,8
33,6
36,4
39,2
Load [kg]
Time [s]
Lift in gravel - 10mm 1D cover I
Loadcell 1
Loadcell 2
-0,4
-0,3
-0,2
-0,1
0
0,1
0,2
0,3
0,4
0,5
0,6
1 26 51 76
101
126
151
176
201
226
251
276
301
326
351
Load [kg]
Lift in gravel - 10mm 1D cover II
Loadcell 1
Loadcell 2
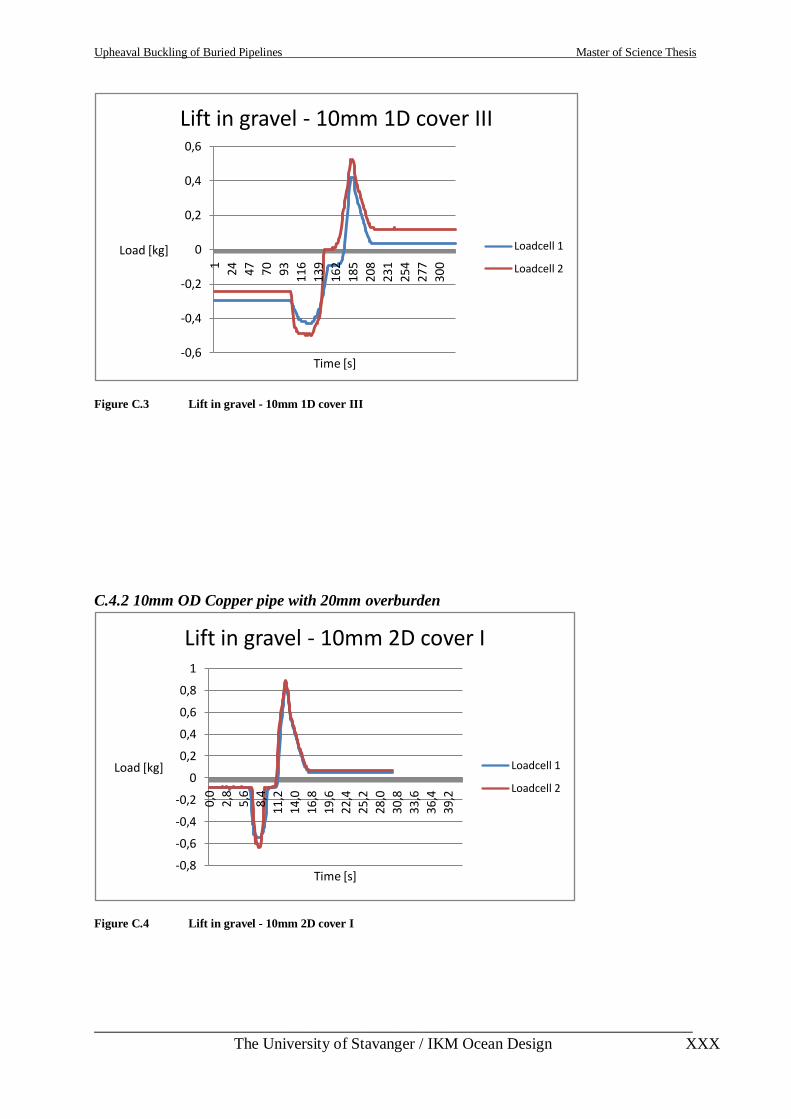
Upheaval Buckling of Buried Pipelines Master of Science Thesis
___________________________________________________________________________
The University of Stavanger / IKM Ocean Design XXX
Figure C.3 Lift in gravel - 10mm 1D cover III
C.4.2 10mm OD Copper pipe with 20mm overburden
Figure C.4 Lift in gravel - 10mm 2D cover I
-0,6
-0,4
-0,2
0
0,2
0,4
0,6
1
24 47 70 93 116
139
162
185
208
231
254
277
300
Load [kg]
Time [s]
Lift in gravel - 10mm 1D cover III
Loadcell 1
Loadcell 2
-0,8
-0,6
-0,4
-0,2
0
0,2
0,4
0,6
0,8
1
0,0
2,8
5,6
8,4
11,2
14
,0
16
,8
19
,6
22
,4
25,2
28
,0
30
,8
33
,6
36
,4
39,2
Load [kg]
Time [s]
Lift in gravel - 10mm 2D cover I
Loadcell 1
Loadcell 2
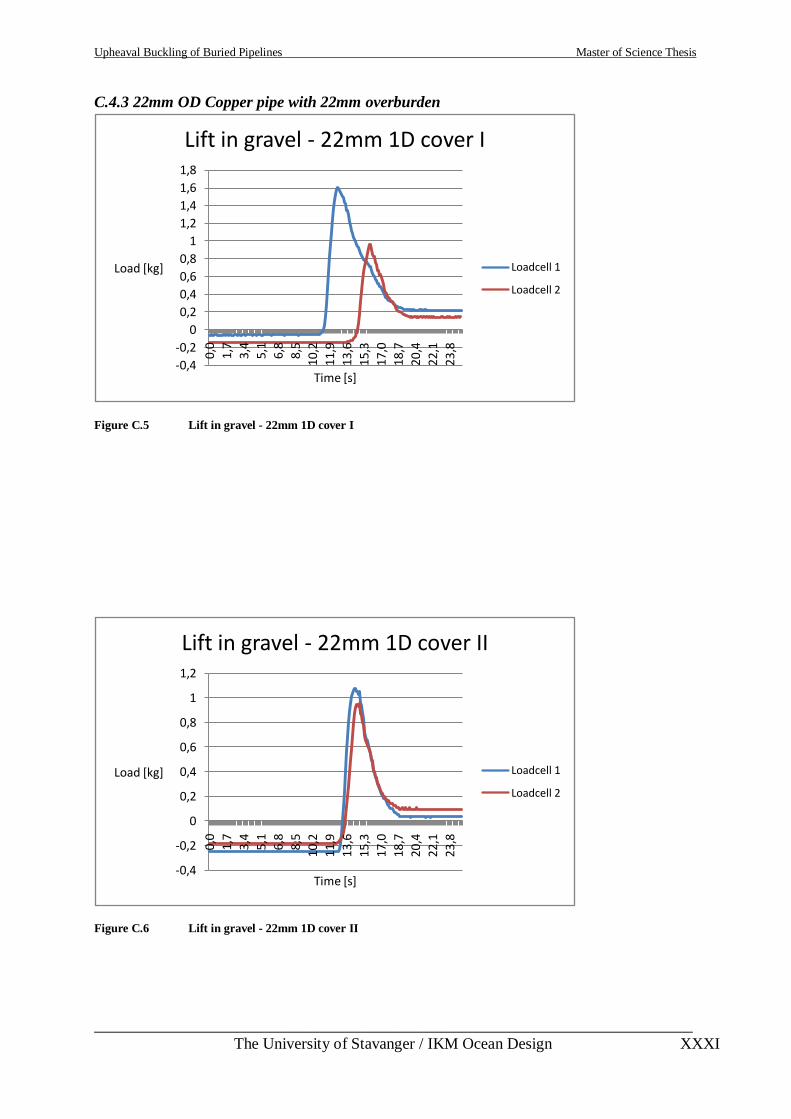
Upheaval Buckling of Buried Pipelines Master of Science Thesis
___________________________________________________________________________
The University of Stavanger / IKM Ocean Design XXXI
C.4.3 22mm OD Copper pipe with 22mm overburden
Figure C.5 Lift in gravel - 22mm 1D cover I
Figure C.6 Lift in gravel - 22mm 1D cover II
-0,4
-0,2
0
0,2
0,4
0,6
0,8
1
1,2
1,4
1,6
1,8
0,0
1,7
3,4
5,1
6,8
8,5
10,2
11,9
13,6
15,3
17,0
18,7
20,4
22,1
23,8
Load [kg]
Time [s]
Lift in gravel - 22mm 1D cover I
Loadcell 1
Loadcell 2
-0,4
-0,2
0
0,2
0,4
0,6
0,8
1
1,2
0,0
1,7
3,4
5,1
6,8
8,5
10,2
11,9
13,6
15,3
17,0
18,7
20,4
22,1
23,8
Load [kg]
Time [s]
Lift in gravel - 22mm 1D cover II
Loadcell 1
Loadcell 2
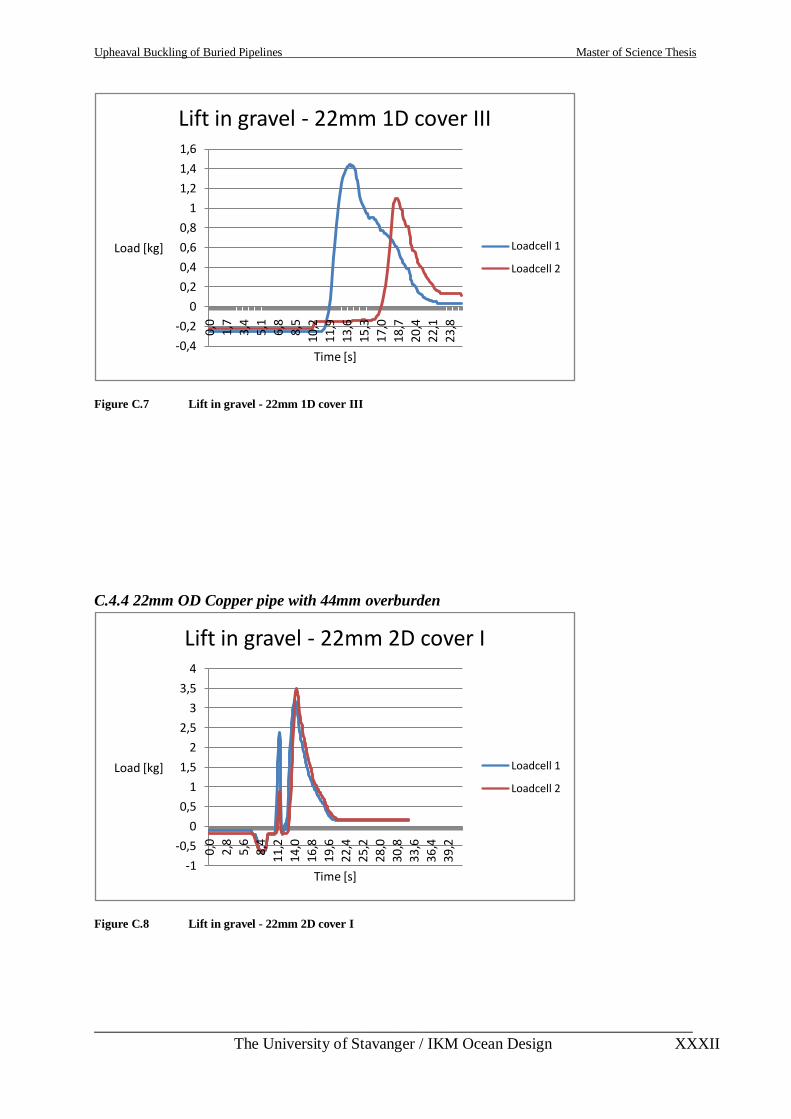
Upheaval Buckling of Buried Pipelines Master of Science Thesis
___________________________________________________________________________
The University of Stavanger / IKM Ocean Design XXXII
Figure C.7 Lift in gravel - 22mm 1D cover III
C.4.4 22mm OD Copper pipe with 44mm overburden
Figure C.8 Lift in gravel - 22mm 2D cover I
-0,4
-0,2
0
0,2
0,4
0,6
0,8
1
1,2
1,4
1,6
0,0
1,7
3,4
5,1
6,8
8,5
10,2
11,9
13,6
15,3
17,0
18,7
20,4
22,1
23,8
Load [kg]
Time [s]
Lift in gravel - 22mm 1D cover III
Loadcell 1
Loadcell 2
-1
-0,5
0
0,5
1
1,5
2
2,5
3
3,5
4
0,0
2,8
5,6
8,4
11,2
14,0
16,8
19,6
22,4
25,2
28,0
30,8
33,6
36,4
39,2
Load [kg]
Time [s]
Lift in gravel - 22mm 2D cover I
Loadcell 1
Loadcell 2
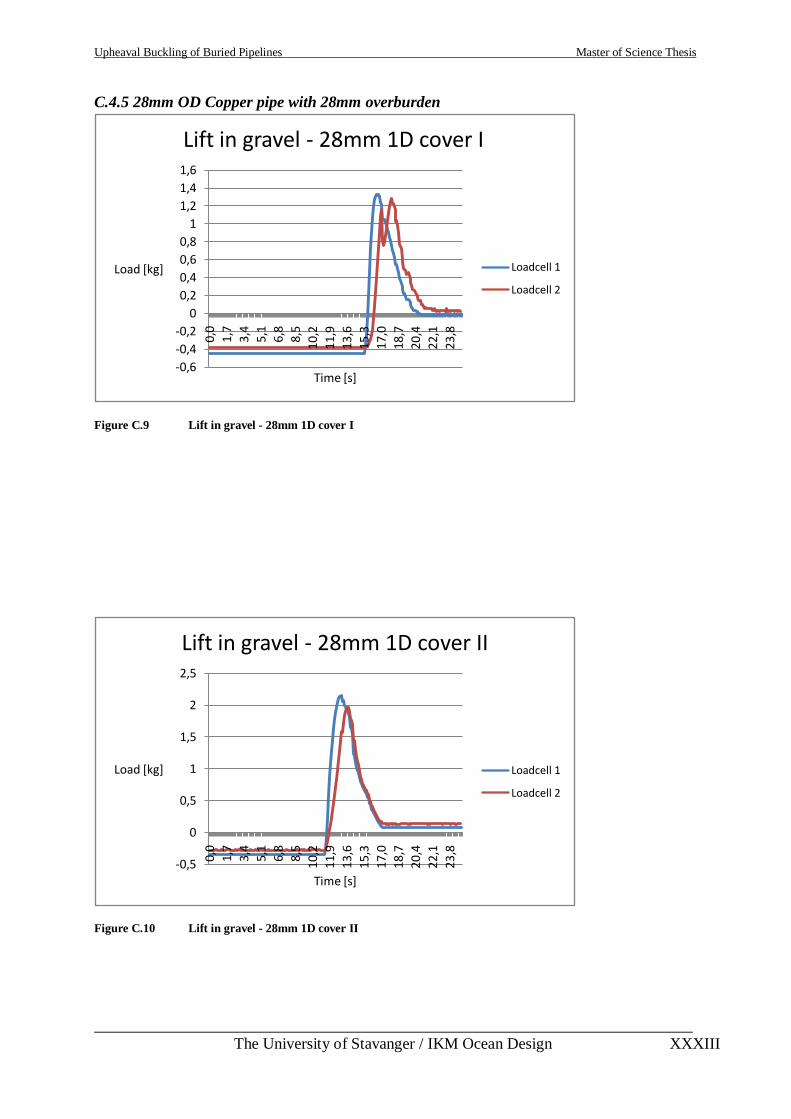
Upheaval Buckling of Buried Pipelines Master of Science Thesis
___________________________________________________________________________
The University of Stavanger / IKM Ocean Design XXXIII
C.4.5 28mm OD Copper pipe with 28mm overburden
Figure C.9 Lift in gravel - 28mm 1D cover I
Figure C.10 Lift in gravel - 28mm 1D cover II
-0,6
-0,4
-0,2
0
0,2
0,4
0,6
0,8
1
1,2
1,4
1,6
0,0
1,7
3,4
5,1
6,8
8,5
10,2
11,9
13,6
15,3
17,0
18,7
20,4
22,1
23,8
Load [kg]
Time [s]
Lift in gravel - 28mm 1D cover I
Loadcell 1
Loadcell 2
-0,5
0
0,5
1
1,5
2
2,5
0,0
1,7
3,4 5,1
6,8
8,5
10,2
11,9
13,6
15,3
17,0
18,7
20,4
22,1
23,8
Load [kg]
Time [s]
Lift in gravel - 28mm 1D cover II
Loadcell 1
Loadcell 2
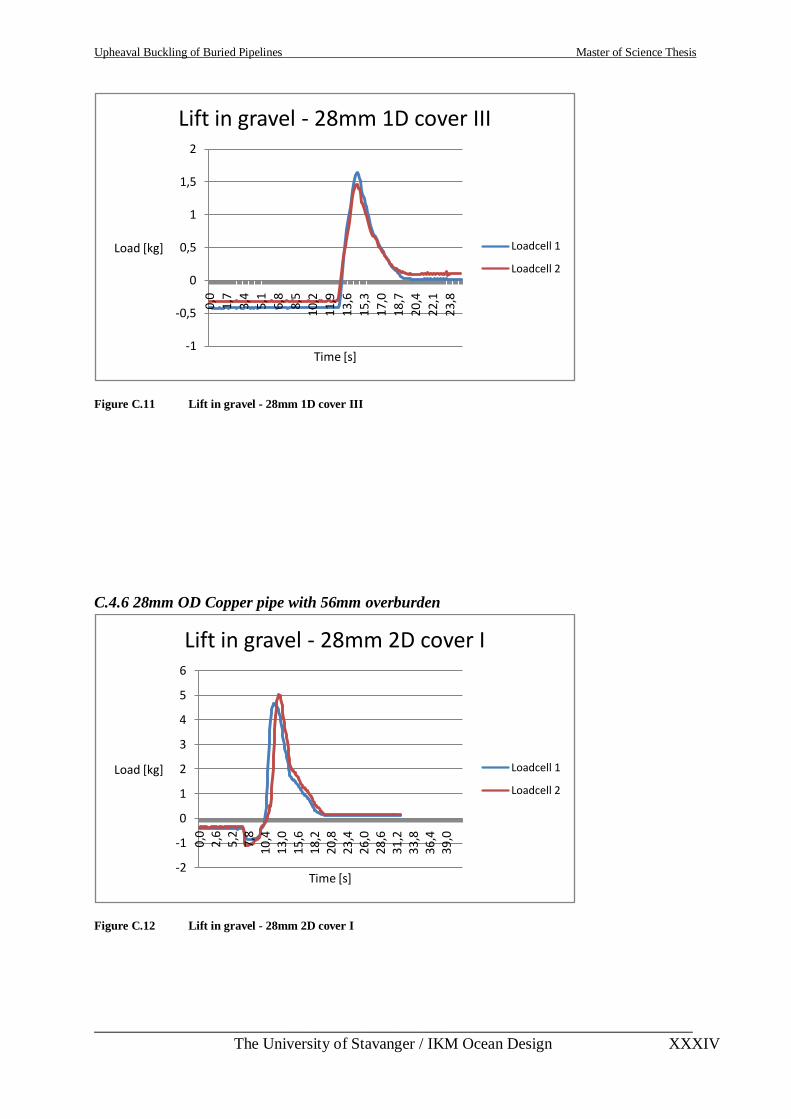
Upheaval Buckling of Buried Pipelines Master of Science Thesis
___________________________________________________________________________
The University of Stavanger / IKM Ocean Design XXXIV
Figure C.11 Lift in gravel - 28mm 1D cover III
C.4.6 28mm OD Copper pipe with 56mm overburden
Figure C.12 Lift in gravel - 28mm 2D cover I
-1
-0,5
0
0,5
1
1,5
2
0,0
1,7
3,4
5,1
6,8
8,5
10,2
11,9
13,6
15,3
17,0
18,7
20,4
22,1
23,8
Load [kg]
Time [s]
Lift in gravel - 28mm 1D cover III
Loadcell 1
Loadcell 2
-2
-1
0
1
2
3
4
5
6
0,0
2,6
5,2
7,8
10,
41
3,0
15,
618
,220
,82
3,4
26,
02
8,6
31,
23
3,8
36,
43
9,0
Load [kg]
Time [s]
Lift in gravel - 28mm 2D cover I
Loadcell 1
Loadcell 2
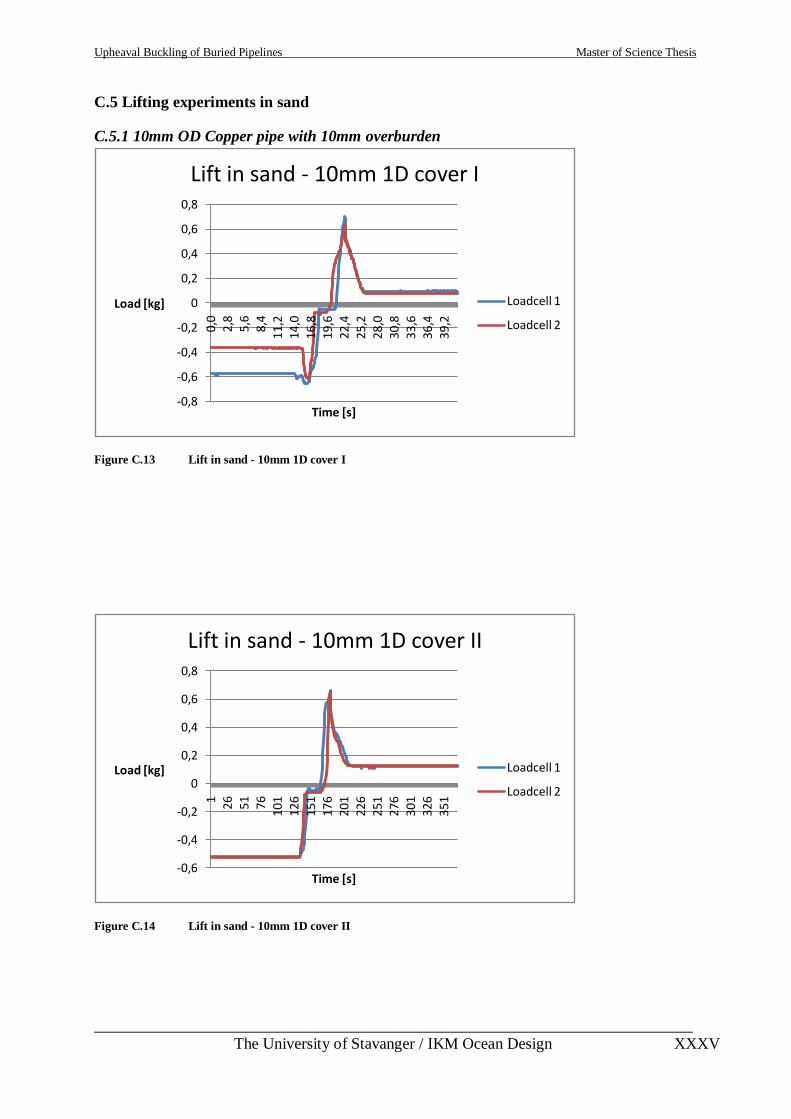
Upheaval Buckling of Buried Pipelines Master of Science Thesis
___________________________________________________________________________
The University of Stavanger / IKM Ocean Design XXXV
C.5 Lifting experiments in sand
C.5.1 10mm OD Copper pipe with 10mm overburden
Figure C.13 Lift in sand - 10mm 1D cover I
Figure C.14 Lift in sand - 10mm 1D cover II
-0,8
-0,6
-0,4
-0,2
0
0,2
0,4
0,6
0,80,
02,
85,
68,
411
,214
,016
,819
,622
,425
,228
,030
,833
,636
,439
,2
Load [kg]
Time [s]
Lift in sand - 10mm 1D cover I
Loadcell 1
Loadcell 2
-0,6
-0,4
-0,2
0
0,2
0,4
0,6
0,8
1 26 51 7610
112
615
117
620
122
625
127
630
132
635
1
Load [kg]
Time [s]
Lift in sand - 10mm 1D cover II
Loadcell 1
Loadcell 2
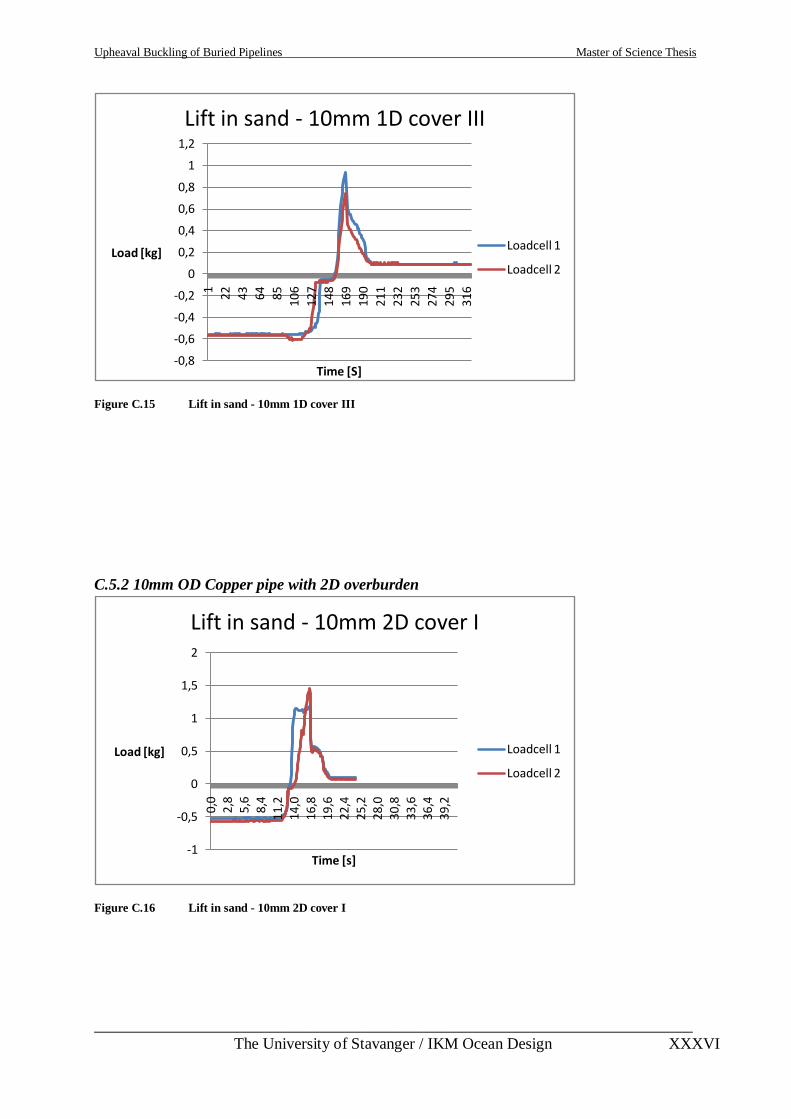
Upheaval Buckling of Buried Pipelines Master of Science Thesis
___________________________________________________________________________
The University of Stavanger / IKM Ocean Design XXXVI
Figure C.15 Lift in sand - 10mm 1D cover III
C.5.2 10mm OD Copper pipe with 2D overburden
Figure C.16 Lift in sand - 10mm 2D cover I
-0,8
-0,6
-0,4
-0,2
0
0,2
0,4
0,6
0,8
1
1,2
1
22 43 64 85 106
127
148
169
190
211
232
253
274
295
316
Load [kg]
Time [S]
Lift in sand - 10mm 1D cover III
Loadcell 1
Loadcell 2
-1
-0,5
0
0,5
1
1,5
2
0,0
2,8
5,6
8,4
11,2
14,0
16,8
19,6
22,4
25,2
28,0
30,8
33,6
36,4
39,2
Load [kg]
Time [s]
Lift in sand - 10mm 2D cover I
Loadcell 1
Loadcell 2
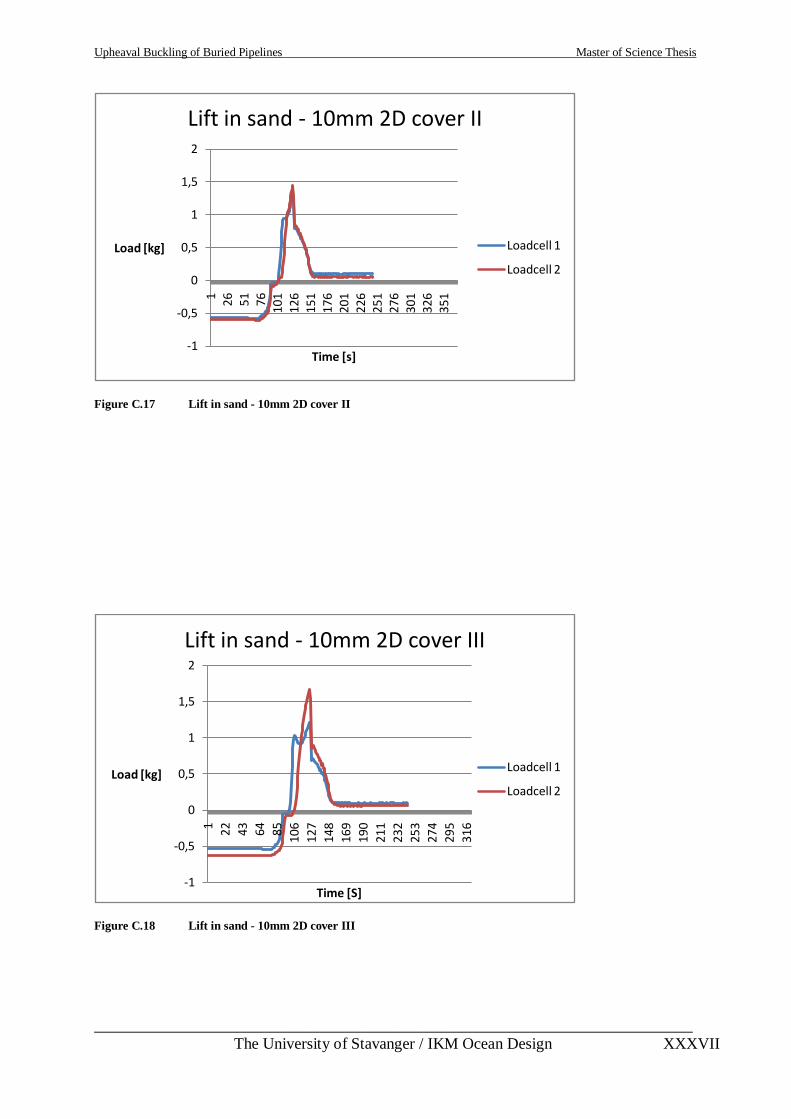
Upheaval Buckling of Buried Pipelines Master of Science Thesis
___________________________________________________________________________
The University of Stavanger / IKM Ocean Design XXXVII
Figure C.17 Lift in sand - 10mm 2D cover II
Figure C.18 Lift in sand - 10mm 2D cover III
-1
-0,5
0
0,5
1
1,5
2
1 26 51 7610
112
615
117
620
122
625
127
630
132
635
1
Load [kg]
Time [s]
Lift in sand - 10mm 2D cover II
Loadcell 1
Loadcell 2
-1
-0,5
0
0,5
1
1,5
2
1 22 43 64 85
106
127
148
169
190
211
232
253
274
295
316
Load [kg]
Time [S]
Lift in sand - 10mm 2D cover III
Loadcell 1
Loadcell 2
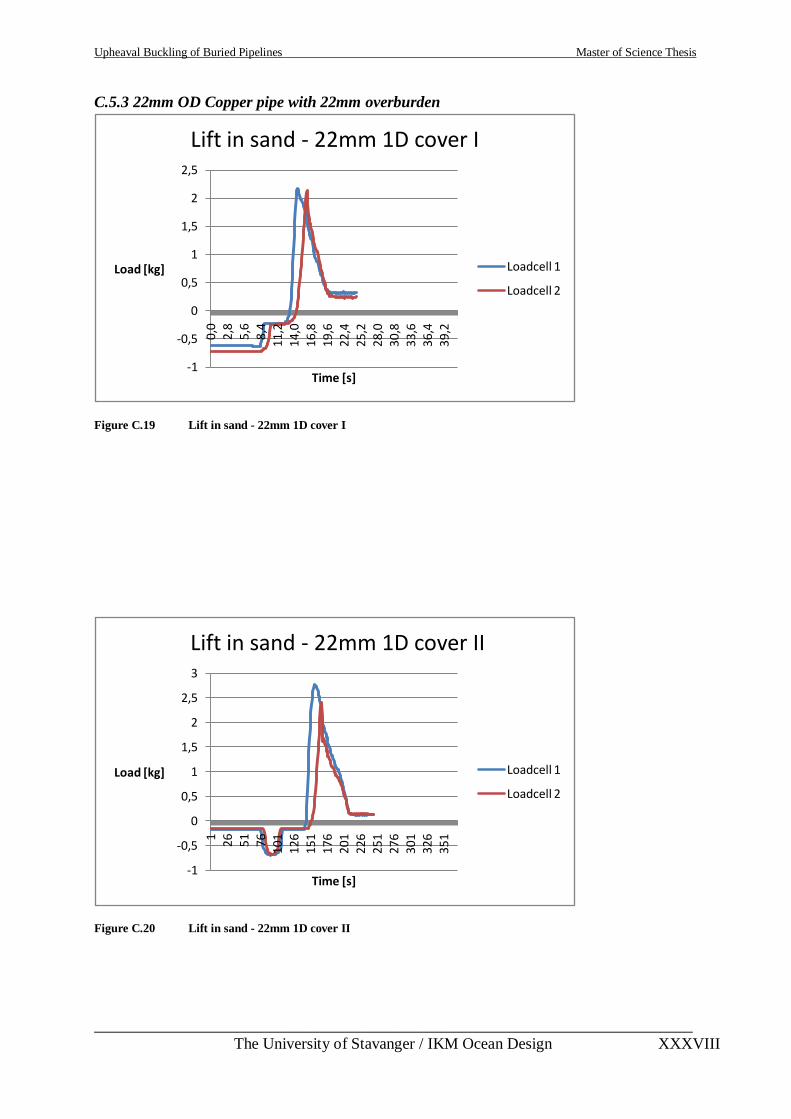
Upheaval Buckling of Buried Pipelines Master of Science Thesis
___________________________________________________________________________
The University of Stavanger / IKM Ocean Design XXXVIII
C.5.3 22mm OD Copper pipe with 22mm overburden
Figure C.19 Lift in sand - 22mm 1D cover I
Figure C.20 Lift in sand - 22mm 1D cover II
-1
-0,5
0
0,5
1
1,5
2
2,5
0,0
2,8
5,6
8,4
11,2
14,0
16,8
19,6
22,4
25,2
28,0
30,8
33,6
36,4
39,2
Load [kg]
Time [s]
Lift in sand - 22mm 1D cover I
Loadcell 1
Loadcell 2
-1
-0,5
0
0,5
1
1,5
2
2,5
3
1 26 51 7610
112
615
117
620
122
625
127
630
132
635
1
Load [kg]
Time [s]
Lift in sand - 22mm 1D cover II
Loadcell 1
Loadcell 2
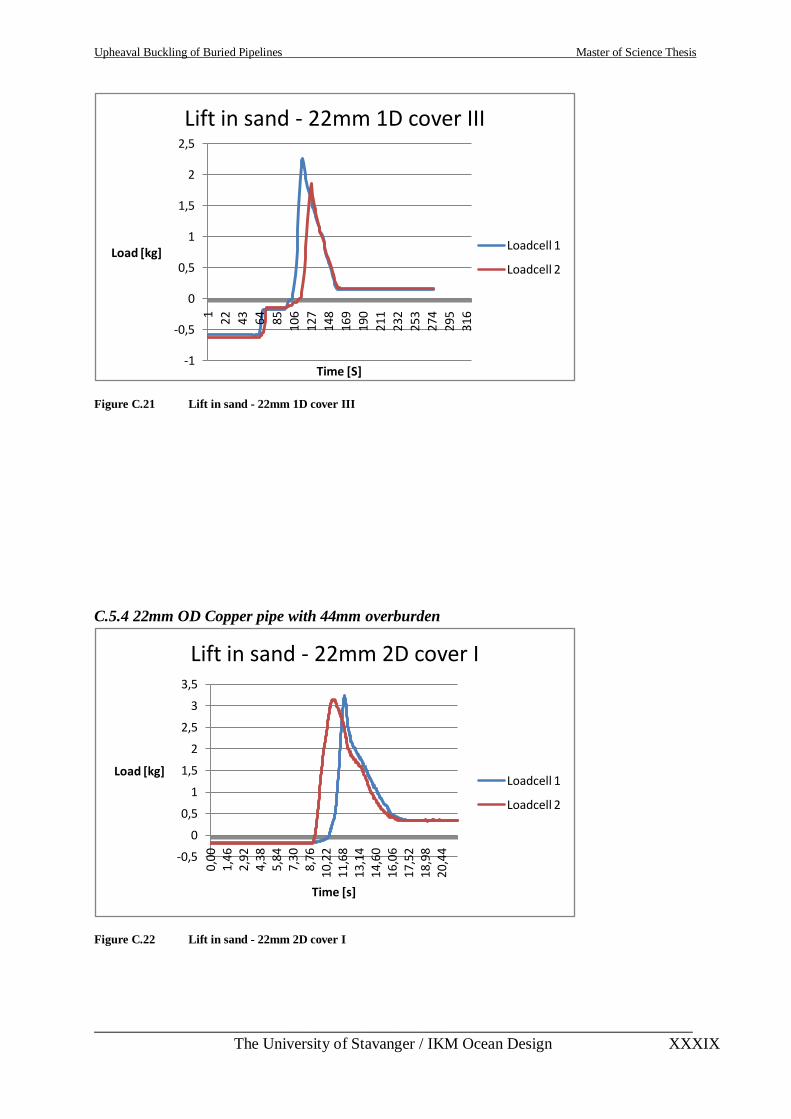
Upheaval Buckling of Buried Pipelines Master of Science Thesis
___________________________________________________________________________
The University of Stavanger / IKM Ocean Design XXXIX
Figure C.21 Lift in sand - 22mm 1D cover III
C.5.4 22mm OD Copper pipe with 44mm overburden
Figure C.22 Lift in sand - 22mm 2D cover I
-1
-0,5
0
0,5
1
1,5
2
2,5
1
22 43 64 85 106
127
148
169
190
211
232
253
274
295
316
Load [kg]
Time [S]
Lift in sand - 22mm 1D cover III
Loadcell 1
Loadcell 2
-0,5
0
0,5
1
1,5
2
2,5
3
3,5
0,0
01,
46
2,9
24,
38
5,84
7,3
08,
76
10,2
211
,68
13,1
414
,60
16,0
617
,52
18,9
820
,44
Load [kg]
Time [s]
Lift in sand - 22mm 2D cover I
Loadcell 1
Loadcell 2
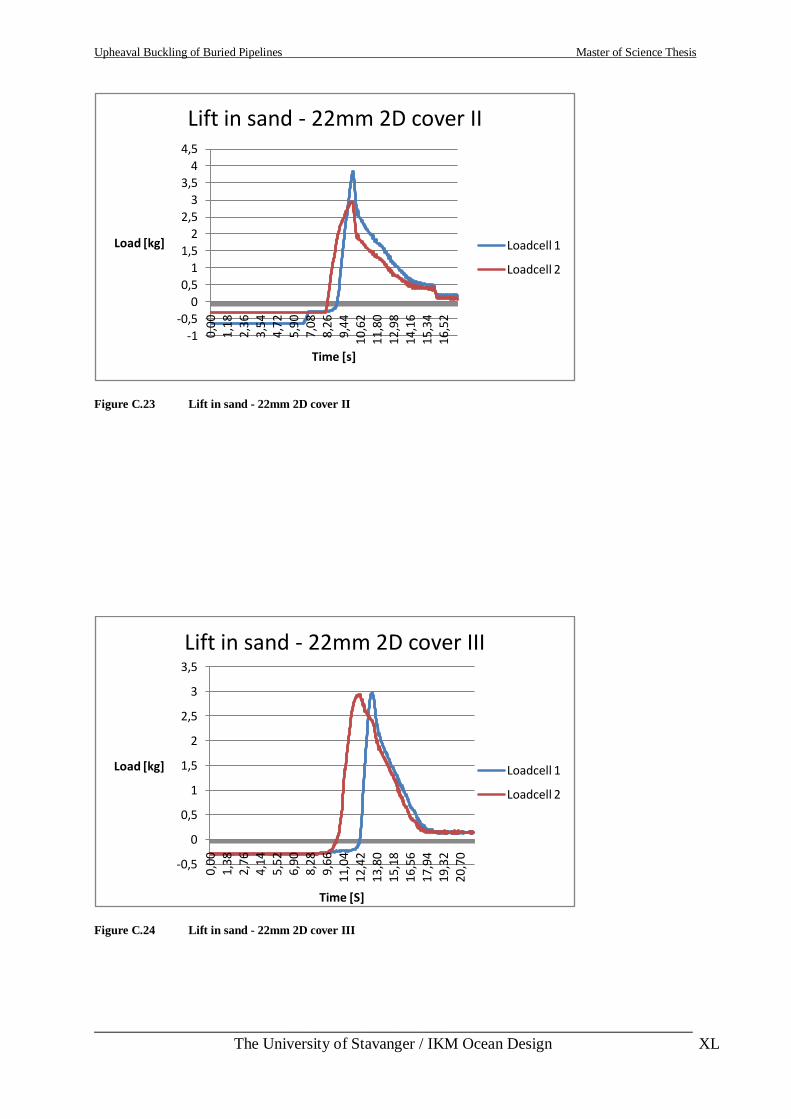
Upheaval Buckling of Buried Pipelines Master of Science Thesis
___________________________________________________________________________
The University of Stavanger / IKM Ocean Design XL
Figure C.23 Lift in sand - 22mm 2D cover II
Figure C.24 Lift in sand - 22mm 2D cover III
-1
-0,5
0
0,5
1
1,5
2
2,5
3
3,5
4
4,5
0,00
1,18
2,36
3,54
4,72
5,90
7,08
8,26
9,44
10,6
211
,80
12,9
814
,16
15,3
416
,52
Load [kg]
Time [s]
Lift in sand - 22mm 2D cover II
Loadcell 1
Loadcell 2
-0,5
0
0,5
1
1,5
2
2,5
3
3,5
0,0
01
,38
2,7
64
,14
5,5
26
,90
8,2
89
,66
11,0
412
,42
13,8
015
,18
16,5
617
,94
19,3
220
,70
Load [kg]
Time [S]
Lift in sand - 22mm 2D cover III
Loadcell 1
Loadcell 2
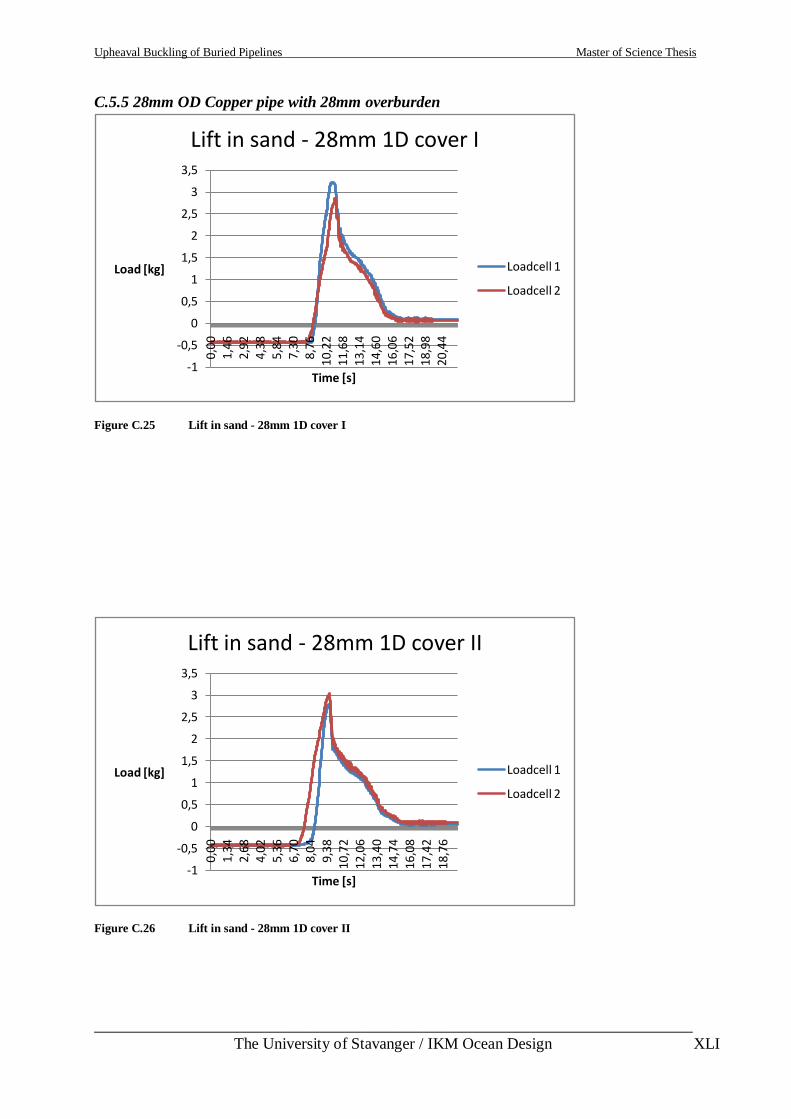
Upheaval Buckling of Buried Pipelines Master of Science Thesis
___________________________________________________________________________
The University of Stavanger / IKM Ocean Design XLI
C.5.5 28mm OD Copper pipe with 28mm overburden
Figure C.25 Lift in sand - 28mm 1D cover I
Figure C.26 Lift in sand - 28mm 1D cover II
-1
-0,5
0
0,5
1
1,5
2
2,5
3
3,5
0,00
1,46
2,92
4,38
5,84
7,30
8,76
10,2
211
,68
13,1
414
,60
16,0
617
,52
18,9
820
,44
Load [kg]
Time [s]
Lift in sand - 28mm 1D cover I
Loadcell 1
Loadcell 2
-1
-0,5
0
0,5
1
1,5
2
2,5
3
3,5
0,0
01
,34
2,6
84
,02
5,3
66
,70
8,0
49
,38
10,
721
2,06
13,
401
4,74
16,
081
7,42
18,
76
Load [kg]
Time [s]
Lift in sand - 28mm 1D cover II
Loadcell 1
Loadcell 2
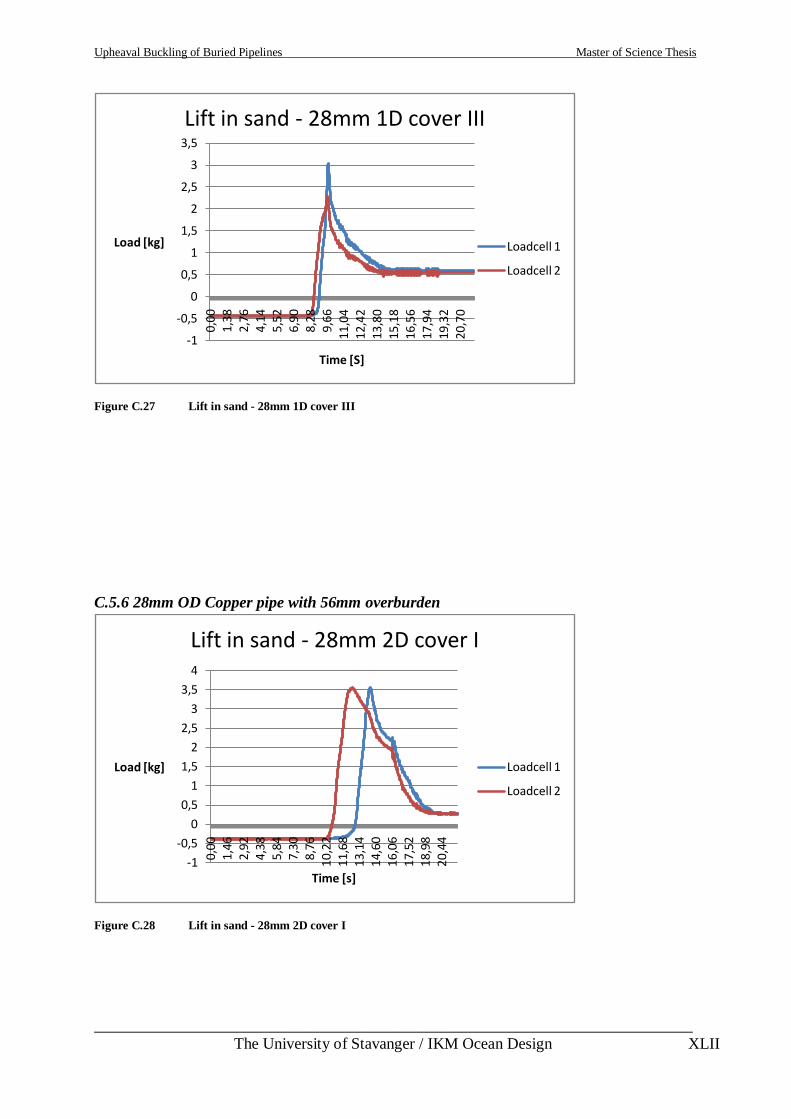
Upheaval Buckling of Buried Pipelines Master of Science Thesis
___________________________________________________________________________
The University of Stavanger / IKM Ocean Design XLII
Figure C.27 Lift in sand - 28mm 1D cover III
C.5.6 28mm OD Copper pipe with 56mm overburden
Figure C.28 Lift in sand - 28mm 2D cover I
-1
-0,5
0
0,5
1
1,5
2
2,5
3
3,5
0,00
1,38
2,76
4,14
5,52
6,90
8,28
9,66
11,0
412
,42
13,8
015
,18
16,5
617
,94
19,3
220
,70
Load [kg]
Time [S]
Lift in sand - 28mm 1D cover III
Loadcell 1
Loadcell 2
-1
-0,5
0
0,5
1
1,5
2
2,5
3
3,5
4
0,0
01
,46
2,9
24
,38
5,84
7,3
08
,76
10,2
211
,68
13,1
414
,60
16,0
617
,52
18,9
820
,44
Load [kg]
Time [s]
Lift in sand - 28mm 2D cover I
Loadcell 1
Loadcell 2
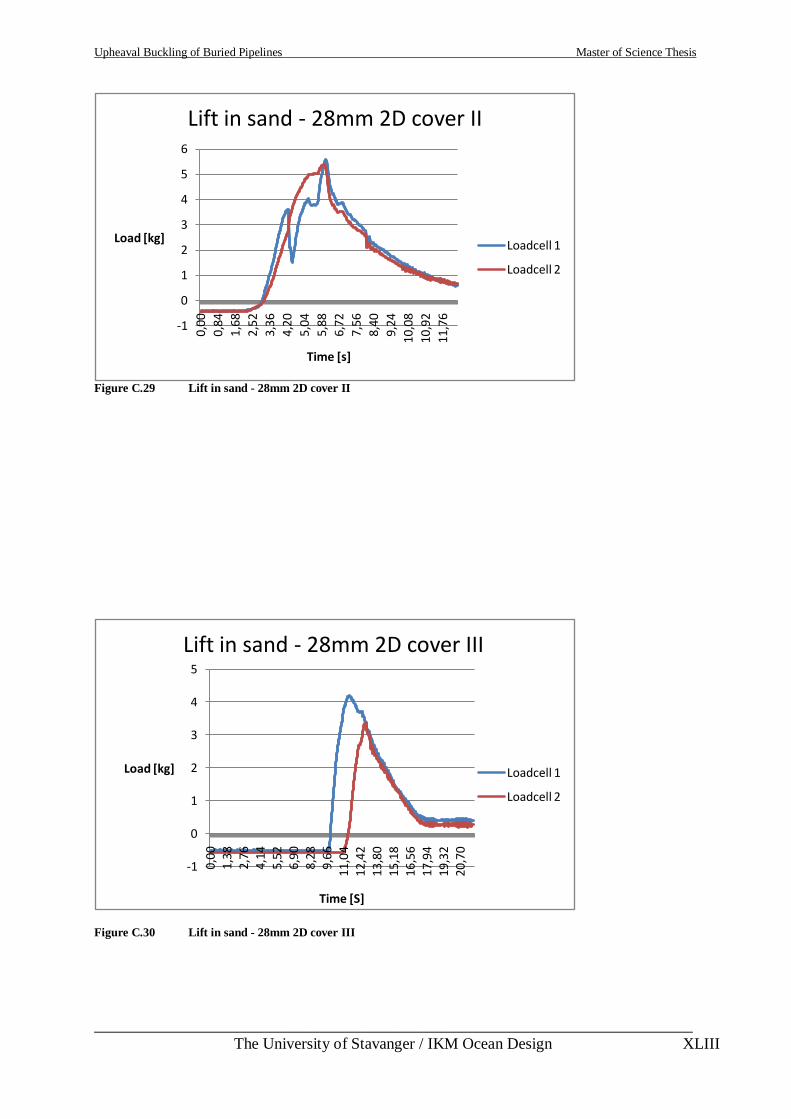
Upheaval Buckling of Buried Pipelines Master of Science Thesis
___________________________________________________________________________
The University of Stavanger / IKM Ocean Design XLIII
Figure C.29 Lift in sand - 28mm 2D cover II
Figure C.30 Lift in sand - 28mm 2D cover III
-1
0
1
2
3
4
5
6
0,00
0,84
1,68
2,52
3,36
4,20
5,04
5,88
6,72
7,56
8,40
9,24
10,0
8
10,9
2
11,7
6
Load [kg]
Time [s]
Lift in sand - 28mm 2D cover II
Loadcell 1
Loadcell 2
-1
0
1
2
3
4
5
0,0
01
,38
2,7
64
,14
5,5
26
,90
8,2
89
,66
11,
04
12,
42
13,
80
15,
18
16,
56
17,
94
19,
32
20,
70
Load [kg]
Time [S]
Lift in sand - 28mm 2D cover III
Loadcell 1
Loadcell 2
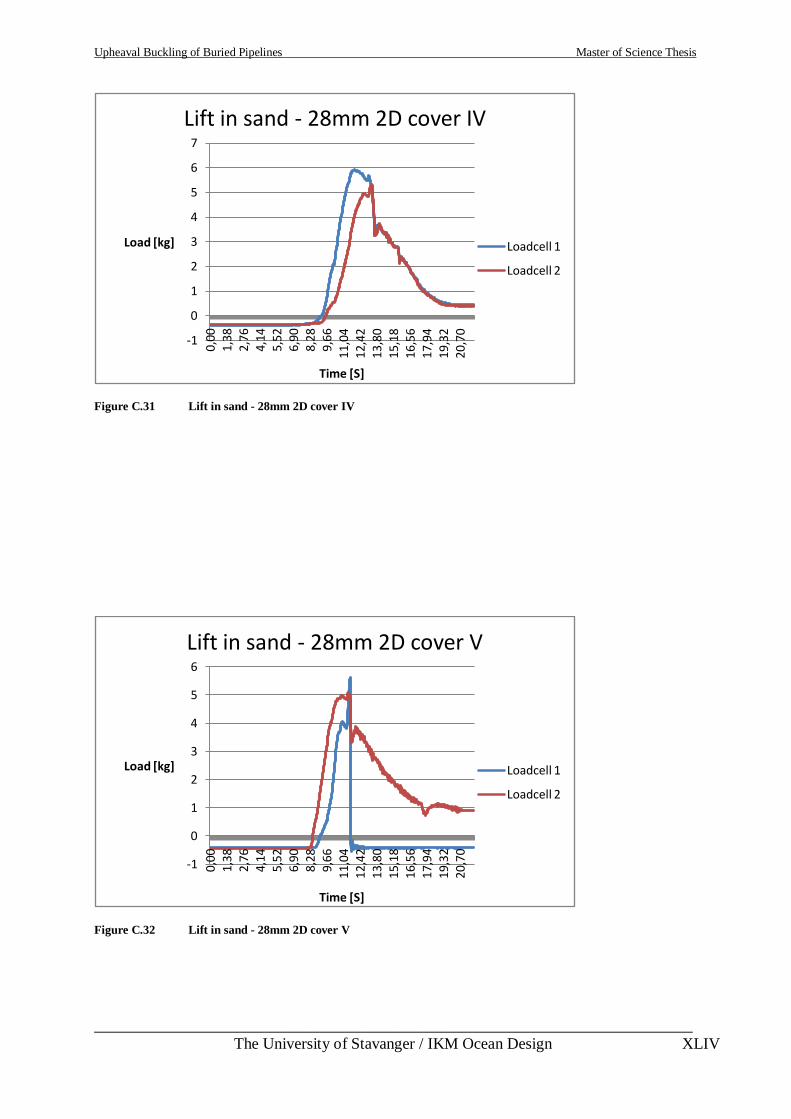
Upheaval Buckling of Buried Pipelines Master of Science Thesis
___________________________________________________________________________
The University of Stavanger / IKM Ocean Design XLIV
Figure C.31 Lift in sand - 28mm 2D cover IV
Figure C.32 Lift in sand - 28mm 2D cover V
-1
0
1
2
3
4
5
6
7
0,00
1,38
2,76
4,14
5,52
6,90
8,28
9,66
11,0
412
,42
13,8
015
,18
16,5
617
,94
19,3
220
,70
Load [kg]
Time [S]
Lift in sand - 28mm 2D cover IV
Loadcell 1
Loadcell 2
-1
0
1
2
3
4
5
6
0,0
01
,38
2,7
64
,14
5,5
26
,90
8,2
89
,66
11,0
412
,42
13,8
015
,18
16,5
617
,94
19,3
220
,70
Load [kg]
Time [S]
Lift in sand - 28mm 2D cover V
Loadcell 1
Loadcell 2
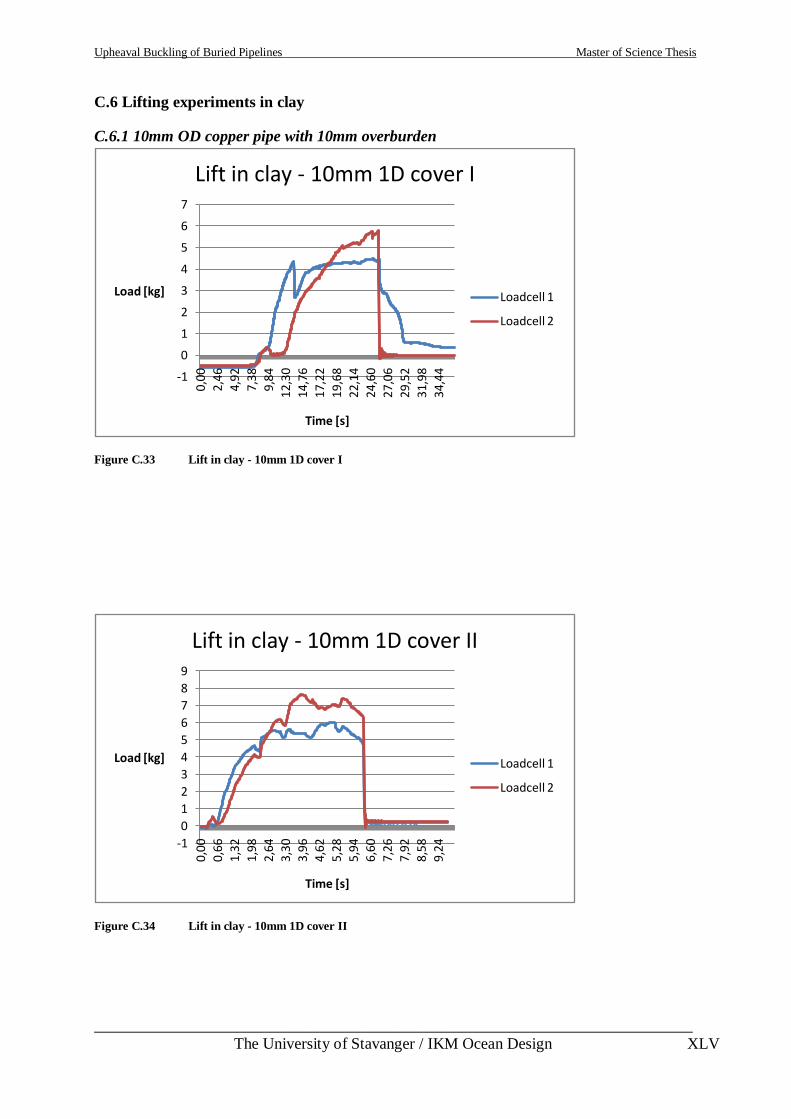
Upheaval Buckling of Buried Pipelines Master of Science Thesis
___________________________________________________________________________
The University of Stavanger / IKM Ocean Design XLV
C.6 Lifting experiments in clay
C.6.1 10mm OD copper pipe with 10mm overburden
Figure C.33 Lift in clay - 10mm 1D cover I
Figure C.34 Lift in clay - 10mm 1D cover II
-1
0
1
2
3
4
5
6
70,
00
2,46
4,92
7,38
9,84
12,3
0
14,7
6
17,2
2
19,6
8
22,1
4
24,6
0
27,0
6
29,5
2
31,9
8
34,4
4
Load [kg]
Time [s]
Lift in clay - 10mm 1D cover I
Loadcell 1
Loadcell 2
-1
0
1
2
3
4
5
6
7
8
9
0,0
0
0,6
6
1,3
2
1,9
8
2,6
4
3,30
3,9
6
4,6
2
5,2
8
5,9
4
6,6
0
7,2
6
7,9
2
8,5
8
9,24
Load [kg]
Time [s]
Lift in clay - 10mm 1D cover II
Loadcell 1
Loadcell 2
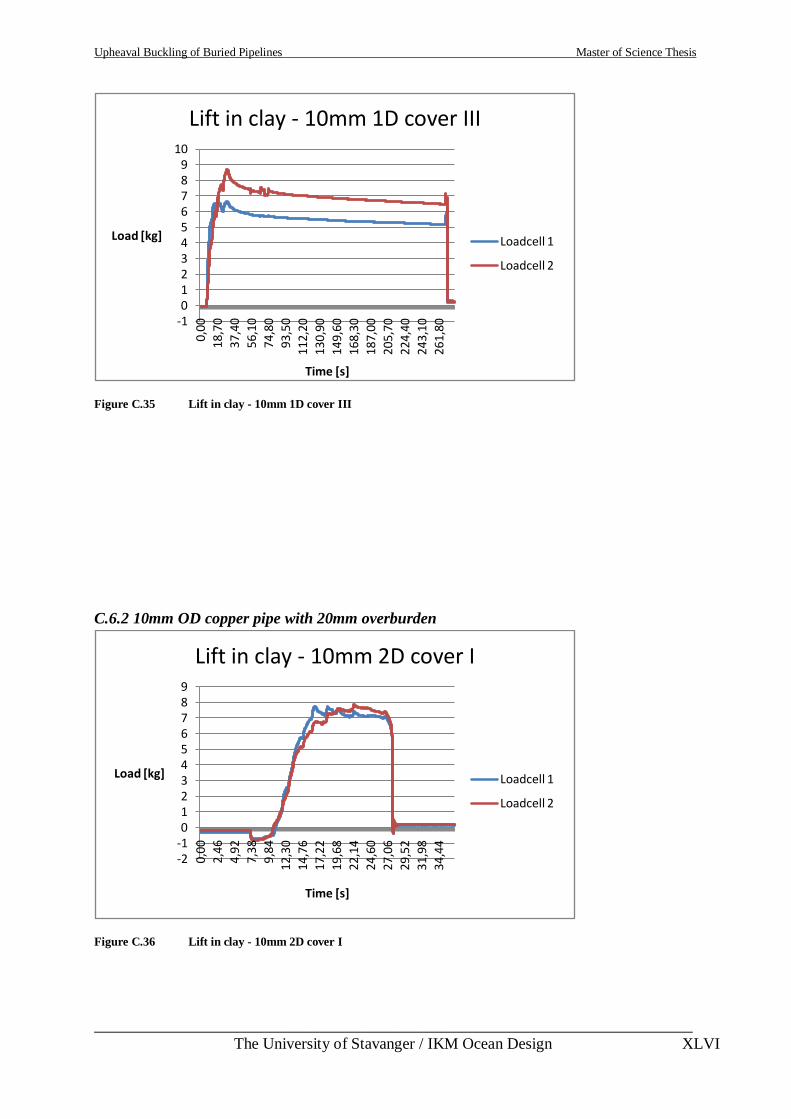
Upheaval Buckling of Buried Pipelines Master of Science Thesis
___________________________________________________________________________
The University of Stavanger / IKM Ocean Design XLVI
Figure C.35 Lift in clay - 10mm 1D cover III
C.6.2 10mm OD copper pipe with 20mm overburden
Figure C.36 Lift in clay - 10mm 2D cover I
-10123456789
10
0,00
18,7
0
37,4
0
56,1
0
74,8
0
93,5
0
112,
20
130,
90
149,
60
168,
30
187,
00
205,
70
224,
40
243,
10
261,
80
Load [kg]
Time [s]
Lift in clay - 10mm 1D cover III
Loadcell 1
Loadcell 2
-2-10123456789
0,00
2,46
4,92
7,38
9,84
12,
30
14,
76
17,2
2
19,
68
22,
14
24,6
0
27,
06
29,
52
31,9
8
34,
44
Load [kg]
Time [s]
Lift in clay - 10mm 2D cover I
Loadcell 1
Loadcell 2
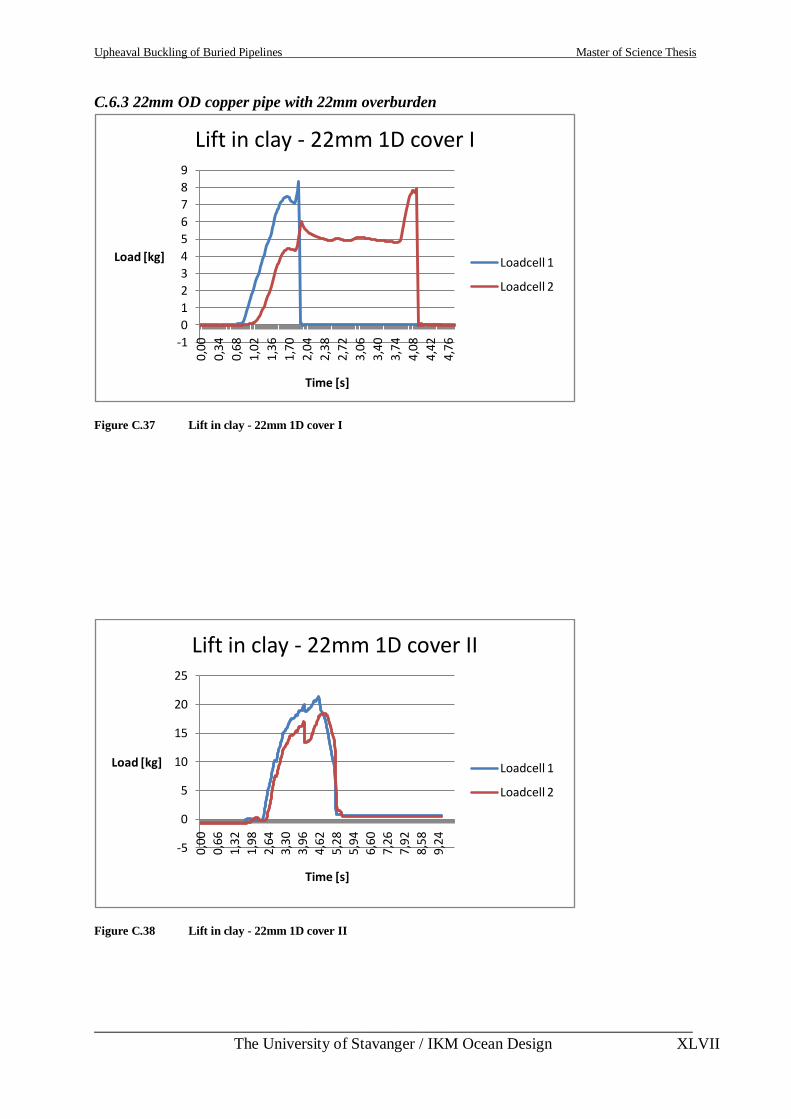
Upheaval Buckling of Buried Pipelines Master of Science Thesis
___________________________________________________________________________
The University of Stavanger / IKM Ocean Design XLVII
C.6.3 22mm OD copper pipe with 22mm overburden
Figure C.37 Lift in clay - 22mm 1D cover I
Figure C.38 Lift in clay - 22mm 1D cover II
-1
0
1
2
3
4
5
6
7
8
9
0,00
0,34
0,68
1,02
1,36
1,70
2,04
2,38
2,72
3,06
3,40
3,74
4,08
4,42
4,76
Load [kg]
Time [s]
Lift in clay - 22mm 1D cover I
Loadcell 1
Loadcell 2
-5
0
5
10
15
20
25
0,0
0
0,6
6
1,3
2
1,9
8
2,6
4
3,30
3,9
6
4,6
2
5,2
8
5,9
4
6,6
0
7,2
6
7,9
2
8,5
8
9,24
Load [kg]
Time [s]
Lift in clay - 22mm 1D cover II
Loadcell 1
Loadcell 2
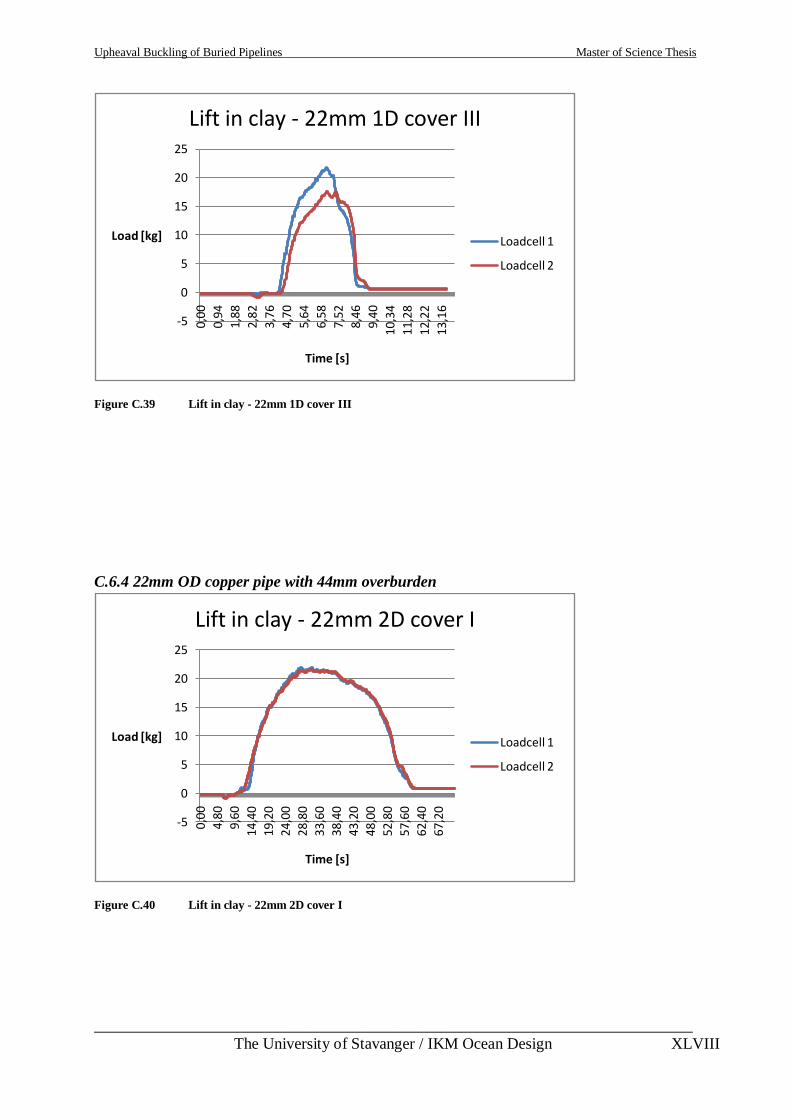
Upheaval Buckling of Buried Pipelines Master of Science Thesis
___________________________________________________________________________
The University of Stavanger / IKM Ocean Design XLVIII
Figure C.39 Lift in clay - 22mm 1D cover III
C.6.4 22mm OD copper pipe with 44mm overburden
Figure C.40 Lift in clay - 22mm 2D cover I
-5
0
5
10
15
20
25
0,00
0,94
1,88
2,82
3,76
4,70
5,64
6,58
7,52
8,46
9,40
10,3
4
11,2
8
12,2
2
13,1
6
Load [kg]
Time [s]
Lift in clay - 22mm 1D cover III
Loadcell 1
Loadcell 2
-5
0
5
10
15
20
25
0,0
0
4,8
0
9,6
0
14,4
0
19,2
0
24,0
0
28,8
0
33,6
0
38,4
0
43,2
0
48,0
0
52,8
0
57,6
0
62,4
0
67,2
0
Load [kg]
Time [s]
Lift in clay - 22mm 2D cover I
Loadcell 1
Loadcell 2
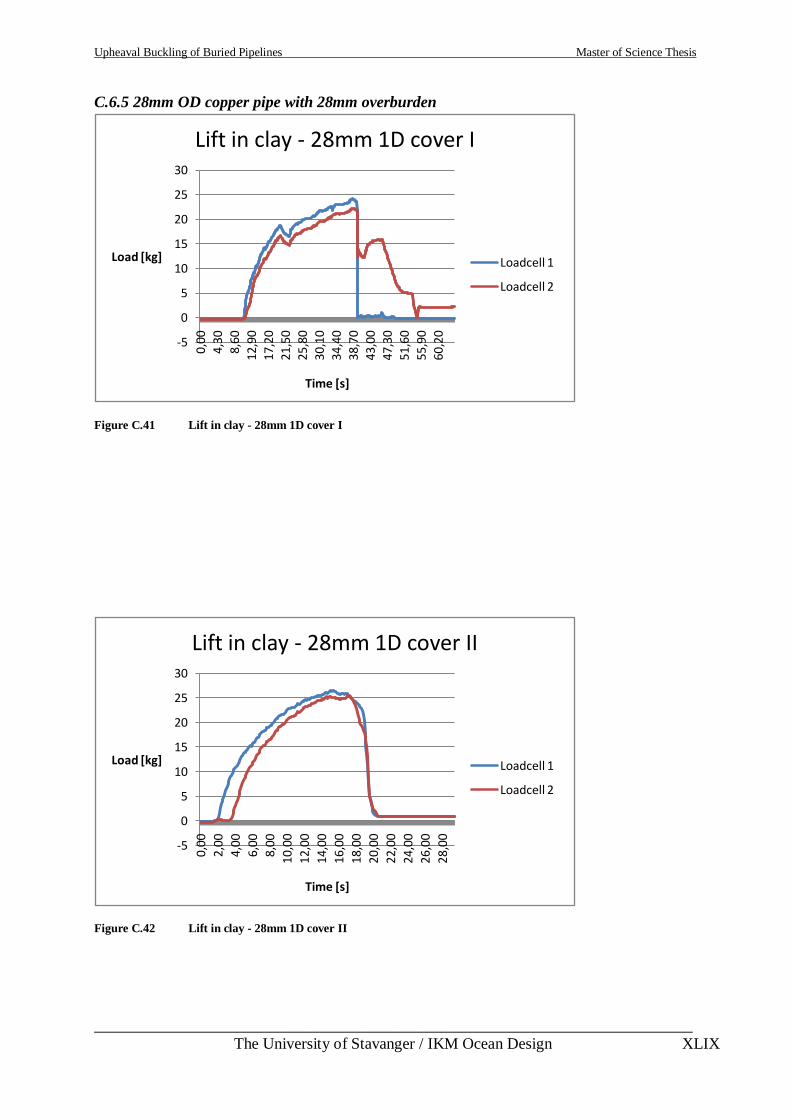
Upheaval Buckling of Buried Pipelines Master of Science Thesis
___________________________________________________________________________
The University of Stavanger / IKM Ocean Design XLIX
C.6.5 28mm OD copper pipe with 28mm overburden
Figure C.41 Lift in clay - 28mm 1D cover I
Figure C.42 Lift in clay - 28mm 1D cover II
-5
0
5
10
15
20
25
30
0,00
4,30
8,60
12,9
0
17,2
0
21,5
0
25,8
0
30,1
0
34,4
0
38,7
0
43,0
0
47,3
0
51,6
0
55,9
0
60,2
0
Load [kg]
Time [s]
Lift in clay - 28mm 1D cover I
Loadcell 1
Loadcell 2
-5
0
5
10
15
20
25
30
0,00
2,00
4,0
0
6,0
0
8,0
0
10,0
0
12,0
0
14,0
0
16,0
0
18,0
0
20,0
0
22,0
0
24,0
0
26,0
0
28,0
0
Load [kg]
Time [s]
Lift in clay - 28mm 1D cover II
Loadcell 1
Loadcell 2
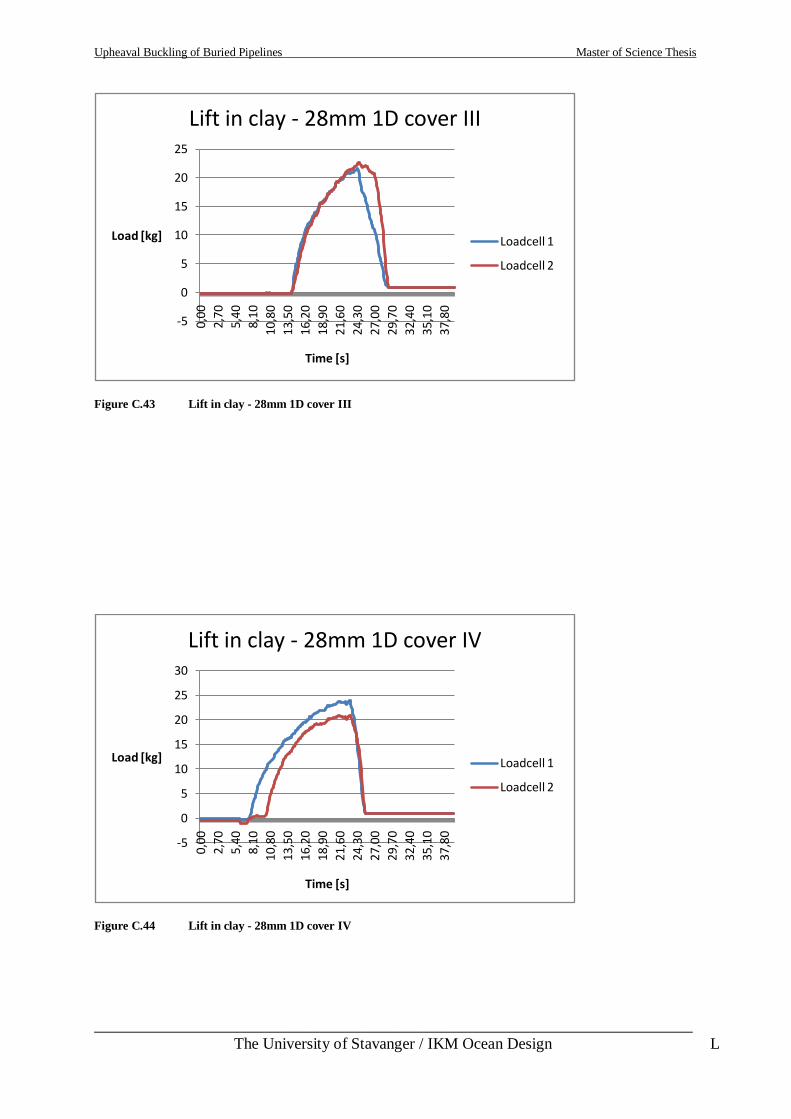
Upheaval Buckling of Buried Pipelines Master of Science Thesis
___________________________________________________________________________
The University of Stavanger / IKM Ocean Design L
Figure C.43 Lift in clay - 28mm 1D cover III
Figure C.44 Lift in clay - 28mm 1D cover IV
-5
0
5
10
15
20
25
0,00
2,70
5,40
8,10
10,8
0
13,5
0
16,2
0
18,9
0
21,6
0
24,3
0
27,0
0
29,7
0
32,4
0
35,1
0
37,8
0
Load [kg]
Time [s]
Lift in clay - 28mm 1D cover III
Loadcell 1
Loadcell 2
-5
0
5
10
15
20
25
30
0,0
0
2,70
5,4
0
8,1
0
10,8
0
13,5
0
16,2
0
18,9
0
21,6
0
24,3
0
27,0
0
29,7
0
32,4
0
35,1
0
37,8
0
Load [kg]
Time [s]
Lift in clay - 28mm 1D cover IV
Loadcell 1
Loadcell 2
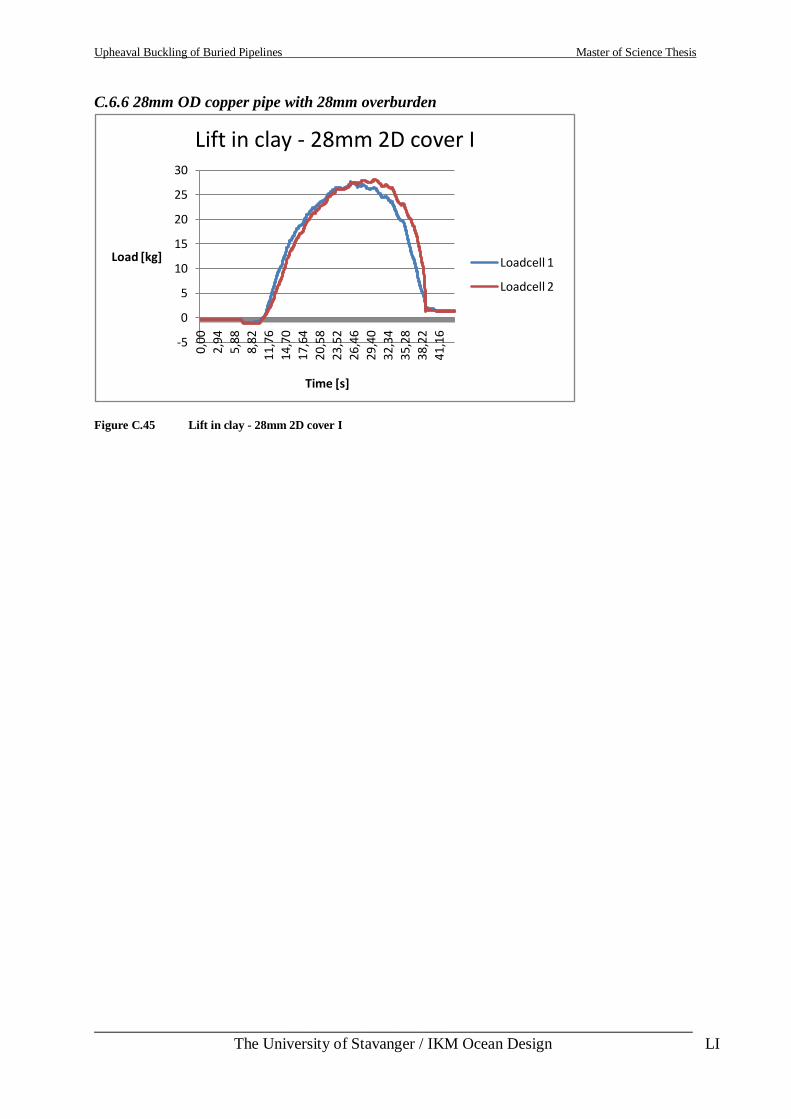
Upheaval Buckling of Buried Pipelines Master of Science Thesis
___________________________________________________________________________
The University of Stavanger / IKM Ocean Design LI
C.6.6 28mm OD copper pipe with 28mm overburden
Figure C.45 Lift in clay - 28mm 2D cover I
-5
0
5
10
15
20
25
30
0,00
2,94
5,88
8,82
11,7
6
14,7
0
17,6
4
20,5
8
23,5
2
26,4
6
29,4
0
32,3
4
35,2
8
38,2
2
41,1
6
Load [kg]
Time [s]
Lift in clay - 28mm 2D cover I
Loadcell 1
Loadcell 2
