on guidance and volatility - wharton accounting guidance and volatility* mary ... some argue that...
TRANSCRIPT

On Guidance and Volatility*
Mary Brooke Billings New York University
Robert Jennings Indiana University
Baruch Lev New York University [email protected]
October 2014
Abstract
Survey evidence suggests that managers choosing to provide earnings guidance do so in order to, among other things, dampen share price volatility. Yet, consultants and influential institutions strongly urge managers to cease guidance — citing a lack of evidence that guidance curbs volatility. Furthermore, recent research links guidance to increased volatility. Hence, some argue that guidance not only fails to promote market tranquility but may actually prompt turbulence. In this paper, we consider the interplay between guidance and volatility, focusing on guidance bundled with quarterly earnings, which now constitutes the vast majority of earnings guidance. Consistent with the notion that volatility concerns factor into managers’ decisions to provide earnings guidance, we find a consistent link between abnormal run-ups in volatility prior to an earnings release and the likelihood that a manager “bundles” a forecast with the firm’s earnings announcement. Our tests also indicate that managers’ efforts do not go unrewarded, as we document abnormally large post-announcement declines in volatility for guidance quarters. Collectively, our evidence supports the view that managers seek to and do mitigate share price volatility with guidance. Keywords: disclosure; earnings guidance; volatility; earnings announcements JEL Classification: G13; G14; M41
We thank Jerry Zimmerman (editor), an anonymous reviewer, John Bildersee, Ilan Guttman, Paul Healy, Bob Holthausen, Mike Kirschenheiter, Doug Skinner, Li Zhang (our NYU Summer Camp discussant), workshop participants at the University of Illinois at Chicago and participants at the 2013 NYU Summer Camp and the 2014 Penn State Accounting Research Conference for helpful suggestions.
* Corresponding author: Mary Billings, New York University, Stern School of Business, Suit 10-94, 44 West Fourth Street, New York, NY 10012. Telephone: 212-998-0097. Fax: 212-995-4004. E-mail: [email protected].
1. Introduction
Theoretical models indicate that managers may engage in voluntary disclosure in order to
decrease information asymmetry (Diamond 1985; Diamond and Verrecchia 1991) and to reduce
investor uncertainty (Verrecchia 1983; Lewellen and Shanken 2002; Pastor and Veronesi 2003).
When surveyed about their ongoing communication with investors, managers often express
concern about excessive share price volatility, which is widely believed to enhance investors’
risk perceptions about the firm. Many managers aim to dampen volatility and improve their
firm’s information environment with guidance (Graham, Harvey and Rajgopal 2005; McKinsey
survey 2006). Furthermore, executives often mention guidance’s effectiveness in promoting a
reputation for transparency, attracting analyst following, and constraining price volatility, when
explaining why they are committed to guidance (Graham et al. 2005; Johnson 2009; National
Investor Relations Institute 2009).1 Thus, from some managers’ points of view, reducing
uncertainty and share price volatility is an important objective and guidance is an effective
means for achieving this objective.
Consistent with various hypothesized guidance benefits, recent work connects earnings
guidance with the reduction of litigation risk (Billings and Cedergren 2014), the attraction of
analyst coverage (Anantharaman and Zhang 2011), economically meaningful improvements in
liquidity (Balakrishnan et al. 2014), and compliance with disclose-or-abstain trading regulations
(Li, Wasley and Zimmerman 2014).2 Yet, consultants and influential institutions (including
McKinsey, Deloitte, the Business Roundtable and the CFA Institute) advise against providing
guidance — citing potential litigation and market penalties associated with missed earnings
targets, as well as a lack of evidence that disclosure actually curbs volatility (McKinsey 2006).
1 In support of this survey evidence, research finds that managers of guiding firms respond to the loss of analyst coverage with increased guidance (Anantharaman and Zhang 2011; Balakrishnan, Billings, Kelly and Ljungqvist 2014). 2 Prior work also links improvements in analysts’ ratings of firms’ disclosure policies to capital market benefits (Lang and Lundholm 1993, 1996; Healy et al. 1999; Healy and Palepu 2001).
1
Moreover, recent research offers support for these objections, linking negative guidance to
increased volatility (Rogers, Skinner and Van Buskirk 2009) and increased crash risk (Hamm, Li
and Ng 2014).3 Consequently, while some argue that managers may use guidance to positively
shape their firm’s information environment (and there is empirical evidence in support of this
view), others contend that guidance not only fails to promote tranquility, but may actually
prompt turbulence.
Weighing in on this debate, we investigate the interplay between share price volatility
and the decision to bundle a forecast with the current quarter’s earnings announcement. In
particular, as shown in Panel A of Figure 1, we examine (1) whether abnormal increases in
volatility are associated with the decision to bundle a forecast with current-quarter earnings
news, and (2) how volatility changes after the issuance of a bundled forecast compare to
volatility changes in quarters in which earnings are released without guidance.
Our analyses examine a sample of 107,307 quarterly earnings announcements made
during the decade since Regulation Fair Disclosure (“Reg FD”) took effect in October of 2000.
In our empirical tests, we compare the volatility dynamics surrounding quarterly earnings
announcements bundled with guidance to quarterly earnings announcements without guidance.
Recognizing that not all managers may seek to quiet volatility (So 2013), our tests concentrate on
firms with a demonstrated willingness to guide. Thus, because we aim to predict when a firm
with a demonstrated willingness to guide chooses to supply guidance (as opposed to if a firm
chooses to be a guiding firm), we use firms’ guiding histories to narrow our focus to the firm-
quarters in which guiding firms choose whether to guide or not.
As mentioned, recent work examines volatility surrounding unbundled forecasts (Rogers
et al. 2009) and studies a yearly count of annual earnings forecasts in the context of crash risk 3 Rogers et al. (2009) document a link between bad news warnings and increased volatility surrounding the warning. Nonetheless, their multivariate tests do not speak to whether a positive or confirming forecast links to increased volatility surrounding the forecast. Rather, their tests document greater increases in uncertainty surrounding bad news forecasts as compared to the changes in uncertainty surrounding positive/confirming forecasts (see their Table 5).
2
(Hamm et al. 2014). Our research design, in contrast, focuses on whether a bundled quarterly or
annual forecast is given and the volatility dynamics surrounding that forecast. We do so for
three main reasons. First, the overwhelming majority of guidance now arrives bundled with a
quarterly earnings release. Over our sample period, approximately 80% of all forecasts are
bundled and, in later years, the proportion climbs above 90%. Accordingly, the decision to guide
increasingly appears to be made on a quarterly (as opposed to a day-to-day) basis. At the same
time, forecasts of quarterly earnings represent nearly half of all post-Reg-FD guidance. Thus,
bundled forecasts of both quarterly and annual earnings offer the most representative sample of
recent guidance practices. Consistent with this notion, Rogers and Van Buskirk (2013)
document the recent shift in guidance practices toward the issuance of bundled forecasts and
caution against drawing inferences from non-representative samples of unbundled guidance.
Second, in contrast to prior work’s focus on the volatility changes surrounding
unbundled forecasts (as depicted in Panel B of Figure 1), in this study we separate pre-forecast
changes from post-forecast changes in volatility (as depicted in Panel A of Figure 1).
Disentangling the change in volatility surrounding the forecast into two distinct windows (pre-
and post-guidance) allows us to examine the role that volatility plays in prompting firms to
guide. Further, and just as important, this measurement precision allows us to control for pre-
forecast movements in volatility when examining post-forecast volatility changes. Absent efforts
to separate pre-guidance changes from post-guidance changes in volatility, tests examining the
link between guidance and volatility are biased in favor of finding a positive relation if managers
issue forecasts in response to some other volatility-provoking event and the measurement
window commingles pre-guidance movement with post-guidance movement.
Finally, earnings announcements are well-defined information events that occur routinely
for all firms and, as such, we have a wealth of prior research to help guide the inclusion of
control variables in our analyses (Bushee et al. 2010). Thus, in our analyses, we rely on
3
established findings to help us consider (and later control for) the determinants of the decision to
guide.4
Supporting the notion that volatility concerns factor into managers’ quarterly decisions to
guide, we find that earnings news is more likely to be bundled with guidance when the release
follows an abnormal run-up in forward-looking stock price volatility. Apparently, in an attempt
to calm a particularly turbulent pre-earnings release information environment, some managers
choose to accompany current-quarter earnings news with forward-looking guidance. Shifting
attention to the effectiveness of managers’ guidance efforts, we find no evidence that guidance
fuels volatility. To the contrary, we document that earnings releases bundled with guidance are
associated with abnormally large post-announcement reductions in volatility—after controlling
for both the run-up in pre-announcement volatility and the average (typical) post-announcement
rundown in volatility.
Evidence of a link between pre-announcement run-ups in volatility and the decision to
guide is consistent with: (1) managers reacting to the rising volatility with guidance, and/or (2)
investors anticipating the arrival of a forecast (and its impact on prices). Because we are
interested in documenting the presence of the former effect, we make a number of adjustments to
our research design in an effort to control for (or hold constant) investors’ expectation of
guidance (the latter effect). Most notably, all of our regressions explaining current-quarter
guidance include the average run-up in volatility for the prior four quarters. This average run-up
serves as a proxy for the expected (and well-documented) run-up around earnings
announcements and allows the current-quarter run-up to capture the abnormal increase in
uncertainty. At the same time, all of our regressions explaining post-announcement reductions in
4 Prior work (i.e., Rogers et al. 2009) aims to control for the endogeneity of managers’ disclosure decisions by matching on the gap in earnings expectations faced by managers. In our analyses, we control for various determinants of managers’ decisions to issue guidance documented by recent work (i.e., Rogers and Van Buskirk 2013) and augment their model to control for other factors, most notably, the extent to which the firm recently and frequently supplied both bundled and unbundled guidance, as well as the presence of “disclose-or-abstain” insider trading incentives (as discussed in Li et al. 2014). See Section 5 for further discussion.
4

volatility control for the current-quarter run-up in volatility as well as the average rundown in
volatility from the prior four quarters. This allows our tests to link guidance to abnormally large
reversions in volatility.
In a further effort to hold constant the market’s expectation of guidance, we re-estimate
our regressions focusing on subsamples where investors are more or less likely to anticipate
guidance. Focusing on the subset of “committed” guiders for which guidance is more likely to
be expected (as measured by the presence of a bundled forecast in the same quarter of last year
as well as the presence a bundled forecast last quarter), we find that 87.2% of firms bundle in the
current quarter. Yet, we continue to find that an abnormally low run-up in current quarter
volatility predicts the quarters in which these firms that bundle almost 9 out of every 10 quarters
(and for which bundling should be largely expected by the market) choose not to bundle. In
contrast, focusing on the subset of “occasional” guiders for which guidance is less likely to be
expected (as measured by the absence of a bundled forecast in the same quarter of last year as
well as the absence of a bundled forecast last quarter), we find that only 24.2% of firms bundle in
the current quarter. Yet again we find strong evidence of a positive association between
abnormal run-ups and the decision to bundle. Taken collectively, these subsample tests provide
further support for the notion that abnormal changes in volatility explain the quarters in which
guiding firms choose to bundle or choose to remain silent.5
As mentioned earlier, because earnings announcements are well-researched information
events, we also conduct a number of additional tests in an effort to control for well-documented,
contemporaneous effects. As noted by Rogers et al. (2009), under the “expectations adjustment
hypothesis” of Ajinkya and Gift (1984), managers are more likely to provide guidance when
investors’ earnings expectations differ from their own. Consequently, in addition to holding
5 Further, focusing on the 8,039 (2,542) firm-quarters in which guiding firms supply unbundled (uncontaminated, unbundled) guidance during the quarter, we also find evidence of an abnormal run-up in volatility prior to the decision to provide unbundled guidance.
5

constant investors’ expectations of guidance as discussed above, we also control for managers’
use of guidance to adjust gaps in investors’ expectations of earnings by limiting analysis to firm-
quarter observations in which (1) firms report no current-quarter earnings surprise and (2)
managers either remain silent or bundle a neutral/confirming forecast with the current-quarter, no
surprise earnings news, (i.e., no “expectation adjustment”). In these “no news” firm-quarters, we
find that managers are still more likely to bundle a confirming forecast (as opposed to remain
silent) in the presence of an abnormal run-up in volatility.6
In other words, an abnormal increase in uncertainty explains when managers bundle
verbal indications of their agreement with the market’s expectations of their future earnings
versus when managers tacitly confirm their agreement with the market’s expectations via silence.
Further, we continue to find that the abnormal rundown in volatility is greater when managers
bundle verbal indications of their agreement with the market’s expectations of their future
earnings than when managers tacitly confirm their agreement with the market’s expectations via
their silence. Consequently, we view this evidence as supporting the notion that explicit (verbal)
guidance that confirms the consensus has a volatility benefit that exceeds the benefit of implicit
(non-verbal) agreement with the prevailing consensus.
In summary, all of our findings hold: (1) when we limit variation in the extent to which
investors might (might not) reasonably anticipate guidance by examining committed (occasional)
guiders (i.e., when we control for the likelihood of guidance), (2) when we focus exclusively on
the firm-quarters when the decision to guide versus remain silent is unlikely to be influenced by
current-quarter earnings news (i.e., when we control for contemporaneous earnings news), and
(3) when managers do not appear to be using guidance to adjust gaps in earnings expectations
6 Consistent with the notion that focusing on “no news” firm-quarters (as measured by the absence of a current-quarter earnings surprise and either the absence of a bundled forecast or the presence of a neutral confirming forecast) holds constant contemporaneous news, we detect no significant differences in the means, medians or standard deviations of the 3- or 5-day abnormal return surrounding the report date of quarterly earnings when we compare the bundled (i.e., neutral/confirming guidance) quarters to the non-bundled (silent) quarters.
6
(i.e., when we control for the expectations gap faced by managers). Thus, our evidence
consistently supports the view that managers seek to and do mitigate share price volatility with
guidance. Consequently, this paper provides evidence of a major stated motive for guidance and
documents evidence consistent with the presence of an important benefit to guidance.
The remainder of this paper progresses as follows. Section 2 reviews the relevant
literature and presents our predictions. Section 3 discusses our data and Section 4 provides
descriptive statistics. Section 5 presents our findings concerning the motives of guidance.
Section 6 discusses alternative explanations. Section 7 presents findings on the consequences of
guidance. Section 8 concludes the study.
2. Related Literature and Hypotheses
Patell and Wolfson (1976, 1981) document that implied volatility increases before an
earnings announcement and subsequently falls, while Rogers et al. (2009) document a similar
pattern surrounding bundled forecasts. Shifting attention to unbundled forecasts, Rogers et al.
(2009) observe a rise in pre-issuance volatility, but note that volatility remains elevated thereafter
(see their Figure 2 on page 96). Thus, this work establishes that volatility escalates before the
market receives a management forecast, but leaves open the important question of whether this
pre-forecast rise in volatility reflects investors’ expectation of a the forthcoming forecast, or if
the pre-forecast rise in volatility motivates managers to issue a forecast aimed at calming the
market. As Rogers et al. (2009) observe:
“This increase in volatility likely occurs for two reasons. First, the sample includes some regular forecasts for which timing is predictable. Second, forecasts may be issued in response to some other event that caused an increase in volatility.” (footnote 13 of Rogers et al. 2009).
7

The second possibility (i.e., guidance given in response to volatility increases) suggests that
managers believe that they can use guidance to positively shape their firm’s information
environment.
Thus, we begin by examining the question of whether volatility plays a role in the
decision to supply a forecast. Given that managers committed to the practice of guidance do so
because they believe that it aids in reducing investor uncertainty and in curbing volatility
(Graham, Harvey, and Rajgopal 2005; McKinsey survey 2006), our first prediction focuses on
the role that volatility plays in prompting managers to provide guidance in a given quarter. In
particular, we posit that recent movements in volatility induce managers to provide a forecast
along with the current quarter’s regularly scheduled earnings release. For managers who guided
in the past, even sporadically, we expect that a recent increase in volatility (or the presence of
volatility-generating events, such as an increase in material news items) will give guiding
managers increased incentive to provide a forecast that quarter. Accordingly, our first
hypothesis predicts:
H1: Abnormally large increases in pre-earnings announcement share price volatility are associated with an increased likelihood of bundling guidance.
The prior literature examining the benefits and costs to disclosure emphasizes that it is a
sustained commitment to disclosure that affects a firm’s information environment (Diamond and
Verrrecchia 1991; Leuz and Verrecchia 2000; Clinch and Verrecchia 2011). Consistent with this
literature, H1 focuses on making predictions about when a firm with a demonstrated willingness
to guide in the past chooses to guide in the current quarter. In other words, H1 suggests that an
abnormal run-up in volatility explains when guiding firms guide versus remain silent in a
particular quarter.
Shifting attention to the consequences of guidance, we note that prior evidence suggests
that guidance might not achieve the expected reductions in volatility. While some work connects
8
earnings guidance (and/or improvements in disclosure ratings) to decreased stock price volatility
and other information environment benefits (Welker, 1995; Bushee and Noe 2000; Balakrishnan
et al. 2014), other work links the issuance of negative earnings guidance to increased volatility
(Rogers et al. 2009) and the frequency of annual guidance to heightened crash risk (Hamm et al.
2014). Collectively, these studies suggest that guidance not only fails to decrease volatility, but
might actually increase it. Consequently, these latter findings (derived from the study of
unbundled guidance and counts of forecasts of annual earnings) lead us to examine whether
bundled guidance (pertaining to both annual and quarterly earnings), which now constitutes the
vast majority of guidance cases, alters the typical post-earnings-announcement decline in
volatility documented by Patell and Wolfson (1976, 1981). Accordingly, we make the following
prediction with respect to post-announcement declines in volatility during quarters in which
managers bundle guidance with earnings news:
H2: The general post-earnings-announcement decrease in volatility is further enhanced by the presence of guidance with the earnings release.
3. Data
We begin our data collection by obtaining the report date of quarterly earnings
announcements (RDQ) for all firm quarters in Compustat from the beginning of 2001 through the
end of 2010. To these firm-quarter observations, we add guidance data from First Call’s
Company Issued Guidelines files maintained by Thomson Reuters.7 We code a variable
(BUNDLE) to indicate when a management forecast occurs during the 5 trading days centered on
7 Limiting attention to the guidance behavior of firms with a history of guidance in the post-Reg-FD time period helps to address concerns as to bias in First Call’s coverage, as all firms included in this analysis appear in the guidance dataset at least once (and often many times) in the prior 12 quarters. In addition, other sample selection and data availability constraints lead us to examine a sample of firms with high analyst following and large institutional ownership, which prior research also suggests mitigates concerns as to coverage issues. Refer to the appendix of Anilowski et al. (2007) for a discussion of the evolution of First Call as a provider of earnings forecast data and to Chuk et al. (2013) for a discussion of possible incompleteness of the CIG dataset.
9
the earnings announcement.8 We also code several indicator variables that reflect the firm’s
guidance history. GUIDE_CQTR indicates whether the firm previously provided guidance for
the current quarter’s earnings. BUNDLE_PRIOR reflects whether the firm bundled earnings
guidance with the prior quarter’s earnings announcement. BUNDLE_SQLY equals one for firm-
quarters in which the firm bundled earnings guidance with the earnings announcement for the
same fiscal quarter of the previous year. RECENT_GUIDER denotes firms with at least one
instance of guidance in the prior 12 quarters, while GUIDER equals the subset of recent guiders
with at least three instances of guidance in the prior 12 quarters. Finally, UNBUNDLED
indicates instances when the firm provides guidance this quarter outside of the five-day window
around the RDQ.
Within guiding firms (i.e., GUIDER=1), we code two additional variables that allow us to
examine subsamples of firms where the market is more or less likely to expect guidance:
COMMITTED_GUIDER denotes guiding firms that bundled in the prior quarter (i.e.,
BUNDLE_PRIOR=1) and also bundled in the same quarter of last year (i.e., BUNDLE_SQLY=1).
In contrast, OCCASIONAL_GUIDER denotes guiding firms that did not bundle in the prior
quarter (i.e., BUNDLE_PRIOR=0) and also did not bundle in the same quarter of last year (i.e.,
BUNDLE_SQLY=0).
Next, we collect analyst forecast data from I/B/E/S, using the unadjusted, detail file three
days prior to each earnings announcement. From this file, we derive the number of analyst
forecasts (NUMEST), conditional on the forecast being no more than 90 days old (i.e., non-stale),
the median non-stale analyst forecast, and the standard deviation of non-stale analyst forecasts
(DISPERSION). The median analyst forecast, combined with the actual earnings for a given
quarter, provides a history of earnings surprises. Specifically, we measure each quarter’s
8 The 5-day window follows from prior work (Anilowski et al. 2007; Rogers et al. 2009). All results remain if we exclude the 3% of our firm-quarter observations where the forecast does not arrive exactly on the RDQ.
10
surprise (SURPRISE) as the reported actual earnings (obtained from Compustat quarterly files)
minus the most recent median analyst estimates, deflated by stock price three trading days prior
to the earnings release date. That is, we examine the typical standardized unexpected earnings
(SUE). Following Rogers and Van Buskirk (2013), we create indicator variables for positive
earnings surprises (P_SURPRISE equals one if SURPRISE > +0.0001) and for negative earnings
surprises (N_SURPRISE equals one if SURPRISE < -0.0001). In addition, we code an indicator
variable (LOSS) for firm quarters where the firm reports negative earnings. To capture the recent
history of earnings surprises, we compute the proportion of the four prior quarters that
SURPRISE was non-negative, i.e., the proportion of quarters the firm met or beat analysts’
median forecasts (PROPMB). For earnings announcements with a bundled management forecast
of future earnings, we also compare the guidance to the prevailing median analyst forecast for
the same horizon. Three binary variables are used to denote instances where the management
forecast exceeds the analysts’ forecast (POSITIVE_BUNDLE), is equal to (i.e., confirms) the
analysts’ forecast (NEUTRAL_BUNDLE), or is less than the analysts’ forecast
(NEGATIVE_BUNDLE).9
In addition to actual and forecasted earnings information, we collect share price, return,
number of shares and volume data from the Center for Research in Security Prices database. We
use these data to compute the market value of a firm’s equity each quarter (MVE), the 90-day
return ending three days prior to the earnings release date (PRIOR_RET), and the standard
deviation of returns over that 90-day period (SVOL_LEVEL).
Following Rogers et al. (2009), we also gather close-of-day implied volatility data from
the standardized option files of OptionMetrics. These are the implied volatilities on 30-day, 60-
day, and 91-day standardized at-the-money options during the days before and after each
9 Rogers and Van Buskirk (2013) identify econometric problems associated with classifying news of bundled forecasts and describe an alternative approach to classifying bundled forecast news based on conditional expectations. All of our results remain when we reclassify the nature of the guidance news using their conditional approach to measurement.
11

earnings release date. This allows us to determine an average level of implied volatility in the
days before a quarterly earnings release (IVOL_LEVEL) and the changes in implied volatility
over various time periods before (ΔIVOL_PRE) and after quarterly earnings releases
(ΔIVOL_POST).10 Earnings announcements often generate substantial anticipatory news and
uncertainty about a firm’s prospects. Our intuition is that managers can use earnings forecasts
(guidance) to help investors digest the many, possibly disparate, pieces of information about the
firm that occur around the earnings release date. Option implied volatility is a common proxy
for researchers to capture uncertainty about a firm’s prospects. We also collect closing levels of
the Chicago Board Option’s Exchange volatility index (VIX_LEVEL) from their website during
the three-day window centered on an earnings announcement date to control for market-wide
volatility effects.
We suggest that at informationally intense times, managers aim to influence the firm’s
information environment by releasing guidance. For comprehensiveness, we measure the
informational intensity about a firm in two ways. In addition to the implied volatility measures
discussed above, we count the number of material news events using the Key Developments
database from Capital IQ. For this measure of news events, we count the number of news items
during the 15, 30 and 90 days leading up to each quarter’s earnings release. For a given quarter,
we also compute “abnormal” news items as the percentage difference between the number of
news items in the quarter of interest and the number in the same quarter in the prior year
(ABNEWS15D, ABNEWS30D, and ABNEWS90D).
Finally, we gather insider trading data from Thomson Reuters Stock Transactions file. In
constructing our trading measures, we concentrate on the behavior of directors and officers,
consistent with prior work (e.g., Johnson et al. 2007; Li et al. 2014). This focuses our attention
10 As depicted in Figure 1, Rogers et al. (2009) study movements in volatility in the 7-day period surrounding the forecast. Because we are interested in disentangling the role that volatility plays in prompting the forecast from post-forecast movements in volatility, we measure volatility changes before, during and after the forecast.
12

on the trading decisions of insiders who are most likely to be aware of impending earnings news
and also most likely to be in a position to influence the firm’s disclosure decisions. To further
concentrate on the trading behavior of individuals most central to disclosure choices, we restrict
our measure of insider trading to actions of the CEO and CFO. Insider trading is measured both
within the quarter of interest (INSIDERTRADEqtr and CEO/CFO_TRADEqtr) and in the 15-day
period of time after the earnings release (INSIDERTRADEpost15d and CEO/CFO_TRADEpost15d).
This 15-day window corresponds to the period of time when Bettis et al. (2000) find that
managers are typically not restricted in trading shares of their firm’s stock. We fully define all
the variables used in our analyses in Appendix A.
4. Descriptive Statistics
Table 1 characterizes the variables of interest for the 107,307 sample observations (Panel
A) and for the 47,947 firm quarters associated with recent guiders (Panel B). In each case, we
condition the data on whether the earnings announcement is or is not accompanied by guidance
(i.e., BUNDLED). In the overall sample (Panel A), about 31% (32,910 of 107,307) of the
quarterly earnings announcements are bundled with guidance, which aligns with prior work
(Anilowski et al. 2005; Rogers and Van Buskirk 2013). Consistent with idea that the guidance
decision is sticky, this fraction increases substantially when we examine the subsample of recent
guiders. Specifically, as shown in Panel B, over 55% (26,428/47,947) of current-quarter
earnings announcements contain guidance if we condition on a recently demonstrated
willingness to guide (i.e., RECENT_GUIDER=1).
[Insert Table 1]
Regardless of sample, we find statistically significant differences between the means and
medians of the bundled and non-bundled earnings announcements for all the variables tabulated.
Notably, the current quarter bundling decision is highly correlated with past guiding decisions
13
(GUIDE_CQTR, BUNDLE_PRIOR, UNBUNDLED). Managers who report positive current and
past earnings news (P_SURPRISE and PROPMB) are more likely to bundle guidance with the
earnings releases than managers reporting less favorable earnings news. Firms providing
bundled guidance tend to have greater market capitalizations (MVE) and be more widely
followed by analysts (NUMEST) than non-guiders. There also tends to be less disagreement
among analysts following firms that guide than those that do not guide (DISPERSION). The
decision to provide guidance with earnings is positively correlated with insiders’ (either in
general or just the CEO and CFO) trading behavior both in the quarter leading up to the earnings
release or in the typically open trading window after the earnings release. That is, net insider
sales are larger for the firm quarters where firms choose to guide than for quarters where firms
do not guide. This association between insider trading and disclosure decisions is consistent
with recent research highlighting the disclosure incentives created by “disclose-or-abstain”
insider trading rules (Li et al. 2014).
The final three variables in Table 1 provide insight into the public news activity of the
sample firms in the 15, 30, and 90 days leading up to the earnings announcement date
(ABNEWS15D, ABNEWS30D, and ABNEWS90D). In all cases, we find that the percentage
change in news activity leading up to a quarter with a bundled earnings release is larger than that
leading up to an earnings release without a bundled forecast. For example, focusing on recent
guiders, firm-quarters without bundled guidance are associated with a mean increase in abnormal
news of 4.0%, while firm-quarters with bundled guidance are associated with a significantly
larger mean increase in news events (14.3%) in the 15 days prior to the earnings announcement.
Collectively, the statistics presented in Table 1 underscore the notion that firms providing
bundled guidance operate in significantly different information environments than non-guiding
firms. These findings confirm the importance of controlling for prior guidance behavior in our
upcoming multivariate tests. These statistics also highlight the value of conducting tests that
14
focus on the subset of firms with a history of guidance, as our predictions focus on the role that
recent movements in volatility play in the decision to supply guidance for firms that have
demonstrated a willingness to provide guidance. In other words, our tests aim to identify the
factors associated with the decision to guide in a particular quarter by guiding firms, not to
distinguish between guiding firms and non-guiding firms, nor the decision to begin or cease
guidance.
5. The Decision to Bundle Guidance with an Earnings Release
This section reports the results of our investigation into the association between pre-
announcement changes in uncertainty (as measured by option implied volatility and abnormal
news activity) and the decision to bundle guidance with a particular earnings release.
Univariate findings
Table 2 provides descriptive statistics for the stock price volatility measures we use in our
analyses. Panel A’s statistics include all 107,307 sample observations for variables not requiring
option data and 72,016 firm-quarters describing OptionMetrics information. In Panel B, we
include only firm-quarters of recent guiders with OptionMetrics data (47,947 observations).
To get a sample-wide idea of volatility levels and changes in volatility around earnings, we
compute the (unreported) overall sample means by combining the bundlers and the non-bundlers.
On average, the realized stock price volatility (SVOL_LEVEL) in the 90 days prior to the
earnings announcement, is 3% per day, or about 47.6% annualized (assuming identically and
independently distributed returns) to a 252 trading-day year. Implied volatility from
OptionMetrics, IVOL_LEVEL, is, on average, 49.1%. As noted in prior literature, implied
volatility rises in the days prior to an earnings announcement (by 1.8% over three days, as
evidenced by ΔIVOL_PRE3D, and by 2.9% over 15 days, as evidenced by ΔIVOL_PRE15D, on
average), and falls substantially on the earnings announcement day (2.5%, on average, as
15
evidenced by ΔIVOL_RDQ) and the immediately following days (by at least 6%,
ΔIVOL_POST3D or ΔIVOL_POST15D).
[Insert Table 2]
Using the conditional statistics from Table 2, consistent with prior work (e.g., Waymire
1985), we document that firms that have demonstrated a willingness to guide have lower
volatility levels (either historical or implied) than firms that do not guide. We also find that
bundled quarters are associated with larger increases in volatility prior to the earnings release
than non-bundled quarters. The average volatility increase in the 15 days prior to earnings
announcements of bundled quarters (4.2%) exceeds that of all non-bundled quarters (2.3% for all
non-bundlers or 2.6% for non-bundlers that recently guided). This suggests that the decision to
bundle might be related to the pre-earnings volatility increase—a finding not reported in the
existing literature, to our knowledge, but consistent with Rogers et al. (2009)’s findings for
unbundled forecasts. This result is consistent with our finding (see Table 1) that firm-quarters
having guidance bundled with earnings are associated with a larger number of news stories than
firm-quarters without such guidance.
We also document significantly larger declines in post-earnings volatility for bundled
quarters (around 11%, consisting of 2.8% on the earnings announcement day and at least 8% in
the days thereafter) than for non-bundled quarters (less than 8%)—as evidenced by contrasting
ΔIVOL_RDQ, ΔIVOL_POST3D and ΔIVOL_POST15D across the bundled guidance partition.
To gain some understanding of the overall movement in volatility surrounding the earnings
announcement, we define the net overall change in volatility as the pre-announcement change in
implied volatility (ΔIVOL_PRE), which is typically positive, combined with report date change
(ΔIVOL_RDQ) as well as the post-earnings change (ΔIVOL_POST), which are both typically
negative. On average, bundled firm-quarters are associated with a more negative net change
16
(i.e., an overall decrease) in implied volatility as compared to non-bundled quarters. For
example, the mean seven-day net volatility change from three days before the announcement
through three days afterward is −8.6% for bundled quarters as compared to −5.8% for non-
bundled quarters.
Table 3 reports correlations between some of the most relevant variables that we study.
As noted previously, management’s decision to provide guidance in quarterly earnings reports is
sticky: the variables BUNDLE, BUNDLE_PRIOR, and GUIDE_CQTR are highly positively
correlated. The positive correlation between CEO and CFO trading and the decision to bundle
suggests that it is important to control for insiders’ trading behavior in the multivariate analysis
below as trading behavior might explain some disclosure decisions. Consistent with the pre- and
post-earnings changes in implied volatility documented in Table 2, we find that the pre-release
run-up in volatility is significantly positively associated with the decision to bundle and the post-
release run-down in volatility is negatively correlated with the decision to bundle.
[Insert Table 3]
What Affects the Decision to Bundle? Multivariate Analysis
A. Our estimation constructs
H1 predicts that increased uncertainty is associated with an increased likelihood of
bundled guidance. To test this hypothesis, we estimate the following logistic regression model
that builds on the model supplied in Rogers and Van Buskirk (2013):
17
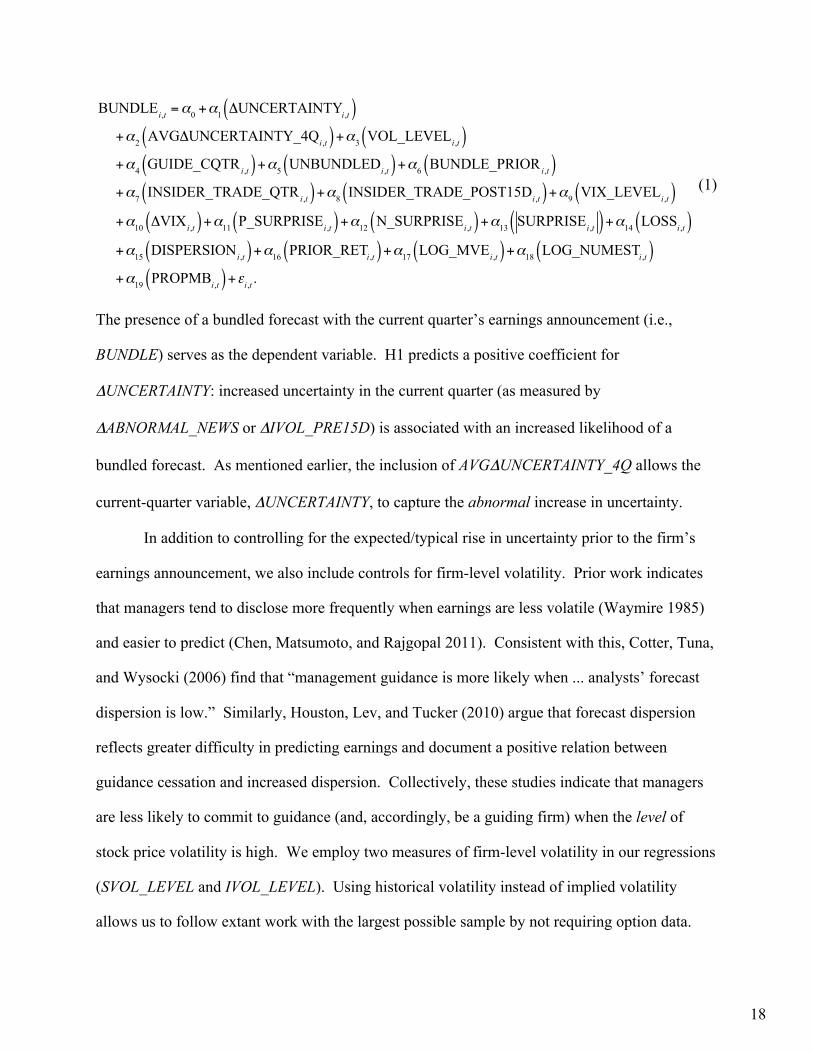
BUNDLEi ,t =α0 +α1 ΔUNCERTAINTYi ,t( ) +α2 AVGΔUNCERTAINTY_4Qi ,t( )+α3 VOL_LEVELi ,t( ) +α4 GUIDE_CQTR i ,t( )+α5 UNBUNDLEDi ,t( )+α6 BUNDLE_PRIOR i ,t( ) +α7 INSIDER_TRADE_QTR i ,t( )+α8 INSIDER_TRADE_POST15Di ,t( )+α9 VIX_LEVELi ,t( ) +α10 ΔVIXi ,t( )+α11 P_SURPRISEi ,t( )+α12 N_SURPRISEi ,t( )+α13 SURPRISEi ,t( )+α14 LOSSi ,t( ) +α15 DISPERSIONi ,t( )+α16 PRIOR_RETi ,t( )+α17 LOG_MVEi ,t( )+α18 LOG_NUMESTi ,t( ) +α19 PROPMBi ,t( )+εi ,t .
(1)
The presence of a bundled forecast with the current quarter’s earnings announcement (i.e.,
BUNDLE) serves as the dependent variable. H1 predicts a positive coefficient for
ΔUNCERTAINTY: increased uncertainty in the current quarter (as measured by
ΔABNORMAL_NEWS or ΔIVOL_PRE15D) is associated with an increased likelihood of a
bundled forecast. As mentioned earlier, the inclusion of AVGΔUNCERTAINTY_4Q allows the
current-quarter variable, ΔUNCERTAINTY, to capture the abnormal increase in uncertainty.
In addition to controlling for the expected/typical rise in uncertainty prior to the firm’s
earnings announcement, we also include controls for firm-level volatility. Prior work indicates
that managers tend to disclose more frequently when earnings are less volatile (Waymire 1985)
and easier to predict (Chen, Matsumoto, and Rajgopal 2011). Consistent with this, Cotter, Tuna,
and Wysocki (2006) find that “management guidance is more likely when ... analysts’ forecast
dispersion is low.” Similarly, Houston, Lev, and Tucker (2010) argue that forecast dispersion
reflects greater difficulty in predicting earnings and document a positive relation between
guidance cessation and increased dispersion. Collectively, these studies indicate that managers
are less likely to commit to guidance (and, accordingly, be a guiding firm) when the level of
stock price volatility is high. We employ two measures of firm-level volatility in our regressions
(SVOL_LEVEL and IVOL_LEVEL). Using historical volatility instead of implied volatility
allows us to follow extant work with the largest possible sample by not requiring option data.
18

Following Kim et al. (2014), we also control for market-wide volatility by using the Chicago
Board Option Exchange’s volatility index (VIX_LEVEL and ΔVIX).
Further, recent work by Li et al. (2014) underscores the importance of controlling for the
presence of “disclose-or-abstain” insider trading incentives. Consequently, we also include
measures of insider trade during the quarter (INSIDER_TRADEQTR) and in the typically open
trading window following the report date of quarterly earnings (INSIDER_TRADEPOST15D) in the
regression. Because we expect the disclosure and trading decisions to be most salient for the
CEO and CFO, we tabulate results using measures of trading based exclusively on the trades of
the CEO and CFO (i.e., CEO/CFO_TRADEQTR and CEO/CFO_TRADEPOST15D). Our results are
robust to either approach to measurement.11
As mentioned, our model adjusts/augments the model introduced by Rogers and Van
Buskirk (2013). Accordingly, the remaining control variables follow directly from their analysis.
In particular, consistent with Rogers and Van Buskirk (2013), we predict that the likelihood of
current-quarter guidance increases with past guidance (i.e., GUIDE_CQTR and
BUNDLE_PRIOR).12 In addition, because the existence of an earlier unbundled management
forecast might alter the relation we anticipate between pre-announcement changes in volatility
and the decision to bundle guidance, we also include a binary variable (UNBUNDLED) to
indicate if the firm issued an unbundled piece of guidance earlier in the quarter of interest.
Again following Rogers and Van Buskirk (2013) we also control for the current quarter’s
earnings news (P_SURPRISE, N_SURPRISE, |SURPRISE|, and LOSS), the information
11 Although sample size is reduced by approximately 20%, all of our results are also robust when we exclude all observations where any trading occurs in the 15-day window following the report date of quarterly earnings (and, hence, the management forecast). Thus, our results remain robust to the exclusion of management forecasts that are potentially issued in response to disclose-or-abstain rules (Li et al. (2014). 12 As shown in Table 3, BUNDLE_PRIOR and GUIDE_CQTR are highly correlated (61% Spearman correlation in the full sample of firm-quarter observations and 38% Spearman correlation in the subsample of firm-quarter observations for recent guiders). Following Rogers and Van Buskirk (2013) we include both in our tabulated regressions. All of our results remain when we re-estimate our regressions excluding either BUNDLE_PRIOR and GUIDE_CQTR. More important, in the upcoming subsample analyses that predict bundling within the groups of firms that are more/less likely to guide, both of these variables are no longer needed in the model, as they are held constant within these subsamples.
19
environment of the firm (DISPERSION, LOG_NUMEST, LOG_MVE), and recent performance
(PRIOR_RET and PROPMB).13
B. Multivariate findings
We report results from two samples and several measures of uncertainty in Table 4. The
two samples are all firm-quarter observations and the firm-quarter observations associated with
recent guiders. Uncertainty measures include abnormal news items and changes in option
implied volatilities using options of various maturities over multiple time periods. When using
abnormal news to measure changes in uncertainty, we control for stock price volatility level with
historical stock price volatility. When using changes in implied volatility to measure changes in
uncertainty, we use the average implied volatility to control for volatility level.
[Insert Table 4]
In columns [1] and [2], we use all observations in the sample with complete relevant data.
This includes all 107,307 firm quarters in column [1], while column [2] uses all 72,016 firm
quarters with available OptionMetrics data. In columns [3] through [6], we use only the
observations characterized as coming from recently guiding firms (RECENT_GUIDER=1) with
options data. The sample size decreases slightly when using longer-maturity options or
measuring the implied volatility change over different time periods, as evidenced by the steadily
reduced sample size from column [3] to column [6]. The advantage of focusing the sample on
recent guiders is that we consider only firms with a demonstrated willingness to provide
guidance. Thus, while the regressions in columns [1] and [2] at least partially distinguish
guiding firms from non-guiding firms, the regressions in columns [3] through [6] focus more
13 Rogers and Van Buskirk (2013) also include an indicator variable to identify earnings announcements that are accompanied by conference calls. When we re-estimate all of our regressions using a subset of data for which we have available conference call data, all of our results remain when we include a conference call indicator. Because we conduct all of our main tests using the subsample of firms with guiding histories and for which publicly traded options exist, the vast majority of our firms host conference calls surrounding their earnings announcements.
20
sharply on explaining why a firm with a history of guiding chooses to guide or remain silent in a
particular quarter.
In all specifications in Table 4 the relation between the change in “unexpected” pre-
earnings uncertainty and management’s decision to bundle guidance with the earnings is
positive. We also report the coefficient estimates of variables designed to control for the
typical/normal increase in volatility prior to an earnings release (AVGΔUNCERTAINTY), the
level of earnings volatility (VOL_LEVEL), the firm’s guidance history (GUIDE_CQTR and
BUNDLE_PRIOR), the existence of a management forecast during the quarter of interest that is
not bundled with earnings (UNBUNDLED), and insider trading (CEO/CFO_TRADEqtr and
CEO/CFO_TRADEpost15d).
Although we do not report the coefficient estimates for the remaining control variables,
our conclusions are consistent with prior findings. Further, the addition of our volatility and
trading variables appears to significantly improve the fit of the model, as the Pseudo R2 for our
model estimated on the full sample is 65.5%, which improves considerably upon the 42.49%
shown in Rogers and Van Buskirk (2013, Table 3) for a similar time period.
Focusing on the full-sample specifications, we find both ABNORMAL_NEWS and
ΔIVOL_PRE15D (our proxies for ΔUNCERTAINTY) are associated with an increased likelihood
of bundled guidance. Because we control for the “typical” volatility increase prior to earnings
with AVGΔUNCERTAINTY4Q, we mitigate the likelihood that the market increases the volatility
in anticipation of the bundling decision. Thus, the coefficient estimate for ΔUNCERTAINTY
represents the effect that the current-quarter elevation in unanticipated uncertainty has on the
bundling decision. For the most part, reported control variables have the expected sign. Firms
with higher volatility levels are less likely to bundle. Firms that guided in the past (either via
bundled or unbundled forecasts) are more likely to continue to provide guidance in the quarter of
interest. Finally, consistent with the idea that managers must disclose or abstain from trading (Li
21

et al. 2014), we find that guidance is positively correlated with both backward-looking and
forward-looking measures of insider trading.
Because we aim to predict when a firm with a demonstrated willingness to guide chooses
to supply guidance (as opposed to if a firm chooses to be a guiding firm), the next four
specifications presented in columns [3] through [6] narrow our focus to recent guiders that have,
on average, bundled guidance in 5 of the prior 12 quarters. Said differently, we remove non-
guiding firms from the analysis in order to allow our tests to focus on explaining the quarters in
which guiders do and do not guide (as opposed to explaining whether a firm is a guider or not).
In so doing, we increase the rigor of our empirical tests. The difference across columns [3]
through [6] is the time period over which we measure the change in option implied volatility or
the maturity of the option used. In columns [3], [4] and [5], we measure the change in implied
volatility in the 15 days prior to the earnings release, but use 30-day, 60-day, and 91-day
maturity options, respectively.
Patell and Wolfson (1981) document that implied volatility increases before an earnings
announcement and subsequently falls, as Figure 2 of Rogers et al. 2009 illustrates. This causes
concern that our tests are picking up the normal rise in volatility associated with investors’
anticipation of the forthcoming earnings and forecast news. Although we believe that including
AVGΔUNCERTAINTY4Q addresses this concern because we are now focused on the abnormal
run-up in volatility, we further address this concern in column [6] by moving the window over
which we measure the run-up back to ten days prior to the report date of quarterly earnings (i.e.,
we measure from day -20 to day -10), as Figure 2 of Rogers et al. (2009) indicates that most of
this rise occurs in the 10 days before the earnings announcement. Across all specifications for
the recent guiders, we continue to observe a significantly positive association between abnormal
increases in pre-announcement uncertainty and the decision to bundle guidance with the current
quarter’s earnings release.
22
Thus, the evidence in Table 4 suggests that regardless of our approach to measuring the
current-quarter pre-announcement rise in uncertainty, we detect a consistently robust, positive
relation between abnormal run-ups in uncertainty and the decision to supply earnings guidance in
the current quarter.
6. Alternative Explanations
A. Is the run-up in volatility related to the market’s expectation of guidance?
Evidence of a link between run-ups in volatility prior to providing guidance is consistent
with two explanations: (1) the market anticipating the act of bundling (and its associated impact
on stock price), and (2) managers reacting to the rising volatility by providing guidance. The
fact that managers of firms with a history of guidance are also more likely to guide following
quarters containing an abnormal increase in uncertainty provides initial evidence consistent with
the latter effect: the presence of a managerial reaction. In Table 5, we provide additional
univariate evidence in support of the presence of a managerial reaction effect by limiting
variation in the extent to which investors might reasonably anticipate guidance. We hold
constant the market’s expectation of guidance by focusing on subsamples of committed and
occasional guiders (Panels A and B), a sample of unbundled guidance (Panel C) and a subsample
of uncontaminated, unbundled guidance (Panel D).
As shown in Panel A, focusing on the subset of committed guiders for which guidance is
more likely to be expected (as measured by the presence of a bundled forecast in the same
quarter of last year as well as the presence a bundled forecast last quarter—i.e.,
BUNDLE_PRIOR=1 and BUNDLE_SQLY=1), we find that this set of firms bundles 87.2% of the
time in the current quarter. Thus, given that this a committed guiders bundle the vast majority of
the time (i.e., nearly 9 out of every 10 quarters), market participants should rationally anticipate a
bundled forecast in the current quarter.
23
In contrast, focusing on the subset of occasional guiders for which guidance is less likely
to be expected (as measured by the absence of a bundled forecast in the same quarter of last year
as well as the absence a bundled forecast last quarter—i.e., BUNDLE_PRIOR=0 and
BUNDLE_SQLY=0), we find that these firms only bundle 24.2% of the time in the current
quarter. Thus, Panel A of Table 5 suggests that partitioning based on the presence of a bundled
forecast in the prior quarter and in the same quarter of last year allows us to isolate subsamples
where investors are more and less likely to expect the guidance.
[Insert Table 5]
In Panel B of Table 5, we compare the pre-earnings run-up in volatility across four
groups:
(1) Committed guiders who are MORE LIKELY and DO: firms that are more likely to bundle this quarter and, as expected, do bundle in the current quarter (i.e., BUNDLE_PRIOR=1, BUNDLE_SQLY=1 and BUNDLE=1),
(2) Committed guiders who are MORE LIKELY and DO NOT: firms that are more likely to bundle this quarter and, unexpectedly, do not bundle in the current quarter (i.e., BUNDLE_PRIOR=1, BUNDLE_SQLY=1 and BUNDLE=0),
(3) Occasional guiders who are LESS LIKELY and DO: firms that are less likely to
bundle this quarter and, unexpectedly, do bundle in the current quarter (i.e., BUNDLE_PRIOR=0, BUNDLE_SQLY=0 and BUNDLE=1), and
(4) Occasional guiders who are LESS LIKELY and DO NOT: firms that are less
likely to bundle this quarter and, as expected, do not bundle in the current quarter (i.e., BUNDLE_PRIOR=0, BUNDLE_SQLY=0 and BUNDLE=0).
First, we hold constant the likelihood of bundling and then compare ΔIVOL_PRE15D for
group (1) to that of group (2) and ΔIVOL_PRE15D for group (3) to that of group (4)—i.e., we
compare ΔIVOL_PRE15D across the bundled columns within the more likely (row [a]) and less
likely (row [b]) subsamples. For firms most likely to bundle (row [a]), the mean volatility
increase is 4.3% for the firms that actually bundle (group 1) in the current quarter compared to
2.3% for firms that do not bundle (group 2). For firms less likely to bundle (row [b]), the mean
24
volatility increase is 4.4% for the current-quarter bundlers (group 3) and 3.1% for the current-
quarter non-bundlers (group 4). Both of these differences are statistically significant. Thus,
holding constant the market’s anticipation of bundling, ΔIVOL_PRE15D is higher in quarters
when the firm actually bundles as compared to non-bundled quarters. These differences are
consistent with a managerial reaction to rising volatility in the current quarter, as the likelihood
of bundling is similar across compared groups.
Next, we hold constant the presence/absence of a bundled forecast in the current quarter
and compare ΔIVOL_PRE15D for group (1) to that of group (3) and ΔIVOL_PRE15D for group
(2) to that of group (4)—i.e., we compare ΔIVOL_PRE15D across the more likely (row [a]) and
less likely (row [b]) rows within the bundled columns. For firms that bundle in the current
quarter, the mean volatility run-up is 4.3% for firms that the market would expect to bundle (i.e.,
group (1)) and 4.4% for firms that the market would not expect to bundle (i.e., group (3)).
Likewise, the mean volatility increase in non-bundled quarters is 2.3% for expected bundlers
(i.e., group (2)) as compared to 3.1% for unexpected bundlers (i.e., group (4)). None of these
differences in means (or medians) is statistically significant at traditional levels. Hence, holding
constant the guidance decision in the quarter of interest, we detect no differences in volatility
run-up between expected and unexpected bundlers. The absence of significant differences in
these comparisons is inconsistent with notion that the volatility increase is due to the market’s
anticipation of bundled guidance.
Finally, in Panels C and D of Table 5, we aim to hold the expectation of guidance
constant by examining whether there is an abnormal run-up in volatility prior to unbundled
guidance. To do so, we focus on the 8,039 firm-quarters in which guiding firms supplied an
unbundled piece of guidance during the quarter (i.e., UNBUNDLED=1). In this analysis, we test
whether the run-up in volatility prior to an unbundled forecast (as measured by
25
∆IVOL_PRE15D_UNBUNDLED) is greater than the run-up in volatility during the same time in
the prior quarter (as measured by ∆IVOL_PRE15D_UNBUNDLED_PRIOR) or than the run-up in
volatility during the same time last year (as measured by
∆IVOL_PRE15D_UNBUNDLED_SQLY). As shown in Panel C, we find evidence of a
significant difference between the run-up prior to an unbundled forecast as compared to the run-
up during the same time last quarter (i.e., [a]>[b]) and as compared to the run-up same time in the
same quarter of last year (i.e., [a]>[c]). This again supports the hypothesis that managers react to
rising volatility with guidance.
Yet, as Rogers et al. (2009) note, a sample of unbundled forecasts may include some
forecasts for which the timing is predictable or forecasts that are issued in response to a
volatility-provoking news event. Using the Key Developments database from Capital IQ, we
find support for this notion: 3,655 (59%) of the 6,197 unbundled forecasts (with available
OptionMetrics data) occurring after 2004 (the point at which Capital IQ data becomes stable)
contain a contaminating news item in the 3-day window prior to and including the date of the
forecast, some of which can be anticipated by investors.14 To address this issue of potential
anticipation by investors, in Panel D we limit our analysis to the 2,542 uncontaminated,
unbundled forecasts that are not contemporaneous with another announcement or event.
Although the mean/median changes in volatility run-ups are now smaller in magnitude, we
continue to find evidence consistent with a managerial reaction to rising volatility.
Given that recent research cautions against drawing inferences from small samples of
unbundled guidance, our main analyses focus on the decision to supply bundled guidance. 14 Additional (untabulated) analysis of the Key Developments database indicates that from 2005 through 2010, the mean (median) number of key events per firm per year is 24 (17), with a lower quartile of 7 and an upper quartile of 32. This suggests that the typical firm experiences a key event approximately every two weeks, although many key events cluster in time. Of the 8,913 unbundled forecasts occurring during this period, 3,431 (38.5%) of those forecasts are given on the same date that the firm holds a conference call (which are announced in advance) and in total 5,838 (65.5%) of those forecasts have a contaminating event in the 7-day window surrounding the forecast. The most frequent contaminating events are conference presentation calls, client announcements, CEO/CFO/executive board change announcements, product related announcements, and monthly sales announcements/calls. Because some of these events have predictable timing, investor anticipation can be an issue even with unbundled guidance.
26

Nonetheless, this small sample evidence is consistent with volatility concerns influencing the
decision to supply unbundled guidance. This provides further evidence of a managerial reaction
to rising volatility, as uncontaminated, unbundled forecasts are relatively infrequent and are less
likely to be anticipated by investors.
Building upon the univariate evidence of a managerial reaction effect presented in Table
5, in Table 6 we re-consider the multivariate analysis presented in Table 4 but this time
differentiate between instances where investors are more or less likely to expect current-quarter
guidance from guiding firms. In Panel A of Table 6, we consider firm-quarter observations
where the market is more likely to expect guidance (i.e., the groups described in the first two
rows of Table 5, Panel A). In Panel B of Table 6, we consider firm-quarter observations where
the market is less likely to expect guidance (i.e., the groups described in the last three rows of
Table 5, Panel B).
[Insert Table 6]
Column [1] of Panel A reports the results of estimating Equation (1) using firm quarters
of where BUNDLE_SQLY=1. Column [2] further restricts the sample to committed guiders (i.e.,
where BUNDLE_SQLY=1 and BUNLDE_PRIOR=1). Regardless of which definition of
expected guider we use, the incidence of guiding increases with changes in implied volatility.
Recall from Panel A of Table 5, 80% to 87% of these sample firms guided with the current
quarter’s earnings. Thus, for this subset of firms, variation in the dependent variable that
remains to be explained by our logistic regression is limited (as the overwhelming majority of
these observations come with bundled forecasts). Yet, we continue to find strong evidence of a
positive association between the abnormal run-up in volatility (∆UNCERTAINTY) and the
decision to bundle. In other words, we find that the abnormal run-up in current quarter volatility
predicts the quarters in which firms that bundle the vast majority of the time (and for which
bundling should be largely expected by the market) choose not to bundle.
27
In Panel B of Table 6, we shift attention to the firm-quarters for which guidance is less
likely to be expected (as measured by the absence of a bundled forecast in the same quarter of
last year as well as the absence of a bundled forecast last quarter—i.e., BUNDLE_SQLY=0 and
BUNLDE_PRIOR=0), we find that 24.2% of occasional guiders bundle in the current quarter.
Thus, for this subset of firms, the market should not be routinely anticipating guidance (as the
overwhelming majority of observations do not contain bundled forecasts) and the market would
not be anticipating bundling for most of these firm-quarter observations. Yet, we continue to
find strong evidence of a positive association between the abnormal run-up in volatility
(∆UNCERTAINTY) and the decision to bundle. Because investors are unlikely to be assessing a
high likelihood of bundling for these events, we argue that the decision to bundle is a reaction to
the larger increase in volatility rather than the volatility rise anticipating guidance.
Taken collectively, these subsample tests support the notion that abnormal run-ups in
volatility explain the quarters in which guiding firms choose to guide, even after we hold
constant the expectation of bundling (by narrowing in on the firm-quarters where bundling is
expected the vast majority of the time or by narrowing in on the firm-quarters where bundling is
less likely to be expected).
Importantly, we notice that when we limit analysis to the subsamples that hold constant
the expectation of guidance (i.e., the “committed guider” subsample reported in column [2] of
Panel A and the “occasional guider” subsample reported in column [2] of Panel B of Table 6),
we do not detect a significant relation between the average run-up (AVGΔUNCERTAINTY4Q) and
the decision to bundle in the current quarter. In contrast, when estimating the regression on the
full sample of guiding firms (i.e., the full sample regressions reported in Table 4), we detect a
significantly positive relation. The lack of significance in the subsample regressions is consistent
with the notion that focusing on subsamples successfully controls for the expectation of guidance
28
in the current quarter and, thus, the inclusion of the normal run-up is no longer important in
explaining BUNDLE.
B. Expectation adjustment?
Under the “expectations adjustment hypothesis” of Ajinkya and Gift (1984), managers
are more likely to provide guidance when investors’ earnings expectations differ from their own.
Consequently, in our next analysis we control for managers’ use of guidance to adjust gaps in
investors’ expectations of earnings by limiting analysis to firm-quarter observations in which (1)
firms report no current-quarter earnings surprise and (2) managers either remain silent or bundle
a neutral/confirming forecast with the current-quarter, no surprise earnings news, (i.e., no
“expectation adjustment”). In particular, in Table 7 we examine the decision to bundle in these
“no news” firm-quarters, focusing on changes in option implied volatilities using options of
various durations as our measures of uncertainty: column [1] examines our basic measure of the
run-up in volatility that uses options with 30-day durations (i.e., ∆IVOL_PRE15D), while
columns [2] and [3] examine 60-day and 91-day durations (i.e., ∆IVOL_PRE15D and
∆IVOL_PRE15D, respectively). As mentioned earlier, consistent with the notion that focusing
on “no news” firm-quarters (as measured by the absence of a current-quarter earnings surprise
and either the absence of a bundled forecast or the presence of a neutral confirming forecast)
holds constant contemporaneous news, we detect no significant differences in the means,
medians or standard deviations of the 3- or 5-day abnormal return surrounding the report date of
quarterly earnings when we compare the bundled (i.e., neutral/confirming guidance) quarters to
the non-bundled (silent) quarters.
[Insert Table 7]
Not surprisingly, sample size drops considerably in these analyses. Yet, as shown in
column [1], we still find that managers are more likely to bundle a confirming forecast (as
29
opposed to remain silent) in the presence of an abnormal run-up in volatility. In other words, an
abnormal increase in uncertainty explains when managers bundle verbal indications of their
agreement with the market’s expectations of their future earnings versus when managers tacitly
confirm their agreement with the market’s expectations via silence.15 Moving across columns,
the results weaken, which suggests that concerns over short-term volatility drive this finding.
Collectively, the evidence presented in Tables 4, 5, 6 and 7 suggests that managers aim to
calm short-term investor uncertainty with their guidance in the current quarter. In our next set of
tests, we examine the extent to which this anticipated benefit manifests.
7. The Change in Implied Volatility following the Guidance
In this section, we investigate whether changes in volatility in the days following bundled
earnings releases are associated with larger declines in volatility than the volatility declines after
earnings releases that are not accompanied by guidance. We do this by estimating the following
regression equation for the sample of recent guiders:
ΔIVOL_POST15Di ,t = β0 +β1 BUNDLEi ,t( ) +β2 AVGΔIVOL_POST15D_4Qi ,t( )+β3 ΔIVOL_PRE15Di ,t( )+β4 ΔIVOL_RDQi ,t( ) +β5 |SURPRISE|i ,t( )+β6 INSIDER_TRADE_QTR i ,t( )+β7 INSIDER_TRADE_POST15Di ,t( ) +β8 VIX_LEVELi ,t( )+β9 ΔVIXi ,t( )+β10 VOL_LEVELi ,t( )+β11 LOG_MVEi ,t( ) +β12 LOG_NUMESTi ,t( )+β13 PROBMBi ,t( )+εi ,t .
(2)
∆IVOL_POST15D serves as the dependent variable in this regression. We report results
using both 30- and 60-day maturity options. H2 predicts a negative coefficient for BUNDLED:
bundled guidance is associated with abnormally large reversions in post-announcement
volatility.
15 This finding is consistent with prior work that provides evidence to suggest that confirming unbundled forecasts given in a pre-Regulation FD time frame (i.e., 1993 to 1997) reduce consensus analyst dispersion (Clement, Frankel and Miller 2003).
30
The above regression equation follows from Rogers et al. (2009) with a few notable
exceptions. Disentangling the change in volatility surrounding the forecast into two distinct
windows (pre- and post-guidance) allows us to control for pre-forecast movements in volatility
when examining post-forecast volatility changes. Absent efforts to separate pre-guidance
changes from post-guidance changes in volatility, tests examining the link between guidance and
volatility are biased in favor of finding a positive relation if managers issue forecasts in response
to some other volatility-provoking event (such as an abnormal amount of news) and the
measurement window commingles pre-guidance movement with post-guidance movement.
Consequently, we adjust Rogers et al. (2009)’s research design to disentangle the pre- and post-
guidance movements in volatility, which allows us to sharpen our tests. In particular, if the run-
up in pre-announcement volatility is greater, then we expect that the reversion will likely be
greater. Our analyses address this issue with the inclusion of the current-quarter run-up
(∆IVOL_PRE15D), the day 0 movement (∆IVOL_RDQ), and the average rundown from the prior
four quarters AVG∆IVOL_POST15D4Q). As such, our analysis speaks to the relation between
BUNDLE and the abnormal rundown in volatility (∆IVOL_POST15D) after the current-quarter
earnings announcement. In our opinion, this is a strong test, as the average rundown will be
higher for frequently guiding firms, as there may have been bundled guidance in the prior four
quarters. Hence, our tests link abnormally large reversions to guidance after controlling for the
run-up in volatility and after controlling for the typical rundown that follows the firm’s earnings
announcement.
As shown in Table 8, the firm-quarters including guidance (regardless of the
contemporaneous earnings news) consistently have larger post-earnings announcement
decreases in volatility than firm-quarters without guidance, as evidenced by the significantly
negative coefficient for BUNDLE. This result holds after controlling for the earnings news (i.e.,
moving across the negative (columns [1] and [2]), neutral (columns [3] and [4]), and positive
31
(columns [5] and [6]) current-quarter earnings news samples), the typical run-down in volatility
post earnings, the change in volatility levels leading up to the earnings release, and the change in
volatility on the earnings release date. The clear message is that bundling guidance with
earnings announcement is associated with larger decreases in post-earnings announcement
volatility than unbundled earnings releases. In terms of economic significance, the coefficients
in the 15-day regression average almost -0.015 across the various subsamples. That compares to
a mean 15-day volatility change of -0.086 for the recent-guider sample (Table 2) or a 17%
difference. As we have selected our sample from guiding firms, this result is not simply due to a
distinction between firms that never guide and firms that guide, but reflects differences in firms
that are willing to guide between quarters when they guide and quarters when they do not guide.
[Insert Table 8]
Panel B of Table 8 examine the volatility run-down conditioning on both earnings and
forecast news. In Panel B, we distinguish between positive and negative earnings surprises and
the content of the associated guidance (negative, positive, or neutral). In all six categories, the
regression coefficient on the post-announcement volatility change is statistically significantly
negative at the 95% confidence level.
In Panel C of Table 8, we again narrow our focus on “no news” quarters. As mentioned,
we aim to control for managers’ use of guidance to adjust gaps in investors’ expectations of
earnings by limiting analysis to firm-quarter observations in which (1) firms report no current-
quarter earnings surprise and (2) managers either remain silent or bundle a neutral/confirming
forecast with the current-quarter, no surprise earnings news, (i.e., no “expectation adjustment”).
Thus, in these tests we examine the link between the presence of a confirming forecast (as
opposed to a potentially confirming absence of a forecast) and the abnormal rundown in
volatility after the announcement. In these “no news” firm-quarters, we still find that the
abnormal rundown in volatility is greater when managers bundle verbal indications of their
32
agreement with the market’s expectations of their future earnings than when managers tacitly
confirm their agreement with the market’s expectations via their silence. Consequently, we view
this evidence as supporting the notion that explicit (verbal) guidance that confirms the consensus
has a volatility benefit that exceeds the benefit of implicit (non-verbal) agreement with the
prevailing consensus.
8. Conclusion
In this study, we consider the interplay between guidance and volatility after separating
pre-earnings run-ups in volatility from post-earnings declines in volatility. Our motivation for
this investigation comes from the tension between managers’ claims that a major reason for
earnings guidance is to relieve investor uncertainty and dampen share price volatility and some
recent academic evidence suggesting that guidance increases volatility.
Consistent with the notion that volatility does indeed factor into managers’ decisions to
provide earnings guidance, we find that abnormal run-ups in volatility help to predict the
quarters in which guiding firms choose to give guidance. And what happens to share price
volatility after the guidance release? In contrast to recent work, we find no evidence that
guidance increases volatility. In fact, our evidence indicates that earnings releases bundled with
guidance are associated with abnormally large post-announcement reductions in volatility.
All of our findings hold when we limit variation in the extent to which investors might
reasonably anticipate guidance by focusing on committed and occasional guiders, when we focus
exclusively on the firm-quarters when the decision to guide versus remain silent is unlikely to be
influenced by current-quarter earnings news, and when managers do not appear to be using
guidance to adjust gaps in earnings expectations. Indeed, our evidence on these “no news” firm-
quarters indicates that abnormal run-ups in volatility help to explain when managers bundle
verbal indications of their agreement with the market’s expectations of their future earnings
33
versus when managers tacitly confirm their agreement with the market’s expectations via silence.
Further, in these “no news” firm-quarters, we still find that the abnormal post-announcement
rundown in volatility is greater when managers bundle verbal indications of their agreement with
the market’s expectations of their future earnings than when managers tacitly confirm their
agreement with the market’s expectations via their silence. Consequently, we view this evidence
as supporting the notion that explicit (verbal) guidance that confirms the consensus has a
volatility benefit that exceeds the benefit of implicit (non-verbal) agreement with the prevailing
consensus.
Thus, consistent with managers’ perceptions (as reflected in survey evidence regarding
the perceived benefits of disclosure), guidance appears to reduce share price volatility. This
finding, along with recent work connecting guidance to meaningful improvements in liquidity,
reductions in litigation risk and the attraction of analyst coverage, speaks to the potential benefits
of guidance.
34
References
Ajinkya, B. and M. Gift. 1984. Corporate managers’ earnings forecasts and symmetrical adjustments of market expectations. Journal of Accounting Research 22, p. 425-444. Anantharaman, D. and Y. Zhang. 2011. Cover me: Managers’ responses to changes in analyst coverage in the post-Regulation FD period. The Accounting Review 86, p. 1851-1885. Anilowski, C., M. Feng, and D. Skinner. 2007. Does earnings guidance affect market returns? The nature and information content of aggregate earnings guidance. Journal of Accounting and Economics 44, p. 36-63. Balakrishnan, K., M. Billings, B. Kelly, and A. Ljungqvist. 2014. Shaping liquidity: On the causal effects of voluntary disclosure. Journal of Finance 69, p. 2,237-2,278. Bettis, J., J. Coles, and M. Lemmon. 2000. Corporate policies restricting trading by insiders. Journal of Financial Economics 57: 191-220.
Billings, M. and M. Cedergren. 2014. Strategic silence, insider selling and litigation risk. Working paper. Bushee, B., J. Core, W. Guay, and S. Hamm. The role of the business press as an information intermediary. Journal of Accounting Research 48, p. 1-19. Bushee, B. and C. Noe. 2000. Corporate disclosure practices, institutional investors, and stock return volatility. Journal of Accounting Research 38, p. 171-202. Chen, S., D. Matsumoto, and S. Rajgopal. 2011. Is silence golden? An empirical analysis of firms that stop giving quarterly earnings guidance. Journal of Accounting and Economics 51, p. 134-150. Chuk, E., D. Matsumoto, and G. Miller. 2013. Assessing methods of identifying management forecasts: CIG vs. researcher collected. Journal of Accounting and Economics 55, p. 23-42. Clement, M., R. Frankel, and J. Miller. 2003. Confirming management earnings forecasts, earnings uncertainty, and stock returns. Journal of Accounting Research 41, p. 653-679. Clinch, G. and R. Verrecchia. 2012. Voluntary disclosure and the cost of capital. Working paper. Cotter, J., I. Tuna, and P. Wysocki. 2006. Earnings management and beatable targets: how do analysts react to explicit earnings guidance? Contemporary Accounting Research 23, 593–624. Diamond, D. 1985. Optimal release of information by firms, Journal of Finance 40, 1071-1094. Diamond, D. and R. Verrecchia. 1991. Disclosure, liquidity, and the cost of capital. Journal of Finance 46, 1325-1359.
35
Field, L., M. Lowry, and S. Shu. 2005. Does disclosure deter or trigger litigation? Journal of Accounting and Economics 39, 487-507. Graham, J., C. Harvey, and S. Rajgopal. 2005. The economic implications of corporate financial reporting. Journal of Accounting and Economics 40, p. 3-73. Hamm, S., E. Li, and J. Ng. 2014. Management earnings guidance and stock price crash risk. Working paper. Healy, P., A. Hutton, and K. Palepu. 1999. Stock performance and intermediation changes surrounding sustained increases in disclosure. Contemporary Accounting Research 16, 485-520. Healy, P. and K. Palepu. 2001. Information asymmetry, corporate disclosure, and the capital markets: a review of the empirical disclosure literature. Journal of Accounting and Economics 31, 405-440. Houston, J., B. Lev, and J. Tucker. 2010. To guide or not to guide? Causes and consequences of stopping quarterly earnings guidance. Contemporary Accounting Research 27, 143–185. Johnson, S. 2009. Earnings guidance takes a dip. CFO.com. May 18, 2009. Johnson, M., K. Nelson, and A. Pritchard. 2007. Do the merits matter more? The impact of the Private Securities Litigation Reform Act. Journal of Law, Economics, and Organization 23: 627−652. Kim, K., S. Pandit, C. Wasley. 2014. Macroeconomic uncertainty and management earnings forecasts. Working paper. Lang, M. and R. Lundholm. 1993. Cross-sectional determinants of analyst ratings of corporate disclosures, Journal of Accounting Research 31, 246-271. Lang, M. and R. Lundholm. 1996. Corporate disclosure policy and analyst behavior. The Accounting Review 71, 467-493. Leuz, C. and R. Verrecchia. 2000. The economic consequences of increased disclosure. Journal of Accounting Research 38, 91-124. Lewellen, J. and J. Shanken. 2002. Learning, asset pricing, and market efficiency. Journal of Finance 57, 1113-1145. Li, E., C. Wasley, and J. Zimmerman. The disclose or abstain incentive to issue management guidance. Working paper. Pastor, L. and P. Veronesi. 2003. Stock valuation and learning about profitability. Journal of Finance 58, 1749-1789.
36
Patell, J. and M. Wolfson. 1979. Anticipated information releases reflected in call option prices. Journal of Accounting and Economics 1, p. 117-140. Patell, J. and M. Wolfson. 1981. The ex ante and ex post price effects of quarterly earnings announcements reflected in option and stock prices. Journal of Accounting Research 19, p. 434-458. Rogers, J., D. Skinner, and A. Van Buskirk. 2009. Earnings guidance and market uncertainty. Journal of Accounting and Economics 48, p.90-109. Rogers, J. and A. Van Buskirk. 2013. Bundled forecasts in empirical accounting research. Journal of Accounting and Economics, forthcoming. So, E. 2013. Disclosure and the option value of equity. Working paper. Verrecchia, R.E. 1983. Discretionary disclosure. Journal of Accounting and Economics 5, 179-194. Waymire, G. 1985. Earnings volatility and Voluntary Management Forecast Disclosure. Journal of Accounting Research 23, 268-295. Welker, M. 1995. Disclosure policy, information asymmetry, and liquidity in equity markets. Contemporary Accounting Research 11, 801-827.
37
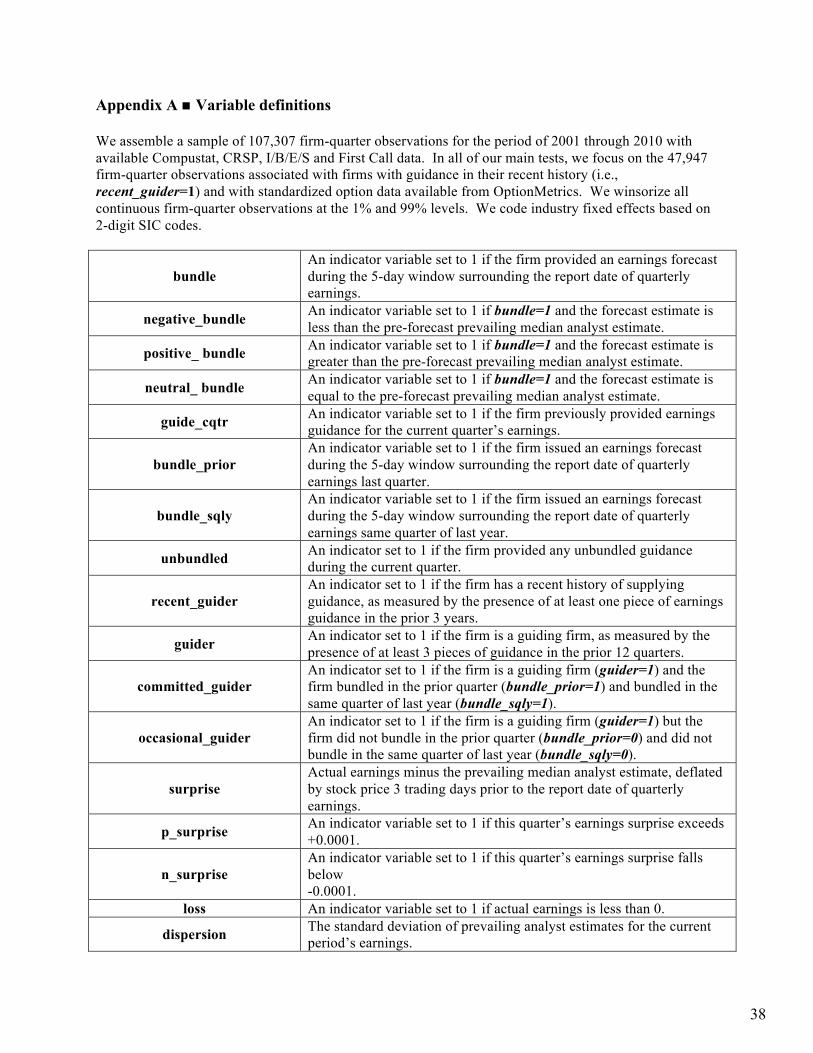
Appendix A n Variable definitions We assemble a sample of 107,307 firm-quarter observations for the period of 2001 through 2010 with available Compustat, CRSP, I/B/E/S and First Call data. In all of our main tests, we focus on the 47,947 firm-quarter observations associated with firms with guidance in their recent history (i.e., recent_guider=1) and with standardized option data available from OptionMetrics. We winsorize all continuous firm-quarter observations at the 1% and 99% levels. We code industry fixed effects based on 2-digit SIC codes.
bundle An indicator variable set to 1 if the firm provided an earnings forecast during the 5-day window surrounding the report date of quarterly earnings.
negative_bundle An indicator variable set to 1 if bundle=1 and the forecast estimate is less than the pre-forecast prevailing median analyst estimate.
positive_ bundle An indicator variable set to 1 if bundle=1 and the forecast estimate is greater than the pre-forecast prevailing median analyst estimate.
neutral_ bundle An indicator variable set to 1 if bundle=1 and the forecast estimate is equal to the pre-forecast prevailing median analyst estimate.
guide_cqtr An indicator variable set to 1 if the firm previously provided earnings guidance for the current quarter’s earnings.
bundle_prior An indicator variable set to 1 if the firm issued an earnings forecast during the 5-day window surrounding the report date of quarterly earnings last quarter.
bundle_sqly An indicator variable set to 1 if the firm issued an earnings forecast during the 5-day window surrounding the report date of quarterly earnings same quarter of last year.
unbundled An indicator set to 1 if the firm provided any unbundled guidance during the current quarter.
recent_guider An indicator set to 1 if the firm has a recent history of supplying guidance, as measured by the presence of at least one piece of earnings guidance in the prior 3 years.
guider An indicator set to 1 if the firm is a guiding firm, as measured by the presence of at least 3 pieces of guidance in the prior 12 quarters.
committed_guider An indicator set to 1 if the firm is a guiding firm (guider=1) and the firm bundled in the prior quarter (bundle_prior=1) and bundled in the same quarter of last year (bundle_sqly=1).
occasional_guider An indicator set to 1 if the firm is a guiding firm (guider=1) but the firm did not bundle in the prior quarter (bundle_prior=0) and did not bundle in the same quarter of last year (bundle_sqly=0).
surprise Actual earnings minus the prevailing median analyst estimate, deflated by stock price 3 trading days prior to the report date of quarterly earnings.
p_surprise An indicator variable set to 1 if this quarter’s earnings surprise exceeds +0.0001.
n_surprise An indicator variable set to 1 if this quarter’s earnings surprise falls below -0.0001.
loss An indicator variable set to 1 if actual earnings is less than 0.
dispersion The standard deviation of prevailing analyst estimates for the current period’s earnings.
38
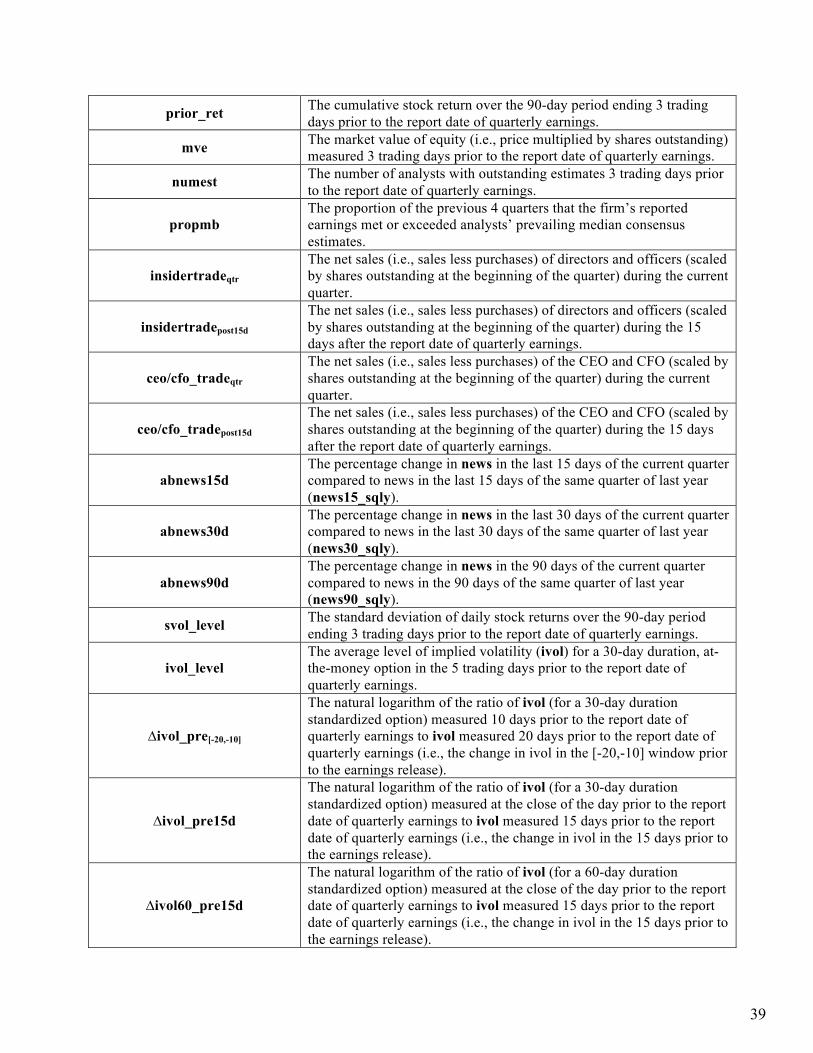
prior_ret The cumulative stock return over the 90-day period ending 3 trading days prior to the report date of quarterly earnings.
mve The market value of equity (i.e., price multiplied by shares outstanding) measured 3 trading days prior to the report date of quarterly earnings.
numest The number of analysts with outstanding estimates 3 trading days prior to the report date of quarterly earnings.
propmb The proportion of the previous 4 quarters that the firm’s reported earnings met or exceeded analysts’ prevailing median consensus estimates.
insidertradeqtr The net sales (i.e., sales less purchases) of directors and officers (scaled by shares outstanding at the beginning of the quarter) during the current quarter.
insidertradepost15d The net sales (i.e., sales less purchases) of directors and officers (scaled by shares outstanding at the beginning of the quarter) during the 15 days after the report date of quarterly earnings.
ceo/cfo_tradeqtr The net sales (i.e., sales less purchases) of the CEO and CFO (scaled by shares outstanding at the beginning of the quarter) during the current quarter.
ceo/cfo_tradepost15d The net sales (i.e., sales less purchases) of the CEO and CFO (scaled by shares outstanding at the beginning of the quarter) during the 15 days after the report date of quarterly earnings.
abnews15d The percentage change in news in the last 15 days of the current quarter compared to news in the last 15 days of the same quarter of last year (news15_sqly).
abnews30d The percentage change in news in the last 30 days of the current quarter compared to news in the last 30 days of the same quarter of last year (news30_sqly).
abnews90d The percentage change in news in the 90 days of the current quarter compared to news in the 90 days of the same quarter of last year (news90_sqly).
svol_level The standard deviation of daily stock returns over the 90-day period ending 3 trading days prior to the report date of quarterly earnings.
ivol_level The average level of implied volatility (ivol) for a 30-day duration, at-the-money option in the 5 trading days prior to the report date of quarterly earnings.
∆ivol_pre[-20,-10]
The natural logarithm of the ratio of ivol (for a 30-day duration standardized option) measured 10 days prior to the report date of quarterly earnings to ivol measured 20 days prior to the report date of quarterly earnings (i.e., the change in ivol in the [-20,-10] window prior to the earnings release).
∆ivol_pre15d
The natural logarithm of the ratio of ivol (for a 30-day duration standardized option) measured at the close of the day prior to the report date of quarterly earnings to ivol measured 15 days prior to the report date of quarterly earnings (i.e., the change in ivol in the 15 days prior to the earnings release).
∆ivol60_pre15d
The natural logarithm of the ratio of ivol (for a 60-day duration standardized option) measured at the close of the day prior to the report date of quarterly earnings to ivol measured 15 days prior to the report date of quarterly earnings (i.e., the change in ivol in the 15 days prior to the earnings release).
39

∆ivol91_pre15d
The natural logarithm of the ratio of ivol (for a 91-day duration standardized option) measured at the close of the day prior to the report date of quarterly earnings to ivol measured 15 days prior to the report date of quarterly earnings (i.e., the change in ivol in the 15 days prior to the earnings release).
∆ivol_pre3d
The natural logarithm of the ratio of ivol (for a 30-day duration standardized option) measured at the close of the day prior to the report date of quarterly earnings to ivol measured 3 days prior to the report date of quarterly earnings (i.e., the change in ivol in the 3 days prior to the earnings release).
∆ivol_rdq
The natural logarithm of the ratio of ivol (for a 30-day duration standardized option) measured at the close of the report date of quarterly earnings to ivol measured at the close of the day prior to the report date of quarterly earnings (i.e., the change in ivol on the day of the earnings release).
∆ivol_post3d
The natural logarithm of the ratio of ivol (for a 30-day duration standardized option) measured 3 days after the report date of quarterly earnings to ivol measured as of the close of the report date of quarterly earnings (i.e., the change in ivol in the 3 days following the earnings release).
∆ivol_post15d
The natural logarithm of the ratio of ivol (for a 30-day duration standardized option) measured 15 days after the report date of quarterly earnings to ivol measured as of the close of the report date of quarterly earnings (i.e., the change in ivol in the 15 days following the earnings release).
∆ivol60_post15d
The natural logarithm of the ratio of ivol (for a 60-day duration standardized option) measured 15 days after the report date of quarterly earnings to ivol measured as of the close of the report date of quarterly earnings (i.e., the change in ivol in the 15 days following the earnings release).
avg∆ivol_pre15d4q The average of ∆ivol_pre15d for the prior 4 quarters. avg∆ivol_post15d4q The average of ∆ivol_post15d for the prior 4 quarters.
∆ivol_pre15d_unbundled
The natural logarithm of the ratio of ivol (for a 30-day duration standardized option) measured at the close of the day 15 days prior to the issuance of an unbundled forecast to ivol measured 1 day prior to the issuance of an unbundled forecast (i.e., the change in ivol in the 15 days prior to an unbundled forecast). ∆ivol_pre15d_unbundled_prior is ∆ivol_pre15d_unbundled measured in the same time of the prior quarter. ∆ivol_pre15d_unbundled_sqly is ∆ivol_pre15d_unbundled measured in the same time of the same quarter of last year.
vix_level The level of the Chicago Board Options Exchange Volatility Index on the report date of quarterly earnings.
∆vix The natural logarithm of the ratio of vix_level measured 1 day after the earnings announcement to the vix_level measured 1 day prior to the earnings announcement.
40
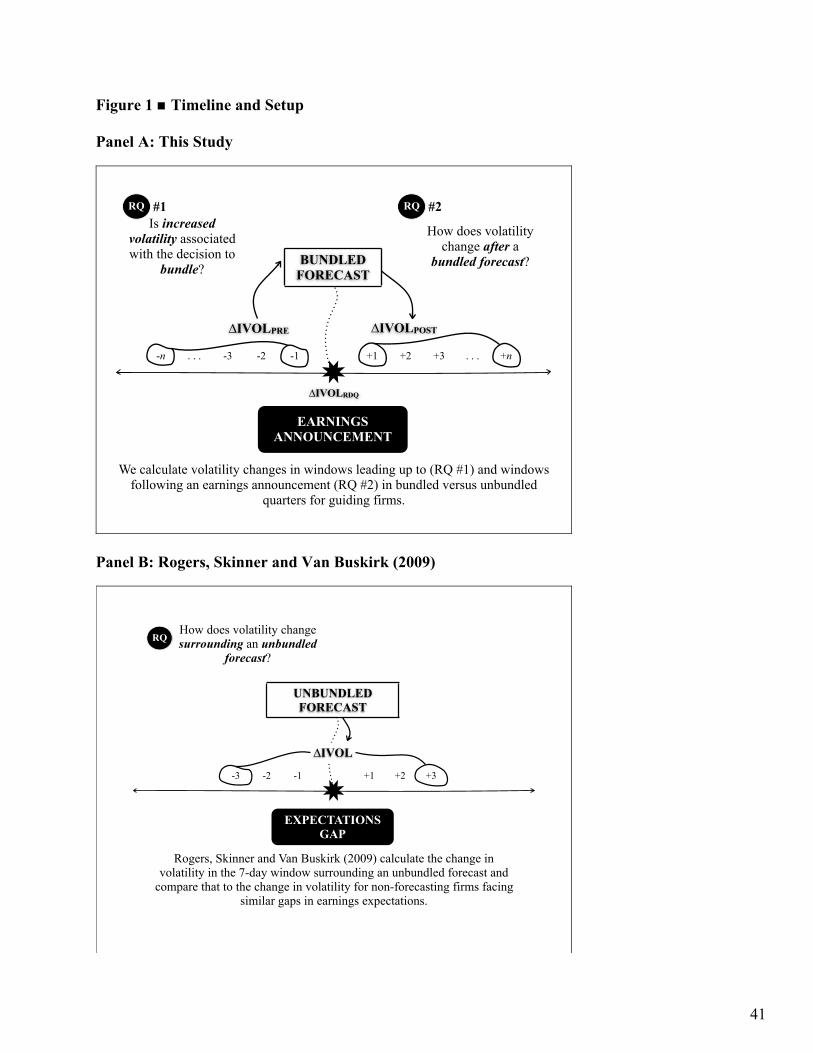
Figure 1 n Timeline and Setup Panel A: This Study
∆IVOLRDQ
Is increased volatility associated with the decision to
bundle?
✸-n . . . -3 -2 -1 +1 +2 +3 . . . +n
∆IVOLPRE
EARNINGS ANNOUNCEMENT
∆IVOLPOST
We calculate volatility changes in windows leading up to (RQ #1) and windows following an earnings announcement (RQ #2) in bundled versus unbundled
quarters for guiding firms.
#1RQ
How does volatility change after a
bundled forecast?
#2RQ
BUNDLED FORECAST
Panel B: Rogers, Skinner and Van Buskirk (2009)
UNBUNDLED FORECAST
✸-3 -2 -1 +1 +2 +3
EXPECTATIONS GAP
∆IVOL
Rogers, Skinner and Van Buskirk (2009) calculate the change in volatility in the 7-day window surrounding an unbundled forecast and
compare that to the change in volatility for non-forecasting firms facing similar gaps in earnings expectations.
RQHow does volatility change surrounding an unbundled
forecast?
41
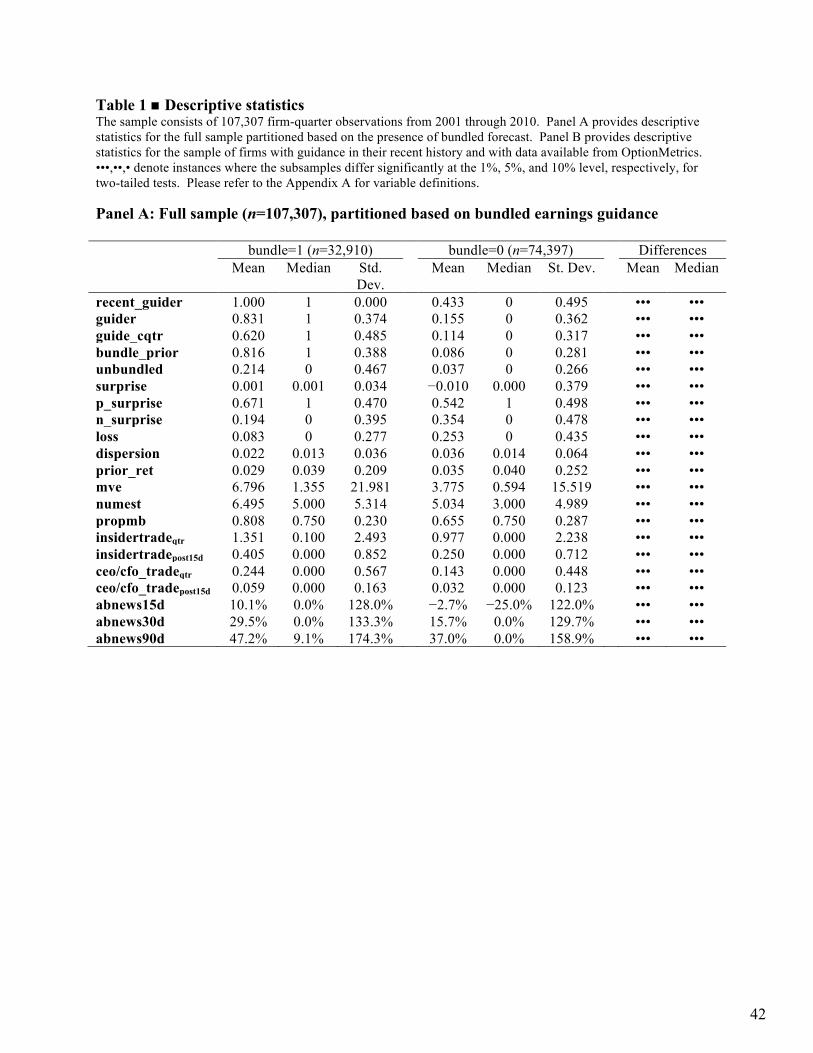
Table 1 n Descriptive statistics The sample consists of 107,307 firm-quarter observations from 2001 through 2010. Panel A provides descriptive statistics for the full sample partitioned based on the presence of bundled forecast. Panel B provides descriptive statistics for the sample of firms with guidance in their recent history and with data available from OptionMetrics. •••,••,• denote instances where the subsamples differ significantly at the 1%, 5%, and 10% level, respectively, for two-tailed tests. Please refer to the Appendix A for variable definitions. Panel A: Full sample (n=107,307), partitioned based on bundled earnings guidance bundle=1 (n=32,910) bundle=0 (n=74,397) Differences Mean Median Std.
Dev. Mean Median St. Dev. Mean Median
recent_guider 1.000 1 0.000 0.433 0 0.495 ••• ••• guider 0.831 1 0.374 0.155 0 0.362 ••• ••• guide_cqtr 0.620 1 0.485 0.114 0 0.317 ••• ••• bundle_prior 0.816 1 0.388 0.086 0 0.281 ••• ••• unbundled 0.214 0 0.467 0.037 0 0.266 ••• ••• surprise 0.001 0.001 0.034 −0.010 0.000 0.379 ••• ••• p_surprise 0.671 1 0.470 0.542 1 0.498 ••• ••• n_surprise 0.194 0 0.395 0.354 0 0.478 ••• ••• loss 0.083 0 0.277 0.253 0 0.435 ••• ••• dispersion 0.022 0.013 0.036 0.036 0.014 0.064 ••• ••• prior_ret 0.029 0.039 0.209 0.035 0.040 0.252 ••• ••• mve 6.796 1.355 21.981 3.775 0.594 15.519 ••• ••• numest 6.495 5.000 5.314 5.034 3.000 4.989 ••• ••• propmb 0.808 0.750 0.230 0.655 0.750 0.287 ••• ••• insidertradeqtr 1.351 0.100 2.493 0.977 0.000 2.238 ••• ••• insidertradepost15d 0.405 0.000 0.852 0.250 0.000 0.712 ••• ••• ceo/cfo_tradeqtr 0.244 0.000 0.567 0.143 0.000 0.448 ••• ••• ceo/cfo_tradepost15d 0.059 0.000 0.163 0.032 0.000 0.123 ••• ••• abnews15d 10.1% 0.0% 128.0% −2.7% −25.0% 122.0% ••• ••• abnews30d 29.5% 0.0% 133.3% 15.7% 0.0% 129.7% ••• ••• abnews90d 47.2% 9.1% 174.3% 37.0% 0.0% 158.9% ••• •••
42
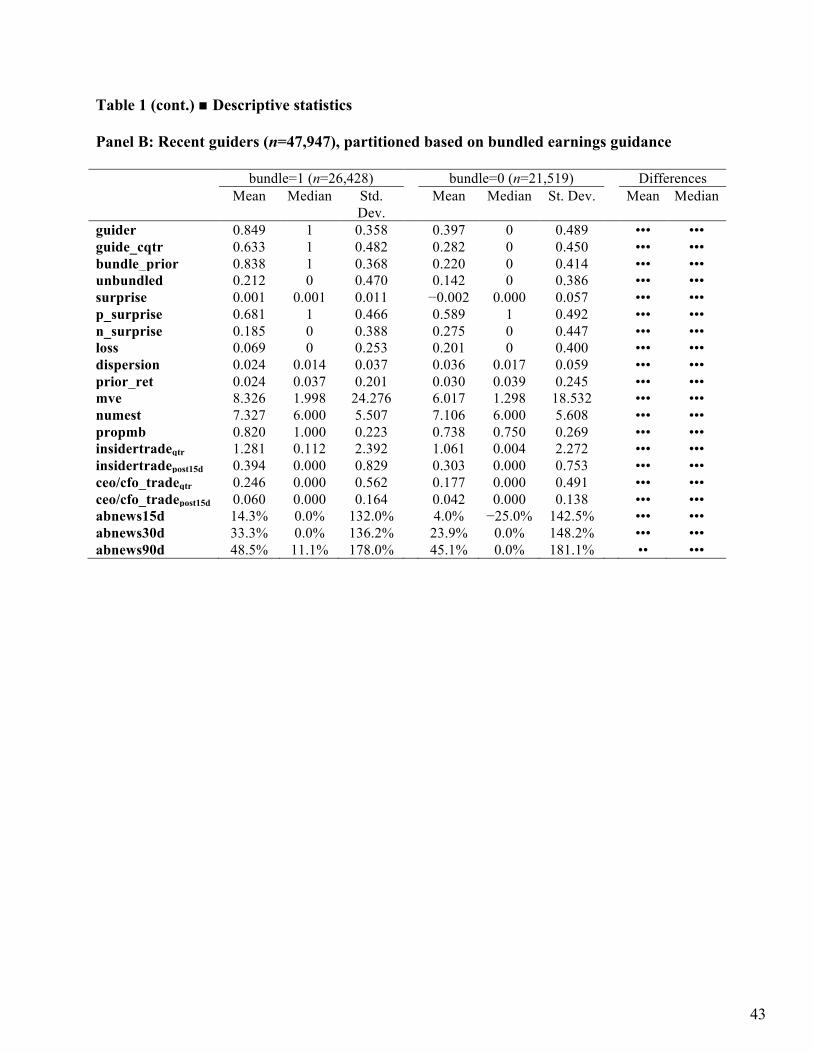
Table 1 (cont.) n Descriptive statistics Panel B: Recent guiders (n=47,947), partitioned based on bundled earnings guidance bundle=1 (n=26,428) bundle=0 (n=21,519) Differences Mean Median Std.
Dev. Mean Median St. Dev. Mean Median
guider 0.849 1 0.358 0.397 0 0.489 ••• ••• guide_cqtr 0.633 1 0.482 0.282 0 0.450 ••• ••• bundle_prior 0.838 1 0.368 0.220 0 0.414 ••• ••• unbundled 0.212 0 0.470 0.142 0 0.386 ••• ••• surprise 0.001 0.001 0.011 −0.002 0.000 0.057 ••• ••• p_surprise 0.681 1 0.466 0.589 1 0.492 ••• ••• n_surprise 0.185 0 0.388 0.275 0 0.447 ••• ••• loss 0.069 0 0.253 0.201 0 0.400 ••• ••• dispersion 0.024 0.014 0.037 0.036 0.017 0.059 ••• ••• prior_ret 0.024 0.037 0.201 0.030 0.039 0.245 ••• ••• mve 8.326 1.998 24.276 6.017 1.298 18.532 ••• ••• numest 7.327 6.000 5.507 7.106 6.000 5.608 ••• ••• propmb 0.820 1.000 0.223 0.738 0.750 0.269 ••• ••• insidertradeqtr 1.281 0.112 2.392 1.061 0.004 2.272 ••• ••• insidertradepost15d 0.394 0.000 0.829 0.303 0.000 0.753 ••• ••• ceo/cfo_tradeqtr 0.246 0.000 0.562 0.177 0.000 0.491 ••• ••• ceo/cfo_tradepost15d 0.060 0.000 0.164 0.042 0.000 0.138 ••• ••• abnews15d 14.3% 0.0% 132.0% 4.0% −25.0% 142.5% ••• ••• abnews30d 33.3% 0.0% 136.2% 23.9% 0.0% 148.2% ••• ••• abnews90d 48.5% 11.1% 178.0% 45.1% 0.0% 181.1% •• •••
43
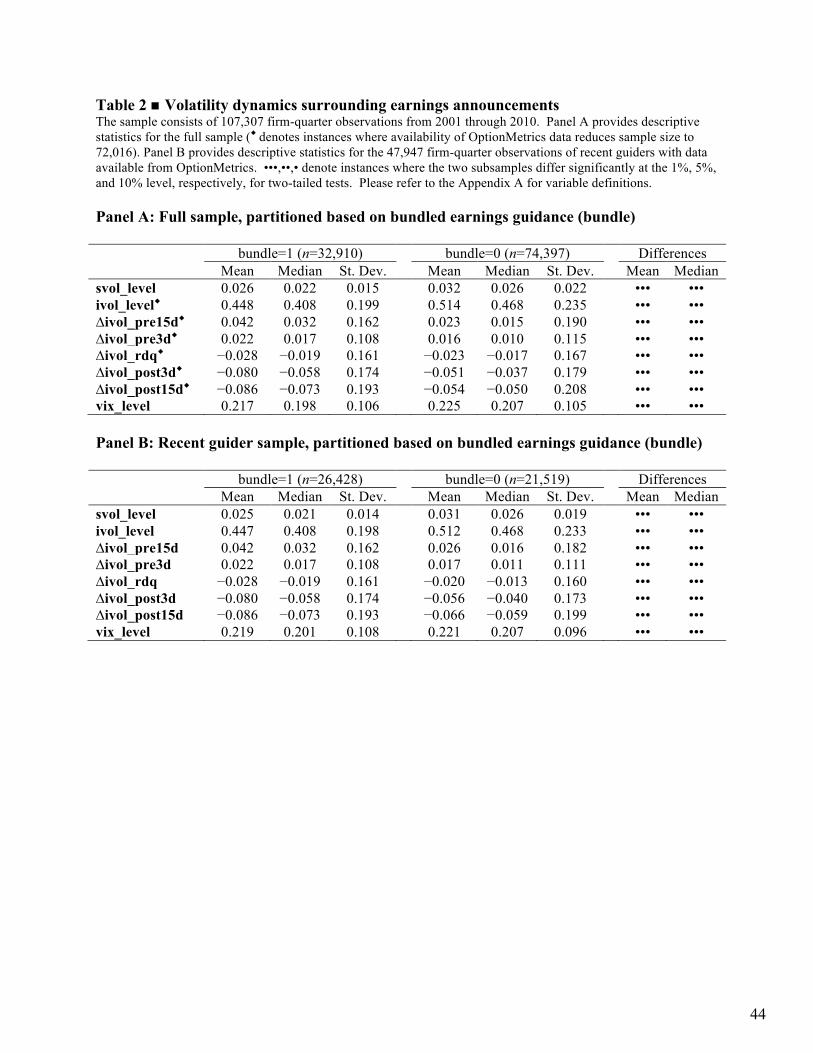
Table 2 n Volatility dynamics surrounding earnings announcements The sample consists of 107,307 firm-quarter observations from 2001 through 2010. Panel A provides descriptive statistics for the full sample (® denotes instances where availability of OptionMetrics data reduces sample size to 72,016). Panel B provides descriptive statistics for the 47,947 firm-quarter observations of recent guiders with data available from OptionMetrics. •••,••,• denote instances where the two subsamples differ significantly at the 1%, 5%, and 10% level, respectively, for two-tailed tests. Please refer to the Appendix A for variable definitions. Panel A: Full sample, partitioned based on bundled earnings guidance (bundle) bundle=1 (n=32,910) bundle=0 (n=74,397) Differences Mean Median St. Dev. Mean Median St. Dev. Mean Median svol_level 0.026 0.022 0.015 0.032 0.026 0.022 ••• ••• ivol_level® 0.448 0.408 0.199 0.514 0.468 0.235 ••• ••• ∆ivol_pre15d® 0.042 0.032 0.162 0.023 0.015 0.190 ••• ••• ∆ivol_pre3d® 0.022 0.017 0.108 0.016 0.010 0.115 ••• ••• ∆ivol_rdq® −0.028 −0.019 0.161 −0.023 −0.017 0.167 ••• ••• ∆ivol_post3d® −0.080 −0.058 0.174 −0.051 −0.037 0.179 ••• ••• ∆ivol_post15d® −0.086 −0.073 0.193 −0.054 −0.050 0.208 ••• ••• vix_level 0.217 0.198 0.106 0.225 0.207 0.105 ••• ••• Panel B: Recent guider sample, partitioned based on bundled earnings guidance (bundle) bundle=1 (n=26,428) bundle=0 (n=21,519) Differences Mean Median St. Dev. Mean Median St. Dev. Mean Median svol_level 0.025 0.021 0.014 0.031 0.026 0.019 ••• ••• ivol_level 0.447 0.408 0.198 0.512 0.468 0.233 ••• ••• ∆ivol_pre15d 0.042 0.032 0.162 0.026 0.016 0.182 ••• ••• ∆ivol_pre3d 0.022 0.017 0.108 0.017 0.011 0.111 ••• ••• ∆ivol_rdq −0.028 −0.019 0.161 −0.020 −0.013 0.160 ••• ••• ∆ivol_post3d −0.080 −0.058 0.174 −0.056 −0.040 0.173 ••• ••• ∆ivol_post15d −0.086 −0.073 0.193 −0.066 −0.059 0.199 ••• ••• vix_level 0.219 0.201 0.108 0.221 0.207 0.096 ••• •••
44
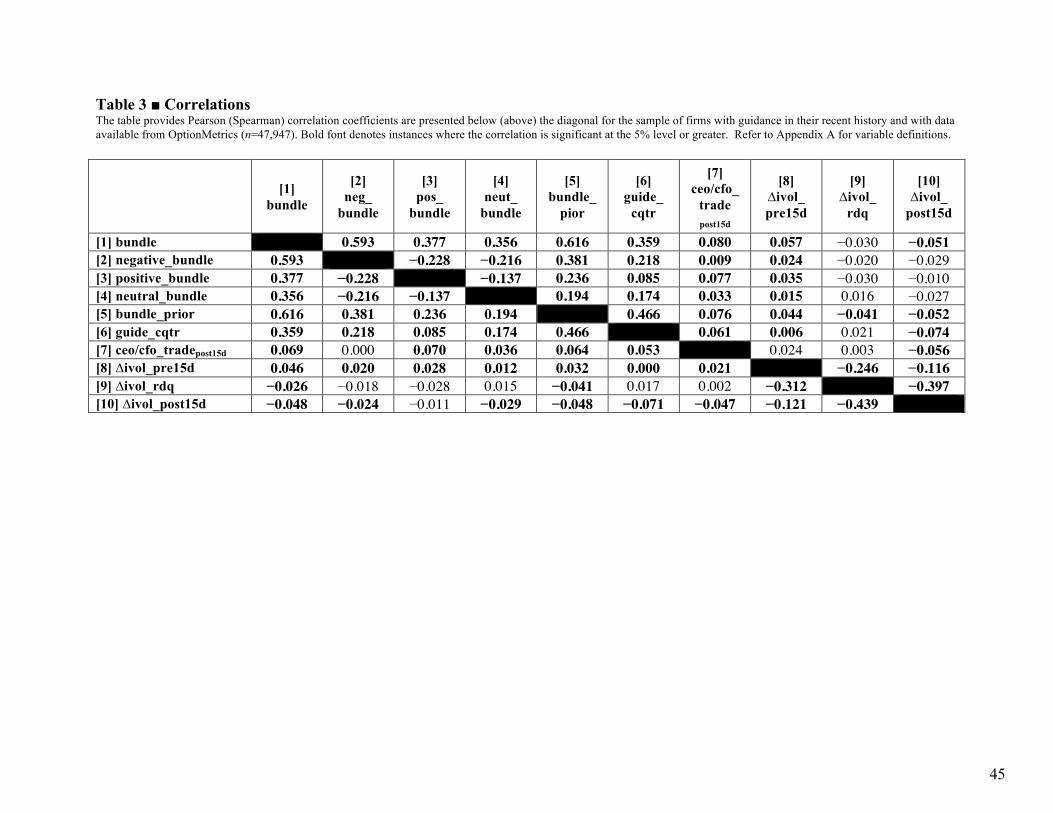
Table 3 ■ Correlations The table provides Pearson (Spearman) correlation coefficients are presented below (above) the diagonal for the sample of firms with guidance in their recent history and with data available from OptionMetrics (n=47,947). Bold font denotes instances where the correlation is significant at the 5% level or greater. Refer to Appendix A for variable definitions.
[1] bundle
[2] neg_
bundle
[3] pos_
bundle
[4] neut_
bundle
[5] bundle_
pior
[6] guide_
cqtr
[7] ceo/cfo_
trade post15d
[8] ∆ivol_ pre15d
[9] ∆ivol_
rdq
[10] ∆ivol_
post15d
[1] bundle 0.593 0.377 0.356 0.616 0.359 0.080 0.057 −0.030 −0.051 [2] negative_bundle 0.593 −0.228 −0.216 0.381 0.218 0.009 0.024 −0.020 −0.029 [3] positive_bundle 0.377 −0.228 −0.137 0.236 0.085 0.077 0.035 −0.030 −0.010 [4] neutral_bundle 0.356 −0.216 −0.137 0.194 0.174 0.033 0.015 0.016 −0.027 [5] bundle_prior 0.616 0.381 0.236 0.194 0.466 0.076 0.044 −0.041 −0.052 [6] guide_cqtr 0.359 0.218 0.085 0.174 0.466 0.061 0.006 0.021 −0.074 [7] ceo/cfo_tradepost15d 0.069 0.000 0.070 0.036 0.064 0.053 0.024 0.003 −0.056 [8] ∆ivol_pre15d 0.046 0.020 0.028 0.012 0.032 0.000 0.021 −0.246 −0.116 [9] ∆ivol_rdq −0.026 −0.018 −0.028 0.015 −0.041 0.017 0.002 −0.312 −0.397 [10] ∆ivol_post15d −0.048 −0.024 −0.011 −0.029 −0.048 −0.071 −0.047 −0.121 −0.439
45
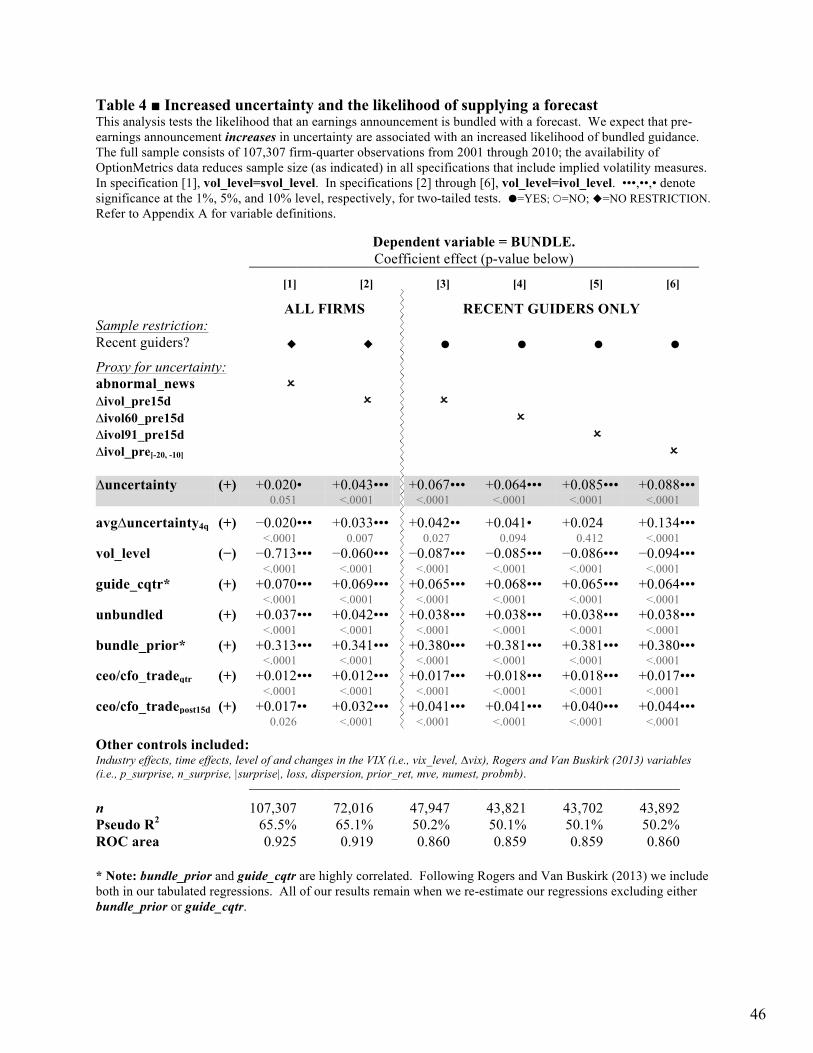
Table 4 ■ Increased uncertainty and the likelihood of supplying a forecast This analysis tests the likelihood that an earnings announcement is bundled with a forecast. We expect that pre-earnings announcement increases in uncertainty are associated with an increased likelihood of bundled guidance. The full sample consists of 107,307 firm-quarter observations from 2001 through 2010; the availability of OptionMetrics data reduces sample size (as indicated) in all specifications that include implied volatility measures. In specification [1], vol_level=svol_level. In specifications [2] through [6], vol_level=ivol_level. •••,••,• denote significance at the 1%, 5%, and 10% level, respectively, for two-tailed tests. �=YES; �=NO; u=NO RESTRICTION. Refer to Appendix A for variable definitions.
Dependent variable = BUNDLE.
Coefficient effect (p-value below) [1] [2] [3] [4] [5] [6]
ALL FIRMS RECENT GUIDERS ONLY Sample restriction:
Recent guiders? u u � � � �
Proxy for uncertainty: abnormal_news O ∆ivol_pre15d O O ∆ivol60_pre15d O ∆ivol91_pre15d O ∆ivol_pre[-20, -10] O ∆uncertainty (+) +0.020 • +0.043 ••• +0.067 ••• +0.064 ••• +0.085 ••• +0.088 ••• 0.051 <.0001 <.0001 <.0001 <.0001 <.0001
avg∆uncertainty4q (+) −0.020 ••• +0.033 ••• +0.042 •• +0.041 • +0.024 +0.134 ••• <.0001 0.007 0.027 0.094 0.412 <.0001 vol_level (−) −0.713 ••• −0.060 ••• −0.087 ••• −0.085 ••• −0.086 ••• −0.094 ••• <.0001 <.0001 <.0001 <.0001 <.0001 <.0001 guide_cqtr* (+) +0.070 ••• +0.069 ••• +0.065 ••• +0.068 ••• +0.065 ••• +0.064 ••• <.0001 <.0001 <.0001 <.0001 <.0001 <.0001 unbundled (+) +0.037 ••• +0.042 ••• +0.038 ••• +0.038 ••• +0.038 ••• +0.038 ••• <.0001 <.0001 <.0001 <.0001 <.0001 <.0001 bundle_prior* (+) +0.313 ••• +0.341 ••• +0.380 ••• +0.381 ••• +0.381 ••• +0.380 ••• <.0001 <.0001 <.0001 <.0001 <.0001 <.0001 ceo/cfo_tradeqtr (+) +0.012 ••• +0.012 ••• +0.017 ••• +0.018 ••• +0.018 ••• +0.017 ••• <.0001 <.0001 <.0001 <.0001 <.0001 <.0001 ceo/cfo_tradepost15d (+) +0.017 •• +0.032 ••• +0.041 ••• +0.041 ••• +0.040 ••• +0.044 ••• 0.026 <.0001 <.0001 <.0001 <.0001 <.0001
Other controls included: Industry effects, time effects, level of and changes in the VIX (i.e., vix_level, ∆vix), Rogers and Van Buskirk (2013) variables (i.e., p_surprise, n_surprise, |surprise|, loss, dispersion, prior_ret, mve, numest, probmb).
n 107,307 72,016 47,947 43,821 43,702 43,892 Pseudo R2 65.5% 65.1% 50.2% 50.1% 50.1% 50.2% ROC area 0.925 0.919 0.860 0.859 0.859 0.860 * Note: bundle_prior and guide_cqtr are highly correlated. Following Rogers and Van Buskirk (2013) we include both in our tabulated regressions. All of our results remain when we re-estimate our regressions excluding either bundle_prior or guide_cqtr.
46

Table 5 n Is the run-up in volatility related to the market’s expectation of guidance? Panel A: Bundled guidance frequency by expectation of guidance This analysis examines the 29,228 firm-quarter observations of guiding firms (guider=1). In an effort to limit variation in the extent to which investors might reasonably anticipate guidance (i.e., to hold constant the market’s expectation of guidance), we examine subsamples where investors are more likely (committed_guider=1) or less likely (occasional_guider=1) to anticipate the presence of the guidance. Refer to Appendix A for variable definitions.
Did the firm bundle in the current quarter? Total % bundled in the
current quarter
No Yes MORE LIKELY TO EXPECT GUIDANCE:
Bundled in the same quarter last year (bundle_sqly=1)
3,647 14,670 18,317 80.1%
Bundled in the same quarter last year and in the prior quarter (bundle_sqly=1) and (bundle_prior=1)
1,974 13,498 15,472 87.2% COMMITTED GUIDERS
LESS LIKELY TO EXPECT GUIDANCE:
Did not bundle same quarter last year (bundle_sqly=0)
4,420 6,491 10,911 59.5%
Did not bundle same quarter last year or in the prior quarter (bundle_sqly=0) and (bundle_prior=0)
2,951 941 3,892 24.2% OCCASIONAL GUIDERS
47
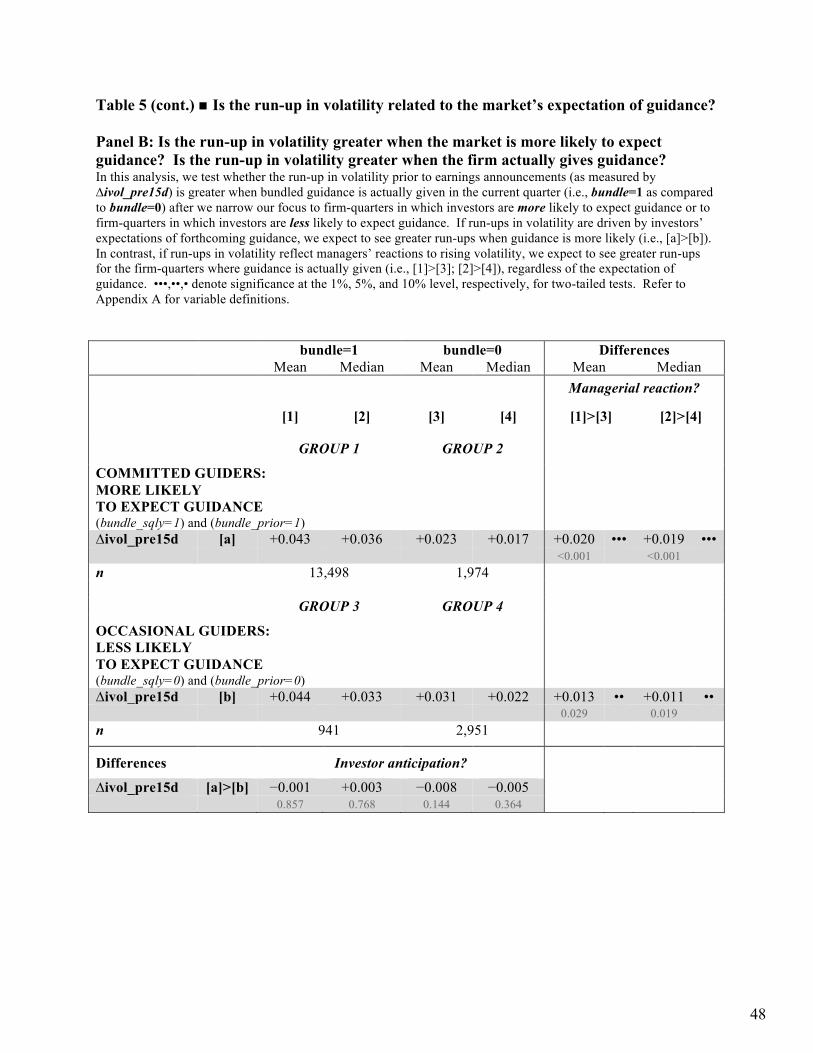
Table 5 (cont.) n Is the run-up in volatility related to the market’s expectation of guidance? Panel B: Is the run-up in volatility greater when the market is more likely to expect guidance? Is the run-up in volatility greater when the firm actually gives guidance? In this analysis, we test whether the run-up in volatility prior to earnings announcements (as measured by ∆ivol_pre15d) is greater when bundled guidance is actually given in the current quarter (i.e., bundle=1 as compared to bundle=0) after we narrow our focus to firm-quarters in which investors are more likely to expect guidance or to firm-quarters in which investors are less likely to expect guidance. If run-ups in volatility are driven by investors’ expectations of forthcoming guidance, we expect to see greater run-ups when guidance is more likely (i.e., [a]>[b]). In contrast, if run-ups in volatility reflect managers’ reactions to rising volatility, we expect to see greater run-ups for the firm-quarters where guidance is actually given (i.e., [1]>[3]; [2]>[4]), regardless of the expectation of guidance. •••,••,• denote significance at the 1%, 5%, and 10% level, respectively, for two-tailed tests. Refer to Appendix A for variable definitions. bundle=1 bundle=0 Differences Mean Median Mean Median Mean Median Managerial reaction? [1] [2] [3] [4] [1]>[3] [2]>[4]
GROUP 1 GROUP 2
COMMITTED GUIDERS: MORE LIKELY TO EXPECT GUIDANCE (bundle_sqly=1) and (bundle_prior=1)
∆ivol_pre15d [a] +0.043 +0.036 +0.023 +0.017 +0.020 ••• +0.019 ••• <0.001 <0.001 n 13,498 1,974 GROUP 3 GROUP 4
OCCASIONAL GUIDERS: LESS LIKELY TO EXPECT GUIDANCE (bundle_sqly=0) and (bundle_prior=0)
∆ivol_pre15d [b] +0.044 +0.033 +0.031 +0.022 +0.013 •• +0.011 •• 0.029 0.019 n 941 2,951
Differences Investor anticipation?
∆ivol_pre15d [a]>[b] −0.001 +0.003 −0.008 −0.005 0.857 0.768 0.144 0.364
48
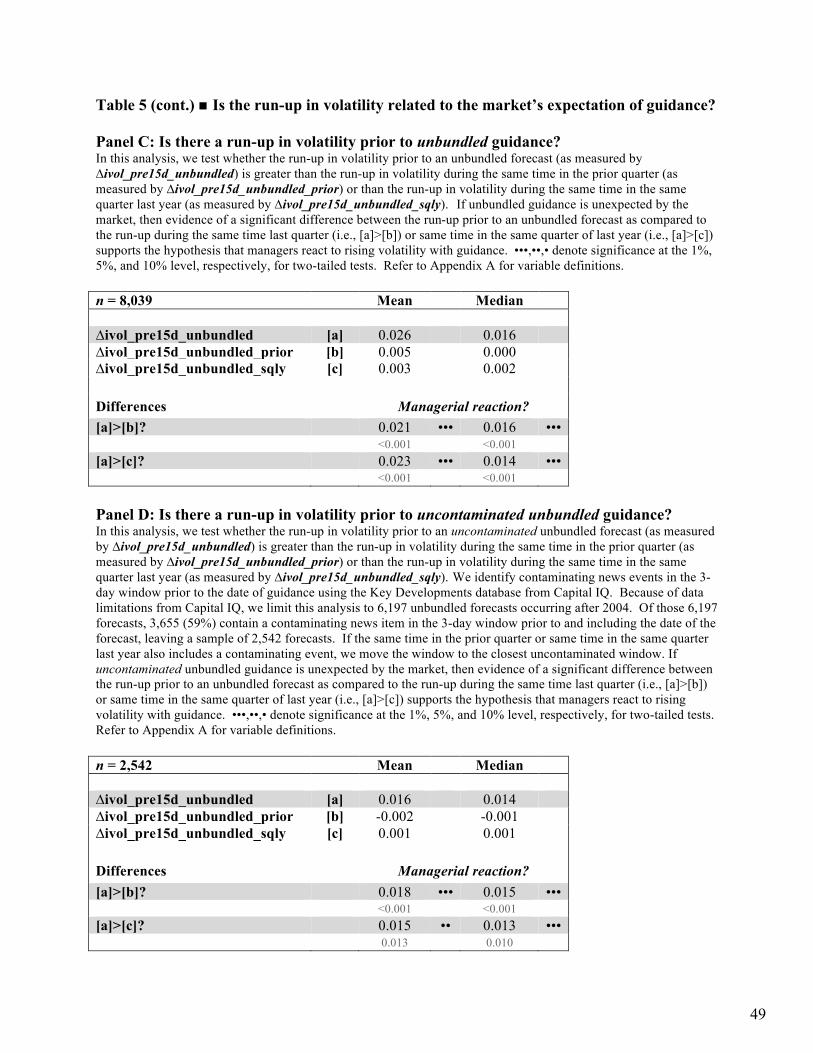
Table 5 (cont.) n Is the run-up in volatility related to the market’s expectation of guidance? Panel C: Is there a run-up in volatility prior to unbundled guidance? In this analysis, we test whether the run-up in volatility prior to an unbundled forecast (as measured by ∆ivol_pre15d_unbundled) is greater than the run-up in volatility during the same time in the prior quarter (as measured by ∆ivol_pre15d_unbundled_prior) or than the run-up in volatility during the same time in the same quarter last year (as measured by ∆ivol_pre15d_unbundled_sqly). If unbundled guidance is unexpected by the market, then evidence of a significant difference between the run-up prior to an unbundled forecast as compared to the run-up during the same time last quarter (i.e., [a]>[b]) or same time in the same quarter of last year (i.e., [a]>[c]) supports the hypothesis that managers react to rising volatility with guidance. •••,••,• denote significance at the 1%, 5%, and 10% level, respectively, for two-tailed tests. Refer to Appendix A for variable definitions. n = 8,039 Mean Median ∆ivol_pre15d_unbundled [a] 0.026 0.016 ∆ivol_pre15d_unbundled_prior [b] 0.005 0.000 ∆ivol_pre15d_unbundled_sqly [c] 0.003 0.002 Differences Managerial reaction? [a]>[b]? 0.021 ••• 0.016 ••• <0.001 <0.001 [a]>[c]? 0.023 ••• 0.014 ••• <0.001 <0.001
Panel D: Is there a run-up in volatility prior to uncontaminated unbundled guidance? In this analysis, we test whether the run-up in volatility prior to an uncontaminated unbundled forecast (as measured by ∆ivol_pre15d_unbundled) is greater than the run-up in volatility during the same time in the prior quarter (as measured by ∆ivol_pre15d_unbundled_prior) or than the run-up in volatility during the same time in the same quarter last year (as measured by ∆ivol_pre15d_unbundled_sqly). We identify contaminating news events in the 3-day window prior to the date of guidance using the Key Developments database from Capital IQ. Because of data limitations from Capital IQ, we limit this analysis to 6,197 unbundled forecasts occurring after 2004. Of those 6,197 forecasts, 3,655 (59%) contain a contaminating news item in the 3-day window prior to and including the date of the forecast, leaving a sample of 2,542 forecasts. If the same time in the prior quarter or same time in the same quarter last year also includes a contaminating event, we move the window to the closest uncontaminated window. If uncontaminated unbundled guidance is unexpected by the market, then evidence of a significant difference between the run-up prior to an unbundled forecast as compared to the run-up during the same time last quarter (i.e., [a]>[b]) or same time in the same quarter of last year (i.e., [a]>[c]) supports the hypothesis that managers react to rising volatility with guidance. •••,••,• denote significance at the 1%, 5%, and 10% level, respectively, for two-tailed tests. Refer to Appendix A for variable definitions. n = 2,542 Mean Median ∆ivol_pre15d_unbundled [a] 0.016 0.014 ∆ivol_pre15d_unbundled_prior [b] -0.002 -0.001 ∆ivol_pre15d_unbundled_sqly [c] 0.001 0.001 Differences Managerial reaction? [a]>[b]? 0.018 ••• 0.015 ••• <0.001 <0.001 [a]>[c]? 0.015 •• 0.013 ••• 0.013 0.010
49

Table 6 ■ Holding constant the expectation of guidance: committed vs. occasional guiders This analysis tests the likelihood that an earnings announcement is bundled with a forecast for guiding firms (guider=1). In an effort to limit variation in the extent to which investors might reasonably anticipate guidance (i.e., to hold constant the market’s expectation of guidance), we examine subsamples where investors are more (see Panel A) or less (see Panel B) likely to anticipate the presence of the guidance. In all cases, we expect that increases in uncertainty (as measured by ∆ivol_pre15d) are associated with an increased likelihood of bundled guidance. •••,••,• denote significance at the 1%, 5%, and 10% level, respectively, for two-tailed tests. �=YES; �=NO; u=NO RESTRICTION. Refer to Appendix A for variable definitions. Panel A: Investors are more likely to expect guidance – COMMITTED GUIDERS In Panel A, we focus on the firm-quarters where investors are more likely to expect guidance. In [1] we focus on firm-quarters where managers bundled in the same quarter of last year (bundle_sqly=1) and in [2] we examine firm-quarters where managers bundled in the same quarter of last year and they also bundled in the prior quarter (bundle_sqly=1 and bundle_prior=1).
Dependent variable = BUNDLE.
Coefficient effect (p-value below)
[1] [2]
Sample restrictions: Bundled in same quarter of last year? � � Bundled prior? u �
∆uncertainty (+) +0.058 ••• +0.058 ••• <.0001 <.0001 avg∆uncertainty4q (+) −0.021 −0.046 0.485 0.128 guide_cqtr (+) +0.023 ••• +0.007 <.0001 0.254 unbundled (+) +0.048 ••• +0.030 ••• <.0001 <.0001 bundle_prior (+) +0.273 ••• N.A. <.0001 ceo/cfo_tradeqtr (+) +0.022 ••• +0.024 ••• <.0001 <.0001 ceo/cfo_tradepost15d (+) +0.071 ••• +0.053 ••• <.0001 0.004
Other controls included: Industry and time effects, level of and changes in the VIX (i.e., vix_level, ∆vix), vol_level, Rogers and Van Buskirk (2013) variables (i.e., p_surprise, n_surprise, |surprise|, loss, dispersion, prior_ret, mve, numest, probmb).
n 18,317 15,472 Adjusted R2 26.1% 5.7% ROC area 0.766 0.648
50
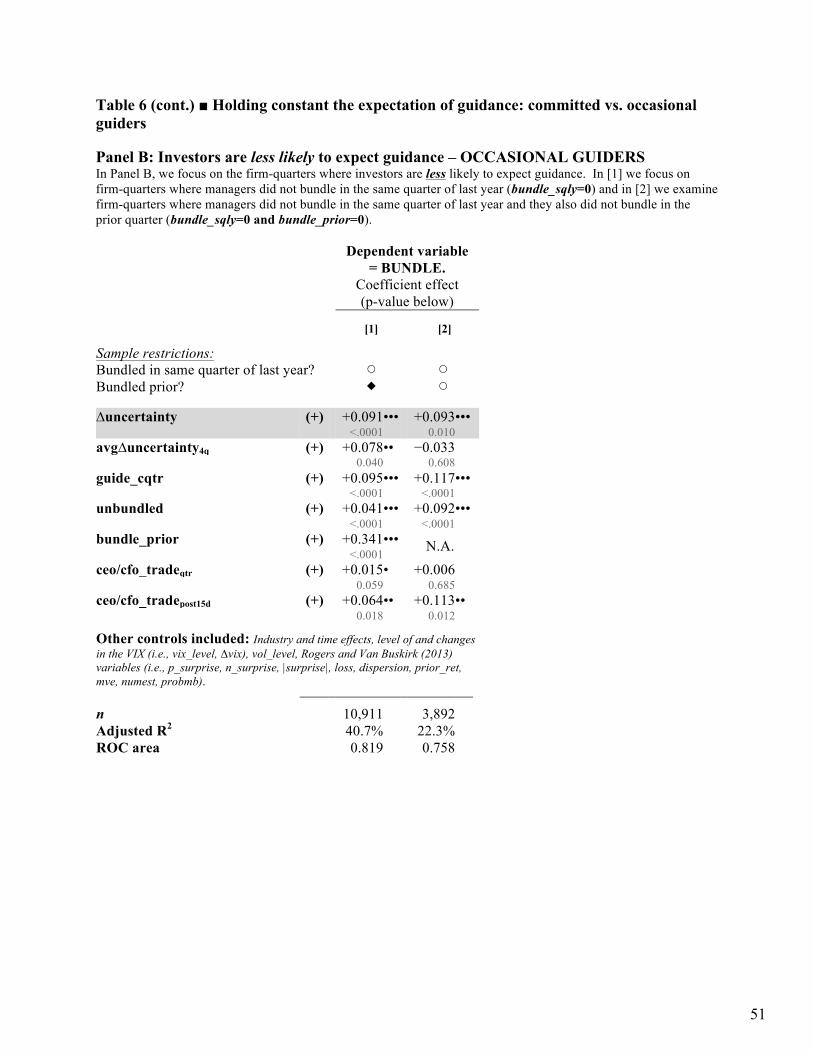
Table 6 (cont.) ■ Holding constant the expectation of guidance: committed vs. occasional guiders Panel B: Investors are less likely to expect guidance – OCCASIONAL GUIDERS In Panel B, we focus on the firm-quarters where investors are less likely to expect guidance. In [1] we focus on firm-quarters where managers did not bundle in the same quarter of last year (bundle_sqly=0) and in [2] we examine firm-quarters where managers did not bundle in the same quarter of last year and they also did not bundle in the prior quarter (bundle_sqly=0 and bundle_prior=0).
Dependent variable = BUNDLE.
Coefficient effect (p-value below)
[1] [2]
Sample restrictions: Bundled in same quarter of last year? � � Bundled prior? u �
∆uncertainty (+) +0.091 ••• +0.093 ••• <.0001 0.010 avg∆uncertainty4q (+) +0.078 •• −0.033 0.040 0.608 guide_cqtr (+) +0.095 ••• +0.117 ••• <.0001 <.0001 unbundled (+) +0.041 ••• +0.092 ••• <.0001 <.0001 bundle_prior (+) +0.341 ••• N.A. <.0001 ceo/cfo_tradeqtr (+) +0.015 • +0.006 0.059 0.685 ceo/cfo_tradepost15d (+) +0.064 •• +0.113 •• 0.018 0.012
Other controls included: Industry and time effects, level of and changes in the VIX (i.e., vix_level, ∆vix), vol_level, Rogers and Van Buskirk (2013) variables (i.e., p_surprise, n_surprise, |surprise|, loss, dispersion, prior_ret, mve, numest, probmb).
n 10,911 3,892 Adjusted R2 40.7% 22.3% ROC area 0.819 0.758
51

Table 7 ■ “No news” firm-quarters This analysis tests the likelihood that an earnings announcement is bundled with a confirming forecast for guiding firms (guider=1). In particular, in this analysis we control for managers’ use of guidance to adjust gaps in investors’ expectations of earnings by limiting analysis to firm-quarter observations in which (1) firms report no current-quarter earnings surprise, and (2) managers either remain silent or bundle a neutral/confirming forecast with the current-quarter, no surprise earnings news, (i.e., no “expectation adjustment”). Thus, in these tests we examine the link between ∆uncertainty and bundle when managers have no earnings news (about the current quarter or a future quarter) to give. We continue to expect that increases in uncertainty (as measured by ∆ivol_pre15d) are associated with an increased likelihood of bundled confirming/neutral guidance. •••,••,• denote significance at the 1%, 5%, and 10% level, respectively, for two-tailed tests. �=YES; �=NO; u=NO RESTRICTION. Refer to Appendix A for variable definitions. Dependent variable
= BUNDLE (neutral). Coefficient effect (p-value below)
[1] [2] [3] Dependent variable:
Bundle (neutral only) O O O Proxy for uncertainty: ∆ivol_pre15d O ∆ivol60_pre15d O ∆ivol91_pre15d O
Sample restrictions: Earnings news? � � �
∆uncertainty (+) +0.160 •• +0.144 • +0.120 0.016 0.057 0.151 avg∆uncertainty4q (+) +0.064 +0.073 +0.090 0.345 0.373 0.359 guide_cqtr (+) +0.144 ••• +0.142 ••• +0.143
<.0001 •••
<.0001 <.0001 unbundled (+) +0.034 +0.033 +0.033 0.170 0.182 0.192 bundle_prior (+) +0.295 ••• +0.294
<.0001 •••
+0.294 <.0001
•••
<.0001 ceo/cfo_tradeqtr (+) +0.011 +0.009 +0.007 0.623 0.668 0.733 ceo/cfo_tradepost15d (+) +0.125 +0.122 +0.127 0.130 0.140 0.126
Industry controls included: Yes Yes Yes
Other controls included: Time effects, level of and changes in the VIX (i.e., vix_level, ∆vix), vol_level, Rogers and Van Buskirk (2013) variables (i.e., p_surprise, n_surprise, |surprise|, loss, dispersion, prior_ret, mve, numest, probmb).
n 1,539 1,533 1,528 Pseudo R2 34.6% 34.4% 34.2% ROC area 0.800 0.799 0.798
52
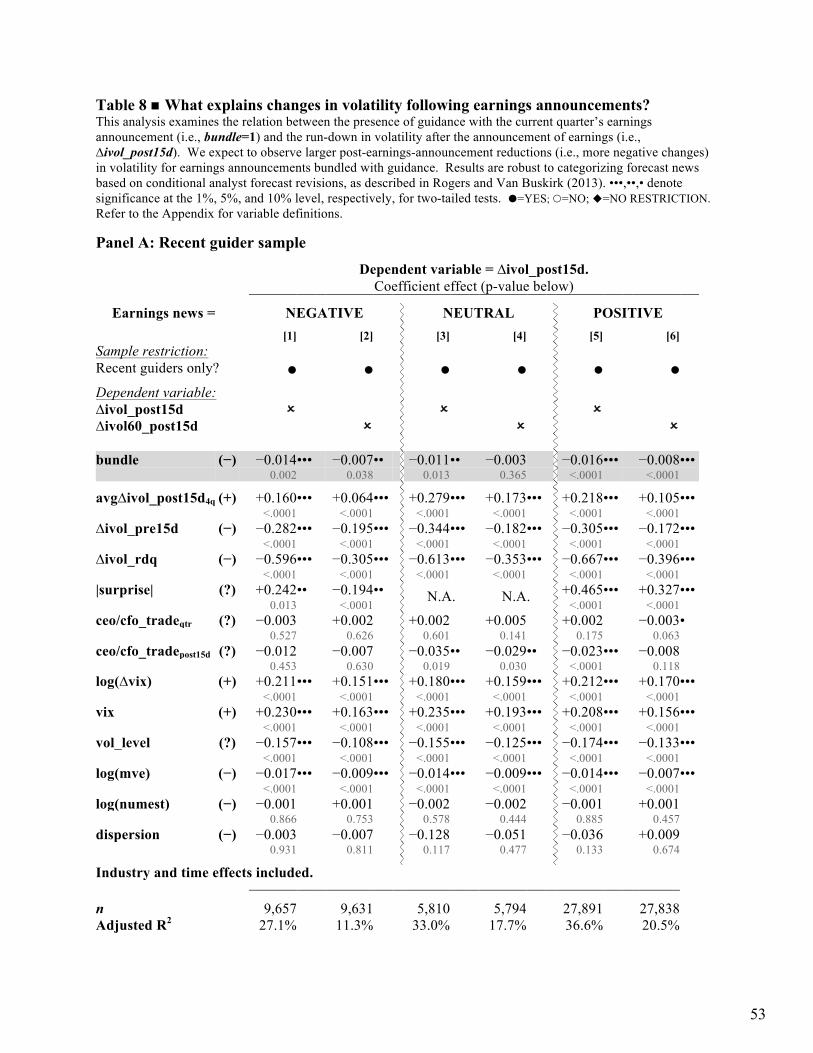
Table 8 n What explains changes in volatility following earnings announcements? This analysis examines the relation between the presence of guidance with the current quarter’s earnings announcement (i.e., bundle=1) and the run-down in volatility after the announcement of earnings (i.e., ∆ivol_post15d). We expect to observe larger post-earnings-announcement reductions (i.e., more negative changes) in volatility for earnings announcements bundled with guidance. Results are robust to categorizing forecast news based on conditional analyst forecast revisions, as described in Rogers and Van Buskirk (2013). •••,••,• denote significance at the 1%, 5%, and 10% level, respectively, for two-tailed tests. �=YES; �=NO; u=NO RESTRICTION. Refer to the Appendix for variable definitions. Panel A: Recent guider sample
Dependent variable = ∆ivol_post15d.
Coefficient effect (p-value below)
Earnings news = NEGATIVE NEUTRAL POSITIVE
[1] [2] [3] [4] [5] [6] Sample restriction:
Recent guiders only? � � � � � �
Dependent variable: ∆ivol_post15d O O O ∆ivol60_post15d O O O bundle (−) −0.014 ••• −0.007 •• −0.011 •• −0.003 −0.016 ••• −0.008 ••• 0.002 0.038 0.013 0.365 <.0001 <.0001
avg∆ivol_post15d4q (+) +0.160 ••• +0.064 ••• +0.279 ••• +0.173 ••• +0.218 ••• +0.105 ••• <.0001 <.0001 <.0001 <.0001 <.0001 <.0001 ∆ivol_pre15d (−) −0.282 ••• −0.195 ••• −0.344 ••• −0.182 ••• −0.305 ••• −0.172 ••• <.0001 <.0001 <.0001 <.0001 <.0001 <.0001 ∆ivol_rdq (−) −0.596 ••• −0.305 ••• −0.613 ••• −0.353 ••• −0.667 ••• −0.396 ••• <.0001 <.0001 <.0001 <.0001 <.0001 <.0001 |surprise| (?) +0.242 •• −0.194 •• N.A. N.A. +0.465 ••• +0.327 ••• 0.013 <.0001 <.0001 <.0001 ceo/cfo_tradeqtr (?) −0.003 +0.002 +0.002 +0.005 +0.002 −0.003 • 0.527 0.626 0.601 0.141 0.175 0.063 ceo/cfo_tradepost15d (?) −0.012 −0.007 −0.035 •• −0.029 •• −0.023 ••• −0.008 0.453 0.630 0.019 0.030 <.0001 0.118 log(∆vix) (+) +0.211 ••• +0.151 ••• +0.180 ••• +0.159 ••• +0.212 ••• +0.170 ••• <.0001 <.0001 <.0001 <.0001 <.0001 <.0001 vix (+) +0.230 ••• +0.163 ••• +0.235 ••• +0.193 ••• +0.208 ••• +0.156 ••• <.0001 <.0001 <.0001 <.0001 <.0001 <.0001 vol_level (?) −0.157 ••• −0.108 ••• −0.155 ••• −0.125 ••• −0.174 ••• −0.133 ••• <.0001 <.0001 <.0001 <.0001 <.0001 <.0001 log(mve) (−) −0.017 ••• −0.009 ••• −0.014 ••• −0.009 ••• −0.014 ••• −0.007 ••• <.0001 <.0001 <.0001 <.0001 <.0001 <.0001 log(numest) (−) −0.001 +0.001 −0.002 −0.002 −0.001 +0.001 0.866 0.753 0.578 0.444 0.885 0.457 dispersion (−) −0.003 −0.007 −0.128 −0.051 −0.036 +0.009 0.931 0.811 0.117 0.477 0.133 0.674
Industry and time effects included.
n 9,657 9,631 5,810 5,794 27,891 27,838 Adjusted R2 27.1% 11.3% 33.0% 17.7% 36.6% 20.5%
53

Table 8 (cont.) n What explains changes in volatility following earnings announcements? Panel B: Considering forecast news for “non-neutral news” quarters Panel B considers the nature of the forecast news as well as a shorter post-RDQ window. We expect to observe larger post-earnings-announcement reductions in volatility for earnings announcements bundled with guidance.
Dependent variable = ∆ivol_post15d. Coefficient effect (p-value below)
Earnings news = NEGATIVE POSITIVE [1] [2]
Sample restrictions:
Recent guiders only? � �
negative_bundle (−) −0.015 ••• −0.018 ••• 0.001 <.0001 positive_bundle (−) −0.014 •• −0.015 ••• 0.046 <.0001 neutral_bundle (−) −0.015 •• −0.015 ••• 0.033 <.0001
Other controls included: avg∆ivol_post4q, ∆ivol_pre, ∆ivol_rdq, |surprise|, ceo/cfo_tradeqtr, ceo/cfo_tradepost15d, log(mve), log(numest), dispersion, industry effects, time effects, level of and changes in the VIX (i.e., vix_level, ∆vix), and vol_level.
n 9,657 27,891 Adjusted R2 27.0% 36.6%
54
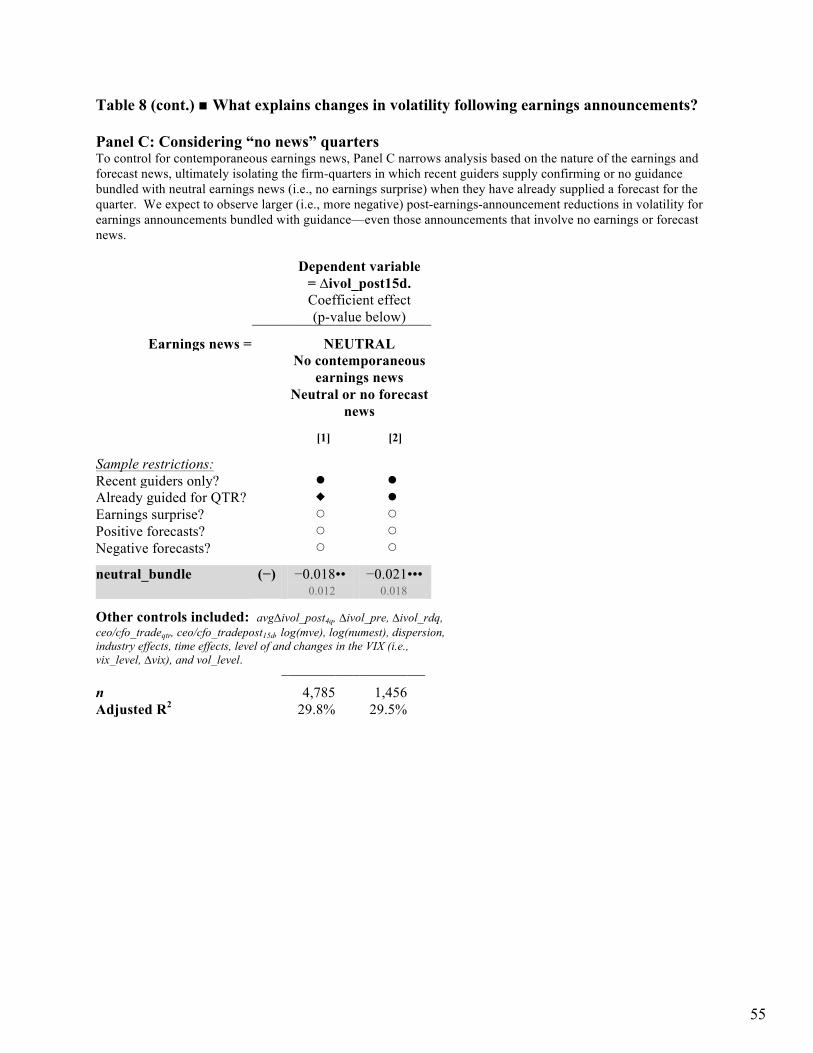
Table 8 (cont.) n What explains changes in volatility following earnings announcements? Panel C: Considering “no news” quarters To control for contemporaneous earnings news, Panel C narrows analysis based on the nature of the earnings and forecast news, ultimately isolating the firm-quarters in which recent guiders supply confirming or no guidance bundled with neutral earnings news (i.e., no earnings surprise) when they have already supplied a forecast for the quarter. We expect to observe larger (i.e., more negative) post-earnings-announcement reductions in volatility for earnings announcements bundled with guidance—even those announcements that involve no earnings or forecast news.
Dependent variable = ∆ivol_post15d. Coefficient effect (p-value below)
Earnings news = NEUTRAL
No contemporaneous earnings news
Neutral or no forecast news
[1] [2]
Sample restrictions:
Recent guiders only? � � Already guided for QTR? u � Earnings surprise? � � Positive forecasts? � � Negative forecasts? � �
neutral_bundle (−) −0.018 •• −0.021 ••• 0.012 0.018
Other controls included: avg∆ivol_post4q, ∆ivol_pre, ∆ivol_rdq, ceo/cfo_tradeqtr, ceo/cfo_tradepost15d, log(mve), log(numest), dispersion, industry effects, time effects, level of and changes in the VIX (i.e., vix_level, ∆vix), and vol_level.
n 4,785 1,456 Adjusted R2 29.8% 29.5%
55