on-line appendixes - uwpress.wisc.edu · starting from cohorts 1932 and born later, individuals are...
TRANSCRIPT

1
On-line Appendixes Lazuka, Volha
“Infant Health and Later-Life Labour Market Outcomes: Evidence from
the Introduction of Sulpha Antibiotics in Sweden”

2
Appendix A
CONTEXT OF THE INTRODUCTION OF SULPHAPYRIDINE
The necessity of improving infant health, whose advances in Sweden began to stagnate similar
to other Western countries (Griffiths and Brock 2003), received wide public attention in the
1920s. The Swedish government in 1929 published a report on public health insurance that in
part demonstrated the large inequalities in infant and child mortality across regions, urban and
rural areas and socio-economic classes (SOU 1929). Despite the remarkable economic
development in the country, measured for instance with real income per capita that had grown
at 2.4 percent annually between 1890 and 1930 (Schön and Krantz 2012), these differentials
persisted. Among candidate factors responsible for health inequalities several had been listed,
such as the standards of living, including housing, family size, infectious disease environment,
nutrition, childcare, willingness to use medical services, as well as climatic conditions (Sundin
and Willner 2007). Causes associated with infectious diseases clearly dominated both infant
and child mortality (see Table). Similar to other countries in Western Europe and North
America, respiratory diseases, such as pneumonia, bronchitis and influenza, exhibited
stagnation or slow decline for half of the century up until the late 1930s in Sweden (van Hofsten
and Lundström 1976). Among exogenous causes, pneumonia and influenza alone accounted for
no less than 20 percent of premature deaths below the age of 5 in the 1920s–1930s, emerging
as the major cause of death among infants and the major infectious-disease cause of death
among children.
The invention and introduction of sulpha antibiotics into medical practice as treatment against
pneumonia and other infectious diseases is recognised as one of the major historical
breakthrough innovations (WIPO 2015). The efficiency of sulphonamides against many
experimental streptococcal and other infections was observed by Gerhard Domagk in Germany
in 1932 (Domagk 1957). By the late 1930s, a bacteriostatic component of sulphonamides –

3
‘sulpha’ – had been revealed, that prevented the bacteria from multiplying, by inhibiting the
synthesis of folic acid within bacteria, and did not kill it, and experiments with derivatives of
sulphonamide preparations were launched elsewhere (The Nobel Foundation 1965). The
production and trade of the drugs at a mass and international scale started by the end of the
1930s, among which the major success is attributed to sulphapyridine (a compound of pyridine
and sulphonamides) against pneumonia prepared by the May and Baker Company as M&B 693
(Bentley 2009). The clinical trials showed that treatment of pneumonia with sulpha medications
on humans reduced the mortality rate by between 1/2 and 6/7, being especially efficacious in
treating bacteria-caused pneumonia (Graham et al. 1939). Until the introduction of penicillin in
the late 1940s, sulpha antibiotics remained the prime cure against pneumococcal,
meningococcal, gonococcal and some other infections.

4
REFERENCES (IN ADDITION TO THE SOURCES NOT CITED IN THE MAIN TEXT)
Domagk, Gerhard. 1957. “Twenty-Five Years of Sulfonamide Therapy.” Annals of the New
York Academy of Sciences 69 (3): 380–84.
Graham, Duncan, W. P. Warner, J. A. Dauphinee, and R. C. Dickson. 1939. “The Treatment of
Pneumococcal Pneumonia with Dagenan (M&B 693).” Canadian Medical Association
Journal 40 (4): 325–32.
Griffiths, Clare, and Anita Brock. 2003. “Twentieth Century Mortality Trends in England and
Wales.” Health Statistics Quarterly 18: 5–17.
Schön, Lennart, and Olle Krantz. 2012. “Swedish Historical National Accounts 1560–2010.”
Lund Papers in Economic History 123.
SOU. 1929. Statens Offentliga Utredningar: Betäkande Angående Moderkapsskydd avgivet den
26 September 1929. [Ministry of Health and Social Affairs: Statement of Parental
Protection Issued on September 26, 1929] 28. Stockholm: Socialdepartementet.
Sundin, Jan, and Sam Willner. 2007. Social Change and Health in Sweden – 250 Years of
Politics and Practice. Stockholm: Swedish National Institute of Public Health.
van Hofsten, Erland A., and Hans Lundström. 1976. Swedish Population History. Main Trends
from 1750 to 1970. Stockholm: Statistiska Centralbyrån.
WIPO. 2015. “Historical Breakthrough Innovations.” In World Intellectual Property Report
2015, 49–94. http://www.wipo.int/econ_stat/en/economics/wipr/. (accessed October, 1
2016).

5
TABLE – COMPOSITION OF THE CAUSES OF DEATH IN SWEDEN, PERCENT, 1920–1950
1920 1930 1940 1950 age<1 ages 1-5 all ages age<1 ages 1-5 all ages age<1 ages 1-5 all ages age<1 ages 1-5 all ages
malformations 43 2 5 52 4 4 59 3 3 76 8 2 infectious 12 45 18 8 30 14 6 24 9 3 7 3 pneumonia and influenza 20 25 12 20 26 7 21 24 7 11 22 5 diarrheal 10 5 2 9 9 1 5 9 0 5 9 0 non-infectious 5 11 32 6 18 44 5 21 55 4 24 67 other 10 12 32 6 14 30 3 21 27 2 30 23 total 100 100 100 100 100 100 100 100 100 100 100 100
Source: own calculations based on Statistiska Centralbyrån (1920a-1950)

6
Appendix B
FIGURE – EXAMPLE OF PHARMACEUTICAL RECORD ON DRUG INVENTORY IN SEPTEMBER 1939, SWEDEN
Source: Riksarkivet (1920–1967) (owner) Notes: The amount of sulphapyridine (Pyriamid, M&B 693, drug against pneumonia) is marked. The amount of
sulphonamides (drug against puerperal fever) is recorded separately and marked.

7
Appendix C
SURVIVORS OF COHORTS UNDER ANALYSIS
The cohorts born between 1934 and 1943 appear in the SIP dataset from 1968. I therefore do
not observe individuals that died or migrated from Sweden prior to age 34. I gathered
information on one-year survivors born in rural areas (live births minus infant deaths) of the
cohorts born 1920–1950 from Statistics Sweden (Statistiska Centralbyrån, 1920c–1950). In
Figure below, I plot them against counts of individuals with places of birth available in SIP by
cohort and those who have valid information on the county and parish of birth. A relatively
stable fraction of individuals observed in the SIP dataset compared to number of one-year
survivors indicates that the individuals born 1934–1943 were dying at a constant rate between
the ages 1 and 33. Among the first-year survivors of these cohorts, 96.0 percent were observed
in the dataset. The selection to survival to adulthood should not therefore violate the results in
the paper.
Starting from cohorts 1932 and born later, individuals are linked to their parents through the
multigenerational register (Flergenerationsregistret) thereby giving a unique family identifier.
This information is available for all individuals in our sample conditional on their survival or
presence in Sweden to the year 1991. Due to the availability of family links (across different
outcome samples, 91–94 percent are linked to mothers, and 83–86 percent to both mothers and
fathers), I was able to merge socio-economic and demographic information of the family to the
individual data. The parental background characteristics included the following information:
age of the mother obtained from population register (Registret över Totalbefolkningen),
education of the mother, socio-economic status and sector of employment of the father obtained
from population and housing census 1970 (Folk- och Bostadsräkningen 1970). Socio-economic
status has been originally constructed by Statistics Sweden (Statistiska Centralbyrån 1975)
based on occupation and occupational status, which I further grouped into high (farmers,

8
business owners in different sectors of economy, higher professionals, and higher managers)
and low (workers in different sectors of economy, military, lower professionals and managers,
and clerical and sales personnel). This information was available only for the post-treatment
child’s ages, in parents’ late adulthood (mean age 64 and 99.8 percent are employed), although
for paternal cohorts education should have been completed, and socio-economic status and
branch of work had to stabilise.
For the cohorts 1925–1929, because the data is conditional on cohorts 1930–1980 and their
parents and siblings, no individuals with any younger siblings born starting from 1930 were
observed. Among the first-year survivors of these cohorts, I observe 76.6 percent in the dataset.
These cohorts do not contain information on sibling links.

9
REFERENCES (IN ADDITION TO THE SOURCES NOT CITED IN THE MAIN TEXT)
Statistiska Centralbyrån. 1920c–1950. Sveriges Officiella Statistik. Statistik Årsbok för Sverige
[Sweden’s Official Statistics. Statistics Yearbook for Sweden]. Stockholm: P.A. Norstedt
& Söner [Annual Volumes].
Statistiska Centralbyrån. 1920d–1950. Sveriges Officiella Statistik. Befolkningsrörelsen
[Sweden’s Official Statistics. Population Movements]. [Annual Volumes]. Stockholm:
P.A. Norstedt & Söner.
Statistiska Centralbyrån. 1975. Folk- och Bostadsräkningen 1970: Del 13. Sysselsättning och
Utbildning. Definitioner, Jämförbarhet och Utveckling m.m. [Population and Housing
Census 1970: Part 13. Employment and Education. Definitions, Comparability and
Development, etc.] Stockholm: Berlingska Boktryckeriet.

10
FIGURE – FIRST-YEAR SURVIVORS AND ESTIMATION SAMPLE FOR THE COHORTS 1920–1950
Sources: own calculations based on SIP and Statistiska Centralbyrån (1920c,d-1950).
0
20000
40000
60000
80000
100000
120000
140000
1920
1921
1922
1923
1924
1925
1926
1927
1928
1929
1930
1931
1932
1933
1934
1935
1936
1937
1938
1939
1940
1941
1942
1943
1944
1945
1946
1947
1948
1949
1950
1st yearsurvivors
individuals inSIP, withvalid place ofbirthinformation
Individuals
Year of birth

11
Appendix D
GROUPS OF CAUSES OF MORBIDITY
The cause of admission to the hospital is obtained from the Swedish national inpatient register
1987–2012. It adopted two revisions of the international classifications of the causes of
morbidity, such as revision 9 for 1987–1996, and revision 10 for 1997–2012. Following the
previous literature (Kuh and Ben-Shlomo 2007), I classified all causes of admissions into six
groups, including infectious/respiratory diseases, cardiovascular diseases, diabetes, cancer,
degenerative diseases of tissues and organs, and mental diseases and calculated the respective
average length of stay in hospital. The same classification is used for cause-specific mortality.
The group of degenerative diseases of tissues and organs is dominant with symptoms of
respiratory diseases, arthritis and gastro-enteric diseases. In order to measure pathology in
health exclusively, I excluded hospital admissions due to violent/accidental causes (2 percent
of person-years) and observations with no need for further treatment (0.01 percent of person-
years). The exact codes used for these groupings are provided in Table below.

12
TABLE – DIAGNOSES GROUPS ACROSS TWO REVISIONS OF THE ICD, 1987–2012
ICD-9 ICD-10
Infectious/Respiratory 001-139; 320-324; 460-519 A00-B99; G00-G09; J00-J99 Cardiovascular 390-459 I00-I99 Diabetes 250 E10-E14 Cancer 140-239 C00-D48 Degenerative 240-246; 251-289; 325-330; 332-389;
520-796 D50-E07; E15-E90; F10-F99; G10-G26; G31-H95; K00-R94
Mental diseases 290-319; 331 F00-F09; G30

13
Appendix E
DATA SOURCES FOR REGION-OF-BIRTH CHARACTERISTICS, SWEDEN 1934–1943
Variable Source Comments
Pneumonia mortality rate, per 1000 mid-year population
constructed based on SCB Sveriges officiella statistik. Dödsorsaker [Statistics Sweden. Causes of Deaths]: deaths from respiratory diseases: pneumonia, acute bronchitis, chronic bronchitis, pleurisy and other respiratory diseases (Pneumonia acuta lobaris. Bronchopnenmonia acuta. Bronchitis capillaris; Bronchitis acuta. Laryngo-tracheitis acuta; Bronchitis chronica; Pleuritis. Empyema pleurae; Alii morbi organoram respirationis); SCB Sveriges officiella statistik. Befolkningsrörelsen [Statistics Sweden. Population Movement] (mid-year population)
yearly and county urban-rural level, 49 regions, 1920–1950
Cause-specific mortality rates, per 1000 mid-year population
constructed based on Dödsorsaker: typhoid fever (Febris typhoidea. Febris paratyphoidea), acute and chronic diarrhoea (Gastro-enteritia acnta infectiosa; Gastroenteritis chronica), influenza (Influenza cum aegrotatione pulmonis. Influenza sine aegrotatione pulmonis), lung tuberculosis (Tuberculosis pulmonis, laryngis), acute and chronic heart disease (Thrombo-endocarditis acuta; Endocarditis chronica. Hyocarditis chronica), diabetes (Diabetes mellitus), cancer (Carcinoma oris et linguae, ventriculi, intestine, uteri et ovariorom, mammae, cutis, aliorum organoram; Sarcoma cutis et subcutis, ossiam, viscerum, alioram organoram; Helanosarcoma; Alii tumores), and puerperal fever (Septichaemia paerperalis postpartum; Septichaemia puerperalis post abortum); SCB Sveriges officiella statistik. Befolkningsrörelsen (mid-year population)
yearly and county urban-rural level, 49 regions, 1920–1950
Infant mortality rate, per 1000 live births
constructed based on SCB Sveriges officiella statistik. Befolkningsrörelsen (infant deaths and live births)
yearly and county urban-rural level, 49 regions
Crude death rate, per 1000 mid-year population
constructed based on SCB Sveriges officiella statistik. Befolkningsrörelsen (total deaths and mid-year population)
yearly and county urban-rural level, 49 regions
Stillbirth rate, per 1000 total births
constructed based on SCB Sveriges officiella statistik. Befolkningsrörelsen (stillbirths and live births)
yearly and county urban-rural level, 49 regions
Crude birth rate, per 1000 mid-year population
constructed based on SCB Sveriges officiella statistik. Befolkningsrörelsen (live births and mid-year population)
yearly and county urban-rural level, 49 regions
Marital fertility rate, per 1000
constructed based on SCB Sveriges officiella statistik. Befolkningsrörelsen (yearly legitimate total births and 5-mid-year married women 15-45 ages)
yearly and county urban-rural level, 49 regions
Share females in total population
constructed based on SCB Sveriges officiella statistik. Befolkningsrörelsen (female and male mid-year population)
yearly and county urban-rural level, 49 regions
Share employed in agriculture
constructed based on SCB Sveriges officiella statistik. Folkräkningen [Statistics Sweden. Population Census] (number employed in agriculture, industry and services) 1930, 1940, 1950
decadal and county level, 24 counties and Stockholm
Share employed in industry
constructed based on SCB Sveriges officiella statistik. Folkräkningen (number employed in agriculture, industry and services) 1930, 1940, 1950
decadal and county level, 24 counties and Stockholm
Real yearly wage of worker
constructed based on Socialstyrelsen Lönestatistisk Årsbok 1930-1950 [Statistics Sweden. Wage Statistics] (average yearly wages for male manufacturing worker and average yearly wages for male servants in agriculture) as a weighted average (share of employed in agriculture and industry as weights from Folkräkningen 1930, 1940, 1950); Edvinsson & Söderberg (2011) (national CPI)
yearly and county level, 24 counties and Stockholm
Real regional GDP per capita
Enflo, Henning & Schön (2015)
decadal and county level, 24 counties

14
Medical personnel, per 1000 mid-year population
constructed based on SCB Sveriges officiella statistik. Allmän om Hålso och sjukvård [Statistics Sweden. Health and Health Care] (number of legitimate doctors, midwives, and medical nurses); SCB Sveriges officiella statistik. Befolkningsrörelsen (mid-year population)
yearly and county urban-rural level, 49 regions
Real hospital spending, per 1000 mid-year population
constructed based on SCB Sveriges officiella statistik. Allmän om Hålso och sjukvård (hospitals’ receipts); SCB Sveriges officiella statistik. Befolkningsrörelsen (mid-year population); Edvinsson & Söderberg (2011) (national CPI)
yearly and county urban-rural level (24 counties and 3 urban regions: Stockholm, Malmo and Gothenborg), 27 regions
Share under age 15 in total population
constructed based on SCB Sveriges officiella statistik. Statistik Årsbok för Sverige [Statistics Sweden. Statistics Yearbook] (population under age 15); SCB Sveriges officiella statistik. Befolkningsrörelsen (mid-year population)
5-year and county level, 24 counties and Stockholm
Share above age 65 in total population
constructed based on SCB Sveriges officiella statistik. Statistik Årsbok för Sverige (population above age 65); SCB Sveriges officiella statistik. Befolkningsrörelsen (mid-year population)
5-year and county level, 24 counties and Stockholm
Number of school-rooms, per 1000 primary-school pupils
constructed based on SCB Sveriges officiella statistik. Statistik Årsbok för Sverige (number of school-rooms and number of pupils in primary schools)
yearly and county level, 24 counties and Stockholm
Number of teachers, per 1000 primary-school pupils
constructed based on SCB Sveriges officiella statistik. Statistik Årsbok för Sverige (number of teachers and number of pupils in primary schools)
yearly and county level, 24 counties and Stockholm
Sulphapyridine availability, per 1000 mid-year population;
Sulphonamide availability, per 1000 mid-year population;
Price index of medical drugs
constructed based on Riksarkivet. Medicinalstyrelsens apoteksbyrå [National Archive. National Health Board’s Pharmacy Agency], aggregated from pharmacy level, pharmacy-city locations from SCB. Recalculated into adult doses to treat pneumonia episode per 1000 population (1 adult dose = 20 grams of sulphapyridine). Sveriges kommuner åren 1952-1986
year 1939 and county urban-rural level, 49 regions
Absolute change in price of medical drugs
constructed based on Riksarkivet. Medicinalstyrelsens apoteksbyrå [National Archive. National Health Board’s Pharmacy Agency], aggregated from pharmacy level, pharmacy-city locations from SCB. Sveriges kommuner åren 1952-1986
year 1940 relative to 1939 and county urban-rural level, 49 regions

15
REFERENCES (IN ADDITION TO THE SOURCES NOT CITED IN THE MAIN TEXT)
Edvinsson, Rodney, and Johan Söderberg. 2011. “A Consumer Price Index for Sweden, 1290–
2008.” Review of Income and Wealth 57 (2): 270–92.
Enflo, Kerstin, Martin Henning, and Lennart Schön. 2015. “Swedish Regional GDP 1855–
2000: Estimations and General Trends in the Swedish Regional System.” Research in
Economic History, 47–89.
Socialstyrelsen. 1930–1950. Lönestatistisk Årsbok för Sverige [Wage Statistics for Sweden]
[Annual Volumes]. Stockholm: Isaac Marcus Bocktryckeri-Aktiebolag.
Statistiska Centralbyrån. 1920d–1950. Sveriges Officiella Statistik. Befolkningsrörelsen
[Sweden’s Official Statistics. Population Movements]. [Annual Volumes]. Stockholm:
P.A. Norstedt & Söner.
Statistiska Centralbyrån. 1936. Folkräkningen 1930: Del III Folkmängden Efter Yrke, Inkomst
och Förmögenhet. [Census 1930: Part III Population by Occupation, Income and Wealth].
Stockholm: P.A. Norstedt & Söner.
Statistiska Centralbyrån. 1943. Folkräkningen 1940: Del III Folkmängden Efter Yrke. [Census
1940: Part III Population by Occupation]. Stockholm: P.A. Norstedt & Söner.
Statistiska Centralbyrån. 1954. Folkräkningen 1950: Del IV Totala Räkningen. Folkmängden
Efter Yrke i Kommuner, Församlingar och Tätorter. [Census 1950: Part IV Total Income.
Population by Occupation in Municipalities, Parishes and Towns]. Stockholm: P.A.
Norstedt & Söner.
Statistiska Centralbyrån. 1986. Sveriges Kommuner åren 1952-1986 Förändringar i
Kommunindelning och Kommunkoder. [The Municipalities of Sweden in 1952-1986
Changes in Municipal Division and Municipal Codes]. Stockholm: Civiltryck AB.

16
Appendix F
ASSOCIATIONS BETWEEN BASELINE PNEUMONIA MORTALITY AND REGION-OF-BIRTH CHARACTERISTICS (CONTROL VARIABLES), SWEDEN 1932–1936
Region-level socio-economic and
health care characteristics Region-level cause-specific
mortality rates (1) (2) (1) (2) Reduced Full Reduced Full Stillbirth rate 0.0429 -1.423 Puerperal fever 1.893 0.401 (0.718) (0.870) (1.721) (2.087) CBR 1.667** -0.449 Typhoid fever -0.261 -1.043 (0.779) (1.832) (0.725) (0.682) Share of females -165.9* -124.8 Diarrhoea 1.282** 1.623** (82.90) (240.5) (0.599) (0.648) Share above age 65 105.5 -6.984 Influenza -0.781 -0.971 (115.8) (317.3) (0.602) (0.605) Share below age 15 93.36 271.7 Lung tuberculosis 0.0238 -0.0453 (59.66) (180.0) (0.0650) (0.112) CDR 7.078*** 8.914** Heart disease -0.0409 -0.0787 (2.228) (3.411) (0.0771) (0.0967) IMR 0.427* 0.190 Diabetes -0.761 -0.436 (0.214) (0.396) (0.531) (0.671) Ln real regional GDP pc -20.84* -38.58 Cancer 0.0139 0.0648 (10.42) (43.65) (0.0686) (0.0923) Ln real wage of worker 6.412 -21.00 (13.34) (41.23) Share employed in agriculture 21.67 -31.45 (15.06) (84.03) Share employed in industry -40.94 -0.316 (29.82) (59.66) Ln medical personnel per 1000 -6.948 5.942 (4.805) (12.31) Ln pharmacies per 1000 -4.424** 1.101 (1.930) (4.082) Ln real hospital spending per 1000 -0.283 9.994 (5.199) (8.225) Ln school-rooms per 1000 pupils -21.56 -15.19 (25.19) (34.20) Ln teachers per 1000 pupils -14.81 6.872 (26.52) (57.50) Observations 49 49 Observations 49 49 R-squared - 0.49 R-squared - 0.20
Source: own estimations based on sources from Appendix E. Notes: OLS regression estimates. Each variable is the arithmetic average for 1932–1936. Mortality rates per
1000 mid-year population. In Model 1 ‘Reduced’, the effect of pneumonia mortality is estimated separately for each variable (plus constant); in Model 2 ‘Full’, all variables are included (plus a constant). Standard errors (in parentheses) are clustered at a region level. *** p<0.01, ** p<0.05, * p<0.1

17
Appendix G
THE CONTEMPORANEOUS EFFECTS OF THE INTRODUCTION OF SULPHAPYRIDINE
To start with the graphical analysis, beginning from the late 1930s, total pneumonia mortality
exhibited an irretrievable decline in both level and trend (see Figure 1 of the main text). There
are no similar breaks in other diseases at the same time. Figure G1 below shows that that in
absolute terms pneumonia mortality (per 1000) declined most among infants than among other
age groups: -1.8 deaths for infants versus -0.4 deaths in ages 1–4, -0.6 deaths in ages 5–14 or
15–30, -0.3 deaths in ages 30–59, or -1.1 deaths in ages 60+. Figure G2 presents pneumonia
mortality across the whole age range in 1933 and 1943, pointing to the same conclusion. Figure
3 of the main text presents the effects of arrival of sulpha antibiotics on mortality at the
aggregate level, where baseline pneumonia mortality in 1932–1936 is plotted against absolute
decline in pneumonia mortality for the period until 1943. The results indicate strong
convergence in aggregate mortality rates from pneumonia after arrival of sulpha antibiotics.
More specifically, a one-unit higher pneumonia mortality rate in 1932–1936 is associated with
0.6 unit reduction in pneumonia mortality afterwards.
It is important to investigate whether the breaks in pneumonia mortality occurred in year
1939 using formal tests. As noted above, Figure 1 (in the main text) provides visual evidence
that mortality declined substantially, accelerated and never returned to its previous levels after
arrival of sulpha medicaments in 1939. The results in both level and logarithmic terms are
presented in Table G1. Columns 1 and 2 support that there are both level and trend breaks in
pneumonia death rate that year. More specifically, pneumonia mortality dropped significantly
in 1939–1943 by around 30 percent in the level and exhibited a trend decline by 16 percent.
The beneficial effects of sulpha introduction could also be detected in crude death rate
(Columns 3 and 4) and infant mortality rate (Columns 5 and 6), which from 1939 followed an
accelerated decrease by 5 percent annually each. I re-estimated the presence of breaks in both

18
absolute and logarithmic terms using a difference-in-differences approach, where both
infectious (Columns 7 and 8) and non-infectious diseases (Columns 9 and 10) are added as
control diseases interacted with drug period. The size of the decreases and acceleration in
pneumonia mortality from 1939 until 1943 is similar to the one provided in Table G1.
It is plausible that pneumonia reduction due to sulphapyridine affected the array of regional
characteristics, including demographic, socio-economic and health care characteristics and
cause-specific mortality (see Table G2). I additionally studied these effects to shed light on the
mechanisms by which the intervention affected child health. Even though results point to the
intervention-led decline in crude birth rate, this effects is not robust to the inclusion of the
region-specific time trend (point estimate 0.106 and standard error 0.501) or more accurate
measures of fertility, such as marital fertility rate. However, in the further analysis based on
microdata, I investigate whether fertility was indeed affected across cohorts under analysis (see
V. Empirical strategy). Arrival of pneumonia did not affect other socio-economic or
demographic indicators. While the results confirmed that the arrival of sulphapyridine caused
abrupt reduction in pneumonia mortality, it also led to an increase in influenza mortality, by
29– 34 percent of the pre-treatment rate (dependent on specification). At that time, doctors
recognised that influenza was not responsive to sulphapyridine, only if it was a complication to
pneumonia (Malmros and Wilander 1941). This finding could indicate that either influenza
cases were prior diagnosed as pneumonia, or that deaths from competing causes were captured.
While plausible measurement error is addressed extensively in the further analysis, the latter
would imply that the true effect of decline in pneumonia mortality could be underestimated.
Sulpha drugs were available in 1939 in all parts of the country in the amounts accounting for
this decline (see Figure 2 of the main text). On average across country, pre-treatment pneumonia
mortality was 1.043 deaths per 1000 and sulpha drugs were available to save 1.1 deaths per
1000. Importantly, I examined whether regional distribution of sulphapyridine was related to

19
socio-economic characteristics of the regions of birth. As for the variables approximating
utilisation of drugs, I employed several, including sulphapyridine availability (in adult doses of
sulphapyridine sufficient to treat full pneumonia episode per 1000 mid-year population) in
1939, average price of a medical drug in 1939 and its change between 1939 and 1940. Table
G3 shows that in general there is no systematic association between sulpha drug availability
and prices with regional socio-economic variables.

20
FIGURE G1 – PNEUMONIA MORTALITY BY AGE GROUPS IN 1920–1950 Sources: own calculations based on Statistiska Centralbyrån (1920a-1950) and Human Mortality Database
(2018) at https://www.mortality.org/. Notes: pneumonia includes pneumonia, acute bronchitis, and chronic bronchitis to avoid differences in
nomenclature before and after 1931.
Below age 1
Ages 60+
Ages 1–4
Ages 5-15 Ages 30-59

21
FIGURE G2 – AGE PATTERN OF PNEUMONIA MORTALITY BEFORE AND AFTER INTRODUCTION OF SULPHAPYRIDINE, PER 1000, SWEDEN
Source: own calculations based on Statistiska Centralbyrån (1920a-1950) Notes: pneumonia includes pneumonia, acute bronchitis, and chronic bronchitis.
0123456789
10
<1 1-4
5-9
10-1
415
-19
20-2
425
-29
30-3
435
-39
40-4
445
-49
50-5
455
-59
60+
1933
1943

22
TABLE G1 – LEVEL AND TREND BREAKS IN PNEUMONIA MORTALITY AT THE AGGREGATE LEVEL, 1934–1943
(1) (2) (3) (4) (5) (6) (7) (8) (9) (10)
Pneumonia mortality rate
CDR
IMR
Pneumonia mortality rate (treated) and mortality rates from other infectious diseases
(control)
Pneumonia mortality rate (treated) and mortality rates from non-infectious diseases
(control) levels logs levels logs levels logs levels logs levels logs post1939 -0.3542*** -0.2961*** -0.2309** -0.0192* -0.8270 -0.0225 (0.0401) (0.0402) (0.1111) (0.0101) (1.2298) (0.0331) post1939Xyear -0.1444*** -0.1593*** -0.5384*** -0.0501*** -1.4741*** -0.0502*** (0.0137) (0.0138) (0.0381) (0.0035) (0.4218) (0.0114) pneumonia mortalityXPost1939 -0.2878*** -0.2598*** -0.3483*** -0.3530*** (0.0472) (0.0659) (0.0399) (0.0479) pneumonia mortalityXPost1939Xyear -0.1153*** -0.0815*** -0.0857*** -0.0920***
(0.0170) (0.0257) (0.0174) (0.0230) Observations 490 490 490 490 490 490 2,450 2,341 1,960 1,945 R-sq 0.64 0.66 0.82 0.82 0.65 0.63 0.90 0.87 0.90 0.94
Sources: own estimations based on sources from Appendix E. Notes: OLS regression estimates. Models 1–6 additionally include year trend and region dummies. Models 7–10 additionally include post1939, year, pneumonia
mortalityXyear trend, disease dummies, diseaseXyear trends, and region dummies. Infectious diseases added to Models 7 and 8 include typhoid fever, diarrhoea, influenza and lung tuberculosis. Non-infectious diseases added to Models 9 and 10 include puerperal fever, heart disease, diabetes and cancer. Some observations in specifications with logarithmic terms (Models 8 and 10) omitted due to zero mortality from diseases used in the models in some regions. All death rates are calculated per 1000 mid-year population in a corresponding region, and infant mortality rate is calculated per 1000 live births. Year is centred around 1939.
*** p<0.01, ** p<0.05, * p<0.1.

23
TABLE G2 – THE EFFECT OF REDUCED PNEUMONIA MORTALITY ON REGION-OF-BIRTH CHARACTERISTICS (CONTROL VARIABLES), SWEDEN 1934–1943
Region-level socio-economic and health care characteristics
Stillbirth rate CBR Marital fertility rate
Share females
Share <15 ages
Share >65 ages
CDR IMR Ln real regional GDP pc
post1939Xbaseline pneumonia mortality
1.299 -2.181** -10.916 0.004 -0.000 -0.001 -0.264 -2.835 -0.008
(1.725) (0.954) (7.091) (0.004) (0.002) (0.001) (0.265) (2.505) (0.027) Pre-mean 27.795 14.126 64.960 0.511 0.235 0.095 11.614 44.186 7.346 Observations 490 490 490 490 490 490 490 490 490 R-squared 0.37 0.85 0.68 0.98 0.98 0.97 0.86 0.67 0.94
Region-level socio-economic and health care characteristics
Ln real wage of worker
Share in agriculture
Share in industry
Ln medical personnel per
1000
Ln pharmacies per 1000
Ln real hospital spending per 1000
Ln school-rooms per 1000 pupils
Ln teachers per 1000 pupils
post1939Xbaseline pneumonia mortality
-0.006 -0.017 0.007 -0.033 0.058 0.016 0.018 0.026***
(0.012) (0.013) (0.016) (0.107) (0.100) (0.098) (0.013) (0.009) Pre-mean 7.441 0.451 0.341 0.155 -1.511 8.758 4.345 3.853 Observations 490 490 490 490 490 490 490 490 R-squared 0.92 0.98 0.94 0.94 0.97 0.82 0.95 0.96
Region-level cause-specific mortality rates
Pneumonia Puerperal fever
Typhoid fever
Diarrhoea Influenza Lung tuberculosis Heart disease Diabetes Cancer
post1939Xbaseline pneumonia mortality
-0.223*** -0.003 -0.005 -0.013 0.032** 0.003 0.026 0.002 0.048
(0.0546) (0.005) (0.011) (0.013) (0.016) (0.057) (0.079) (0.016) (0.059) Pre-mean 1.106 0.020 0.132 0.066 0.093 0.779 1.218 0.125 1.481 Observations 490 490 490 490 490 490 490 490 490 R-squared 0.70 0.26 0.39 0.29 0.55 0.79 0.69 0.41 0.60
Source: own estimations based on sources from Appendix E. Notes: OLS regression estimates. Each model controls for year fixed effects and region fixed effects. Mortality rates per 1000 mid-year population. Pneumonia mortality rate
is per 1000 mid-year population, normalized (dividing by its 95th-5th percentile range). Baseline pneumonia mortality is for 1932–1936. Standard errors (in parentheses) are clustered at a region level. Pre-mean denotes mean of the outcome in 1934–1938. *** p<0.01, ** p<0.05, * p<0.1. .

24
TABLE G3 – UTILISATION OF SULPHAPYRIDINE AND REGION-OF-BIRTH SOCIO-ECONOMIC CHARACTERISTICS
(1) (2) (3) Sulphapyridine drugs
per 1000 in 1939 Price index of
medical drugs in 1939 Change
in price index of medical drugs 1939-1940
Ln real GDP, per capita -2.193 0.516 -5.048 (13.036) (0.430) (3.464) Ln real wage of worker -0.548 -0.865** 4.681* (14.375) (0.420) (2.770) Share of employed in agriculture 3.923 0.738 -7.046 (29.431) (0.908) (5.198) Share of employed in industry 5.050 0.628 0.849 (23.513) (1.001) (2.571) Ln medical personnel, per 1000 3.476 0.0537 -0.221 (2.629) (0.0883) (0.472) Ln pharmacies, per 1000 1.573 -0.0134 0.171 (1.205) (0.0404) (0.194) Ln real hospital spending, per 1000 0.395 -0.121 0.290 (1.265) (0.0867) (0.334) Regions of birth 49 49 49 R-squared 0.39 0.13 0.13
Sources: own estimations based on sources from Appendix E. Notes: Sulphapyridine drugs is recalculated from original data (in compatible grams) into adult doses
sufficient to treat full pneumonia episode per 1000 population (1 adult dose = 20 grams of sulphapyridine). Standard errors (in parentheses) are clustered at a region-of-birth level.
*** p<0.01, ** p<0.05, * p<0.1.

25
Appendix H
TRENDS IN LATER-LIFE OUTCOMES FOR COHORTS BORN BEFORE AND DURING/AFTER ARRIVAL OF SULPHAPYRIDINE, SWEDEN
(1) – Ln labour income
(2) – Years of schooling
(3) – Length of stay in hospital
Source: own estimations based on the SIP. Notes: Figure presents the means for the outcome by year of birth and pneumonic regions-of-birth (divided at the quartiles based on baseline pneumonia mortality). Cohort 1939 is the first exposed to sulphapyridine.

26
Appendix I
ANALYSIS OF CHANGES IN COMPOSITION OF COHORTS DUE TO ARRIVAL OF SULPHAPYRIDINE
The intervention could initiate heterogeneous migration or fertility responses among parents
of the cohorts under study. If such responses change the composition of cohorts in favour of
children with high levels of human capital, this would provide an alternative explanation for
the long-term results. I address this concern with individual and family data.
First, in Table I1 I examine whether the arrival of sulphapyridine affected the composition
of the parents. I estimate the effect of treatment intensity on parental characteristics such as
whether mother is older than age 28, whether mother has only primary education, whether father
has low socio-economic status and whether he works in agriculture. I detect no systematic
pattern on these parental characteristics, except for maternal education. While the result for
maternal schooling should be interpreted with caution, because the share of mothers with
unknown education is substantial, the estimates probably pick up the general migration pattern,
flowing away from economically disadvantaged regions, rather than the effect of
sulphapyridine. For the long-term effects of pneumonia reduction, if low maternal education is
associated with poor infant health, such a finding means that they might be underestimated.
Second, in Table I2 I analyse whether the arrival of sulphapyridine affected completed
fertility of the mothers. This outcome is more accurate for our estimation sample compared to
the regional-level crude birth and marital fertility rates that measure period fertility. The results
on family size for the total sample and by subsamples, distinguished on different socio-
economic and demographic characteristics are presented based on the specification with region-
specific time trends, to diminish concern that they capture pre-treatment convergence. I do not
find significant effects of the intervention on completed fertility in any of these samples. While
being insignificant, consistently with previous observations, the results tentatively point to the
positive effects from intervention among low-resource families, measured with low SES and

27
low schooling (+1.2-1.6% of the pre-treatment rate) and otherwise for high-resource families (-
1.8- -3.8% of the pre-treatment rate). Not only, as before, could a higher proportion of high-
risk babies be present among the treated cohorts, but the drug intervention could also pose
higher constraints on resources devoted to each child in poorer families (and lower constraints
for richer families). In both cases, the true long-term effect of the reduced pneumonia contagion
could be underestimated.

28
TABLE I1 – REDUCED-FORM ESTIMATES. EFFECTS OF PNEUMONIA EXPOSURE IN INFANCY ON PARENTAL CHARACTERISTICS OF COHORTS 1934–1943, SWEDEN
(1) (2) (3) (4) Mother old Mother only
primary schooling Father SES low Father in agriculture
Sample ‘Ln labour income’ post1939Xbaseline pneumonia mortality -0.0045 0.0272** 0.0091 -0.0080 (0.0066) (0.0112) (0.0154) (0.0079) Individuals 878,606 878,606 878,606 878,606 R-squared 0.01 0.07 0.04 0.07 Sample ‘Years of schooling’ post1939Xbaseline pneumonia mortality -0.0042 0.0277** 0.0099 -0.0083 (0.0065) (0.0114) (0.0153) (0.0081) Individuals 879,175 879,175 879,175 879,175 R-squared 0.01 0.07 0.04 0.04 Sample ‘Length of stay in hospital’ post1939Xbaseline pneumonia mortality -0.0046 0.0267** 0.0105 -0.0107 (0.0068) (0.0113) (0.0159) (0.0085) Individuals 852,460 852,460 852,460 852,460 R-squared 0.01 0.07 0.04 0.07
Source: estimations from the SIP. Notes: Standard errors (in parentheses) are clustered at a region-of-birth level. All models include region-of-
birth fixed effects (49 regions) and year-of-birth fixed effects, and are estimated for both sexes jointly. All Models are estimated according to Eq.1. Pneumonia mortality rate is per 1000 mid-year population, normalised (dividing by its 95th-5th percentile range). Age interval for ln labour income is ages 44–60, and for length of stay in hospital is ages 53–60. Pre-mean denotes mean of the outcome in 1934–1938.
*** p<0.01, ** p<0.05, * p<0.1.

29
TABLE I2 – REDUCED-FORM ESTIMATES. EFFECTS OF PNEUMONIA EXPOSURE IN INFANCY ON COMPLETED FERTILITY OF THE MOTHERS BY SUBGROUPS IN SWEDEN, COHORTS 1934–1943
(1) (2) (3) (4) (5) (6) (7) Mother’s schooling Father’s SES
Full sample primary more than
primary unknown low high unknown
post1939Xbaseline pneumonia mortality -0.0087 0.0280 -0.0382 -0.0294 0.0346 -0.0898 -0.0240 (0.0192) (0.0282) (0.0437) (0.0214) (0.0229) (0.0568) (0.0220) Pre-mean 2.245 2.256 2.186 2.256 2.163 2.352 2.274 Individuals 811,241 311,387 126,205 373,649 279,541 95,382 436,318 R-sq 0.0556 0.0746 0.0815 0.0640 0.0620 0.0671 0.0621 (8) (9) (10) (11) (12) (13) Mother’s age Father’s sector of employment
old young agriculture industry service unknown
post1939Xbaseline pneumonia mortality 0.0056 -0.0193 -0.0846 0.0342 0.0126 -0.0236 (0.0202) (0.0259) (0.0652) (0.0253) (0.0379) (0.0219) Pre-mean 2.234 2.254 2.586 2.175 2.083 2.275 Individuals 366,010 445,231 64,085 183,010 127,250 436,896 R-sq 0.0767 0.0834 0.0525 0.0600 0.0528 0.0621
Source: estimations from the SIP. Notes: Standard errors (in parentheses) are clustered at a region-of-birth level. All models include region-of-
birth fixed effects (49 regions) and year-of-birth fixed effects, and are estimated for both sexes jointly. All Models are estimated according to Eq.1. Pneumonia mortality rate is per 1000 mid-year population, normalised (dividing by its 95th-5th percentile range). Estimates based on ln labour income sample. Pre-mean denotes mean of the outcome in 1934–1938.
*** p<0.01, ** p<0.05, * p<0.1.

30
Appendix J
HETEROGENEOUS EFFECTS
Table presents the results from subsamples distinguished based on father’s socio-economic
class and mother’s age, with the latter approximating differences in infant health. Before, I
found that baseline pneumonia was higher for less economically developed and unhealthy
regions. The results are generally consistent in finding that individuals from these families gain
more from reduction in pneumonia mortality later in life. Children born to mothers aged above
the average age in the sample and probably less healthy attain the treatment effects of larger
magnitude (Column 1). The treatment effects for the individuals born to families with poor and
high socio-economic status are not statistically different, although for ln labour income they are
larger for poor families (Column 2). For instance, for labour income, the reduction in
pneumonia mortality leads to a 5.7 and 4.3 percent increase for individuals born to older
mothers and younger mothers correspondingly; it leads to a 4.8 and 4.2 percent increase for
those born to fathers with low and high socio-economic status respectively. Such difference
across background characteristics can be plausibly explained by the data limitations, as father’s
socio-economic status in observed close to retirement ages.

31
TABLE – REDUCED-FORM ESTIMATES. HETEROGENEOUS EFFECTS OF PNEUMONIA EXPOSURE IN INFANCY BY PARENTAL CHARACTERISTICS ON ADULT OUTCOMES IN SWEDEN, COHORTS 1934–1943
(1) Mother’s age
(2) Father’s SES
young old unknown low high Ln labour income post1939Xbaseline 0.0426*** 0.0569*** 0.0427 0.0478*** 0.0417** pneumonia mortality (0.0115) (0.0154) (0.0621) (0.0176) (0.0198) Pre-mean 8.160 8.159 7.808 8.135 8.127 Individuals 445,231 366,010 67,365 618,512 260,094 Years of schooling post1939Xbaseline 0.2076*** 0.2212*** 0.1914*** 0.1942*** 0.1945*** pneumonia mortality (0.0457) (0.0624) (0.0634) (0.0576) (0.0563) Pre-mean 9.525 9.778 8.994 9.634 9.465 Individuals 441,992 362,253 74,930 621,748 257,427 Length of stay in hospital post1939Xbaseline -0.0378* -0.0783*** 0.0161 -0.0438*** -0.0661*** pneumonia mortality (0.0198) (0.0166) (0.0881) (0.0157) (0.0221) Pre-mean 0.671 0.645 1.086 0.707 0.640 Individuals 436,125 360,693 55,642 594,958 257,502
Source: estimations from the SIP. Notes: Standard errors (in parentheses) are clustered at a region-of-birth level. All models include region-of-
birth fixed effects (49 regions) and year-of-birth fixed effects, and are estimated for both sexes jointly. Pneumonia mortality rate is per 1000 mid-year population, normalised (dividing by its 95th-5th percentile range). Age interval for ln labour income is ages 44–60, and for length of stay in hospital is ages 53–60. All Models are estimated according to Eq.1 plus family-level controls (mother age, mother education, father SES, and father sector of employment) separately for sub-groups defined by parental characteristics. Pre-mean denotes mean of the outcome in 1934–1938.
*** p<0.01, ** p<0.05, * p<0.1.

32
Appendix K
ADDITIONAL TESTS FOR PLAUSIBLE MEASUREMENT ERROR
In Table K1 I estimate the impact of pneumonia mortality in a region and a year of birth on
later-life outcomes, while instrumenting it with treatment intensity. Any measurement error
should be absorbed from the 2SLS estimates with this check. The 2SLS results give the average
effects for individuals for different treatment groups (LATE effects), including those whose
mortality from pneumonia mortality has declined after the arrival of sulphapyridine. The 2SLS
results are all statistically significant, at least at 5 percent significance level, and their
magnitudes are now larger. In Table K2 I split baseline pneumonia mortality at the quartiles (4
groups), rank and normalise them and use this indicator in the models (Panel A). The rationale
for this test is that regions with certain levels of pneumonia mortality, even measured with some
error, are unlikely to fall into wrong quartiles. I further adjusted the pneumonia indicator by
dividing it by region-of-birth crude death rate in order to exclude the influence of possible
regional differences in registration of deaths (Panel B). While it is unlikely that deaths were not
registered in regions in full, because they were aggregated from parish records, these models
estimate the impact of pneumonia with the share of pneumonia deaths in total deaths. Similarly
to the tests presented in the main body of the text, these robustness checks in general produce
estimates which are even larger compared to the main estimates, suggesting that they could be
seen as conservative.

33
TABLE K1 – 2SLS ESTIMATES. EFFECTS OF PNEUMONIA EXPOSURE IN INFANCY ON ADULT OUTCOMES, SWEDEN, COHORTS 1934–1943, BOTH SEXES
(1) (2) (3) (4) (5) (6) (7) Ln labour income pneumonia mortality -0.1228*** -0.1556*** -0.0687*** - - -0.1342*** -0.1458*** (0.0447) (0.0360) (0.0299) (0.0442) (0.0502) First stage post1939Xbaseline -0.3513*** -0.3258*** -0.4050*** -0.1694* -0.1236 -0.3514*** -0.3195*** pneumonia mortality (0.0611) (0.0646) (0.0563) (0.0963) (0.1067) (0.0611) (0.0022) F-stats 32.98 25.36 51.61 3.07 1.34 33.01 20221.28 Pre-mean 8.063 8.063 8.063 8.063 8.063 8.063 8.098 Individuals 878,606 878,606 878,606 878,606 878,606 878,606 811,241 Mothers 545,318 Years of schooling pneumonia mortality -0.4198** -0.4058** -0.6436** - - -0.1217** -0.0187 (0.2112) (0.1990) (0.2872) (0.0504) (0.0834) First stage post1939Xbaseline -0.3512*** -0.3260*** -0.4038*** -0.1688* -0.1226 -0.3513*** -0.3197*** pneumonia mortality (0.0611) (0.0646) (0.0564) (0.0961) (0.1069) (0.0612) (0.0023) F-stats 32.95 25.45 51.30 3.08 1.30 32.76 18763.79 Pre-mean 9.271 9.271 9.271 9.271 9.271 9.271 9.330 Individuals 879,175 879,175 879,175 879,175 879,175 879,175 804,245 Mothers 542,422 Length of stay in hospital pneumonia mortality 0.1186** 0.1248** 0.1337*** - - 0.5865** 0.6256*** (0.0460) (0.0624) (0.0502) (0.2261) (0.0657) First stage post1939Xbaseline -0.3506*** -0.3251*** -0.4042*** -0.1685* -0.1221 -0.3507*** -0.3174*** pneumonia mortality (0.0611) (0.0648) (0.0564) (0.0963) (0.1068) (0.0612) (0.0022) F-stats 32.73 25.16 51.91 3.06 1.32 32.98 20548.50 Pre-mean 0.770 0.770 0.770 0.770 0.770 0.770 0.718 Individuals 852,460 852,460 852,460 852,460 852,460 852,460 796,818 Mothers 538,951
Source: estimations from the SIP. Notes: Standard errors (in parentheses) are clustered at a region-of-birth level. Pneumonia mortality rate is per
1000 mid-year population, normalised (dividing by its 95th-5th percentile range). All models include region-of-birth fixed effects (49 regions) and year-of-birth fixed effects, and are estimated for both sexes jointly. Age interval for ln labour income is ages 44–60, and for the length of stay in hospital is ages 53–60. Model 1 is estimated according to Eq.1 Models 2-6 are estimated according to Eq.1 plus additional controls. Models 2 additionally include disease controls, such as separate interactions between post1939 and baseline cause-specific mortality (puerperal fever, typhoid fever, diarrhoea, influenza, lung tuberculosis, heart disease, diabetes, and cancer). Models 3 additionally include interactions between post1939 and baseline region-of-birth controls (stillbirth rate, crude birth rate, share of females, share under age 15, share above age 65, infant mortality rate, ln real regional GDP per capita, ln real wage of worker, share of employed in agriculture, share of employed in industry, ln medical personnel per 1000, ln pharmacies per 1000, ln real hospital spending per 1000, ln number of school-rooms per 1000 pupils, and ln number of teachers per 1000 pupils). Models 4 additionally include interactions between baseline pneumonic regions-of-birth (at the quartiles of baseline pneumonia mortality) and linear time trends. Models 5 additionally include region-of-birth linear time trends. Models 6 add family-level controls (mother age, mother education, father SES, and father sector of employment). Models 7 are estimated according to Eq.2. Pre-mean denotes mean of the outcome in 1934–1938.
*** p<0.01, ** p<0.05, * p<0.1.

34
TABLE K2 – REDUCED-FORM ESTIMATES. EFFECTS OF PNEUMONIA EXPOSURE IN INFANCY ON ADULT OUTCOMES WHILE CORRECTING FOR PLAUSIBLE MEASUREMENT ERROR, SWEDEN, COHORTS 1934–1943, BOTH SEXES
(1) (2) (3) (4) (5) (6) (7) A – Pneumonic categories as a baseline pneumonia mortality
Ln labour income post1939Xbaseline pneumonia mortality 0.0486** 0.0559*** 0.0269* 0.0445** 0.0438** 0.0542*** 0.0479*** (0.0193) (0.0154) (0.0141) (0.0179) (0.0179) (0.0198) (0.0174) Pre-mean 8.063 8.063 8.063 8.063 8.063 8.063 8.098 Individuals 878,606 878,606 878,606 878,606 878,606 878,606 811,241 Mothers 545,318 Years of schooling post1939Xbaseline pneumonia mortality 0.1357** 0.1284** 0.2476** 0.0527 0.0427 0.1987*** 0.1797*** (0.0657) (0.0546) (0.1023) (0.0466) (0.0477) (0.0702) (0.0251) Pre-mean 9.271 9.271 9.271 9.271 9.271 9.271 9.330 Individuals 879,175 879,175 879,175 879,175 879,175 879,175 804,245 Mothers 542,422 Length of stay in hospital post1939Xbaseline pneumonia mortality -0.0446*** -0.0436** -0.0548*** -0.0428 -0.0421 -0.0460** -0.0382 (0.0165) (0.0180) (0.0185) (0.0337) (0.0339) (0.0175) (0.0288) Pre-mean 0.770 0.770 0.770 0.770 0.770 0.770 0.718 Individuals 852,460 852,460 852,460 852,460 852,460 852,460 796,818 Mothers 538,951
B – Adjusting for crude death rate Ln labour income post1939Xbaseline pneumonia mortality 0.0443 0.0638* 0.0478** 0.0295 0.0296 0.0466* 0.0686** (0.0282) (0.0321) (0.0229) (0.0278) (0.0278) (0.0277) (0.0295) Pre-mean 8.063 8.063 8.063 8.063 8.063 8.063 8.098 Individuals 878,606 878,606 878,606 878,606 878,606 878,606 811,241 Mothers 545,318 Years of schooling post1939Xbaseline pneumonia mortality 0.2065** 0.2034* 0.4897** 0.1894* 0.0504 0.2586** 0.2780*** (0.1007) (0.1128) (0.2199) (0.0963) (0.0843) (0.1083) (0.0434) Pre-mean 9.271 9.271 9.271 9.271 9.271 9.271 9.330 Individuals 879,175 879,175 879,175 879,175 879,175 879,175 804,245 Mothers 542,422 Length of stay in hospital post1939Xbaseline pneumonia mortality -0.0561** -0.0736** -0.0801** -0.0466* -0.0504 -0.0537** -0.0495 (0.0246) (0.0281) (0.0324) (0.0241) (0.0591) (0.0264) (0.0487) Pre-mean 0.770 0.770 0.770 0.770 0.770 0.770 0.718 Individuals 852,460 852,460 852,460 852,460 852,460 852,460 796,818 Mothers 538,951
Source: estimations from the SIP. Notes: Standard errors (in parentheses) are clustered at a county-of-birth level. All models include region-of-
birth fixed effects (49 regions) and year-of-birth fixed effects, and are estimated for both sexes jointly. In Panel A pneumonia mortality rate is per 1000 mid-year population divided by crude death rate per 1000, normalised (dividing by its 95th-5th percentile range). In Panel B pneumonia mortality rate is ranked within pneumonia mortality per 1000 mid-year population divided at the quartiles, normalised (dividing by its 95th-5th percentile range). Age interval for ln labour income is ages 44–60, and for length of stay in hospital is ages 53–60. Models 1 correspond to Eq.1. Models 2–6 are estimated according to Eq.1 plus additional controls. Models 2 additionally include disease controls, such as separate interactions between post1939 and baseline cause-specific mortality. Models 3 additionally include interactions between post1939 and baseline region-of-birth controls. Models 4 additionally include interactions between baseline pneumonic regions-of-birth (divided at the quartiles of baseline pneumonia mortality) and linear time trends. Models 5 additionally include region-of-birth linear time trends. Models 6 add family-level controls. Models 7 are estimated according to Eq.2. Pre-mean denotes mean of the outcome in 1934–1938.
*** p<0.01, ** p<0.05, * p<0.1.
35
Appendix L
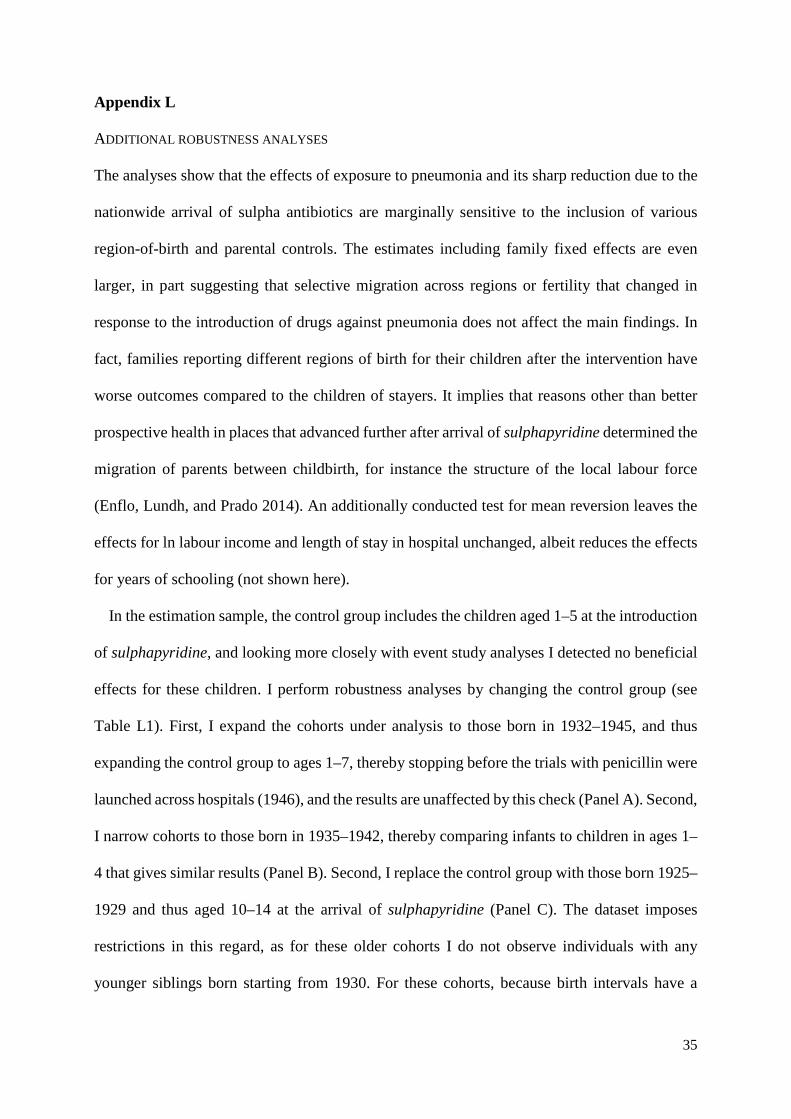
ADDITIONAL ROBUSTNESS ANALYSES
The analyses show that the effects of exposure to pneumonia and its sharp reduction due to the
nationwide arrival of sulpha antibiotics are marginally sensitive to the inclusion of various
region-of-birth and parental controls. The estimates including family fixed effects are even
larger, in part suggesting that selective migration across regions or fertility that changed in
response to the introduction of drugs against pneumonia does not affect the main findings. In
fact, families reporting different regions of birth for their children after the intervention have
worse outcomes compared to the children of stayers. It implies that reasons other than better
prospective health in places that advanced further after arrival of sulphapyridine determined the
migration of parents between childbirth, for instance the structure of the local labour force
(Enflo, Lundh, and Prado 2014). An additionally conducted test for mean reversion leaves the
effects for ln labour income and length of stay in hospital unchanged, albeit reduces the effects
for years of schooling (not shown here).
In the estimation sample, the control group includes the children aged 1–5 at the introduction
of sulphapyridine, and looking more closely with event study analyses I detected no beneficial
effects for these children. I perform robustness analyses by changing the control group (see
Table L1). First, I expand the cohorts under analysis to those born in 1932–1945, and thus
expanding the control group to ages 1–7, thereby stopping before the trials with penicillin were
launched across hospitals (1946), and the results are unaffected by this check (Panel A). Second,
I narrow cohorts to those born in 1935–1942, thereby comparing infants to children in ages 1–
4 that gives similar results (Panel B). Second, I replace the control group with those born 1925–
1929 and thus aged 10–14 at the arrival of sulphapyridine (Panel C). The dataset imposes
restrictions in this regard, as for these older cohorts I do not observe individuals with any
younger siblings born starting from 1930. For these cohorts, because birth intervals have a

36
negative association with income (e.g., Bengtsson and Dribe 2014), the control group could be
positively selected. Despite this limitation, I find beneficial effects of reduction in pneumonia
mortality of sizable magnitude for all outcomes.
Similar to other studies looking at the long-term survival of cohorts treated by different socio-
economic conditions in childhood (cf. Zajacova and Burgard 2013), the bias related to selective
mortality is likely to be downward in this case, as the weakest members of cohorts are more
likely to survive in the after-drug period and observed in the registers. To assess it formally, I
apply a two-stage Heckman selection procedure to analyse whether selective survival affects
the estimates (Heckman 1979). In the first stage, the probability of being observed in the
estimation sample is modelled as a function of cohort fixed effects, region of birth fixed effects
and sex for all individuals observed as early as the year 1960 (Folk- och Bostadsräkningen
1960) in a probit model. An inverse Mills’ ratio originating for each individual from the
estimates of the probit model is further included as a covariate into the baseline specification,
and this procedure does not affect the main findings (see Table L2).
The main results of the paper are unlikely to be explained by other programmes that
overlapped with the introduction of sulphapyridine. The confounding compulsory schooling
reforms that were also coordinated with child labour laws do not appear to be problematic for
the estimates, as the children in the estimation samples in the overwhelming majority were
exposed to the same reforms after age 5. The introduction of seventh compulsory grade has
been completed for the studied cohorts, with the exception of several municipalities (out of 949)
that introduced the reform in 1934–1936 (Fischer, Karlsson, and Nilsson 2013). Similarly, an
introduction of a nine-year comprehensive school hardly affected the cohorts under analysis,
although some forerunning municipalities, which had such a system in place early, implemented
it fully in 1943 (Holmlund 2008). Nevertheless, I rerun the models while excluding these
municipalities of birth (less than 1 percent of population) treated by the changes in the

37
compulsory schooling and the results remain unchanged (not shown here). Besides the
compulsory schooling reforms, up to 1950, institutions of secondary schooling and vocational
training gradually began to educate pupils of both sexes (Ljungberg and Nilsson 2009). Because
this process was smooth, the plausible effects from this educational development are likely to
be controlled by several socio-economic and demographic region-of-birth characteristics that
have already been included in the models.
The arrival of sulphapyridine overlapped with two other public health reforms. One reform
was related to the rollout of government support to maternal and child health in 1937 until its
full nationwide coverage in 1960 (Ström 1946). Based on the official statistical sources
(Statistiska Centralbyrån 1920b-1950), I collected information on the coverage of infant
population in the regions of birth by this programme. The correlation between the region-of-
birth baseline pneumonia mortality and proportion of infants enrolled in the institutional care
activities in 1938–1943 is –0.055 (p-value is 0.708), indicating its unlikely influence on the
results. Another institutional change occurred with regard to the gradual expansion of hospital
births in 1925–1950 (Vallgårda 1996; Wisselgren 2005). It is not problematic if this expansion
occurred gradually across the cohorts in a manner unrelated to baseline pneumonia mortality,
only its acceleration for the cohorts treated by sulpha antibiotics could potentially violate the
results. Based on the same statistical sources, I collected information on the regional
proportions of hospital deliveries in total. The correlation between the rate of change in these
fractions in 1938–1943 and the region-of-birth baseline pneumonia mortality is 0.022 (p-value
is 0.883), which is too weak to affect the results.
Additionally, I test the robustness of the results to the region-specific influence of WWII.
During the war, Sweden was neutral, but there were problems with supply of food and fuels
(Wangel 1982). Studies looking at the impact of food shortage on either childhood
anthropometric measures, such as birth weight, height and BMI (Abolins 1962; Angell-

38
Andersen et al. 2004), or in female labour force participation (Gustafsson and Jacobsson 1985),
by comparing the surrounding cohorts, do not reveal any differences. In this case, any potential
country-level changes in child health due to food shortage are ruled out by the birth cohort fixed
effects. Differences in price changes of basic products in 1930s–1940s were also indicated
across regions of Sweden; food prices increased more considerably in central parts compared
to others (Statistiska Centralbyrån 1931-1959). Based on the official statistical sources, I
collected the regional price indices for main food products for years 1934–1943 (Statistiska
Centralbyrån 1931-1959) and added them into the specification. As evident (see Table L3), the
results stay unaffected by this check. Given the importance of month of birth for the later-life
outcomes (Bound, Jaeger, and Baker 1995; Buckles and Hungerman 2013), I introduce month
of birth and it interactions with control variables that leaves the estimates unaffected (not shown
here).
In Table L4, I perform the placebo analysis when the post-treatment period is assigned to
earlier cohorts (post is defined as 1 for those born during and after 1935, 1936, 1937, and 1938
instead of during and after 1939). With these checks, I detect no significant effects and they all
are smaller in magnitudes than those in the main analyses, consistent with arrival of
sulphapyridine in 1939.
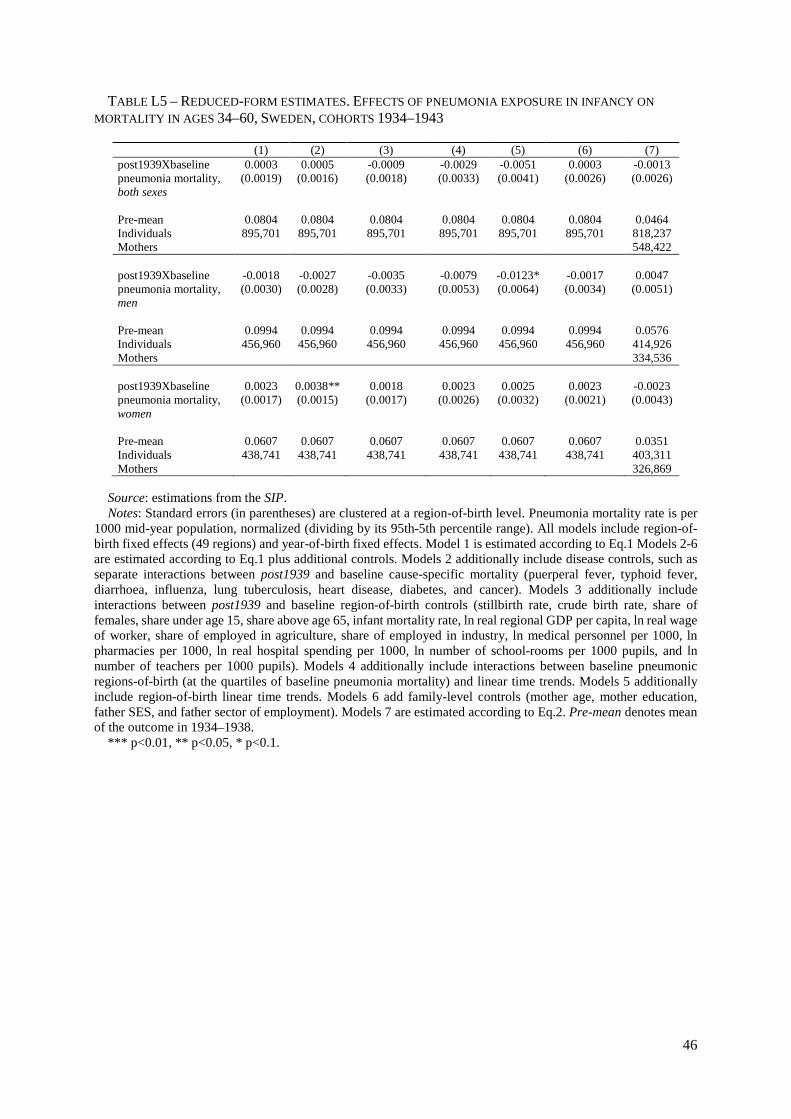
I find that the effects of reduced pneumonia infection in infancy exist for other
approximations of health, education and labour productivity available in the dataset (whether
on disability pension, ever at hospital, total hospital admissions, more than secondary schooling,
tertiary degree, ln total income, ln family income, whether employed). In addition to morbidity
outcome, I run the models for mortality in ages 34–60 and detect no systematic treatment effects
on mortality for the cohorts under study (see Table L5). I also perform the same analysis for
mortality by cause of death (see Table L6). Consistent with previous findings for cause-specific
morbidity, the results point to the beneficial effect of reduced pneumonia exposure in infancy

39
on probability of dying from cardiovascular disease, although it does not attain statistical
significance in many specifications. For instance, for the specification with region-of-birth
linear time trends, the reduction in pneumonia infection led to a decrease in cardiovascular
mortality by 0.0057 percentage points (26.1 percent of the pre-treatment level). The results are
similar if I follow these individuals in their mortality outcomes until age 69.

40
REFERENCES (IN ADDITION TO THE SOURCES NOT CITED IN THE MAIN TEXT)
Abolins, J.A. 1962. “Weight and Length of the Newborn during the Years 1918–1922 and
1938–1942.” Acta Paediatrica 51 (S135): 8–13.
Angell-Andersen, Elisabeth, S. Tretli, T. Grotmol, R. Bjerknes, T. Forsén, J. G. Eriksson,
Sørensen, T. I. A., and L. Räsänen. 2004. “The Association between Nutritional Conditions
during World War II and Childhood Anthropometric Variables in the Nordic Countries.”
Annals of Human Biology 31 (3): 342–55.
Bound, John, Jaeger, David A., and Regina M. Baker. 1995. “Problems with Instrumental
Variables Estimation When the Correlation between the Instruments and the Endogeneous
Explanatory Variable is Weak.” Journal of the American Statistical Association 90 (430):
443–50.
Buckles, Kasey S., and Daniel M., Hungerman. 2013. “Season of Birth and Later Outcomes:
Old Questions, New Answers.” Review of Economics and Statistics 95 (3): 711–24.
Enflo, Kerstin, Christer Lundh, and Svante Prado. 2014. “The Role of Migration in Regional
Wage Convergence: Evidence from Sweden 1860–1940.” Explorations in Economic
History 52: 93–110.
Gustafsson, Siv, and Roger Jacobsson. 1985. “Trends in Female Labor Force Participation in
Sweden.” Journal of Labor Economics 3 (1): S256–74.
Statistiska Centralbyrån. 1931–1959. Sveriges Officiella Statistik. Konsumentpriser och
Indexberäkningar [Sweden’s Official Statistics. Consumer Prices and Indices].
Stockholm: P.A. Norstedt & Söner.
Wangel, Carl-Axel. 1982. Sveriges Militära Beredskap 1939-1945 [Sweden's Military
Preparedness 1939–1945]. Stockholm: Militärhistoriska förl.
Wisselgren, Maria J. 2005. Att Föda Barn – Från Privat till Offentlig Angelägenhet [To Bear
Children – From Private to Public Concern]. Umeå: Umeå University.

41
TABLE L1 – REDUCED-FORM ESTIMATES. EFFECTS OF PNEUMONIA EXPOSURE IN INFANCY ON ADULT OUTCOMES (VARIATIONS WITH TREATMENT AND CONTROL GROUPS), SWEDEN, COHORTS 1925–1945, BOTH SEXES
(1) (2) (3) (4) (5) (6) (7) A - Expanding cohorts: cohorts 1932–1938 and 1939–1945
Ln labour income post1939Xbaseline 0.0477*** 0.0569*** 0.0371*** 0.0474*** 0.0412*** 0.0547*** 0.0484*** pneumonia mortality
(0.0140) (0.0128) (0.0121) (0.0155) (0.0131) (0.0140) (0.0136)
Pre-mean 8.021 8.021 8.021 8.021 8.021 8.021 8.069 Individuals 1,271,553 1,271,553 1,271,553 1,271,553 1,271,553 1,271,553 1,129,255 Mothers 695,674 Years of schooling post1939Xbaseline 0.1865*** 0.1673*** 0.2980*** 0.1691* 0.0553 0.2653*** 0.1513*** pneumonia mortality
(0.0622) (0.0594) (0.1177) (0.0980) (0.0400) (0.0626) (0.0181)
Pre-mean 9.180 9.180 9.180 9.180 9.180 9.180 9.282 Individuals 1,278,988 1,278,988 1,278,988 1,278,988 1,278,988 1,278,988 1,123,680 Mothers 694,017 Length of stay in hospital
post1939Xbaseline -0.0384*** -0.0343*** -0.0525*** -0.0770*** -0.0810*** -0.0395*** -0.0380* pneumonia mortality
(0.0115) (0.0126) (0.0116) (0.0243) (0.0263) (0.0124) (0.0215)
Pre-mean 0.776 0.776 0.776 0.776 0.776 0.776 0.717 Individuals 1,227,889 1,227,889 1,227,889 1,227,889 1,227,889 1,227,889 1,102,011 Mothers 685,451
B - Narrowing cohorts: cohorts 1935–1938 and 1939–1942 Ln labour income post1939Xbaseline 0.0432*** 0.0496*** 0.0274** 0.0381** 0.0194 0.0458*** 0.0411** pneumonia mortality
(0.0125) (0.0106) (0.0124) (0.0150) (0.0153) (0.0122) (0.0174)
Pre-mean 8.076 8.076 8.076 8.076 8.076 8.076 8.108 Individuals 689,170 689,170 689,170 689,170 689,170 689,170 638,458 Mothers 458,367 Years of schooling post1939Xbaseline 0.1190** 0.1020** 0.2256** 0.1157* 0.0658 0.1567*** 0.1843*** pneumonia mortality
(0.0491) (0.0467) (0.1000) (0.0664) (0.0394) (0.0470) (0.0247)
Pre-mean 9.324 9.324 9.324 9.324 9.324 9.324 9.376 Individuals 689,414 689,414 689,414 689,414 689,414 689,414 632,683 Mothers 455,612 Length of stay in hospital
post1939Xbaseline -0.0369*** -0.0414** -0.0520** -0.0608** -0.0667** -0.0377** -0.0423 pneumonia mortality
(0.0134) (0.0159) (0.0198) (0.0275) (0.0304) (0.0142) (0.0280)
Pre-mean 0.754 0.754 0.754 0.754 0.754 0.754 0.714 Individuals 668,728 668,728 668,728 668,728 668,728 668,728 627,461 Mothers 452,813
C - Changing a control group: cohorts 1925–1929 and 1939–1943 Ln labour income post1939Xbaseline 0.0904*** 0.1136*** 0.0467** 0.1163 0.0784 0.1196*** na pneumonia mortality
(0.0318) (0.0278) (0.0213) (0.0740) (0.0753) (0.0313)
Pre-mean 7.430 7.430 7.430 7.430 7.430 7.430 Individuals 815,285 815,285 815,285 815,285 815,285 815,285 Years of schooling post1939Xbaseline 0.0944 0.0902 0.2021 0.2993 0.0462 0.2780*** na pneumonia mortality
(0.0664) (0.0642) (0.1367) (0.2121) (0.1025) (0.0761)
Pre-mean 8.527 8.527 8.527 8.527 8.527 8.527 Individuals 834,447 834,447 834,447 834,447 834,447 834,447 Length of stay in hospital
post1939Xbaseline -0.0661* -0.0503* -0.0273 -0.0600 -0.0163 -0.0650 na pneumonia mortality
(0.0075) (0.0287) (0.0234) (0.0731) (0.0976) (0.0400)
Pre-mean 1.348 1.348 1.348 1.348 1.348 1.348 Individuals 770,907 770,907 770,907 770,907 770,907 770,907
Source: estimations from the SIP. Notes: Standard errors (in parentheses) are clustered at a region-of-birth level. Pneumonia mortality rate is per
1000 mid-year population, normalised (dividing by its 95th-5th percentile range). All models include region-of-birth fixed effects (49 regions) and year-of-birth fixed effects. In the ‘expanded’ sample, age interval for ln labour

42
income is ages 46–60, and for length of stay in hospital is ages 55–60. In the ‘narrow’ sample, age interval for ln labour income is ages 44–60, and for length of stay in hospital is ages 53–60. In the ‘change control’ sample, age interval for ln labour income is ages 53–60, and for length of stay in hospital is ages 62–69. All models are estimated for both sexes jointly. Models 1 are estimated according to Eq.1 Models 2-6 are estimated according to Eq.1 plus additional controls. Models 2 additionally include disease controls, such as separate interactions between post1939 and baseline cause-specific mortality (puerperal fever, typhoid fever, diarrhoea, influenza, lung tuberculosis, heart disease, diabetes, and cancer). Models 3 additionally include interactions between post1939 and baseline region-of-birth controls (stillbirth rate, crude birth rate, share of females, share under age 15, share above age 65, infant mortality rate, ln real regional GDP per capita, ln real wage of worker, share of employed in agriculture, share of employed in industry, ln medical personnel per 1000, ln pharmacies per 1000, ln real hospital spending per 1000, ln number of school-rooms per 1000 pupils, and ln number of teachers per 1000 pupils). Models 4 additionally include interactions between baseline pneumonic regions-of-birth (at the quartiles of baseline pneumonia mortality) and linear time trends. Models 5 additionally include region-of-birth linear time trends. Models 6 add family-level controls (mother age, mother education, father SES, and father sector of employment). Models 7 are estimated according to Eq.2. Pre-mean denotes mean of the outcome in 1932–1938 for ‘expanded’ sample, that in 1934–1938 for ‘narrow’ sample, and that in 1925–1929 for ‘change control’ sample.
*** p<0.01, ** p<0.05, * p<0.1.

43
TABLE L2 – REDUCED-FORM ESTIMATES. EFFECTS OF PNEUMONIA EXPOSURE IN INFANCY ON LATER-LIFE OUTCOMES WHILE ADJUSTING FOR SELECTIVE SURVIVAL, SWEDEN, COHORTS 1934–1943
(1) Ln labour income post1939Xbaseline pneumonia mortality, both sexes 0.0319** (0.0154) Individuals 878,606 Years of schooling post1939Xbaseline pneumonia mortality, both sexes 0.0472 (0.0348) Individuals 879,175 Length of stay in hospital post1939Xbaseline pneumonia mortality, both sexes -0.0472* (0.0244) Individuals 852,460
Source: estimations from the SIP. Notes: Models adjust for selective survival by using a two-stage Heckman selection procedure. Standard errors
(in parentheses) are clustered at a region-of-birth level. All models include region-of-birth fixed effects (49 regions) and year-of-birth fixed effects, and are estimated for both sexes jointly. Pneumonia mortality rate is per 1000 mid-year population, normalized (dividing by its 95th-5th percentile range). Models correspond to Eq.1 plus region-of-birth linear time trends.
*** p<0.01, ** p<0.05, * p<0.1.

44
TABLE L3 – REDUCED-FORM ESTIMATES. PLACEBO TREND BREAKS. EFFECTS OF PNEUMONIA EXPOSURE IN INFANCY ON ADULT OUTCOMES IN SWEDEN, COHORTS 1934–1943 BOTH SEXES
(1) (2) (3) Ln labour income Years of schooling Length of stay
in hospital post1935Xbaseline pneumonia mortality 0.0023 0.0353 -0.0053 (0.0147) (0.0319) (0.0344) Pre-mean 8.013 9.049 0.839 Rsq 0.031 0.068 0.002 Individuals 852,460 879,175 852,460 post1936Xbaseline pneumonia mortality 0.0184 -0.0045 -0.0028 (0.0139) (0.0303) (0.0219) Pre-mean 8.031 9.108 0.827 Rsq 0.031 0.068 0.002 Individuals 852,460 879,175 852,460 post1937Xbaseline pneumonia mortality 0.0027 -0.0406 -0.0128 (0.0133) (0.0483) (0.0272) Pre-mean 8.041 9.168 0.807 Rsq 0.031 0.068 0.002 Individuals 852,460 879,175 852,460 post1938Xbaseline pneumonia mortality 0.0232 0.0051 -0.0250 (0.0139) (0.0467) (0.0279) Pre-mean 8.050 9.217 0.787 Rsq 0.031 0.068 0.002 Individuals 852,460 879,175 852,460
Source: estimations from the SIP. Notes: Standard errors (in parentheses) are clustered at a region-of-birth level. All models include region-of-
birth fixed effects (49 regions) and year-of-birth fixed effects, and are estimated for both sexes jointly. Pneumonia mortality rate is per 1000 mid-year population, normalized (dividing by its 95th-5th percentile range). Models correspond to Eq.1 plus region-of-birth linear time trends. Age interval for ln labour income is ages 44–60, and for length of stay in hospital is ages 53–60. Pre-mean denotes mean of the outcome in 1934–1938.
*** p<0.01, ** p<0.05, * p<0.1.

45
TABLE L4– REDUCED-FORM ESTIMATES. EFFECTS OF PNEUMONIA EXPOSURE IN INFANCY ON ADULT OUTCOMES WHILE CONTROLLING FOR REGIONAL FOOD PRICES, SWEDEN, COHORTS 1934–1943
(1) All
(2) Men
(3) Women
Ln labour income post1939Xbaseline pneumonia mortality 0.0429*** 0.0302 0.0553*** (0.0143) (0.0202) (0.0136) Pre-mean 8.063 8.321 7.798 Individuals 878,606 446,511 432,095 Years of schooling post1939Xbaseline pneumonia mortality 0.1472** 0.1446** 0.1510** (0.0562) (0.0567) (0.0591) Pre-mean 9.271 9.274 9.268 Individuals 879,175 446,736 432,439 Length of stay in hospital post1939Xbaseline pneumonia mortality -0.0417*** -0.0465** -0.0369* (0.0129) (0.0198) (0.0213) Pre-mean 0.770 0.785 0.775 Individuals 852,460 430,096 422,364
Source: estimations from the SIP. Notes: Standard errors (in parentheses) are clustered at a region-of-birth level. All models include region-of-
birth fixed effects (49 regions) and year-of-birth fixed effects. Pneumonia mortality rate is per 1000 mid-year population, normalized (dividing by its 95th-5th percentile range). Age interval for ln labour income is ages 44–60, and for the length of stay in hospital is ages 53–60. Models correspond to Eq.1 plus price the index of main food products. Pre-mean denotes mean of the outcome in 1934–1938.
*** p<0.01, ** p<0.05, * p<0.1.
46
TABLE L5 – REDUCED-FORM ESTIMATES. EFFECTS OF PNEUMONIA EXPOSURE IN INFANCY ON MORTALITY IN AGES 34–60, SWEDEN, COHORTS 1934–1943
(1) (2) (3) (4) (5) (6) (7) post1939Xbaseline 0.0003 0.0005 -0.0009 -0.0029 -0.0051 0.0003 -0.0013 pneumonia mortality, both sexes
(0.0019) (0.0016) (0.0018) (0.0033) (0.0041) (0.0026) (0.0026)
Pre-mean 0.0804 0.0804 0.0804 0.0804 0.0804 0.0804 0.0464 Individuals 895,701 895,701 895,701 895,701 895,701 895,701 818,237 Mothers 548,422 post1939Xbaseline -0.0018 -0.0027 -0.0035 -0.0079 -0.0123* -0.0017 0.0047 pneumonia mortality, men
(0.0030) (0.0028) (0.0033) (0.0053) (0.0064) (0.0034) (0.0051)
Pre-mean 0.0994 0.0994 0.0994 0.0994 0.0994 0.0994 0.0576 Individuals 456,960 456,960 456,960 456,960 456,960 456,960 414,926 Mothers 334,536 post1939Xbaseline 0.0023 0.0038** 0.0018 0.0023 0.0025 0.0023 -0.0023 pneumonia mortality, women
(0.0017) (0.0015) (0.0017) (0.0026) (0.0032) (0.0021) (0.0043)
Pre-mean 0.0607 0.0607 0.0607 0.0607 0.0607 0.0607 0.0351 Individuals 438,741 438,741 438,741 438,741 438,741 438,741 403,311 Mothers 326,869
Source: estimations from the SIP. Notes: Standard errors (in parentheses) are clustered at a region-of-birth level. Pneumonia mortality rate is per
1000 mid-year population, normalized (dividing by its 95th-5th percentile range). All models include region-of-birth fixed effects (49 regions) and year-of-birth fixed effects. Model 1 is estimated according to Eq.1 Models 2-6 are estimated according to Eq.1 plus additional controls. Models 2 additionally include disease controls, such as separate interactions between post1939 and baseline cause-specific mortality (puerperal fever, typhoid fever, diarrhoea, influenza, lung tuberculosis, heart disease, diabetes, and cancer). Models 3 additionally include interactions between post1939 and baseline region-of-birth controls (stillbirth rate, crude birth rate, share of females, share under age 15, share above age 65, infant mortality rate, ln real regional GDP per capita, ln real wage of worker, share of employed in agriculture, share of employed in industry, ln medical personnel per 1000, ln pharmacies per 1000, ln real hospital spending per 1000, ln number of school-rooms per 1000 pupils, and ln number of teachers per 1000 pupils). Models 4 additionally include interactions between baseline pneumonic regions-of-birth (at the quartiles of baseline pneumonia mortality) and linear time trends. Models 5 additionally include region-of-birth linear time trends. Models 6 add family-level controls (mother age, mother education, father SES, and father sector of employment). Models 7 are estimated according to Eq.2. Pre-mean denotes mean of the outcome in 1934–1938.
*** p<0.01, ** p<0.05, * p<0.1.

47
TABLE L6 – REDUCED-FORM ESTIMATES. EFFECTS OF PNEUMONIA EXPOSURE IN INFANCY ON CAUSE-SPECIFIC MORTALITY IN AGES 34–60, BOTH SEXES, SWEDEN, COHORTS 1934–1943
(1) (2) (3) (4) (5) (6) (7) Infectious/Respiratory post1939Xbase 0.0004 0.0004 0.0003 0.0007 0.0009 0.0004 0.0003 pneumonia (0.0003) (0.0004) (0.0003) (0.0006) (0.0007) (0.0003) (0.0005) Pre-mean 0.0033 0.0033 0.0033 0.0033 0.0033 0.0033 0.0019 CVD post1939Xbase -0.0014 -0.0013 -0.0015 -0.0046** -0.0057*** -0.0014 0.0002 pneumonia (0.0012) (0.0011) (0.0012) (0.0017) (0.0017) (0.0014) (0.0014) Pre-mean 0.0218 0.0218 0.0218 0.0218 0.0218 0.0218 0.0133 Diabetes post1939Xbase 0.0001 -0.0001 0.0001 -0.0001 0.0001 0.0001 -0.0001 pneumonia (0.0002) (0.0002) (0.0002) (0.0005) (0.0006) (0.0002) (0.0003) Pre-mean 0.0015 0.0015 0.0015 0.0015 0.0015 0.0015 0.0008 Cancer post1939Xbase 0.0015 0.0024*** 0.0006 0.0022 0.0017 0.0015 -0.0001 pneumonia (0.0011) (0.0009) (0.0011) (0.0020) (0.0025) (0.0012) (0.0017) Pre-mean 0.0293 0.0293 0.0293 0.0293 0.0293 0.0293 0.0191 Degenerative post1939Xbase -0.0004 -0.0007 -0.0004 -0.0013 -0.0016 -0.0004 -0.0017** pneumonia (0.0005) (0.0005) (0.0005) (0.0010) (0.0011) (0.0005) (0.0008) Pre-mean 0.0077 0.0077 0.0077 0.0077 0.0077 0.0077 0.0040 Mental post1939Xbase -0.0002 -0.0004 -0.0003 -0.0004 -0.0005 -0.0003 -0.0008** pneumonia (0.0003) (0.0003) (0.0003) (0.0004) (0.0005) (0.0003) (0.0004) Pre-mean 0.0019 0.0019 0.0019 0.0019 0.0019 0.0019 0.0009 Other post1939Xbase 0.0003 0.0002 0.0004 0.0006 0.0001 0.0004 0.0009 pneumonia (0.0007) (0.0009) (0.0007) (0.0013) (0.0018) (0.0009) (0.0010) Pre-mean 0.0146 0.0146 0.0146 0.0146 0.0146 0.0146 0.0061 Individuals 895,701 895,701 895,701 895,701 895,701 895,701 818,237 Mothers 548,422
Source: estimations from the SIP. Notes: Standard errors (in parentheses) are clustered at a region-of-birth level. Pneumonia mortality rate is per
1000 mid-year population, normalized (dividing by its 95th-5th percentile range). All models include region-of-birth fixed effects (49 regions) and year-of-birth fixed effects, and are estimated for both sexes jointly. Model 1 is estimated according to Eq.1 Models 2-6 are estimated according to Eq.1 plus additional controls. Models 2 additionally include disease controls, such as separate interactions between post1939 and baseline cause-specific mortality (puerperal fever, typhoid fever, diarrhoea, influenza, lung tuberculosis, heart disease, diabetes, and cancer). Models 3 additionally include interactions between post1939 and baseline region-of-birth controls (stillbirth rate, crude birth rate, share of females, share under age 15, share above age 65, infant mortality rate, ln real regional GDP per capita, ln real wage of worker, share of employed in agriculture, share of employed in industry, ln medical personnel per 1000, ln pharmacies per 1000, ln real hospital spending per 1000, ln number of school-rooms per 1000 pupils, and ln number of teachers per 1000 pupils). Models 4 additionally include interactions between baseline pneumonic regions-of-birth (at the quartiles of baseline pneumonia mortality) and linear time trends. Models 5 additionally include region-of-birth linear time trends. Models 6 add family-level controls (mother age, mother education, father SES, and father sector of employment). Models 7 are estimated according to Eq.2. Pre-mean denotes mean of the outcome in 1934–1938.
*** p<0.01, ** p<0.05, * p<0.1.