on measuring individual knowledge in organizations measuring individual knowledge 2 on measuring...
TRANSCRIPT
On Measuring Individual Knowledge in Organizations
Stephen P. Borgatti
Carroll School of Management
Boston College
Chestnut Hill, MA 02467 USA
Tel: 617 552 0452; Fax: 617 552 4230
Inga Carboni
Graduate School of Arts and Sciences
Boston College
Chestnut Hill, MA 02467 USA
Tel: 617 552 0910; Fax: 617 552 0523
Keywords: knowledge, measurement, consensus
On Measuring Individual Knowledge 2
On Measuring Individual Knowledge in Organizations
Abstract
The recent interest in organizational learning, transactive knowledge systems, human and
intellectual capital, absorptive capacity, and knowledge management in general brings to the fore
a fundamental question: How can we measure the knowledge held by individuals and groups?
One common measurement tool is the standardized test: a multiple-choice test scored with the
help of a right answer key. However, in many organizational research settings, the right answers
are not necessarily known by the researcher. An alternative approach that does not require an
answer key is to ask individuals to rate their own levels of knowledge, or to ask members of a
group to rate each other on amount of knowledge, and average their various estimates for each
person. Unfortunately, these subjective rating approaches are subject to a variety of biases,
making them less than accurate. This paper presents a promising third approach -- based on
anthropological consensus theory -- that is similar in spirit to the standardized test but does not
require an answer key. In this method, knowledge levels are estimated by examining patterns of
agreement between all pairs of respondents on responses to a knowledge questionnaire. In this
study, we compare these various methods empirically using a unique dataset in which a test is
given where the right answers are known and subjective estimates are also obtained. The results
show that the self-rating and network rating models are not well correlated with the truth (i.e.,
the standardized test method), but that the consensus method is highly correlated (r = .95) with
the truth. This suggests that the consensus model may indeed be a useful way to estimate
knowledge levels in a number of settings in which the a priori “right” answers are unknown.
Keywords: knowledge, measurement, consensus, organizational learning
On Measuring Individual Knowledge in Organizations
The recent interest in transactive knowledge systems (Wegner, 1987; Moreland, Argote,
Krishnan, 1996), human and intellectual capital (Stewart, 1997), absorptive capacity (Cohen and
Levinthal, 1990), organizational learning (Argyris & Schon, 1978), and knowledge management
in general brings to the fore a thorny question: How do we measure the knowledge held by
individuals and groups?
Given the prominence of the concept in empirical research, it is striking how little research there
has been on how knowledge might be measured. In part, this is because the measurement of
knowledge begs exceedingly difficult questions of epistemology and ontology. Discussions of
what constitutes knowledge can quickly become frustrating battlegrounds for combatants who
don’t share fundamental paradigms. Even among those who agree that knowledge can, in
principle, be measured, there is the concern that measuring the extent of an individual’s domain
knowledge would require that the researcher be even more knowledgeable about the domain than
the research subjects, which will not often be the case.
The goal of this paper is to explore ways of measuring knowledge that do not require the
researcher to know more than is known by those being measured. We first examine three basic
methods and their variants. The first, and perhaps most common, method is based upon an
underlying belief in knowledge as an objective truth; it involves administering a test for which
the right answers are known. The second method, also fairly common, is drawn from a more
humanistic perspective and involves asking individuals to self-evaluate their own level of
On Measuring Individual Knowledge 2
knowledge or, alternatively, asking contacts of a target individual to evaluate the target’s level of
knowledge. The third method is a promising new approach based on anthropological consensus
theory (Romney, Weller & Batchelder, 1986). It is similar in spirit to the standardized test but
does not require an a priori answer key. Interestingly, although the consensus approach is based
on fundamentally scientific or modernist principles, the result is something that is consistent with
social constructivist approaches to knowledge.
After explaining the three basic approaches, we use a unique dataset to compare the methods in a
controlled setting in which the right answers are known. Finally, we discuss some problems with
the application of these methods, and offer some thoughts on the underlying issues surrounding
conceptualizations of knowledge.
WHY MEASURE KNOWLEDGE?
The fundamental reason to measure knowledge is to permit empirical testing of theories of
knowledge acquisition (e.g., learning theory) or knowledge utilization (e.g., intellectual capital
theory). Until we can actually measure knowledge, theories involving knowledge remain a tissue
of conjectures. For example, in community of practice theory (Lave and Wenger, 1991),
knowledge is seen as being co-constructed through interaction among members of a community
engaged in a joint enterprise. A key concept in this perspective is that of participation: the term
“legitimate peripheral participation” is used to describe neophytes who apprentice themselves to
full participators in order to learn the ropes. A key implication of community of practice theory
On Measuring Individual Knowledge 3
is that individuals who participate more fully and have been involved longer will have more
knowledge. Yet this hypothesis has never been tested, in part because the dependent variable has
seemed a daunting task.
With respect to knowledge utilization, it is axiomatic in social capital theories such as Burt
(1992) that knowledge is power. Typically, such theories assert that certain network properties
(such as having many structural holes) facilitate the gathering of timely information from the
network, and this in turn leads to successful action and rewards (such as early promotion). But
what is actually tested is the relationship between the easily measured network properties and the
ultimate dependent variable (success or rewards) and the mediating variable that defines the
theoretical mechanism is not actually tested.
MEASURING KNOWLEDGE
In this section we outline in more detail the three approaches to measuring knowledge that we
test empirically. It is useful to keep in mind that each approach entails different assumptions
about the nature of knowledge and its relation to truth.
Classical Test Theory
The measurement of knowledge via standardized tests is a well-developed sub-discipline of
education and psychology, dating back to the early part of the last century (Ekstrom, 1973;
Hambleton & Zaal, 1991; Spearman, 1904). The basic paradigm can be viewed as a translation
On Measuring Individual Knowledge 4
of an objective body of knowledge into a set of propositions whose truth or falsity are known. A
representative sample of these propositions is presented to persons (“subjects”) in the form of a
questionnaire (i.e., a test) consisting of a series of true/false, multiple choice or other questions.
The results of administering such a test to a set of subjects can be represented as a response
matrix X whose rows correspond to subjects (respondents) and whose columns correspond to test
items, and where the cell xij gives the response of subject i to question j. In addition, there is a
row vector Y representing the answer key, with cell yj indicating the correct answer for item j. To
evaluate a subject’s performance, we need only to measure the similarity between their row of X
and the answer key Y. The natural measure of similarity is the simple matching coefficient, mi,
which, for any given subject i, counts the proportion of times that xij = yj for all questions j.
Test theory usually distinguishes between the performance of a subject, mi (defined as the
proportion correct), and the knowledge of a subject, di (defined as the proportion of the material
that the person knows). The assumption is that a person’s score on a test is not exactly the same
as their knowledge for two reasons. First, the questions asked on the test are a sample of the set
of all propositions possible, and by chance alone the sample chosen could include a
preponderance of questions to which the subject happens to know the answers. Second, in a
true/false or multiple-choice test, the respondent may guess the right answer without knowing it.
To handle the first problem, we focus on making the exam as representative and as long as
possible. To handle the second problem, we factor down mi by a function of the number of
alternatives to provide an adjustment for guessing.

On Measuring Individual Knowledge 5
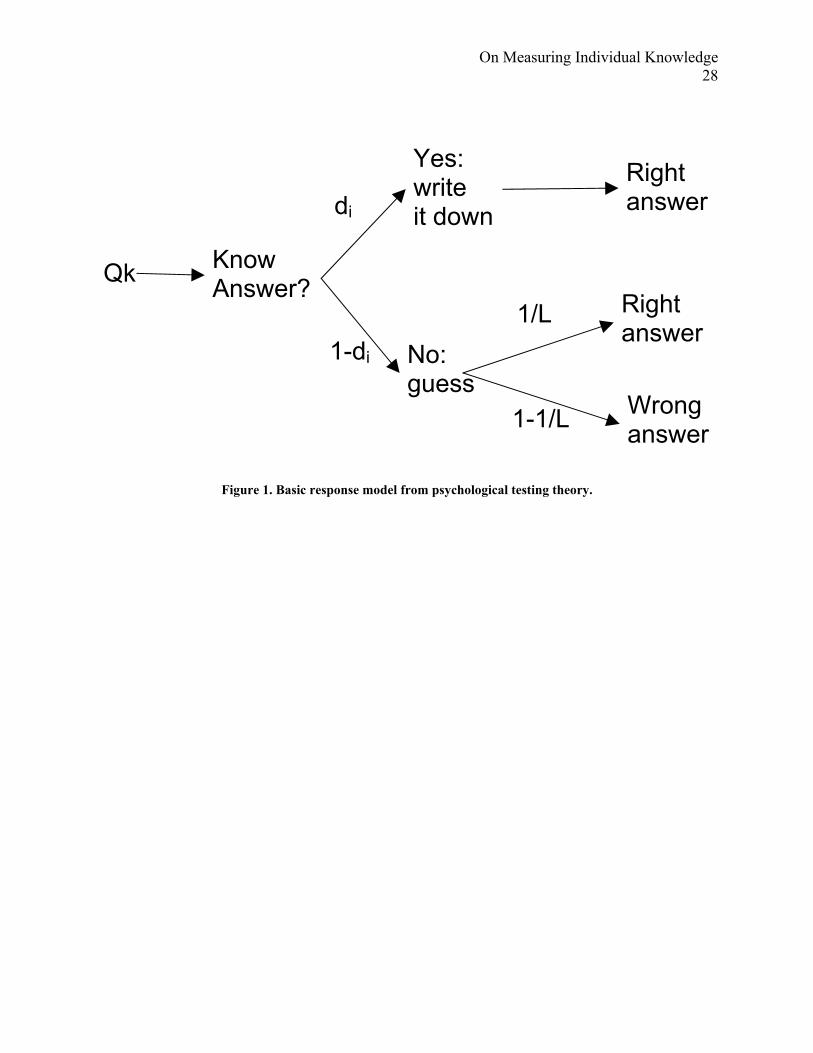
The implicit response model is given in Figure 1. The model says that when confronted with test
item j, the test subject either knows the answer (with probability di) or doesn’t (with probability
1-di). If she knows the answer, she writes it down and moves to the next question. If she doesn't
know the answer, she guesses randomly among the L alternatives (e.g., L=2 for true/false test),
with a 1/L conditional probability of guessing correctly.
Given this model, the probability of a correct answer (or, equally, the expected proportion of
correct answers) is given by
Lddm i
ii)1( −
+=
Equation 1
In other words, the expected proportion correct is due to the number of questions known plus the
number guessed. Re-arranging terms, we can see that knowledge can then be estimated as
)1()1(
−−
=L
Lmd ii
Equation 2
Naturally, more complex models can be formulated in which non-random heuristics are posited
for choosing among the alternatives, and for cases in which the person doesn’t necessarily write
down the correct answer even when she knows it.

On Measuring Individual Knowledge 6
This approach assumes the existence of an answer key containing the set of correct answers. In
some contexts, such as educational testing, this is conventionally seen as unproblematic. In an
organizational context, however, having a set of correct answers is problematic. Neither the
organizational members nor the researchers can be expected to be omniscient. When there is
intra-organizational variability in responses to “factual” questions, whose answers are “correct”?
Direct Subjective Ratings
An approach that sidesteps the issue of obtaining the answer key is the direct subjective ratings
method, in which a subjective rating is obtained of a person’s level of knowledge. This approach
is consistent with social construction perspectives, which have a long history in education (e.g.,
Vogotsky, 1962). There are three variants of the basic ratings method that we consider here.
The first variant is the meta-knowledge self-report: we simply ask the respondent to rate her
level of knowledge in the domain under investigation. The key problem, of course, is that when
the extent of knowledge in a domain is itself unknown, a person has no basis for estimating the
extent of what she doesn’t know. Two individuals with the same knowledge base may vary
wildly in their self-ratings, based on their understanding of what knowledge may exist. In
addition, self-reports are susceptible to bias (whether self-aggrandizing or self-deprecatory) and
deliberate distortion. Lastly, the construct itself may be invalid. How can an individual assess
their own level of domain knowledge when the individual’s understanding of the domain affects
her understanding of her own knowledge level, the very thing being measured?

On Measuring Individual Knowledge 7
The second variant proposes that socially relevant others may be able to better judge an
individual’s knowledge than the individual him/herself. Each person in a socially relevant group
is asked to rate the level of knowledge of every other person, similar to “360-degree” evaluation
schemes in organizations. The knowledge score for a given person is then taken as the mean of
individual estimates. Pooling multiple estimates of the same quantity is a technique used very
successfully in a variety of fields from scientific measurement to jury-based legal systems
(Shaw, 1981). An advantage of this approach over self-ratings is that the knowledge levels of
those with little knowledge are potentially accurately measured, as they are being assessed
mostly by people of greater knowledge. Unfortunately, the knowledge level of those with greater
levels of knowledge may be poorly estimated, as the estimates are made by people of lesser
knowledge. Although this approach eliminates the powerful biases encountered in the self-report
approach, it is susceptible to other biases. For example, a person’s ability to manage the
impressions of others can lead to increased estimates of their competence by others (Kilduff &
Day, 1994).
The third variant asks each person to identify people with whom he/she is especially familiar,
and then asks her to estimate the knowledge levels of those people. Thus, the estimate for a given
person is an aggregation of estimates from a select group who is putatively more familiar with
the person’s actual competencies. The difficulty here is that the sample can easily consist of a set
of nearly mutually exclusive cliques with high positive affect, resulting in a positive in-group
bias that can leads clique members to rate each other highly (Sumner, 1908).
On Measuring Individual Knowledge 8
All of the survey methods discussed here have the advantage of not needing an answer key (and
are relatively convenient to administer), but suffer from various validity problems. It is simply
not clear what is being measured when a human being is asked to assess their own or someone
else’s knowledge. Is the rater assessing breadth or depth of knowledge? Is the rater primarily
responding to the ability to apply that knowledge in situations (which would be more visible)?
Or are they responding to the ability to articulate knowledge? In addition, the rater may be
influenced by such variables as interpersonal attraction, self-monitoring, and status. The next
section describes a method that attempts to resolve both the validity problem of the direct
subjective rating method and the “unknown answer key” problem of classical test theory.
Cultural Consensus Model
Romney, Weller and Batchelder (1986) introduced a formal theory relating agreement to
knowledge. Observing that human systems often rely on agreement to determine truth (e.g., the
jury system), their research question was: Under what conditions does agreement imply
knowledge? They begin with the basic response model of classical test theory shown in Figure 1.
Given that model, they formulate the probability of agreement between any pair of subjects i and
k on a given question j. Agreement can occur in any of four mutually exclusive ways. The first
case is where both i and k know the correct answer, and therefore answer the same way. This
occurs with probability
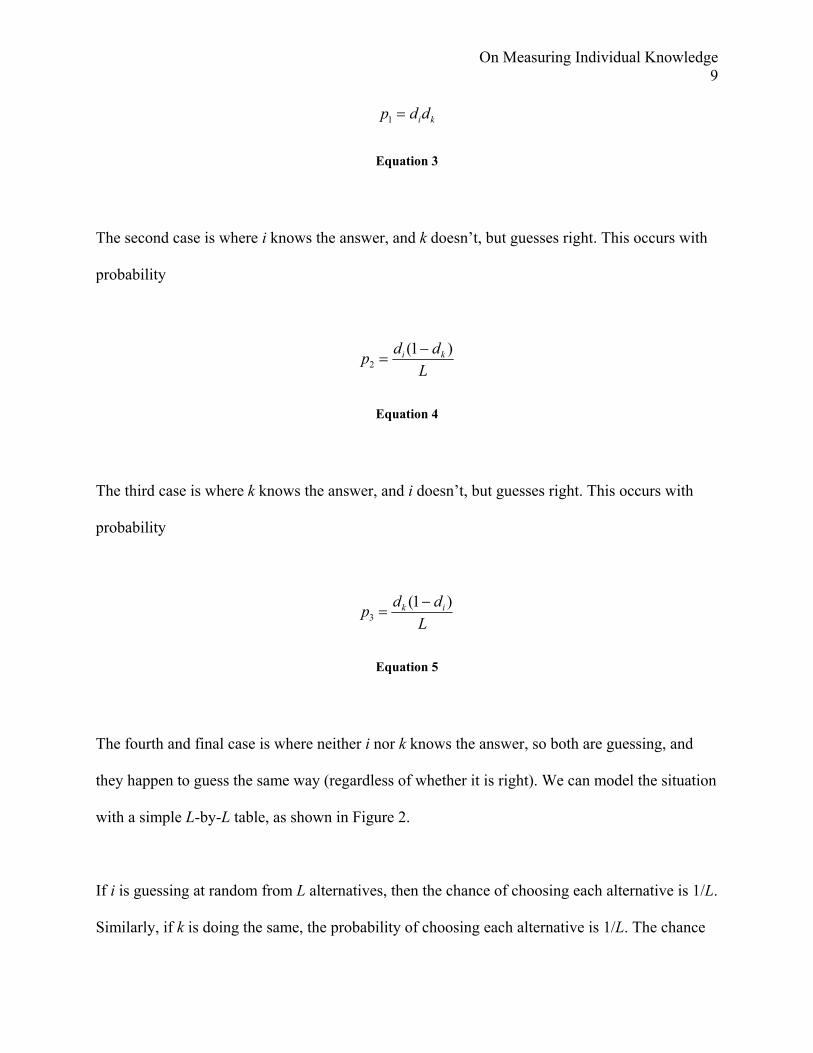
On Measuring Individual Knowledge 9
kiddp =1
Equation 3
The second case is where i knows the answer, and k doesn’t, but guesses right. This occurs with
probability
Lddp ki )1(
2−
=
Equation 4
The third case is where k knows the answer, and i doesn’t, but guesses right. This occurs with
probability
Lddp ik )1(
3−
=
Equation 5
The fourth and final case is where neither i nor k knows the answer, so both are guessing, and
they happen to guess the same way (regardless of whether it is right). We can model the situation
with a simple L-by-L table, as shown in Figure 2.
If i is guessing at random from L alternatives, then the chance of choosing each alternative is 1/L.
Similarly, if k is doing the same, the probability of choosing each alternative is 1/L. The chance
On Measuring Individual Knowledge 10
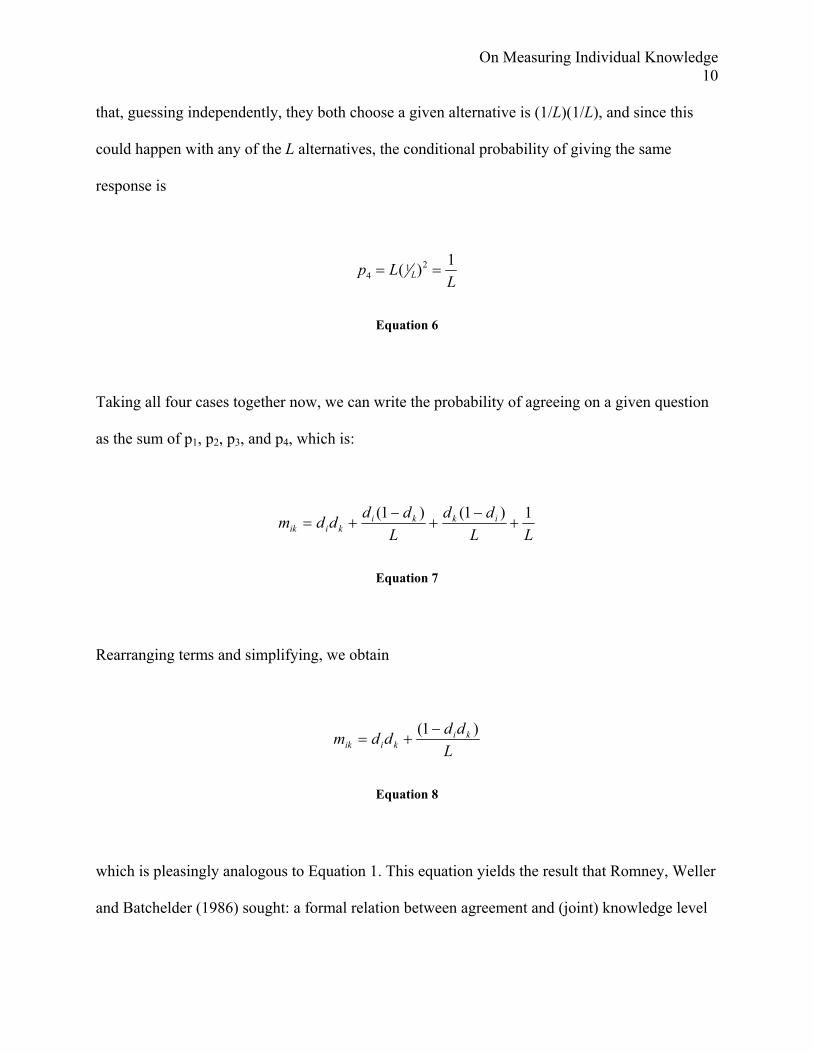
that, guessing independently, they both choose a given alternative is (1/L)(1/L), and since this
could happen with any of the L alternatives, the conditional probability of giving the same
response is
LLp L
1)( 214 ==
Equation 6
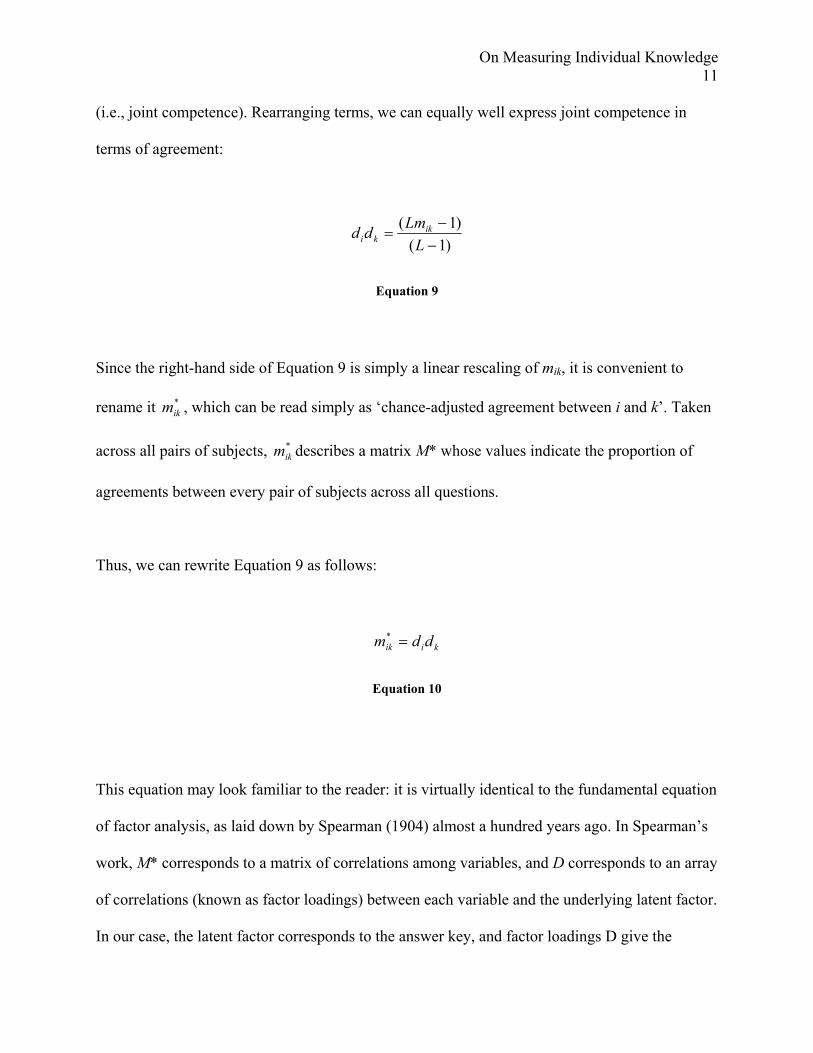
Taking all four cases together now, we can write the probability of agreeing on a given question
as the sum of p1, p2, p3, and p4, which is:
LLdd
Lddddm ikki
kiik1)1()1(
+−
+−
+=
Equation 7
Rearranging terms and simplifying, we obtain
Lddddm ki
kiik)1( −
+=
Equation 8
which is pleasingly analogous to Equation 1. This equation yields the result that Romney, Weller
and Batchelder (1986) sought: a formal relation between agreement and (joint) knowledge level
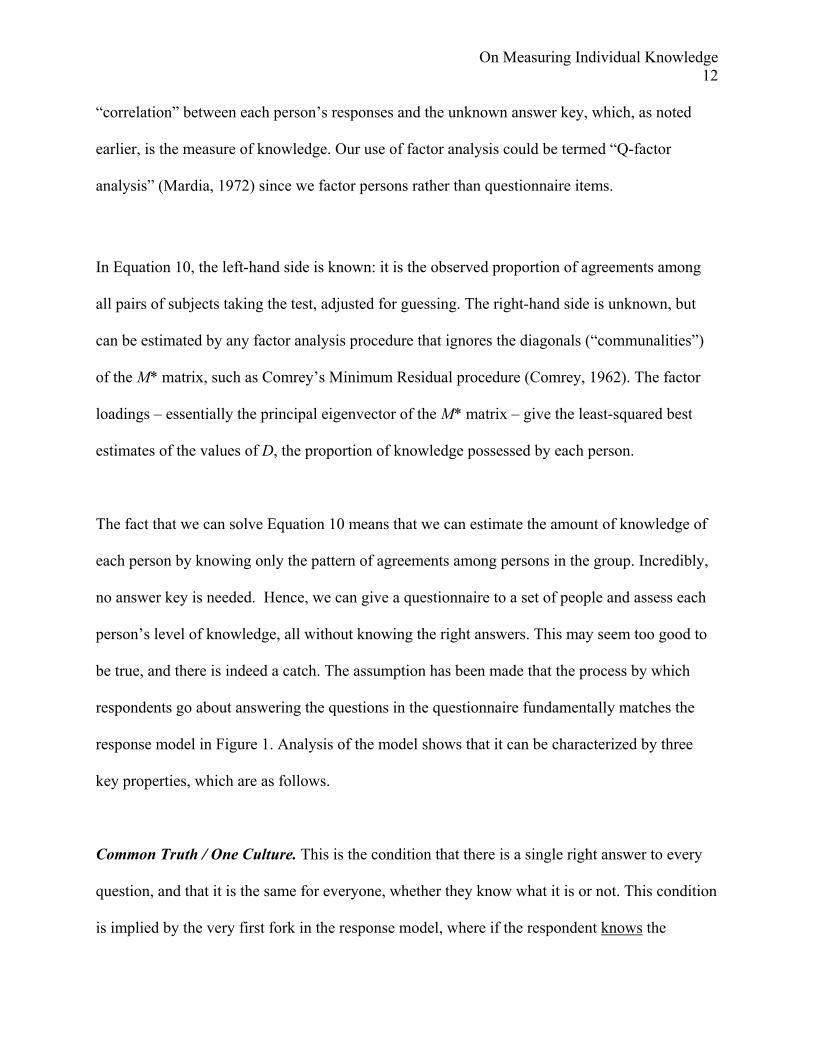
On Measuring Individual Knowledge 11
(i.e., joint competence). Rearranging terms, we can equally well express joint competence in
terms of agreement:
)1()1(
−−
=L
Lmdd ikki
Equation 9
Since the right-hand side of Equation 9 is simply a linear rescaling of mik, it is convenient to
rename it *ikm , which can be read simply as ‘chance-adjusted agreement between i and k’. Taken
across all pairs of subjects, *ikm describes a matrix M* whose values indicate the proportion of
agreements between every pair of subjects across all questions.
Thus, we can rewrite Equation 9 as follows:
kiik ddm =*
Equation 10
This equation may look familiar to the reader: it is virtually identical to the fundamental equation
of factor analysis, as laid down by Spearman (1904) almost a hundred years ago. In Spearman’s
work, M* corresponds to a matrix of correlations among variables, and D corresponds to an array
of correlations (known as factor loadings) between each variable and the underlying latent factor.
In our case, the latent factor corresponds to the answer key, and factor loadings D give the
On Measuring Individual Knowledge 12
“correlation” between each person’s responses and the unknown answer key, which, as noted
earlier, is the measure of knowledge. Our use of factor analysis could be termed “Q-factor
analysis” (Mardia, 1972) since we factor persons rather than questionnaire items.
In Equation 10, the left-hand side is known: it is the observed proportion of agreements among
all pairs of subjects taking the test, adjusted for guessing. The right-hand side is unknown, but
can be estimated by any factor analysis procedure that ignores the diagonals (“communalities”)
of the M* matrix, such as Comrey’s Minimum Residual procedure (Comrey, 1962). The factor
loadings – essentially the principal eigenvector of the M* matrix – give the least-squared best
estimates of the values of D, the proportion of knowledge possessed by each person.
The fact that we can solve Equation 10 means that we can estimate the amount of knowledge of
each person by knowing only the pattern of agreements among persons in the group. Incredibly,
no answer key is needed. Hence, we can give a questionnaire to a set of people and assess each
person’s level of knowledge, all without knowing the right answers. This may seem too good to
be true, and there is indeed a catch. The assumption has been made that the process by which
respondents go about answering the questions in the questionnaire fundamentally matches the
response model in Figure 1. Analysis of the model shows that it can be characterized by three
key properties, which are as follows.
Common Truth / One Culture. This is the condition that there is a single right answer to every
question, and that it is the same for everyone, whether they know what it is or not. This condition
is implied by the very first fork in the response model, where if the respondent knows the
On Measuring Individual Knowledge 13
answer, she writes it down. Naturally, this does not refer to absolute truth but rather to a cultural
reality that applies to all members of a group. The condition says that there is a culturally correct
answer to each question, and everyone in the sample belongs to that same culture.
Conditional Independence of person-item response variables. This says that, conditional on the
answer key, respondents’ responses to a given question are independent of their responses to
other questions and of the responses of other respondents. This condition is implied by the
bottom fork of the response model, where if a person doesn’t know the answer, he guesses
randomly (i.e., without consulting other respondents and without basing his answer on his/an
answer to a previous question).
Item Homogeneity / One Domain. This condition states that a respondent’s level of competence
applies to all questions in the questionnaire. This is implied by the use of a single parameter, di,
to model the probability of knowing the answer to any question. Another way to put this is that
all questions are drawn from the same knowledge domain (e.g., the questionnaire does not mix
questions about tennis with questions about biology, as people can be expected to have different
competence levels in those two domains).
These three properties define the conditions under which a factor analysis of the chance-adjusted
agreement matrix yields point estimates of the proportion of the domain mastered by each person
(i.e., knowledge or competence). When these conditions hold, we can measure competence
without an answer key. Once competence has been measured, it is possible to use Bayesian or
Maximum Likelihood techniques to infer an answer key that maximizes the probability of
On Measuring Individual Knowledge 14
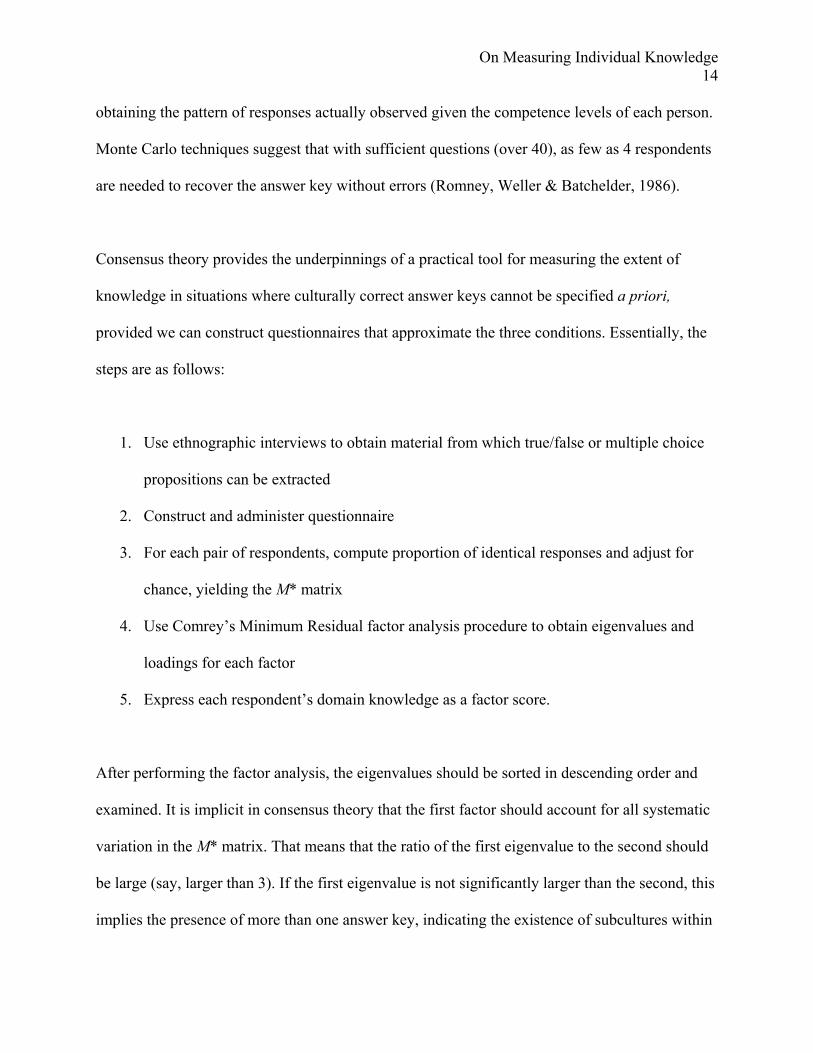
obtaining the pattern of responses actually observed given the competence levels of each person.
Monte Carlo techniques suggest that with sufficient questions (over 40), as few as 4 respondents
are needed to recover the answer key without errors (Romney, Weller & Batchelder, 1986).
Consensus theory provides the underpinnings of a practical tool for measuring the extent of
knowledge in situations where culturally correct answer keys cannot be specified a priori,
provided we can construct questionnaires that approximate the three conditions. Essentially, the
steps are as follows:
1. Use ethnographic interviews to obtain material from which true/false or multiple choice
propositions can be extracted
2. Construct and administer questionnaire
3. For each pair of respondents, compute proportion of identical responses and adjust for
chance, yielding the M* matrix
4. Use Comrey’s Minimum Residual factor analysis procedure to obtain eigenvalues and
loadings for each factor
5. Express each respondent’s domain knowledge as a factor score.
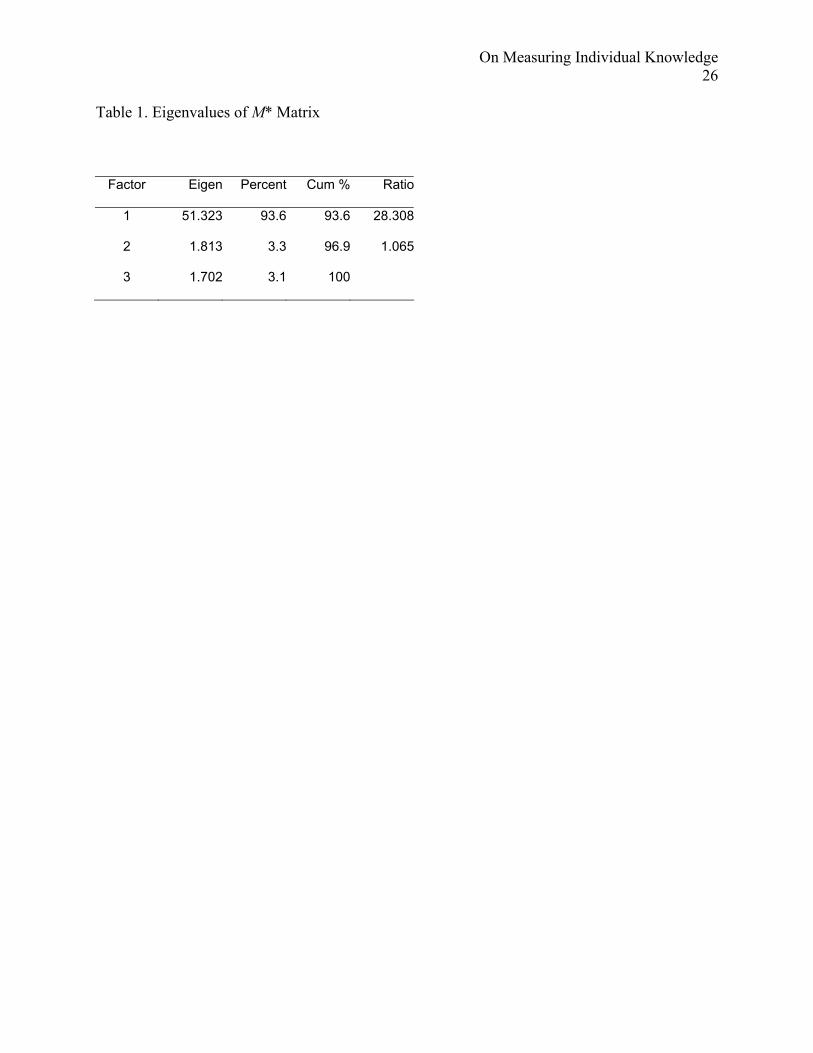
After performing the factor analysis, the eigenvalues should be sorted in descending order and
examined. It is implicit in consensus theory that the first factor should account for all systematic
variation in the M* matrix. That means that the ratio of the first eigenvalue to the second should
be large (say, larger than 3). If the first eigenvalue is not significantly larger than the second, this
implies the presence of more than one answer key, indicating the existence of subcultures within
On Measuring Individual Knowledge 15
the sample. (A similar conclusion is warranted when negative factor loadings are encountered.)
When this occurs, in order to accurately estimate the domain knowledge of each person, it is
necessary to split the sample by subculture / subdomain and rerun the factor analysis separately
for each subsample. Splitting the sample can be done heuristically by examining the pattern of
loadings (e.g., separating positives and negatives), or by clustering the chance-adjusted
agreement matrix.
If the model fits, as evidenced by an overwhelming first eigenvalue and the absence of negative
loadings, then the factor loadings can be interpreted as estimates of the extent of the group’s
knowledge shared by each person. These knowledge scores can then be used as a variable in a
larger analysis. For example, we might correlate knowledge with organizational tenure,
education, rank, and so on to understand the sources of knowledge in the group.
EMPIRICAL TEST
To evaluate the relative performance of the different approaches to measuring knowledge, it was
necessary to find a setting in which all three could be compared directly. The setting chosen was
a multiple-choice non-cumulative final exam given to 91 undergraduates as part of an
Organizational Behavior class. An answer key was provided by the instructor, enabling us to
estimate knowledge via standard testing procedures (approach 1). In addition, at the end of the
exam, students were asked to estimate their own performance in the exam (approach 2a), and to
estimate the performance of each other person they could identify (approach 2b). Students were
On Measuring Individual Knowledge 16
also asked to identify friends within the class, so that estimates of others’ performance could be
limited to just those involving friends (approach 2c). Finally, a data matrix X suitable for
consensus analysis (approach 3) was constructed from each student’s response to each question.
The exam contained a mix of questions that varied from two possible responses up to five. Only
the questions with five possible responses were used, since Equations 1 through 10 were, for
simplicity, derived with the assumption of a fixed number of alternative choices. However, it is
not conceptually difficult to construct models in which the number of choices varies from
question to question.
For approach 1 (classical test theory), each student’s responses were compared to the instructor’s
answer key and the number of correct responses calculated. This figure was then adjusted for
chance guessing by subtracting one quarter of the number of incorrect responses, per Equation 2,
and then converted to a proportion by dividing by the number of questions. Of course, these
linear rescalings do not change the correlations with other variables: they serve only to honor the
traditional distinction in this literature between performance (proportion correct) and knowledge
(proportion of domain mastered).
For approach 2a (self-evaluation), the self-reported estimate of their performance on the test was
used. Twenty students did not give an estimate, and were assigned missing values, leaving a
sample size of 71.
On Measuring Individual Knowledge 17
For approach 2b (others’ evaluation), the aggregate estimate for each person was computed.
Several variants were calculated, including assigning missing values to students for whom there
were fewer than three and also fewer than five estimates. Additional versions were calculated in
which raw scores were mean-centered within judges, to correct for response sets (e.g., judges
who always guess high). Finally, for all of these variants, two different aggregations were
attempted: the simple mean and the median.
For approach 2c (friends’ evaluation), the aggregate estimate for each person who was rated by
someone who had identified them as a friend was computed. As with approach 2b, several
variants were calculated, including assigning missing values to students for whom there were
fewer than 10 and also fewer than 15 estimates. Additional versions were calculated in which
raw scores were mean-centered within judges, to correct for response sets. Again, for all of these
variants, both means and medians were used for aggregation.
For approach 3 (consensus model), the Anthropac software package (Borgatti, 1992) was used to
construct the chance-adjusted agreement matrix and perform the minimum residual factor
analysis. The top three eigenvalues are shown in Table 1. The ratio of the first to the second is
almost 30, and no negative loadings were found, indicating a strong fit to the consensus model.
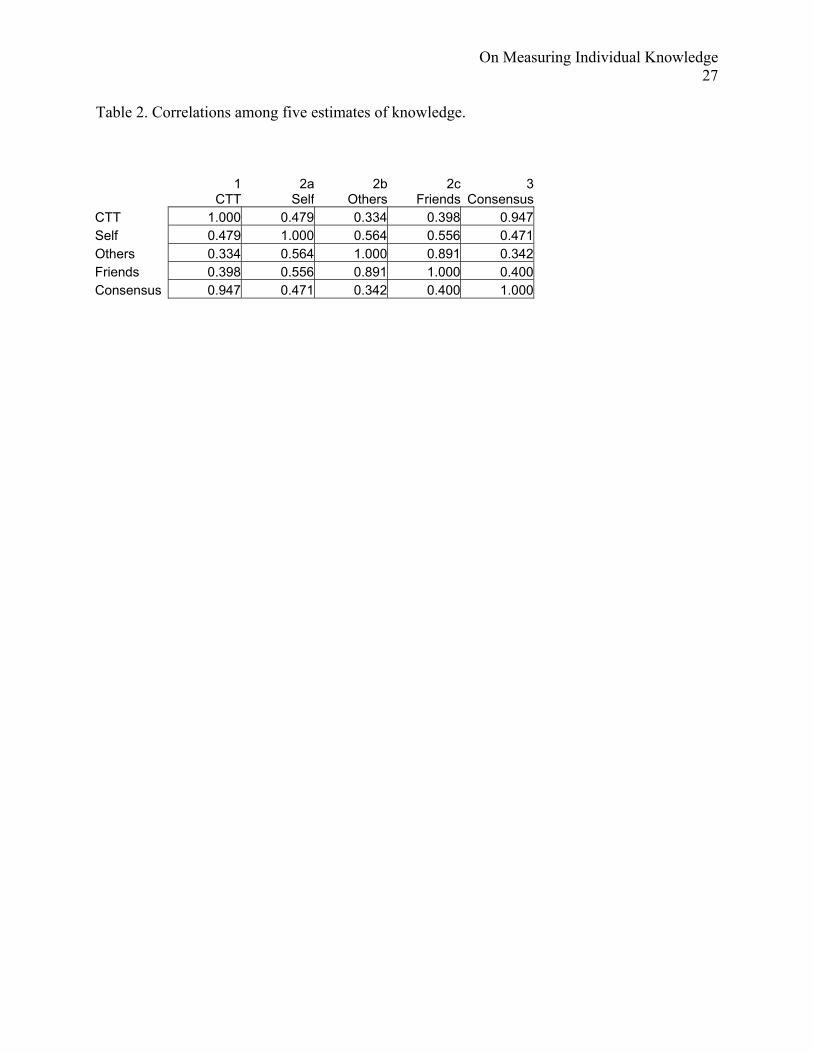
Correlations among the five knowledge score variables are given in Table 2.1 With regard to
approaches 2a, 2b and 2c (labeled “Self”, “Others” and “Friends” respectively), the table reports
only results involving variables constructed using mean aggregation and no recoding of any
On Measuring Individual Knowledge 18
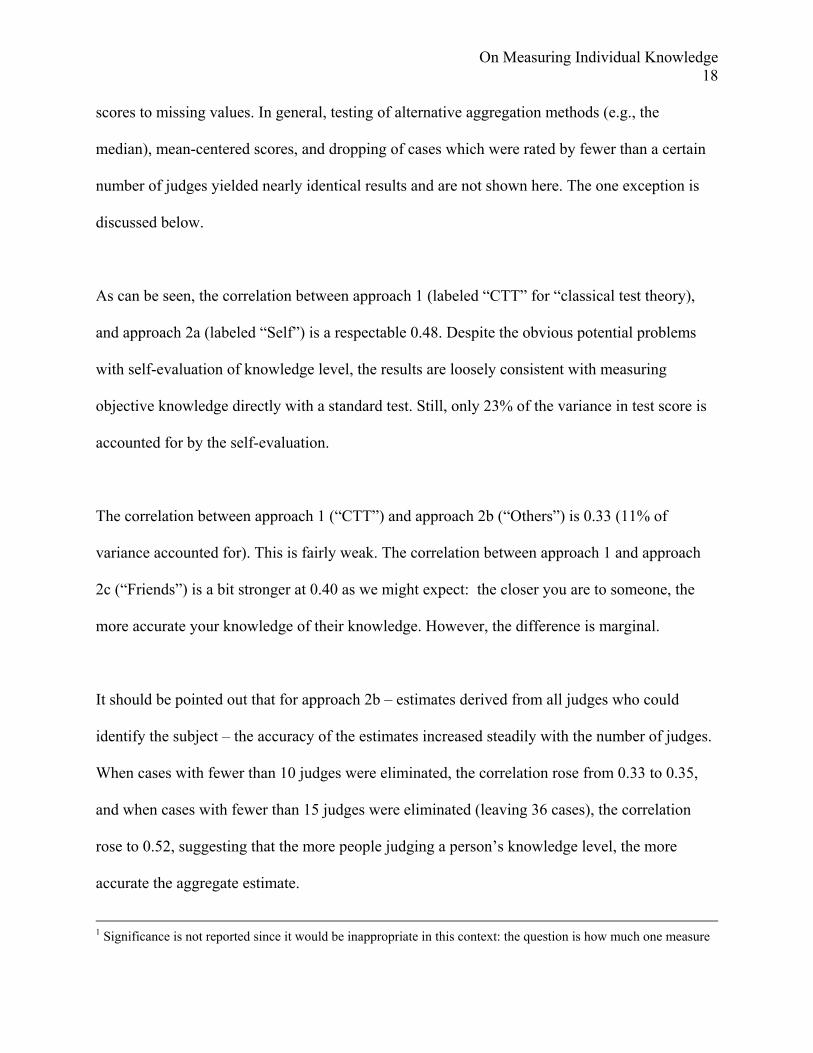
scores to missing values. In general, testing of alternative aggregation methods (e.g., the
median), mean-centered scores, and dropping of cases which were rated by fewer than a certain
number of judges yielded nearly identical results and are not shown here. The one exception is
discussed below.
As can be seen, the correlation between approach 1 (labeled “CTT” for “classical test theory),
and approach 2a (labeled “Self”) is a respectable 0.48. Despite the obvious potential problems
with self-evaluation of knowledge level, the results are loosely consistent with measuring
objective knowledge directly with a standard test. Still, only 23% of the variance in test score is
accounted for by the self-evaluation.
The correlation between approach 1 (“CTT”) and approach 2b (“Others”) is 0.33 (11% of
variance accounted for). This is fairly weak. The correlation between approach 1 and approach
2c (“Friends”) is a bit stronger at 0.40 as we might expect: the closer you are to someone, the
more accurate your knowledge of their knowledge. However, the difference is marginal.
It should be pointed out that for approach 2b – estimates derived from all judges who could
identify the subject – the accuracy of the estimates increased steadily with the number of judges.
When cases with fewer than 10 judges were eliminated, the correlation rose from 0.33 to 0.35,
and when cases with fewer than 15 judges were eliminated (leaving 36 cases), the correlation
rose to 0.52, suggesting that the more people judging a person’s knowledge level, the more
accurate the aggregate estimate.
1 Significance is not reported since it would be inappropriate in this context: the question is how much one measure
On Measuring Individual Knowledge 19
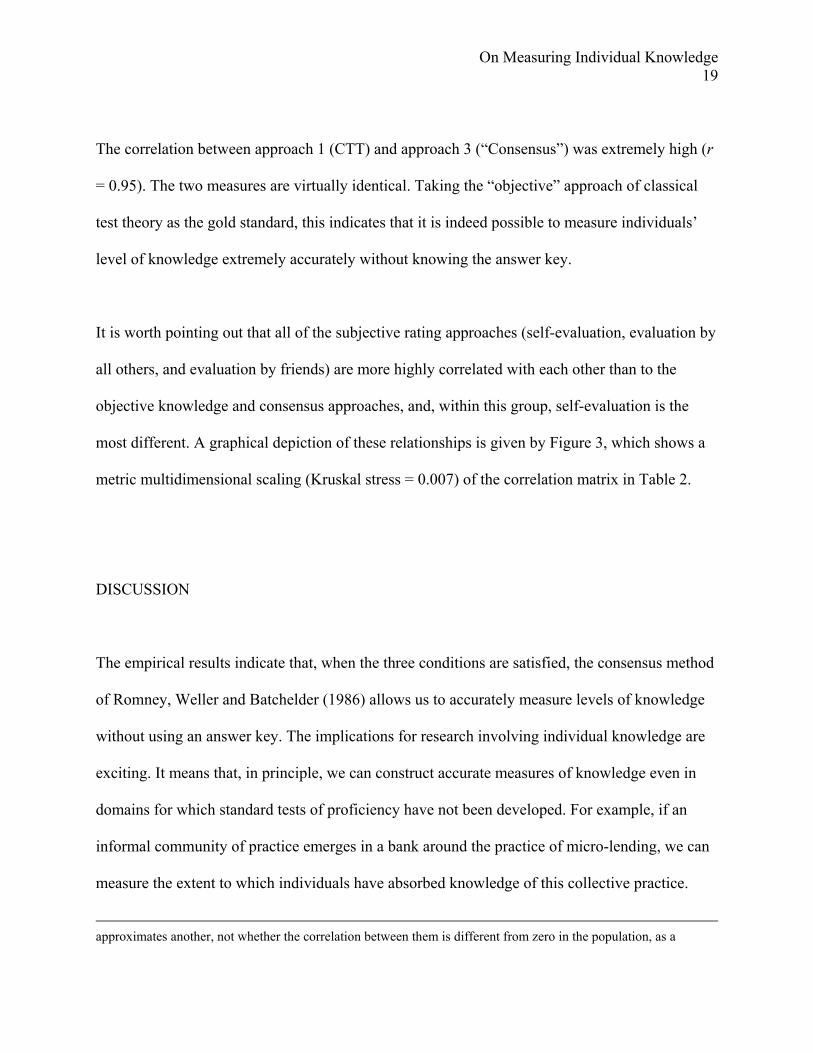
The correlation between approach 1 (CTT) and approach 3 (“Consensus”) was extremely high (r
= 0.95). The two measures are virtually identical. Taking the “objective” approach of classical
test theory as the gold standard, this indicates that it is indeed possible to measure individuals’
level of knowledge extremely accurately without knowing the answer key.
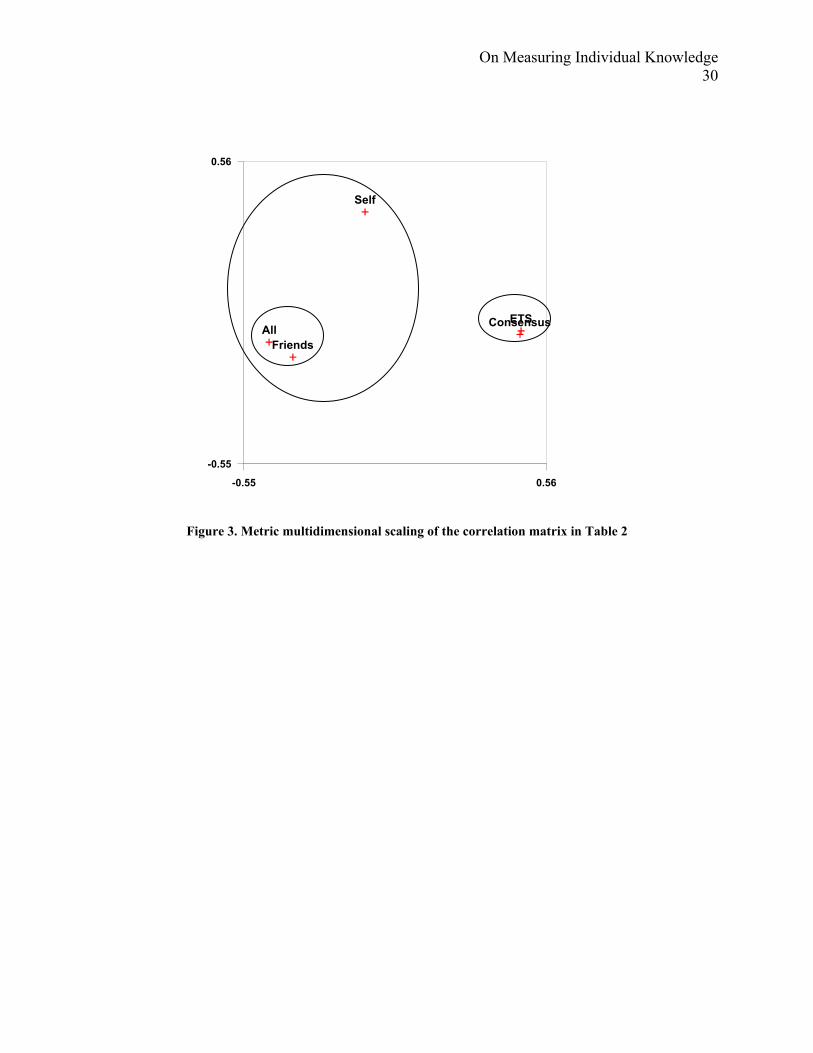
It is worth pointing out that all of the subjective rating approaches (self-evaluation, evaluation by
all others, and evaluation by friends) are more highly correlated with each other than to the
objective knowledge and consensus approaches, and, within this group, self-evaluation is the
most different. A graphical depiction of these relationships is given by Figure 3, which shows a
metric multidimensional scaling (Kruskal stress = 0.007) of the correlation matrix in Table 2.
DISCUSSION
The empirical results indicate that, when the three conditions are satisfied, the consensus method
of Romney, Weller and Batchelder (1986) allows us to accurately measure levels of knowledge
without using an answer key. The implications for research involving individual knowledge are
exciting. It means that, in principle, we can construct accurate measures of knowledge even in
domains for which standard tests of proficiency have not been developed. For example, if an
informal community of practice emerges in a bank around the practice of micro-lending, we can
measure the extent to which individuals have absorbed knowledge of this collective practice.
approximates another, not whether the correlation between them is different from zero in the population, as a
On Measuring Individual Knowledge 20
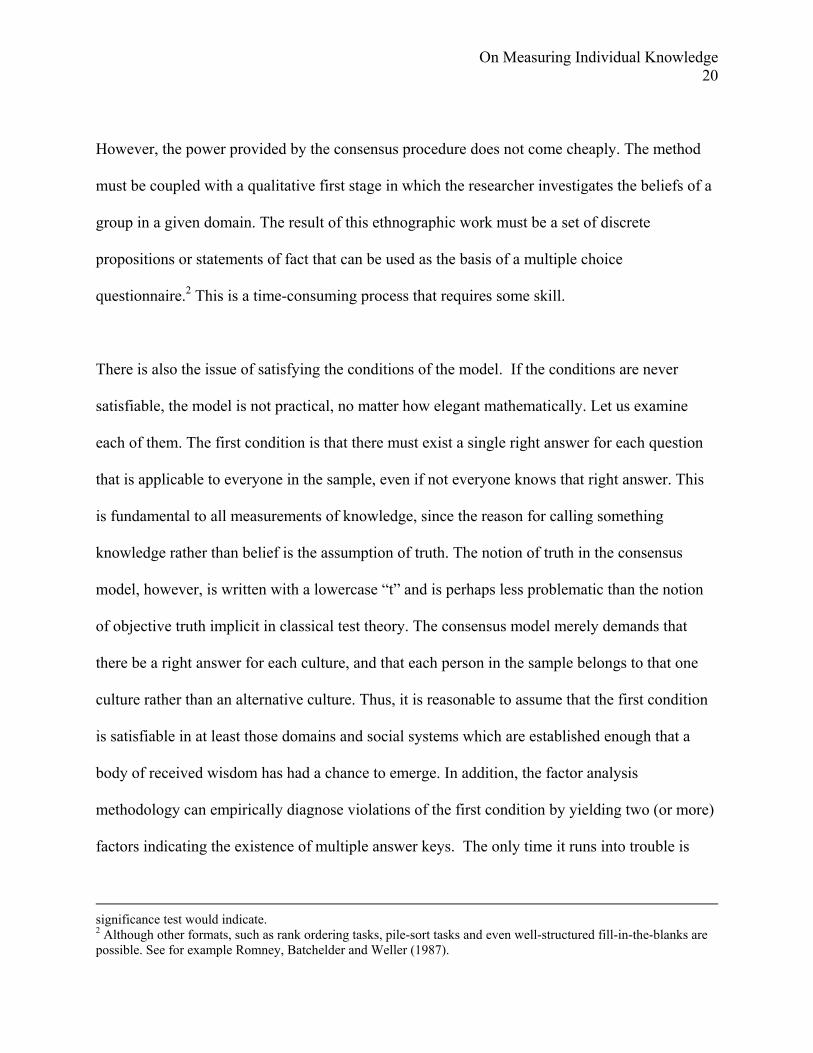
However, the power provided by the consensus procedure does not come cheaply. The method
must be coupled with a qualitative first stage in which the researcher investigates the beliefs of a
group in a given domain. The result of this ethnographic work must be a set of discrete
propositions or statements of fact that can be used as the basis of a multiple choice
questionnaire.2 This is a time-consuming process that requires some skill.
There is also the issue of satisfying the conditions of the model. If the conditions are never
satisfiable, the model is not practical, no matter how elegant mathematically. Let us examine
each of them. The first condition is that there must exist a single right answer for each question
that is applicable to everyone in the sample, even if not everyone knows that right answer. This
is fundamental to all measurements of knowledge, since the reason for calling something
knowledge rather than belief is the assumption of truth. The notion of truth in the consensus
model, however, is written with a lowercase “t” and is perhaps less problematic than the notion
of objective truth implicit in classical test theory. The consensus model merely demands that
there be a right answer for each culture, and that each person in the sample belongs to that one
culture rather than an alternative culture. Thus, it is reasonable to assume that the first condition
is satisfiable in at least those domains and social systems which are established enough that a
body of received wisdom has had a chance to emerge. In addition, the factor analysis
methodology can empirically diagnose violations of the first condition by yielding two (or more)
factors indicating the existence of multiple answer keys. The only time it runs into trouble is
significance test would indicate. 2 Although other formats, such as rank ordering tasks, pile-sort tasks and even well-structured fill-in-the-blanks are possible. See for example Romney, Batchelder and Weller (1987).
On Measuring Individual Knowledge 21
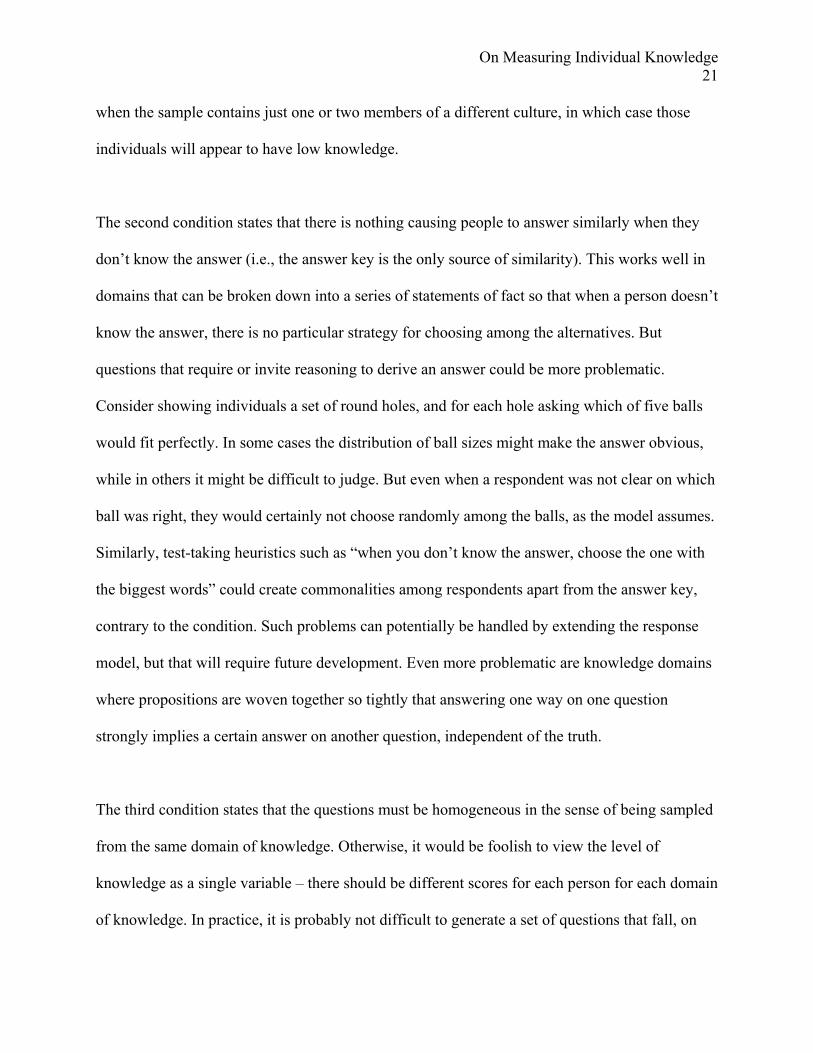
when the sample contains just one or two members of a different culture, in which case those
individuals will appear to have low knowledge.
The second condition states that there is nothing causing people to answer similarly when they
don’t know the answer (i.e., the answer key is the only source of similarity). This works well in
domains that can be broken down into a series of statements of fact so that when a person doesn’t
know the answer, there is no particular strategy for choosing among the alternatives. But
questions that require or invite reasoning to derive an answer could be more problematic.
Consider showing individuals a set of round holes, and for each hole asking which of five balls
would fit perfectly. In some cases the distribution of ball sizes might make the answer obvious,
while in others it might be difficult to judge. But even when a respondent was not clear on which
ball was right, they would certainly not choose randomly among the balls, as the model assumes.
Similarly, test-taking heuristics such as “when you don’t know the answer, choose the one with
the biggest words” could create commonalities among respondents apart from the answer key,
contrary to the condition. Such problems can potentially be handled by extending the response
model, but that will require future development. Even more problematic are knowledge domains
where propositions are woven together so tightly that answering one way on one question
strongly implies a certain answer on another question, independent of the truth.
The third condition states that the questions must be homogeneous in the sense of being sampled
from the same domain of knowledge. Otherwise, it would be foolish to view the level of
knowledge as a single variable – there should be different scores for each person for each domain
of knowledge. In practice, it is probably not difficult to generate a set of questions that fall, on
On Measuring Individual Knowledge 22
the whole, in one domain of knowledge. Individual questions, of course, are always ambiguous
as to whether they belong to a domain or not, especially since they can simultaneously belong to
any number of domains. However, the situation is similar to that of the first condition (except
applied to items rather than persons), and the presence of questions from more than one domain
can often be detected empirically via factor analysis (of the agreements among items rather than
persons).
All three of the conditions imply that the method works best with what might be called
“atomizable” domains, which can be divided into largely unrelated facts and propositions.
Knowledge that consists of learned perspectives or ways of approaching problems will not easily
be measured using consensus methodology. Nor will domains in which knowledge remains tacit
even in the face of ethnographic inquiry.
Despite these very real limitations, the consensus methodology offers promise for knowledge
management research in appropriate domains. While labor intensive, it appears considerably
more accurate than approaches based on subjective ratings (and with fewer validity problems),
and yet does not require an omniscient researcher.
As a final note, it is interesting that classical test theory, a formal model based on an objective
view of knowledge, should, after mathematical derivation, yield the consensus model, whose
conception of knowledge is not absolute but rather culturally relative. In this sense, it may be that
the consensus model provides a path of reconciliation between scientific and post-scientific
epistemologies.
On Measuring Individual Knowledge 23
References
Argyris, C. & Schon, D. (1978). Organizational Learning: Theory, Method and Practice.
Reading, MA: Addison-Wesley.
Batchelder, W. H., and A. K. Romney. (1988). Test theory without an answer key.
Psychometrika, 53, 71-92.
Borgatti, S.P. (1992). Anthropac. Columbia, SC: Analytic Technologies.
Burt, R. (1992). Structural Holes: The Social Structure of Competition. Cambridge, MA:
Harvard University Press.
Cohen, W. & Levinthal, D. (1990). Absorptive Capacity: A New Perspective on Learning and
Innovation. Administrative Science Quarterly, 35, 128-152.
Comrey, A.L. (1962). The minimum residual method of factor analysis. Psychological Reports,
11, 15-18.
Hambleton, R.K. and Zaal, J.N. (1991). Advances in Educational and Psychological Testing:
Theory and Applications. Boston: Kluwer.
On Measuring Individual Knowledge 24
Lave, J. and Wenger. E. (1991). Situated Learning - Legitimate Peripheral Participation.
Cambridge: Cambridge University Press.
Mardia, K.V. (1972). Statistics of Directional Data. London: Academic Press.
Moreland, R., Argote, L. & Krishnan, R. (1996). Socially Shared Cognition at Work:
Transactive Memory and Group Performance. In J. Nye & A. Brower (Eds) What's Social About
Social Cognition pp. 57-85. Thousand Oaks, CA: Sage.
Romney, A. K., Batchelder, W. H., and Weller, S. C. 1987. Recent applications of cultural
consensus theory. American Behavioral Science, 31, 163-177.
Romney, A.K., Weller, S.C. and Batchelder, W.H. (1986). Culture as Consensus: A Theory of
Culture and Informant Accuracy. American Anthropologist 88(2), 313-338.
Spearman, C. (1904). Correspondence between General Discrimination and General Intelligence.
American Journal of Psychology 15, 268-272.
Stewart, J. (1997). Intellectual Capital: The New Wealth of Organizations. New York: Currency
Doubleday.

On Measuring Individual Knowledge 25
Wegner, D. (1987). Transactive Memory: A Contemporary Analysis of Group Mind. In B.
Mullen & G. Goethals (Eds.) Theories of Group Behavior. Pp. 185-208. New York, NY:
Springer-Verlang.
On Measuring Individual Knowledge 26
Table 1. Eigenvalues of M* Matrix
Factor Eigen Percent Cum % Ratio
1 51.323 93.6 93.6 28.308
2 1.813 3.3 96.9 1.065
3 1.702 3.1 100
On Measuring Individual Knowledge 27
Table 2. Correlations among five estimates of knowledge.
1
CTT2a
Self2b
Others2c
Friends3
ConsensusCTT 1.000 0.479 0.334 0.398 0.947Self 0.479 1.000 0.564 0.556 0.471Others 0.334 0.564 1.000 0.891 0.342Friends 0.398 0.556 0.891 1.000 0.400Consensus 0.947 0.471 0.342 0.400 1.000
On Measuring Individual Knowledge 28
Figure 1. Basic response model from psychological testing theory.
Qk Know Answer?
Yes: write it down
No: guess
Right answer
Right answer
Wronganswer
di
1-di
1/L
1-1/L

On Measuring Individual Knowledge 29
Respondent k
1 2 3 4 … p
1 (1/L)(1/L) 1/L
2 (1/L)(1/L) 1/L
3 (1/L)(1/L) 1/L
4 (1/L)(1/L) 1/L
Resp i
… (1/L)(1/L) 1/L
p 1/L 1/L 1/L 1/L 1/L
Figure 2. Respondents i and k guess at random.
On Measuring Individual Knowledge 30
-0.55
0.56
-0.55 0.56
ETS
Self
AllFriends
Consensus
Figure 3. Metric multidimensional scaling of the correlation matrix in Table 2