on pre- and post-treatment mri nasopharyngeal carcinoma
TRANSCRIPT

Page 1/25
Deep Learning for Locally AdvancedNasopharyngeal Carcinoma Prognostication Basedon Pre- and Post-treatment MRISong Li
Renmin Hospital of Wuhan UniversityYu-Qin Deng
Renmin Hospital of Wuhan UniversityHong-Li Hua
Renmin Hospital of Wuhan UniversitySheng-Lan Li
Renmin Hospital of UniversityXi-Xiang Chen
Renmin Hospital of Wuhan UniversityBao-Jun Xie
Renmin Hospital of Wuhan UniversityZhiling Zhu
Huazhong University of Science and TechnologyRuoyun Liu
Wuhan Textile UniversityJin Huang
Wuhan Textile UniversityZe-Zhang Tao ( [email protected] )
Renmin Hospital of Wuhan University
Research
Keywords: Deep learning, Transfer learning, Nasopharyngeal carcinoma, Prognosis, Post-treatment MRI
Posted Date: November 12th, 2020
DOI: https://doi.org/10.21203/rs.3.rs-103654/v1
License: This work is licensed under a Creative Commons Attribution 4.0 International License. Read Full License

Page 2/25
AbstractBackground: Although it has been reported by several studies that using AI to predict the prognosis ofnasopharyngeal carcinoma (NPC) based on magnetic resonance (MR) image, the information around thetumor was not valued and the post-treatment MR images were ignored. Herein we aimed to predict theprognosis of advanced NPC (stage - a) using pre- and post-treatment MR images based on deeplearning (DL).
Methods: A total of 206 patients with primary NPC who were diagnosed and treated at the RenminHospital of Wuhan University between June 2012 and January 2018 were retrospectively selected. Arectangular region of interest (ROI), which included the tumor area, surrounding tissues and organs, wasdelineated on each pre- and post-treatment MR image. Two InceptionResnetV2-based transfer learningmodels, named pre-model and post-model, were trained with the Pre-dataset and the Post-dataset,respectively. In addition, an ensemble learning model based on the pre-model and post-models wastrained. The three established models were evaluated by receiver operating characteristic (ROC) analysis,confusion matrix, and Harrell’s concordance indices (C-index) after the model test. High-risk-related heatmaps were developed according to the DL models.
Results: The pre-model, post-model, and ensemble models displayed a C-index of 0.717 (95% CI: 0.639 to0.795), 0.811 (95% CI: 0.745–0.877), 0.830 (95% CI: 0.767–0.893), and AUC of 0.745 (95% CI: 0.592–0.897), 0.820 (95% CI: 0.687–0.953), and 0.841 (95% CI: 0.715–0.968) for the test cohort, respectively. Incomparison with the models, the post-model performance was better than the pre-model, which indicatedthe importance of post-treatment images for prognosis prediction. All three DL models performed betterthan the TNM staging system. The captured features presented on heat maps showed that the areasaround the tumor and lymph nodes were related to the prognosis of the tumor.
Conclusions: The three established DL models based on pre- and post-treatment MR images have a betterperformance than TNM staging. Post-treatment MR images are of great signi�cance for prognosisprediction and could contribute to clinical decision-making.
BackgroundNPC is a malignant tumor that originates from the epithelium of the nasopharynx and has the highestincidence reported in Southeast Asia (1). Radiotherapy for early NPC and concurrent chemoradiotherapyfor advanced NPC is recommended by the National Comprehensive Cancer Network (NCCN) (2). As abene�t from the improvements in radiotherapy technology and equipment, the overall 5-year survival ratehas improved signi�cantly (3, 4). The common TNM staging system, which combines evidence-based�ndings with empirical knowledge, is adopted for the prognosis assessment of most tumor types (5, 6).However, it is inevitable that accuracy is sacri�ced to make the criterion simple and intuitive.
Arti�cial intelligence (AI) has been rapidly applied to the �eld of medicine, especially to medical imageprocessing in recent years (7, 8). Many studies have introduced AI to predict the prognosis of patients

Page 3/25
with cancer and have achieved remarkable results (9–11). Based on past achievements in this �eld, moreAI-based studies on tumor prognosis using different methods have been reported. Several studies havefocused on evaluating the prognosis of NPC (12–16) and predicting the response of NPC to inductionchemotherapy (17–19) which is related to our topic. However, except for the study reported by MengyunQiang (16), the progression of these studies unanimously included a step of manual primary tumorsegmentation based on radiomics. This manual segmentation, which removes the "noise" from images,however, is complex and inconvenient for practical applications (16), and more importantly, it isquestionable that much valuable information could also be removed inadvertently. The standard of Tstaging in the TNM staging system of NPC only contains information on the relationship between thetumor and the surrounding tissues and organs, not including intertumoral information, and it performswell for prognosis prediction (12, 13, 16, 20). Therefore, the signals of organs and tissues borderingtumors that are lost by the manual segmentation approach are of great value in predicting tumorprognosis. Furthermore, it is not reliable to predict the prognosis of patients with cervical lymph nodemetastasis as the main manifestation based on primary tumor segmentation, while the primary tumor islimited or even not presented on MR images. Despite the great advantages of primary tumorsegmentation in noise reduction, the removal of valuable information makes it insu�cient. Due to thedisadvantage of relying on expert knowledge and a prede�ned algorithm, traditional radiomics that isbased on precise segmentation was considered to be gradually replaced by DL (6, 21). However, DLmodels for MRI classi�cation face a common problem: they are typically limited by low sample size (22).Transfer learning, which improves learning a new task through the transfer of knowledge from a relatedtask that has already been learned (23, 24), is an ideal solution for this problem and was applied to ourstudy.
The purpose of evaluating tumor prognosis is to guide oncologists to formulate a more reasonable andindividualized treatment plan. For advanced NPC or other malignant tumors that require multiple coursesof treatment, assessment of post-treatment tumor risk is crucial for the improvement of outcome. TheResponse Evaluation Criteria in Solid Tumors (RECIST) is the common method to evaluate the responseof NPC to treatment, which categorizes patients by assessing changes in tumor size over time and thepresence or absence of new tumors (25, 26). However, similar to the TNM system, this evaluation systemoverlooks other valuable information related to prognosis inside the images. Reported studies referring toAI for post-treatment risk assessment are scarce, while pre-treatment images are used as default inputdata for prediction. However, we believe that post-treatment images contain a massive amount ofinformation related to prognosis. It is valuable to incorporate post-treatment images for AI-assistedprediction to assist in optimizing the treatment plan.
For the reasons mentioned above, we carried out this study of NPC risk assessment based on DL thatincorporated pre- and post-treatment MR images, including tumor area, as well as tissues and organsaround the tumor. We tried to provide a different approach to the prognosis assessment of NPC.
Materials And Methods

Page 4/25
Patient screeningPatients with locally advanced NPC who were admitted to Renmin Hospital of Wuhan University fortreatment between June 2012 and January 2018 were retrospectively selected. Information was collectedfor sex, age, clinical TNM stage (according to the 7th American Joint Committee on Cancer (AJCC)), TNMstaging manual)(27), treatment method adopted in the �rst course of treatment, pathological outcome,MR images before treatment and after one course of treatment, recurrence time (including local progressand distant metastasis), and death events caused by any reason during follow-up. The endpoint wasNovember 20, 2019, to January 5, 2020 (information on more than 1000 patients was collected in thesetwo months). MR images of each listed patient were retrieved and transferred from the picture archivingand communication system (PACS). Patients were screened depending on the following inclusion andexclusion criteria. The inclusion criteria were as follows: 1. Primary NPC diagnosed by pathology andtreated in our hospital; 2. No distant metastasis occurred before diagnosis; 3. MRI before treatment andafter the �rst course of treatment could be obtained; 4. A regular review was performed; 5. Patients wereclassi�ed into stages III and IV by the TNM staging system. The exclusion criteria were as follows: 1.Recurrent NPC after treatment; 2. Distant metastasis was observed at the time of diagnosis; 3. No regularreview was performed; 4. Surgery was included in the treatment procedure; 5. The required demographicinformation and imaging data were not available. The �owchart of patient screening is shown in Fig. 1.
Figure 1: Flowchart of the patient selection procedure
Concept De�nitionDe�nition of the course of treatment for NPC: The formulated treatment plan was completed once. Thestandard for regular review was at least every 3 months within 2 years after treatment, at least once everysix months after treatment for 2–5 years, and annually 5 years after treatment. The requisite items for thereview were nasopharyngeal MRI and lung CT, CT/MRI of the head and abdomen, or contingent PET/CT.Telephone follow-up was performed on all patients who stopped review after at least 2 years of regularreview to obtain information on whether the patient was still alive. If the patient survived but stoppedreview or performed a local review, the data were distributed to censored data. Recurrence wasascertained based on nasopharyngeal MRI or pathology obtained endoscopically. The criteria for the MRIto determine recurrence were progressive local bone erosion, abnormal soft tissue areas larger than theprevious review, and the newly found intensive shadows in the previous neck review increasedprogressively during this review. Distant metastasis was determined by the results of lung CT, head andabdomen CT/MRI, or PET/CT. Data on fatalities were obtained by telephone follow-up. To reduce theproportion of censored data due to the small proportion of fatalities at the endpoint, we set progression-free survival (PFS) as the observation endpoint. The PFS period was de�ned as the time from treatmentto disease progression (recurrence or distant metastasis) or the occurrence of death caused by anyreason or the last review.
Datasets

Page 5/25
The nasopharyngeal and neck MR images were obtained using a 1.5-T MR scanner and were saved in theDICOM format with a size of 512 × 512. Axial images of WATER T2 and enhanced WATER T1 beforetreatment and after the �rst treatment course were included for imaging processing. Rectangular ROIswith an approximate size of 400 × 200, including all tumor areas, metastatic cervical lymph nodes, andtissues and organs surrounding the tumor were delineated on each primary image (the size of therectangular ROIs were allowed to be different for the different sizes of tumors, and the convolution neuralnetwork in the established model was set to transform all pictures into the size of 512 × 512 by the"padding" operation which �lling "0" pixels around the images). Patients were divided into the high-riskand low-risk groups according to the median progression-free survival, and patients on the point ofmedian PFS were classi�ed into the high-risk group. Each MR image was labeled according to thepatient’s outcome. The prediction was made depending on the weighted average of all imageclassi�cation probabilities of a patient.
Finally, 206 NPC patients were included (male: 147, average age: 50.0 years, range: 16–74 years; female:59, average age: 50.5 years, range: 18–75 years) and randomly divided into a training cohort and arandom cohort (by random number table) according to a ratio of 4:1.
Network Architecture and Model TrainingOur DL models were compiled and trained by Professor Huang, who majored in AI for medical imagingfor more than 10 years. Keras 2.2.0, with TensorFlow 2.0, in Python version 3.6, was used as thecompiling platform. InceptionResnetV2 was introduced as the basis of our transfer learning model tooptimize the initial parameters and reduce the training cycle. The top layer of InceptionResnetV2 wasremoved, and a full connection layer with two neurons was added at the tail end to achieve theclassi�cation function. An ensemble learning model based on a soft voting classi�er was established byadding a decision layer to the output layer of the pre-model and post-model to integrate the results of thetwo models.
The training cohort contained approximately 80% of the datasets (163/206). Pre- and post-treatmentimages were used as input data to train the modi�ed InceptionResnetV2 model, named Pre-model andPost-model, respectively. The Adam Optimizer was used to train the network with a batch size of 32. Theinitial learning rate was set to 0.0001, and the training procedure was terminated when the accuracy didnot improve further for 10 continuous epochs. The dropout in the fully connected layers was set with aprobability of 0.5, and the L2 regularization strategy was used to prevent over�tting. The networkarchitecture of our model and the conventional method based on primary tumor segmentation are shownin Fig. 2.
Figure 2: Models for tumor prognosis prediction
Model Testing and Statistical AnalysisApproximately 20% of patients’ datasets were used as the test cohort (43/206) and were imported intothe trained Pre-model and Post-model. The probability of patients with low risk and high risk was given

Page 6/25
according to the patient’s MR image dataset, and the category with high probability was selected as theprediction result. In the ensembling model, a new prediction result was obtained by integrating the outputof the pre - and post-models based on the soft voting algorithm.
ROC curves were constructed, and the area under the curves (AUC) was calculated to compare theperformances of the pre-model, post-model, ensembling model, and TNM staging system. The C-indexwith 95% con�dence interval (CI) was reported for the three established models and the TNM stagingsystem. The number of true-positives, false-positives, true-negatives, and false-negatives of theestablished models were listed in a 2 × 2 table to calculate the confusion matrix. Differences wereconsidered statistically signi�cant at P < 0.05. Statistical analyses were performed using SPSS 24.0 andPython, version 3.6. For a better interpretation of the DL models’ prediction process, heat maps forvisualizing the areas of the image most indicative of high risk were produced by extracting feature mapsfrom the �nal convolutional layers. The Matplotlib package in Python was used to produce heat maps.
Results
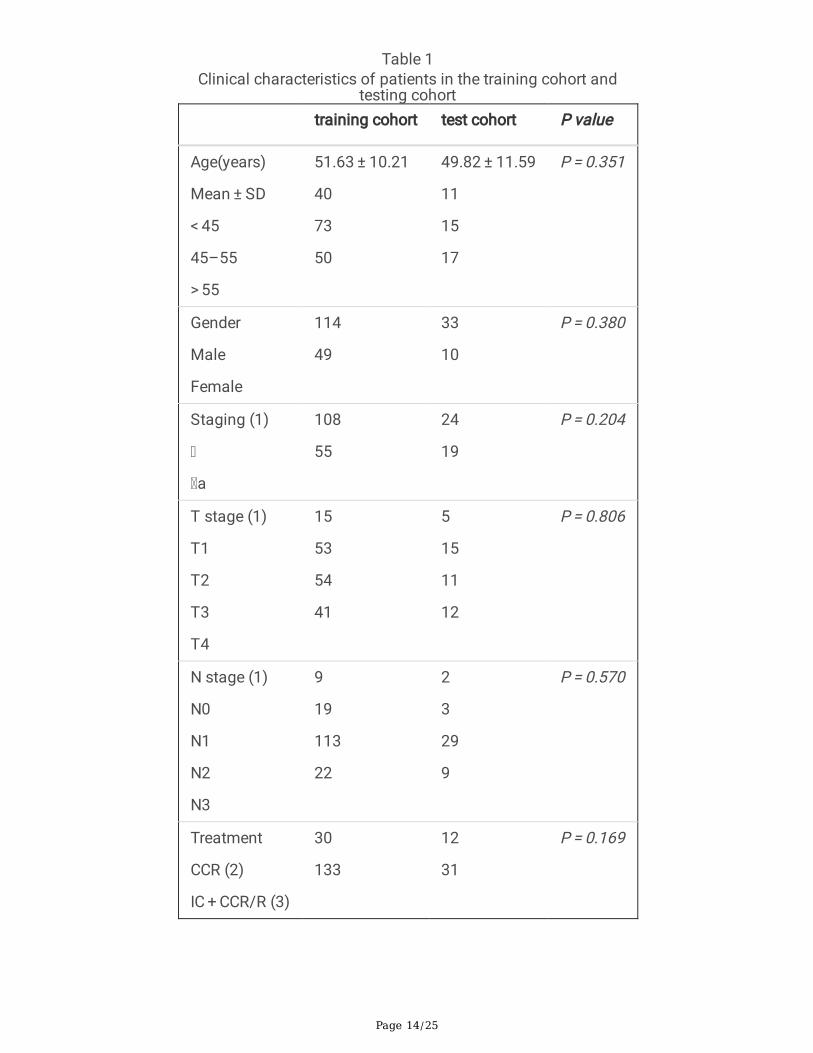
Clinical Characteristics of PatientsA total of 206 patients with locally advanced NPC, including 132 patients with stage III and 74 patientswith stage a, were included in our study. The median time and interquartile time of follow-up were 36.00months, 26.25 months, and 48.75 months, respectively. Patients were randomly divided into a trainingcohort (163 cases) and a test cohort (43 cases). The clinical characteristics of the patients are shown inTable 1. There was no signi�cant difference in age, sex, TNM staging, T staging, N staging, and treatmentbetween the two cohorts
.
Table 1: Clinical characteristics of patients in the training cohort and testing cohort
SD: standard deviation; (1): based on the 7th edition of the American Joint Committee on Cancer(AJCC)/International Union Against Cancer staging systems; (2): concurrent chemoradiation; (3):Including induction chemotherapy + radiotherapy, induction chemotherapy + concurrent chemoradiation.
Performance of DL ModelsThe three DL models (pre-model, post-model, and ensembling model) achieved better performance inpredicting the prognosis of NPC, with AUCs of 0.745 (95% CI: 0.592, 0.897), 0.820 (95% CI: 0.687, 0.953),and 0.841 (95% CI: 0.715, 0.968), respectively, when compared to TNM staging (AUC = 0.723, 95% CI:0.567, 0.879) in the test cohort. The ROC curve based on the outcomes of individual patients obtainedfrom the DL models and TNM staging is shown in Fig. 3.
Figure 3: Receiver operating characteristic curves of DL Models and TNM staging

Page 7/25
A confusion matrix that reports the number of true-positives, false-positives, true-negatives, and false-negatives was arranged as shown in Table 2. The positive and negative predictive values were 73.9%(17/23) and 75.0% (15/20) for the pre-model, 73.9% (17/23) and 90.0% (2/20) for the Post-model, 78.2%(18/23) and 90.0% (2/20) for the ensembling model, 69.6% (16/23), and 75.0% (15/20) for TNM staging,respectively. The accuracies of the pre-model, post-model, ensembling model and TNM staging were74.4% (32 /43), 81.4% (35/43), 83.7% (36/43), and 72.1% (31/43), respectively. The C-index wascalculated based on the category probability obtained from DL models. As reported in Table 2, the pre-model, post-model, and ensembling model and TNM staging obtained C-indexes of 0.717 (95% CI: 0.639–0.795), 0.811 (95% CI: 0.762–0.861), 0.830 (95% CI: 0.784–0.877), and 0.709 (95% CI: 0.620–0.788),respectively. The performance of the post-model based on post-treatment images was better than that ofthe pre-model, which was based on pre-treatment images whenever evaluated with AUC, accuracy or C-index, and all the three DL models were better than TNM staging, while the ensembling model, whichintegrated the results of the two DL models, performed best.
Table 2: Confusion matrices for DL Models and TNM staging
Heat maps, which are produced using the class activation mapping method, are composed of four colors,namely, red, yellow, green, and blue, which represent areas that have different predictive signi�cance. Thered area represents the greatest correlation with the classi�cation, followed by the yellow region. Thegreen and blue areas indicate a weaker predictive signi�cance (Figs. 4–7). For patients classi�ed as highrisk, the red and yellow areas represent features related to poor prognosis. The presentation of heat mapscan help in better understanding of how DL networks capture image features for prediction, and to dispelour doubts about the black box of the convolution neural network (CNN). We observed that our DLmodels suggested that the areas around the tumor and some cervical lymph nodes were strongly relatedto the prognosis of the tumor (marked in red). In many cases, the relationship between the signal of thetumor area and the prognosis was not as strong as expected (Fig. 4–7).
Figure 4: Original images of A, B and C show that the tumor invade brain. The areas of tumor andsurrounding tissues were considered to be related to high risk prognosis In the corresponding heat maps.
Figure 5: D, E and F images show metastatic lymph nodes in the neck, and DL models suggests thatthese lymph node regions contain features associated with high risk prognosis
Figure 6: G, H, I, J, K and L images present the NPCs that mainly invade lateral and posterior structures.The red areas represent the image features that associated with high risk prognosis
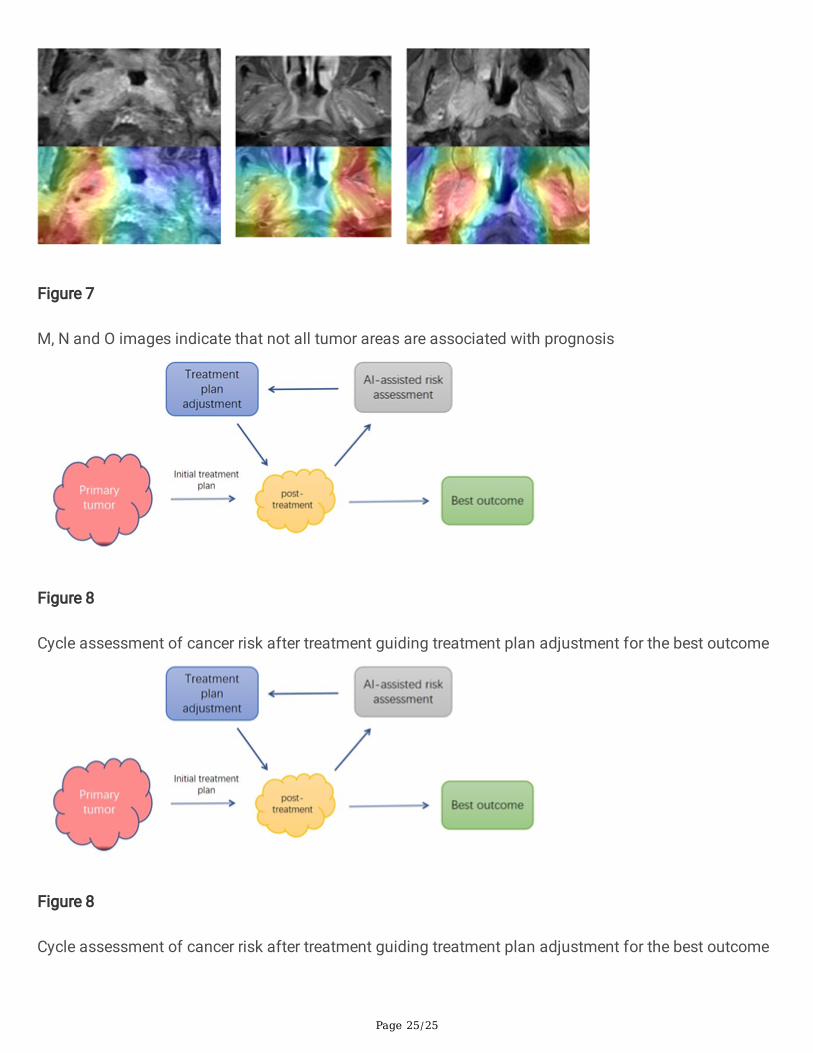
Figure 7: M, N and O images indicate that not all tumor areas are associated with prognosis
Discussion

Page 8/25
With the increasing subspecialization of medical �elds, the demand for more accurate and informativeimage reports is booming, challenging radiologists, and medical imaging specialists to know everythingabout all exams and regions (28). The purpose of image examination today is not only qualitativediagnosis but also obtaining rich quantitative information such as the severity of the disease, prognosis,therapeutic effect of drugs, etc. (29, 30), in which arti�cial intelligence will make an important difference.The pathological processes of tumor occurrence, growth, and invasion are affected by gene regulationand tumor microenvironment and will show corresponding manifestations in medical images (30). The"common" manifestations of some tumors can be identi�ed by the naked eye and empiricallysummarized as the image characteristics of speci�c tumors. However, more "hidden" information thatcontains personal data, such as the individual prognosis and response to speci�c drug treatment, cannotbe recognized. With the development of algorithms, the e�cacy and e�ciency of information extractionfrom images have signi�cantly improved, thus enabling researchers to make more accurate predictionsof prognosis, and greatly bene�t the clinical management of cancer (31). It has been reported that DLmatches and even surpasses human performance in task-speci�c applications (32, 33).
Most of the previous studies on tumor prognosis prediction were developed based on the approach ofradiomics, and the classic steps generally include image acquisition, manual tumor segmentation,feature extraction, feature �ltering, and classi�cation (34). Although there are several tumor segmentationmethods, segmenting images along the edge of the primary tumor were preferred. However, all the criteriafor T staging of NPC which combining evidence-based �ndings with empirical knowledge were composedof the relationship between tumor and surrounding tissues and organs (35), and were abandoned by theapproach of primary tumor segmentation. The characteristics of these relationships undoubtedly containmuch valuable information related to tumor prognosis as the C-index of T staging can reachapproximately 60%-70% (20, 36). However, an analysis based on the whole MR image is an indispensablestep to realize the clinical practical value of these predictive models. Based on this ideal, we established amodel based on the whole MR image for prediction in the pre-experiment stage of our study. Although weobtained an accuracy of nearly 70%, the heatmaps based on the model indicated unreasonable extractionof features, such as cerebrospinal �uid, cerebellum, orbital, and parotid gland, that were considered to berelated to prognosis in most cases, even if the tumor was far away from these structures. Excessiveimage noise and small sample size were considered to be the main reasons; therefore, analysis based onthe whole MR image was abandoned. Based on this reason, a rectangular ROI composed of the tumorand the surrounding tissues and organs was included in our study. The heat maps generated by our DLmodels indicated that tumor peripheral signals contained very important prognostic information.
The purpose of tumor risk assessment is to guide the development of an appropriate treatment plan. Weexpect tumors to respond after receiving the treatment, however, it is not uncommon for the “besttreatment plan” to yield poor results. Radiotherapy resistance, recurrence, distant metastasis, andcomplications caused by radiotherapy are analyzed and considered in many studies as the main causesof treatment failure and patient death (37–40). Oncologists could adjust the predetermined treatmentplan according to the obtained evidence to match the estimated tumor risk. As the common RECISTmethod only evaluates the changes of tumor scope, AI-based analysis is valuable. In the “eye” of AI,

Page 9/25
medical images are not only pictures, many more prognostic features that are not limited to the tumorscope can be extracted. In our study, we included MR images of NPC before and after a course oftreatment for prognosis prediction, and the AUCs of the pre-model, post-model, and ensembling modelswere 0.745, 0.820, and 0.841, respectively. The post-model shows a better prediction than the pre-model,while MR images of post-treatment were rarely used for AI-based prognosis prediction. For advanced NPCor other advanced malignant tumors that require multiple courses of treatment, it is worth recommendingincluding post-treatment medical images when performing AI-assisted prognosis assessment. In fact,depending on a more mature condition, the best imaginable scenario to assess the images after eachtreatment course based on AI is to evaluate the real-time risk to guide the optimization of the treatmentplan (Fig. 8).
Figure 8: Cycle assessment of cancer risk after treatment guiding treatment plan adjustment for the bestoutcome
Regarding the topic of predicting the prognosis of NPC based on imaging data, we listed C-indexes andAUCs of several reports which are commonly used as evaluation indicators in Table 3 for comparison.Because it is impossible to analyze all the variables that affect survival, the accuracy given by predictionmodels inevitably has an upper limit, irrespective if they are based on medical imaging data, clinical data,or both. The C-indexes or AUCs of the prediction models established in the previous studies were between0.694 and 0.863, which exceeded the predictive ability of TNM staging.
Table 3: Studies predicting the prognosis of nasopharyngeal carcinoma based on medical imaging
There are several shortcomings in our study. First, the number of cases in our study was limited. The sizeof the dataset has a complex impact on the performance of DL models that are based on a convolutionalneural network. Although transfer learning provides a good solution for small datasets, large samples areexpected, especially when confronted with MRI-related tasks. However, to ensure the quality of thedataset, only 206 patients remained in our study after �ltering the 1034 patients in the initial list. Second,there are no external datasets for validation in our study. The variety of hospitals has an impact on theoutcome of tumors, which cannot be re�ected in a single-center dataset. Testing based on multicenterdata can provide a better understanding of the generalization ability of the established DL models.
ConclusionsThe three established DL models based on pre- and post-treatment MR images have a good performanceand can accurately capture the image features related to prognosis. Furthermore, post-treatment MRimages are of great signi�cance for prognosis prediction, which could assist clinicians in treatmentdecision optimization.
Abbreviations

Page 10/25
NPC: nasopharyngeal carcinoma; MR: magnetic resonance; DL: deep learning; ROI: region of interest;ROC: receiver operating characteristic; C-index Harrell’s concordance indices; NCCN the NationalComprehensive Cancer Network; AI: Arti�cial intelligence; RECIST: The Response Evaluation Criteria inSolid Tumors; AJCC: American Joint Committee on Cancer; PACS: picture archiving and communicationsystem; CT: Computed tomography; PET: positron emission tomography; PFS: progression-free survival;AUC: area under the curves; CI: con�dence interval; CNN: convolution neural network.
DeclarationsAcknowledgements
The authors would like to thank all subjects, and their caregivers, for their participation in the study.
Authors’ contributions
ZZT and JH conceived and designed the study, JH established computer models; SL collected data,created image datasets and drafted the manuscript; YQD guided the construction of datasets, conducteddata analysis and helped to modify the manuscript; HLH, SLL, XXC and BJX collected data; ZLZ and RYLcontributed to discussion and conducted data analysis. All author(s) read and approved the �nalmanuscript.
Funding
This work was funded by the National Natural Science Foundation of China (Reference Numbers81670910 and 81970860).
Availability of data and materials
The datasets used during this study are available from the corresponding author on reasonable request.
Ethics approval and consent to participate
Our study was approved by the Ethics Committee of the Renmin Hospital of Wuhan University, and theinformed consent from patients was exempted.
Consent for publication
All authors have approved the manuscript and consent publication.
Competing interests
All authors declared that there were no competing interests.
References

Page 11/25
1. Carioli G, Negri E, Kawakita D, et al. Global trends in nasopharyngeal cancer mortality since 1970 andpredictions for 2020: Focus on low-risk areas. Int J Cancer. 2017;140(10):2256–64.
2. National Comprehensive Cancer Network guidelines. About NCCN. Available athttps://www.nccn.org/. Accessed 15 Feb 2018.
3. Lee AW, Ng WT, Chan LL, et al. Evolution of treatment for nasopharyngeal cancer–success andsetback in the intensity-modulated radiotherapy era. Radiother Oncol. 2014;110(3):377–84.
4. Chua MLK, Wee JTS, Hui EP, et al. Nasopharyngeal carcinoma. The Lancet. 2016;387(10022):1012–24.
5. Gospodarowicz MK, Miller D, Groome PA, et al. The process for continuous improvement of the TNMclassi�cation. Cancer. 2004 Jan;100(1)(1):1–5.
�. Hosny A, Parmar C, Coroller TP, et al. DL for lung cancer prognostication: A retrospective multi-cohortradiomics study. PLoS Med. 2018;15(11):e1002711.
7. Hosny A, Parmar C, Quackenbush J, et al. Arti�cial intelligence in radiology. Nat Rev Cancer. 2018Aug;18(8):500–10.
�. Niazi MKK, Parwani AV, Gurcan MN. Digital pathology and arti�cial intelligence. Lancet Oncol. 2019May;20(5):e253–61.
9. Skrede O-J, De Raedt S, Kleppe A, et al. DL for prediction of colorectal cancer outcome: a discoveryand validation study. The Lancet. 2020;395(10221):350–60.
10. Kather JN, Krisam J, Charoentong P, et al. Predicting survival from colorectal cancer histology slidesusing DL: A retrospective multicenter study. PLoS Med. 2019;16(1):e1002730.
11. Courtiol P, Maussion C, Moarii M, et al. DL-based classi�cation of mesothelioma improves predictionof patient outcome. Nat Med. 2019;25(10):1519–25.
12. Zhang B, Tian J, Dong D, et al. Radiomics Features of Multiparametric MRI as Novel PrognosticFactors in Advanced Nasopharyngeal Carcinoma. Clin Cancer Res. 2017;23(15):4259–69.
13. Zhuo EH, Zhang WJ, Li HJ, et al. Radiomics on multi-modalities MR sequences can subtype patientswith non-metastatic nasopharyngeal carcinoma (NPC) into distinct survival subgroups. Eur Radiol.2019;29(10):5590–9.
14. Zhang L, Wu X, Liu J, et al. MRI-Based Deep-Learning Model for Distant Metastasis-Free Survival inLocoregionally Advanced Nasopharyngeal Carcinoma. J Magn Reson Imaging. 2020 Aug 9.
15. Zhong LZ, Fang XL, Dong D, et al. A deep learning MR-based radiomic nomogram may predictsurvival for nasopharyngeal carcinoma patients with stage T3N1M0. Radiother Oncol. 2020Jul;4:151:1–9.
1�. Qiang M, Li C, Sun Y, et al. A Prognostic Predictive System Based on Deep Learning forLocoregionally Advanced Nasopharyngeal Carcinoma. J Natl Cancer Inst. 2020 Sep;24:djaa149.
17. Peng H, Dong D, Fang MJ, et al. Prognostic Value of Deep Learning PET/CT-Based Radiomics:Potential Role for Future Individual Induction Chemotherapy in Advanced NasopharyngealCarcinoma. Clin Cancer Res. 2019 Jul 15;25(14):4271–4279.

Page 12/25
1�. Dong D, Zhang F, Zhong LZ, et al. Development and validation of a novel MR imaging predictor ofresponse to induction chemotherapy in locoregionally advanced nasopharyngeal cancer: arandomized controlled trial substudy (NCT01245959). BMC Med. 2019;17(1):190.
19. Zhao L, Gong J, Xi Y, et al. MRI-based radiomics nomogram may predict the response to inductionchemotherapy and survival in locally advanced nasopharyngeal carcinoma. Eur Radiol.2020;30(1):537–46.
20. OuYang P, Su Z, Ma X, et al. Comparison of TNM staging systems for nasopharyngeal carcinoma,and proposal of a new staging system. Br J Cancer. 2013;109(12):2987–97.
21. Hosny A, Parmar C, Quackenbush J, et al. Arti�cial intelligence in radiology. Nat Rev Cancer.2018;18(8):500–10.
22. Leming M, Górriz JM, Suckling J. Ensemble Deep Learning on Large, Mixed-Site fMRI Datasets inAutism and Other Tasks. Int J Neural Syst. 2020 Jul;30(7):2050012.
23. Shao L, Zhu F, Li XJItonn, systems l. Transfer learning for visual categorization: a survey. IEEE TransNeural Netw Learn Syst. 2015;26(5):1019-34.
24. Tan CQ, Sun FC, Kong T, Zhang WC, Yang C, Liu CF. A Survey on Deep Transfer Learning. In: KurkovaV, Manolopoulos Y, Hammer B, Iliadis L, Maglogiannis I, editors. Arti�cial Neural Networks andMachine Learning - Icann 2018, Pt Iii. Lecture Notes in Computer Science. 11141. Cham: SpringerInternational Publishing Ag; 2018. pp. 270–9.
25. SG PT, EA A. E, et al. New guidelines to evaluate the response to treatment in solid tumors. EuropeanOrganization for Research and Treatment of Cancer, National Cancer Institute of the United States.National Cancer Institute of Canada. 2000;92(3):205–16.
2�. Eisenhauer EA, Therasse P, Bogaerts J, et al. New response evaluation criteria in solid tumours:revised RECIST guideline (version 1.1). Eur J Cancer. 2009 Jan;45(2):228–47.
27. Edge SB, Compton CC. The American Joint Committee on Cancer: the 7th edition of the AJCC cancerstaging manual and the future of TNM. Ann Surg Oncol. 2010 Jun;17(6):1471–4.
2�. Santos MK, Ferreira Junior JR, Wada DT, et al. Arti�cial intelligence, machine learning, computer-aided diagnosis, and radiomics: advances in imaging towards to precision medicine. Radiol Bras.2019;52(6):387–96.
29. Huang S, Yang J, Fong S, et al. Arti�cial intelligence in cancer diagnosis and prognosis: Opportunitiesand challenges. Cancer Lett. 2020;471:61–71.
30. Bi WL, Hosny A, Schabath MB, et al. Arti�cial intelligence in cancer imaging: Clinical challenges andapplications. CA Cancer J Clin. 2019;69(2):127–57.
31. Zhu W, Xie L, Han J, et al. The Application of DL in Cancer Prognosis Prediction. Cancers (Basel).2020;12(3).
32. Ehteshami Bejnordi B, Veta M, Johannes van Diest P, et al. Diagnostic Assessment of Deep LearningAlgorithms for Detection of Lymph Node Metastases in Women With Breast Cancer. JAMA. 2017Dec;12(22):2199–210. 318(.

Page 13/25
33. Esteva A, Kuprel B, Novoa RA, et al. Dermatologist-level classi�cation of skin cancer with deep neuralnetworks. Nature. 2017 Feb 2;542(7639):115–118.
34. Limkin E, Sun R, Dercle L, et al. Promises and challenges for the implementation of computationalmedical imaging (radiomics) in oncology. Ann Oncol. 2017;28(6):1191–206.
35. Amin M, Greene F, Edge S, et al. The Eighth Edition AJCC Cancer Staging Manual: Continuing to builda bridge from a population-based to a more "personalized" approach to cancer staging. CA Cancer JClin. 2017;67(2):93–9.
3�. Pan JJ, Ng WT, Zong JF, et al. Proposal for the 8th edition of the AJCC/UICC staging system fornasopharyngeal cancer in the era of intensity-modulated radiotherapy. Cancer. 2016 Feb15;122(4):546–58.
37. Tang LL, Chen WQ, Xue WQ, et al. Global trends in incidence and mortality of nasopharyngealcarcinoma. Cancer Lett. 2016 Apr 28;374(1):22–30.
3�. Karam I, Huang SH, McNiven A, et al. Outcomes after reirradiation for recurrent nasopharyngealcarcinoma: North American experience. Head Neck. 2016;38(Suppl 1):E1102-9.
39. Yao JJ, Qi ZY, Liu ZG, et al. Clinical features and survival outcomes between ascending anddescending types of nasopharyngeal carcinoma in the intensity-modulated radiotherapy era: A big-data intelligence platform-based analysis. Radiother Oncol. 2019 Aug;137:137–44.
40. Peng H, Chen L, Zhang Y, et al. The Tumour Response to Induction Chemotherapy has PrognosticValue for Long-Term Survival Outcomes after Intensity-Modulated Radiation Therapy inNasopharyngeal Carcinoma. Sci Rep. 2016 Apr;21:6:24835.
Tables
Page 14/25
Table 1Clinical characteristics of patients in the training cohort and
testing cohort
training cohort test cohort P value
Age(years)
Mean ± SD
< 45
45–55
> 55
51.63 ± 10.21
40
73
50
49.82 ± 11.59
11
15
17
P = 0.351
Gender
Male
Female
114
49
33
10
P = 0.380
Staging (1)
a
108
55
24
19
P = 0.204
T stage (1)
T1
T2
T3
T4
15
53
54
41
5
15
11
12
P = 0.806
N stage (1)
N0
N1
N2
N3
9
19
113
22
2
3
29
9
P = 0.570
Treatment
CCR (2)
IC + CCR/R (3)
30
133
12
31
P = 0.169

Page 15/25
Table 2Confusion matrices for DL Models and TNM staging
Ensembling model
(prediction)
High risk Low risk
Pre-model
(prediction)
High risk Low risk
Post-model
(prediction)
High risk Low risk
TNM staging
(prediction)
High risk Low risk
High risk(true) 18 5 17 6 17 6 16 7
Low risk(true) 2 18 5 15 2 18 5 15
C-index 0.830 0.717 0.811 0.709

Page 16/25
Table 3Studies predicting the prognosis of nasopharyngeal carcinoma based on medical imaging
Studies Number of patients Main evaluation indicators Outcome of test
Zhang B, 2017.3(1) 118 C-index
prediction model
TNM
0.737
0.634
En-Hong Zhuo, 2019.2(2) 658 C-index
prediction model
TNM
0.814
0.765
Lina Zhao, 2019.4(3) 123 C-index
prediction model
Accuracy
prediction model
AUC
prediction model
0.863
0.826
0.863
Hao Peng, 2019.4(4) 707 C-index
prediction model
EB-DNA-model
0.722
0.671
Lian-Zhen Zhong, 2020.6(5) 638 C-index
prediction model
clinical-model
0.788
0.625
Lu Zhang, 2020.7(6) 233 AUC
prediction model
clinical-model
0.765
0.649
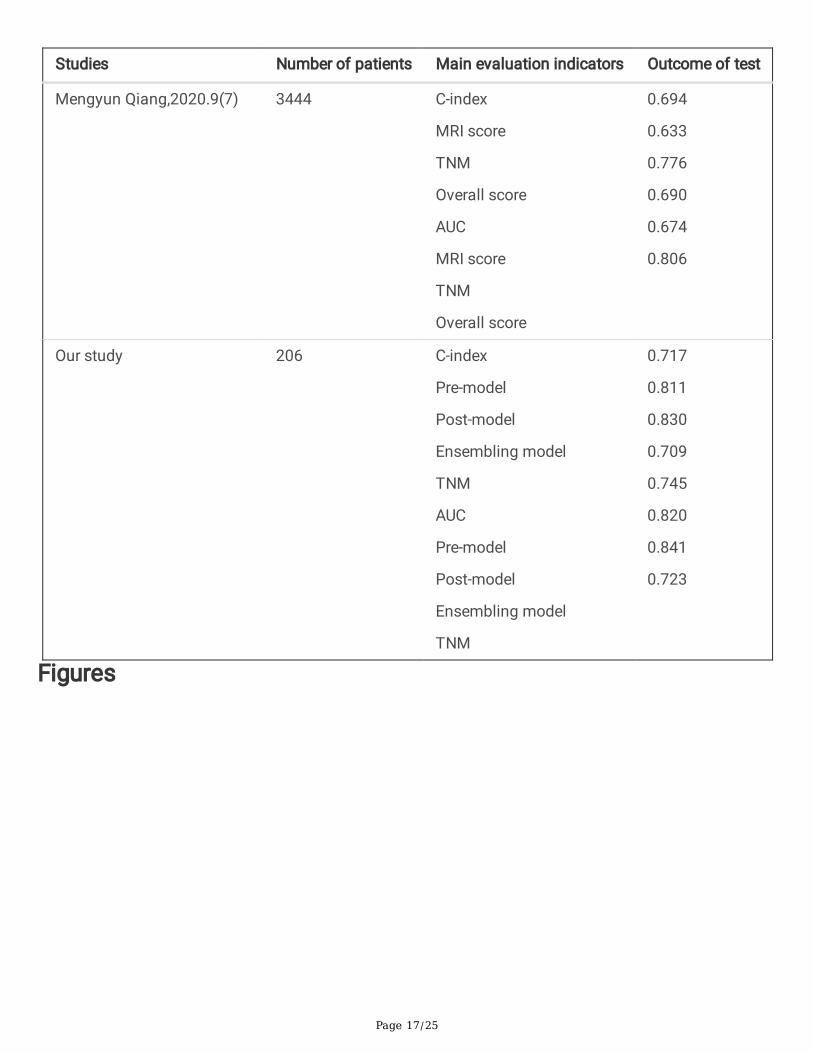
Page 17/25
Studies Number of patients Main evaluation indicators Outcome of test
Mengyun Qiang,2020.9(7) 3444 C-index
MRI score
TNM
Overall score
AUC
MRI score
TNM
Overall score
0.694
0.633
0.776
0.690
0.674
0.806
Our study 206 C-index
Pre-model
Post-model
Ensembling model
TNM
AUC
Pre-model
Post-model
Ensembling model
TNM
0.717
0.811
0.830
0.709
0.745
0.820
0.841
0.723
Figures

Page 18/25
Figure 1
Flowchart of the patient selection procedure

Page 19/25
Figure 1
Flowchart of the patient selection procedure
Figure 2

Page 20/25
Models for tumor prognosis prediction
Figure 2
Models for tumor prognosis prediction
Figure 3
Receiver operating characteristic curves of DL Models and TNM staging

Page 21/25
Figure 3
Receiver operating characteristic curves of DL Models and TNM staging
Figure 4
Original images of A, B and C show that the tumor invade brain. The areas of tumor and surroundingtissues were considered to be related to high risk prognosis In the corresponding heat maps.

Page 22/25
Figure 4
Original images of A, B and C show that the tumor invade brain. The areas of tumor and surroundingtissues were considered to be related to high risk prognosis In the corresponding heat maps.
Figure 5
D, E and F images show metastatic lymph nodes in the neck, and DL models suggests that these lymphnode regions contain features associated with high risk prognosis

Page 23/25
Figure 5
D, E and F images show metastatic lymph nodes in the neck, and DL models suggests that these lymphnode regions contain features associated with high risk prognosis
Figure 6
G, H, I, J, K and L images present the NPCs that mainly invade lateral and posterior structures. The redareas represent the image features that associated with high risk prognosis

Page 24/25
Figure 6
G, H, I, J, K and L images present the NPCs that mainly invade lateral and posterior structures. The redareas represent the image features that associated with high risk prognosis
Figure 7
M, N and O images indicate that not all tumor areas are associated with prognosis
Page 25/25
Figure 7
M, N and O images indicate that not all tumor areas are associated with prognosis
Figure 8
Cycle assessment of cancer risk after treatment guiding treatment plan adjustment for the best outcome
Figure 8
Cycle assessment of cancer risk after treatment guiding treatment plan adjustment for the best outcome