on some implications of non-crystallographic symmetry · on some implications of...
TRANSCRIPT
On some implications of non-crystallographic
symmetry
Andrey Alekseyevich Lebedev
A Thesis submitted for the degree of Doctor of Philosophy
The University of York
Department of Chemistry
April 2009
Abstract
The standard molecular replacement (MR) protocol involvesone-by-one search for molecules
composing the asymmetric unit, therefore the non-crystallographic symmetry (NCS) compli-
cates the structure determination. However, the conservation of the oligomeric state in a series
of homologues and the use of information about the NCS in the target crystal may help to
solve difficult MR problems. A number of the NCS cases which have required tailor-made MR
protocols for successful structure solution are presentedin this thesis. The ultimate goal is to
rationalise these approaches and implement them as supplementary pathways for MR pipelines.
Intermolecular contacts in a macromolecular crystal can have substantially different strengths
as, for example, in crystals composed of natural oligomers,or in order-disorder (OD) structures
with stronger interactions within diperiodic OD-layers and weaker interactions between the lay-
ers. Symmetry of the tightly bound assemblies is often non-crystallographic, whereas weaker in-
teractions are adjusted to enable three-dimensional translational symmetry in the crystal. Weaker
interactions can vary between different crystal forms (polymorphs) or even within one crystal
to give rise to NCS by translation, twinning or crystal disorder. Several twins, structures with
translational NCS and OD-structures are presented in this thesis.
In some cases, the relation between NCS and twinning gives aninsight into the twin mor-
phology. Two examples of macromolecular twins are discussed in which the NCS analysis
explained the accidental lattice symmetry. In another case, the NCS defined the geometry of
twinning by reticular merohedry, so an accurate detwinningwas possible without precise mea-
surements of relative orientation of the alternative lattices.
The twin axis can be aligned with an NCS axis. High relative frequency of such twinning
cases in the Protein Data Bank is demonstrated and the effectof such interference between
twinning and NCS on the intensity statistics is analysed to provide guidelines for interpretation
of the standard twinning tests. The alignment of NCS and twinaxes is typical for OD-twins by
metric merohedry and one of these twins is analysed in detail.
Standard MR is easily adaptable to the case of the translational NCS without significant
changes in the algorithm or protocol. However, translational NCS imposes a problem of false-
origin MR solution, as is demonstrated in this work. Three cases are described, in which such
problem had occurred and was resolved, and which prompted todesign the programZanuda
that automatically handles false-origin MR solutions and also enables validation and correction
of the space group assignment in pseudosymmetric twins.
Thus, the two distinct topics of this thesis are the NCS guided MR, and diagnostics of twin-
ning and incorrect symmetry assignment. Both lines of research have a common goal, to extend
the boundaries of existing methods of macromolecular structure solution.
2
Contents
Abstract . . . . . . . . . . . . . . . . . . . . . . . . . . . . . . . . . . . . . . . . . 2
Contents. . . . . . . . . . . . . . . . . . . . . . . . . . . . . . . . . . . . . . . . . 3
List of Figures. . . . . . . . . . . . . . . . . . . . . . . . . . . . . . . . . . . . . . 8
List of Tables . . . . . . . . . . . . . . . . . . . . . . . . . . . . . . . . . . . . . . 10
Declaration . . . . . . . . . . . . . . . . . . . . . . . . . . . . . . . . . . . . . . . 11
Abbreviations . . . . . . . . . . . . . . . . . . . . . . . . . . . . . . . . . . . . . . 12
Table of examples. . . . . . . . . . . . . . . . . . . . . . . . . . . . . . . . . . . . 14
1 Introduction . . . . . . . . . . . . . . . . . . . . . . . . . . . . . . . . . . . . . . . 16
1.1 Molecular replacement. . . . . . . . . . . . . . . . . . . . . . . . . . . . . . 17
1.1.1 Original meaning of the term. . . . . . . . . . . . . . . . . . . . . . . 17
1.1.2 NCS averaging. . . . . . . . . . . . . . . . . . . . . . . . . . . . . . 17
1.1.3 MR with known search model. . . . . . . . . . . . . . . . . . . . . . 18
1.1.4 Rotation function. . . . . . . . . . . . . . . . . . . . . . . . . . . . . 19
1.1.5 RF: reciprocal space formulation. . . . . . . . . . . . . . . . . . . . . 20
1.1.6 Fast RF. . . . . . . . . . . . . . . . . . . . . . . . . . . . . . . . . . 20
1.1.7 Real space RF and direct RF. . . . . . . . . . . . . . . . . . . . . . . 21
1.1.8 Translation function . . . . . . . . . . . . . . . . . . . . . . . . . . . 22
1.1.9 Packing function. . . . . . . . . . . . . . . . . . . . . . . . . . . . . 23
1.1.10 Combination of MR and experimental phasing. . . . . . . . . . . . . 24
1.1.11 Improvement of the search model. . . . . . . . . . . . . . . . . . . . 25
1.1.12 The use of NCS in MR. . . . . . . . . . . . . . . . . . . . . . . . . . 26
1.1.13 Exhaustive search. . . . . . . . . . . . . . . . . . . . . . . . . . . . . 27
1.1.14 Related methods. . . . . . . . . . . . . . . . . . . . . . . . . . . . . 27
1.1.15 MR and translational NCS. . . . . . . . . . . . . . . . . . . . . . . . 28
1.2 NCS and twinning. . . . . . . . . . . . . . . . . . . . . . . . . . . . . . . . . 30
1.2.1 Geometrical classification of twins. . . . . . . . . . . . . . . . . . . . 30
1.2.2 Determination of approximate lattice symmetries. . . . . . . . . . . . 32
1.2.3 Perfect twinning test. . . . . . . . . . . . . . . . . . . . . . . . . . . 33
1.2.4 Partial twinning test . . . . . . . . . . . . . . . . . . . . . . . . . . . 38
1.2.5 Refinement using twinned data. . . . . . . . . . . . . . . . . . . . . . 44
1.3 OD structures. . . . . . . . . . . . . . . . . . . . . . . . . . . . . . . . . . . 45
1.3.1 Definition and classification. . . . . . . . . . . . . . . . . . . . . . . 46
1.3.2 Symmetry of OD-structures. . . . . . . . . . . . . . . . . . . . . . . 48
1.3.3 Global organisation of OD-structures. . . . . . . . . . . . . . . . . . 51
3
1.3.4 Examples. . . . . . . . . . . . . . . . . . . . . . . . . . . . . . . . . 53
2 MR protocols utilising Non Crystallographic Symmetry. . . . . . . . . . . . . . . . 57
2.1 NCS-constrained exhaustive search with the TF target. . . . . . . . . . . . . . 59
2.1.1 Background. . . . . . . . . . . . . . . . . . . . . . . . . . . . . . . . 59
2.1.2 Model preparation and structure solution. . . . . . . . . . . . . . . . 59
2.2 Partially constrained exhaustive search with the TF target . . . . . . . . . . . . 62
2.2.1 Background. . . . . . . . . . . . . . . . . . . . . . . . . . . . . . . . 62
2.2.2 Models and preliminary MR trials. . . . . . . . . . . . . . . . . . . . 64
2.2.3 Structure determination. . . . . . . . . . . . . . . . . . . . . . . . . . 64
2.2.4 Concluding remarks. . . . . . . . . . . . . . . . . . . . . . . . . . . 65
2.3 Partially constrained exhaustive search with the CRF target . . . . . . . . . . . 67
2.3.1 Background. . . . . . . . . . . . . . . . . . . . . . . . . . . . . . . . 67
2.3.2 Structure solution. . . . . . . . . . . . . . . . . . . . . . . . . . . . . 69
2.3.3 Structure analysis. . . . . . . . . . . . . . . . . . . . . . . . . . . . . 71
2.3.4 Alternative method of the HCHL structure determination . . . . . . . . 73
2.3.5 Conclusion. . . . . . . . . . . . . . . . . . . . . . . . . . . . . . . . 73
2.4 Rigid-body refinement with the CRF target. . . . . . . . . . . . . . . . . . . 74
2.4.1 Structure solution. . . . . . . . . . . . . . . . . . . . . . . . . . . . . 74
2.4.2 Concluding remarks. . . . . . . . . . . . . . . . . . . . . . . . . . . 76
2.5 MR with feedback from the refined partial model. . . . . . . . . . . . . . . . 78
2.5.1 Structure solution. . . . . . . . . . . . . . . . . . . . . . . . . . . . . 78
2.6 Substructure solution using NCS-constrained exhaustive search. . . . . . . . . 81
2.6.1 Background. . . . . . . . . . . . . . . . . . . . . . . . . . . . . . . . 81
2.6.2 Crystallisation and X-ray data analysis. . . . . . . . . . . . . . . . . . 83
2.6.3 Solution of the substructure. . . . . . . . . . . . . . . . . . . . . . . 84
2.6.4 Structure determination and analysis. . . . . . . . . . . . . . . . . . . 87
2.6.5 Conformational asymmetry of the portal protein. . . . . . . . . . . . . 89
2.6.6 Conclusion. . . . . . . . . . . . . . . . . . . . . . . . . . . . . . . . 91
3 Twinned structures . . . . . . . . . . . . . . . . . . . . . . . . . . . . . . . . . . . 92
3.1 Intensity statistics in the case of correlated structure factors . . . . . . . . . . . 93
3.1.1 Twinned intensities. . . . . . . . . . . . . . . . . . . . . . . . . . . . 93
3.1.2 Examples. . . . . . . . . . . . . . . . . . . . . . . . . . . . . . . . . 94
3.1.3 Joint distribution of structure factors. . . . . . . . . . . . . . . . . . . 95
3.1.4 Moment generating function forZ′ andZ′′ . . . . . . . . . . . . . . . . 96
3.1.5 Moment generating function forZ′ and|Z′′| . . . . . . . . . . . . . . . 97
3.1.6 Perfect twinning test. . . . . . . . . . . . . . . . . . . . . . . . . . . 98
4
3.1.7 Partial twinning test . . . . . . . . . . . . . . . . . . . . . . . . . . . 101
3.2 RvR plot. . . . . . . . . . . . . . . . . . . . . . . . . . . . . . . . . . . . . . 104
3.2.1 Algorithm for lattice symmetry . . . . . . . . . . . . . . . . . . . . . 104
3.2.2 R-factor between twin-related intensities. . . . . . . . . . . . . . . . . 106
3.2.3 Scatter RvR plot based on PDB-data. . . . . . . . . . . . . . . . . . . 109
3.2.4 Untwinned cases. . . . . . . . . . . . . . . . . . . . . . . . . . . . . 111
3.2.5 Cases of twinning. . . . . . . . . . . . . . . . . . . . . . . . . . . . . 112
3.2.6 Effect of refinement onRcalctwin . . . . . . . . . . . . . . . . . . . . . . . 113
3.2.7 Concluding remarks. . . . . . . . . . . . . . . . . . . . . . . . . . . 117
3.3 Example of twin by metric merohedry. . . . . . . . . . . . . . . . . . . . . . 119
3.3.1 Background. . . . . . . . . . . . . . . . . . . . . . . . . . . . . . . . 119
3.3.2 Structure solution. . . . . . . . . . . . . . . . . . . . . . . . . . . . . 123
3.3.3 NCS and orthorhombic cell. . . . . . . . . . . . . . . . . . . . . . . 123
3.3.4 Twin axis and composition plane. . . . . . . . . . . . . . . . . . . . . 125
3.3.5 Concluding remarks. . . . . . . . . . . . . . . . . . . . . . . . . . . 128
3.4 Example of OD-twin by metric merohedry. . . . . . . . . . . . . . . . . . . . 129
3.4.1 Structure solution. . . . . . . . . . . . . . . . . . . . . . . . . . . . . 129
3.4.2 Twin morphology. . . . . . . . . . . . . . . . . . . . . . . . . . . . . 131
3.4.3 Lattice constraints. . . . . . . . . . . . . . . . . . . . . . . . . . . . 134
3.4.4 Idealised model of the OD-twin of HemH. . . . . . . . . . . . . . . . 134
3.4.5 Covariance model. . . . . . . . . . . . . . . . . . . . . . . . . . . . 135
3.4.6 Second moment of normalised intensities. . . . . . . . . . . . . . . . 137
3.4.7 Cumulative distribution of normalised intensities. . . . . . . . . . . . 137
3.4.8 Partial twinning test . . . . . . . . . . . . . . . . . . . . . . . . . . . 140
3.4.9 Concluding remarks. . . . . . . . . . . . . . . . . . . . . . . . . . . 142
3.5 Example of OD-twin by reticular pseudomerohedry. . . . . . . . . . . . . . . 144
3.5.1 Background. . . . . . . . . . . . . . . . . . . . . . . . . . . . . . . . 144
3.5.2 Structure solution. . . . . . . . . . . . . . . . . . . . . . . . . . . . . 145
3.5.3 Analysis of twinning. . . . . . . . . . . . . . . . . . . . . . . . . . . 147
3.5.4 Real space lattice geometry and classification of the twin . . . . . . . . 147
3.5.5 Demodulation. . . . . . . . . . . . . . . . . . . . . . . . . . . . . . . 151
3.5.6 Concluding remarks. . . . . . . . . . . . . . . . . . . . . . . . . . . 155
4 False-origin MR-solutions . . . . . . . . . . . . . . . . . . . . . . . . . . . . . . . 156
4.1 Structure solution of anti-TRAP (continued). . . . . . . . . . . . . . . . . . . 157
4.1.1 Organisation of the crystal. . . . . . . . . . . . . . . . . . . . . . . . 157
4.1.2 Test refinements on the two origins. . . . . . . . . . . . . . . . . . . 159
5
4.1.3 Comments on restoring the true structure. . . . . . . . . . . . . . . . 161
4.2 Structure solution of GAF domain of CodY. . . . . . . . . . . . . . . . . . . 162
4.2.1 Background. . . . . . . . . . . . . . . . . . . . . . . . . . . . . . . . 162
4.2.2 Organisation of the true and false structures. . . . . . . . . . . . . . . 163
4.2.3 Structure correction using refinement inP1 . . . . . . . . . . . . . . . 164
4.2.4 Structure correction using the MR with a dimeric model. . . . . . . . 165
4.2.5 Structure correction using the MR with single-subunit model . . . . . . 166
4.2.6 Structure correction using refinements of alternative structures. . . . . 168
4.2.7 Concluding remarks. . . . . . . . . . . . . . . . . . . . . . . . . . . 169
4.3 Zanuda, a program for symmetry validation and correction. . . . . . . . . . . 170
4.3.1 Target cases. . . . . . . . . . . . . . . . . . . . . . . . . . . . . . . . 170
4.3.2 Zanudarun with test case . . . . . . . . . . . . . . . . . . . . . . . . 170
4.3.3 Preparation and transformations of the model. . . . . . . . . . . . . . 174
4.3.4 Starting model and refinements. . . . . . . . . . . . . . . . . . . . . 177
4.3.5 Concluding remarks. . . . . . . . . . . . . . . . . . . . . . . . . . . 178
4.4 Example of twin with double pseudosymmetry. . . . . . . . . . . . . . . . . 179
4.4.1 Background. . . . . . . . . . . . . . . . . . . . . . . . . . . . . . . . 179
4.4.2 Twinning tests . . . . . . . . . . . . . . . . . . . . . . . . . . . . . . 180
4.4.3 Correction of symmetry. . . . . . . . . . . . . . . . . . . . . . . . . 182
4.4.4 Additional criteria for selection of subgroups. . . . . . . . . . . . . . 182
4.4.5 Alternative methods of structure correction. . . . . . . . . . . . . . . 185
4.5 OD-structures with enantiomorphic sequences of stacking vectors . . . . . . . 187
4.5.1 Theoretical model . . . . . . . . . . . . . . . . . . . . . . . . . . . . 187
4.5.2 Example . . . . . . . . . . . . . . . . . . . . . . . . . . . . . . . . . 190
4.5.3 Concluding remarks. . . . . . . . . . . . . . . . . . . . . . . . . . . 191
5 Conclusions. . . . . . . . . . . . . . . . . . . . . . . . . . . . . . . . . . . . . . . 193
5.1 Non-standard MR protocols. . . . . . . . . . . . . . . . . . . . . . . . . . . 193
5.1.1 NCS-constrained exhaustive search. . . . . . . . . . . . . . . . . . . 193
5.1.2 Substructure solution using NCS-constrained exhaustive search . . . . 194
5.1.3 Refinement of partial structures. . . . . . . . . . . . . . . . . . . . . 194
5.2 Symmetry validation and correction. . . . . . . . . . . . . . . . . . . . . . . 195
5.2.1 Twinning by (pseudo)merohedry. . . . . . . . . . . . . . . . . . . . . 195
5.2.2 Twinning by reticular pseudomerohedry. . . . . . . . . . . . . . . . . 196
5.2.3 False origin solutions. . . . . . . . . . . . . . . . . . . . . . . . . . . 197
5.2.4 Program for symmetry validation and correction. . . . . . . . . . . . 198
5.3 Outline on symmetry assignment. . . . . . . . . . . . . . . . . . . . . . . . . 199
6

5.4 Impact on structure refinement and the resulting model. . . . . . . . . . . . . 200
References. . . . . . . . . . . . . . . . . . . . . . . . . . . . . . . . . . . . . . . . 201
7
List of Figures
1.1 Effect of NCS on perfect twinning tests. . . . . . . . . . . . . . . . . . . . . 37
1.2 Effect of resolution cut-off on perfect twinning tests.Example 1 . . . . . . . . 39
1.3 Effect of resolution cut-off on perfect twinning tests.Example 2 . . . . . . . . 40
1.4 Effect of NCS and experimental errors on partial twinning test (H-test) . . . . . 43
1.5 Types of OD-structures. . . . . . . . . . . . . . . . . . . . . . . . . . . . . . 47
1.5 (continued) . . . . . . . . . . . . . . . . . . . . . . . . . . . . . . . . . . . . 48
1.6 Overall organisation of OD-structures. . . . . . . . . . . . . . . . . . . . . . 52
2.1 Structure solution of TPx-B. . . . . . . . . . . . . . . . . . . . . . . . . . . . 60
2.2 Structure solution of anti-TRAP. . . . . . . . . . . . . . . . . . . . . . . . . 63
2.3 Comparison of hexamers formed by three homologues of HCHL . . . . . . . . 70
2.4 Determination of relative orientation of trimers in theHCHL hexamer . . . . . 70
2.5 Structure solution of BPV-1 E1 helicase. . . . . . . . . . . . . . . . . . . . . 75
2.6 Structure solution of the MTH685 protein. . . . . . . . . . . . . . . . . . . . 79
2.7 The Hg-substructure solution of the portal-protein derivative crystals. . . . . . 85
2.8 DNA translocationvia the SPP1 portal protein. . . . . . . . . . . . . . . . . . 88
3.1 Perfect twinning tests in the case of correlated structure factors . . . . . . . . . 100
3.2 Partial twinning test in the case of correlated structure factors. . . . . . . . . . 103
3.3 RvR scatter plot. . . . . . . . . . . . . . . . . . . . . . . . . . . . . . . . . . 110
3.4 Overfitting to twinned data. . . . . . . . . . . . . . . . . . . . . . . . . . . . 116
3.5 RvR plot for twinned crystal of gp2 C-terminal domain. . . . . . . . . . . . . 119
3.6 Perfect twinning test for twinned crystal of gp2 C-terminal domain. . . . . . . 121
3.7 Partial twinning test for twinned crystal of gp2 C-terminal domain . . . . . . . 122
3.8 The SRF for crystals of gp1 and gp2 C-terminal domains. . . . . . . . . . . . 122
3.9 Organisation of twinned crystal of gp2 C-terminal domain . . . . . . . . . . . 124
3.10 Possible orientations of composition plane in monoclinic twins . . . . . . . . . 127
3.11 Analysis of screw axes in the crystal structure of HemH. . . . . . . . . . . . . 130
3.12 OD-twin of HemH . . . . . . . . . . . . . . . . . . . . . . . . . . . . . . . . 132
3.13 Resolution cut-off for twinning tests. . . . . . . . . . . . . . . . . . . . . . . 138
3.14 Perfect twinning tests in the case of OD-twin of type I/B. . . . . . . . . . . . 139
3.15 Partial twinning tests in the case of OD-twin of type I/B. . . . . . . . . . . . . 141
3.16 Effect of interfering NCS onRtwin . . . . . . . . . . . . . . . . . . . . . . . . 142
3.17 Organisation of an OD-twin ofL-2-haloacid dehalogenase. . . . . . . . . . . 146
3.18 Diffraction image of an OD-twin showing alternative lattices . . . . . . . . . . 148
3.19 Diffraction image of an OD-twin showing streaky reflections . . . . . . . . . . 149
8
3.20 Arrangement of spots in the reciprocal space. . . . . . . . . . . . . . . . . . . 149
3.21 Demodulation of the diffraction data. . . . . . . . . . . . . . . . . . . . . . . 152
4.1 True and false-origin MR solutions of the crystal structure of anti-TRAP. . . . 158
4.2 Electron density maps for true and false-origin structures of anti-TRAP . . . . 160
4.3 Crystal structure of GAF domain of CodY and associated false structures . . . 163
4.4 Correction of the space group assignment (GAF-domain ofCodY) . . . . . . . 171
4.5 Pseudosymmetry of CodY GAF-domain crystal. . . . . . . . . . . . . . . . . 172
4.6 RvR plot for twinned crystal of oxidoreductase. . . . . . . . . . . . . . . . . 179
4.7 Perfect twinning tests for the twinned crystal of oxidoreductase. . . . . . . . . 181
4.8 Correction of the space group assignment (oxidoreductase) . . . . . . . . . . . 183
4.9 Pseudosymmetry of the oxidoreductase crystal. . . . . . . . . . . . . . . . . . 184
4.10 Acentric structures with equal structure amplitudes. . . . . . . . . . . . . . . 187
9
List of Tables
1.1 “Biological” OD-groupoids with oblique, rectangular,and square unit cells. . 50
2.1 Conventional-MR step of the structure solution of HCHL. . . . . . . . . . . . 71
2.2 Comparison of molecular architecture of HCHL and its homologues . . . . . . 72
2.3 Structure solution of the MTH685 protein. . . . . . . . . . . . . . . . . . . . 80
2.4 Data sets used for structure solution of SPP1 portal protein . . . . . . . . . . . 84
3.1 Frequency of twinning in different symmetry environments . . . . . . . . . . . 114
3.2 Overfitting to twinned data. . . . . . . . . . . . . . . . . . . . . . . . . . . . 117
3.3 Structure solution of HemH fromBacillus anthracis. . . . . . . . . . . . . . . 130
4.1 MR with refined single-subunit models of CodY GAF-domain. . . . . . . . . 167
4.2 Refinements of true and false structures of the CodY GAF-domain . . . . . . . 168
4.3 Subgroup table for anti-TRAP crystal structure. . . . . . . . . . . . . . . . . 176
4.4 Refinements of OD-structures with enantiomorphic sets of stacking vectors . . 191
10
Declaration
Several protein crystal structures are used as examples in this thesis to illustrate NCS-based
approaches to the structure determination and analysis of twinning. In all these collaborative
structural projects, I took part in the structure solution and, in the work on the portal protein
from the phage SPP1, in the modelling of DNA translocation. Any contribution from others to
a particular structural work is duly acknowledged and the citations associated with the structure
are provided at the appropriate points within the text. The search for twinning cases in the
PDB and preliminary analysis was performed under my (co)supervision by Nagarajan Periasamy
(Mres. Bioinformatics, York, 2004) and was presented earlier in a report entitled “Analysis
of PDB and identification of unusual cell-symmetry combination” as part of his coursework
requirement. No part of that report has been repeated here verbatim.
11
Abbreviations
ATP adenosine-5′-triphosphate
BPV-1 bovine papillomavirus-1
CC correlation coefficient
CCM constant correlation model
CCP4 Collaborative Computational Project Number 4
CCP4mg CCP4 molecular graphics
CRF cross-rotation function
DNA deoxyribonucleic acid
ECH enoyl-CoA hydratase
EM electron microscopy
FFT fast Fourier transform
HCHL hydroxycinnamoyl-CoA hydratase-lyase
HemH ferrochelatase-1
LRF locked rotation function
LTF locked translation function
MAD multiple-wavelength anomalous diffraction
MCM modulated correlation model
MGF moment generating function
MIR multiple isomorphous replacement
MR molecular replacement
NAD+ nicotinamide adenine dinucleotide (oxidised form)
NADP+ nicotinamide adenine dinucleotide phosphate (oxidised form)
NCS non-crystallographic symmetry
NMA normal-mode analysis
OD order-disorder
PC Patterson correlation
PCNA proliferating cell nuclear antigen
PDB protein data bank
PF packing function
PSSG pseudosymmetry space group
PTF phased translation function
12
RF rotation function
RNA ribonucleic acid
RPS rotational pseudosymmetry
SAPTF spherically averaged phase translation function
SRF self-rotation function
TF translation function
TLQS twin-lattice quasisymmetry
TLS translation-libration-screw
TLS twin-lattice symmetry
TPx-B thioredoxin peroxidase B from human erythrocytes
TRAP tryptophan attenuation protein
YSBL York Structural Biology Laboratory
anti-TRAP regulator of TRAP activity
dsDNA double-stranded DNA
pRNA procapsid RNA
r.m.s.d. root mean square deviation
13
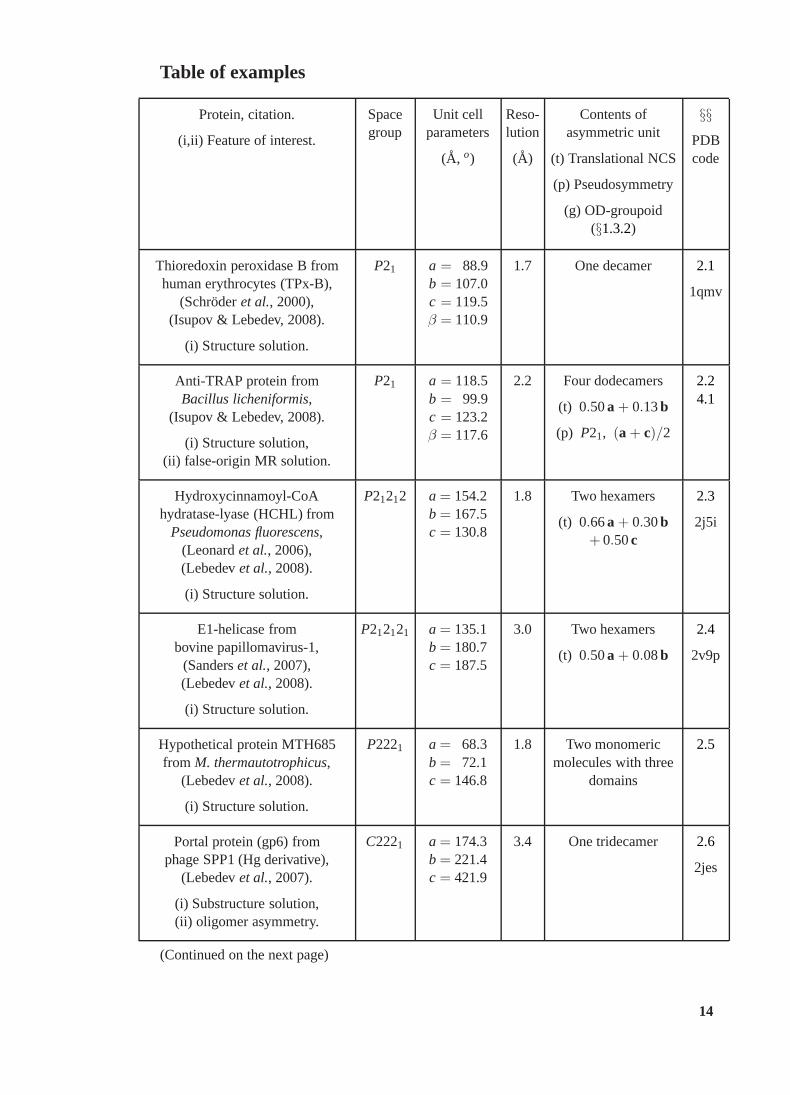
Table of examples
Protein, citation.
(i,ii) Feature of interest.
Spacegroup
Unit cellparameters
(A, o)
Reso-lution
(A)
Contents ofasymmetric unit
(t) Translational NCS
(p) Pseudosymmetry
(g) OD-groupoid(§1.3.2)
§§PDBcode
Thioredoxin peroxidase B fromhuman erythrocytes (TPx-B),
(Schroderet al., 2000),(Isupov & Lebedev, 2008).
(i) Structure solution.
P21 a = 88.9b = 107.0c = 119.5β = 110.9
1.7 One decamer 2.1
1qmv
Anti-TRAP protein fromBacillus licheniformis,
(Isupov & Lebedev, 2008).
(i) Structure solution,(ii) false-origin MR solution.
P21 a = 118.5b = 99.9c = 123.2β = 117.6
2.2 Four dodecamers
(t) 0.50a + 0.13b
(p) P21, (a + c)/2
2.24.1
Hydroxycinnamoyl-CoAhydratase-lyase (HCHL) from
Pseudomonas fluorescens,(Leonardet al., 2006),(Lebedevet al., 2008).
(i) Structure solution.
P21212 a = 154.2b = 167.5c = 130.8
1.8 Two hexamers
(t) 0.66a + 0.30b+ 0.50c
2.3
2j5i
E1-helicase frombovine papillomavirus-1,
(Sanderset al., 2007),(Lebedevet al., 2008).
(i) Structure solution.
P212121 a = 135.1b = 180.7c = 187.5
3.0 Two hexamers
(t) 0.50a + 0.08b
2.4
2v9p
Hypothetical protein MTH685from M. thermautotrophicus,
(Lebedevet al., 2008).
(i) Structure solution.
P2221 a = 68.3b = 72.1c = 146.8
1.8 Two monomericmolecules with three
domains
2.5
Portal protein (gp6) fromphage SPP1 (Hg derivative),
(Lebedevet al., 2007).
(i) Substructure solution,(ii) oligomer asymmetry.
C2221 a = 174.3b = 221.4c = 421.9
3.4 One tridecamer 2.6
2jes
(Continued on the next page)
14
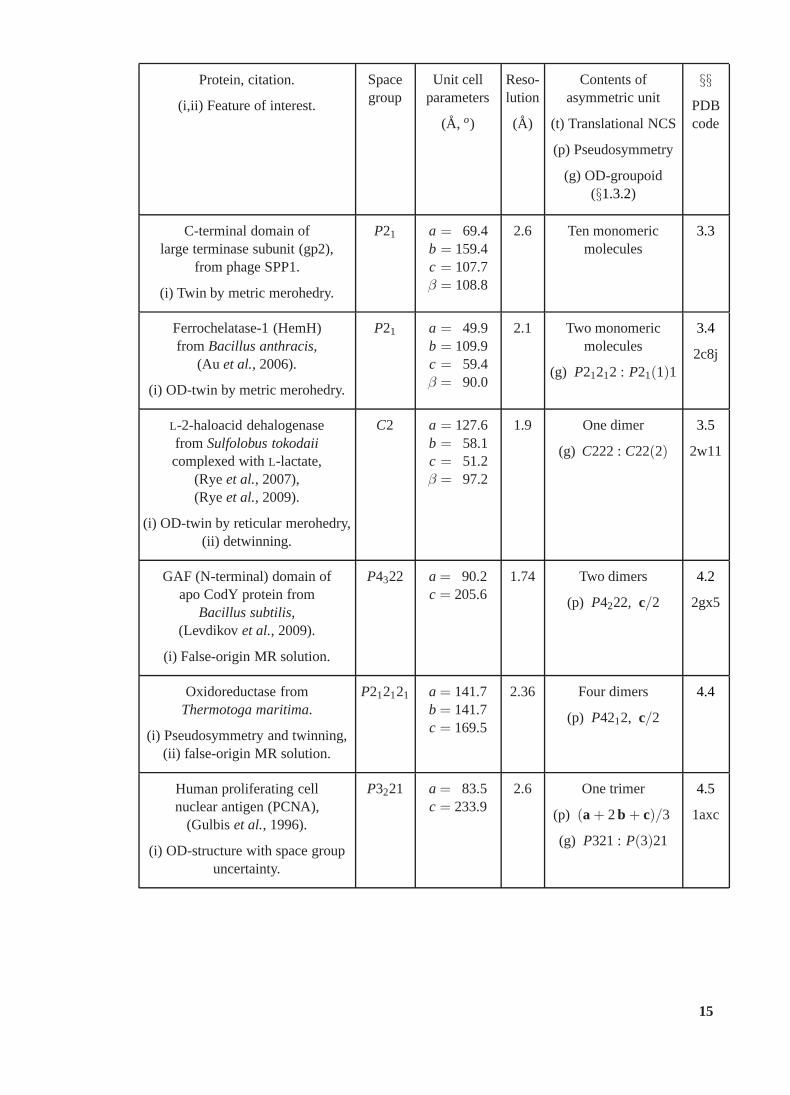
Protein, citation.
(i,ii) Feature of interest.
Spacegroup
Unit cellparameters
(A, o)
Reso-lution
(A)
Contents ofasymmetric unit
(t) Translational NCS
(p) Pseudosymmetry
(g) OD-groupoid(§1.3.2)
§§PDBcode
C-terminal domain oflarge terminase subunit (gp2),
from phage SPP1.
(i) Twin by metric merohedry.
P21 a = 69.4b = 159.4c = 107.7β = 108.8
2.6 Ten monomericmolecules
3.3
Ferrochelatase-1 (HemH)from Bacillus anthracis,
(Au et al., 2006).
(i) OD-twin by metric merohedry.
P21 a = 49.9b = 109.9c = 59.4β = 90.0
2.1 Two monomericmolecules
(g) P21212 : P21(1)1
3.4
2c8j
L-2-haloacid dehalogenasefrom Sulfolobus tokodaiicomplexed withL-lactate,
(Ryeet al., 2007),(Ryeet al., 2009).
(i) OD-twin by reticular merohedry,(ii) detwinning.
C2 a = 127.6b = 58.1c = 51.2β = 97.2
1.9 One dimer
(g) C222 :C22(2)
3.5
2w11
GAF (N-terminal) domain ofapo CodY protein from
Bacillus subtilis,(Levdikov et al., 2009).
(i) False-origin MR solution.
P4322 a = 90.2c = 205.6
1.74 Two dimers
(p) P4222, c/2
4.2
2gx5
Oxidoreductase fromThermotoga maritima.
(i) Pseudosymmetry and twinning,(ii) false-origin MR solution.
P212121 a = 141.7b = 141.7c = 169.5
2.36 Four dimers
(p) P4212, c/2
4.4
Human proliferating cellnuclear antigen (PCNA),
(Gulbiset al., 1996).
(i) OD-structure with space groupuncertainty.
P3221 a = 83.5c = 233.9
2.6 One trimer
(p) (a + 2b + c)/3
(g) P321 : P(3)21
4.5
1axc
15
1 Introduction
The method of molecular replacement (MR) is most suitable for crystal structure solution of
complexes, mutants and close homologues of a macromoleculewith known structure. Some-
times the structure of a distant homologue can be solved, buteven in apparently easy cases a
straightforward structure solution may be prevented by non-trivial organisation of a given crys-
tal. A general overview of MR (§1.1) is therefore followed by discussion of twinning (§1.2),
which frequently obscures a correct MR-solution. Finally,the theory of OD-structures and sev-
eral examples of OD-twins are presented (§1.3).
16
1.1 Molecular replacement
1.1.1 Original meaning of the term
In current understanding, the term MR relates to a series of Patterson function superposition
techniques and auxiliary methods targeting at the positioning of known molecular fragments in
unknown crystal structure. When implemented for the first time (Nordman & Nakatsu, 1963),
the method was not referred to as MR; instead, the term MR was initially assigned to a method,
which was thought to be suitable for determination of entirely unknown molecular structure
given (non-anomalous) diffraction data for two polymorphsor for a single crystal but contain-
ing more than one molecule in the asymmetric unit. Rossmann &Blow (1962; 1963) referred
to Shannon’s theorem and pointed out that diffraction data contained sufficient information to
estimate phases provided that there were two or more copies of an unknown molecule in the
asymmetric unit or diffraction data were available for two or more different crystal forms. A
series of proof-of-principle works outlined the procedureinvolving the following three steps:
(i) the search for relative orientations of identical (but unknown) electron density fragments
(Rossmann & Blow, 1962; Tollin & Rossmann, 1966); (ii) the search for the position of these
fragments in the crystal(s) (Rossmannet al., 1964); (iii) solution of “molecular replacement
equations” (Rossmann & Blow, 1963, 1964; Main & Rossmann, 1966) that restores phases. Sev-
eral macromolecular polymorphs and several cases of non-crystallographic symmetry (NCS) in
protein crystals were already known (e.g.Scouloudi, 1960 and references in Rossmann & Blow
1962; 1963) and the new method seemed to be very promising, also because of rapidly increas-
ing computer power.
1.1.2 NCS averaging
The molecular replacement equations are reciprocal space formulations of the identity of the
electron density in two or more non-equivalent positions. It was demonstrated practically (Muir-
headet al., 1967, and references in Bricogne, 1974) and theoretically(Bricogne, 1974) that these
equations can be solved by averaging of the electron densityin the real space provided reason-
able starting phases are available.
Therefore the third step of the originally assumed scenarioof MR evolved in what is presently
termed as NCS averaging (Cowtan & Main, 1993), although the term MR was for a while ap-
plied to this procedure (Argoset al., 1975).
The phasing of viral structures starting from the sphericalenvelope is the closest method to
the originally assumed MR scenario (Chapmanet al., 1992, and references therein). However,
such method of structure determination was only possible because of up to 60-fold averaging.
Even in these very favourable cases the “MR”ab initio phasing required precise estimation of
17
starting model parameters, the spherical shell radii. Therefore the prerequisites of the procedure
are either good X-ray measurements at very low resolution orexperimental data obtained by
other methods such as low angle X-ray scattering or electronmicroscopy.
1.1.3 MR with known search model
The first two steps of the original MR scenario have clear counterparts in contemporary MR
using a template structure.
The rotation function (RF) is typically used for two purposes, as the self-rotation function
(SRF) to find NCS operations and as the cross-rotation function (CRF) to find the orientation of
the template best matching the orientation of the molecule(s) in the crystal. The two functions
differ in the objects to which they are applied, but both of them are conceptually identical to
the RF by Rossmann & Blow (1962), which is an overlap functionbetween spherical domains
of a fixed Patterson map and a rotated copy of the same or another Patterson map. The SRF is
used in the preliminary analysis of the diffraction data andthe CRF accomplishes the first step
of contemporary MR to define the orientation of the search model. The algorithms that are used
for calculation of the RF are discussed below.
The translation function proposed by Rossmannet al.(1964) was intended to find the relative
positions of the centres of two copies of an entirely unknownmolecule given their orientations.
The proposed method is in practice only applicable to molecules related by two-fold rotation in
a crystal with low crystallographic symmetry and NCS (ideally, two molecules per unit cell). An
extension of the method to structures with many molecules per unit cell would apparently require
precise information on the molecular shape, and relations other than exact two-fold rotation
between two molecules in question would require knowledge of the internal organisation of the
molecule, essentially the search model. On the other hand, the improvement of phases is only
possible with high-order NCS.
The translation function (TF) in the problem with known search model is conceptually dif-
ferent from the initially proposed translation function; it uses the complete Patterson map and
the molecular envelope need not be defined explicitly, it is equally applicable to any two orien-
tations of the search model and in later versions it accountsfor all symmetry related molecules
in a single run. The theory of the contemporary version of theTF is briefly discussed below; it
is used in the second step of the standard MR protocol, the positioning of the model in the unit
cell of the target crystal.
18
1.1.4 Rotation function
Given two Patterson functionsP1 andP2 and a spherical domainU centred at the origin, the RF
is defined as
R(o) =
∫∫∫
U
P1(r) P2(o−1 r) dr3, (1)
whereo is a variable rotation matrix. Two widely used parameterisations of the rotation space
are Euler anglesα, β andγ and polar anglesφ, ψ, χ. The first set of angles is convenient
for computations, whereas the second set can be more suitable for representations. IfP1 and
P2 represent the same experimental Patterson map, equation (1) defines the SRF; ifP1 is an
experimental Patterson map andP2 the Patterson computed from the search model (atomic model
or electron density map), then (1) defines the CRF. The function for two different experimental
Patterson maps can also be of practical interest to verify that two crystals contain identical
molecules or identical oligomers.
The RF is targeted at determining the relative orientationsof the molecules but not their
relative positions. Therefore, the interatomic intramolecular vectors (self-vectors) contribute to
the useful signal in the RF, whereas all the interatomic intermolecular vectors (cross-vectors)
contribute to the noise. Fortunately for the RF performance, all self-vectors from a spherical
molecule but less than half of the cross-vectors are shorterthan the diameter of the molecule.
Therefore, the radius of the spherical domainU is chosen to be approximately equal to the
diameter of a search model (CRF) or to the expected diameter of the unknown molecule (SRF).
In practice the search model is not spherical and, moreover,its largest dimension can exceed the
length of one of the cell edges. Therefore, either twice the radius of gyration of the molecule
or half-length of the shortest crystallographic translation, the smaller of the two magnitudes, is
substituted for the integration radius. If twice the radiusof gyration is used, then most of the
meaningful information from self-vectors is preserved andcontributes to the signal, whereas
most of the noise owing to cross-vectors is suppressed. The limit imposed by cell parameters
prevents accounting for the translational equivalents of the Patterson vectors, and, in particular,
prevents including any translational equivalent of the origin peak into the integration domain.
The contribution from the Patterson origin peak to the RF is almost constant for all rotations
for isotropic data, but this may not be so if the data are anisotropic, and it may disguise correct
RF peaks. The removal of a smaller sphere embracing the origin peak from the integration
sphereU in (1) or removal or downweighting of the low harmonics in the fastRF helps resolve
this problem (e.g. Navaza, 1987). Non-spherical integration domains were also discussed, but
this generalisation seems to be sensible only in the specialcase of a strong prior knowledge of
the orientation.
19
1.1.5 RF: reciprocal space formulation
Direct calculation of the RF according to (1) for reasonably fine sampling of both Patterson map
and rotation space requires huge computer resources. Rossmann & Blow (1962) expressed the
RF in terms of intensities and the interference functionG(h, k), the Fourier transform of the
integration domain,
R(o) =∑
h
∑
h′
|F1(h)|2 |F2(h′)|2 G(h,o−1 h′). (2)
to allow the following approximations. Firstly, only the “strong terms”, i.e. the strong inten-
sities are preserved in one of the two sets of intensities. Secondly, all but the first nodes of
G(h, k) are ignored to retain only close pairs of reflections in the double summation in (2). The
approximation was shown to be sufficiently accurate for practical purposes. The algorithm was
later enhanced by including more nodes ofG(h, k) in the summation and by more efficient sam-
pling of G(h, k) (Tollin & Rossmann, 1966; Tong & Rossmann, 1990). This algorithm is rarely
used now because of the introduction of the fast RF algorithm. However, the algorithms using
the reciprocal space formulations of the real space problems and adequate approximations for
G(h, k) remain of interest. In particular, such an approach is applicable to NCS averaging to
offer iterative phase extension without re-calculation ofthe electron density map at each cycle
(Chapmanet al., 1992; Tsaoet al., 1992).
1.1.6 Fast RF
The idea of the fast RF algorithm (Crowther, 1972) is that thePatterson function in a spherical
domain around the origin is expanded in series, in which the angular dependence is represented
by spherical harmonicsYlm,
P(r) =
∞∑
l=0
l∑
m=−l
clm(r)Ylm(n) (3)
In this equationclm are radial functions, which only depend onr, the length ofr , andn = r/r
is a unit vector alongr . Substitution of (3) into (1) and the orthogonality of spherical harmonics
result in the following expression for the RF,
R(o) =
∞∑
l=0
l∑
m=−l
l∑
m′=−l
Clmm′ Dl
mm′(o), (4)
whereDlmm′ are the Wigner matrices representing the rotationo in terms of linear transformations
of spherical functions andClmm′ depend on the data,
Clmm′ =
a∫
0
c∗(1)lm(r)c(2)lm′(r)r2dr, (5)
20
a is the radius of the spherical integration domain, and the indices 1 and 2 in brackets cor-
respond to fixed and rotated Patterson functions, respectively. The Wigner matricesDlmm′ are
computed using recursion relations. How the coefficientsClmm′ are handled depends on the par-
ticular implementation. Crowther approximated the radialfunctionsclm(r) by truncated Bessel-
Fourier series, expressed the coefficientsclmn of these series in terms of structure amplitudes and
summed the products ofc(1)lmn andc(2)lm′n overn to evaluate the coefficientsClmm′ .
There were several improvements in the fast RF since it was first introduced by Crowther.
Navaza (1987) proposed using Gaussian quadrature for integration in (5) instead of summation
of the products of Bessel-Fourier coefficients. This simplified the code and substantially im-
proved the accuracy without requiring extra computationaltime. “Linear” recursion instead of
“triangular” one (Navaza, 1990) improved the accuracy of Wigner function calculation. The
stability of the new recursion was especially important forcalculation of Wigner functions with
large l and made fine details of the rotation function available if necessary. Further improve-
ment of radial integration (5) was achieved using expansion of the radial integral into a series of
products of spherical Bessel-functions (different from Crowther’s series) allowing 30% higher
efficiency and on-the-fly accuracy control (Navaza, 1993).
The calculation of the coefficientsclmn (Crowther, 1972) or the coefficientselmn (Navaza,
1993) factorising the integral (5) is the most time consuming procedure in the standard MR
protocol with one model and one data set. However, if severaldata sets and several models are
available and the coefficients are pre-computed for them, the summation of the Wigner function
series (4) will be required for each combination of data set and model and will in total take most
of the computational time. The use of the three-dimensionalfast Fourier transform instead of
a two-dimensional one (Kovacs & Wriggers, 2002; Trapani & Navaza, 2006) accelerates this
step by about an order of magnitude in a typical MR problem. Inaddition, such an approach
resolves singularities that occur in the recursion for Wigner functions at special values ofβ.
Alternatively, the RF can be sampled on sparser grids if these are defined specifically for each
β-section according to the angular resolution limit (Trapani et al., 2007).
1.1.7 Real space RF and direct RF
In the real-space RF (Huber, 1965) the RF is computed directly according to definition (1),
but the integration is approximated by summation over only the strongest grid points of the
model Patterson function. This approach is very similar to that by (Nordman & Nakatsu, 1963).
Alternatively, the orientations can be scored according tothe match between the coordinates of
strongest peaks in the rotated and fixed Patterson maps (OVIONE; Alvarez-Ruaet al., 2000;
Borgeet al., 2000).
21
In the direct RF (Brunger, 1992) the model in each of the tested orientations is placed in aP1
unit cell with the same dimensions as the unit cell of the target crystal. The Patterson function
of the model structure can therefore be directly compared with the observed Patterson without
restricting the integration domain. This is especially important if the unit cell dimensions are
very different or the shape of the model is far from spherical. It is also important that the
correspondence between two sets of intensities is clearly defined and therefore a more adequate
target function than the simple overlap function can be used. In particular, the target function
in the direct RF is the “Patterson correlation” (PC), the linear correlation coefficient between
two sets of normalised intensities. The use of all self-vectors, the PC-target and absence of
any approximations are the factors enabling very high contrast in the direct RF compared to
other variations of the RF (DeLano & Brunger, 1995; Grosse-Kunstleve & Adams, 2001), which
compensates for the high computational cost in difficult MR problems.
1.1.8 Translation function
The “modified minimum-function” by Nordman & Nakatsu (1963), which was an equivalent of
the TF with the atomic search model, was expressed in terms ofa sum over all expected cross-
vectors. A similar algorithm was proposed by Tollin (1966),in which the TF was considered as
a modification of the sum function by Buerger (1959). Crowther & Blow (1967) presented an
algorithm where summation over cross-vectors was avoided and the Fourier coefficients of the
TF were expressed in terms of calculated intensities (T-function). Such formulation made the
TF suitable for the solution of macromolecular structures.It was also shown that the removal of
the expected self-vectors from the experimental Pattersonfunction enhances the contrast (T1-
function). Symmetrised versions ofT- andT1-functions were proposed (T2-function), which
revealed peaks from all pairs of symmetry related molecules, but in different positions and there-
fore without increase in contrast.
Later, several improvements of TF were proposed (e.g. Langs, 1975; Litvin, 1977). Major
improvements were independently introduced by Haradaet al.(1981) and Vagin (1983) to render
TF essentially in its present appearance. In the new versionof TF all pairs of symmetry related
molecules act in accord and peak at the same point of three-dimensional TF-space to increase
the signal-to-noise ratio in higher symmetry space groups.
The TF by Haradaet al. (1981) is computed using the fast Fourier transform (FFT) and
approximates the correlation coefficient. In the programBRUTE, Fujinaga & Read (1987) use
exact centred correlation coefficient of intensities. Thisfunction is computed for each sample
point in the TF-space. FFT formulation of such correlation search results in a considerable
saving in computation time (Navaza & Vernoslova, 1995).
22
Another overlap function, although based on a quite different physical approach, is the full-
symmetry phased translation function (Cygler & Desrochers, 1989). Its reciprocal-space version
(Bentley & Houdusse, 1992) is computationally similar to the TF, although the TF is quadratic
in the intensities, whereas the phased translation function (PTF) is quadratic in the amplitudes.
In the case of two molecules in the unit cell this function is equivalent to the search of one ori-
entation in the difference map calculated from the other orientation. However, a more important
application of the PTF is to locate a model given external phases. Such combination of MR and
experimental phasing proved to be successful in the cases oflow homology models and poor
experimental phases, when none of the methods alone succeeded (Strokopytovet al., 2005).
1.1.9 Packing function
The TF defined as the overlap of two Patterson functions (e.g. TO-function by Harada et al.,
1981) linearly depends on the density overlap between the symmetry related copies of the search
model and quadratically on the signal, the overlap between search and target densities. Given a
search model with low similarity the top peaks of such a TF aremost likely to correspond to the
overlap of the symmetry related copies of the search model, but not to the correct solution.
There are several ways of correcting the TF to eliminate or downweight these false peaks.
Both the sum of calculated intensities and the sum of calculated intensities squared depend
on the model overlap. The first magnitude and the square root of the second magnitude enter
the denominators of the modified TF by Haradaet al. (1981) and the TF defined as the cor-
relation coefficient between observed and calculated intensities (Navaza & Vernoslova, 1995),
respectively, to downweight the translation vectors corresponding to the interpenetration of the
symmetry-related copies of the search model (Zhang & Matthews, 1994). The sum of calcu-
lated intensities is the height of the origin peak of the Patterson function. Thus, one of the
subtraction strategies in the MR is the removal of the originpeak of the observed Patterson
function, which simultaneously eliminates contribution to the TF from the origin peak of the
model Patterson map and therefore substantially reduces the effect of the model overlap. The
intensity-correlation search appears to be the most efficient among the FFT-based translation
searches, but it is about one order of magnitude slower than others. It is therefore a common
practice to avoid the global correlation search but to calculate the correlation coefficient for the
top peaks of a faster version of the TF, as is done, for example, in AMoReandMOLREP.
None of the discussed modifications of the TF is guaranteed toremove the false peaks owing
to the overlaps in the model. The packing function (PF; Vagin, 1983; Stubbs & Huber, 1991; Va-
gin & Teplyakov, 1997) provides a straightforward way of discarding such false peaks. In this
method, the density overlap in the model is computed as a function of the translation vector and
23
then inverted and truncated to give the PF, which equals one for the position of the reference
search molecule giving no overlaps between symmetry equivalents and equals zero for maximal
overlap of two symmetry equivalents. The overlap function accounts for all symmetry equiva-
lents and is computed using FFT. An empirical scaling coefficient and threshold are required for
the conversion of the overlap function into the PF. The TF is multiplied by the PF to generate a
modified TF, in which the false peaks owing to overlaps in the model are suppressed.
Usually, residues on the surface of biomolecules are less conserved than those buried inside
it. Moreover, the conformations of exposed loops not only can be different in homologues, but
can vary in different crystal forms of the same protein, especially in the areas of intermolecular
contacts. Therefore it is necessary to allow some overlap between neighbouring molecules in an
MR solution. InMOLREPthis is achieved by using two different models, one for calculation of
RF and TF and another for the packing function (Lebedevet al., 2008). In the latter the atoms
with non-zero accessible surface are removed.
1.1.10 Combination of MR and experimental phasing
Multiple-wavelength anomalous diffraction (MAD) or multiple isomorphous replacement (MIR)
data are frequently used for validation of the MR solution and phase improvement. Anoma-
lous/isomorphous substructures with multiple or partially occupied sites are difficult to solve,
but they can easily be found in difference Fourier synthesisusing MR phases, thus confirming
the correctness of the MR solution. Experimental phases canbe further used to improve poor es-
timates of phases provided by MR (Czjzeket al., 2001). Schuermann & Tanner (2003) proposed
that anomalous differences from S atoms should routinely becollected and used in MR struc-
ture determination. An interesting method is described by Griningeret al. (2004), in which the
correctness of the MR solution was verified by identifying radiation-damage-induced structural
changes.
Moreover, there are several formulations of the TF which utilise the difference data during
the TF search. For example, the experimental phases can be directly used in the PTF, or the
difference electron density can be monitored at known heavy/anomalous atom sites (Zhang &
Matthews, 1994). In addition, the Patterson search for heavy atoms can itself be reformulated
in terms of the TF (Vagin & Teplyakov, 1998). In special casesof high symmetry oligomers the
MR approach to substructure determination is superior overthe otherwise more powerful direct
methods (§2.6; Antsonet al., 1995).
24
1.1.11 Improvement of the search model
More attention is recently paid to search model design because of rapid growth of structural
databases and better understanding of the nature of structural variability. In addition, modern
computers make it possible to test many search models or their ensembles and an effective
ranking of these models becomes a priority (Phaser; McCoy et al., 2007).
Model preparation typically includes searching for homologous structures in the protein data
bank (PDB; Bermanet al., 2002), their analysis and modification. The information important
for MR includes the presence and conservation of the oligomeric state and domain structure in
the family of homologous proteins. Data on oligomers can be obtained fromPISA(Krissinel &
Henrick, 2005) and domain descriptions are given, for example, bySCOP(Murzin et al., 1995),
which is linked to the PDB web resources. This information, combined with analysis of the
SRF, Patterson map, unit-cell parameters and symmetry of the crystal, allows the generation of
a search model or a series of search models, including oligomers, single subunits or domains.
There is a wide range of tools available for modification of the selected model(s). Schwarzen-
bacheret al. (2004) showed that the side-chain modelling according to target sequence has a
significant impact on MR success rates. Such a model modification was implemented in the
CHAINSAWprogram, written by Norman Stein and included in the CCP4 suite (Collaborative
Computational Project, Number 4, 1994). A three-dimensional superposition of homologous
structures using, for example,SSM(Krissinel & Henrick, 2004) integrated inCoot (Emsley &
Cowtan, 2004) allows the identification of polypeptide segments that are variable within the
given family of proteins. The removal of such segments from the search model can often prove
critical for the MR search. More extensive modifications sometimes help to solve difficult MR
cases. These include homology modelling (Schwedeet al., 2003; Fiser & Sali, 2003) and scan-
ning the possible conformations of the unknown protein using normal-mode analysis (NMA;
Suhre & Sanejouand, 2004).
Some of the advanced MR protocols cannot be clearly subdivided into a model preparation
stage and a purely crystallographic stage (Patterson search), as a partial structure is improved
using X-ray data and a better search model for subsequent rounds of Patterson search is pro-
duced.
For example, if there are many identical molecules in the asymmetric unit, it is not necessar-
ily the case that all of them produce an equally good contrastin the RF and TF. The molecules
with lower B-values, or those in favourable positions (e.g. making close contacts with their
symmetry mates) give higher contrast than others. Therefore it frequently happens that the first
few subunits are found easily, but the rest of the structure remains unidentified. In the example
described by Shanet al. (2005), the dimer formed by the first two subunits found was used to
25
find the remaining two dimers. A similar approach was used in (Zhou & Gong, 2004). This
strategy is implemented inMOLREP, which outputs the coordinates of a dimer once it is gener-
ated by previously placed search models. In addition, the relative positions of located subunits
or domains can be refined inP1 prior to the translation search (Yeates & Rini, 1990, see also
§2.4). In some cases, especially with high-resolution data available, the restrained refinement of
a partial structure can lead to determination of the complete structure (§2.5).
The failure of the first MR attempt can be due to conformational differences between the
search model and the target molecule. These differences canfrequently be described by domain
mobility. In such cases the crystal structure can be solved using separate domains as search
models. Also, prediction of conformational changes using NMA has been shown to be suc-
cessful (Suhre & Sanejouand, 2004). An interesting application of NMA to the solution of a
multidomain structure was reported by Jeonget al. (2006). In this work the modification of the
search model using NMA was guided by CRF peaks from individual domains.
Contemporary automated MR programs offer several built-inmodel-preparation function-
alities. The integration of model-preparation and Patterson superposition techniques in one
program has several advantages. Apart from convenience, such integration allows specific ad-
justment of the model-modification parameters for an efficient Patterson search. Moreover, the
weighting parameters for the RF and TF are more reliable if they are derived from the original
sequence and atomic coordinates of the homologous protein.MOLREPwas the first program
implementing such an integrated approach, which had provento be efficient and has recently
been implemented in several MR pipelines includingBALBES(Long et al., 2008),MrBUMP
(Keegan & Winn, 2008) andJSCG(Schwarzenbacheret al., 2008).
1.1.12 The use of NCS in MR
Although the expectation of the 1960’s of directly using NCSfor phasing was not fulfilled, the
methods utilising the NCS are an important ingredient of contemporary crystallographic soft-
ware. In many cases the orders and directions of NCS axes can be determined from diffraction
data using the SRF. Translational NCS can be detected using the native Patterson synthesis. A
comparison of experimental functions and functions generated from MR solutions is a good
validation tool. Two of many examples are given by Makinoet al. (2005b) and Keillor et al.
(2003).
The locked rotation function (LRF) and locked translation function (LTF) were developed
to build an oligomer from subunits in accordance with the SRF(Tong, 2001). The resulting
oligomer is used in a conventional TF search. NCS analysis has to be performed with special
care when NCS is used directly for structure determination (as in the LRF/LTF method). An
26
example of misleading SRF was, for example, reported by Asojo et al. (2003).
The point-group symmetry of an oligomer is an approximate symmetry and its deviation
from the exact symmetry may be too large for methods based on averaging of the Patterson
function (LRF/LTF) to be successful. The selection of the CRF peaks obeying NCS (CRANS;
Lilien et al., 2004) is free of this disadvantage. An interesting example, in which selection
criterion was based on the electron-microscopy reconstruction of a trimer was presented by
Trapaniet al. (2006). A technique in which no restrictions are imposed on the organisation of
the oligomer is the multi-copy search (Vagin & Teplyakov, 2000) implemented inMOLREP.
1.1.13 Exhaustive search
Conventional three-dimensional implementations of Patterson superposition methods suffer from
a low signal-to-noise ratio at the rotation-search step. Anexhaustive six-dimensional search at
low resolution enhanced by multi-start local optimisationagainst all data (SOMoRe; Jamrog
et al., 2003) or six-dimensional stochastic optimisation employing, for example, evolutionary
programming (EPMR; Kissingeret al., 1999) partially overcome this problem. Moreover, a
stochastic approach proved to be successful in solving a 23-dimensional MR problem (Queen
of Spades; Glykos & Kokkinidis, 2003). These methods are especially relevant in cases of low
solvent content (Nakaiet al., 2003).
As a variation of a six-dimensional search, the TF search canbe conducted for a comprehen-
sive sample of orientations of the search model (Sheriffet al., 1999). In general, an exhaustive
search over some parameters of the model can be combined withconventional MR. For exam-
ple, a one-parameter family of hexamers generated from a homologous trimer was tested by
conventional MR (Leonardet al., 2006,§2.3); all possible orientations of the idealised trans-
membrane helices forming symmetric helical bundles were generated and used in an MR search
(Stropet al., 2007).
In general, in the presence of NCS in the target crystal, the availability of a related oligomeric
search model makes it possible to reduce the number of dimensions of the search space. As
a result, the orientations (and in some cases the internal parameters) of the oligomer can be
scanned by a systematic exhaustive search using a TF and the CRF step can therefore be omitted.
Three examples of successful structure solution using an NCS-constrained exhaustive search
were reported in Isupov & Lebedev (2008).
1.1.14 Related methods
There are several other lines along which model-based phasing develops. Envelopes derived
from electron microscopy (EM) reconstruction or small angle scattering can be in principle lo-
27
cated in the unknown crystal structure and phases from the envelope can be extended to higher
resolution (Hao, 2006). Note that the MR search at low resolution is fast and thus an exhaus-
tive six dimensional search becomes possible (Liuet al., 2003). Phased rotation, conformation
and translation function was designed for automatic interpretation of electron density utilising
molecular fragments with some conformational freedom (NUT; Pavelcik, 2006).
1.1.15 MR and translational NCS
Crystal structures containing many independent moleculesin the asymmetric unit are, in gen-
eral, difficult to solve using a sequence of MR searches, as there is a significant decrease in
signal-to-noise ratio for an incomplete model. Even in a solvable case, a correct solution does
not necessarily show as the top score in each of the consecutive one-body searches and there-
fore sophisticated combinatorial algorithms and extensive calculations may be required (Phaser;
McCoyet al., 2007).
The use of LRF/LTF (§1.1.12) for oligomers with known point group symmetry substan-
tially reduces the number of required searches and correspondingly increases the signal-to-noise
ratio in each search. Another special case, in which a reduction in the number of searches is
possible, is translational NCS. The structure factors froma single molecule and from several
molecules in the same orientation differ by a coefficient that only depends on the relative posi-
tions of the molecules and the reflection indices. The relative positions can be determined from
strong non-origin peaks in the Patterson map. Therefore, a minor modification of the TF allows
simultaneous search for two or more molecules (Navazaet al., 1998). The efficiency of this
method is affected by small differences in the orientationsof the NCS-related molecules. How-
ever, the dispersion of the orientations can be estimated prior to the TF search and accounted for
in the weighting scheme during the TF search, as implementedin Phaser.
An even more specialised case is that of translational pseudosymmetry where the NCS trans-
lations are near simple fractions of the crystallographic translations. In these cases some zones
of reciprocal space are much weaker than others, and the crystal structure is very close to one
with a smaller unit cell. These structures are customarily solved in the smaller cell and then the
solution is expanded to the true cell. Navazaet al.(1998) discuss several examples, including the
crystal structure of ribonuclease Barnase fromBacillus amyloliquefaciens(Guillet et al., 1993)
with eight-fold translational pseudosymmetry. It was demonstrated that such structures are solv-
able by either of the two techniques, the simultaneous search for translational-pseudosymmetry
related molecules or the search in the smaller cell. The former method may seem more attrac-
tive as it uses in the TF search the whole data set including the sublattices of weak reflections.
However, the multi-model is unlikely to be sufficiently precise to reasonably match the weak
28
intensities because of both inaccuracy of the NCS-translation vector derived from the Patterson
function and the small differences in the orientations of the pseudotranslation-related molecules.
In both structure determination strategies, the adjustment of the model to fit the weak re-
flections is in effect postponed till the refinement stage. Anefficient approach to refinement in
the presence of translational pseudosymmetry is presentedby Oksanenet al. (2006). The first
step of the procedure includes rigid body refinements against the sublattice of weak intensities
alternated with restrained refinements against the sublattice of strong intensities. The second
step is restrained refinement against all data. In such a way the problem with relative weighting
of weak and strong intensities is avoided to accelerate the convergence.
The presence of translational pseudosymmetry not only requires specific search and refine-
ment protocols, but also imposes additional problems with the space group assignment. It was
likely that theP21 solution found by Oksanenet al. (2006) was a false origin solution (§4) and
therefore did not refine. As a result the correctP21 symmetry was disregarded and incorrect
P1 symmetry was assigned to the structure. Another kind of mistake, made and corrected, was
reported by Makinoet al.(2007). Thec-dimension of the unit cell in two trigonal polymorphs of
Bence Jones protein differed by a factor of two and belonged to the space groupsP3221 (c = 47
A) andP3121 (c = 94 A). The large-c structure was solved first and the same space group was
erroneously assumed for the small-c structure, which led the authors to report the likelihood of
twinning in the small-c form (Makinoet al., 2005a). Note that in this case the pseudosymmetry
space group also included the six-fold rotation complicating the analysis of twinning. A method
and a program for validation and correction of the space group assignment for general cases of
pseudosymmetry and twinning were developed and are presented in this thesis (§4.3).
29
1.2 NCS and twinning
1.2.1 Geometrical classification of twins
The ordered intergrowth of crystals is a phenomenon abundant in nature and widely used in in-
dustry. The mutual orientation of the individual crystals is defined by structural similarity and,
in particular, dimensional similarity of the unit cells of the intergrown crystals. In such edifices,
the composition plane, an interface between individual crystals has two-dimensional transla-
tional symmetry that ensures larger energy gain compared toa random interface. In this context,
the terms reticular control or lattice control of orientation are used. Distinction is typically made
between two- and three-dimensional lattice controls. If the intergrown crystals belong to differ-
ent species (phases), the phenomenon of their definite mutual orientation with two- and three
dimensional control is called epitaxy and syntaxy, respectively (Bailey et al., 1977). In syntacic
intergrowth, the composition surface can in principle be formed by any pair of corresponding
planes of the two individual crystals. However, the structural nature of the three-dimensional
control is still two-dimensional, as the mutual orientation of individual crystals is unambigu-
ously defined by any one of possible interface types and, in practice, one type of interface pre-
vails and define the joint growth of the adjacent individual crystals in the respective orientations
(Bonev, 1972).
A special case of oriented crystal intergrowth, twinning, is an association of individual crys-
tals of the same phase in different relative orientations. Any two individual crystals of a twin are
internally identical and symmetry related (by the twin operation) and it is therefore natural that
emphasis is put on symmetry relations in the description of twins. The dimensional similarity
is now the similarity between the lattice and its rotated or mirror copy, and the reticular control
of the orientation translates into the law of Mallard stating that the twin axis in a rotation twin
exactly coincides with the direction of a certain lattice row or is exactly perpendicular to a lattice
plane, and the twin plane in a mirror twin is exactly parallelto a lattice plane (Le Page, 2002).
The importance of symmetry in the description of twins is underlined by the high frequency
of twins with merohedry-holohedry relation between the point symmetry of the crystal and that
of the crystal lattice. A symmetry operation missing in the merohedral point group of the crystal
but present in corresponding holohedral group (of the lattice) is a potential twinning operation.
For twins generated by such an operation the lattices of individual crystals in their twin orienta-
tions exactly coincide.
For twins by pseudomerohedry the twin operation does not belong to the holohedral group of
the crystal and, in general, the symmetry relation between the individual lattices is approximate.
The mismatch between the lattice and its transformed copy ischaracterised by an obliquity an-
gle,ω. In the case of a rotation twin the obliquity angle is defined as the angle between the plane
30
perpendicular to the twin axis, which is in general non-rational, and the closest crystallographic
plane. In the case of a mirror twin the obliquity angle is the angle between (non-rational) axis
perpendicular to the twin plane and the crystallographic direction closest to it.
In the more general case, twinning by reticular (pseudo)merohedry, the twin operation (ap-
proximately) matches a sublattice of an individual crystaland its rotated or mirror copy, but not
the whole lattice. An additional parameter characterisingsuch a twin is the twin indexn. This
integer number equals the number of all lattice nodes divided by the number of nodes overlap-
ping under the action of twin operation. The particular caseof casen = 1 is not included, as it
corresponds to twinning by (pseudo)merohedry.
Two macromolecular twins by reticular pseudomerohedry arediscussed in this thesis. These
are the PDB entries 1lbs (sixth example in§1.3.4; see also the end of3.2.5) and 2w11. The latter
case is discussed in detail in3.5 and, in particular, the calculation of twin index and obliquity
angle for this twin are given in3.5.4.
The only physical constraint on the twin lattice (an approximately invariant sublattice of
the individual lattice) is that imposed by dimensional similarity of the lattices at the compo-
sition plane. This condition alone does not impose any requirement on the three-dimensional
symmetry of the twin lattice, exact or approximate. The use of lattice-pseudosymmetry-based
description of twinning might therefore seem unnatural, were it not for an empirical observation
of statistical nature that a large obliquity angle and twin index are unfavourable for the occur-
rence of a twin. Le Page (2002) suggests an upper limit of six for the twin index and of six
degrees for obliquity angle, although twins with exceptionally high index are known (Hahn &
Klapper, 2003, see also§3.5).
The effect of twin lattice symmetry on the diffraction pattern of twinned crystals is empha-
sised in a coarser classification (Giacovazzoet al., 1992), in which TLS-twins are opposed to
TLQS-twins, and TLS and TLQS stand for twin-lattice symmetry and twin-lattice quasisymme-
try, respectively. Accordingly, TLS twins include twins bymerohedry and twins by reticular
merohedry, in which the reflections from two individual crystals overlap exactly in everyn-th
plane of the reciprocal space (n is the twin index) and TLQS twins include twins by pseu-
domerohedry and reticular pseudomerohedry, in which the overlap in everyn-th plane is partial.
However, it makes sense to distinguish betweenn = 1 andn> 1 as the former case entails more
problems for structure solution and refinement and therefore the previously described classifica-
tion by Friedel (1926) is typically used in macromolecular crystallography.
A finer symmetry-based classification is proposed by Nespolo& Ferraris (2004). In particu-
lar, the distinction is made between twins by pseudomerohedry with zero and non-zero obliquity
angle. The former case is characterised by an exact (within experimental error) accidental met-
ric symmetry and is therefore termed as twinning by metric merohedry (see also Flack, 1987).
31
In fact, this definition is structurally justified as it applies to a special morphology of twinned
crystals in which the very presence of twinning implies exact lattice symmetry relative to a twin
operation, which does not belong to the holohedry of the crystal (§3.3, §3.4). Of course, the
constraints on unit cell parameters are not a consequence oftwinning, but of certain structural
features of individual crystals, which are only emphasisedby the presence of twinning by metric
merohedry.
The geometrical (twin-lattice symmetry) classification oftwins emphasises the most general
features of a given twin and imposes restrictions on its possible morphology. However the
definition of twinning becomes vague in special cases of single-phase morphologies. Millward
et al.(1983) describe an oriented intergrowth of two individual crystals of the same phase related
by 90o rotation, in which the composition plane is parallel to the (010)-plane of one individual
crystal and to the (001)-plane of the other, the two crystallographic planes being independent
relative to the crystal symmetry. This intergrowth is a twinfrom the point of view of lattice
symmetry, but it was not recognised as a true twin from the point of view of its morphology
owing to the lack of chemical integrity at the composition plane. In this case the composition
plane is not symmetric relative to any of the potential twin operations and this might be another
argument for avoiding the term twin.
1.2.2 Determination of approximate lattice symmetries
The geometrical analysis of the lattice is nevertheless sufficient for the majority of structural
studies, in which the structure of an individual crystal is of interest and twinning is an unwanted
factor which must be taken into account to avoid gross errorsin the structure determination and
refinement. In such studies no distinction is needed betweentwinning and, for example, the
intergrowth of two individual crystals in twin orientations as in the above example by Millward
et al. (1983).
Given the X-ray data for a single lattice, the detection of twinning starts from prediction
of possible twin operations from the unit cell parameters and the point symmetry of the data.
Le Page (2002) proposed an algorithm applicable for a general case of twinning by (reticular)
(pseudo)merohedry. A more specialised technique for identifying data sets where the unit-cell
parameters and space group can allow twinning by (pseudo)merohedry and finding the possible
twin operations is described by Flack (1987).
Twinning by reticular (pseudo)merohedry can usually be handled in the later stages of the
structure refinement. It can be deduced from the presence of non-origin peaks in the Patterson
map, which are not accounted for by translational NCS (§3.5). In a more regular approach,
possible twinning laws and associated peaks in the Patterson map (or modulation of intensities)
32
owing to partial overlap of reflections can be predicted fromthe unit cell parameters, and the hy-
pothesised twinning laws can be accepted or rejected based on their presence in the experimental
data.
Twinning by merohedry, metric merohedry or pseudomerohedry with small obliquity an-
gle is the most unfavourable case for structure determination. In the first two cases a complete
overlap of twin related reflections occurs, and in the third case the intensities of partially over-
lapped reflections are likely to be jointly integrated during the processing of diffraction images.
In a frequent case of approximately equal volumes of individual crystals (perfect twinning),
the apparent symmetry of the data is higher than the true point group symmetry of the individ-
ual crystals and therefore wrong symmetry assignment is possible that results in problems with
the structure determination. Similarly to twinning by reticular (pseudo)merohedry, the detec-
tion of twinning by (pseudo)merohedry includes lattice symmetry analysis to predict possible
twin operation(s) and data analysis to test the predictions. In contrast to twinning by reticular
(pseudo)merohedry, twinning by (pseudo)merohedry does not produce an alternative lattice(s)
and does not cause the modulation of intensities, which could be detected based on the mean
values of intensities in a series of parallel planes in reciprocal space. Therefore several twin tests
were developed that utilise statistics that are finer than mean intensity.
1.2.3 Perfect twinning test
For the rest of this section, the term twinning means twinning by (pseudo)merohedry with two
individual crystals (twinning by hemihedry) and the crystal structure is assumed to be non-
centrosymmetric, the case relevant to macromolecular crystallography.
Given an X-ray data set, the three following questions related to twinning are to be answered.
(i) Are the X-ray data twinned? If so, (ii) what is the twinning fractionα, the relative size of
smaller twin domain, and (iii) what is the true symmetry of anindividual crystal?
Let assume that the data are “ideal”, that is, the experimental error can be neglected and
the structure factors of the twin-related reflections are not correlated. In this case, the first two
questions and, provisionally, the third question may be answered using the method proposed
by Rees (1980), in which the experimental distributions of normalised intensities are compared
with the theoretical distributions derived from the Wilsondistribution (Wilson, 1949).
Rees derived a simple analytical expression for the cumulative distribution of the normalised
intensityZ for acentric reflections and variable twinning fractionα,
P(Z) = 1−(1− α) exp
(
− Z1− α
)
− α exp
(
−Zα
)
1− 2α, (6)
and used numerical integration to tabulate such a distribution for centric reflections. (The latter
33
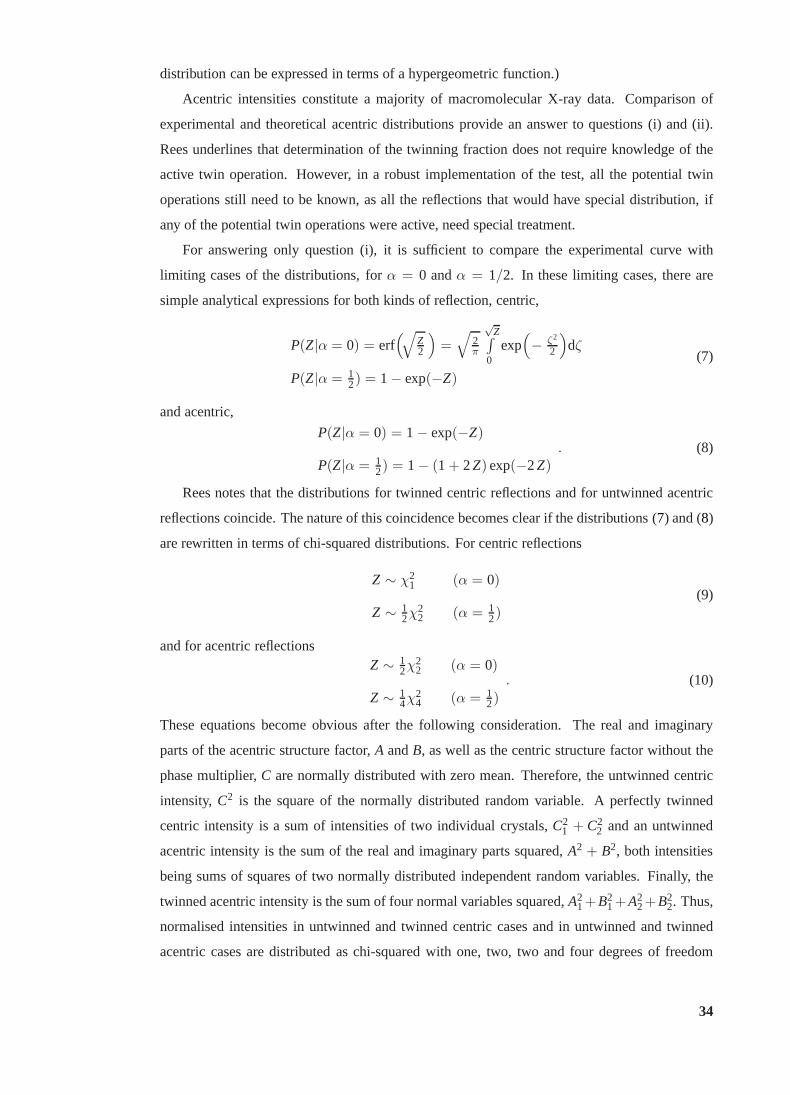
distribution can be expressed in terms of a hypergeometric function.)
Acentric intensities constitute a majority of macromolecular X-ray data. Comparison of
experimental and theoretical acentric distributions provide an answer to questions (i) and (ii).
Rees underlines that determination of the twinning fraction does not require knowledge of the
active twin operation. However, in a robust implementationof the test, all the potential twin
operations still need to be known, as all the reflections thatwould have special distribution, if
any of the potential twin operations were active, need special treatment.
For answering only question (i), it is sufficient to compare the experimental curve with
limiting cases of the distributions, forα = 0 andα = 1/2. In these limiting cases, there are
simple analytical expressions for both kinds of reflection,centric,
P(Z|α = 0) = erf(√
Z2
)
=√
2π
√Z∫
0exp(
− ζ2
2
)
dζ
P(Z|α = 12) = 1− exp(−Z)
(7)
and acentric,
P(Z|α = 0) = 1− exp(−Z)
P(Z|α = 12) = 1− (1 + 2Z) exp(−2Z)
. (8)
Rees notes that the distributions for twinned centric reflections and for untwinned acentric
reflections coincide. The nature of this coincidence becomes clear if the distributions (7) and (8)
are rewritten in terms of chi-squared distributions. For centric reflections
Z ∼ χ21 (α = 0)
Z ∼ 12χ
22 (α = 1
2)(9)
and for acentric reflectionsZ ∼ 1
2χ22 (α = 0)
Z ∼ 14χ
24 (α = 1
2). (10)
These equations become obvious after the following consideration. The real and imaginary
parts of the acentric structure factor,A andB, as well as the centric structure factor without the
phase multiplier,C are normally distributed with zero mean. Therefore, the untwinned centric
intensity,C2 is the square of the normally distributed random variable. Aperfectly twinned
centric intensity is a sum of intensities of two individual crystals,C21 + C2
2 and an untwinned
acentric intensity is the sum of the real and imaginary partssquared,A2 + B2, both intensities
being sums of squares of two normally distributed independent random variables. Finally, the
twinned acentric intensity is the sum of four normal variables squared,A21+B2
1+A22+B2
2. Thus,
normalised intensities in untwinned and twinned centric cases and in untwinned and twinned
acentric cases are distributed as chi-squared with one, two, two and four degrees of freedom
34
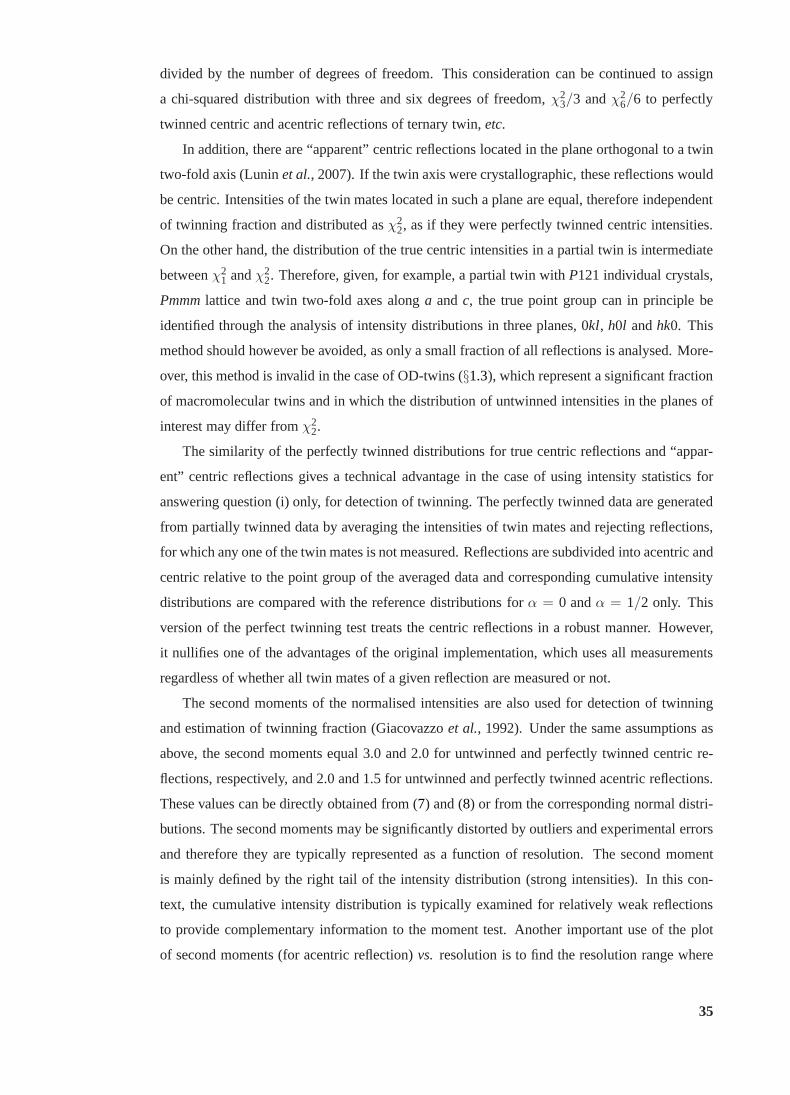
divided by the number of degrees of freedom. This consideration can be continued to assign
a chi-squared distribution with three and six degrees of freedom,χ23/3 andχ2
6/6 to perfectly
twinned centric and acentric reflections of ternary twin,etc.
In addition, there are “apparent” centric reflections located in the plane orthogonal to a twin
two-fold axis (Luninet al., 2007). If the twin axis were crystallographic, these reflections would
be centric. Intensities of the twin mates located in such a plane are equal, therefore independent
of twinning fraction and distributed asχ22, as if they were perfectly twinned centric intensities.
On the other hand, the distribution of the true centric intensities in a partial twin is intermediate
betweenχ21 andχ2
2. Therefore, given, for example, a partial twin withP121 individual crystals,
Pmmmlattice and twin two-fold axes alonga andc, the true point group can in principle be
identified through the analysis of intensity distributionsin three planes, 0kl, h0l andhk0. This
method should however be avoided, as only a small fraction ofall reflections is analysed. More-
over, this method is invalid in the case of OD-twins (§1.3), which represent a significant fraction
of macromolecular twins and in which the distribution of untwinned intensities in the planes of
interest may differ fromχ22.
The similarity of the perfectly twinned distributions for true centric reflections and “appar-
ent” centric reflections gives a technical advantage in the case of using intensity statistics for
answering question (i) only, for detection of twinning. Theperfectly twinned data are generated
from partially twinned data by averaging the intensities oftwin mates and rejecting reflections,
for which any one of the twin mates is not measured. Reflections are subdivided into acentric and
centric relative to the point group of the averaged data and corresponding cumulative intensity
distributions are compared with the reference distributions forα = 0 andα = 1/2 only. This
version of the perfect twinning test treats the centric reflections in a robust manner. However,
it nullifies one of the advantages of the original implementation, which uses all measurements
regardless of whether all twin mates of a given reflection aremeasured or not.
The second moments of the normalised intensities are also used for detection of twinning
and estimation of twinning fraction (Giacovazzoet al., 1992). Under the same assumptions as
above, the second moments equal 3.0 and 2.0 for untwinned andperfectly twinned centric re-
flections, respectively, and 2.0 and 1.5 for untwinned and perfectly twinned acentric reflections.
These values can be directly obtained from (7) and (8) or from the corresponding normal distri-
butions. The second moments may be significantly distorted by outliers and experimental errors
and therefore they are typically represented as a function of resolution. The second moment
is mainly defined by the right tail of the intensity distribution (strong intensities). In this con-
text, the cumulative intensity distribution is typically examined for relatively weak reflections
to provide complementary information to the moment test. Another important use of the plot
of second moments (for acentric reflection)vs. resolution is to find the resolution range where
35
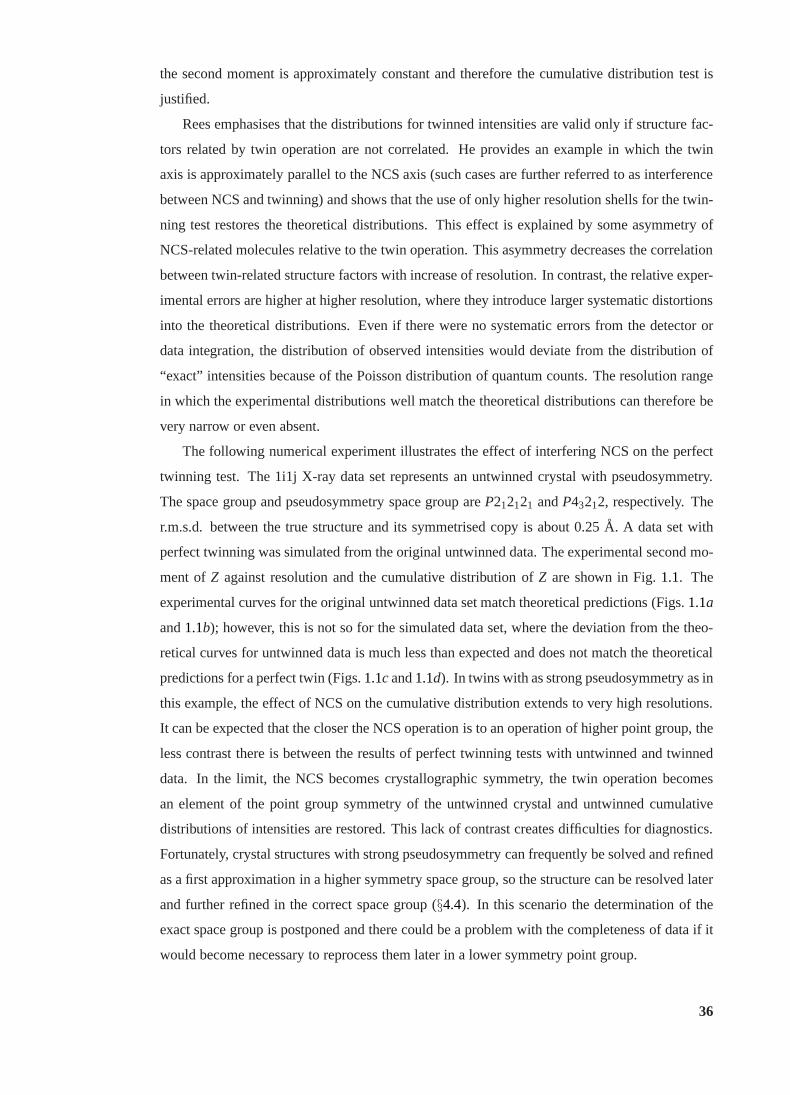
the second moment is approximately constant and therefore the cumulative distribution test is
justified.
Rees emphasises that the distributions for twinned intensities are valid only if structure fac-
tors related by twin operation are not correlated. He provides an example in which the twin
axis is approximately parallel to the NCS axis (such cases are further referred to as interference
between NCS and twinning) and shows that the use of only higher resolution shells for the twin-
ning test restores the theoretical distributions. This effect is explained by some asymmetry of
NCS-related molecules relative to the twin operation. Thisasymmetry decreases the correlation
between twin-related structure factors with increase of resolution. In contrast, the relative exper-
imental errors are higher at higher resolution, where they introduce larger systematic distortions
into the theoretical distributions. Even if there were no systematic errors from the detector or
data integration, the distribution of observed intensities would deviate from the distribution of
“exact” intensities because of the Poisson distribution ofquantum counts. The resolution range
in which the experimental distributions well match the theoretical distributions can therefore be
very narrow or even absent.
The following numerical experiment illustrates the effectof interfering NCS on the perfect
twinning test. The 1i1j X-ray data set represents an untwinned crystal with pseudosymmetry.
The space group and pseudosymmetry space group areP212121 andP43212, respectively. The
r.m.s.d. between the true structure and its symmetrised copy is about 0.25A. A data set with
perfect twinning was simulated from the original untwinneddata. The experimental second mo-
ment ofZ against resolution and the cumulative distribution ofZ are shown in Fig.1.1. The
experimental curves for the original untwinned data set match theoretical predictions (Figs.1.1a
and1.1b); however, this is not so for the simulated data set, where the deviation from the theo-
retical curves for untwinned data is much less than expectedand does not match the theoretical
predictions for a perfect twin (Figs.1.1cand1.1d). In twins with as strong pseudosymmetry as in
this example, the effect of NCS on the cumulative distribution extends to very high resolutions.
It can be expected that the closer the NCS operation is to an operation of higher point group, the
less contrast there is between the results of perfect twinning tests with untwinned and twinned
data. In the limit, the NCS becomes crystallographic symmetry, the twin operation becomes
an element of the point group symmetry of the untwinned crystal and untwinned cumulative
distributions of intensities are restored. This lack of contrast creates difficulties for diagnostics.
Fortunately, crystal structures with strong pseudosymmetry can frequently be solved and refined
as a first approximation in a higher symmetry space group, so the structure can be resolved later
and further refined in the correct space group (§4.4). In this scenario the determination of the
exact space group is postponed and there could be a problem with the completeness of data if it
would become necessary to reprocess them later in a lower symmetry point group.
36
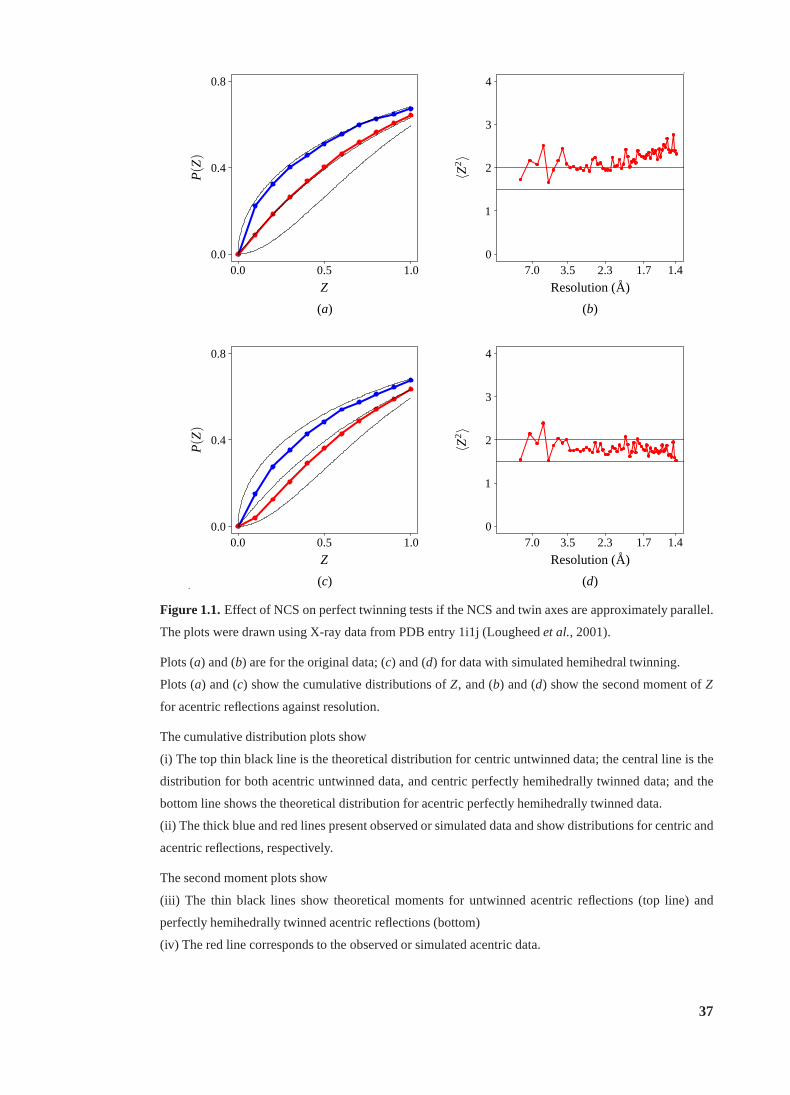
0.00.0
0.4
0.5
0.8
1.0
Z
P(Z
)
0
1
2
3
4
1.41.72.33.57.0
Resolution(A)
〈Z2〉
0.00.0
0.4
0.5
0.8
1.0
Z
P(Z
)
0
1
2
3
4
1.41.72.33.57.0
Resolution(A)
〈Z2〉
(a) (b)
(c) (d).
.
Figure 1.1.Effect of NCS on perfect twinning tests if the NCS and twin axes are approximately parallel.
The plots were drawn using X-ray data from PDB entry 1i1j (Lougheedet al., 2001).
Plots (a) and (b) are for the original data; (c) and (d) for data with simulated hemihedral twinning.
Plots (a) and (c) show the cumulative distributions ofZ, and (b) and (d) show the second moment ofZ
for acentric reflections against resolution.
The cumulative distribution plots show
(i) The top thin black line is the theoretical distribution for centric untwinned data; the central line is the
distribution for both acentric untwinned data, and centricperfectly hemihedrally twinned data; and the
bottom line shows the theoretical distribution for acentric perfectly hemihedrally twinned data.
(ii) The thick blue and red lines present observed or simulated data and show distributions for centric and
acentric reflections, respectively.
The second moment plots show
(iii) The thin black lines show theoretical moments for untwinned acentric reflections (top line) and
perfectly hemihedrally twinned acentric reflections (bottom)
(iv) The red line corresponds to the observed or simulated acentric data.
37
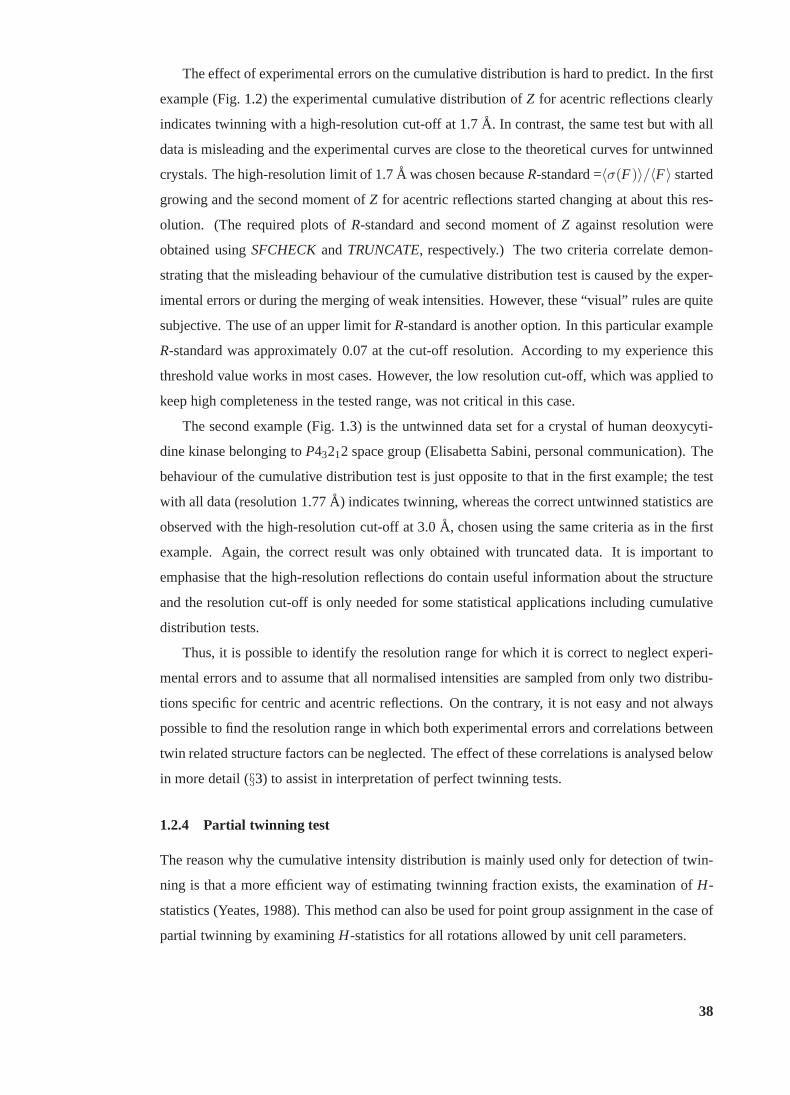
The effect of experimental errors on the cumulative distribution is hard to predict. In the first
example (Fig.1.2) the experimental cumulative distribution ofZ for acentric reflections clearly
indicates twinning with a high-resolution cut-off at 1.7A. In contrast, the same test but with all
data is misleading and the experimental curves are close to the theoretical curves for untwinned
crystals. The high-resolution limit of 1.7A was chosen becauseR-standard =〈σ(F)〉/〈F〉 started
growing and the second moment ofZ for acentric reflections started changing at about this res-
olution. (The required plots ofR-standard and second moment ofZ against resolution were
obtained usingSFCHECKandTRUNCATE, respectively.) The two criteria correlate demon-
strating that the misleading behaviour of the cumulative distribution test is caused by the exper-
imental errors or during the merging of weak intensities. However, these “visual” rules are quite
subjective. The use of an upper limit forR-standard is another option. In this particular example
R-standard was approximately 0.07 at the cut-off resolution. According to my experience this
threshold value works in most cases. However, the low resolution cut-off, which was applied to
keep high completeness in the tested range, was not criticalin this case.
The second example (Fig.1.3) is the untwinned data set for a crystal of human deoxycyti-
dine kinase belonging toP43212 space group (Elisabetta Sabini, personal communication). The
behaviour of the cumulative distribution test is just opposite to that in the first example; the test
with all data (resolution 1.77A) indicates twinning, whereas the correct untwinned statistics are
observed with the high-resolution cut-off at 3.0A, chosen using the same criteria as in the first
example. Again, the correct result was only obtained with truncated data. It is important to
emphasise that the high-resolution reflections do contain useful information about the structure
and the resolution cut-off is only needed for some statistical applications including cumulative
distribution tests.
Thus, it is possible to identify the resolution range for which it is correct to neglect experi-
mental errors and to assume that all normalised intensitiesare sampled from only two distribu-
tions specific for centric and acentric reflections. On the contrary, it is not easy and not always
possible to find the resolution range in which both experimental errors and correlations between
twin related structure factors can be neglected. The effectof these correlations is analysed below
in more detail (§3) to assist in interpretation of perfect twinning tests.
1.2.4 Partial twinning test
The reason why the cumulative intensity distribution is mainly used only for detection of twin-
ning is that a more efficient way of estimating twinning fraction exists, the examination ofH-
statistics (Yeates, 1988). This method can also be used for point group assignment in the case of
partial twinning by examiningH-statistics for all rotations allowed by unit cell parameters.
38
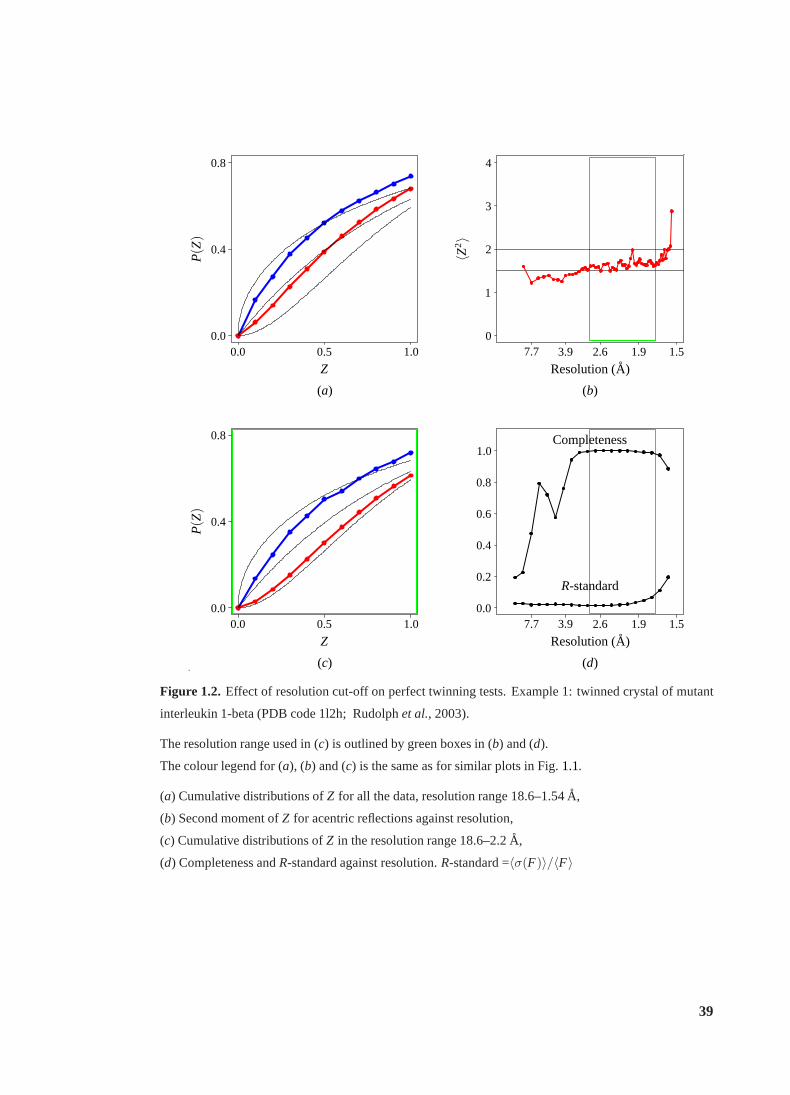
0.00.0
0.4
0.5
0.8
1.0
Z
P(Z
)
0
1
2
3
4
1.51.92.63.97.7
Resolution(A)
〈Z2〉
0.00.0
0.4
0.5
0.8
1.0
Z
P(Z
)
0.0
0.2
0.4
0.6
0.8
1.0
1.51.92.63.97.7
Resolution(A)
Completeness
R-standard
(a) (b)
(c) (d).
.
Figure 1.2. Effect of resolution cut-off on perfect twinning tests. Example 1: twinned crystal of mutant
interleukin 1-beta (PDB code 1l2h; Rudolphet al., 2003).
The resolution range used in (c) is outlined by green boxes in (b) and (d).
The colour legend for (a), (b) and (c) is the same as for similar plots in Fig.1.1.
(a) Cumulative distributions ofZ for all the data, resolution range 18.6–1.54A,
(b) Second moment ofZ for acentric reflections against resolution,
(c) Cumulative distributions ofZ in the resolution range 18.6–2.2A,
(d) Completeness andR-standard against resolution.R-standard =〈σ(F)〉/〈F〉
39
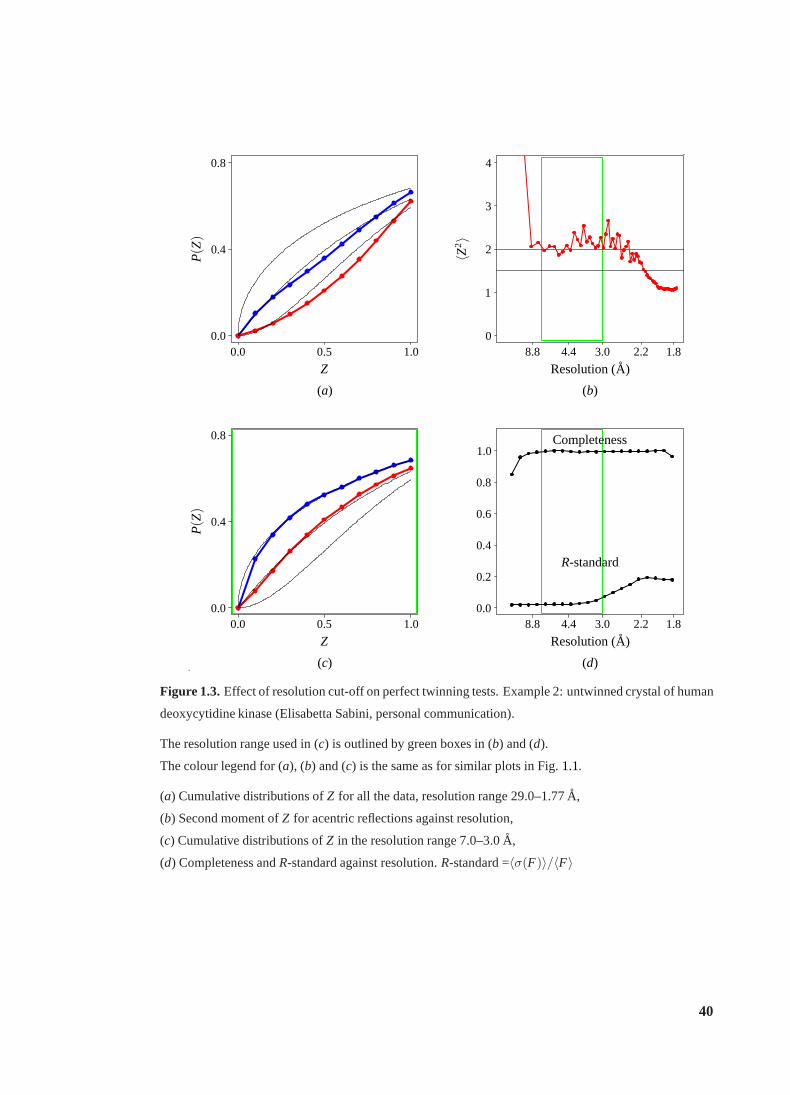
0.00.0
0.4
0.5
0.8
1.0
Z
P(Z
)
0
1
2
3
4
1.82.23.04.48.8
Resolution(A)
〈Z2〉
0.00.0
0.4
0.5
0.8
1.0
Z
P(Z
)
0.0
0.2
0.4
0.6
0.8
1.0
1.82.23.04.48.8
Resolution(A)
Completeness
R-standard
(a) (b)
(c) (d).
.
Figure 1.3.Effect of resolution cut-off on perfect twinning tests. Example 2: untwinned crystal of human
deoxycytidine kinase (Elisabetta Sabini, personal communication).
The resolution range used in (c) is outlined by green boxes in (b) and (d).
The colour legend for (a), (b) and (c) is the same as for similar plots in Fig.1.1.
(a) Cumulative distributions ofZ for all the data, resolution range 29.0–1.77A,
(b) Second moment ofZ for acentric reflections against resolution,
(c) Cumulative distributions ofZ in the resolution range 7.0–3.0A,
(d) Completeness andR-standard against resolution.R-standard =〈σ(F)〉/〈F〉
40
Assuming “ideal” conditions,viz. negligible experimental errors and uncorrelated structure
factors of the twin mates, consider the joint probability distribution of normalised intensities of
two twin-related acentric reflections,
dP(I1, I2) = exp(−I1 − I2) dI1 dI2, 0< I1, I2 <∞. (11)
The intensitiesI1 andI2 are independent random variables, but this is not so for twinned inten-
sitiesJ1 = (1− α)I1 + αI2
J2 = (1− α)I2 + αI1(12)
unless the twinning fractionα is zero.
The transformation of random variables
H = |J1 − J2|/(J1 + J2), 0< H < 1− 2α
Z = (J1 + J2)/2, 0< Z <∞
S= sign(J1 − J2), S∈ {−1, 1}
(13)
can be inverted and therefore the random variablesH, Z, Scompletely describe the probabilistic
model. The distribution of these variables immediately follows from the distribution ofI1 and
I2,
dP(H,Z,S) =2
1− 2αexp(−2Z) Z dZ dH. (14)
The random variablesS, H andZ are independent. RealisationsS = −1 andS= 1 are equally
possible,Z is distributed asχ24/4 according to (10) andH is distributed uniformly from 0 to
1− 2α,
dP(H) = (1− 2α)−1 dH. (15)
The dependence onα only enters the distribution of random variableH, which is therefore a
sufficient statistic (Stuartet al., 1999) for the twinning fractionα. Formally, the condition of
sufficiency ofH for α can be written asP(J1, J2|H, α) = P(J1, J2|H) and follows from the
independence ofZ, SandH and (15). This means that the random variableH contains all the
information aboutα.
Experimental data can be transformed similarly and represented in terms of the mean inten-
sities of twin mates and their absolute differences. The experimental distribution of normalised
mean intensities is suitable for answering question (i), for detection of twinning. In turn, the
distribution ofH is most suitable for estimation of the twinning fraction, question (ii). In addi-
tion, the latter can be used for point group assignment, question (iii) provided that the twinning
is not perfect, as the distribution ofH does not distinguish between perfect twinning operation
and crystal symmetry operation.
41
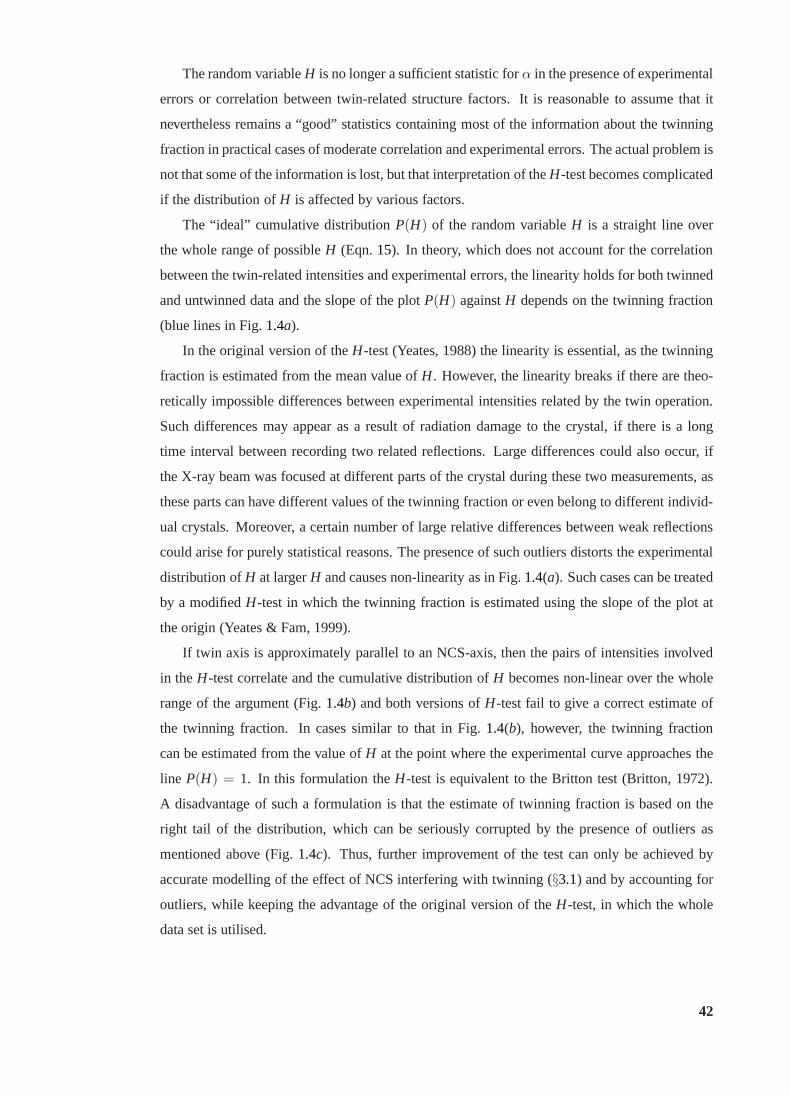
The random variableH is no longer a sufficient statistic forα in the presence of experimental
errors or correlation between twin-related structure factors. It is reasonable to assume that it
nevertheless remains a “good” statistics containing most of the information about the twinning
fraction in practical cases of moderate correlation and experimental errors. The actual problem is
not that some of the information is lost, but that interpretation of theH-test becomes complicated
if the distribution ofH is affected by various factors.
The “ideal” cumulative distributionP(H) of the random variableH is a straight line over
the whole range of possibleH (Eqn.15). In theory, which does not account for the correlation
between the twin-related intensities and experimental errors, the linearity holds for both twinned
and untwinned data and the slope of the plotP(H) againstH depends on the twinning fraction
(blue lines in Fig.1.4a).
In the original version of theH-test (Yeates, 1988) the linearity is essential, as the twinning
fraction is estimated from the mean value ofH. However, the linearity breaks if there are theo-
retically impossible differences between experimental intensities related by the twin operation.
Such differences may appear as a result of radiation damage to the crystal, if there is a long
time interval between recording two related reflections. Large differences could also occur, if
the X-ray beam was focused at different parts of the crystal during these two measurements, as
these parts can have different values of the twinning fraction or even belong to different individ-
ual crystals. Moreover, a certain number of large relative differences between weak reflections
could arise for purely statistical reasons. The presence ofsuch outliers distorts the experimental
distribution ofH at largerH and causes non-linearity as in Fig.1.4(a). Such cases can be treated
by a modifiedH-test in which the twinning fraction is estimated using the slope of the plot at
the origin (Yeates & Fam, 1999).
If twin axis is approximately parallel to an NCS-axis, then the pairs of intensities involved
in theH-test correlate and the cumulative distribution ofH becomes non-linear over the whole
range of the argument (Fig.1.4b) and both versions ofH-test fail to give a correct estimate of
the twinning fraction. In cases similar to that in Fig.1.4(b), however, the twinning fraction
can be estimated from the value ofH at the point where the experimental curve approaches the
line P(H) = 1. In this formulation theH-test is equivalent to the Britton test (Britton, 1972).
A disadvantage of such a formulation is that the estimate of twinning fraction is based on the
right tail of the distribution, which can be seriously corrupted by the presence of outliers as
mentioned above (Fig.1.4c). Thus, further improvement of the test can only be achievedby
accurate modelling of the effect of NCS interfering with twinning (§3.1) and by accounting for
outliers, while keeping the advantage of the original version of theH-test, in which the whole
data set is utilised.
42
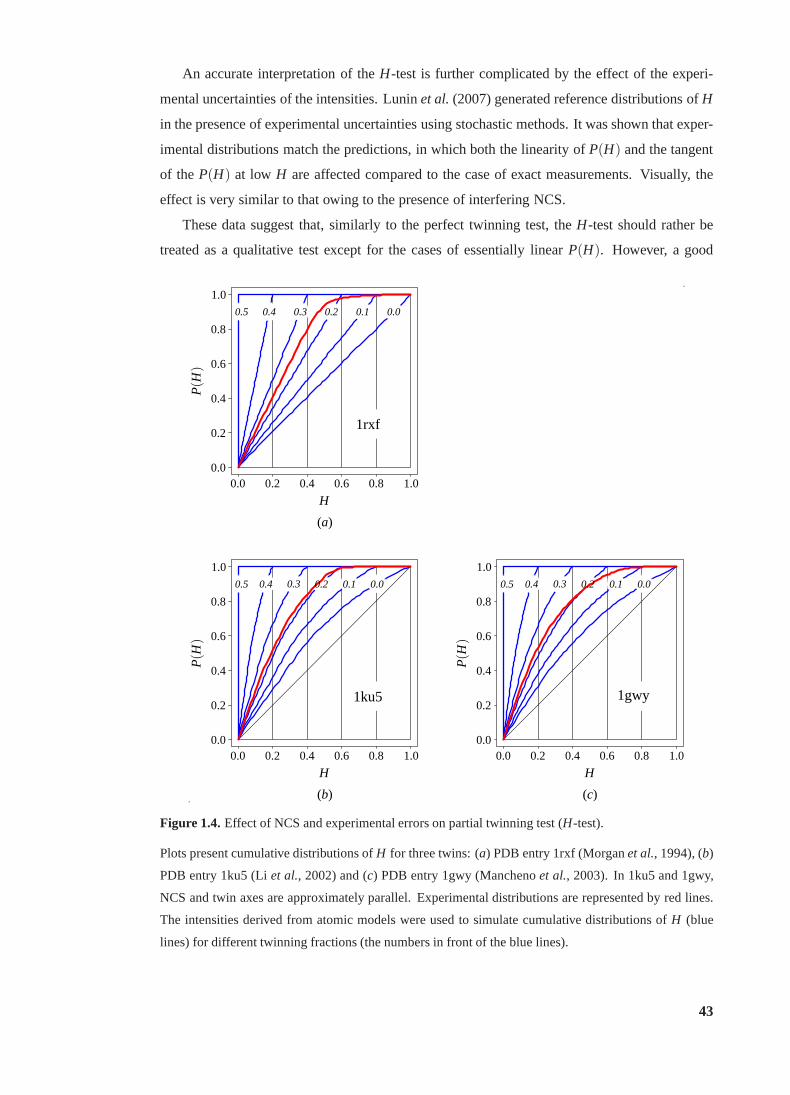
An accurate interpretation of theH-test is further complicated by the effect of the experi-
mental uncertainties of the intensities. Luninet al.(2007) generated reference distributions ofH
in the presence of experimental uncertainties using stochastic methods. It was shown that exper-
imental distributions match the predictions, in which boththe linearity ofP(H) and the tangent
of the P(H) at low H are affected compared to the case of exact measurements. Visually, the
effect is very similar to that owing to the presence of interfering NCS.
These data suggest that, similarly to the perfect twinning test, theH-test should rather be
treated as a qualitative test except for the cases of essentially linear P(H). However, a good
1rxf
0.00.10.20.30.40.5
0.00.0
0.2
0.2
0.4
0.4
0.6
0.6
0.8
0.8
1.0
1.0
H
P(H
)
1ku5
0.00.10.20.30.40.5
0.00.0
0.2
0.2
0.4
0.4
0.6
0.6
0.8
0.8
1.0
1.0
H
P(H
)
1gwy
0.00.10.20.30.40.5
0.00.0
0.2
0.2
0.4
0.4
0.6
0.6
0.8
0.8
1.0
1.0
H
P(H
)
(a)
(b) (c).
.
Figure 1.4.Effect of NCS and experimental errors on partial twinning test (H-test).
Plots present cumulative distributions ofH for three twins: (a) PDB entry 1rxf (Morganet al., 1994), (b)
PDB entry 1ku5 (Liet al., 2002) and (c) PDB entry 1gwy (Manchenoet al., 2003). In 1ku5 and 1gwy,
NCS and twin axes are approximately parallel. Experimentaldistributions are represented by red lines.
The intensities derived from atomic models were used to simulate cumulative distributions ofH (blue
lines) for different twinning fractions (the numbers in front of the blue lines).
43
estimate of the twinning fraction is only important for experimental phasing, which requires
an accurate detwinning. For MR structure solution detwinning is not needed and the twinning
fraction is estimated along with atomic parameters during refinement. However, understand-
ing of various peculiarities in the behaviour ofP(H) can be important for correct point group
assignment.
1.2.5 Refinement using twinned data
The perfect twinning test and partial twinning tests discussed above are important tools in the
preliminary analysis of the X-ray data. These help avoid errors in space group assignment
and guide detwinning, which is less relevant for MR but is important for experimental phasing
using twinned data. However, joint refinement of atomic model and twinning fraction remains
the ultimate twinning test (Herbst-Irmer & Sheldrick, 1998). In addition, the refinement of
twinning fraction for racemic twins (Flack, 1983) in the presence of anomalous signal is a tool
for establishing the true enantiomorph in small molecule structures.
The programSHELXL(Sheldrick, 2008) provides all necessary facilities for such refine-
ments and handles both twins by (pseudo)merohedry and by reticular merohedry (Herbst-Irmer
& Sheldrick, 1998) including obverse/reverse twins (Herbst-Irmer & Sheldrick, 2002). Its flex-
ibility in defining restraints and constraints allows an accurate refinement of pseudosymmetric
twins (Muller et al., 2006).
Specialised macromolecular refinements in CNS (Brungeret al., 1998) andphenix.refine
(Afonine et al., 2005) implementing the FFT (Ten Eyck, 1977) are faster and therefore more
suitable thanSHELXLfor twinned macromolecular crystals with very large asymmetric units.
In the case of twinned data, all these programs use least squares refinement against intensity
target. The twin refinement has recently been implemented inREFMAC(Murshudovet al.,
1997) which strictly follows the Bayesian paradigm and therefore uses a marginal likelihood
target (Garib Murshudov, personal communication). In addition, the internal representation of
X-ray data inREFMACmakes it possible to handle twins by reticular merohedry.
44
1.3 OD structures
Partially disordered structures (including twins) and series of polymorphs are frequently com-
posed of geometrically and chemically equivalent layers; Dornberger-Schiff (1956) introduced
the term OD-structure (OD stands for “order-disorder” to indicate either actual or potential dis-
order) to describe this important particular set of crystalstructures.
It must be underlined that a single crystal can be an OD-structure. In such crystals there is
nothing special about the diffraction of X-rays or structure solution. The concept of OD-family
and corresponding formalism is used in the X-ray analysis ofa series of polymorphs given
the structure of one of them. Such an application is not very important for macromolecular
crystallography, where the structure of a biomolecule is ofinterest but not its crystallographic
environment. What is interesting about OD-structures fromthe point of view of macromolecular
crystallography is the description and prediction of crystal disorder including twinning. In any
OD-structure there is a potential for a well-defined type of one-dimensional disorder. Thus, on
one hand, one can expect a higher frequency of twinning in OD-structures than in fully ordered
structures (defined below in§1.3.1), but on the other hand, the morphology of twinning becomes
evident from the structure of an individual crystal. Another specific feature of an OD-twin is that
the twin operations belong to the point group symmetry of theOD-layer and therefore there is a
strong correlation between complex structure factors of reflections related by the potential twin
operation. As this was previously discussed in§1.2.3and§1.2.4, such a correlation complicates
the detection of twinning and therefore the analysis of OD-structures from this point of view is
quite important (§3.4and§3.5).
A partially disordered OD structure can be considered as a limiting case of an OD-twin with
small sizes of individual crystals. Thus the above remarks on OD-twins are also relevant to par-
tially disordered OD-structures. In addition, the small sizes of the ordered domains result in a
significant diffuse scattering of X-rays and, as the disorder in OD-structures is one-dimensional,
the reflections have streaks along one direction, in which translational symmetry is only local. In
practical terms, the one-dimensional partial disorder leaves more chances for structure solution
compared to two- or three-dimensional disorder. Moreover,partially disordered OD-structures
can be considered in the first approximation as twinned structures and diffuse features in the im-
ages can be ignored, as automatically happens during standard data processing. More accurate
modelling of the crystal diffraction requires an analysis of the interference between adjacent or-
dered domains, but in practice this is only done when it is absolutely necessary for interpretation
of the diffraction data (Examples 3 and 5 in§1.3.4). It seems therefore likely that the partial
disorder occurs more frequently than is thought and is unnoticed or ignored in most cases.
45
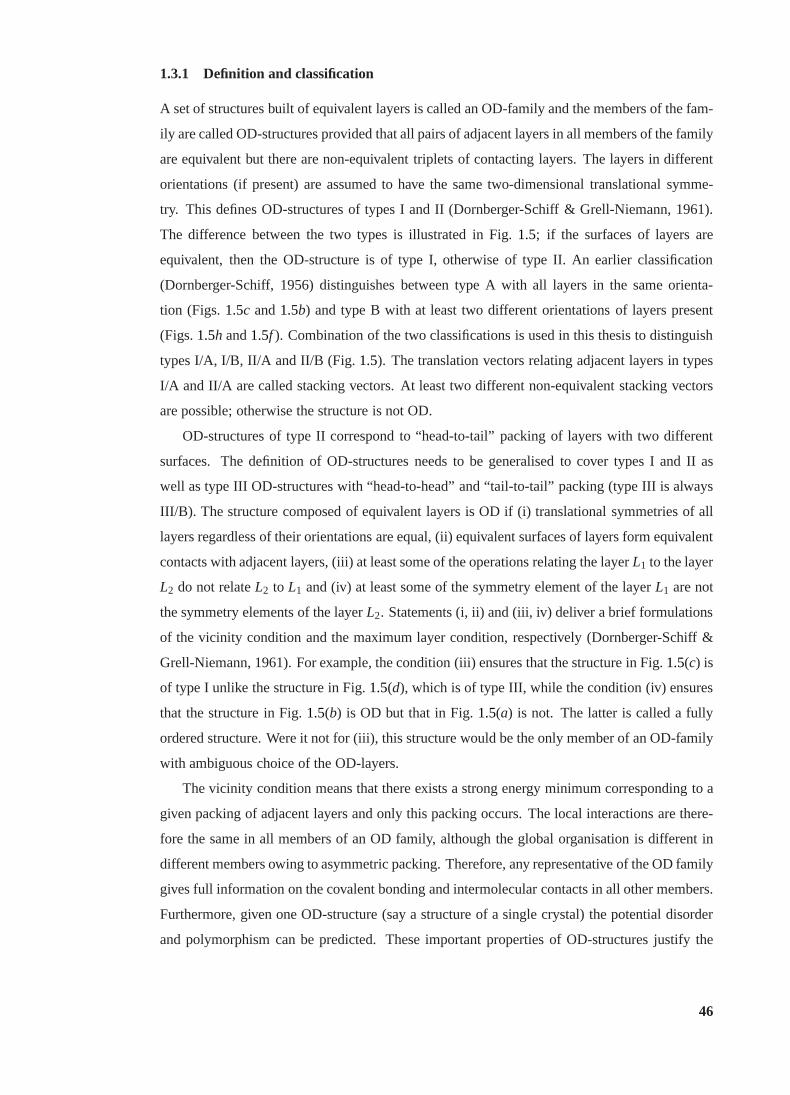
1.3.1 Definition and classification
A set of structures built of equivalent layers is called an OD-family and the members of the fam-
ily are called OD-structures provided that all pairs of adjacent layers in all members of the family
are equivalent but there are non-equivalent triplets of contacting layers. The layers in different
orientations (if present) are assumed to have the same two-dimensional translational symme-
try. This defines OD-structures of types I and II (Dornberger-Schiff & Grell-Niemann, 1961).
The difference between the two types is illustrated in Fig.1.5; if the surfaces of layers are
equivalent, then the OD-structure is of type I, otherwise oftype II. An earlier classification
(Dornberger-Schiff, 1956) distinguishes between type A with all layers in the same orienta-
tion (Figs.1.5c and1.5b) and type B with at least two different orientations of layers present
(Figs.1.5h and1.5f ). Combination of the two classifications is used in this thesis to distinguish
types I/A, I/B, II/A and II/B (Fig.1.5). The translation vectors relating adjacent layers in types
I/A and II/A are called stacking vectors. At least two different non-equivalent stacking vectors
are possible; otherwise the structure is not OD.
OD-structures of type II correspond to “head-to-tail” packing of layers with two different
surfaces. The definition of OD-structures needs to be generalised to cover types I and II as
well as type III OD-structures with “head-to-head” and “tail-to-tail” packing (type III is always
III/B). The structure composed of equivalent layers is OD if(i) translational symmetries of all
layers regardless of their orientations are equal, (ii) equivalent surfaces of layers form equivalent
contacts with adjacent layers, (iii) at least some of the operations relating the layerL1 to the layer
L2 do not relateL2 to L1 and (iv) at least some of the symmetry element of the layerL1 are not
the symmetry elements of the layerL2. Statements (i, ii) and (iii, iv) deliver a brief formulations
of the vicinity condition and the maximum layer condition, respectively (Dornberger-Schiff &
Grell-Niemann, 1961). For example, the condition (iii) ensures that the structure in Fig.1.5(c) is
of type I unlike the structure in Fig.1.5(d), which is of type III, while the condition (iv) ensures
that the structure in Fig.1.5(b) is OD but that in Fig.1.5(a) is not. The latter is called a fully
ordered structure. Were it not for (iii), this structure would be the only member of an OD-family
with ambiguous choice of the OD-layers.
The vicinity condition means that there exists a strong energy minimum corresponding to a
given packing of adjacent layers and only this packing occurs. The local interactions are there-
fore the same in all members of an OD family, although the global organisation is different in
different members owing to asymmetric packing. Therefore,any representative of the OD family
gives full information on the covalent bonding and intermolecular contacts in all other members.
Furthermore, given one OD-structure (say a structure of a single crystal) the potential disorder
and polymorphism can be predicted. These important properties of OD-structures justify the
46
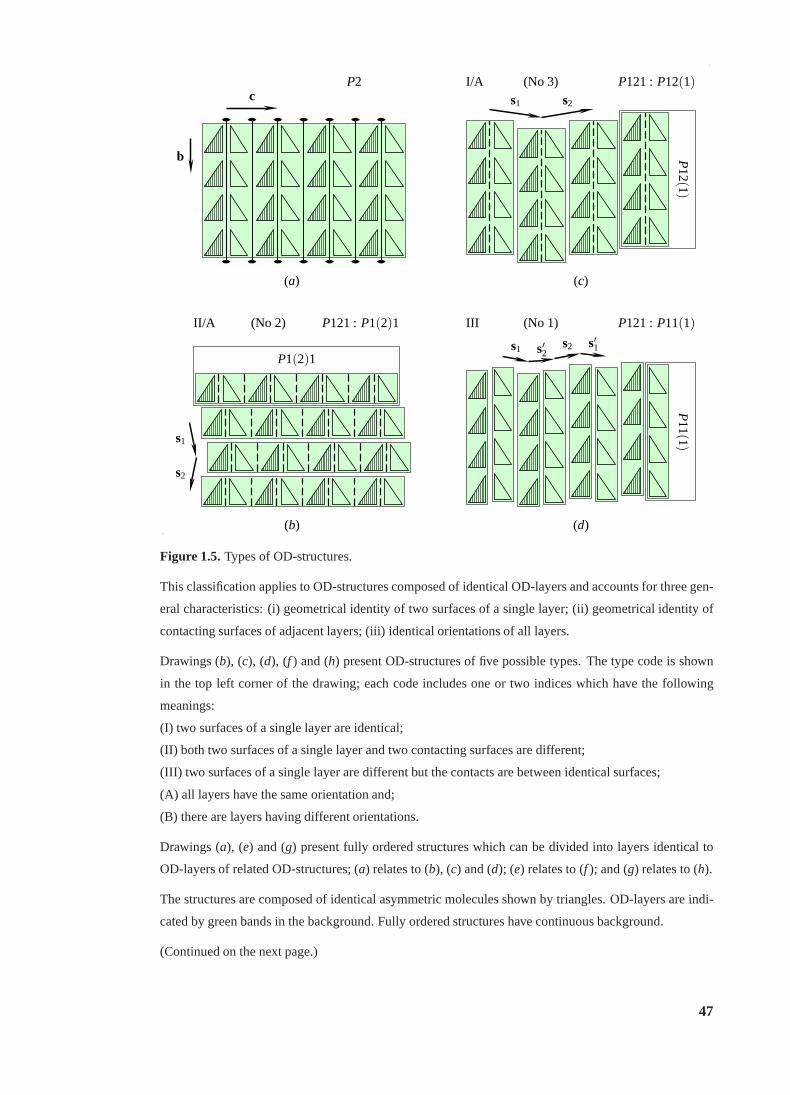
b
c s1 s2
s1
s2
s1 s′2s2 s′1
P1(2)1
P12(1)
P11(1)
(No 2)
(No 3)
(No 1)II/A
I/A
III
P2
P121: P1(2)1
P121: P12(1)
P121: P11(1)
(a)
(b)
(c)
(d)
Figure 1.5.Types of OD-structures.
This classification applies to OD-structures composed of identical OD-layers and accounts for three gen-
eral characteristics: (i) geometrical identity of two surfaces of a single layer; (ii) geometrical identity of
contacting surfaces of adjacent layers; (iii) identical orientations of all layers.
Drawings (b), (c), (d), (f ) and (h) present OD-structures of five possible types. The type codeis shown
in the top left corner of the drawing; each code includes one or two indices which have the following
meanings:
(I) two surfaces of a single layer are identical;
(II) both two surfaces of a single layer and two contacting surfaces are different;
(III) two surfaces of a single layer are different but the contacts are between identical surfaces;
(A) all layers have the same orientation and;
(B) there are layers having different orientations.
Drawings (a), (e) and (g) present fully ordered structures which can be divided intolayers identical to
OD-layers of related OD-structures; (a) relates to (b), (c) and (d); (e) relates to (f ); and (g) relates to (h).
The structures are composed of identical asymmetric molecules shown by triangles. OD-layers are indi-
cated by green bands in the background. Fully ordered structures have continuous background.
(Continued on the next page.)
47
introduction of special terms and nomenclature. Extensionof the definition to include structures
composed of layers with different chemical composition (Grell & Dornberger-Schiff, 1982) is
also justified, as long as the generalised vicinity condition is obeyed. The term OD-structure
is sometimes applied to structures composed of blocks with one-dimensional translational sym-
metry. There also exist structures composed of finite blocks. A general term, modular structure
(Nespolo & Ferraris, 2004) is applicable to all these cases.
1.3.2 Symmetry of OD-structures
The OD-layer is a three-dimensional object with two-dimensional translational symmetry. The
total symmetry of the layer is therefore described by one of 80 plane space groups (Dornberger-
Schiff, 1956). An OD-family contains both structures with space group symmetry and globally
aa
cc
s1
s2
s3
s4
s1
s2
s2
P11(2) P12(1)
(No 17) (No 10)II/B I/B
P42
P42 : P11(2)
P2221
P2221 : P12(1)
(e)
(f )
(g)
(h)
Figure 1.5.Types of OD-structures (continued).
The plane space group of OD-layer is shown in the frame embracing one of the layers; the groupoid
symmetry of OD-structure or the space group symmetry of fully ordered structure is indicated in the top
right corner of each drawing. The number in brackets is a reference to Table1.1.
Stacking vectorssi are defined using related fully ordered structure as a reference. In type A OD-structure
these are the translations relating adjacent OD-layers.
48
asymmetric structures. Therefore the symmetry of an OD-family is described in terms of one of
333 possible groupoids, (Dornberger-Schiff & Grell-Niemann, 1961).
Notation for the layer symmetry (Table1.1, columnc) resembles the notation for the space
group symmetry except for the index corresponding to the direction with no translational sym-
metry being put in brackets. Explicit notation for the groupoid symmetry (Table1.1b) also
resembles the notation for the space group symmetry but specifies separately the symmetry of
the layer and relations between adjacent layers. One of the advantages of this rather complicated
scheme is that it can be expanded to the structures with several non-equivalent layers (Grell &
Dornberger-Schiff, 1982).
Table1.1 presents “biological” groupoids (no inversion centres or reflection planes) with
oblique, rectangular and square lattices. Explicit specification is shown in column (a) and in-
cludes two or three lines of indices. The first line defines theplane space group symmetry of the
OD-layer. The second line defines symmetry operations relating the layerLn to the layerLn+1 in
internal coordinate system of the layerLn. The third line is only needed for the type III. It defines
the relationLn to Ln−1 in the coordinate system ofLn. Each line contains three, five or seven
integer indices for oblique, square and hexagonal latticesof the OD-layer, respectively. These
indices show rotation axes along the following directions.The index in brackets correspond to
the direction orthogonal to the layer; the indices on the left to the brackets correspond to the
coordinate directions of the layer lattice,aL andbL and, in addition,(−aL − bL) for hexago-
nal lattice; and the indices to the right of the brackets correspond to the diagonal directions of
the layer lattice,(aL + bL) and(bL − aL) or, for hexagonal lattice,(2aL + bL), (bL − aL) and
(−aL − 2bL).
The subscripts define translations along corresponding directions. Convention is similar to
that for the space group notations, a subscript of 2 expresses the translation in halves of the unit
translation and so on. The unit translation across the layers, cN relates equivalent planes of ad-
jacent layers, therefore 22, 44 and 412 in the second and third lines in brackets. Other subscripts
in the second and third lines are variable and can be either integer or fractional numbers, but if
all of them are integers, the groupoid is a space group. The variable subscripts in the second
and third lines are independent parameters; if there are more than two variable subscripts in a
particular line, only two of them are independent. While theformula with variable subscripts
defines an abstract groupoid, the specification of all independent subscripts define all geometri-
cal dimensions of a particular groupoid, including all possible distances between the axes. Thus
the number of independent geometrical parameters for a particular groupoid can be picked up
from corresponding explicit formula, for example, four parameters for (No 22) and one for (No
23). The ambiguity in packing can also be expressed in terms of the variable subscripts, for
example,u in (No 23) can be±u0 and the sequence+u0, −u0, +u0 defines a particular packing
of three consecutive layers.
49
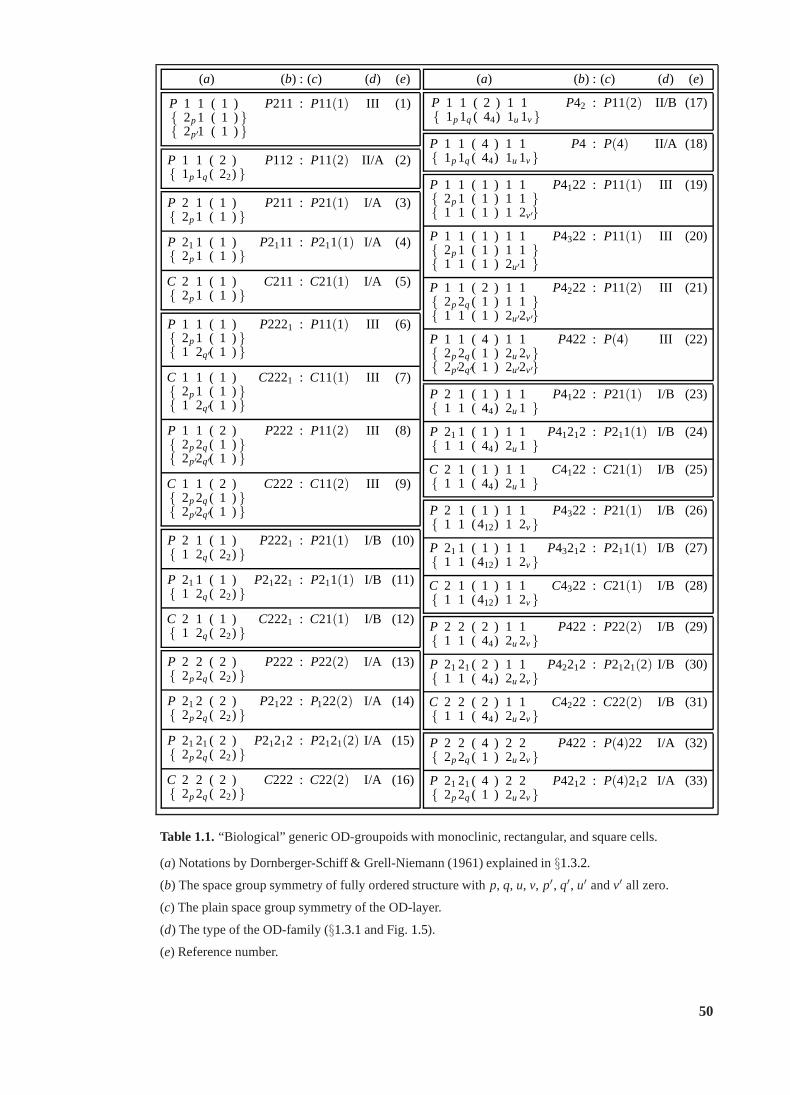
(a) (b) : (c) (d) (e)
P 1 1 ( 1 ){ 2p1 ( 1 ) }{ 2p′1 ( 1 ) }
P211 : P11(1) III ( 1)
P 1 1 ( 2 ){ 1p1q ( 22) }
P112 : P11(2) II /A (2)
P 2 1 ( 1 ){ 2p1 ( 1 ) }
P211 : P21(1) I/A (3)
P 21 1 ( 1 ){ 2p1 ( 1 ) }
P2111 : P211(1) I/A (4)
C 2 1 ( 1 ){ 2p1 ( 1 ) }
C211 : C21(1) I/A (5)
P 1 1 ( 1 ){ 2p1 ( 1 ) }{ 1 2q′( 1 ) }
P2221 : P11(1) III ( 6)
C 1 1 ( 1 ){ 2p1 ( 1 ) }{ 1 2q′( 1 ) }
C2221 : C11(1) III ( 7)
P 1 1 ( 2 ){ 2p2q ( 1 ) }{ 2p′2q′( 1 ) }
P222 : P11(2) III ( 8)
C 1 1 ( 2 ){ 2p2q ( 1 ) }{ 2p′2q′( 1 ) }
C222 : C11(2) III ( 9)
P 2 1 ( 1 ){ 1 2q ( 22) }
P2221 : P21(1) I/B (10)
P 21 1 ( 1 ){ 1 2q ( 22) }
P21221 : P211(1) I/B (11)
C 2 1 ( 1 ){ 1 2q ( 22) }
C2221 : C21(1) I/B (12)
P 2 2 ( 2 ){ 2p2q ( 22) }
P222 : P22(2) I/A (13)
P 21 2 ( 2 ){ 2p2q ( 22) }
P2122 : P122(2) I/A (14)
P 21 21 ( 2 ){ 2p2q ( 22) }
P21212 : P2121(2) I/A (15)
C 2 2 ( 2 ){ 2p2q ( 22) }
C222 : C22(2) I/A (16)
(a) (b) : (c) (d) (e)
P 1 1 ( 2 ) 1 1{ 1p1q ( 44) 1u 1v}
P42 : P11(2) II /B (17)
P 1 1 ( 4 ) 1 1{ 1p1q ( 44) 1u 1v}
P4 : P(4) II /A (18)
P 1 1 ( 1 ) 1 1{ 2p1 ( 1 ) 1 1 }{ 1 1 ( 1 ) 1 2v′}
P4122 : P11(1) III ( 19)
P 1 1 ( 1 ) 1 1{ 2p1 ( 1 ) 1 1 }{ 1 1 ( 1 ) 2u′1 }
P4322 : P11(1) III ( 20)
P 1 1 ( 2 ) 1 1{ 2p2q ( 1 ) 1 1 }{ 1 1 ( 1 ) 2u′2v′}
P4222 : P11(2) III ( 21)
P 1 1 ( 4 ) 1 1{ 2p2q ( 1 ) 2u 2v}{ 2p′2q′( 1 ) 2u′2v′}
P422 : P(4) III ( 22)
P 2 1 ( 1 ) 1 1{ 1 1 ( 44) 2u 1 }
P4122 : P21(1) I/B (23)
P 21 1 ( 1 ) 1 1{ 1 1 ( 44) 2u 1 }
P41212 : P211(1) I/B (24)
C 2 1 ( 1 ) 1 1{ 1 1 ( 44) 2u 1 }
C4122 : C21(1) I/B (25)
P 2 1 ( 1 ) 1 1{ 1 1 (412) 1 2v}
P4322 : P21(1) I/B (26)
P 21 1 ( 1 ) 1 1{ 1 1 (412) 1 2v}
P43212 : P211(1) I/B (27)
C 2 1 ( 1 ) 1 1{ 1 1 (412) 1 2v}
C4322 : C21(1) I/B (28)
P 2 2 ( 2 ) 1 1{ 1 1 ( 44) 2u 2v}
P422 : P22(2) I/B (29)
P 21 21 ( 2 ) 1 1{ 1 1 ( 44) 2u 2v}
P42212 : P2121(2) I/B (30)
C 2 2 ( 2 ) 1 1{ 1 1 ( 44) 2u 2v}
C4222 : C22(2) I/B (31)
P 2 2 ( 4 ) 2 2{ 2p2q ( 1 ) 2u 2v}
P422 : P(4)22 I/A (32)
P 21 21 ( 4 ) 2 2{ 2p2q ( 1 ) 2u 2v}
P4212 : P(4)212 I/A (33)
Table 1.1.“Biological” generic OD-groupoids with monoclinic, rectangular, and square cells.
(a) Notations by Dornberger-Schiff & Grell-Niemann (1961) explained in§1.3.2.
(b) The space group symmetry of fully ordered structure withp, q, u, v, p′, q′, u′ andv′ all zero.
(c) The plain space group symmetry of the OD-layer.
(d) The type of the OD-family (§1.3.1and Fig.1.5).
(e) Reference number.
50
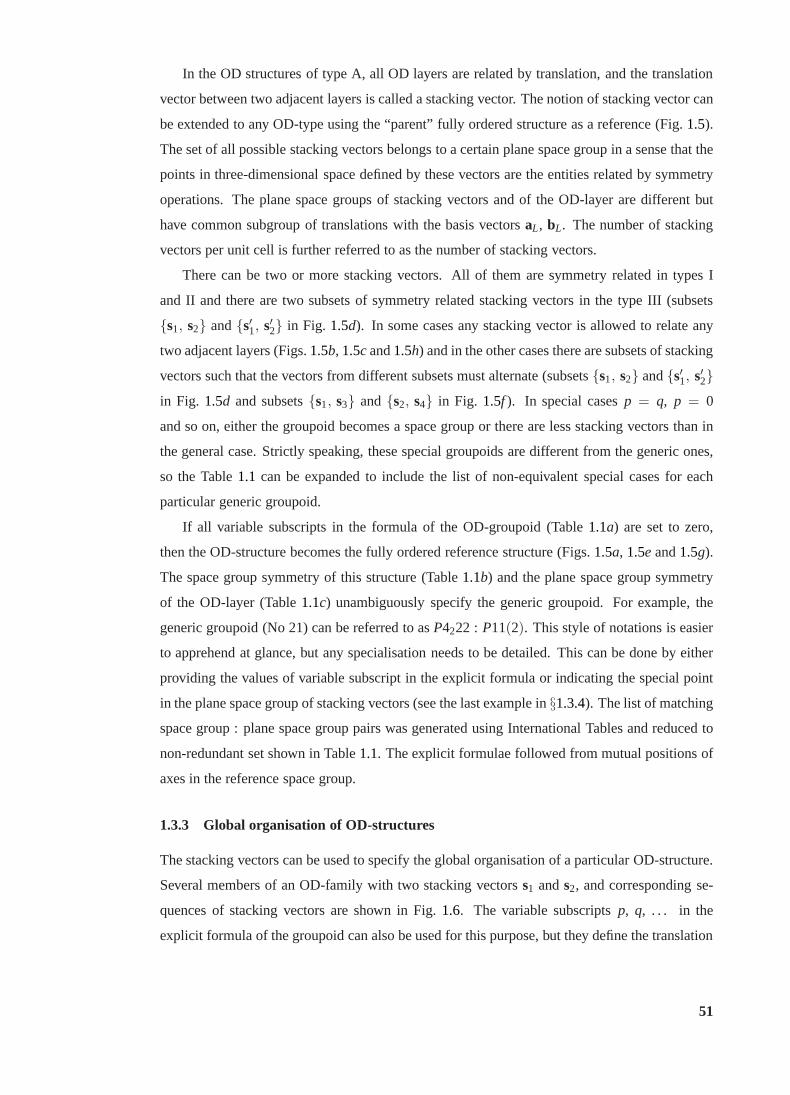
In the OD structures of type A, all OD layers are related by translation, and the translation
vector between two adjacent layers is called a stacking vector. The notion of stacking vector can
be extended to any OD-type using the “parent” fully ordered structure as a reference (Fig.1.5).
The set of all possible stacking vectors belongs to a certainplane space group in a sense that the
points in three-dimensional space defined by these vectors are the entities related by symmetry
operations. The plane space groups of stacking vectors and of the OD-layer are different but
have common subgroup of translations with the basis vectorsaL, bL. The number of stacking
vectors per unit cell is further referred to as the number of stacking vectors.
There can be two or more stacking vectors. All of them are symmetry related in types I
and II and there are two subsets of symmetry related stackingvectors in the type III (subsets
{s1, s2} and{s′1, s′2} in Fig. 1.5d). In some cases any stacking vector is allowed to relate any
two adjacent layers (Figs.1.5b, 1.5c and1.5h) and in the other cases there are subsets of stacking
vectors such that the vectors from different subsets must alternate (subsets{s1, s2} and{s′1, s′2}in Fig. 1.5d and subsets{s1, s3} and{s2, s4} in Fig. 1.5f ). In special casesp = q, p = 0
and so on, either the groupoid becomes a space group or there are less stacking vectors than in
the general case. Strictly speaking, these special groupoids are different from the generic ones,
so the Table1.1 can be expanded to include the list of non-equivalent special cases for each
particular generic groupoid.
If all variable subscripts in the formula of the OD-groupoid(Table 1.1a) are set to zero,
then the OD-structure becomes the fully ordered reference structure (Figs.1.5a, 1.5e and1.5g).
The space group symmetry of this structure (Table1.1b) and the plane space group symmetry
of the OD-layer (Table1.1c) unambiguously specify the generic groupoid. For example,the
generic groupoid (No 21) can be referred to asP4222 : P11(2). This style of notations is easier
to apprehend at glance, but any specialisation needs to be detailed. This can be done by either
providing the values of variable subscript in the explicit formula or indicating the special point
in the plane space group of stacking vectors (see the last example in§1.3.4). The list of matching
space group : plane space group pairs was generated using International Tables and reduced to
non-redundant set shown in Table1.1. The explicit formulae followed from mutual positions of
axes in the reference space group.
1.3.3 Global organisation of OD-structures
The stacking vectors can be used to specify the global organisation of a particular OD-structure.
Several members of an OD-family with two stacking vectorss1 ands2, and corresponding se-
quences of stacking vectors are shown in Fig.1.6. The variable subscriptsp, q, . . . in the
explicit formula of the groupoid can also be used for this purpose, but they define the translation
51
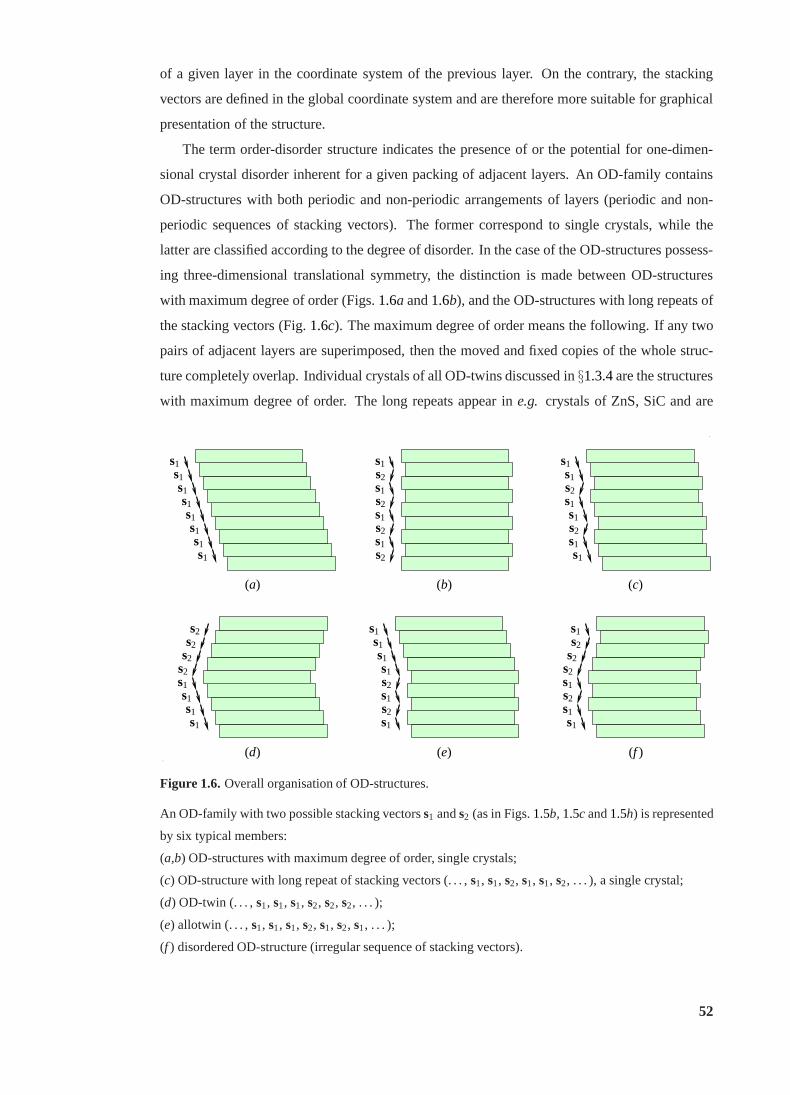
of a given layer in the coordinate system of the previous layer. On the contrary, the stacking
vectors are defined in the global coordinate system and are therefore more suitable for graphical
presentation of the structure.
The term order-disorder structure indicates the presence of or the potential for one-dimen-
sional crystal disorder inherent for a given packing of adjacent layers. An OD-family contains
OD-structures with both periodic and non-periodic arrangements of layers (periodic and non-
periodic sequences of stacking vectors). The former correspond to single crystals, while the
latter are classified according to the degree of disorder. Inthe case of the OD-structures possess-
ing three-dimensional translational symmetry, the distinction is made between OD-structures
with maximum degree of order (Figs.1.6a and1.6b), and the OD-structures with long repeats of
the stacking vectors (Fig.1.6c). The maximum degree of order means the following. If any two
pairs of adjacent layers are superimposed, then the moved and fixed copies of the whole struc-
ture completely overlap. Individual crystals of all OD-twins discussed in§1.3.4are the structures
with maximum degree of order. The long repeats appear ine.g. crystals of ZnS, SiC and are
s1
s1
s1
s1
s1
s1
s1
s1
s1
s1
s1
s1
s1
s1
s1
s1
s1
s1
s1
s1
s1
s1
s1
s1
s1
s1
s1
s1
s1
s1
s1
s1
s2
s2
s2
s2
s2
s2
s2
s2
s2
s2
s2
s2
s2
s2
s2
s2
(a) (b) (c)
(d) (e) (f )
Figure 1.6.Overall organisation of OD-structures.
An OD-family with two possible stacking vectorss1 ands2 (as in Figs.1.5b, 1.5c and1.5h) is represented
by six typical members:
(a,b) OD-structures with maximum degree of order, single crystals;
(c) OD-structure with long repeat of stacking vectors (. . . ,s1, s1, s2, s1, s1, s2, . . . ), a single crystal;
(d) OD-twin (. . . ,s1, s1, s1, s2, s2, s2, . . . );
(e) allotwin (. . . ,s1, s1, s1, s2, s1, s2, s1, . . . );
(f ) disordered OD-structure (irregular sequence of stackingvectors).
52
thought to be owing to the crystal growth along screw dislocations advancing several layers per
turn. The global organisation of periodic OD-structures with long repeats is typically analysed
using the measured intensities and the Fourier transform ofa single layer (Dornberger-Schiff
& Schmittler, 1971). An OD-structure without global translational symmetry can nevertheless
contain ordered domains. Large domains with the same internal organisation are individual
crystals of (polysynthetic) OD-twin (Fig.1.6d). An allotwin (Fig.1.6e) contains domains with
different sequences of stacking vectors and therefore different crystallographic symmetries. If
the dimensions of the ordered domains are small and comparable with the length of coherence
of the X-ray beam, reflections are elongated in the directionperpendicular to the OD-layers,
and the structure is referred to as partially disordered OD-structure. A structure with random
sequence of stacking vectors is called disordered OD-structure (Fig.1.6f ).
1.3.4 Examples
(Example 1) The first case of a disordered macromolecular OD structure was reported by Bragg
& Howells (1954), even before the first protein crystal structure was solved. This was a “statis-
tically orthorhombic” crystal of imidazole methaemoglobin with apparent orthorhombic sym-
metry. The presence of monoclinic form of horse methaemoglobin crystal with the samea and
b and two times smallerc∗ indicated one-dimensional disorder with conserved structure of two-
dimensional layers. The diffraction pattern was analysed in terms of equal probability of two
possible relative positions of the adjacent layers (Cochran & Howells, 1954). Using the OD-
terminology, the “statistically orthorhombic” crystal form can be classified as a disordered OD-
structure of type I/B belonging to the OD-groupoidC2221 : C12(1) (No 12). The two crystal
forms belonged to different OD-families, as in the monoclinic and “statistically orthorhombic”
forms the neighbouring layers were related by crystallographic translation and two-fold screw
rotation, respectively. The structure of the “statistically orthorhombic” form is unavailable, but
it can be modelled using the monoclinic form (PDB code 2mhb; Ladneret al., 1977).
(Example 2) Three complexes of wheat-germ agglutinin formed isomorphous crystals (PDB
codes 1k7t, 1k7u, 1k7v; Murakiet al., 2002) belonging to the space groupP21 with equala and
c. The crystals were found to be twinned during the search for twins in the PDB (§3.2; Lebedev
et al., 2006). The analysis of crystal packing showed that these were OD-twins by pseudomero-
hedry belonging to the OD-groupoidC2221 : C12(1) (No 12) of type I/B, the same groupoid
as in the previous example. A non-standard settingB1211 of the individual crystal is consistent
with the groupoid settingB2212 : B1(1)2. The individual crystals have the same sequences of
stacking vectors,(. . ., s1, s2, s1, s2, . . .) but two possible orientations of the reference layers.
Accordingly, the stacking sequences(. . ., s1, s2, s1, s1, s2, s1, . . .) occur at the twin interfaces.
53
The individual crystals are therefore monoclinic with two layers spanning theb-dimension of
the specialisedB-centred orthorhombic unit cell. (A similar example is detailed in §3.4.) Patter-
son maps for 1k7t and 1k7v revealed non-origin peaks corresponding to the stacking sequences
(s1, s1) and(s2, s2) and indicating partial disorder. There were no non-origin peaks for the twin
1k7u, which was evidently composed of larger individual crystals. The structure 1k7v with the
highest non-origin peaks is likely to resemble, in terms of both order and groupoid symmetry,
Bragg’s “statistically orthorhombic” crystal.
(Example 3) A series of OD-structures of type I/A withP(6)22 OD-layers were reported
by Trame & McKay (2001) for the heat-shock locus U protein from Haemophilus influenzae
and its complexes. The layers were composed of “dodecamers”(the protomer is a hexamer).
The symmetry of layers assumed the generic groupoidP622 : P(6)22. The native crystal was
a partially disordered ternary OD-twin and belonged to a specialised groupoid with six stacking
vectors,s1 ≈ cN + 0.4aL ands2, . . . ,s6 generated froms1 by sixfold rotation. In the proposed
model of the crystal, the stacking sequences(. . ., s1, s4, s1, s4, . . .), (. . ., s2, s5, s2, s5, . . .)
and (. . ., s3, s6, s3, s6, . . .) defined three individual crystals withP21 space group symmetry
and translational NCS. The asymmetric unit of an individualcrystal contained two halves of
the dodecamer related by NCS translation defined by a stacking vector. This model accounted
for six non-origin peaks in the Patterson map. However, the authors underlined that the model
was not exact, as the presence of diffuse streaks indicated partial disorder (small volumes of
individual crystals). In addition, reflections corresponding to two times largerc were found in
some of the data sets, which might be due to the presence of regular subsequences of stacking
vectors with longer repeats. Because the OD-twin under study was of type A, it was possible to
replace detwinning by demodulation. The corrected X-ray data corresponded to aP622 structure
with one dodecamer per unit cell and with every second OD-layer removed.
(Example 4) An allotwin (Fig.1.6e) formed by the proteolytic domain ofArchaeoglobus
fulgidusLon protease was described by Dauteret al. (2005). The individual crystals belonged
to P1211 andP212121 space groups (PDB codes 1z0v and 1z0t, respectively). The OD-layers
although composed of hexamers belonged toP2121(2) plane space group with half of the hex-
amer in the asymmetric unit. There were two stacking vectorsin a specialisedP21212 : P2121(2)
groupoid of the type I/A (No 15), and the sequences of stacking vectors(. . ., s1, s1, s1, s1, . . .)
and(. . ., s1, s2, s1, s2, . . .) corresponded to monoclinic and orthorhombic individual crystals,
respectively. The reflections from two kinds of individual crystals were clearly separated in the
diffraction images enabling processing the same set of images in two different space groups and
the separate solution of the structures of the two individual crystals. Reflections with diffuse
streaks were observed indicating that the volumes of individual crystals were rather small. This
case should therefore be considered as allotwinning with partial disorder.
54
(Example 5) The crystal structure of DNA polymerase from phageφ29 (Wanget al., 2005)
is composed of identical layers. As follows from the authors’ interpretation of the data, this
structure is not OD, as there are present two types of non-equivalent contacts made by geo-
metrically identical surfaces. The authors named the minority contacts translocation defects.
The shape of the different subsets of reflections was shown toagree with the overall statisti-
cal model of the crystal. The data presented in the paper are however insufficient to exclude
the possibility that this was a partially disordered OD-structure of type I/A with the layer sym-
metryP211(1) and with predomination of(. . ., s1, s1, s1, . . .) stacking sequences and with the
sequences(. . ., s1, s1, s2, s1, s1, . . .) at the defects. Regardless of the interpretation, the X-
ray data were treated similarly to the OD case by Trame & McKay(2001). The demodulation
allowed experimental phasing using MIR and MAD.
(Example 6) The monoclinic individual crystal of lipase B from Candida antarctica(PDB
code 1lbs;3.2.5; Uppenberget al., 1995) belonged to the space groupC2 with unit cell pa-
rametersa = 95.9 A, b = 95.6 A, c = 81.8 A and β = 122.2o. The basisa′ = 2c − a,
b′ = −b, c′ = a + c defined aC2 subgroup and an orthorhombic sublattice witha′ = 229.5
A, b′ = 95.6 A and c′ = 86.8 A. The twinning by reticular pseudomerohedry was generated
by two equivalent twin axes alonga′ and c′. The data were collected and processed in the
large orthorhombic lattice, non-overlapping reflections from the minor twin component were
removed and overlapping reflections detwinned. The modifieddata and the final model were
deposited in the PDB in the orthorhombic coordinate system.This resulted in the apparent data
completeness of 27.5% (actual completeness was 82.4%) and six molecules in the asymmetric
unit (two of these were independent in the actualC2 space group with the smaller unit cell, the
others were related by the crystallographic translations to the first two). In structural terms the
crystal was an OD-twin from the OD-familyP21212 : P2121(2) of type I/A (No 15) with two-
dimensional basisaL = c′, bL = −b′, normal component of stacking vectorscN = a′/6, and
stacking vectorss[12] = ±aL/3 + bL/2 + cN. One possibility for its global structure is shown
in Figs. 1.5(a), where the individual crystals lie one on top of the other. However, the exact
orthorhombic symmetry of the twin lattice favours another possibility, with individual crystals
one in front of the other and with each sixth OD-layer having no breaks and spanning through
both individual crystals.
(Example 7) The generic groupoidP42212 : P2121(2) (No 30) has four stacking vectors.
The parallel componentssaaL + sbbL of the stacking vectors are related by operations from the
plane space groupCmm(m), in which aL andbL act as the basis translations of the primitive
lattice. There are three special cases, (i)sa = ±sb (a special position on a mirror-reflection
plane), (ii) eithersa = 0 andsb = 1/2 orsa = 1/2 andsb = 0 (a special position on the intercept
of glide-reflection planes) and (iii)sa = sb = 0 (a special position on the intercept of mirror-
55
reflection planes). Accordingly, there are only two stacking vectors in the cases (i) and (ii),
and the case (iii) corresponds to the reference space groupP42212. The special condition (ii)
defines a single point and therefore the corresponding specialised groupoidP2121(2)/21221
22
has no variable parameters. The crystal of a domain of the splicing factor Prp8p from yeast was
twinned by pseudomerohedry and belonged to this OD-groupoid (Gleb Bourenkov, personal
communication). The individual crystals belonged to the space groupP21212 with a = 77.50
A, b = 77.44 A, c = 97.08 A. The two stacking vectors and their sequence at the twin interface
weres1 = (aL/2 + cN/2), s2 = (bL/2 + cN/2) and(. . . , s1, s1, s1, s1, s2, s2, s2, . . .). The Cα
r.m.s.d. from the special condition and between two molecules in the asymmetric unit were
0.48 A and 0.21A, respectively. The deposited data for this protein (PDB code 2og4; Pena
et al., 2007) were collected from a related crystal, which was composed of the same layers as
the twinned crystal, had essentially the samea = 78.46 A, but belonged to the space group
P42212 and had somewhat largerc = 122.8 A to accommodate less compact contacts between
the layers. Hence the tetragonal crystal was a fully orderedstructure which could be considered
as a natural reference structure for the OD-groupoid of the twinned form.
Two OD-twins are described in this thesis, the first is a twin by metric merohedry and be-
longs to an OD-family of type I/B (§3.4) and the second is a twin by reticular pseudomerohedry
from an OD-family of type I/A (§3.5). A case of space group uncertainty in an OD-structure of
type II/A is discussed in§4.5.
56
2 MR protocols utilising Non Crystallographic Symmetry
MR is a multidimensional optimisation problem. In practice, the multidimensional searches
are replaced by sequences of searches over subsets of parameters. In cases with many search
parameters, the constraints on the parameters derived fromX-ray or other data may be crucial
for the success of the MR. The choice of the target function isanother characteristic of an
MR protocol; the target functions are typically different for rotation and translational searches
although they are intended to approximate a general criterion, the likelihood of a given set of
values of the parameters. Finally, the partial structure can be refined after all or specific steps of
the protocol and used as a fixed partial model or a new search model. Automated MR programs
implement a few “standard” protocols for which these four major characteristics (sequence of
searches, constraints, target function and “refinement points”) are internally defined. A “difficult
MR problem” is in fact one for which the standard protocols donot clearly indicate a solution
but a case-specific protocol succeeds.
In this chapter, several difficult MR cases are presented, inwhich I have contributed to the
structure solution. People involved in the particular projects are acknowledged and the related
publications are indicated in the corresponding sections.
The structure in§2.6 was solved using experimental phasing and MR was used for sub-
structure solution. In all other examples discussed in thischapter standard MR protocols were
attempted but were not successful except for§2.5, where this resulted in a partial structure. In all
these examples several search models were available including single-subunit models and either
single-domain models (§2.5) or one or more oligomeric models. All the models were tried both
with and without sequence correction except for§2.2, where the sequence identity was high and
correction of the model seemed unnecessary. In three cases more substantial modifications of
the search models were also tried, removal of low-identity segments (§2.1and§2.3) or hybridis-
ation of two models (§2.4). For all the structures only one MR program was used in all the trials,
eitherAMoRe(§2.1and§2.6) or MOLREP(all others). For each model two or more attempts at
structure solution were made using all data or with high-resolution cut-offs in the range 5 to 3A.
The initials runs were generally at low resolution for reasons of speed and efficiency. For each
MR attempt, which resulted in an apparent solution with reasonable contrast, a visual analysis
of the molecular packing for that solution was performed followed by rigid body and restrained
refinements if the packing was reasonable. For only one structure (§2.5) was a partial solution
found in this manner and confirmed by a decrease inRfree during refinements.
For single-subunit models of§2.2, §2.3 and§2.4, subsets of the CRF peaks approximately
related by NCS were examined. A list of such relations is optionally generated byMOLREP
using the list of the SRF peaks; this procedure is similar to that used inCRANS(§1.1.12). If
57
some CRF peaks are related by NCS with a high accuracy (a threshold of 4o was typically used)
and these peaks are reproducible at different high-resolution cut-offs, they are worthy of special
examination by either the standard TF or multi-copy search (§1.1.12). However such a situation
did not occur in any of the examples where this analysis was done.
For oligomeric search models the CRF steps of MR were specifically validated. For each of
several highest peaks of the CRF the search model was broughtinto the corresponding orienta-
tion and structure amplitudes from this model were computedin P1 with target cell parameters.
If the native SRF and the SRF from the model in a tested orientation have common peaks (the
native SRF contains more peaks owing to the crystallographic symmetry) then there is a high
likelihood that the tested orientation of the oligomer is correct. For the E1-helicase (§2.4) this
analysis, which is later referred to as an SRF test, showed that the top three equivalent CRF
peaks were likely to be correct and therefore the respectiveorientation was used as a starting
point for refinement of a hexamer. In all the other examples the oligomeric models failed the
SRF test.
As the standard protocols were not successful, non-standard protocols were designed and
applied to the structures under consideration. The approaches used in the first three examples
can be classified as NCS-constrained exhaustive searches for the parameters defining the struc-
tures of oligomers. The selection criteria were the maximumvalue of the correlation coefficient
(CC) in the series of the TF searches (the first and the second examples) and the maximal value
of the CRF (the third example). In the fourth example, the required changes in the oligomer
organisation were relatively small and therefore a local optimisation against the CRF was un-
dertaken. In the fifth example, the restrained refinement of partial model was a key step in the
structure determination. Finally, in the sixth example, anNCS-constrained exhaustive search
was used for Hg-substructure determination.
58
2.1 NCS-constrained exhaustive search with the TF target
Thioredoxin peroxidase B from human erythrocytes (TPx-B) was studied in the group of Pro-
fessor Jennifer Littlechild (University of Exeter). The protein was isolated and biochemical
experiments were carried out by Dr. Ewald Schroder and Dr. Neil Errington; Dr. Michail
Isupov collected the X-ray data and solved the structure. I took part in designing the protocol
and scripts for the exhaustive search. The results were presented by Schroderet al. (2000) and
structure solution is described by Isupov & Lebedev (2008).
This case is characterised by moderate similarity of the search model (30% sequence iden-
tity with the target) and a large number of molecules in the asymmetric unit (ten). However,
the knowledge of the point group symmetry of the oligomer andthe availability of a dimeric
homologous structure enabled substantial reduction in thenumber of independent parameters
and made an exhaustive search feasible. Our protocol is a multibody NCS-constrained version
of the procedure proposed by Sheriffet al. (1999),§1.1.13, in which a comprehensive sample
of subunit orientations was tested by conventional TF. A closely related procedure was used by
Stropet al. (2007),§1.1.13, except that the variable search model was a single protein and the
building blocks were helices in place of the oligomer and subunits in our case.
2.1.1 Background
Peroxiredoxins are ubiquitous antioxidant enzymes. TPx-Bis a 2-Cys peroxiredoxin with a
subunit molecular weight of 22 kDa. The protein was purified from dated blood packs and
crystallised in space groupP21, with unit-cell parametersa = 88.9, b = 107.0, c = 119.5 A,
β = 110.9o. Native synchrotron data were collected to 1.7A.
Attempted MIR phasing did not work owing to poor native crystal isomorphism. The Se-Met
MAD approach was not possible, as the protein was purified from the native source. Because
of experimental uncertainties, analytical ultracentrifugation, gel-filtration chromatography and
specific volume calculations were inconclusive regarding the oligomeric state of the protein,
suggesting eight to twelve subunits in the oligomer. The SRFcalculated withMOLREPrevealed
that TPx-B is a decamer with 52 molecular symmetry (Figs.2.1a and2.1b).
2.1.2 Model preparation and structure solution
The closest available homologue, dimeric hORF06 (Fig.2.1c; PDB code 1prx; Choiet al., 1998)
shared 30% sequence identity with TPx-B. No MR solution was found for single subunit or
dimeric hORF06 models.
A polyalanine model of hORF06, containing amino acids 1–189out of 224 in order to cut
off a poorly conserved domain, was used to generate all possible decamers with 52 point-group
59
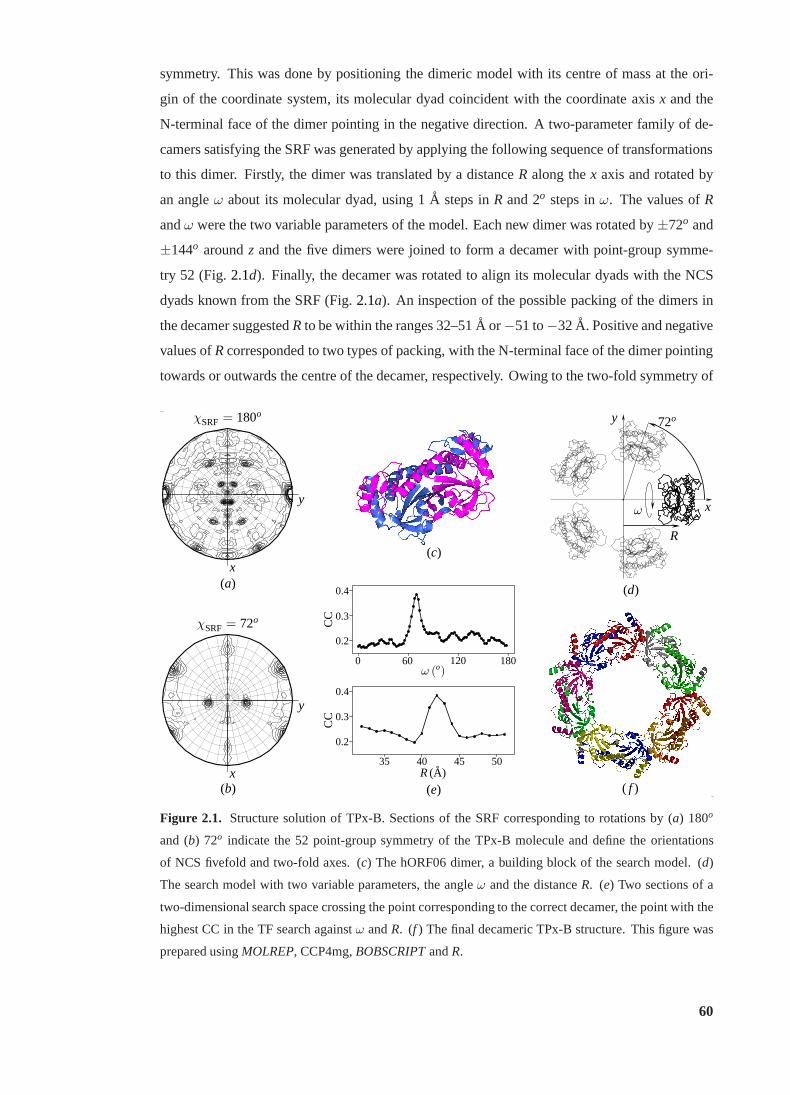
symmetry. This was done by positioning the dimeric model with its centre of mass at the ori-
gin of the coordinate system, its molecular dyad coincidentwith the coordinate axisx and the
N-terminal face of the dimer pointing in the negative direction. A two-parameter family of de-
camers satisfying the SRF was generated by applying the following sequence of transformations
to this dimer. Firstly, the dimer was translated by a distance R along thex axis and rotated by
an angleω about its molecular dyad, using 1A steps inR and 2o steps inω. The values ofR
andω were the two variable parameters of the model. Each new dimerwas rotated by±72o and
±144o aroundz and the five dimers were joined to form a decamer with point-group symme-
try 52 (Fig.2.1d). Finally, the decamer was rotated to align its molecular dyads with the NCS
dyads known from the SRF (Fig.2.1a). An inspection of the possible packing of the dimers in
the decamer suggestedR to be within the ranges 32–51A or −51 to−32A. Positive and negative
values ofRcorresponded to two types of packing, with the N-terminal face of the dimer pointing
towards or outwards the centre of the decamer, respectively. Owing to the two-fold symmetry of
ω (o)
CC
0 60 120 180
0.2
0.3
0.4
R(A)
CC
35 40 45 50
0.2
0.3
0.4
χSRF = 180o
χSRF = 72o
ω
R
72o
x
x
x
y
y
y
(a)
(b)
(c)
(d)
(e) ( f )
Figure 2.1. Structure solution of TPx-B. Sections of the SRF corresponding to rotations by (a) 180o
and (b) 72o indicate the 52 point-group symmetry of the TPx-B molecule and define the orientations
of NCS fivefold and two-fold axes. (c) The hORF06 dimer, a building block of the search model. (d)
The search model with two variable parameters, the angleω and the distanceR. (e) Two sections of a
two-dimensional search space crossing the point corresponding to the correct decamer, the point with the
highest CC in the TF search againstω andR. (f ) The final decameric TPx-B structure. This figure was
prepared usingMOLREP, CCP4mg,BOBSCRIPTandR.
60
the dimers, theω search range was 0–180o. A total of 3600 decamers were generated, with two
types of packing. A TF search was conducted with these modelsusingAMoReand atcsh-script
in which one cycle included generation of a decamer and the TFwith this decamer as the search
model. The data with the resolution less than 5A were used to reduce the computational time.
For each decamer the highest value of CC was stored to generate a two-dimensional plot of CC
againstRandω (Fig. 2.1e). The only strong peak in this plot (R = 42A, ω = 70o) corresponded
to the correct structure.
Subsequent phase improvement involved rigid-body refinement, restrained refinement (REF-
MAC), tenfold NCS averaging (DM) and restrained refinement with externalDM-averaged
phases (REFMAC). The TPx-B model was rebuilt and refined to anR-factor of 0.192 and an
Rfree of 0.256 (Fig.2.1f ; PDB code 1qmv; Schroderet al., 2000).
61
2.2 Partially constrained exhaustive search with the TF target
The anti-TRAP protein fromBacillus licheniformiswas supplied by Professor Paul Gollnick
(State University of New York, Buffalo) and the structural analysis was carried out in the group
of Dr. Fred Antson. Crystallisation, data collection and refinement were conducted by Mikhail
Shevtsov. Dr. Mikhail Isupov (University of Exeter) and I used the available X-ray data to solve
the structure (Isupov & Lebedev, 2008).
In retrospect, there were two major complications with the structure solution. Firstly, the
dodecamer of anti-TRAP fromBacillus licheniformisturned out to be entirely different from the
known dodecamer of the homologous protein and, secondly, there was four-fold translational
NCS which prevented the structure solution using one-by-one RF/TF searches for single sub-
units or trimers. In addition, a false origin solution emerged in the first successful MR attempt
(details in§4).
Assuming that the trimers were conserved gave a similar situation to that in§2.1in which the
knowledge of oligomer orientation and partial knowledge ofoligomer structure were available.
In the previous example all this information was used as constraints in the exhaustive search.
In this case, constraints on the positions of trimers relative to the centre of the dodecamer were
relaxed. This reduced the contrast but added a validation criterion, the point group symmetry
of the complete oligomer. In addition, the new procedure wasfaster and simpler to implement.
Should this approach fail, the protocol with all possible constraints would be invoked.
2.2.1 Background
Anti-TRAP is a small protein of 53 amino acids involved in regulation of tryptophan biosyn-
thesis and transport inBacilli. In particular, it regulates the activity of tryptophan attenuation
protein, TRAP (Antsonet al., 1999). The crystal structure of anti-TRAP fromB. subtiliswas
solved by Shevtsovet al. (2005), PDB code 2bx9. This crystal contained a dodecamericparticle
with cubic 23 point-group symmetry (Fig.2.2a).
Anti-TRAP from B. licheniformiscrystallised in space groupP21 with unit-cell parameters
a = 118.5 A, b = 99.9 A, c = 123.2 A, β = 117.6o. The crystal diffracted to the resolution
of 2.2 A. If there were four dodecamers in the asymmetric unit the specific volume would be
2.35 A3Da−1 and the solvent content 47%. The sequence identity betweenB. subtilisandB.
licheniformisanti-TRAP was 64%.
The native Patterson synthesis ofB. licheniformisanti-TRAP contained three strong non-
origin peaks at (0.5, 0.13, 0.0), (0.5, 0.0, 0.5) and (0.0, 0.13, 0.5), with heights of 0.4, 0.4 and
0.16 relative to the origin peak, respectively (Fig.2.2b). This suggested that the asymmetric unit
contained four anti-TRAP particles related by translational NCS. The SRF had strong features
62
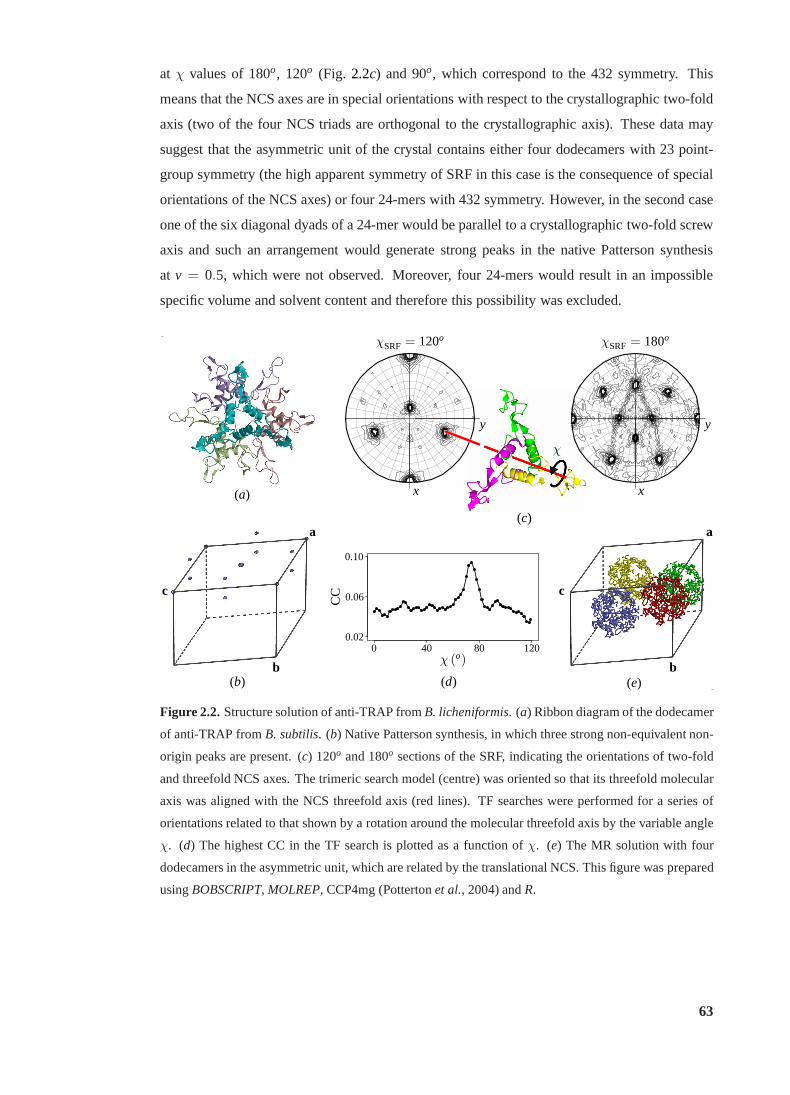
at χ values of 180o, 120o (Fig. 2.2c) and 90o, which correspond to the 432 symmetry. This
means that the NCS axes are in special orientations with respect to the crystallographic two-fold
axis (two of the four NCS triads are orthogonal to the crystallographic axis). These data may
suggest that the asymmetric unit of the crystal contains either four dodecamers with 23 point-
group symmetry (the high apparent symmetry of SRF in this case is the consequence of special
orientations of the NCS axes) or four 24-mers with 432 symmetry. However, in the second case
one of the six diagonal dyads of a 24-mer would be parallel to acrystallographic two-fold screw
axis and such an arrangement would generate strong peaks in the native Patterson synthesis
at v = 0.5, which were not observed. Moreover, four 24-mers would result in an impossible
specific volume and solvent content and therefore this possibility was excluded.
χSRF = 120o χSRF = 180o
χ
xx
yy
a a
b b
c c
(a)
(b)
(c)
(d) (e)
χ (o)
CC
0 40 80 1200.02
0.06
0.10
Figure 2.2.Structure solution of anti-TRAP fromB. licheniformis. (a) Ribbon diagram of the dodecamer
of anti-TRAP fromB. subtilis. (b) Native Patterson synthesis, in which three strong non-equivalent non-
origin peaks are present. (c) 120o and 180o sections of the SRF, indicating the orientations of two-fold
and threefold NCS axes. The trimeric search model (centre) was oriented so that its threefold molecular
axis was aligned with the NCS threefold axis (red lines). TF searches were performed for a series of
orientations related to that shown by a rotation around the molecular threefold axis by the variable angle
χ. (d) The highest CC in the TF search is plotted as a function ofχ. (e) The MR solution with four
dodecamers in the asymmetric unit, which are related by the translational NCS. This figure was prepared
usingBOBSCRIPT, MOLREP, CCP4mg (Pottertonet al., 2004) andR.
63
2.2.2 Models and preliminary MR trials
Prior to the structure determination, it seemed likely thatdodecamers in the crystals ofB. licheni-
formisandB. subtilisanti-TRAP proteins would be identical. Therefore, three models were tried
in the conventional MR attempts, the dodecamer, a trimer anda single subunit. Owing to the
high sequence similarity between the two proteins, the models were used without any modifica-
tion, but several resolution limits were tried.
First of all, the dodecameric model was used, but without success. Moreover, the CRF did
not contain strong features and its top peaks failed the SRF validation, suggesting a different
organisation of the dodecamers in the anti-TRAP proteins from B. subtilisandB. licheniformis.
Further attempts with the trimer and single subunit failed as well. This was not surprising, as
these models represented only a small part of the asymmetricunit content.
Nevertheless, the trimeric model (Fig.2.2c) appeared attractive because of the presence of a
trimeric B. licheniformisanti-TRAP species in solution. Therefore, the next attemptat structure
solution was the constrained exhaustive search with the trimeric model.
2.2.3 Structure determination
It was possible to use a two-dimensional exhaustive search similar to one described in the previ-
ous section. In this case, the variable parameters would have been the distance from the centres
of trimers to the centre of the dodecamer and the angle defining the rotation of the reference
trimer about its three-fold axis.
However, in order to accelerate the search and retain a validation criterion, another protocol
was applied in this case. The trimeric model ofB. subtilisanti-TRAP was positioned at the
origin and rotated to align its molecular threefold axis with one of the NCS three-fold axes. The
angleχ defining the rotation of the trimer about its three-fold axiswas sampled with a 2o step
over the range 0–120o, which was sufficient owing to the threefold symmetry of the model. A
TF search was carried out for each of these 60 orientations using MOLREPand the data in the
resolution range 15–4.2A. Fig. 2.2(d) shows the dependence of the highest CC in the TF search
onχ, with a clear solution atχ = 74o. The CC at this global maximum is 9.4%, while the CC
at the other maxima is below 6%.
In the model shown in Fig.2.2c, the N-termini of the subunits point away from the origin.
In the general case it would have been necessary to repeat theTF runs with the ’flipped-over’
model, in which the three-fold axis has the same orientation, but the N-termini point towards
the origin. However, in our particular case it was not needed, as the NCS axes were in special
orientation relative to the crystallographic 21 axis and the ’flipped-over’ trimers related to the
original trimers by crystallographic rotation.
64
The search was repeated for the three remaining NCS threefold axes. Similarly to the con-
ventional MR protocol, each found trimer was added to the partial model used as a fixed model
in the next TF search, until one complete dodecamer was built. Visual inspection showed that
the resultant dodecameric model had point group symmetry 23, as expected. This was strong ev-
idence for the correctness of the model, as the 23 symmetry constraints were partially relaxed in
the exhaustive search. Comparison of the new dodecamer withthe one fromB. subtilisshowed
that the two particles were entirely different and thus explained the failure of the first MR trial.
The resulting dodecamer was used as a search model for the next step of structure solution, in
which four dodecamers related by translational NCS were located using conventional MR. The
electron density map allowed model correction to theB. licheniformissequence and the model
was iteratively refined and rebuilt usingREFMACandCoot. At the early stages, the behaviour
of the refinement seemed normal. However, the refinement stalled atR = 33% andRfree = 43%.
At this point, the 2Fo−Fc synthesis was of reasonable quality, but did not indicate ways of further
model improvements. Moreover, main-chain breaks were observed in the electron density maps
and the water structure was poorly defined. Therefore, one dodecamer, which had fewer main-
chain breaks in the density, was used as the model for a further MR search. This time one of the
correct RF peaks split. Dodecamers in slightly different orientations were positioned one by one
using the TF. The new structure was easily refined toR = 19.7% andRfree = 25.4% (Fig.2.2e).
The problems with the first refinement attempt and the difference between the two models is
analysed in§4.1.
2.2.4 Concluding remarks
Given a known trimer and the orientations of the NCS axes, an unknown dodecamer with point
symmetry 23 is defined by two internal and three translational parameters. Four independent
trimers have twelve rotational and twelve translational parameters. Therefore, there are 19 sym-
metry constraints available for the exhaustive search withthe trimeric model. In our exhaustive
search, only eight angular parameters (two for each of four trimers) were constrained. This was
nevertheless sufficient to exclude the CRF from the protocoland to solve the structure. (The fact
that the CRF was a weak link in the structure determination was realised during the preliminary
MR trials with the trimeric model, as the orientations of themodel defined by CRF did not pass
the SRF validation.)
The protocol with partially relaxed NCS constraints had twomajor advantages compared
to the fully constrained exhaustive search. Firstly, it wasa variation of one-by-one search and
therefore it was fast and, secondly, the relaxed constraints provided a validation criterion, the
expected 23 symmetry of the dodecamer.
65
In addition, this protocol was easy to implement, as it required only a minimal modification
to the standard protocol. Namely,MOLREPwas instructed to switch the RF step off and to use
the external list of orientations instead. So, for each of four series of translation searches, a table
was manually created that contained polar angles defining the model orientations to be tested by
the TF. In our case, these were 60 rotations about the three-fold NCS axes. In each table the first
two polar angles were the same and the third was 0o to 120o with the step of 2o. The first two
angles were copied from the table of peaks of the experimental SRF.
A similar protocol was used in the structure solution of the oxygenating component of 3,6-
diketocamphane monooxygenase fromPseudomonas putida(Isupov & Lebedev, 2008). In the
latter case the homology was much lower (14%), but there was only one dimer to locate in
the asymmetric unit. The automation of this protocol is straightforward and only requires a
simple additional program to test the symmetry of the experimental SRF against the point group
symmetry of the model.
The crystal structure solution of anti-TRAP fromB. licheniformisunderlines the importance
of using a conserved protein oligomer for the MR. It was the anti-TRAP trimer that was con-
served in two species,B. subtilisandB. licheniformisalthough both homologue proteins form
dodecamers with quite rare 23 point group symmetry.
66
2.3 Partially constrained exhaustive search with the CRF target
The biochemical and structural studies of hydroxycinnamoyl-CoA hydratase-lyase (HCHL)
from Pseudomonas fluorescensAN103 were carried out by Dr. Gideon Grogan’s group (YSBL)
in collaboration with Dr. Marek Brzozowski (YSBL), Dr. Nicholas Walton (Institute of Food
Research, Norwich), Dr. Derek Smith and Dr. Chandra Verma (Bioinformatics Institute, Sin-
gapore). My role was in finding the MR solution of the crystal structure of HCHL (PDB code
2j5i). The results are presented by Leonardet al. (2006). The details of the structure solution
are presented in a separate publication (Lebedevet al., 2008).
Compared to the previously described protocols, the constraints on the orientation of the
oligomer were relaxed in this case, but constraints on its internal organisation were used in full.
The oligomeric models from a one-parameter family were scored by maximum value of the
CRF and the consistency of the orientation of the best oligomer with the SRF was a validation
criterion. This approach was adopted because it seemed essential to build a reliable model of
the complete oligomer prior to any use of the TF, which was complicated by translational NCS.
2.3.1 Background
The bacteriumP. fluorescensAN103 is able to grow on ferulic acid as the sole carbon source
utilising a catabolic pathwayvia vanillin (Narbad & Gasson, 1998). An interest in the transfor-
mation of ferulic acid, an abundant natural product into a flavour agent vanillin is dictated by its
industrial significance.
Ferulic acid is transformed to vanillin in a three-step reaction. Ferulic acid was first ligated to
coenzyme A to form feruloyl-CoA by the action of 4-hydroxycinnamate-CoA ligase-synthetase.
The acyl-CoA thioester of ferulic acid was then transformedto vanillin by the action of a single
enzyme, HCHL, which first catalyses the hydration of the double bond between C2 and C3 to
yield a hydroxyacyl-CoA and then retro-aldol cleavages theC2-C3 bond to give vanillin and
acetyl-CoA.
The enzymatic transformation performed by HCHL representsan interesting mode of en-
zymatic activity that is reminiscent of the hydration of double bonds in enoyl-CoA and related
substrates in fatty-acid oxidation pathways by the enzyme crotonase or enoyl-CoA hydratase
(ECH). In contrast to ECH, HCHL performs a second half-reaction, a cleavage of a C-C bond.
The hydration mechanism proposed for ECH by (Bahnsonet al., 2002) involves sin-addition in
which the only source of protons is the catalytic water molecule donating all its three atoms to
the product, presumably in a concerted mode. Thus, of special interest is the question whether
such hydration mechanism is conserved in the two enzymes andhow the active cite of HCHL is
modified to be able to perform the second half-reaction.
67
Both ECH and HCHL are members of a low-sequence-identity superfamily of enzymes
known as the crotonase or low-similarity hydratase/isomerase (LSI/H) superfamily. The en-
zymes of this superfamily are characterised by pronounced structural similarity, which is at odds
with the divergent catalytic chemistry including the stereospecific hydration of double bonds
performed by ECH and also dehalogenation (Benninget al., 1996), double-bond isomerisation
in fatty acids (Modiset al., 1998; Mursulaet al., 2001), cyclisation/aromatisation reactions in
the synthesis of vitamin K intermediates (Truglioet al., 2003) and the retro-Dieckmann con-
densation (Eberhard & Gerlt, 2004). The divergent catalysis is often enabled by amino acid
residues which have no counterparts in the sequences of the other superfamily members (Gerlt
& Babbitt, 2001).
The majority of solved crotonase structures are homohexamers consisting of a dimer of
trimers. Moreover, the trimers of the closest HCHL homologues possess an intra-trimer domain-
swapping fold as defined by Hubbardet al. (2005), in which the trimer is stabilised by extensive
interactions between the C-terminal domain of one subunit with the N-terminal domain of its
neighbour. These homologues include ECH, dienoyl-CoA isomerase, 4-chlorobenzoyl dehalo-
genase and the human AUH protein. The major overall difference between these homologous
hexamers is therefore defined by different relative orientations of trimers.
HCHL was crystallised and a native 1.8A resolution data set was collected at ESRF Greno-
ble station ID14-EH1 (Leonardet al., 2004). The crystal belonged to the space groupP21212
with unit cell dimensionsa = 154.2 A, b = 167.5 A, c = 130.8 A.
Three structures of HCHL sequence homologues, rat liver ECH(24% sequence identity;
PDB code 1dub; Engelet al., 1996)T. thermophilusECH (31% sequence identity; PDB code
1uiy) and 4-chlorobenzoyl-CoA dehalogenase fromPseudomonas sp.(28% sequence identity;
PDB code 1nzy; Benninget al., 1996) were used in the structure solution by MR as described
below. These structures are further referred to by their PDBcodes.
The native CRF and the Patterson map were indicative of two hexamers in the asymmetric
unit related by translational NCS 0.66a + 0.30b + 0.50c (the heights of the corresponding
Patterson peaks were 23% of the origin peak at 3A resolution cut-off). This interpretation was
in agreement with the solvent content of 46% corresponding to twelve subunits per asymmetric
unit. Hexamers and trimers derived from the crystal structures of the selected homologues were
used as a search models in the preliminary MR trials, along with the single subunits. Both
complete models and their truncated versions were tested using MOLREP(Vagin & Teplyakov,
1997). The TF searches were attempted in both default mode, in which the translational NCS
is automatically accounted for (§1.1.15) and with the translational NCS option turned off. No
significant contrast was observed in the RF or TF for all data and for resolution cut-off 3A. The
difficulties with the MR were attributed to different organisation of the hexamers in the target
68
structure compared to the search models and to the presence of the translational NCS.
2.3.2 Structure solution
The RF uses only the fraction of the Patterson map within a sphere centred at the origin, which
does not include the non-origin peaks. It was therefore reasonable to try a non-standard ap-
proach, in which the search hexamer is adjusted using the RF as a target function. It was ex-
pected that the subsequent TF search with two corrected hexamers related by translational NCS
would be substantially assisted by the packing function, astwo hexamers would constitute a
complete asymmetric unit except for the truncated residues.
To achieve the best possible contrast in the MR searches and to make the MR searches
with alternative models comparable, a careful search modelpreparation was undertaken. Firstly,
the models of single hexamers were derived from PDB entries 1dub, 1uiy and 1nzy, in two
of which, 1uiy and 1nzy, the asymmetric unit contained one and three molecules, respectively,
and the complete hexamers were generated by crystallographic symmetry. Secondly, the single
subunits from three homologues were superimposed using thesecondary structure match (SSM;
Krissinel & Henrick, 2004) implemented inCoot(Emsley & Cowtan, 2004) to identify segments
of residues that were spatially aligned in all three homologues and had close values of the back-
bone torsion angles (Fig.2.3a). These highly conserved segments (Fig.2.3b) were kept intact in
corresponding hexameric models, while all other residues were removed from all their subunits.
In particular, the removed segments included the complete C-terminal domain and all loops.
Figs.2.3(c), 2.3(d) and2.3(e) represent the spatial alignment of the three truncated hexameric
models by one of two trimers. The fitted and free trimers are separately shown in Figs.2.3(c)
and2.3(e), respectively. The side view of the aligned hexamers is represented in Fig.2.3(d).
The difference in orientations of the free trimers was measured usingLSQKAB(Fig. 2.3e).
Comparison of oligomers from homologue structures (Fig.2.3) suggests that trimers in the
unknown structure are spatially similar, but the hexamers are different from those in homo-
logues. The centres of masses of the trimers have similar spacing in homologous hexamers.
Assuming similar spacing in the unknown structure, the relative rotation of the trimers around
three-fold axis is the only parameter to vary in order to build a correct hexameric model. There-
fore, a set of models was generated from the three truncated hexamers with the relative rotations
of trimers in the range 0-120o (sufficient range for the point group 32) and with an increment of
2o. Smaller differences in the organisation of trimers and in the spacing between trimers might
be nevertheless essential for the performance of the MR. In effect, the related parameters were
roughly sampled by scanning hexameric models derived from three different homologues.
The RF (MOLREP) at 5A resolution cut-off was performed with these three sets of models
using atcsh-script to generate plots in Figs.2.4(a), 2.4(b) and2.4(c), in which the maximum
69
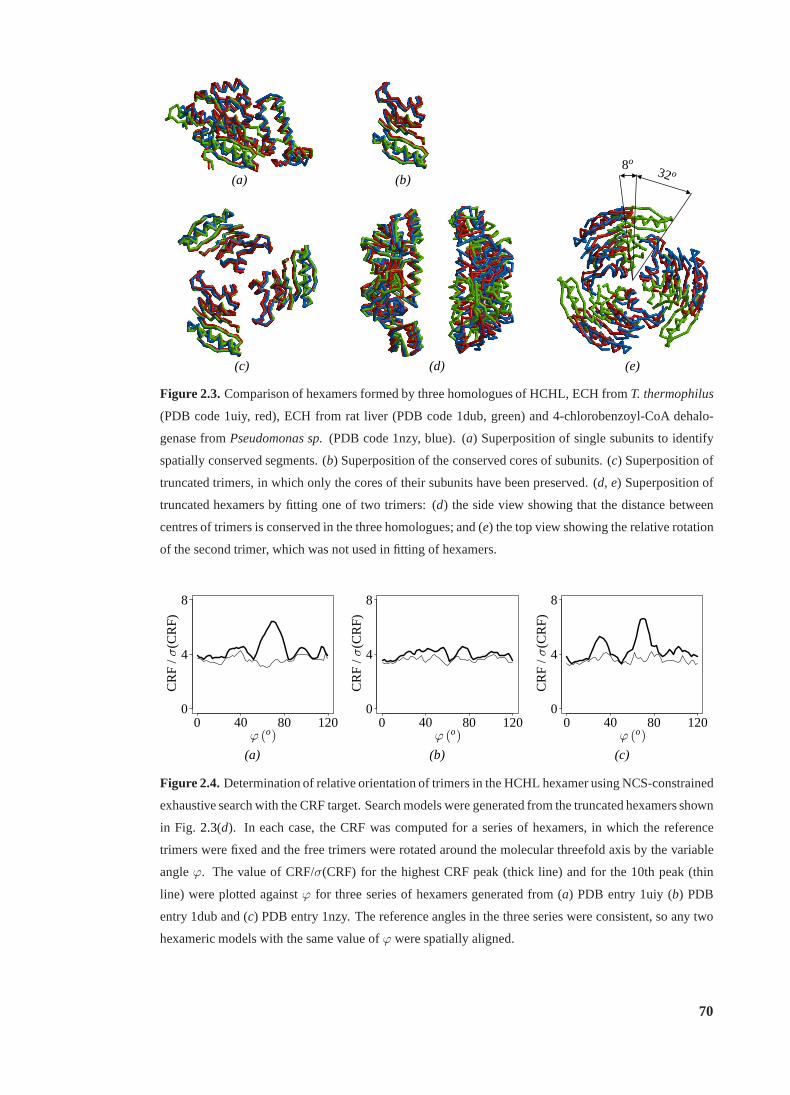
(a) (b)
(c) (d) (e)
8o32o
Figure 2.3.Comparison of hexamers formed by three homologues of HCHL, ECH fromT. thermophilus
(PDB code 1uiy, red), ECH from rat liver (PDB code 1dub, green) and 4-chlorobenzoyl-CoA dehalo-
genase fromPseudomonas sp.(PDB code 1nzy, blue). (a) Superposition of single subunits to identify
spatially conserved segments. (b) Superposition of the conserved cores of subunits. (c) Superposition of
truncated trimers, in which only the cores of their subunitshave been preserved. (d, e) Superposition of
truncated hexamers by fitting one of two trimers: (d) the side view showing that the distance between
centres of trimers is conserved in the three homologues; and(e) the top view showing the relative rotation
of the second trimer, which was not used in fitting of hexamers.
0 40 80 1200
4
8
ϕ (o)
CR
F/σ
(CR
F)
0 40 80 1200
4
8
ϕ (o)
CR
F/σ
(CR
F)
0 40 80 1200
4
8
ϕ (o)
CR
F/σ
(CR
F)
(a) (b) (c)
Figure 2.4.Determination of relative orientation of trimers in the HCHL hexamer using NCS-constrained
exhaustive search with the CRF target. Search models were generated from the truncated hexamers shown
in Fig. 2.3(d). In each case, the CRF was computed for a series of hexamers,in which the reference
trimers were fixed and the free trimers were rotated around the molecular threefold axis by the variable
angleϕ. The value of CRF/σ(CRF) for the highest CRF peak (thick line) and for the 10th peak (thin
line) were plotted againstϕ for three series of hexamers generated from (a) PDB entry 1uiy (b) PDB
entry 1dub and (c) PDB entry 1nzy. The reference angles in the three series were consistent, so any two
hexameric models with the same value ofϕ were spatially aligned.
70
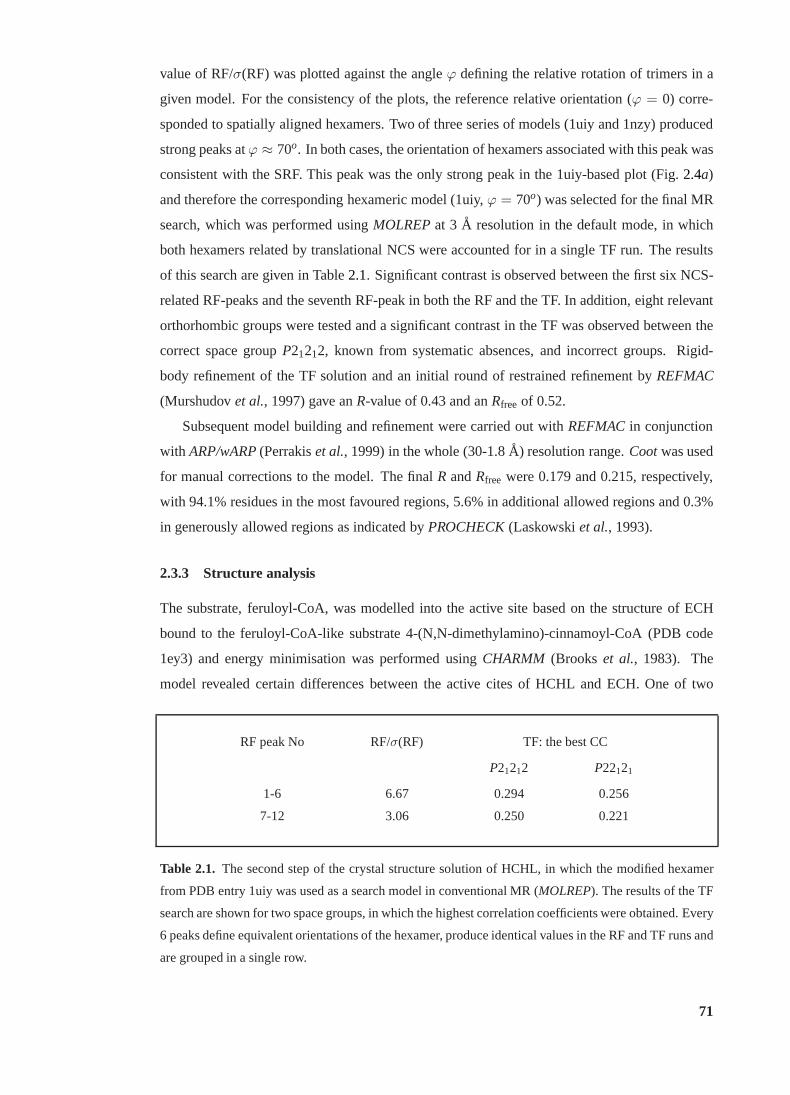
value of RF/σ(RF) was plotted against the angleϕ defining the relative rotation of trimers in a
given model. For the consistency of the plots, the referencerelative orientation (ϕ = 0) corre-
sponded to spatially aligned hexamers. Two of three series of models (1uiy and 1nzy) produced
strong peaks atϕ ≈ 70o. In both cases, the orientation of hexamers associated withthis peak was
consistent with the SRF. This peak was the only strong peak inthe 1uiy-based plot (Fig.2.4a)
and therefore the corresponding hexameric model (1uiy,ϕ = 70o) was selected for the final MR
search, which was performed usingMOLREPat 3 A resolution in the default mode, in which
both hexamers related by translational NCS were accounted for in a single TF run. The results
of this search are given in Table2.1. Significant contrast is observed between the first six NCS-
related RF-peaks and the seventh RF-peak in both the RF and the TF. In addition, eight relevant
orthorhombic groups were tested and a significant contrast in the TF was observed between the
correct space groupP21212, known from systematic absences, and incorrect groups. Rigid-
body refinement of the TF solution and an initial round of restrained refinement byREFMAC
(Murshudovet al., 1997) gave anR-value of 0.43 and anRfree of 0.52.
Subsequent model building and refinement were carried out with REFMACin conjunction
with ARP/wARP(Perrakiset al., 1999) in the whole (30-1.8A) resolution range.Cootwas used
for manual corrections to the model. The finalR andRfree were 0.179 and 0.215, respectively,
with 94.1% residues in the most favoured regions, 5.6% in additional allowed regions and 0.3%
in generously allowed regions as indicated byPROCHECK(Laskowskiet al., 1993).
2.3.3 Structure analysis
The substrate, feruloyl-CoA, was modelled into the active site based on the structure of ECH
bound to the feruloyl-CoA-like substrate 4-(N,N-dimethylamino)-cinnamoyl-CoA (PDB code
1ey3) and energy minimisation was performed usingCHARMM (Brooks et al., 1983). The
model revealed certain differences between the active cites of HCHL and ECH. One of two
RF peak No RF/σ(RF) TF: the best CC
P21212 P22121
1-6 6.67 0.294 0.256
7-12 3.06 0.250 0.221
Table 2.1. The second step of the crystal structure solution of HCHL, inwhich the modified hexamer
from PDB entry 1uiy was used as a search model in conventionalMR (MOLREP). The results of the TF
search are shown for two space groups, in which the highest correlation coefficients were obtained. Every
6 peaks define equivalent orientations of the hexamer, produce identical values in the RF and TF runs and
are grouped in a single row.
71
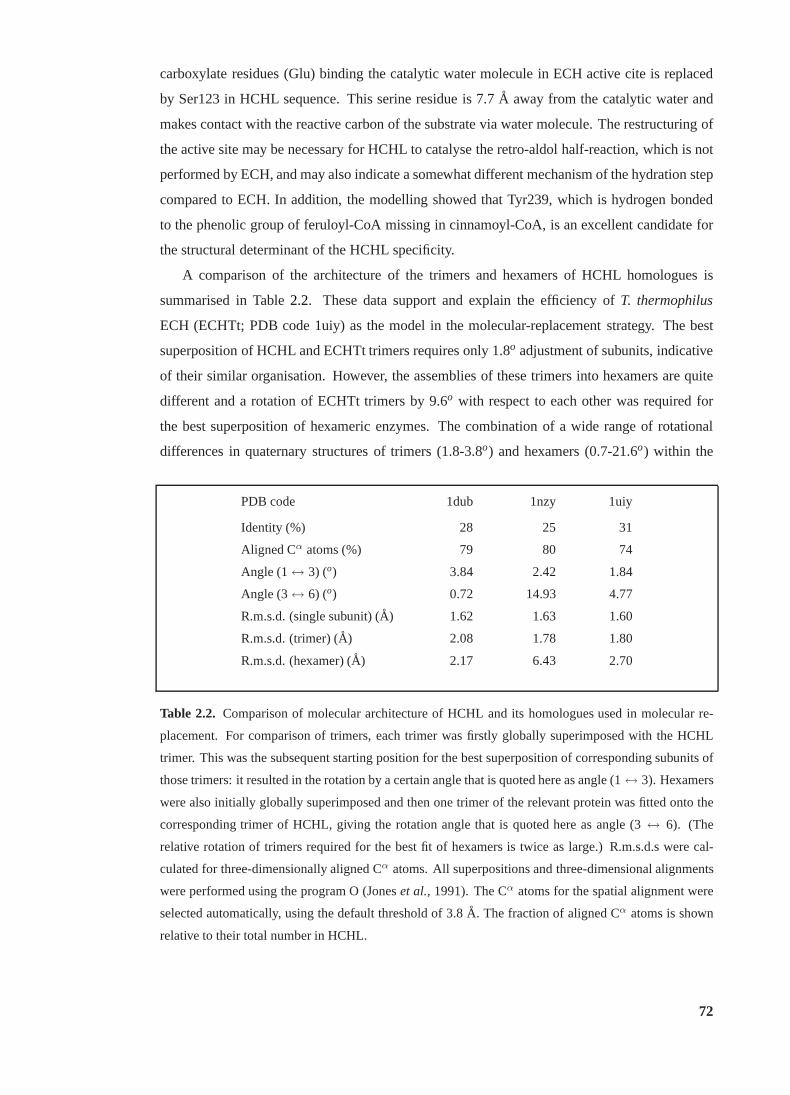
carboxylate residues (Glu) binding the catalytic water molecule in ECH active cite is replaced
by Ser123 in HCHL sequence. This serine residue is 7.7A away from the catalytic water and
makes contact with the reactive carbon of the substrate via water molecule. The restructuring of
the active site may be necessary for HCHL to catalyse the retro-aldol half-reaction, which is not
performed by ECH, and may also indicate a somewhat differentmechanism of the hydration step
compared to ECH. In addition, the modelling showed that Tyr239, which is hydrogen bonded
to the phenolic group of feruloyl-CoA missing in cinnamoyl-CoA, is an excellent candidate for
the structural determinant of the HCHL specificity.
A comparison of the architecture of the trimers and hexamersof HCHL homologues is
summarised in Table2.2. These data support and explain the efficiency ofT. thermophilus
ECH (ECHTt; PDB code 1uiy) as the model in the molecular-replacement strategy. The best
superposition of HCHL and ECHTt trimers requires only 1.8o adjustment of subunits, indicative
of their similar organisation. However, the assemblies of these trimers into hexamers are quite
different and a rotation of ECHTt trimers by 9.6o with respect to each other was required for
the best superposition of hexameric enzymes. The combination of a wide range of rotational
differences in quaternary structures of trimers (1.8-3.8o) and hexamers (0.7-21.6o) within the
PDB code 1dub 1nzy 1uiy
Identity (%) 28 25 31
Aligned Cα atoms (%) 79 80 74
Angle (1↔ 3) (o) 3.84 2.42 1.84
Angle (3↔ 6) (o) 0.72 14.93 4.77
R.m.s.d. (single subunit) (A) 1.62 1.63 1.60
R.m.s.d. (trimer) (A) 2.08 1.78 1.80
R.m.s.d. (hexamer) (A) 2.17 6.43 2.70
Table 2.2. Comparison of molecular architecture of HCHL and its homologues used in molecular re-
placement. For comparison of trimers, each trimer was firstly globally superimposed with the HCHL
trimer. This was the subsequent starting position for the best superposition of corresponding subunits of
those trimers: it resulted in the rotation by a certain anglethat is quoted here as angle (1↔ 3). Hexamers
were also initially globally superimposed and then one trimer of the relevant protein was fitted onto the
corresponding trimer of HCHL, giving the rotation angle that is quoted here as angle (3↔ 6). (The
relative rotation of trimers required for the best fit of hexamers is twice as large.) R.m.s.d.s were cal-
culated for three-dimensionally aligned Cα atoms. All superpositions and three-dimensional alignments
were performed using the program O (Joneset al., 1991). The Cα atoms for the spatial alignment were
selected automatically, using the default threshold of 3.8A. The fraction of aligned Cα atoms is shown
relative to their total number in HCHL.
72
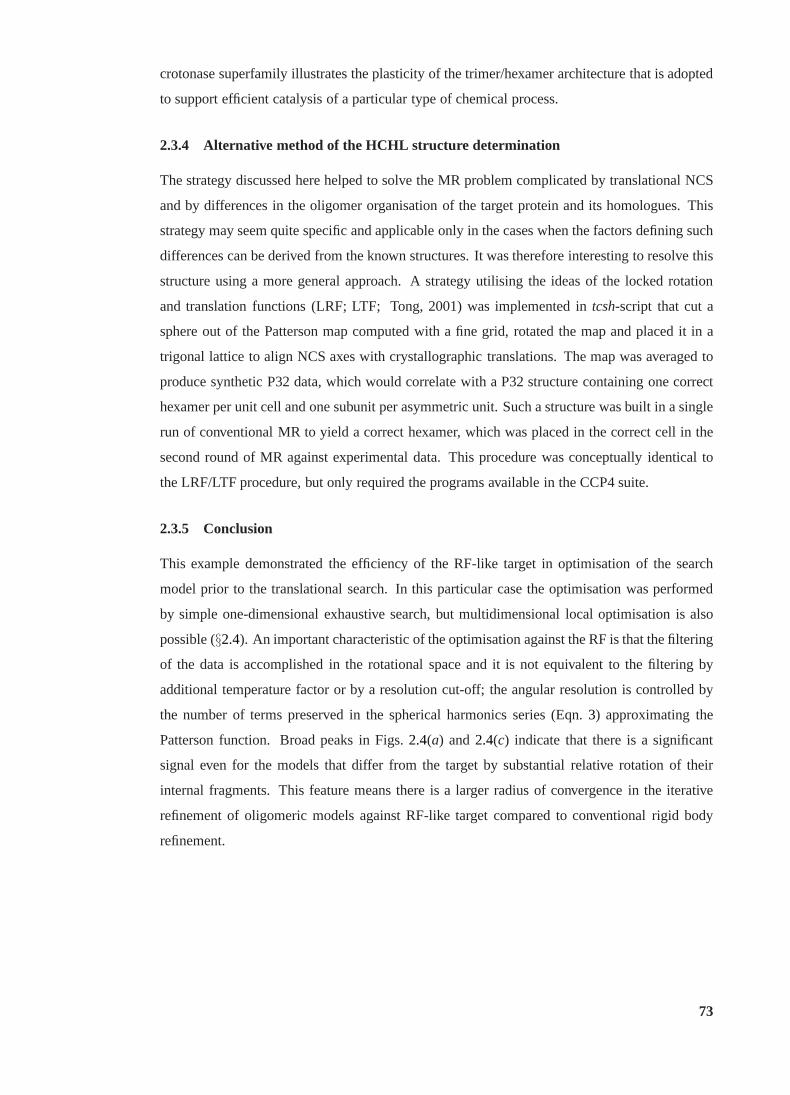
crotonase superfamily illustrates the plasticity of the trimer/hexamer architecture that is adopted
to support efficient catalysis of a particular type of chemical process.
2.3.4 Alternative method of the HCHL structure determination
The strategy discussed here helped to solve the MR problem complicated by translational NCS
and by differences in the oligomer organisation of the target protein and its homologues. This
strategy may seem quite specific and applicable only in the cases when the factors defining such
differences can be derived from the known structures. It wastherefore interesting to resolve this
structure using a more general approach. A strategy utilising the ideas of the locked rotation
and translation functions (LRF; LTF; Tong, 2001) was implemented intcsh-script that cut a
sphere out of the Patterson map computed with a fine grid, rotated the map and placed it in a
trigonal lattice to align NCS axes with crystallographic translations. The map was averaged to
produce synthetic P32 data, which would correlate with a P32structure containing one correct
hexamer per unit cell and one subunit per asymmetric unit. Such a structure was built in a single
run of conventional MR to yield a correct hexamer, which was placed in the correct cell in the
second round of MR against experimental data. This procedure was conceptually identical to
the LRF/LTF procedure, but only required the programs available in the CCP4 suite.
2.3.5 Conclusion
This example demonstrated the efficiency of the RF-like target in optimisation of the search
model prior to the translational search. In this particularcase the optimisation was performed
by simple one-dimensional exhaustive search, but multidimensional local optimisation is also
possible (§2.4). An important characteristic of the optimisation againstthe RF is that the filtering
of the data is accomplished in the rotational space and it is not equivalent to the filtering by
additional temperature factor or by a resolution cut-off; the angular resolution is controlled by
the number of terms preserved in the spherical harmonics series (Eqn.3) approximating the
Patterson function. Broad peaks in Figs.2.4(a) and 2.4(c) indicate that there is a significant
signal even for the models that differ from the target by substantial relative rotation of their
internal fragments. This feature means there is a larger radius of convergence in the iterative
refinement of oligomeric models against RF-like target compared to conventional rigid body
refinement.
73
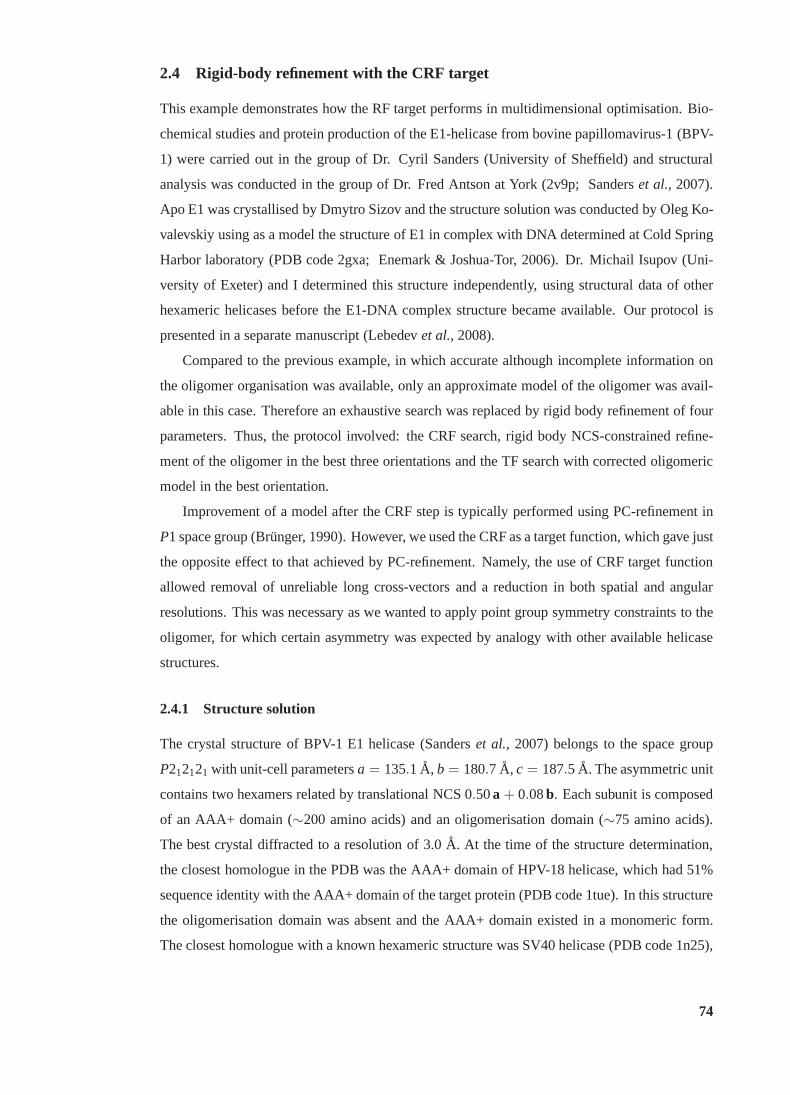
2.4 Rigid-body refinement with the CRF target
This example demonstrates how the RF target performs in multidimensional optimisation. Bio-
chemical studies and protein production of the E1-helicasefrom bovine papillomavirus-1 (BPV-
1) were carried out in the group of Dr. Cyril Sanders (University of Sheffield) and structural
analysis was conducted in the group of Dr. Fred Antson at York(2v9p; Sanderset al., 2007).
Apo E1 was crystallised by Dmytro Sizov and the structure solution was conducted by Oleg Ko-
valevskiy using as a model the structure of E1 in complex withDNA determined at Cold Spring
Harbor laboratory (PDB code 2gxa; Enemark & Joshua-Tor, 2006). Dr. Michail Isupov (Uni-
versity of Exeter) and I determined this structure independently, using structural data of other
hexameric helicases before the E1-DNA complex structure became available. Our protocol is
presented in a separate manuscript (Lebedevet al., 2008).
Compared to the previous example, in which accurate although incomplete information on
the oligomer organisation was available, only an approximate model of the oligomer was avail-
able in this case. Therefore an exhaustive search was replaced by rigid body refinement of four
parameters. Thus, the protocol involved: the CRF search, rigid body NCS-constrained refine-
ment of the oligomer in the best three orientations and the TFsearch with corrected oligomeric
model in the best orientation.
Improvement of a model after the CRF step is typically performed using PC-refinement in
P1 space group (Brunger, 1990). However, we used the CRF as a target function, which gave just
the opposite effect to that achieved by PC-refinement. Namely, the use of CRF target function
allowed removal of unreliable long cross-vectors and a reduction in both spatial and angular
resolutions. This was necessary as we wanted to apply point group symmetry constraints to the
oligomer, for which certain asymmetry was expected by analogy with other available helicase
structures.
2.4.1 Structure solution
The crystal structure of BPV-1 E1 helicase (Sanderset al., 2007) belongs to the space group
P212121 with unit-cell parametersa = 135.1 A, b = 180.7 A, c = 187.5 A. The asymmetric unit
contains two hexamers related by translational NCS 0.50a + 0.08b. Each subunit is composed
of an AAA+ domain (∼200 amino acids) and an oligomerisation domain (∼75 amino acids).
The best crystal diffracted to a resolution of 3.0A. At the time of the structure determination,
the closest homologue in the PDB was the AAA+ domain of HPV-18helicase, which had 51%
sequence identity with the AAA+ domain of the target protein(PDB code 1tue). In this structure
the oligomerisation domain was absent and the AAA+ domain existed in a monomeric form.
The closest homologue with a known hexameric structure was SV40 helicase (PDB code 1n25),
74
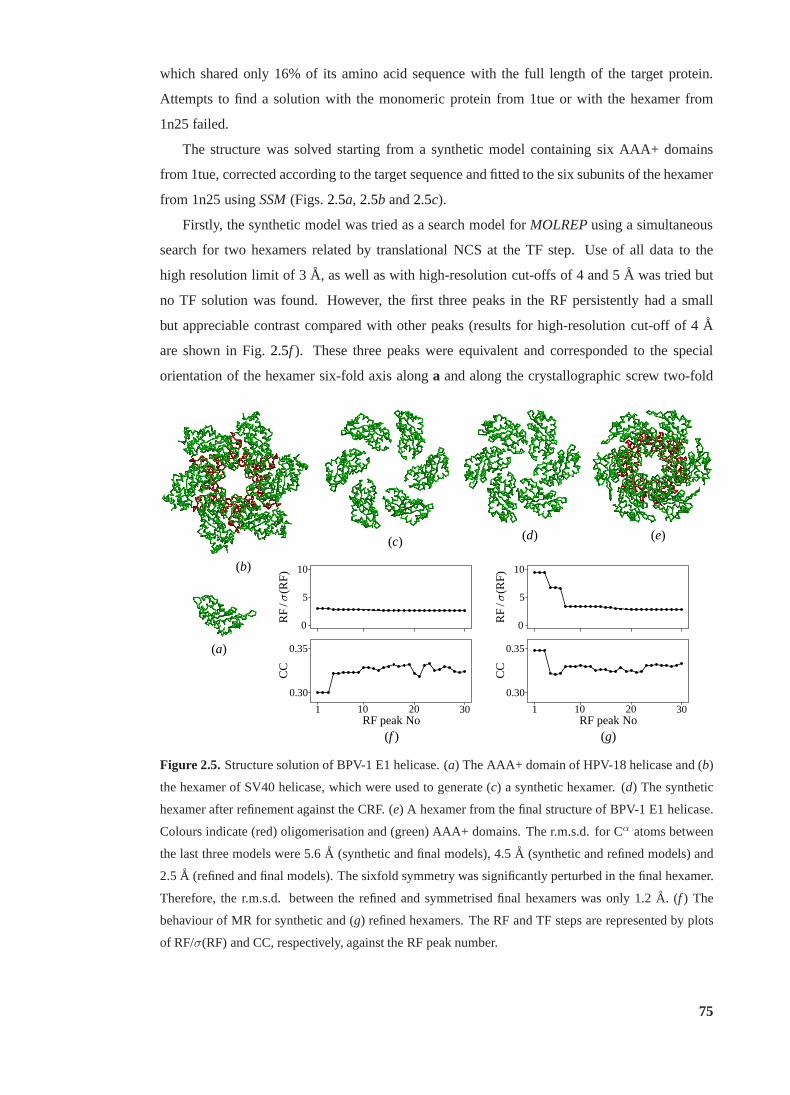
which shared only 16% of its amino acid sequence with the fulllength of the target protein.
Attempts to find a solution with the monomeric protein from 1tue or with the hexamer from
1n25 failed.
The structure was solved starting from a synthetic model containing six AAA+ domains
from 1tue, corrected according to the target sequence and fitted to the six subunits of the hexamer
from 1n25 usingSSM(Figs.2.5a, 2.5b and2.5c).
Firstly, the synthetic model was tried as a search model forMOLREPusing a simultaneous
search for two hexamers related by translational NCS at the TF step. Use of all data to the
high resolution limit of 3A, as well as with high-resolution cut-offs of 4 and 5A was tried but
no TF solution was found. However, the first three peaks in theRF persistently had a small
but appreciable contrast compared with other peaks (results for high-resolution cut-off of 4A
are shown in Fig.2.5f ). These three peaks were equivalent and corresponded to thespecial
orientation of the hexamer six-fold axis alonga and along the crystallographic screw two-fold
(a)
(b)
(c) (d) (e)
RF
/σ(R
F)
0
5
10
RFpeakNo
CC
1 10 20 30
0.30
0.35
(f )
RF
/σ(R
F)
0
5
10
RFpeakNo
CC
1 10 20 30
0.30
0.35
(g)
Figure 2.5.Structure solution of BPV-1 E1 helicase. (a) The AAA+ domain of HPV-18 helicase and (b)
the hexamer of SV40 helicase, which were used to generate (c) a synthetic hexamer. (d) The synthetic
hexamer after refinement against the CRF. (e) A hexamer from the final structure of BPV-1 E1 helicase.
Colours indicate (red) oligomerisation and (green) AAA+ domains. The r.m.s.d. for Cα atoms between
the last three models were 5.6A (synthetic and final models), 4.5A (synthetic and refined models) and
2.5A (refined and final models). The sixfold symmetry was significantly perturbed in the final hexamer.
Therefore, the r.m.s.d. between the refined and symmetrisedfinal hexamers was only 1.2A. (f ) The
behaviour of MR for synthetic and (g) refined hexamers. The RF and TF steps are represented by plots
of RF/σ(RF) and CC, respectively, against the RF peak number.
75
axis. Such an orientation of the hexamer was consistent withthe SRF and was considered as
a likely RF-solution. However, the best CC in the TF for this orientation was lower than for
other orientations and it seemed likely (and confirmed later) that the correct TF solution was
suppressed by the packing constraints.
Therefore we assumed that the hexamer in the unknown structure had a slightly different
organisation and undertook refinement of the synthetic hexamer model. The data up to reso-
lution of 4.5A were used for efficiency, but it was known from the previous RF trials that the
orientation of interest had the first rank for the resolutioncut-offs from 3 to 5A. During this
procedure four parameters were refined: three angles defining the orientation of the subunitA
and the distance between the centre of subunitA and the sixfold axis. The remaining five sub-
units were generated from subunitA by the sixfold symmetry. The target function was the value
of RF/σ(RF) for the highest RF peak. Maximisation of the target function was performed iter-
atively using atcsh-script. For a given current hexamer, eight new hexamers were generated,
in which the distance was incremented by±1 A or one of the angular parameters was incre-
mented by±1o. MOLREPwas used to compute the RF for each of new hexamers. The values
of the target function, RF/σ(RF) for the first RF peaks were extracted from the log files. The
new hexamer with the highest value of the target function became the current model in the next
iteration. The procedure was terminated when none of the newmodels gave an increase in the
target function compared with the current model. The refinement rotated the subunits by 10o and
translated their centres of mass by 6A (Fig. 2.5d). Using the refined hexamer, the behaviour
of conventional MR improved dramatically (Fig.2.5g). The refined hexamer (Fig.2.5d) and
the hexamer from the final structure (Fig.2.5e) were very similar to each other and differed
significantly from the initial synthetic hexamer (Fig.2.5c).
Similar refinements were performed with the fourth and seventh peaks of the RF from the
starting model. The target functions was the value of RF/σ(RF) for the RF peaks closest to the
initial peak. The increase in the target function was significantly less than in the refinement with
the first peak.
2.4.2 Concluding remarks
After the structure was solved it became evident why the default MR protocol with the synthetic
model failed, although the correct orientation was the firstin the list of the RF peaks. The large
Cα r.m.s.d. of 5.6A between the synthetic and final hexamers (Figs.2.5c and2.5e) and larger
size of the former prevented the TF solution and, in particular, a proper functioning of the PF. On
the other hand, it is unlikely to be possible to solve a structure with translational NCS without
packing constraints.
76

It seems likely that the success of refinement using CRF were owing to the following rea-
sons, (i) the presence of NCS constraints in the successful refinement protocol, (ii) additional
reduction in the angular resolution in the RF target (spherical harmonics with largel are ignored
in the RF by default) and (iii) the absence in the RF target of long cross-vectors, which may
result in false local minima. However, a general implementation of such refinement does not
necessarily imply the use of spherical harmonics. For example, adjustment of the angular reso-
lution can be performed by refining the TLS parameters of the rigid groups. An improved rigid
body refinement program could be useful in cases similar to one described here and those in
which the adjustment of a multi-domain model is needed, as inthe next example.
77
2.5 MR with feedback from the refined partial model
Structural studies of the hypothetical protein MTH685 fromthe archaeonMethanothermobacte-
ria thermautotrophicuswas part of a mini structural genomics project on RNA-binding proteins
carried out in the group of Dr. Fred Antson (YSBL) in collaboration with several other groups.
The protein was produced, characterised, crystallised andthe X-ray data were collected by Dr.
Chyan Leong Ng. Dr. Michail Isupov (University of Exeter) and I used the available X-ray data
and solved the structure (Lebedevet al., 2008). A manuscript describing the structure is being
prepared by Dr. Chyan Leong Ng.
There are two three-domain molecules in the asymmetric unitof the crystal. Flexibility of
the molecules prevented a straightforward structure determination despite the availability of a
closely homologous structure. A domain-by-domain search was therefore performed alternated
with restrained refinements of partial structures, as proposed by Brunger (1990). Furthermore,
the refined domains were the search models in the subsequent steps of the MR. In effect, the
restrained refinements allowed utilisation of higher-resolution data, which otherwise would not
contribute to the MR searches with less similar models.
2.5.1 Structure solution
The symmetry relations between structural elements (subunits or domains) forming the asym-
metric unit are not necessarily obvious from the SRF or othermethods. Moreover, there can be
several different types of structural elements. In such cases, the NCS-based protocols are not
applicable and the structure solution requires a standard one-by-one search with very incom-
plete search models. Two problems are usually encountered in this approach. Firstly, a minor
problem is the lack of contrast in the TF when positioning thelast few structural elements. The
major problem is that the RF is calculated only once for each search model, each representing
only a small fraction of the asymmetric unit (Fig.2.6a). Even if the search model is adequately
modified, some of the correct RF peaks may remain weak owing tothe specific configuration
of the interatomic vectors in the actual crystal structure.Such peaks are therefore absent in the
list of top RF peaks provided for the further TF search. As a result, the corresponding elements
of the asymmetric unit are not positioned at all. If, however, a partial MR solution is found,
restrained refinement of the partial structure allows an update of the search model(s) and the list
of RF peaks (Fig.2.6b).
This technique was instrumental in the determination of thecrystal structure of the hypo-
thetical protein MTH685 from the archaeonMethanothermobacteria thermautotrophicus. The
crystal with unit-cell parametersa = 68.3, b = 72.1, c = 146.8 A belonged to the space
groupP2221. X-ray data were collected to a resolution of 1.8A. The asymmetric unit contained
78
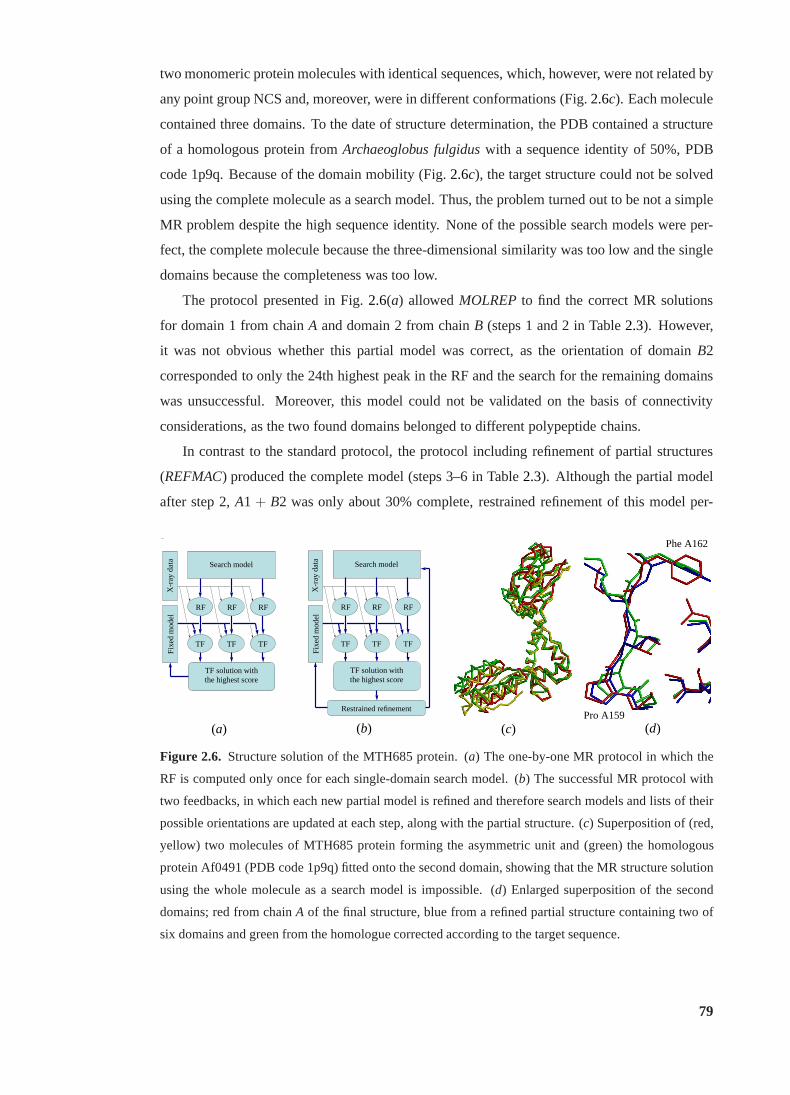
two monomeric protein molecules with identical sequences,which, however, were not related by
any point group NCS and, moreover, were in different conformations (Fig.2.6c). Each molecule
contained three domains. To the date of structure determination, the PDB contained a structure
of a homologous protein fromArchaeoglobus fulgiduswith a sequence identity of 50%, PDB
code 1p9q. Because of the domain mobility (Fig.2.6c), the target structure could not be solved
using the complete molecule as a search model. Thus, the problem turned out to be not a simple
MR problem despite the high sequence identity. None of the possible search models were per-
fect, the complete molecule because the three-dimensionalsimilarity was too low and the single
domains because the completeness was too low.
The protocol presented in Fig.2.6(a) allowedMOLREPto find the correct MR solutions
for domain 1 from chainA and domain 2 from chainB (steps 1 and 2 in Table2.3). However,
it was not obvious whether this partial model was correct, asthe orientation of domainB2
corresponded to only the 24th highest peak in the RF and the search for the remaining domains
was unsuccessful. Moreover, this model could not be validated on the basis of connectivity
considerations, as the two found domains belonged to different polypeptide chains.
In contrast to the standard protocol, the protocol including refinement of partial structures
(REFMAC) produced the complete model (steps 3–6 in Table2.3). Although the partial model
after step 2,A1 + B2 was only about 30% complete, restrained refinement of this model per-
Fix
edm
odel
Fix
edm
odel
X-r
ayda
ta
X-r
ayda
ta SearchmodelSearchmodel
TF solutionwiththehighestscore
TF solutionwiththehighestscore
Restrainedrefinement
RFRFRFRFRFRF
TFTFTFTFTFTF
ProA159
PheA162
(a) (b) (c) (d)
Figure 2.6. Structure solution of the MTH685 protein. (a) The one-by-one MR protocol in which the
RF is computed only once for each single-domain search model. (b) The successful MR protocol with
two feedbacks, in which each new partial model is refined and therefore search models and lists of their
possible orientations are updated at each step, along with the partial structure. (c) Superposition of (red,
yellow) two molecules of MTH685 protein forming the asymmetric unit and (green) the homologous
protein Af0491 (PDB code 1p9q) fitted onto the second domain,showing that the MR structure solution
using the whole molecule as a search model is impossible. (d) Enlarged superposition of the second
domains; red from chainA of the final structure, blue from a refined partial structure containing two of
six domains and green from the homologue corrected according to the target sequence.
79
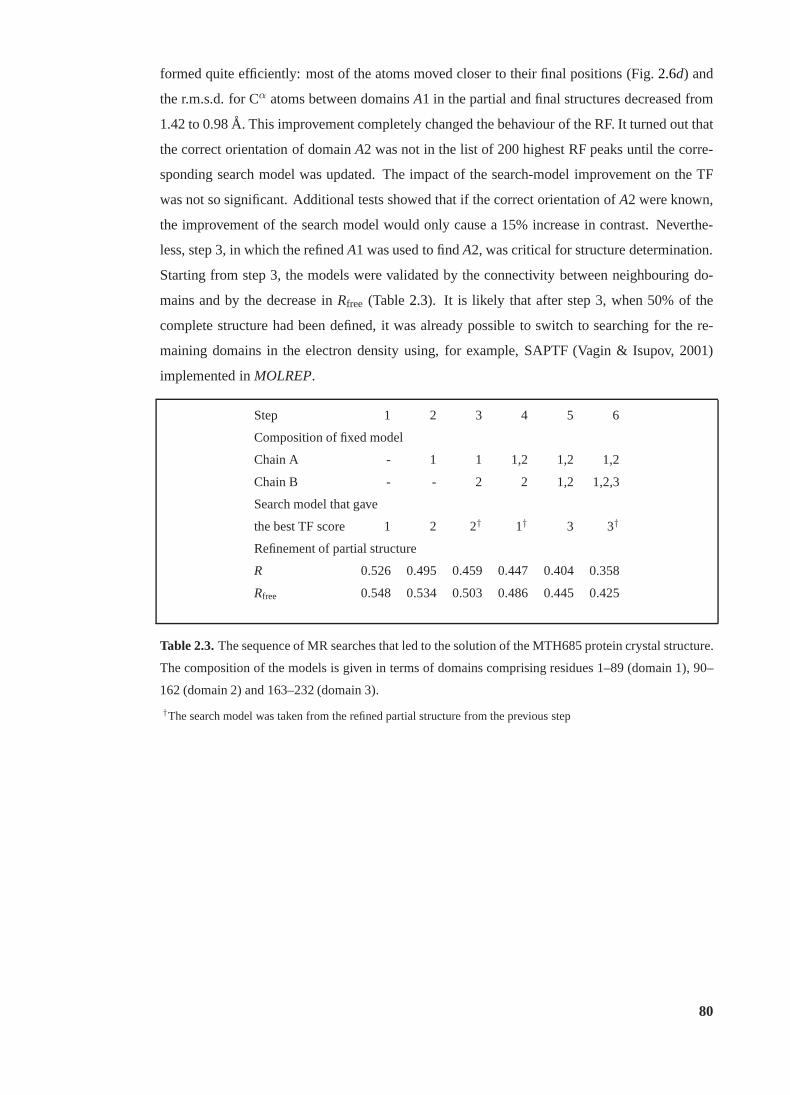
formed quite efficiently: most of the atoms moved closer to their final positions (Fig.2.6d) and
the r.m.s.d. for Cα atoms between domainsA1 in the partial and final structures decreased from
1.42 to 0.98A. This improvement completely changed the behaviour of theRF. It turned out that
the correct orientation of domainA2 was not in the list of 200 highest RF peaks until the corre-
sponding search model was updated. The impact of the search-model improvement on the TF
was not so significant. Additional tests showed that if the correct orientation ofA2 were known,
the improvement of the search model would only cause a 15% increase in contrast. Neverthe-
less, step 3, in which the refinedA1 was used to findA2, was critical for structure determination.
Starting from step 3, the models were validated by the connectivity between neighbouring do-
mains and by the decrease inRfree (Table2.3). It is likely that after step 3, when 50% of the
complete structure had been defined, it was already possibleto switch to searching for the re-
maining domains in the electron density using, for example,SAPTF (Vagin & Isupov, 2001)
implemented inMOLREP.
Step 1 2 3 4 5 6
Composition of fixed model
Chain A - 1 1 1,2 1,2 1,2
Chain B - - 2 2 1,2 1,2,3
Search model that gave
the best TF score 1 2 2† 1† 3 3†
Refinement of partial structure
R 0.526 0.495 0.459 0.447 0.404 0.358
Rfree 0.548 0.534 0.503 0.486 0.445 0.425
Table 2.3.The sequence of MR searches that led to the solution of the MTH685 protein crystal structure.
The composition of the models is given in terms of domains comprising residues 1–89 (domain 1), 90–
162 (domain 2) and 163–232 (domain 3).
†The search model was taken from the refined partial structurefrom the previous step
80
2.6 Substructure solution using NCS-constrained exhaustive search
The structure and function of the portal protein from the phage SPP1 was studied in the group
of Dr. Fred Antson (YSBL) in collaboration with several other groups and researchers (PDB
code 2jes; Lebedevet al., 2007). Dr. Margaret Krause (Max-Planck Institut fur Molekulare
Genetik, Berlin, Germany), Professor Eleanor Dodson (YSBL), Dr. Fred Antson and I were
involved in the crystal structure solution and analysis. Mycontribution was the solution of the
phase problem by MR and analysis of the results and model.
The crystal structure was determined using a Hg-derivativeand native data. The Hg sub-
structure was solved using an NCS-constrained exhaustive search with a CRF-target against the
anomalous differences. This method was first used by Dr. FredAntson to solve the structure
of the TRAP protein (Antsonet al., 1995) and was invoked for this case because of the failure
of direct methods, probably owing to a low signal-to-noise ratio in the isomorphous differences.
Essentially the same approach was used for the structure solution of HCHL (§2.3), except that
in this case it was applied to substructure determination.
The X-ray study of the isolated 13-mer form of the portal protein revealed the structure of
the tunnel loops, which interact with the DNA during the DNA translocation. The asymmetry of
the tunnel loops in the functional dodecameric form of the portal protein was established and the
model of the DNA translocation was proposed based on a combination of various data including
the results of the X-ray model fitting into the electron microscopy (EM) reconstruction of the
connector.
2.6.1 Background
The assembly of tailed bacteriophages and herpesviruses (Fig. 2.8a) starts from the formation
of a procapsid with a portal protein embedded in one of the twelve five-fold icosahedral sym-
metric vertices of the shell. At a later stage, a complex composed of the multisubunit terminase
assembly and concatameric phage dsDNA binds to the portal vertex to form a DNA translocat-
ing molecular motor, which packages DNA into the capsid. Finally, after concatameric DNA
cleavage and terminase dissociation a few other proteins are attached to the portal to form the
tail of infective phage.
In bacteriophage SPP1, the molecular motor consists of three proteins (Fig.2.8a) – gp1,
gp2 (small and large terminase subunits, respectively) andgp6 (portal protein) – and powers
translocation of the 45.9 kbp phage chromosome (Camachoet al., 2003; Oliveiraet al., 2005).
DNA translocation is fuelled by ATP hydrolysis; ATPase activity is associated with the large
terminase subunit gp2. However, it is still not clear if the power stroke generated by gp2 pro-
tein applies directly to the DNA or to the portal protein, causing its structural rearrangement
81
and DNA translocation. All components of the DNA-translocating motor possess distinct sym-
metries. For example, the capsid’s vertex and the backbone of the B-form DNA have five-fold
and screw ten-fold symmetry axes, respectively. In common with the herpesvirus portal protein
(Truset al., 2004), the portal protein of bacteriophage SPP1 can exist as a circular assembly with
varying number of subunits (Lurzet al., 2001; Orlovaet al., 2003): it was found as a 13-subunit
assembly in its isolated form and as a 12-subunit assembly when integrated into the functional
viral capsid. According to the latest results, the small terminase subunit gp1 forms decamers
with ten-fold rotational symmetry (Maria Chechik and Fred Antson, personal communication).
The large terminase subunit gp2 exist in a monomeric form in solution, but the number of gp2
subunits and their orientations in the functional motor assembly is unknown.
High-resolution EM reconstructions of the SPP1 portal protein were available both for the
isolated 13-subunit oligomer (9A resolution) and for the connector (10A resolution), an assem-
bly purified from the viral capsids consisting of the 12-mer portal protein in a coaxial complex
with two other viral components gp15 and gp16 (Orlovaet al., 2003).
Although in all species the portal protein is a central and essential component of the DNA-
translocating machine, the organisation of the molecular motor varies. For example, in bacte-
riophageφ29, the motor consists of three coaxial macromolecular rings, the portal protein, the
ATPase and the procapsid RNA (pRNA) acting as the substrate for ATPase binding (Simpson
et al., 2000), while there is no evidence for the presence of pRNA inother bacteriophages. This
motor generates a force of up to 57 pN, which makes it one of themost powerful molecular
motors discovered so far (Smithet al., 2001). Such a force is needed to pump the viral DNA
against the high internal pressure that increases as the DNAis encapsidated.
The available EM data showed that portal proteins of different phages and herpesviruses all
shared a common turbine-like shape (Valpuesta & Carrascosa, 1994; Orlovaet al., 1999; Trus
et al., 2004). However, they showed no detectable similarity in amino acid sequence and exhibit
large variations in their subunit molecular masses, for example 36 kDa in the case of phageφ29
and 57 kDa in the case of phage SPP1. Therefore, theφ29 portal protein, the only portal protein
for which the crystal structures had been available (Simpson et al., 2000; Guaschet al., 2002),
could not be used as a MR search model for solving the crystal structure of the SPP1 portal
protein.
The operation of the DNA-translocation molecular motor hasbeen the subject of much de-
bate. The low-energy barriers to rotation of symmetry mismatching protein rings relative to
each other led Hendrix (1978) to propose that DNA translocation is accompanied by rotation of
the portal protein inside the capsid vertex. Different models of DNA translocation, all involv-
ing the rotation of the portal protein, were put forward following the EM image analysis of the
SPP1 portal protein (Dubeet al., 1993) and the determination of the X-ray structure of theφ29
82
portal protein (Simpsonet al., 2000; Guaschet al., 2002). These models were based mostly
on symmetry considerations, as even the available X-ray data provided no atomic-scale struc-
tural information about the most constricted part of the internal tunnel that would be in close
contact with the DNA during translocation: the tunnel loopsin theφ29 portal protein (residues
229–245) were either disordered in the native structure (Simpsonet al., 2000) or missing in the
higher-resolution structure of mutant (Guaschet al., 2002).
2.6.2 Crystallisation and X-ray data analysis
Diffracting crystals were obtained for the SPP1 portal protein gp6SizA with the amino acid
substitution N365K. This mutation reduced the length of encapsidated DNA but did not affect
the DNA packaging process (Tavareset al., 1992). The crystallisation conditions were found
by Jekowet al. (1998) and optimised by Dr. Margaret Krause. The best crystals were obtained
using hanging-drop vapour diffusion. A solution containing 8 mg/ml of protein was mixed in a
1:1 ratio with the reservoir solution containing 20% PEG 400, 100mM CaCl2, 50mM HEPES
pH 7.6 and 10% glycerol, which acted also as a cryoprotectant. The non-derivative crystals of
this mutant and the X-ray data from these crystals are further referred to as native crystals and
native data.
The presence of a single cysteine residue (C55) per subunit suggested that the mercury
derivative is a good candidate for isomorphous replacementphasing. The crystals of HgCl2
derivatives were obtained by cocrystallisation, in which different amounts of HgCl2 were added
directly to the protein solution. X-ray data from several native crystals and from several HgCl2
derivative crystals were collected at 100K using synchrotron radiation at the ESRF, beam-
line ID14-4. The data were processed usingDENZOand SCALEPACK(Otwinowski & Mi-
nor, 1997). Some characteristics of the three best crystalsused in structure solution are presented
in Table2.4.
Table2.4 shows that the increase of the concentration of HgCl2 in mother liquor further
improves the resolution of the diffraction data, although it causes increase of non-isomorphism.
This observation suggested that the derivative crystal Hg-1 obtained with lower concentration
of HgCl2 was more suitable for substructure determination, but the less isomorphous derivative
Hg-2 was a better candidate for model building and refinement.
The confirmation that the crystals Hg-1 and Hg-2 were true derivatives came from the SRF
that was computed for the observed native structure factors, and for two sets of isomorphous
differences between the derivative and the native structure factors (Fig.2.7a). The SRF from the
observed structure factors clearly revealed peaks accounting for thirteen-fold NCS (sectionχ =
27.7o) and for interaction between this NCS and crystallographicsymmetry (sectionχ = 180o).
83
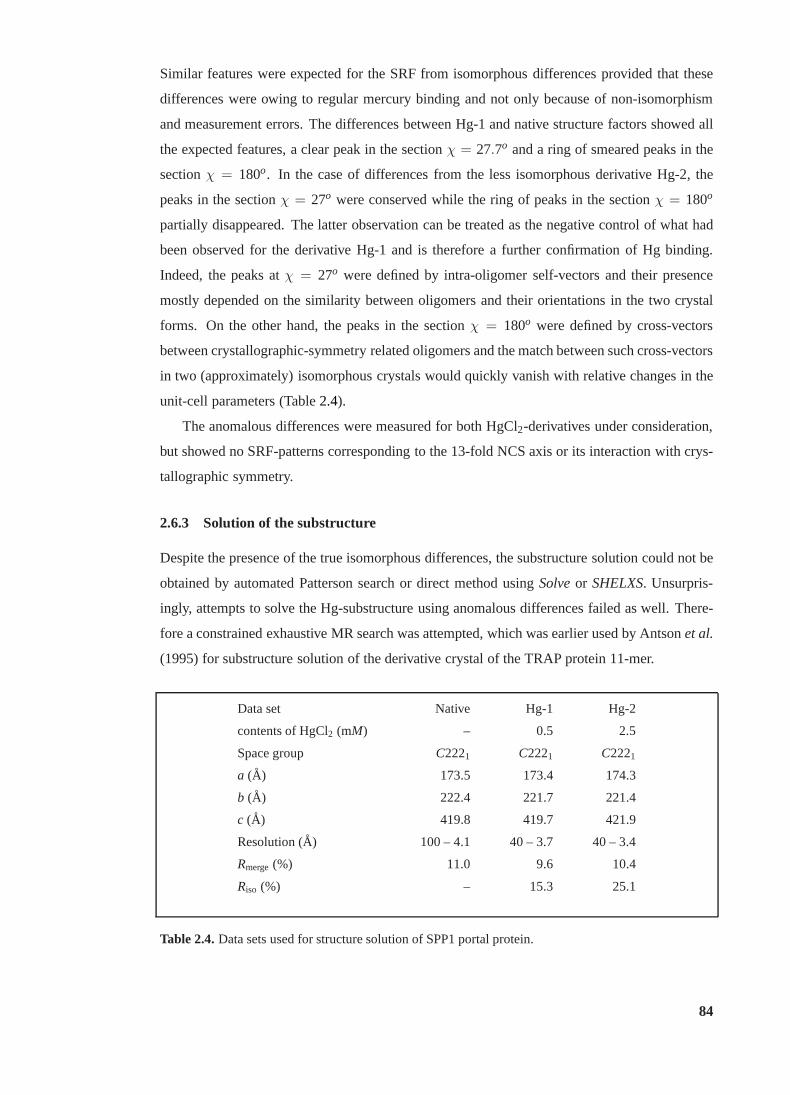
Similar features were expected for the SRF from isomorphousdifferences provided that these
differences were owing to regular mercury binding and not only because of non-isomorphism
and measurement errors. The differences between Hg-1 and native structure factors showed all
the expected features, a clear peak in the sectionχ = 27.7o and a ring of smeared peaks in the
sectionχ = 180o. In the case of differences from the less isomorphous derivative Hg-2, the
peaks in the sectionχ = 27o were conserved while the ring of peaks in the sectionχ = 180o
partially disappeared. The latter observation can be treated as the negative control of what had
been observed for the derivative Hg-1 and is therefore a further confirmation of Hg binding.
Indeed, the peaks atχ = 27o were defined by intra-oligomer self-vectors and their presence
mostly depended on the similarity between oligomers and their orientations in the two crystal
forms. On the other hand, the peaks in the sectionχ = 180o were defined by cross-vectors
between crystallographic-symmetry related oligomers andthe match between such cross-vectors
in two (approximately) isomorphous crystals would quicklyvanish with relative changes in the
unit-cell parameters (Table2.4).
The anomalous differences were measured for both HgCl2-derivatives under consideration,
but showed no SRF-patterns corresponding to the 13-fold NCSaxis or its interaction with crys-
tallographic symmetry.
2.6.3 Solution of the substructure
Despite the presence of the true isomorphous differences, the substructure solution could not be
obtained by automated Patterson search or direct method using Solveor SHELXS. Unsurpris-
ingly, attempts to solve the Hg-substructure using anomalous differences failed as well. There-
fore a constrained exhaustive MR search was attempted, which was earlier used by Antsonet al.
(1995) for substructure solution of the derivative crystalof the TRAP protein 11-mer.
Data set Native Hg-1 Hg-2
contents of HgCl2 (mM) – 0.5 2.5
Space group C2221 C2221 C2221
a (A) 173.5 173.4 174.3
b (A) 222.4 221.7 221.4
c (A) 419.8 419.7 421.9
Resolution (A) 100 – 4.1 40 – 3.7 40 – 3.4
Rmerge(%) 11.0 9.6 10.4
Riso (%) – 15.3 25.1
Table 2.4.Data sets used for structure solution of SPP1 portal protein.
84
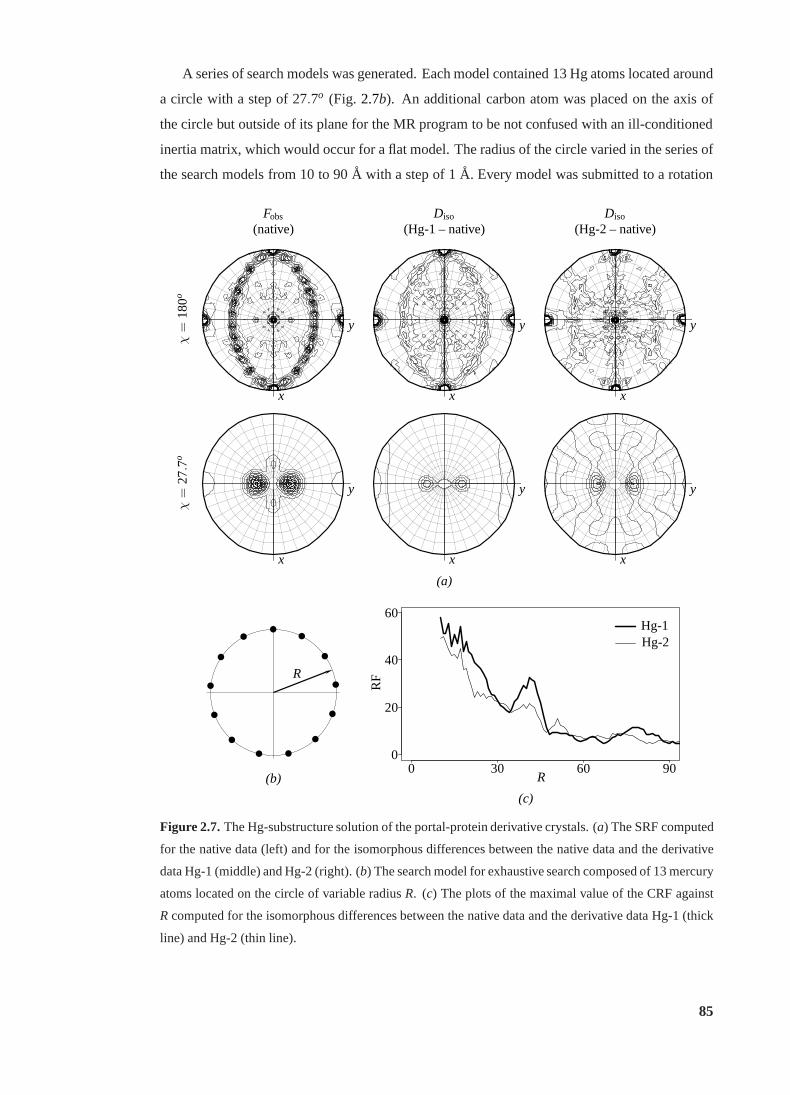
A series of search models was generated. Each model contained 13 Hg atoms located around
a circle with a step of 27.7o (Fig. 2.7b). An additional carbon atom was placed on the axis of
the circle but outside of its plane for the MR program to be notconfused with an ill-conditioned
inertia matrix, which would occur for a flat model. The radiusof the circle varied in the series of
the search models from 10 to 90A with a step of 1A. Every model was submitted to a rotation
Fobs Diso Diso
(native) (Hg-1 – native) (Hg-2 – native)
χ=
18
0o
x
y
x
y
x
y
χ=
27.
7o
x
y
x
y
x
y
(a)
R
(b) R0 30 60 90
RF
0
20
40
60Hg-1Hg-2
(c)
Figure 2.7.The Hg-substructure solution of the portal-protein derivative crystals. (a) The SRF computed
for the native data (left) and for the isomorphous differences between the native data and the derivative
data Hg-1 (middle) and Hg-2 (right). (b) The search model for exhaustive search composed of 13 mercury
atoms located on the circle of variable radiusR. (c) The plots of the maximal value of the CRF against
R computed for the isomorphous differences between the native data and the derivative data Hg-1 (thick
line) and Hg-2 (thin line).
85
run ofAMoRe(Navaza, 2001) against isomorphous differences from the derivative Hg-1 and the
best CC was plotted against the radius of the Hg-cycle (thickline in Fig.2.7c). The CC peaked
at 32.7% for the 41.0A radius model. The orientation of the Hg-ring corresponding to this peak
was consistent with the SRF.
An identical search was performed against isomorphous differences between the less iso-
morphous derivative Hg-2 and the native data (thin lines in Fig. 2.7c). Again, there was a peak
atR = 41A corresponding to the correct model in the correct orientation. However, the contrast
in this case was much lower, so the results of this search alone would not be convincing enough.
The background of the plots in Fig.2.7(c) decreases with the growth of the Hg-circle radius.
This is because the radius of integration in the RF was not constant but was adjusted to be linearly
dependent on the Hg-sphere radius. Thus the integration sphere included cross-vectors between
Hg-atoms and their first and second neighbours only (the integration radius was about half the
radius of Hg-circle). With this approach, the signals from all correct models (the case of multiple
Hg binding) but not the noise would have been equalised. The protocol with large constant
integration radius would be significantly slower, but wouldpresumably result in a constant level
of noise and higher level of signal coming from more cross-vectors.
The model with the Hg-circle radius 41A and 30 best orientations for this model found
during the RF search against Hg-1 isomorphous differences were selected for the TF trials.
The TF search usingAMoReand Hg-1 differences gave eight equivalent solutions with aCC
of 13.5% (orientations 5–12). The second best CC was 9.9% (orientations 1–4). The found
solutions were consistent with the SRF, had reasonable (97.5 A) distance between symmetry
equivalents and were the best among the TF peaks for the same orientation in terms ofR-factor,
CC of structure factors and the height of the TF peak. Therefore, there were no doubts that the
correct substructure solution was found.
Thus the NCS-constrained exhaustive search with the CRF target proved to be successful
for both the protein oligomer rebuilding (§2.3) and substructure solution. An important feature
of this approach is that the orientations of the NCS axes are known, but corresponding con-
straints are relaxed during the search and this informationis used for validation only. In the
particular case under consideration, the validation of thesubstructure model was important, as it
helped avoiding time-consuming attempts at phase improvement starting with a false substruc-
ture model.
After the portal protein structure was solved, another method of substructure solution was
successfully tested, in which all possible NCS constraintswere applied during the exhaustive
search. Two parameters were scanned against the TF target, the Hg-circle radius and the position
of the reference Hg on the circle. This was the analogue of themethod used for structure solution
of TPx-B (§2.1). Had only the Hg-2 derivative been available, the exhaustive search with the
86
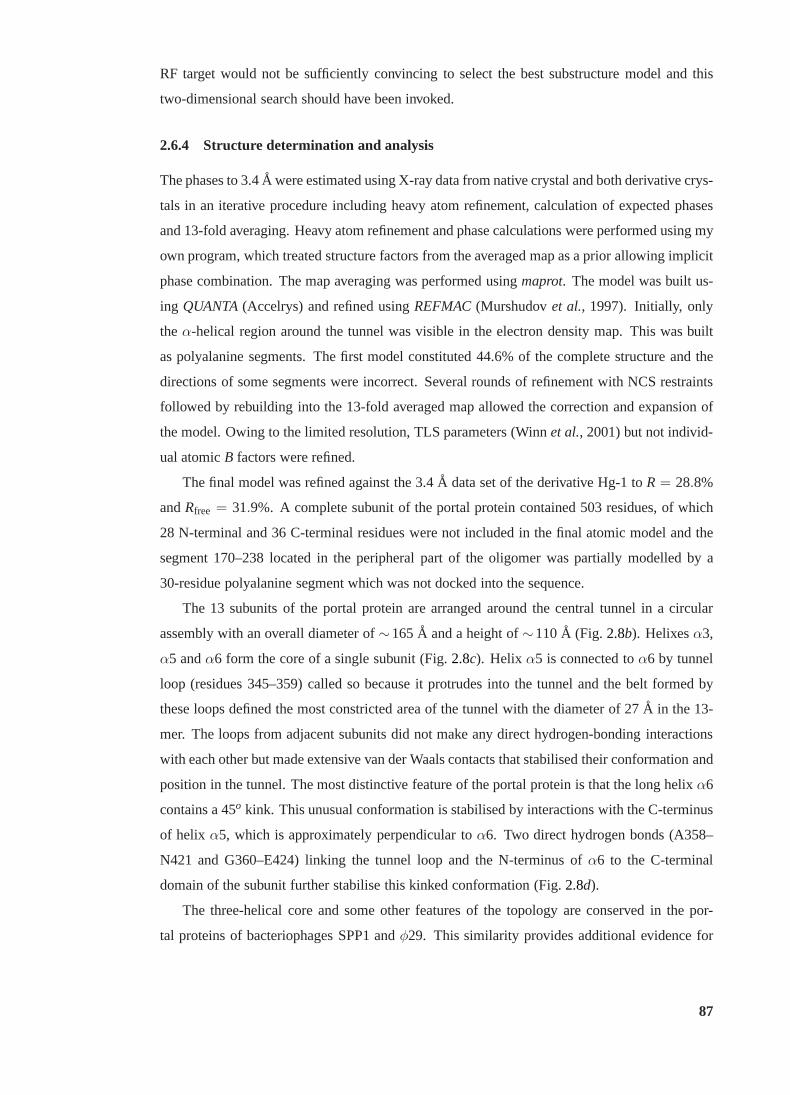
RF target would not be sufficiently convincing to select the best substructure model and this
two-dimensional search should have been invoked.
2.6.4 Structure determination and analysis
The phases to 3.4A were estimated using X-ray data from native crystal and both derivative crys-
tals in an iterative procedure including heavy atom refinement, calculation of expected phases
and 13-fold averaging. Heavy atom refinement and phase calculations were performed using my
own program, which treated structure factors from the averaged map as a prior allowing implicit
phase combination. The map averaging was performed usingmaprot. The model was built us-
ing QUANTA(Accelrys) and refined usingREFMAC(Murshudovet al., 1997). Initially, only
theα-helical region around the tunnel was visible in the electron density map. This was built
as polyalanine segments. The first model constituted 44.6% of the complete structure and the
directions of some segments were incorrect. Several roundsof refinement with NCS restraints
followed by rebuilding into the 13-fold averaged map allowed the correction and expansion of
the model. Owing to the limited resolution, TLS parameters (Winn et al., 2001) but not individ-
ual atomicB factors were refined.
The final model was refined against the 3.4A data set of the derivative Hg-1 toR = 28.8%
andRfree = 31.9%. A complete subunit of the portal protein contained 503 residues, of which
28 N-terminal and 36 C-terminal residues were not included in the final atomic model and the
segment 170–238 located in the peripheral part of the oligomer was partially modelled by a
30-residue polyalanine segment which was not docked into the sequence.
The 13 subunits of the portal protein are arranged around thecentral tunnel in a circular
assembly with an overall diameter of∼165A and a height of∼110A (Fig. 2.8b). Helixesα3,
α5 andα6 form the core of a single subunit (Fig.2.8c). Helix α5 is connected toα6 by tunnel
loop (residues 345–359) called so because it protrudes intothe tunnel and the belt formed by
these loops defined the most constricted area of the tunnel with the diameter of 27A in the 13-
mer. The loops from adjacent subunits did not make any directhydrogen-bonding interactions
with each other but made extensive van der Waals contacts that stabilised their conformation and
position in the tunnel. The most distinctive feature of the portal protein is that the long helixα6
contains a 45o kink. This unusual conformation is stabilised by interactions with the C-terminus
of helix α5, which is approximately perpendicular toα6. Two direct hydrogen bonds (A358–
N421 and G360–E424) linking the tunnel loop and the N-terminus of α6 to the C-terminal
domain of the subunit further stabilise this kinked conformation (Fig.2.8d).
The three-helical core and some other features of the topology are conserved in the por-
tal proteins of bacteriophages SPP1 andφ29. This similarity provides additional evidence for
87
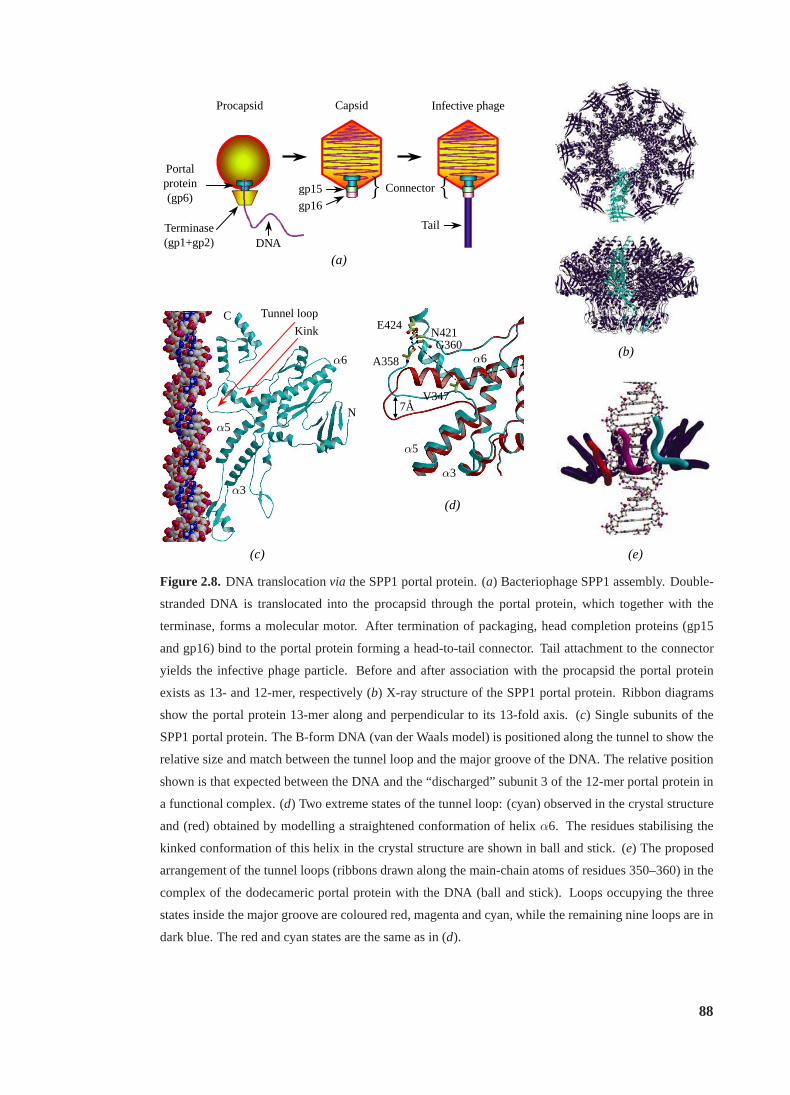
} {
Procapsid Capsid Infective phage
DNA
gp15
gp16
Connector
Tail
Portalprotein(gp6)
Terminase(gp1+gp2)
Tunnel loop
KinkC
N
α3
α5
α6
α3
α5
α6
E424N421G360
A358
V3477A
(a)
(b)
(c)
(d)
(e)
Figure 2.8. DNA translocationvia the SPP1 portal protein. (a) Bacteriophage SPP1 assembly. Double-
stranded DNA is translocated into the procapsid through theportal protein, which together with the
terminase, forms a molecular motor. After termination of packaging, head completion proteins (gp15
and gp16) bind to the portal protein forming a head-to-tail connector. Tail attachment to the connector
yields the infective phage particle. Before and after association with the procapsid the portal protein
exists as 13- and 12-mer, respectively (b) X-ray structure of the SPP1 portal protein. Ribbon diagrams
show the portal protein 13-mer along and perpendicular to its 13-fold axis. (c) Single subunits of the
SPP1 portal protein. The B-form DNA (van der Waals model) is positioned along the tunnel to show the
relative size and match between the tunnel loop and the majorgroove of the DNA. The relative position
shown is that expected between the DNA and the “discharged” subunit 3 of the 12-mer portal protein in
a functional complex. (d) Two extreme states of the tunnel loop: (cyan) observed in the crystal structure
and (red) obtained by modelling a straightened conformation of helix α6. The residues stabilising the
kinked conformation of this helix in the crystal structure are shown in ball and stick. (e) The proposed
arrangement of the tunnel loops (ribbons drawn along the main-chain atoms of residues 350–360) in the
complex of the dodecameric portal protein with the DNA (balland stick). Loops occupying the three
states inside the major groove are coloured red, magenta andcyan, while the remaining nine loops are in
dark blue. The red and cyan states are the same as in (d).
88
the proposal that the dsDNA tailed bacteriophages divergedfrom a common ancestor, which
was the root of the lineage formed by tailed phages and herpesviruses (Bamfordet al., 2005).
Equally this conservation suggests that the mechanism of DNA translocation is similar in all
these systems.
The application of normal mode analysis (NMA) to the MR structure solution was discussed
in §1.1.11. In this study, the NMA-server ElNemo (Suhre & Sanejouand, 2004) was used to in-
vestigate possible conformational changes in the portal protein. One of the low-frequency modes
corresponded to the movement of the loops along the tunnel axis and included the conforma-
tion in which helixα6 was straightened and the end of the loop moved by about 7A down the
tunnel, the distance corresponding to translocation of twobase-pairs of the DNA (red ribbon
in Fig. 2.8d). This conformation breaks the hydrogen bonds A358–N421 and G360–E424, but
gains fiveα-helical hydrogen bonds, which are otherwise disrupted by the kink ofα6.
Further inspection of the structure showed that the structural motif comprisingα5 – tunnel
loop –α6 could function as molecular lever, in which a slight axial shift of helix α5 is associated
with a much larger axial shift of the N-terminal end of helixα6 and the tunnel loop, the latter
making shape matching interaction with the major groove of the translocated DNA (Fig.2.8c).
Mutagenesis and biochemical data (Isidroet al., 2004; Oliveiraet al., 2006) suggested that the
structural organisation of this motif is crucial for DNA translocation. In particular, five single
amino acid substitutions in the tunnel impair DNA packaging. These include two mutations
of V347 underpinning the kink in the helixα6 with its side chain (Fig.2.8d). Its mutation to
alanine (smaller side chain) or methionine (larger side chain) apparently alters the kink in helix
α6 and therefore abolishes the DNA packaging. The above data,as well as the conservation
of α3, α5 andα6 in two known portal protein structures (phagesφ29 and SPP1) suggested
that the signal or force exchange between ATPase and DNA could be accomplished through the
structural motifα3 –α5 – tunnel loop –α6.
2.6.5 Conformational asymmetry of the portal protein
During the structure solution the NCS is generally treated as an exact symmetry and the infor-
mation on the NCS operations is particularly useful for reduction of the dimensionality of the
search space. From the biological point of view, of interestare both the overall mode of the as-
sociation of subunits into oligomers and the conformational variability of subunits. In particular,
the conformational and atomic-scale asymmetry gives an insight into functioning of the motor
proteins composed of several identical subunits (as in the case of E1-helicase,§2.4).
The 13-mer of the portal protein in the crystal structure wassymmetric. No significant
conformational differences between refined subunits were detected. Furthermore, the omit map
89
showed no interpretable density that would not be accountedfor in the model. However, the
docking of twelve portal protein subunits into EM map of the dodecameric connector (§2.6.1
Orlovaet al., 2003) showed that the tunnel loops forming symmetric belt in the 13-mer would
necessarily deviate from this symmetric arrangement in theactive dodecameric assembly.
The fitting into the EM map was performed by Alexei Vagin usingSAPTF (Vagin & Isupov,
2001) and NCS-constrained rigid body refinement, both implemented inMOLREP. The pseu-
doatomic model of the portal protein 12-mer revealed reasonable intersubunit contacts except
for the C-terminal domain and the tunnel loops. Dissecting subunits into several rigid bodies and
further refinement restored acceptable contacts between C-terminal domains, but not between
loops.
The minimal diameter of the tunnel decreased by 10A on the transition of the portal protein
from 13- to 12-mer, a substantially greater contraction than a simple scaling down by a factor
12/13. The reason for so large variation in the tunnel diameter was that the dimensions of the
two oligomers were defined by inter-subunit contacts in the area separated from the tunnel axis
by about 50A. As a result, the tunnel in the 12-mer was too narrow (van derWaals diameter
∼ 18 A) to accommodate the B-form of the DNA (van der Waals diameter ∼ 23 A) without
clashes.
The clashes between neighbouring tunnel loops and the too narrow tunnel in the symmetric
pseudoatomic model of 12-mer suggested that actual structure of dodecameric portal protein
was asymmetric, at least in area of the tunnel, with flexible loop conformations. Conformational
variability of the tunnel loops was supported by several other observations. These included
weak electron density for the tunnel loops in the EM reconstructions of both the dodecameric
SPP1 connector and the dodecamericφ29 portal protein embedded in the procapsid (Morais
et al., 2005). Similarly, in the crystal structures of the 12-subunit assembly of theφ29 portal
protein (Simpsonet al., 2000; Guaschet al., 2002), amino acid segments 229–245 that could
form tunnel loops were not observed in the electron density.
The mutant of SPP1 portal protein with truncated C-terminaldomain was found to form 14-
mers and the crystal structure of this mutant has recently been solved (Joanne Turner and Fred
Antson, personal communication). The extrapolation of the14- and 13-mer structures to the
12-mer showed similar clashes and the same diameter of the tunnel as the pseudoatomic model.
The structure of the tunnel loops observed in the X-ray structure of the 13-mer and relative
position of subunits in pseudoatomic model of 12-mer imposed strong constraints on possible
organisation of the portal protein complex with the DNA. A model of the complex was therefore
generated, in which unfavourable interatomic contacts were avoided (Fig.2.8e). Subunits 1 and
3 were assigned the conformations shown in Fig.2.8(d). The intermediate conformations of the
remaining ten subunits were modelled by linear interpolation. The axis of the DNA was slightly
90
shifted relative to the axis of the portal protein, so the tunnel loops of the subunits 1, 2 and 3
sank into the major groove of the DNA as shown in Fig.2.8(c) for subunit 3. During the active
event, tunnel loops 11 and 12, which are initially outside the major groove, are forced to slide
between adjacent phosphates into the major groove and the communication between the active
subunit of the ATPase and the active tunnel loops is accomplished viaα3 –α5 as mentioned at
the end of§2.6.4. After the active event, the system relaxes into an energy minimum, in which
the individual states of subunits circularly permuted and the DNA is translocated by two base
pairs. According to measurements by (Guoet al., 1987; Moritaet al., 1993), one such transition
occurs per one ATP hydrolysis event.
2.6.6 Conclusion
An NCS-constrained exhaustive search with the CRF target was used for the Hg-substructure
solution in the course of determination of the SPP1 portal protein crystal structure. This method
was used because the substructure could not be solved by automated direct methods.
Two structures of the bacteriophage SPP1 portal protein were determined and analysed,
the X-ray structure of the isolated 13-subunit form and the pseudoatomic structure of a 12-
subunit assembly derived from the EM reconstruction. The first defines the DNA-interacting
segments (tunnel loops) that pack tightly against each other forming the most constricted part of
the tunnel; the second shows that the functional dodecameric state must induce variability in the
loop positions. Structural observations together with geometrical constraints dictate that in the
portal-DNA complex, the loops form an undulating belt that fits and tightly embraces the helical
DNA, suggesting that DNA translocation is accompanied by a Mexican wave of positional and
conformational changes propagating sequentially along this belt.
91
3 Twinned structures
Geometrical classification of twins and intensity statistics in twinned crystals are discussed in
the introduction (§1.2). In this chapter, the geometry of the crystal lattice and the intensity
statistics in twins are studied in their relation to NCS.
It is known that if the NCS and twinning axes are aligned, thenthe correlations between
NCS-related reflections affect the distributions of intensities and their differences used in twin-
ning tests. For handling such data I first restate the equations for intensity statistics in a more
convenient form (§3.1) and then derive theoretical distributions for two idealised cases. In the
first case, the twinned structure contains an untwinned substructure with higher crystallographic
symmetry (§3.1). Such a situation may, for example, occur in a crystal containing larger dimers
complexed with smaller monomeric proteins. The second caseunder consideration is an OD-
twin of type I/B (§3.4).
The second section of this chapter (§3.2) presents the analysis of the PDB, in which the cases
of twinning were revealed and classified in terms of the presence or absence of interfering NCS.
This section highlights the problem of incorrect space group assignment and, in particular, the
problem of false-positive twins.
The last three sections present three examples of twinned structures with different relations
between twinning and NCS. In the first and the second examples, attention is paid to the struc-
tural nature of the lattice constraints that make the twinning by metric merohedry possible. In
the second of these two examples, the OD-nature of the crystal was shown to be responsible for
both the lattice constraints and the alignment of the NCS andtwin axes. In the third example, the
OD-nature of the twin by reticular merohedry defines the relation between alternative lattices.
In all three cases I contributed to structure solution. People involved in the projects are
acknowledged and related papers are cited in correspondingsections.
92
3.1 Intensity statistics in the case of correlated structure factors
In this section, the statistics that are used in twinning tests are derived for the following particular
case of twinning by hemihedry. Two individual crystals represented by normalised structure
factors f1 and f2 possess a common substructure represented by a structure factor f0,
f1 = fo + ∆1
f2 = fo + ∆2
(16)
Equation (16) assumes an agreement between the origins in the structuresf1 and f2, so the two
copies of the substructuref0 overlap (if extended by crystallographic translations). It is also
assumed that the substructures∆1 and∆2 do not contain complete translated copies off0.
In the hemihedral case under consideration the set of equivalent twin operations includes a
twofold rotationot . The twin operation ˆot can be assigned a translational component to become
a pseudosymmetry operation forf0. The action of ˆot on
f = ( f1, f2)T (17)
is written as
ot f =
0 1
1 0
f. (18)
Accordingly, ot is further referred to as either NCS operation or twin operation depending on
the context. When it acts on structure factors, it is an element of the pseudosymmetry space
group of f0. When it acts on intensities, its translational component is inactive and its rotational
component is the twin operation.
3.1.1 Twinned intensities
Letα1 andα2 be relative volumes of individual crystals,
α1 + α2 = 1. (19)
Typically, the smallest ofα1 andα2 is denoted asα and is called the twinning fraction. In some
equations, it is convenient to use another parameter,
β = α1 − α2. (20)
Thus,α1 = α2 = 1/2 andβ = 0 correspond to perfectly twinned crystal andβ = ±1 corre-
spond to a single crystal in one of two possible crystallographic orientations.
The squared moduli| f1|2 and | f2|2 of the two components off are the intensities of the
different individual crystals. Both intensities contribute to the total intensityZ,
Z = α1| f1|2 + α2| f2|2, (21)
93
The operation ˆot (18) permutes structure factors of twin-related reflections and, accordingly,
intensities of individual crystals,
otZ = α1| f2|2 + α2| f1|2. (22)
Of particular interest are the mean of two intensities related by the twin operation,Z′, and
the difference between the two intensities represented here by its half valueZ′′,
Z′ =Z + otZ
2=
| f1|2 + | f2|22
Z′′ =Z − otZ
2= β
| f1|2 − | f2|22
(23)
In a perfect twinZ′ = Z andZ′′ = 0. Rotation of a twinned crystal by the twin operation does
not changeZ′ and changes sign ofZ′′.
The random variableH,
H =|Z′′|Z′ (24)
is a more convenient representation of the difference between two intensities. Firstly, it is inde-
pendent of the overallB-factor. Also, it is positive and therefore has, in general,a non-zero first
moment, which is a preferable statistic compared to the second moment, as it is less sensitive to
experimental errors. It is also important thatH is a sufficient statistic for the twinning fraction
α in the ideal model of twin (§1.2.4) and is likely to remain a “good” statistic in the presence of
various factors perturbing the ideal model.
The experimental distributions and moments of random variablesZ andH are used in perfect
and partial twinning tests, respectively, and are comparedwith the theoretical predictions. The
theoretical distributions ofZ and H for uncorrelated structure factors were discussed in the
introduction, in§1.2.3and§1.2.4, respectively. The distribution of these variables for acentric
correlated structure factors are derived and discussed in this section.
3.1.2 Examples
The PDB entries 1ewy and 1irm present examples of this type oftwinning. In the first case
(1ewy; Moraleset al., 2000), the asymmetric unit of the space groupP212121 contains a dimer
of ferredoxin-NADP+ reductase (A) complexed with a single molecule of ferredoxin (B), sof0
corresponds to theP43212-substructure formed by molecules A, whereas∆1 and∆2 correspond
to two different orientations of theP212121-substructure formed by molecules B. In the second
case (1irm; Sugishimaet al., 2002) the asymmetric unit of the individual crystalf1 (or f2) with
the space group symmetryP32 contains three molecules of apo-heme oxygenase-1. Two of the
three molecules are attributed to the substructuref0 with the space group symmetryP3221 and
the third molecule belongs to∆1 (or ∆2).
94
The operation ˆot can be chosen as follows: any of two diagonal two-fold rotation of the
P43212 space group off0 (the first example), and any of two-fold rotations of theP3221 space
group of f0 (the second example).
3.1.3 Joint distribution of structure factors
Let ρ, 0< ρ < 1, denote the correlation between normalised structure factors f1 and f2. This is
a positive real number because of the common substructuref0. Using vector notations (17), and
E for the expected value, the covariance matrix forf is defined as follows,
M = E(f f∗T) =
1 ρ
ρ 1
. (25)
It is further assumed thatρ is the same for all reflections. This corresponds to exact symmetry
of f0 relative to the NCS operation ˆot . In reality, the NCS is approximate andρ decreases with
increase of the resolution. Nevertheless, constantρ is a good approximation especially because
only low and medium resolution data are to be used in twinningtests to avoid the effect of
experimental errors (§1.2.3, Fig. 1.2). It will be also shown in§3.4 that the model with constant
ρ works even if the actualρ is an oscillating function ofl .
The assumption (25) is not always justified. For example, in the case of pseudotranslation,
even the intensities from the same resolution shell should not be assumed to have the same
expected values. Formal analysis of this special case is notincluded in this thesis, although a
related example is presented below (§4.4). Also, the normal distribution off is not always a
good approximation for anisotropic data, although most anisotropic cases can be treated using a
reduced resolution range for twinning tests.
The complex vectorf can be represented in terms of its real and imaginary parts,a andb,
real vectors,
f = a + ib (26)
The joint distribution ofa andb is normal with zero mean and variance-covariance matrix de-
fined by (25),
p(a,b|ρ) =1
π2|M| exp(
− fT∗M−1f)
(27)
BecauseM is a real matrix,
p(a,b|ρ) =1
π2|M| exp(
− aTM−1a− bTM−1b)
, (28)
that is, the vectorsa andb are identically distributed and mutually independent.
This is a standard statistical model for the structure factors f1 and f2 from two similar but
not identical structures containing an equal number of atoms. The structure factorsf1 and f2 are
95
identically distributed and the correlation between them isρ. The propertyρ > 0 is not essential
for the intensity statistics and it isρ2 that matters. All equations of this section are valid for
|ρ| 6 1, so they are applicable for the case of an OD-twin (§3.4), in whichρ may be considered
as the cosine function of indexl .
3.1.4 Moment generating function forZ′ and Z′′
The moment generating function (MGF; Stuart & Ord, 1994) of the random variablesZ′ andZ′′
is defined as follows,
LZ′Z′′(t ′, t ′′) = E(
et′Z′+ t′′Z′′)
(29)
The calculations below are performed in terms of the random vectorsa andb distributed ac-
cording to (27). Equations (23) are transformed into vector form (17) and substituted into (29)
to give
LZ′Z′′(t ′, t ′′) =1
π2|M|
∫∫
R2da2∫∫
R2db2 exp
(
− fT∗Af)
, (30)
whereM is defined in (25) and
A = M−1 − 12
t ′ + βt ′′ 0
0 t ′ − βt ′′
. (31)
Explicitly,
LZ′Z′′(t ′, t ′′) =1
|AM| =1
1− t ′ + 14(1− ρ2)(t ′2 − β2t ′′2)
. (32)
The MGF (29) can be expressed in terms of joint probability distribution density ofZ′
andZ′′,
LZ′Z′′(t ′, t ′′) =
∞∫
−∞
∞∫
−∞
pZ′Z′′(Z′,Z′′) et′Z′
et′′Z′′
dZ′dZ′′. (33)
and the probability distribution density can be restored asfollows,
pZ′Z′′(Z′,Z′′) =1
(2πi)2
i∞∫
−i∞
i∞∫
−i∞
LZ′Z′′(t ′, t ′′) e−t′Z′
e−t′′Z′′
dt ′dt ′′. (34)
In the last two equations, physically impossible pairs ofZ′ andZ′′ are assumed to have zero
probability. In (34), the integral with limits−i∞ and i∞ denotes an integral along the imag-
inary axis. Equations (33) and (34) are direct and inverse Fourier transformations in terms of
parametersτ ′ = −it ′ andτ ′′ = −it ′′. In the general case, the MGF is therefore defined for
imaginaryt ′ andt ′′ and, in special cases including the one under consideration, there exists an
analytical extension of the MGF in the entire complex plane.The reason why the MGF transfor-
mation is used instead of Fourier transformation is a minor convenience of the MGF being real
for realt (if defined) andn-th mixed moments of the random variablesZ′ andZ′′ being equal to
then-th mixed derivatives of the MGF (without the coefficienti n).
96
3.1.5 Moment generating function forZ′ and |Z′′|
The definition of the joint MGF of random variablesZ′ and |Z′′| and its explicit expression
through the density function of random variablesZ′ andZ′′ are as follows,
LZ′, |Z′′|(t′, t ′′) = E
(
et′Z′+ t′′|Z′′|) (35)
and
LZ′, |Z′′|(t′, t ′′) =
∞∫
−∞
∞∫
−∞
pZ′Z′′(Z′,Z′′) et′Z′+ t′′|Z′′| dZ′dZ′′. (36)
The substitution of (34) and integration overZ′ gives the following equation,
LZ′, |Z′′|(t′, t ′′) =
12πi
i∞∫
−i∞
LZ′Z′′(t ′, t) dt
∞∫
−∞
et′′|Z′′|−t Z′′
dZ′′. (37)
To integrate overZ′′, this integral is split into two integrals, over positive and negativeZ′′. The
latter two are equal becauseLZ′Z′′(t ′, t) defined in (32) is a symmetric function oft. Therefore,
LZ′, |Z′′|(t′, t ′′) =
1πi
i∞∫
−i∞
LZ′Z′′(t ′, t)1
t − t ′′dt. (38)
As follows from (32), the integrand in (38) has three special points for the variablet. If
ℜ(t ′′) < 0, there is only one special point forℜ(t) > 0 andvice versa. The integration path
is locked around this unique special point to get the following explicit expression for the MGF
of interest,
LZ′, |Z′′|(t′, t ′′) =
1√
1− t ′ + (µ t ′)2
1√
1− t ′ + (µ t ′)2 − µ|β|t ′′, (39)
where
µ =12
√
1− ρ2. (40)
As follows from (35), the joint moments ofZ′ and|Z′′| are obtained by differentiating this MGF.
In particular, the first moments,
E(Z′) = 1 (41)
and
E(|Z′′|) =12|β|√
1− ρ2, (42)
and the following combination of the first and second moments,
E(
(
|Z′′| − Z′E(
|Z′′|)
)2)
=18β2(1− ρ4) (43)
are used in the next section to estimate theR-factor between twin related intensities and the
standard deviation of this estimate.
97
3.1.6 Perfect twinning test
The distribution of normalised intensitiesP(Z) in the absence of the correlation between twin
related structure factors is discussed in the introduction(§1.2.3). This is the case forρ = 0. In
this subsection,P(Z) is derived and analysed for the general case ofρ 6= 0.
As follows from (23) and (29), the MGF ofp(Z) can be obtained from the MGF ofp(Z′,Z′′),
LZ(t) = E(
etZ) = E(
et(Z′+Z′′))
= LZ′Z′′(t, t). (44)
From (32),
LZ(t) =1
1− t + 14(1− β2)t2
, (45)
where
1− β2 = (1− ρ2)(1− β2). (46)
Equation (45) defines a one-parameter family of probability distribution functions. The nor-
malised intensities are therefore distributed identically for all pairs ofρ andβ corresponding to
the same value ofβ and neitherρ norβ can be identified from single experimental distribution.
Effective twinning fractions ˜α1 andα2 are defined by similarity with (19) and (20),
α1 + α2 = 1
α1 − α2 = β.(47)
If ρ = 0, thenβ = β. Henceα1 = α1, α2 = α2 and (6) is rewritten as follows,
P(Z) = 1− α1 exp(−Z/α1) − α2 exp(−Z/α2)
α1 − α2. (48)
BecauseLZ(t) and, accordinglyP(Z), depend on a single parameter,β, equation (48) is valid
for any value ofρ. Of course,p(Z) can also be directly obtained from (44) and then integrated
to give (48).
For a single crystal one ofα1 andα2 is zero and thereforeβ2 = 1. If ot is in fact a crystallo-
graphic operation thenρ = 1. In both cases|β| = 1 and one of ˜α1 andα2 is zero, and equation
(48) reduces to
P(Z) = 1− exp(−Z). (49)
This is a reference distribution for untwinned intensities.
The caseβ = 0 can only occur for uncorrelated structure factors (ρ = 0) and only if the
crystal is a perfect twin (β = 0). In this case ˜α1 = α2 and the singularity should be resolved in
the denominator of (48) to give
P(Z) = 1− (1 + 2Z) exp(−2Z). (50)
98
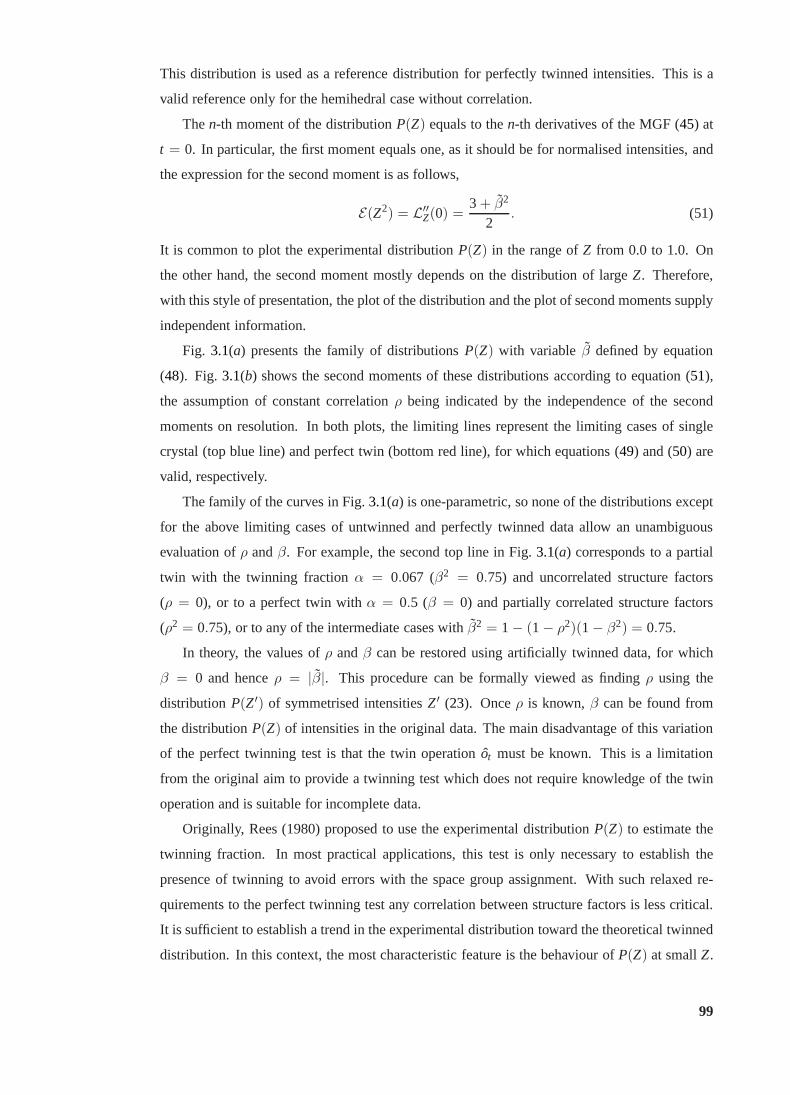
This distribution is used as a reference distribution for perfectly twinned intensities. This is a
valid reference only for the hemihedral case without correlation.
Then-th moment of the distributionP(Z) equals to then-th derivatives of the MGF (45) at
t = 0. In particular, the first moment equals one, as it should be for normalised intensities, and
the expression for the second moment is as follows,
E(Z2) = L′′Z(0) =
3 + β2
2. (51)
It is common to plot the experimental distributionP(Z) in the range ofZ from 0.0 to 1.0. On
the other hand, the second moment mostly depends on the distribution of largeZ. Therefore,
with this style of presentation, the plot of the distribution and the plot of second moments supply
independent information.
Fig. 3.1(a) presents the family of distributionsP(Z) with variable β defined by equation
(48). Fig. 3.1(b) shows the second moments of these distributions accordingto equation (51),
the assumption of constant correlationρ being indicated by the independence of the second
moments on resolution. In both plots, the limiting lines represent the limiting cases of single
crystal (top blue line) and perfect twin (bottom red line), for which equations (49) and (50) are
valid, respectively.
The family of the curves in Fig.3.1(a) is one-parametric, so none of the distributions except
for the above limiting cases of untwinned and perfectly twinned data allow an unambiguous
evaluation ofρ andβ. For example, the second top line in Fig.3.1(a) corresponds to a partial
twin with the twinning fractionα = 0.067 (β2 = 0.75) and uncorrelated structure factors
(ρ = 0), or to a perfect twin withα = 0.5 (β = 0) and partially correlated structure factors
(ρ2 = 0.75), or to any of the intermediate cases withβ2 = 1− (1− ρ2)(1− β2) = 0.75.
In theory, the values ofρ andβ can be restored using artificially twinned data, for which
β = 0 and henceρ = |β|. This procedure can be formally viewed as findingρ using the
distributionP(Z′) of symmetrised intensitiesZ′ (23). Onceρ is known,β can be found from
the distributionP(Z) of intensities in the original data. The main disadvantage of this variation
of the perfect twinning test is that the twin operation ˆot must be known. This is a limitation
from the original aim to provide a twinning test which does not require knowledge of the twin
operation and is suitable for incomplete data.
Originally, Rees (1980) proposed to use the experimental distributionP(Z) to estimate the
twinning fraction. In most practical applications, this test is only necessary to establish the
presence of twinning to avoid errors with the space group assignment. With such relaxed re-
quirements to the perfect twinning test any correlation between structure factors is less critical.
It is sufficient to establish a trend in the experimental distribution toward the theoretical twinned
distribution. In this context, the most characteristic feature is the behaviour ofP(Z) at smallZ.
99
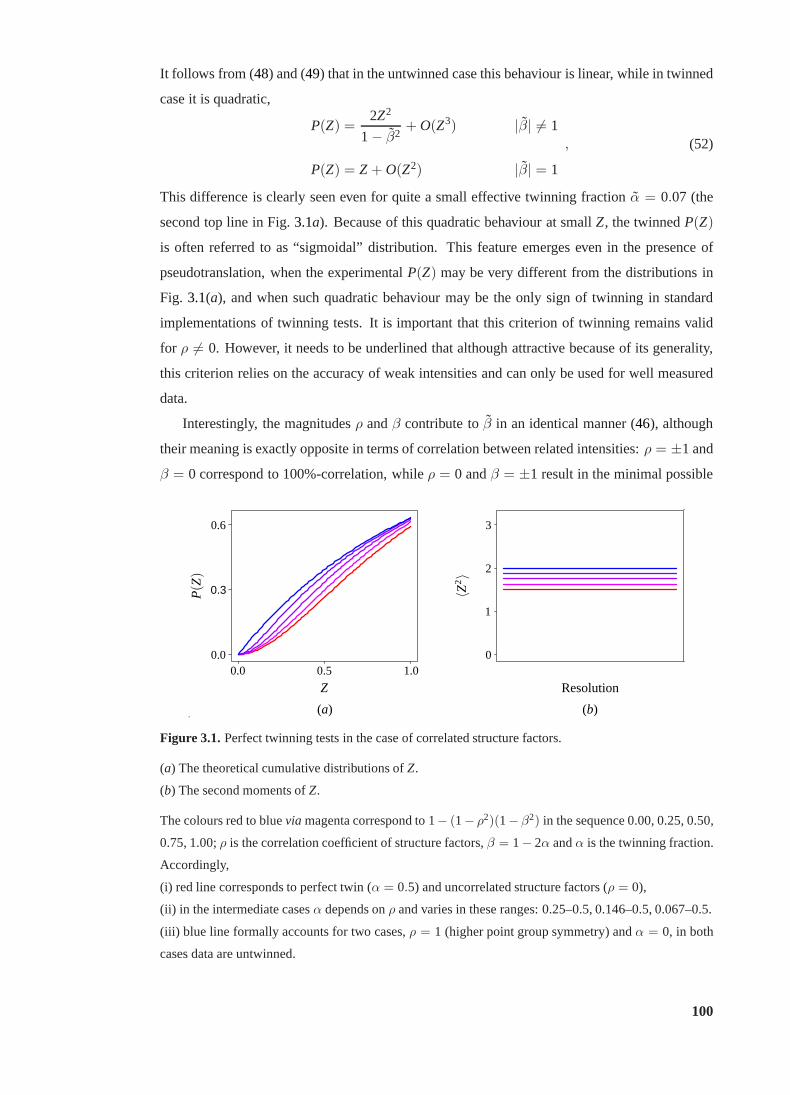
It follows from (48) and (49) that in the untwinned case this behaviour is linear, while in twinned
case it is quadratic,
P(Z) =2Z2
1− β2+ O(Z3) |β| 6= 1
P(Z) = Z + O(Z2) |β| = 1
, (52)
This difference is clearly seen even for quite a small effective twinning fractionα = 0.07 (the
second top line in Fig.3.1a). Because of this quadratic behaviour at smallZ, the twinnedP(Z)
is often referred to as “sigmoidal” distribution. This feature emerges even in the presence of
pseudotranslation, when the experimentalP(Z) may be very different from the distributions in
Fig. 3.1(a), and when such quadratic behaviour may be the only sign of twinning in standard
implementations of twinning tests. It is important that this criterion of twinning remains valid
for ρ 6= 0. However, it needs to be underlined that although attractive because of its generality,
this criterion relies on the accuracy of weak intensities and can only be used for well measured
data.
Interestingly, the magnitudesρ andβ contribute toβ in an identical manner (46), although
their meaning is exactly opposite in terms of correlation between related intensities:ρ = ±1 and
β = 0 correspond to 100%-correlation, whileρ = 0 andβ = ±1 result in the minimal possible
0.3
0.00.0 0.5
0.6
1.0
Z
P(Z
)
0
1
2
3
Resolution
〈Z2〉
(a) (b).
.
Figure 3.1.Perfect twinning tests in the case of correlated structure factors.
(a) The theoretical cumulative distributions ofZ.
(b) The second moments ofZ.
The colours red to bluevia magenta correspond to 1− (1− ρ2)(1− β2) in the sequence 0.00, 0.25, 0.50,
0.75, 1.00;ρ is the correlation coefficient of structure factors,β = 1− 2α andα is the twinning fraction.
Accordingly,
(i) red line corresponds to perfect twin (α = 0.5) and uncorrelated structure factors (ρ = 0),
(ii) in the intermediate casesα depends onρ and varies in these ranges: 0.25–0.5, 0.146–0.5, 0.067–0.5.
(iii) blue line formally accounts for two cases,ρ = 1 (higher point group symmetry) andα = 0, in both
cases data are untwinned.
100
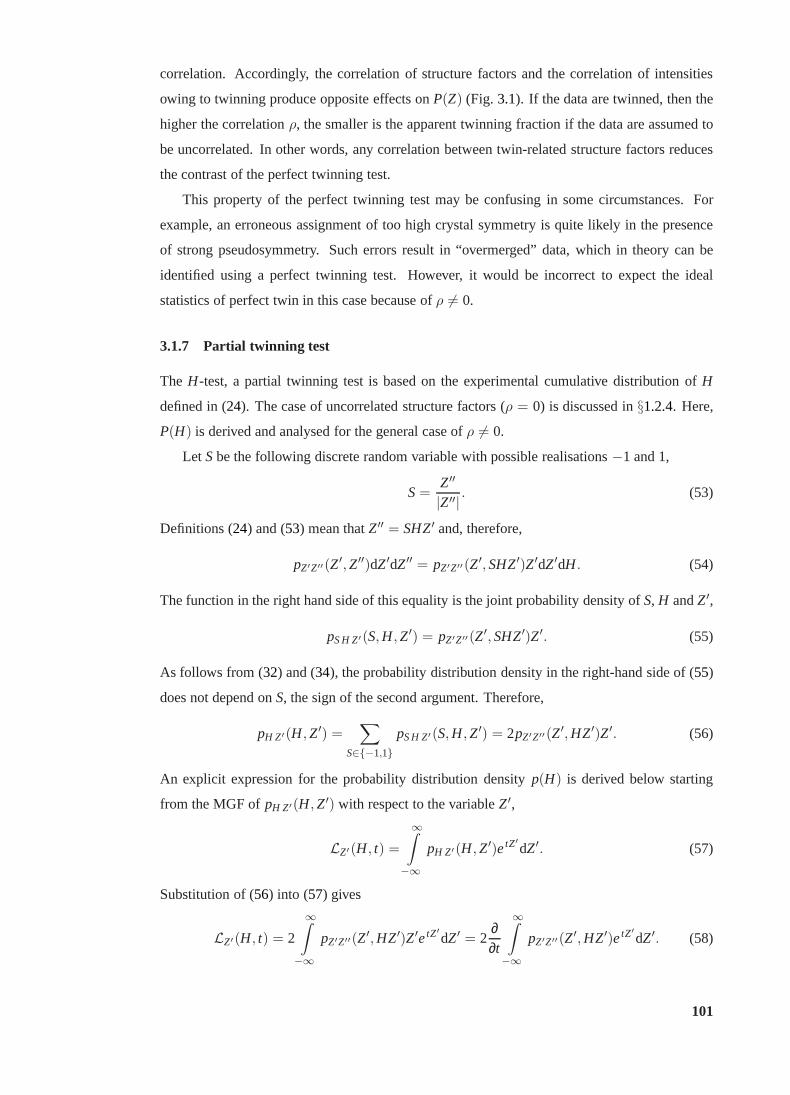
correlation. Accordingly, the correlation of structure factors and the correlation of intensities
owing to twinning produce opposite effects onP(Z) (Fig. 3.1). If the data are twinned, then the
higher the correlationρ, the smaller is the apparent twinning fraction if the data are assumed to
be uncorrelated. In other words, any correlation between twin-related structure factors reduces
the contrast of the perfect twinning test.
This property of the perfect twinning test may be confusing in some circumstances. For
example, an erroneous assignment of too high crystal symmetry is quite likely in the presence
of strong pseudosymmetry. Such errors result in “overmerged” data, which in theory can be
identified using a perfect twinning test. However, it would be incorrect to expect the ideal
statistics of perfect twin in this case because ofρ 6= 0.
3.1.7 Partial twinning test
The H-test, a partial twinning test is based on the experimental cumulative distribution ofH
defined in (24). The case of uncorrelated structure factors (ρ = 0) is discussed in§1.2.4. Here,
P(H) is derived and analysed for the general case ofρ 6= 0.
Let Sbe the following discrete random variable with possible realisations−1 and 1,
S=Z′′
|Z′′| . (53)
Definitions (24) and (53) mean thatZ′′ = SHZ′ and, therefore,
pZ′Z′′(Z′,Z′′)dZ′dZ′′ = pZ′Z′′(Z′,SHZ′)Z′dZ′dH. (54)
The function in the right hand side of this equality is the joint probability density ofS, H andZ′,
pS H Z′(S,H,Z′) = pZ′Z′′(Z′,SHZ′)Z′. (55)
As follows from (32) and (34), the probability distribution density in the right-hand side of (55)
does not depend onS, the sign of the second argument. Therefore,
pH Z′(H,Z′) =∑
S∈{−1,1}pS H Z′(S,H,Z
′) = 2pZ′Z′′(Z′,HZ′)Z′. (56)
An explicit expression for the probability distribution density p(H) is derived below starting
from the MGF ofpH Z′(H,Z′) with respect to the variableZ′,
LZ′(H, t) =
∞∫
−∞
pH Z′(H,Z′)etZ′
dZ′. (57)
Substitution of (56) into (57) gives
LZ′(H, t) = 2
∞∫
−∞
pZ′Z′′(Z′,HZ′)Z′etZ′
dZ′ = 2∂∂t
∞∫
−∞
pZ′Z′′(Z′,HZ′)etZ′
dZ′. (58)
101
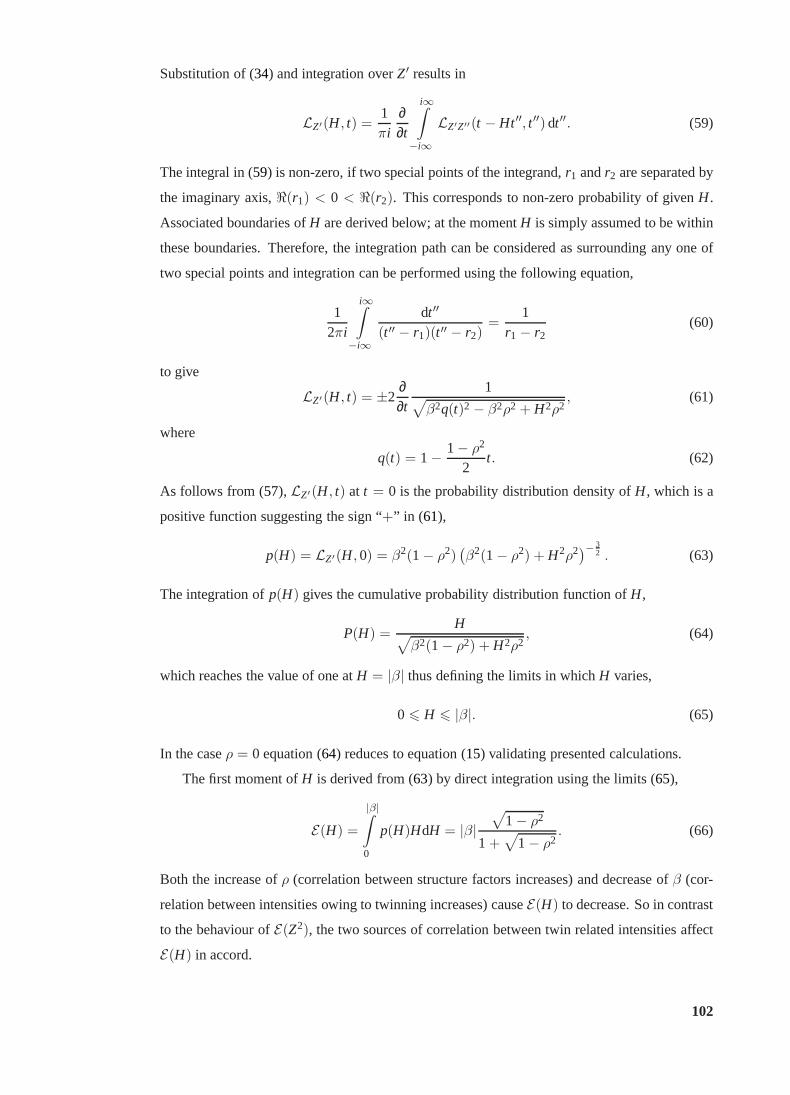
Substitution of (34) and integration overZ′ results in
LZ′(H, t) =1πi
∂∂t
i∞∫
−i∞
LZ′Z′′(t − Ht ′′, t ′′) dt ′′. (59)
The integral in (59) is non-zero, if two special points of the integrand,r1 andr2 are separated by
the imaginary axis,ℜ(r1) < 0 < ℜ(r2). This corresponds to non-zero probability of givenH.
Associated boundaries ofH are derived below; at the momentH is simply assumed to be within
these boundaries. Therefore, the integration path can be considered as surrounding any one of
two special points and integration can be performed using the following equation,
12πi
i∞∫
−i∞
dt ′′
(t ′′ − r1)(t ′′ − r2)=
1r1 − r2
(60)
to give
LZ′(H, t) = ±2∂∂t
1√
β2q(t)2 − β2ρ2 + H2ρ2, (61)
where
q(t) = 1− 1− ρ2
2t. (62)
As follows from (57), LZ′(H, t) at t = 0 is the probability distribution density ofH, which is a
positive function suggesting the sign “+” in (61),
p(H) = LZ′(H,0) = β2(1− ρ2)(
β2(1− ρ2) + H2ρ2)− 32 . (63)
The integration ofp(H) gives the cumulative probability distribution function ofH,
P(H) =H
√
β2(1− ρ2) + H2ρ2, (64)
which reaches the value of one atH = |β| thus defining the limits in whichH varies,
0 6 H 6 |β|. (65)
In the caseρ = 0 equation (64) reduces to equation (15) validating presented calculations.
The first moment ofH is derived from (63) by direct integration using the limits (65),
E(H) =
|β|∫
0
p(H)HdH = |β|√
1− ρ2
1 +√
1− ρ2. (66)
Both the increase ofρ (correlation between structure factors increases) and decrease ofβ (cor-
relation between intensities owing to twinning increases)causeE(H) to decrease. So in contrast
to the behaviour ofE(Z2), the two sources of correlation between twin related intensities affect
E(H) in accord.
102
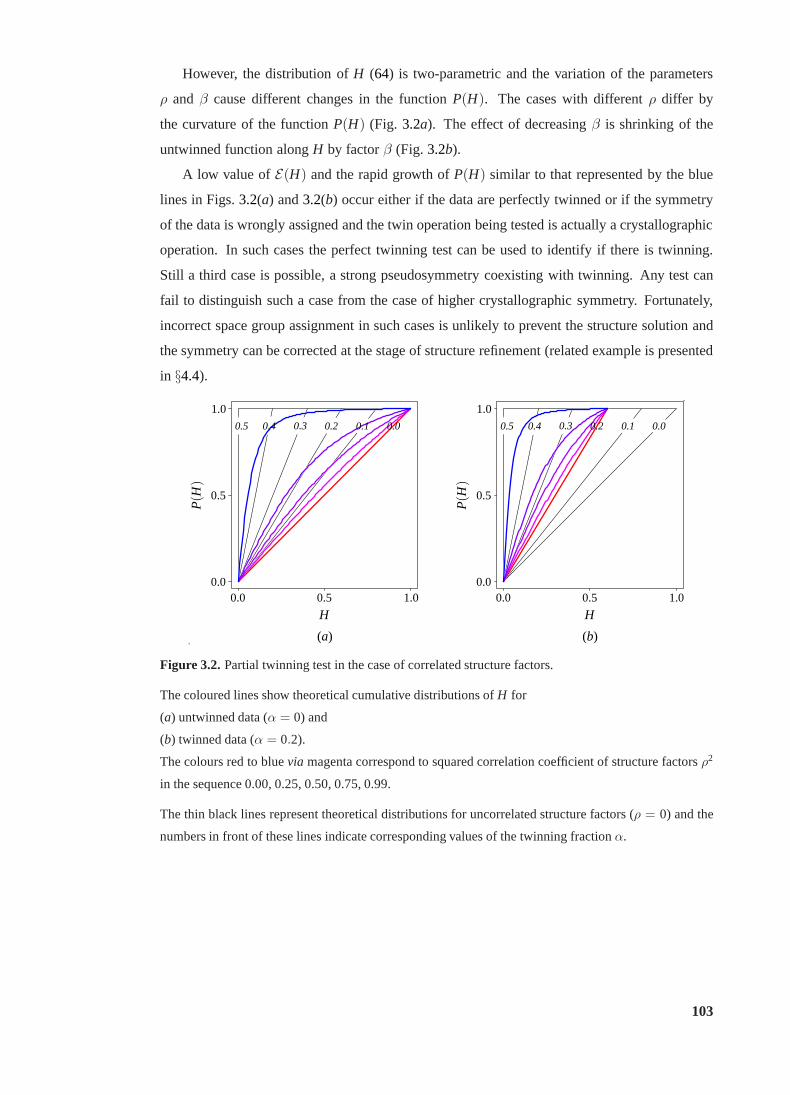
However, the distribution ofH (64) is two-parametric and the variation of the parameters
ρ andβ cause different changes in the functionP(H). The cases with differentρ differ by
the curvature of the functionP(H) (Fig. 3.2a). The effect of decreasingβ is shrinking of the
untwinned function alongH by factorβ (Fig. 3.2b).
A low value ofE(H) and the rapid growth ofP(H) similar to that represented by the blue
lines in Figs.3.2(a) and3.2(b) occur either if the data are perfectly twinned or if the symmetry
of the data is wrongly assigned and the twin operation being tested is actually a crystallographic
operation. In such cases the perfect twinning test can be used to identify if there is twinning.
Still a third case is possible, a strong pseudosymmetry coexisting with twinning. Any test can
fail to distinguish such a case from the case of higher crystallographic symmetry. Fortunately,
incorrect space group assignment in such cases is unlikely to prevent the structure solution and
the symmetry can be corrected at the stage of structure refinement (related example is presented
in §4.4).
0.00.10.20.30.40.5
0.00.0
0.5
0.5
1.0
1.0
H
P(H
)
0.00.10.20.30.40.5
0.00.0
0.5
0.5
1.0
1.0
H
P(H
)
(a) (b).
.
Figure 3.2.Partial twinning test in the case of correlated structure factors.
The coloured lines show theoretical cumulative distributions ofH for
(a) untwinned data (α = 0) and
(b) twinned data (α = 0.2).
The colours red to bluevia magenta correspond to squared correlation coefficient of structure factorsρ2
in the sequence 0.00, 0.25, 0.50, 0.75, 0.99.
The thin black lines represent theoretical distributions for uncorrelated structure factors (ρ = 0) and the
numbers in front of these lines indicate corresponding values of the twinning fractionα.
103
3.2 RvR plot
Refinement against twinned data has recently been implemented in REFMAC(Garib Murshu-
dov, personal communication;§1.2.5). This work required a collection of test cases. Therefore,
we undertook an investigation of all the possible twinning cases, known or undetected, for struc-
tures deposited in the PDB (Lebedevet al., 2006). The goal of the work was to understand the
symmetry environments most frequently accompanying twinning and to pinpoint problems with
refinement of twinned structures.
The search for twins in the PDB was originally performed in terms of estimates of the twin-
ning fraction obtained from the mean values ofH (§3.1.7) for both observed and calculated
intensities. I wrote a subroutine for the analysis of the lattice symmetry for Alexei Vagin to
incorporate it intoSFCHECK. A project student, Nagarajan Periasamy, under my and Garib
Murshudov’s supervision, wrote atcsh-script for scanning the PDB and I analysed all the struc-
tures that were likely to be twinned. The estimate of twinning fraction for the calculated inten-
sities was intended to be a negative control that could help identifying structures overfitted to
the twinned data, but it was found that there are too many structures for which this value was
significantly greater than zero because of the alignment of the NCS and twin axes. I later recast
the scatter plot in terms ofRtwin, as this statistic is more robust to the resolution range used com-
pared to the above estimate of twinning fraction. This also helped avoid confusing terms such
as “an estimate of twinning fraction for calculated intensities”. For this thesis I have rewritten
the software using the statistical packageR (R Development Core Team, 2005) but have anal-
ysed the same set of structures. The new script used only acentric reflections which made the
comparison with the theory possible. In addition, a larger area of RvR-plot was annotated and
more twins found, and the detection of false-positives was more accurate as all pseudosymmet-
ric structures selected for annotation were automaticallyconverted into higher symmetry space
group using subroutines fromZanuda(§4.3) and refined to check whether the pseudosymme-
try and twinning were actually a misinterpretation of a higher crystallographic symmetry. The
updated results are presented below in this section.
Firstly, the algorithm is described, which was used for the automatic determination of po-
tential twin operations. Next, the expected value of theR-factor between twin related intensities
is derived. Finally, analysis of the PDB is presented and theresults are summarised in Fig.3.3
(p.110) and Table3.1(p.114).
3.2.1 Algorithm for lattice symmetry
Several authors (Flack, 1987; Le Page, 2002; Grimmer, 2003)have already described the au-
tomatic identification of potential twin operations using unit-cell parameters and space group.
104
An algorithm, which is simpler to implement and more efficient in the case of twinning by
(pseudo)merohedry, is described below.
A necessary step in all these algorithms is reducing the cellto a minimum primitive cell,
either a Buerger or Niggli cell; see, for example, Mighell & Rodgers (1980) and references
therein. In the basis associated with any minimal primitiveunit-cell, the basis vectors of any
other minimal primitive unit-cell have components -1, 0 or 1. Accordingly, any crystallographic
point group operation is represented in this basis by a matrix with elements from{−1,0,1}, as
it transforms a minimal primitive cell into a minimal primitive cell.
The setX of all 480 matrices with elements from{−1,0,1}, of finite order with respect
to matrix multiplication and with determinant equal to one is generated. This set includes all
matrices representing (pseudo)rotations of the lattice, but also contains irrelevant matrices. Each
matrix o ∈ X is scored according to the perturbation ¯ω that it causes to the metric matrixm
derived from the primitive unit-cell parameters,
8(tanω)2 = trace(
(
δ − o m−1oTm)2)
. (67)
In the case of two-fold rotations, the perturbation ¯ω converges to the obliquity angleω as the
obliquity angle decreases. The reason for using ¯ω as a score instead ofω is that the obliquity
angle is not a good measure of lattice perturbation for the rotations of higher order.
The operations of the crystal point group are transformed tothe primitive cell to giveG, a
group of 3×3 matrices with elements from{−1,0,1}. The matrices fromX are used sequen-
tially, in order of increasing ¯ω, to expandG to the point group of the lattice (pseudo)rotationsH.
At each step, the currentH is replaced by its external product with the nexto ∈ X. The proce-
dure is terminated and the last step cancelled, if the newH is an infinite group (25th element is
generated).
Finally, the coset decomposition ofH relative toG is found and one representative from
each coset is selected to be further used as a potential twin operation. The lattice perturbation ¯ω
is invariant relative to the exact rotations fromG and the same value of ¯ω is therefore associated
with all members of the same coset. This is an additional advantage ofω as compared with the
obliquity angleω.
The twin is a twin by merohedry if the twin operation belongs to the hemihedry of a mero-
hedral point group and the twin is a twin by pseudomerohedry otherwise. To draw Fig.3.3(b),
the type of twinning associated with given potential twin operation was automatically analysed
using the following method. LetG be a point group andm be a metric matrix represented as a
set of 6×6 matrices and as a 6-vector, respectively. Letmbe invariant with respect toG,
g m = m, g ∈ G. (68)
105
Consequently, the projector
π = |G|−1∑
g∈G
g
is such thatπm = m. Let o be a 6×6 matrix representing a potential twin operation. If
oπ = π, (69)
then
o m = oπm = πm = m
and no constraints are needed form to be invariant with respect too in addition to those imposed
by (68). Therefore, if (69) holds, theno generates twinning by merohedry. This test requires no
tables and can be performed in integers if the 6×6 matrix representation ofG corresponds to its
3×3 matrix representation in fractional coordinates.
These two algorithms were implemented in aFORTRANprogram used for the analysis of
twins in the PDB. A modified version of my algorithm for determination of twin operations was
later implemented incctbx(Ralf W. Grosse-Kunstleve, personal communication)
3.2.2 R-factor between twin-related intensities
Let Rtwin denote the intensity-basedR factor between reflections related by potential twin oper-
ationStwin,
Rtwin =
∑
h
|Ih − Ih′ |∑
h
(Ih + Ih′). (70)
Summation in (70) is over all unique reflectionsh, such that intensities for bothh andh′ = Stwinh
have been measured andh 6= h′. The definition (70) coincides with the definition ofRsym in the
case of two symmetry operations. Therefore,Rtwin can be directly compared withRsym estimated
during data processing.
In terms of the normalised sum,Z′ and difference,Z′′ of twin-related intensities defined in
(23),
Rtwin =
∑
hχh|Z′′
h |∑
hχhZ′
h. (71)
In this equation,χh is the normalisation coefficient, which depends on the resolution of a given
reflection.
The expected value ofRtwin is approximated by the ratio of the expected values of the numer-
ator and denominator. Under assumption of constant correlation between twin-related structure
106
factors, as in§3.1, the expected values ofZ′ and|Z′′| are independent ofh and sums of normal-
isation coefficients are cancelled,
E(
Rtwin)
≈E(
∑
hχh|Z′′
h |)
E(
∑
hχhZ′
h
) ≈ E(
|Z′′|)
E(Z′). (72)
The expression in terms of the correlation coefficient between twin-related structure factorρ and
relative volume of smaller individual crystalα follows from (20), (41) and (42),
E(
Rtwin)
≈ E(
|Z′′|)
=12
(1− 2α)√
1− ρ2. (73)
The standard deviation,
σ2(Rtwin) = E(
(
Rtwin − E(
Rtwin)
)2)
(74)
is expressed through the ratio of the expected values,
σ2(Rtwin) ≈E(
(
∑
hχh|Z′′
h | − E(
|Z′′|)∑
hχhZ′
h
)2)
E(
(
∑
hχhZ′
h
)2) . (75)
The expected value of the square in the denominator in (75) is approximated by the square of
the expected value, the expected values ofZ′ and|Z′′| are assumed to be independent ofh, and
equations (41) and (43) are used to obtain the following approximation,
σ2(Rtwin) ≈18(1− 2α)2(1− ρ4)
(
∑
h
χh
)−2∑
h
χ2h. (76)
The dependence of the normalisation coefficientχ on s = |h|, on the overall scale factora and
the temperature factorb is approximated by the following Gaussian,
χ(s) ≈ a e−12bs2
(77)
and summation is replaced by integration to evaluate the twosums in (76),
∑
h
χh ≈ 3Ns3
s∫
0
a e−12bs2
s2ds≈ 3√π√2
Na
(s√
b)3,
∑
h
χ2h ≈ 3N
s3
s∫
0
(
a e−12bs2)2
s2ds≈ 3√π
4Na2
(s√
b)3.
(78)
In these approximations,N is the number of reflections including all symmetry equivalents, the
intensities of the reflections beyond the upper resolution limit sare assumed to be negligible and
therefore the upper integration limits are replaced by infinity. Finally, the combination of (73),
(76) and (78) gives the following approximation for the relative error of the estimate (73),
σ(Rtwin)
E(Rtwin)≈
√
(s√
b)3 (1 + ρ2)
12√πN
. (79)
107
In the rather unfavourable case of high temperature factor,b = 50A2, inadequately high upper
resolution limit s = 0.5A−1, moderate number of reflections,N = 10000 andρ = 1, the
relative error is 0.02. The absolute error of the estimate ofρ2 from Rtwin is of the same order of
magnitude and is much less than the variation ofρ2 with resolution.
Let Robstwin andRcalc
twin denoteRtwin calculated using observed intensities and intensities derived
from the atomic model, respectively. The calculated intensities, which represent a single indi-
vidual crystal, are untwinned. Therefore,
Rcalctwin ≈ 1
2
√
1− ρ2,
Robstwin ≈ (1− 2α) Rcalc
twin.
(80)
Given twinned data and an atomic model of the crystal, the mean squared correlation between
twin-related structure factors,ρ2 and the twinning fraction,α can be estimated from the first and
the second equations in (80), respectively.
If the unit cell parameters and space group of a given structure allow twinning, then the
structure can be represented by a point in the plot ofRobstwin againstRcalc
twin (RvR-plot, Fig.3.3).
The value ofρ2 is in the range 0 to 1 and the value ofα is in the range 0 to 1/2. Therefore,
as long as the approximation (25) is valid, the point is located in the triangle defined by the
following inequalities,
0 6 Rcalctwin 6
12,
0 6 Robstwin 6 Rcalc
twin.
(81)
Fig. 3.3(a) provides a qualitative characterisation of possible cases. The points withRcalctwin ≈
1/2 represent the cases, in which the twin-related structure factors do not correlate (these may
be twinned or untwinned). If the space group assignment is incorrect and the potential twin
operation is in fact the operation of the crystal point group, thenRcalctwin ≈ 0. The abbreviation
RPS stands for rotational pseudosymmetry and denotes the intermediate cases, in which the
orientations of some molecules are related by the potentialtwin operation.
Any single-value intensity statistic can be used in a similar manner to estimateα andρ and
to characterise the relation between NCS and twinning. A good candidate is the mean value of
H defined in (24). In the case of uncorrelated structure factors,H is a sufficient statistic forα
and, similarly toRtwin, the expected value of this statistic (66) linearly depends onα. However,
Rtwin has several minor advantages: it is directly comparable with Rsym; there is no singularity in
the denominator for small intensities, in contrast toH; and the contribution from high-resolution
shells with high experimental errors is downweighted. In addition, the nonlinearity onρ2 is less
in the case ofRtwin.
108
The RvR-plot or similar plot for another single-value statistic can be useful for structure
validation. In this project, it was used for detection of twinned cases in the PDB.
3.2.3 Scatter RvR plot based on PDB-data
The simplest possible way to select twinning cases from the PDB would be to extract the relevant
information from the PDB headers or related papers. However, this approach is not sufficient
because the researchers depositing data or writing papers may have not noticed or not discussed
twinning (false negatives), or may have misinterpreted higher crystal symmetry as twinning
(false positive). Therefore, it was decided to analyse PDB entries directly. This direct approach
may also lead to a better understanding of the problems with the detection of twinning.
The PDB February 2004 release containing about 22 000 structures was screened and the
entries in which both coordinates and structures factors were available and readable by CCP4
software (11 367 entries) were used in the analysis. The unit-cell parameters and space group
of these entries were analysed using the technique described above (§3.2.1). In this analysis, a
lattice perturbation (67) less than 3.5o was allowed. This threshold was about two times less than
the Mallard’s limit of 6o for the obliquity angle§1.2.1. If twinning by (pseudo)merohedry was
possible then this data set was selected for further analysis (4010 entries). If observed intensities
were present they were used directly for theR-factor calculations, and if only observed structure
amplitudes were available, they were squared to approximate corresponding intensities.
For each of the selected PDB-entries, potential twin operations were selected, one from each
coset of equivalent operations, and the associatedRobstwin andRcalc
twin were calculated. If there were
more than one non-equivalent operations (as, for example, in P3), the one with the lowest value
of Robstwin was selected. Thus, each selected entry was characterised by two quantities,Robs
twin and
Rcalctwin, and the corresponding point was drawn on the scatter RvR plot (Fig. 3.3b). In addition,
the method described in§3.2.1was used to decide whether any twinning for the selected twin
operation could be by merohedry or pseudomerohedry. The points in Fig.3.3(b) are coloured
according to the results of this analysis. The specific areasand some peculiarities of the RvR
plot are discussed below.
Calculation ofRobstwin andRcalc
twin were performed for all data and for the resolution range 10 to
3 A and revealed only a marginal difference between two sets ofR-factors for most examples.
Only for six structures from the annotated area of the RvR-plot was this difference for any of
Robstwin and Rcalc
twin greater that 0.05 and only in one case could lead to misinterpretation of the
results. However the latter structure was annotated manually as untwinned. Fig.3.3 shows the
results with the resolution cut-off applied, as it was done for the previous versions of the RvR
plot discussed in the beginning of this section (§3.2).
109
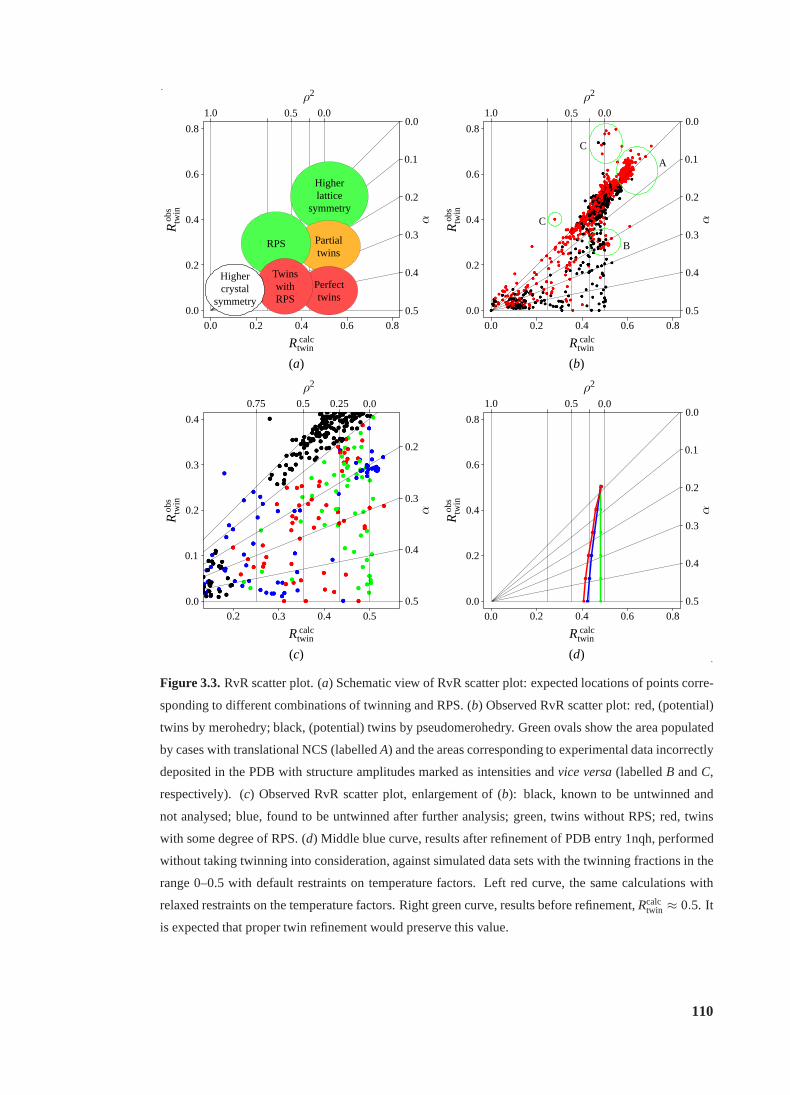
Rcalctwin
Rob
stw
in
α
ρ2
0.00.0
0.0
0.0
0.1
0.2
0.2
0.2
0.3
0.4
0.4
0.40.5
0.5
0.6
0.6
0.8
0.8
1.0
Higherlattice
symmetry
Partialtwins
Perfecttwins
RPS
TwinswithRPS
Highercrystal
symmetry
Rcalctwin
Rob
stw
in
α
ρ2
0.00.0
0.0
0.0
0.1
0.2
0.2
0.2
0.3
0.4
0.4
0.40.5
0.5
0.6
0.6
0.8
0.8
1.0
A
B
C
C
Rcalctwin
Rob
stw
in
α
ρ2
0.0
0.0
0.1
0.2
0.2
0.2
0.3
0.3
0.3
0.4
0.4
0.4
0.5
0.5
0.5
0.250.75
Rcalctwin
Rob
stw
in
α
ρ2
0.00.0
0.0
0.0
0.1
0.2
0.2
0.2
0.3
0.4
0.4
0.4
0.5
0.5
0.6
0.6
0.8
0.8
1.0
(a) (b)
(c) (d) .
.
Figure 3.3.RvR scatter plot. (a) Schematic view of RvR scatter plot: expected locations of points corre-
sponding to different combinations of twinning and RPS. (b) Observed RvR scatter plot: red, (potential)
twins by merohedry; black, (potential) twins by pseudomerohedry. Green ovals show the area populated
by cases with translational NCS (labelledA) and the areas corresponding to experimental data incorrectly
deposited in the PDB with structure amplitudes marked as intensities andvice versa(labelledB andC,
respectively). (c) Observed RvR scatter plot, enlargement of (b): black, known to be untwinned and
not analysed; blue, found to be untwinned after further analysis; green, twins without RPS; red, twins
with some degree of RPS. (d) Middle blue curve, results after refinement of PDB entry 1nqh, performed
without taking twinning into consideration, against simulated data sets with the twinning fractions in the
range 0–0.5 with default restraints on temperature factors. Left red curve, the same calculations with
relaxed restraints on the temperature factors. Right greencurve, results before refinement,Rcalctwin ≈ 0.5. It
is expected that proper twin refinement would preserve this value.
110
3.2.4 Untwinned cases
A large cluster around (0.5, 0.5) includes the points corresponding to untwinned crystals without
RPS and, in particular, to untwinned crystals belonging to merohedral point groups 4, 3, 32, 6,
23. In addition, some of the points from this cluster are likely to represent detwinned data sets.
The latter cases of twinning could be found by scanning the headers of the coordinate files, but
could not be validated. This analysis has not been performed.
The points on and close to the diagonal, withRcalctwin ≈ Robs
twin in the range 0.3–0.4 form the
lower tail of the main cluster and correspond to untwinned crystals with RPS. This tail extends
down the diagonal to about 0.2, where one can find an extreme example of pseudosymmetry
(1i1j; Lougheedet al., 2001). In this high-resolution structure, the r.m.s.d. ofCα atoms from
the positions corresponding to higher crystal symmetry is about 0.25A.
The main cluster also has an upper diagonal tail around (0.6,0.6) corresponding to structures
with translational NCS, in which the set of NCS vectors is notinvariant with respect toStwin.
In these structures,Stwin maps weak reflections into strong reflections and the assumption that
the expected values of twin-related intensities are equal (25) is violated. The numerator in (71)
increases and thereforeRtwin becomes greater than expected. Twinning seems unlikely in such
structures, note the empty area in the RvR plot below the areaunder consideration.
The cluster at the origin corresponds to the structures in which the crystal symmetry is
incorrectly assigned and is actually higher than that used in the refinement and reported in the
PDB entry. In 42 cases randomly chosen from this cluster refinements in the original and higher
symmetry space groups were performed starting from symmetrised models without solvent and
gave differences inRfree in the range−0.02 to 0.02. (Inclusion of solvent would break the higher
symmetry.) I deemed this to represent successful refinement. In all these cases the intensity
statistics either favour the higher symmetry or are inconclusive. It seems therefore impossible to
reject the null hypothesis of higher symmetry with the experimental data available in the PDB,
although it cannot be excluded that analysis of unmerged intensities and merging statistics could
reveal pseudosymmetry and twinning in some of these structures.
There are extra features in the RvR-plot, which arise from errors in deposition. These are
two small clusters located above and below the main cluster and highlighted by green ovals
in Fig. 3.3(b). In the first one, at about (0.5, 0.3), the structure amplitudes are labelled as
intensities, and in the second one, at about (0.5, 0.7), the intensities are labelled as the structure
amplitudes. Such mistakes can in principle be automatically identified if necessary. However,
if additional factors, such as twinning, pseudosymmetry oranisotropy affect the data, or several
deposition inaccuracies (for example, deposition of the detwinned data instead of the measured
data) are present simultaneously, then such an analysis becomes complicated, if at all possible.
111
For example, the manual analysis of the “twinned” area of theRvR-plot revealed several data
sets with unusual intensity statistics, which could not be unambiguously attributed to twinning,
NCS or a combination of these two.
3.2.5 Cases of twinning
The cases withRobstwin < 0.4Rcalc
twin andRcalctwin > 0.2, as well as some randomly chosen cases from
other areas of the RvR plot, were further investigated (coloured circles in Fig.3.3c) to validate
the presence or absence of twinning and to characterise the NCS if present. It was assumed
that this area contained all twinned cases with significant twinning fraction (α > 0.1) except
for the PDB entries with detwinned data. However, some of thetwins with α ' 0.1 could
have been overlooked, and actualα in identified twins could be greater than expected from the
RvR plot. This is because refinement against twinned data butwith twinning ignored leads to
underestimated value ofRcalctwin and consequently underestimatedα (§3.2.6; Fig. 3.3c).
The protocol of analysis included validation of the model (SFCHECK; Vaguineet al., 1999),
visual analysis of the structure (Coot; Emsley & Cowtan, 2004), analysis of the SRF (MOLREP;
Vagin & Teplyakov, 1997), perfect twinning tests (cumulative distribution of normalised inten-
sity and the second moments of acentric reflections;TRUNCATE; Collaborative Computational
Project, Number 4, 1994) and partial twinning test (H-tests;SFCHECK). The analysis of the
SRF and twinning tests were performed for both observed and calculated intensities with differ-
ent resolution cut-offs. In problematic cases the statistics of calculated intensities were exam-
ined for different models, original and refined with strong restraints, with and without solvent
atoms. The NCS operations if present were compared with potential twin operations to identify
RPS. If pseudosymmetry was present, an attempt was made to transform and refine the structure
in the corresponding higher symmetry space group using subroutines formZanuda(§4.3) and
REFMAC, in order to validate the reported space group.
Twinning has been identified with a high degree of confidence in 110 cases shown by red
and green circles in Fig.3.3(c); red and green indicating the cases with and without RPS, respec-
tively. The remaining cases analysed (blue circles) split into three groups, untwinned structures,
untwinned structures with incorrect space group assignment and pathological cases, in which the
model is incomplete or corrupted, or intensity statistics could not be unambiguously interpreted.
The minimal value ofRcalctwin for twinned structures was 0.2. At the same time, there were several
cases with incorrect space groups, in whichRcalctwin was more than 0.2, up to 0.4. These models
were strongly overfitted towards twinned data and there weresignificant differences between
independently refined molecules which were symmetry-related in the actual crystal structure.
In general, only one third of the cases identified as twins were reported as such in the PDB
112
submission (32 out of 110), although in some of the remainingtwinned cases the analysis of
intensities derived from atomic models shows that the twinning was actually taken into account
during refinement. Nevertheless, in a significant number of cases this was not done (false nega-
tives). In two certainly untwinned cases twinning was reported in the PDB file and, accordingly,
the structures were refined in lower symmetry space groups (false positives).
Table3.1contains symmetry and NCS information for the identified cases of twinning and
demonstrates that twins by pseudomerohedry are not unusualand that RPS is present in half of
all twins. The nature of additional lattice symmetry in macromolecular twins by pseudomero-
hedry is analysed for two examples in§3.3 and§3.4. The second example also demonstrates
that RPS is necessarily present in OD-twins by pseudomerohedry.
Four orthorhombic twins by pseudomerohedry with a specialised tetragonal lattice have been
identified (Table3.1). In these cases, the lattice symmetry also allows twin by merohedry with
tetragonal crystal symmetry. These examples therefore highlight the importance of an exhaustive
analysis of possible twin laws and show that the attempts at structure solution should not be
limited by consideration of twinning by merohedry despite its higher probability, if both types
of twins are allowed by the lattice symmetry.
The blue point in the RvR plot withRcalctwin = 0.18 andRobs
twin = 0.28 corresponds to detwinned
data of an OD-twin be reticular pseudomerohedry (PDB code 1lbs) discussed in§1.3.4.
3.2.6 Effect of refinement onRcalctwin
The cases with RPS (red points in Fig.3.3c) were defined from the analyses of the atomic
models. The similarity between NCS related molecules and the alignment of NCS and twin axes
(a discrepancy of up to 6o was tolerated) could be insufficiently precise to cause any significant
correlation between twin related structure factors. It is therefore unsurprising thatRcalctwin for some
of the cases with RPS is large, up to 0.5.
On the contrary, the assignment of cases without RPS was strict (green points in Fig.3.3c);
there was only one molecule per asymmetric unit in many of these, and the relation between
symmetry independent molecules was clearly irrelevant to twin rotation in others. The low
values ofRcalctwin for some of these cases can only be explained by either pathologies in the exper-
imental data, or, more likely, by overfitting of the model toward twinned data.
The decrease inRcalctwin owing to untwinned refinement against twinned data was examined
using a simulated experiment. The 3.1A data from an untwinned crystal (PDB entry 1nqh,
space groupP3121) were artificially twinned to produce six data sets with twinning fractions
of 0.0, 0.1, 0.2, 0.3, 0.4, 0.5. The model from the PDB was refined against all these data sets
following the same protocol, without model rebuilding and ignoring twinning. The values of
113
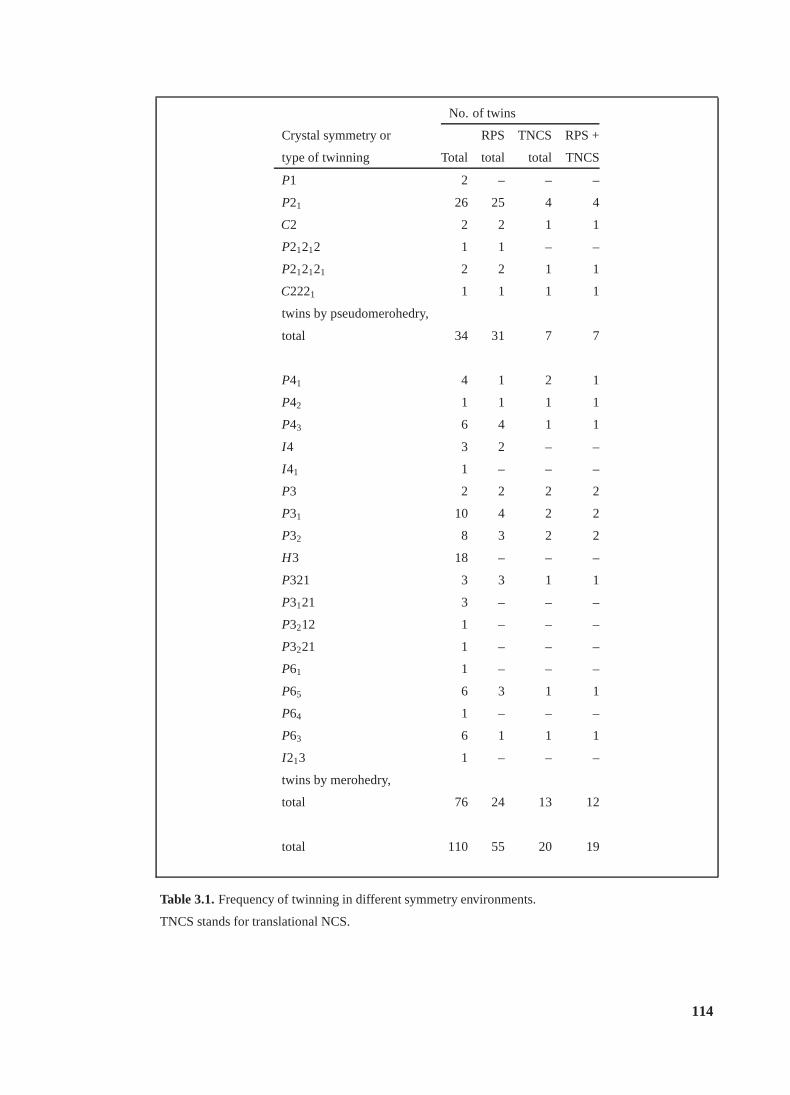
No. of twins
Crystal symmetry or RPS TNCS RPS +
type of twinning Total total total TNCS
P1 2 – – –
P21 26 25 4 4
C2 2 2 1 1
P21212 1 1 – –
P212121 2 2 1 1
C2221 1 1 1 1
twins by pseudomerohedry,
total 34 31 7 7
P41 4 1 2 1
P42 1 1 1 1
P43 6 4 1 1
I4 3 2 – –
I41 1 – – –
P3 2 2 2 2
P31 10 4 2 2
P32 8 3 2 2
H3 18 – – –
P321 3 3 1 1
P3121 3 – – –
P3212 1 – – –
P3221 1 – – –
P61 1 – – –
P65 6 3 1 1
P64 1 – – –
P63 6 1 1 1
I213 1 – – –
twins by merohedry,
total 76 24 13 12
total 110 55 20 19
Table 3.1.Frequency of twinning in different symmetry environments.
TNCS stands for translational NCS.
114
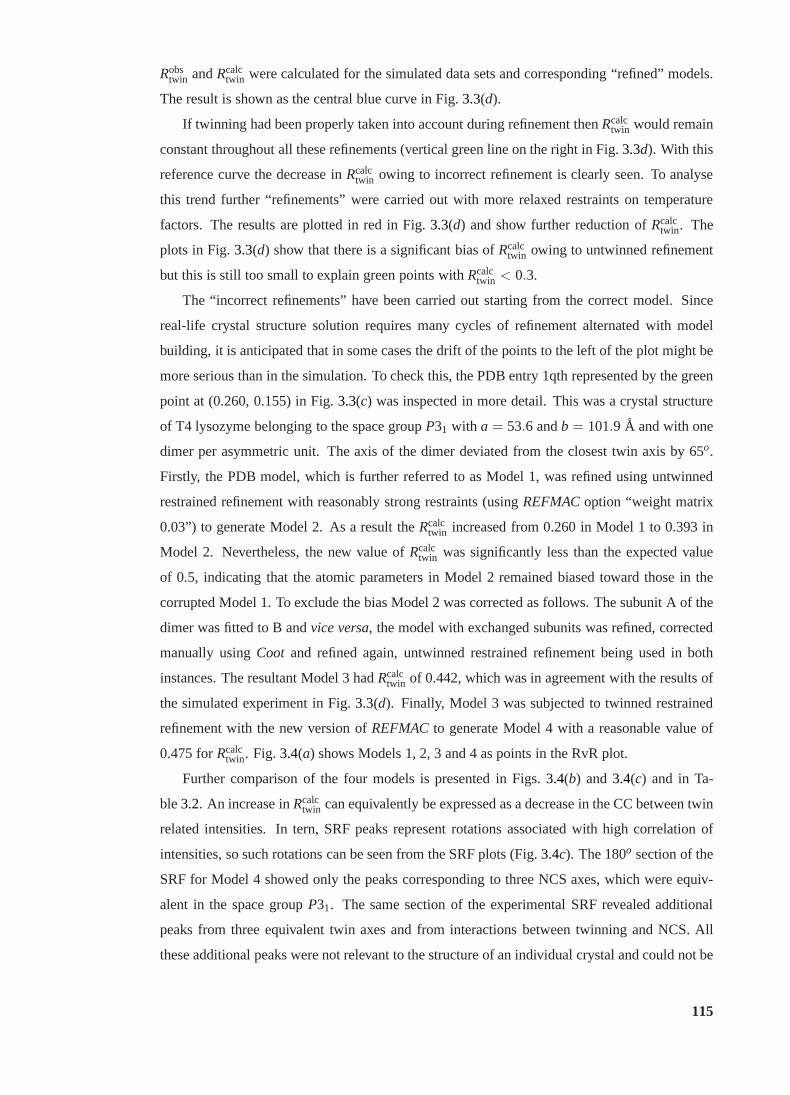
Robstwin andRcalc
twin were calculated for the simulated data sets and corresponding “refined” models.
The result is shown as the central blue curve in Fig.3.3(d).
If twinning had been properly taken into account during refinement thenRcalctwin would remain
constant throughout all these refinements (vertical green line on the right in Fig.3.3d). With this
reference curve the decrease inRcalctwin owing to incorrect refinement is clearly seen. To analyse
this trend further “refinements” were carried out with more relaxed restraints on temperature
factors. The results are plotted in red in Fig.3.3(d) and show further reduction ofRcalctwin. The
plots in Fig.3.3(d) show that there is a significant bias ofRcalctwin owing to untwinned refinement
but this is still too small to explain green points withRcalctwin < 0.3.
The “incorrect refinements” have been carried out starting from the correct model. Since
real-life crystal structure solution requires many cyclesof refinement alternated with model
building, it is anticipated that in some cases the drift of the points to the left of the plot might be
more serious than in the simulation. To check this, the PDB entry 1qth represented by the green
point at (0.260, 0.155) in Fig.3.3(c) was inspected in more detail. This was a crystal structure
of T4 lysozyme belonging to the space groupP31 with a = 53.6 andb = 101.9 A and with one
dimer per asymmetric unit. The axis of the dimer deviated from the closest twin axis by 65o.
Firstly, the PDB model, which is further referred to as Model1, was refined using untwinned
restrained refinement with reasonably strong restraints (using REFMACoption “weight matrix
0.03”) to generate Model 2. As a result theRcalctwin increased from 0.260 in Model 1 to 0.393 in
Model 2. Nevertheless, the new value ofRcalctwin was significantly less than the expected value
of 0.5, indicating that the atomic parameters in Model 2 remained biased toward those in the
corrupted Model 1. To exclude the bias Model 2 was corrected as follows. The subunit A of the
dimer was fitted to B andvice versa, the model with exchanged subunits was refined, corrected
manually usingCoot and refined again, untwinned restrained refinement being used in both
instances. The resultant Model 3 hadRcalctwin of 0.442, which was in agreement with the results of
the simulated experiment in Fig.3.3(d). Finally, Model 3 was subjected to twinned restrained
refinement with the new version ofREFMACto generate Model 4 with a reasonable value of
0.475 forRcalctwin. Fig. 3.4(a) shows Models 1, 2, 3 and 4 as points in the RvR plot.
Further comparison of the four models is presented in Figs.3.4(b) and 3.4(c) and in Ta-
ble3.2. An increase inRcalctwin can equivalently be expressed as a decrease in the CC betweentwin
related intensities. In tern, SRF peaks represent rotations associated with high correlation of
intensities, so such rotations can be seen from the SRF plots(Fig. 3.4c). The 180o section of the
SRF for Model 4 showed only the peaks corresponding to three NCS axes, which were equiv-
alent in the space groupP31. The same section of the experimental SRF revealed additional
peaks from three equivalent twin axes and from interactionsbetween twinning and NCS. All
these additional peaks were not relevant to the structure ofan individual crystal and could not be
115
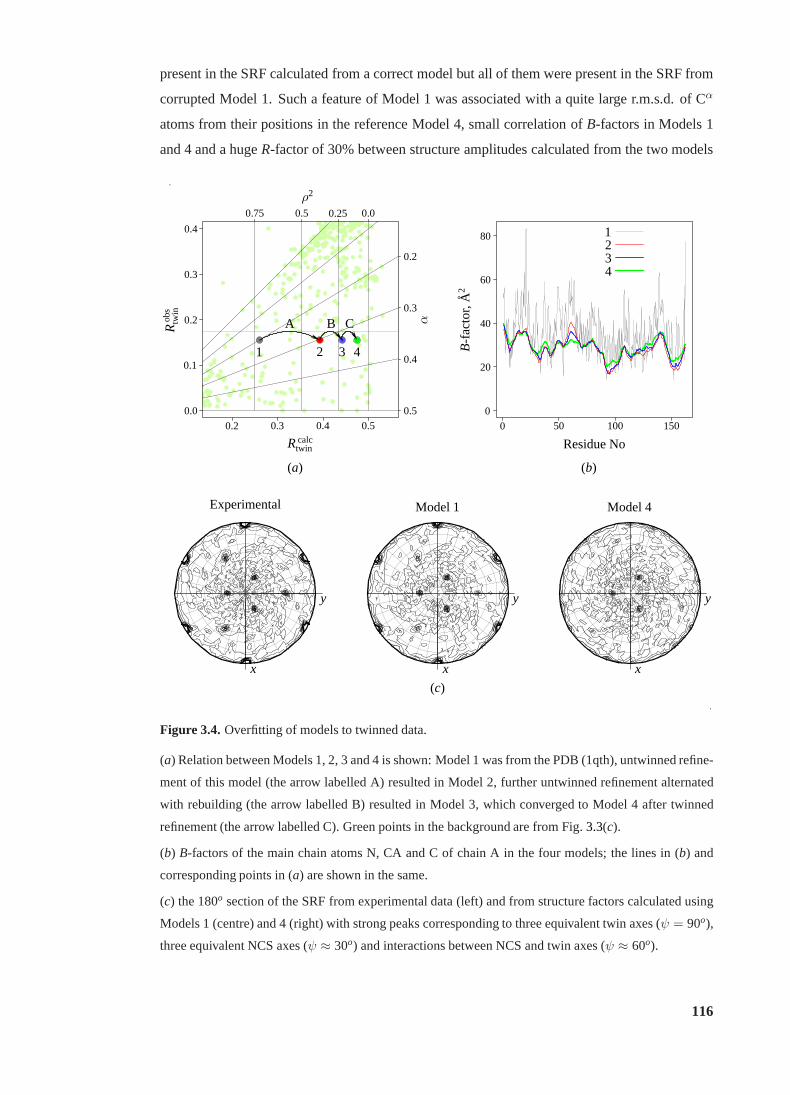
present in the SRF calculated from a correct model but all of them were present in the SRF from
corrupted Model 1. Such a feature of Model 1 was associated with a quite large r.m.s.d. of Cα
atoms from their positions in the reference Model 4, small correlation ofB-factors in Models 1
and 4 and a hugeR-factor of 30% between structure amplitudes calculated from the two models
Rcalctwin
Rob
stw
in
α
ρ2
0.0
0.0
0.1
0.2
0.2
0.2
0.3
0.3
0.3
0.4
0.4
0.4
0.5
0.5
0.5
0.250.75
1 2 3 4
A B C
ResidueNo
B-f
acto
r,A
2
50 100 1500
0
20
40
60
80 1234
(a) (b)
x
y
x
y
x
y
(c)
Experimental Model1 Model4
.
.
Figure 3.4.Overfitting of models to twinned data.
(a) Relation between Models 1, 2, 3 and 4 is shown: Model 1 was from the PDB (1qth), untwinned refine-
ment of this model (the arrow labelled A) resulted in Model 2,further untwinned refinement alternated
with rebuilding (the arrow labelled B) resulted in Model 3, which converged to Model 4 after twinned
refinement (the arrow labelled C). Green points in the background are from Fig.3.3(c).
(b) B-factors of the main chain atoms N, CA and C of chain A in the four models; the lines in (b) and
corresponding points in (a) are shown in the same.
(c) the 180o section of the SRF from experimental data (left) and from structure factors calculated using
Models 1 (centre) and 4 (right) with strong peaks corresponding to three equivalent twin axes (ψ = 90o),
three equivalent NCS axes (ψ ≈ 30o) and interactions between NCS and twin axes (ψ ≈ 60o).
116
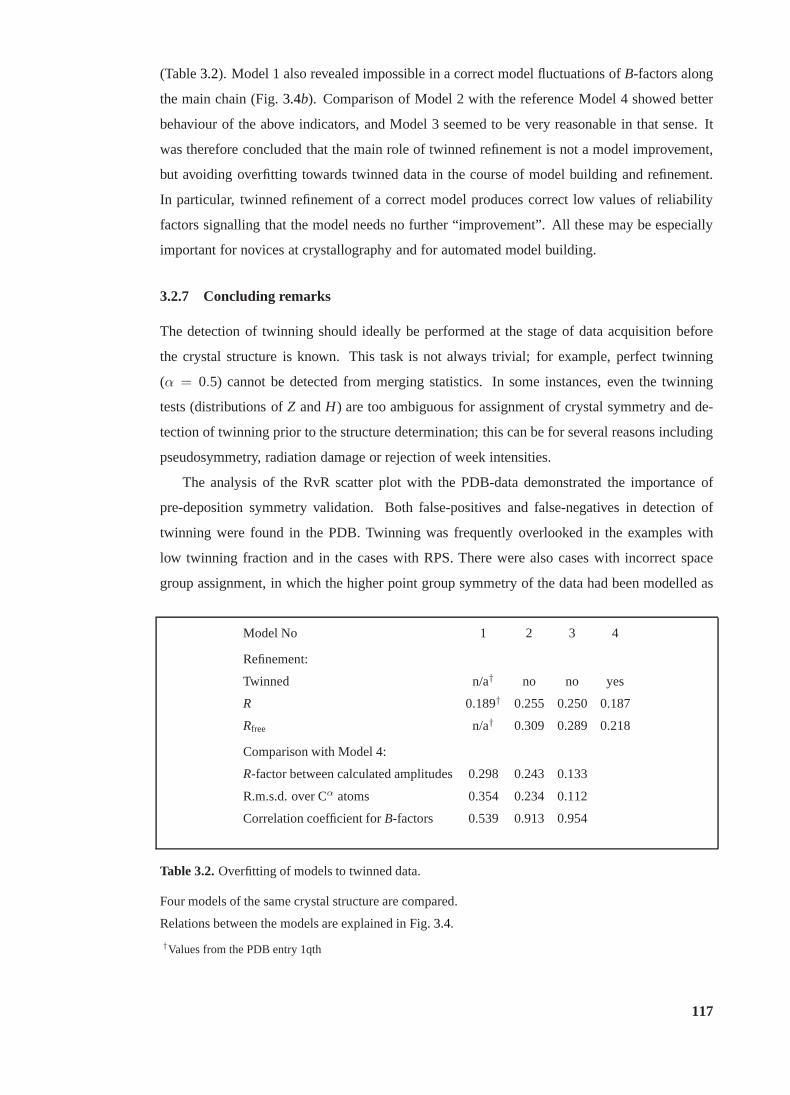
(Table3.2). Model 1 also revealed impossible in a correct model fluctuations ofB-factors along
the main chain (Fig.3.4b). Comparison of Model 2 with the reference Model 4 showed better
behaviour of the above indicators, and Model 3 seemed to be very reasonable in that sense. It
was therefore concluded that the main role of twinned refinement is not a model improvement,
but avoiding overfitting towards twinned data in the course of model building and refinement.
In particular, twinned refinement of a correct model produces correct low values of reliability
factors signalling that the model needs no further “improvement”. All these may be especially
important for novices at crystallography and for automatedmodel building.
3.2.7 Concluding remarks
The detection of twinning should ideally be performed at thestage of data acquisition before
the crystal structure is known. This task is not always trivial; for example, perfect twinning
(α = 0.5) cannot be detected from merging statistics. In some instances, even the twinning
tests (distributions ofZ andH) are too ambiguous for assignment of crystal symmetry and de-
tection of twinning prior to the structure determination; this can be for several reasons including
pseudosymmetry, radiation damage or rejection of week intensities.
The analysis of the RvR scatter plot with the PDB-data demonstrated the importance of
pre-deposition symmetry validation. Both false-positives and false-negatives in detection of
twinning were found in the PDB. Twinning was frequently overlooked in the examples with
low twinning fraction and in the cases with RPS. There were also cases with incorrect space
group assignment, in which the higher point group symmetry of the data had been modelled as
Model No 1 2 3 4
Refinement:
Twinned n/a† no no yes
R 0.189† 0.255 0.250 0.187
Rfree n/a† 0.309 0.289 0.218
Comparison with Model 4:
R-factor between calculated amplitudes 0.298 0.243 0.133
R.m.s.d. over Cα atoms 0.354 0.234 0.112
Correlation coefficient forB-factors 0.539 0.913 0.954
Table 3.2.Overfitting of models to twinned data.
Four models of the same crystal structure are compared.
Relations between the models are explained in Fig.3.4.
†Values from the PDB entry 1qth
117

twinning. However, these false-positives constituted only a minor fraction of the whole set of
structures modelled and deposited in a lower symmetry spacegroup.
The programZanudawas therefore developed for validation and, if necessary, automatic
correction of the space group assignment for pre-refined models. This program is described in
§4.3in the discussion on false origin MR solutions, yet another reason for incorrect identification
of symmetry in the presence of NCS.
In addition, the identified twinned data were used as test cases for the new version ofREFMAC,
which performs twinned refinement against a marginal likelihood target.
118
3.3 Example of twin by metric merohedry
Proteins from the phage SPP1 involved in DNA translocation are studied in the group of Dr.
Fred Antson (YSBL). Two crystal forms of the C-terminal domain of the large terminase protein
(gp2) were obtained by Dr. Maria Chechik, anomalous diffraction data (Se-Met) were collected
by Mikhail Shevtsov and the structure of a non-twinned form determined by Oleg Kovalevskiy.
I solved and analysed the structure of the twinned crystal form.
This is an example of a crystal in which several NCS operations are present but none of them
has its axis aligned with the twin axis. Therefore the theoretical intensity distribution (§1.2.3)
holds despite the high-order NCS. Accordingly, the point inthe RvR plot (§3.2) corresponding
to this structure is located in the area of “simple” twins (Fig. 3.5). A remarkable feature of this
example is that the analysis of NCS clearly reveals the structural nature of constraints on cell
dimensions required for twinning.
3.3.1 Background
The diffraction data from a twinned crystal of the gp2 C-terminal domain were initially pro-
cessed inC2221 space group. Perfect twinning tests clearly revealed twinning by hemihedry
(Fig. 3.6). With these data, the space group can be unambiguously determined. There are four
subgroups,P1, P21 and two non-equivalentC2 in the apparentC2221 space group. Only one of
them,P21 accounts for observed systematic absences. The data were therefore reprocessed in
P21 with a = 69.4 A, b = 159.4 A, c = 107.7 A andβ = 108.8o. The partial twinning test in
P21 (H-test for the twin operationh, −k, −h− l ) is shown in Fig.3.7. Similar behaviour was
Rcalctwin
Rob
stw
in
α
ρ2
0.0 0.2 0.4 0.6 0.8
0.0
0.2
0.4
0.6
0.8
0.00.51.00.0
0.1
0.2
0.3
0.4
0.5
.
.
Figure 3.5.Twinned crystal of C-terminal domain of gp2 protein from phage SPP1. The red point in the
RvR plot (§3.2) corresponds to theP21 crystal structure and X-ray data collected from twinned crystal.
Green points in the background present scatter plot derivedfrom the PDB (Fig.3.3b).
119
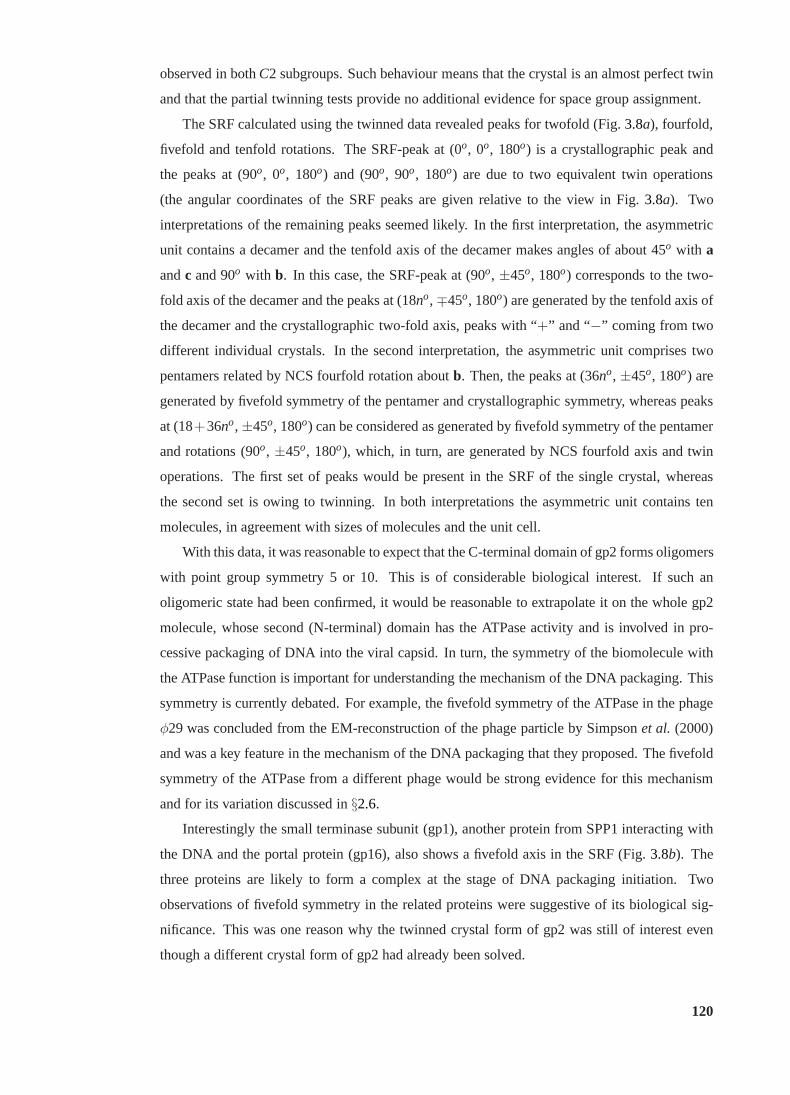
observed in bothC2 subgroups. Such behaviour means that the crystal is an almost perfect twin
and that the partial twinning tests provide no additional evidence for space group assignment.
The SRF calculated using the twinned data revealed peaks fortwofold (Fig.3.8a), fourfold,
fivefold and tenfold rotations. The SRF-peak at (0o, 0o, 180o) is a crystallographic peak and
the peaks at (90o, 0o, 180o) and (90o, 90o, 180o) are due to two equivalent twin operations
(the angular coordinates of the SRF peaks are given relativeto the view in Fig.3.8a). Two
interpretations of the remaining peaks seemed likely. In the first interpretation, the asymmetric
unit contains a decamer and the tenfold axis of the decamer makes angles of about 45o with a
andc and 90o with b. In this case, the SRF-peak at (90o, ±45o, 180o) corresponds to the two-
fold axis of the decamer and the peaks at (18no, ∓45o, 180o) are generated by the tenfold axis of
the decamer and the crystallographic two-fold axis, peaks with “+” and “−” coming from two
different individual crystals. In the second interpretation, the asymmetric unit comprises two
pentamers related by NCS fourfold rotation aboutb. Then, the peaks at (36no, ±45o, 180o) are
generated by fivefold symmetry of the pentamer and crystallographic symmetry, whereas peaks
at (18+36no, ±45o, 180o) can be considered as generated by fivefold symmetry of the pentamer
and rotations (90o, ±45o, 180o), which, in turn, are generated by NCS fourfold axis and twin
operations. The first set of peaks would be present in the SRF of the single crystal, whereas
the second set is owing to twinning. In both interpretationsthe asymmetric unit contains ten
molecules, in agreement with sizes of molecules and the unitcell.
With this data, it was reasonable to expect that the C-terminal domain of gp2 forms oligomers
with point group symmetry 5 or 10. This is of considerable biological interest. If such an
oligomeric state had been confirmed, it would be reasonable to extrapolate it on the whole gp2
molecule, whose second (N-terminal) domain has the ATPase activity and is involved in pro-
cessive packaging of DNA into the viral capsid. In turn, the symmetry of the biomolecule with
the ATPase function is important for understanding the mechanism of the DNA packaging. This
symmetry is currently debated. For example, the fivefold symmetry of the ATPase in the phage
φ29 was concluded from the EM-reconstruction of the phage particle by Simpsonet al. (2000)
and was a key feature in the mechanism of the DNA packaging that they proposed. The fivefold
symmetry of the ATPase from a different phage would be strongevidence for this mechanism
and for its variation discussed in§2.6.
Interestingly the small terminase subunit (gp1), another protein from SPP1 interacting with
the DNA and the portal protein (gp16), also shows a fivefold axis in the SRF (Fig.3.8b). The
three proteins are likely to form a complex at the stage of DNApackaging initiation. Two
observations of fivefold symmetry in the related proteins were suggestive of its biological sig-
nificance. This was one reason why the twinned crystal form ofgp2 was still of interest even
though a different crystal form of gp2 had already been solved.
120
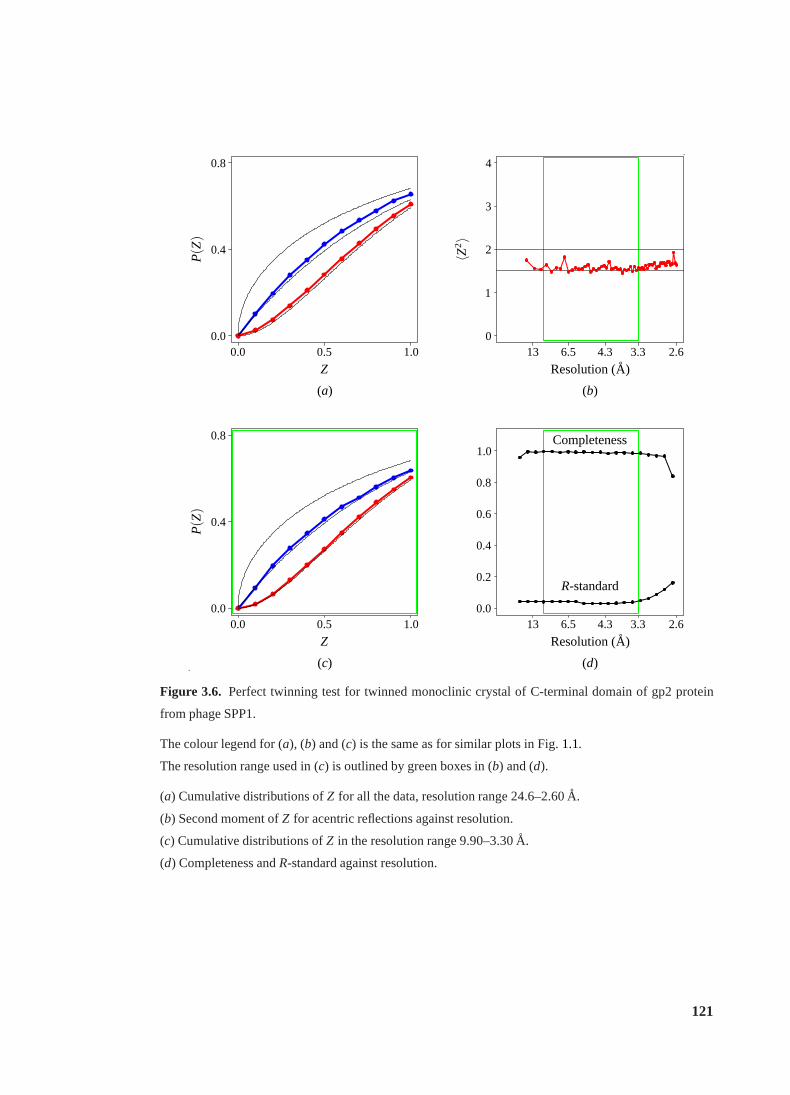
0.00.0
0.4
0.5
0.8
1.0
Z
P(Z
)
0
1
2
3
4
2.63.34.36.513
Resolution(A)
〈Z2〉
0.00.0
0.4
0.5
0.8
1.0
Z
P(Z
)
0.0
0.2
0.4
0.6
0.8
1.0
2.63.34.36.513
Resolution(A)
Completeness
R-standard
(a) (b)
(c) (d).
.
Figure 3.6. Perfect twinning test for twinned monoclinic crystal of C-terminal domain of gp2 protein
from phage SPP1.
The colour legend for (a), (b) and (c) is the same as for similar plots in Fig.1.1.
The resolution range used in (c) is outlined by green boxes in (b) and (d).
(a) Cumulative distributions ofZ for all the data, resolution range 24.6–2.60A.
(b) Second moment ofZ for acentric reflections against resolution.
(c) Cumulative distributions ofZ in the resolution range 9.90–3.30A.
(d) Completeness andR-standard against resolution.
121
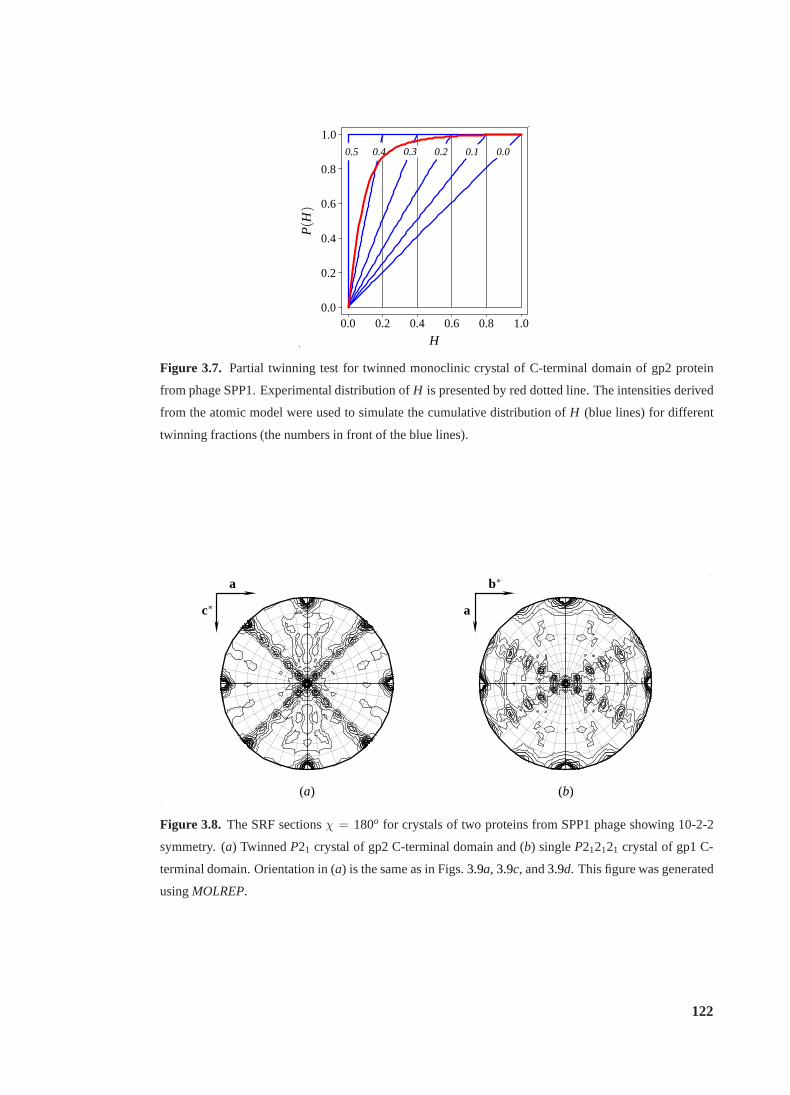
0.00.10.20.30.40.5
0.00.0
0.2
0.2
0.4
0.4
0.6
0.6
0.8
0.8
1.0
1.0
H
P(H
)
.
.
Figure 3.7. Partial twinning test for twinned monoclinic crystal of C-terminal domain of gp2 protein
from phage SPP1. Experimental distribution ofH is presented by red dotted line. The intensities derived
from the atomic model were used to simulate the cumulative distribution ofH (blue lines) for different
twinning fractions (the numbers in front of the blue lines).
ac∗
a b∗
(a) (b)
Figure 3.8. The SRF sectionsχ = 180o for crystals of two proteins from SPP1 phage showing 10-2-2
symmetry. (a) TwinnedP21 crystal of gp2 C-terminal domain and (b) singleP212121 crystal of gp1 C-
terminal domain. Orientation in (a) is the same as in Figs.3.9a, 3.9c, and3.9d. This figure was generated
usingMOLREP.
122
3.3.2 Structure solution
Several data sets were collected for the twinned crystal form, including KBr derivative data sets.
The crystals were diffracting to 2.6A at best. All of the crystals were twins and attempts to
solve the structure with experimental phasing failed.
The Se-Met mutant of the gp2 C-terminal domain was thereafter obtained and crystallised.
These crystals belonged to space groupP3221 with a = 69.9 A, c = 72.7 A, had one molecule
in the asymmetric unit and diffracted to 1.9A. These crystals were not twinned. X-ray diffrac-
tion data were collected at ESRF at three wavelengths, 0.94213 A (remote), 0.97873A (peak),
0.97891A (inflection). An initial set of phases was obtained usingSHELXDandSHELXEand
a partial model was built usingSOLVE. The complete model was built manually usingCootand
refined usingREFMACand the data from the remote wavelength.
The twinned crystal form was solved by MR. Eight of ten molecules constituting the asym-
metric unit were found using the default mode ofMOLREP. The remaining two molecules were
placed usingLSQKABby interpolating NCS symmetry. The MR was repeated inP1 to validate
the assumption ofP21 symmetry. The model was refined usingREFMAC, the first chain was
corrected manually usingCoot and changes were propagated to NCS-related molecules. The
next round of refinement,REFMACwith TLS parameters gaveR = 31.5%,Rfree = 33.9% and
further twinned refinement with CNS resulted inR = 21.6%,Rfree = 23.3%.
3.3.3 NCS and orthorhombic cell
The organisation of the crystal is shown in (Fig.3.9). The expectation of an oligomer with
point group symmetry 5 was not fulfilled. On the contrary, themolecules form filaments with
53 screw symmetry, in which neighbouring molecules are approximately related by a rotation
of 144o about the axis of the filament and by translation along it. Themolecules are polar and
neighbouring molecules make contacts by oppositely charged faces.
Parallel filaments form layers with much weaker contacts. The layers are stacked across each
other in theb-direction to generate NCS fourfold symmetry and crystallographic symmetryP21
with four layers spanning the length ofb (Fig. 3.9a and3.9b). That is, the neighbouring layers
shown in Figs.3.9(c) and3.9(d) are approximately related by a NCS screw fourfold rotationand
every first and third layers are related by the crystallographic two-fold screw rotation.
The most significant conformational differences between the two crystal forms occur in the
interfaces forming filaments. The (electrostatic) intermolecular interactions within the filaments
appear to be the strongest in the crystals, and a filament appears to be the most stable sub-
structure. Thus, external interactions have little effecton the internal structure of filaments. In
particular, this means that base vectors of crystallographic translations along filaments,e1 ande2
123
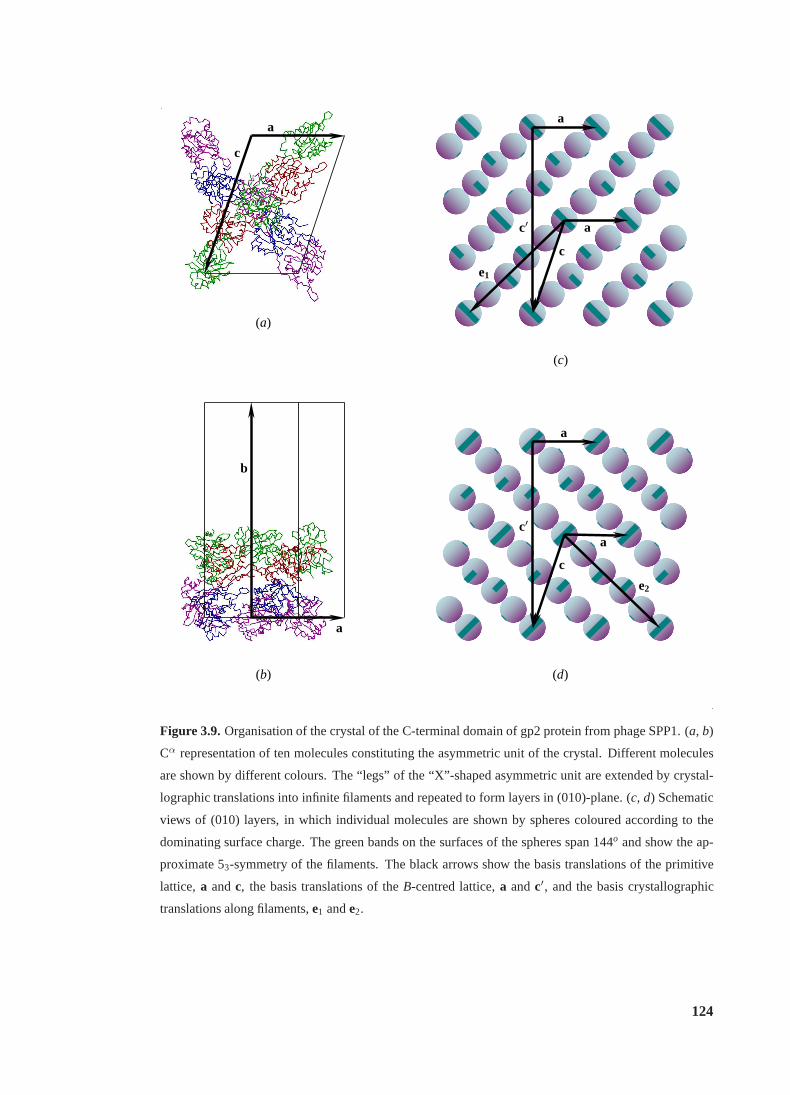
a
a
a
a
a
a
b
c
c
c
c′
c′
e1
e2
(a)
(b)
(c)
(d)
Figure 3.9.Organisation of the crystal of the C-terminal domain of gp2 protein from phage SPP1. (a, b)
Cα representation of ten molecules constituting the asymmetric unit of the crystal. Different molecules
are shown by different colours. The “legs” of the “X”-shapedasymmetric unit are extended by crystal-
lographic translations into infinite filaments and repeatedto form layers in (010)-plane. (c, d) Schematic
views of (010) layers, in which individual molecules are shown by spheres coloured according to the
dominating surface charge. The green bands on the surfaces of the spheres span 144o and show the ap-
proximate 53-symmetry of the filaments. The black arrows show the basis translations of the primitive
lattice, a andc, the basis translations of theB-centred lattice,a andc′, and the basis crystallographic
translations along filaments,e1 ande2.
124
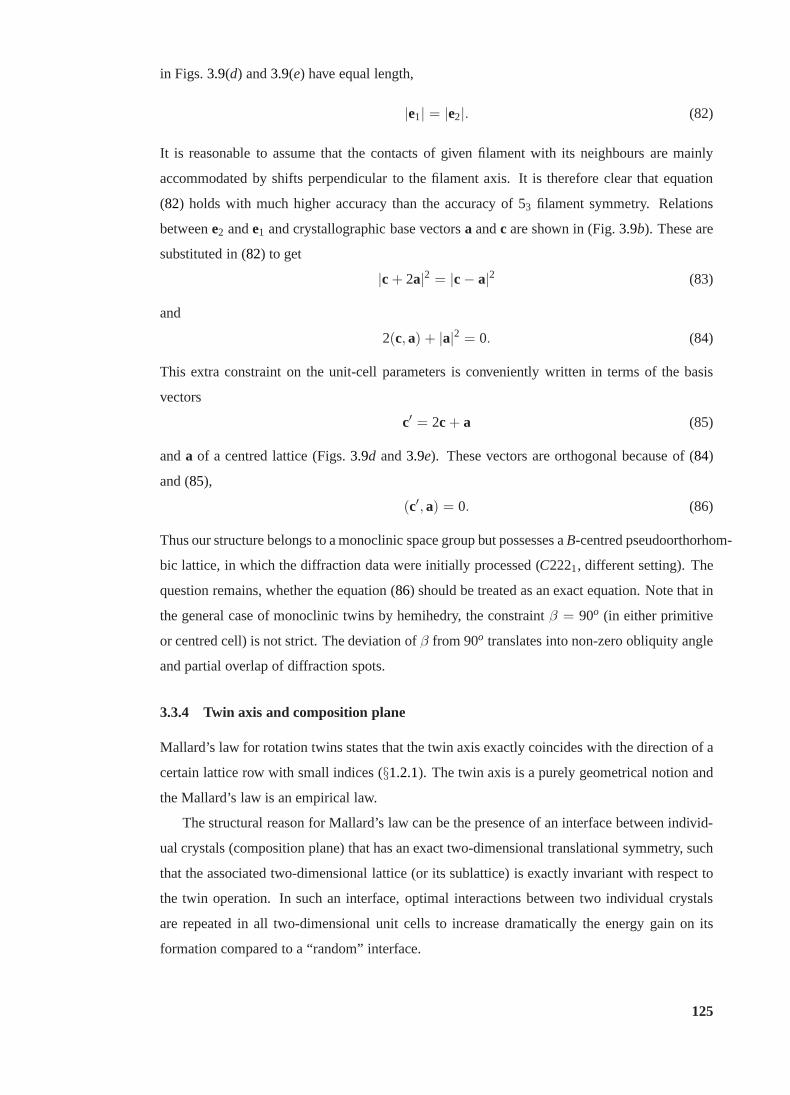
in Figs.3.9(d) and3.9(e) have equal length,
|e1| = |e2|. (82)
It is reasonable to assume that the contacts of given filamentwith its neighbours are mainly
accommodated by shifts perpendicular to the filament axis. It is therefore clear that equation
(82) holds with much higher accuracy than the accuracy of 53 filament symmetry. Relations
betweene2 ande1 and crystallographic base vectorsa andc are shown in (Fig.3.9b). These are
substituted in (82) to get
|c + 2a|2 = |c− a|2 (83)
and
2(c,a) + |a|2 = 0. (84)
This extra constraint on the unit-cell parameters is conveniently written in terms of the basis
vectors
c′ = 2c + a (85)
anda of a centred lattice (Figs.3.9d and3.9e). These vectors are orthogonal because of (84)
and (85),
(c′,a) = 0. (86)
Thus our structure belongs to a monoclinic space group but possesses aB-centred pseudoorthorhom-
bic lattice, in which the diffraction data were initially processed (C2221, different setting). The
question remains, whether the equation (86) should be treated as an exact equation. Note that in
the general case of monoclinic twins by hemihedry, the constraint β = 90o (in either primitive
or centred cell) is not strict. The deviation ofβ from 90o translates into non-zero obliquity angle
and partial overlap of diffraction spots.
3.3.4 Twin axis and composition plane
Mallard’s law for rotation twins states that the twin axis exactly coincides with the direction of a
certain lattice row with small indices (§1.2.1). The twin axis is a purely geometrical notion and
the Mallard’s law is an empirical law.
The structural reason for Mallard’s law can be the presence of an interface between individ-
ual crystals (composition plane) that has an exact two-dimensional translational symmetry, such
that the associated two-dimensional lattice (or its sublattice) is exactly invariant with respect to
the twin operation. In such an interface, optimal interactions between two individual crystals
are repeated in all two-dimensional unit cells to increase dramatically the energy gain on its
formation compared to a “random” interface.
125
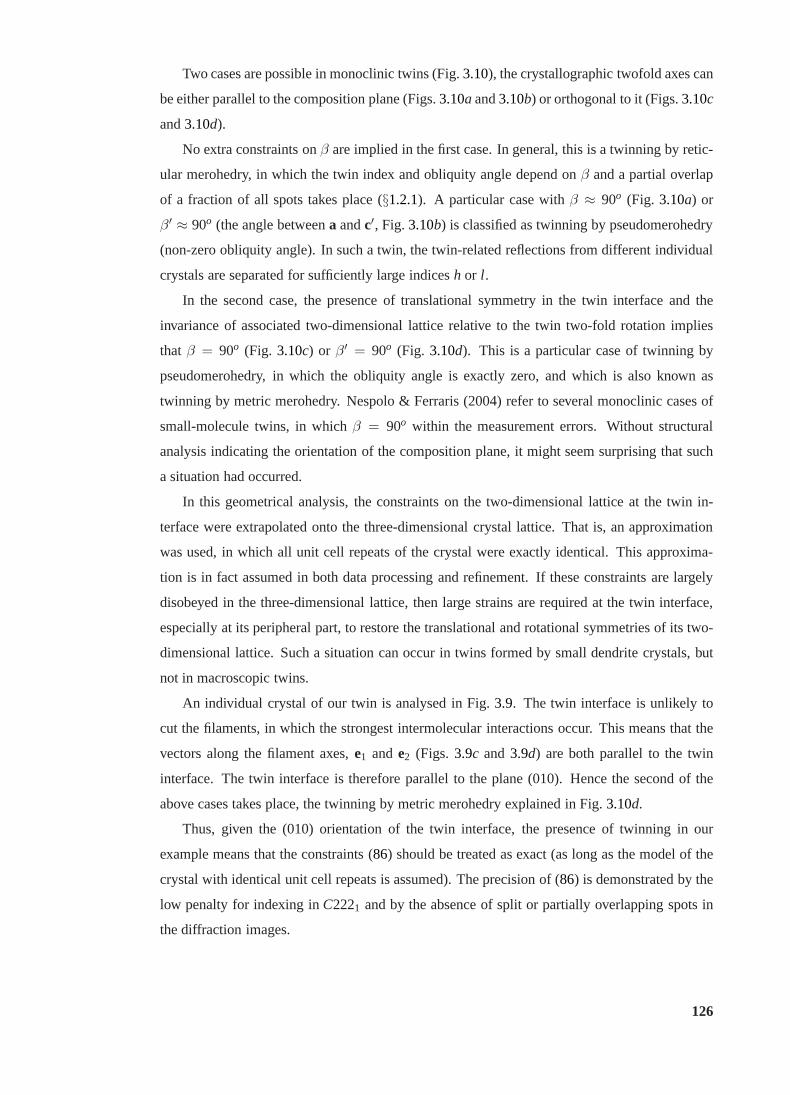
Two cases are possible in monoclinic twins (Fig.3.10), the crystallographic twofold axes can
be either parallel to the composition plane (Figs.3.10a and3.10b) or orthogonal to it (Figs.3.10c
and3.10d).
No extra constraints onβ are implied in the first case. In general, this is a twinning byretic-
ular merohedry, in which the twin index and obliquity angle depend onβ and a partial overlap
of a fraction of all spots takes place (§1.2.1). A particular case withβ ≈ 90o (Fig. 3.10a) or
β′ ≈ 90o (the angle betweena andc′, Fig.3.10b) is classified as twinning by pseudomerohedry
(non-zero obliquity angle). In such a twin, the twin-related reflections from different individual
crystals are separated for sufficiently large indicesh or l .
In the second case, the presence of translational symmetry in the twin interface and the
invariance of associated two-dimensional lattice relative to the twin two-fold rotation implies
that β = 90o (Fig. 3.10c) or β′ = 90o (Fig. 3.10d). This is a particular case of twinning by
pseudomerohedry, in which the obliquity angle is exactly zero, and which is also known as
twinning by metric merohedry. Nespolo & Ferraris (2004) refer to several monoclinic cases of
small-molecule twins, in whichβ = 90o within the measurement errors. Without structural
analysis indicating the orientation of the composition plane, it might seem surprising that such
a situation had occurred.
In this geometrical analysis, the constraints on the two-dimensional lattice at the twin in-
terface were extrapolated onto the three-dimensional crystal lattice. That is, an approximation
was used, in which all unit cell repeats of the crystal were exactly identical. This approxima-
tion is in fact assumed in both data processing and refinement. If these constraints are largely
disobeyed in the three-dimensional lattice, then large strains are required at the twin interface,
especially at its peripheral part, to restore the translational and rotational symmetries of its two-
dimensional lattice. Such a situation can occur in twins formed by small dendrite crystals, but
not in macroscopic twins.
An individual crystal of our twin is analysed in Fig.3.9. The twin interface is unlikely to
cut the filaments, in which the strongest intermolecular interactions occur. This means that the
vectors along the filament axes,e1 ande2 (Figs. 3.9c and 3.9d) are both parallel to the twin
interface. The twin interface is therefore parallel to the plane (010). Hence the second of the
above cases takes place, the twinning by metric merohedry explained in Fig.3.10d.
Thus, given the (010) orientation of the twin interface, thepresence of twinning in our
example means that the constraints (86) should be treated as exact (as long as the model of the
crystal with identical unit cell repeats is assumed). The precision of (86) is demonstrated by the
low penalty for indexing inC2221 and by the absence of split or partially overlapping spots in
the diffraction images.
126
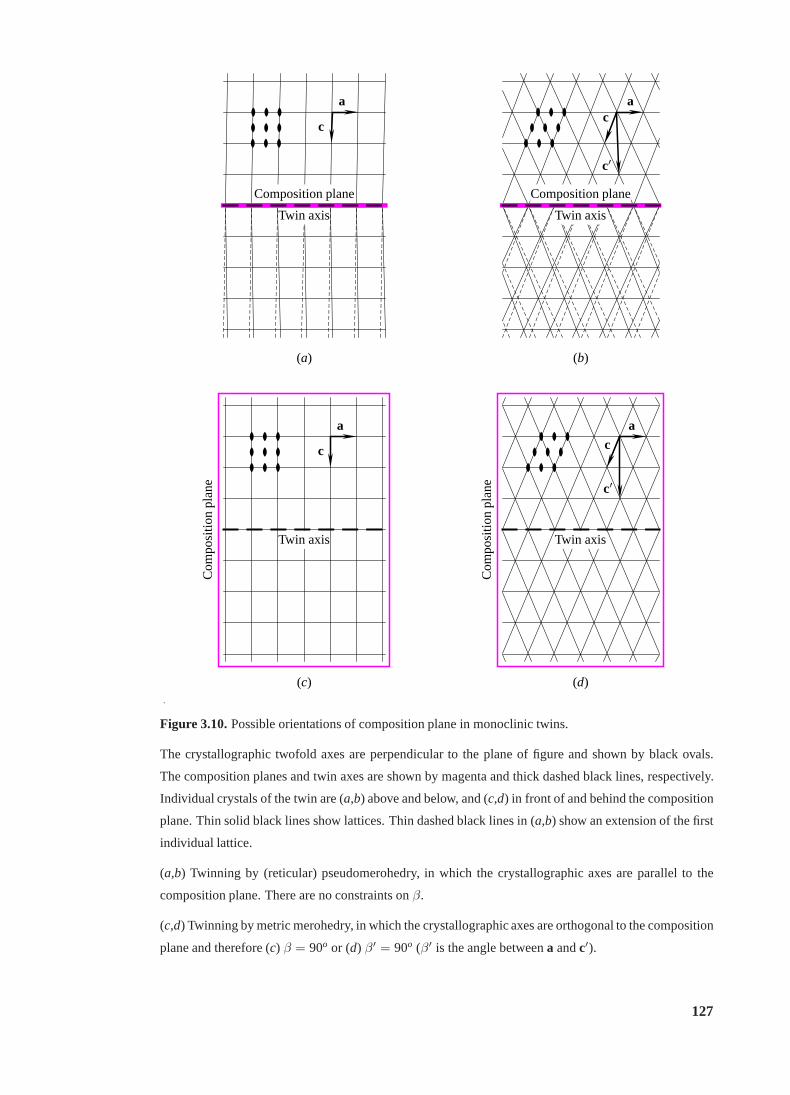
a
c
Compositionplane
Twin axis
(a)
ac
c′
Compositionplane
Twin axis
(b)
a
c
Com
posi
tionp
lane
Twin axis
(c)
ac
c′C
ompo
sitio
npla
ne
Twin axis
(d).
Figure 3.10.Possible orientations of composition plane in monoclinic twins.
The crystallographic twofold axes are perpendicular to theplane of figure and shown by black ovals.
The composition planes and twin axes are shown by magenta andthick dashed black lines, respectively.
Individual crystals of the twin are (a,b) above and below, and (c,d) in front of and behind the composition
plane. Thin solid black lines show lattices. Thin dashed black lines in (a,b) show an extension of the first
individual lattice.
(a,b) Twinning by (reticular) pseudomerohedry, in which the crystallographic axes are parallel to the
composition plane. There are no constraints onβ.
(c,d) Twinning by metric merohedry, in which the crystallographic axes are orthogonal to the composition
plane and therefore (c) β = 90o or (d) β′ = 90o (β′ is the angle betweena andc′).
127
3.3.5 Concluding remarks
Macromolecular structures allow convenient visual analysis of the intermolecular interactions
involved in formation of twinned crystals. In particular, the twinned crystal of C-terminal do-
main of gp2 protein from phage SPP1 is composed of one-dimensional arrays of molecules, in
which the strongest intermolecular interactions occur andwhich span the whole crystal. The
presence of such filaments explains both (i) the presence of molecular layers, which make rel-
atively weak contacts with each other and which can therefore form boundaries of individual
crystals and (ii) the constraint (86) that makes the translational symmetry of two individual
crystals consistent at such boundary. The next section represents the more common case, in
which the symmetry of a two-dimensional array of molecules is the reason for the “accidental”
symmetry of the lattice.
128
3.4 Example of OD-twin by metric merohedry
Ferrochelatase-1 (HemH) fromBacillus anthraciswas one of the targets of SPINE (Auet al.,
2006). A diffracting crystal was obtained and the crystal structure was solved by Dr. Elena
Blagova, Dr. Olga Moroz, Dr. Vladimir Levdikov and Dr. Axel Muller (PDB code 2c8j). I took
part in the structure refinement. The crystal was twinned butthe time constraints imposed by
the genomics project did not allow a scan for another crystalform.
The crystal of HemH was an OD-twin belonging to an OD-family of type I/B (§1.3). This
example is presented to demonstrate a typical morphology and the effect of NCS on the intensity
statistics for this type of twin.
The internal symmetry of the OD-layers is shown to impose additional constraints on the lat-
tice parameters. In terms of geometrical classification, the twin under consideration is therefore
a twin by metric merohedry (i.e. by pseudomerohedry with zero obliquity angle,§1.2.1).
The NCS and twin axes are necessarily aligned and structure factors related by the twin
operation correlate in this type of twins. The theoretical model of an ideal OD-twin is analysed,
in which the symmetry of the OD-layers is exact and correlation between structure factors is
modulated. The experimental distributions ofZ andH and these distributions for simulated data
sets are compared with the theoretical distributions for a constant correlation model (§3.1) and
for a modulated correlation model.
3.4.1 Structure solution
Ferrochelatase-1 (HemH) fromBacillus anthraciswas crystallised using Mosquito robot and
mother liquor containing 0.2M MgCl2, 0.1M Tris-Cl pH 8.5, 30% PEG 30K to yield diffracting
crystals with unit-cell parametersa = 49.9, b = 109.9, c = 59.4 A andα = β = γ = 90o.
The diffraction data were collected at SRS Daresbury PX9.6 beamline to 2.1A resolution and
initially processed in the point group 222 usingMOSFLM (Leslie, 1992; Leslie, 2006) and
SCALA(Evans, 1997; Evans, 2006).
The MR was carried out using Ferrochelatase fromBacillus subtilisas a search model (PDB
code 1ak1), a homologue with a sequence identity of 73%. The MR trials and preliminary
refinements were later repeated in a consistent manner to generate Table3.3 showing the three
best solutions in both orthorhombic and monoclinic systems. In this Table the space group
settings are such that the unit cell parameters are the same in all six presented space groups but
the directions of the (unique) crystallographic axes vary.
Initially, eight “biological” orthorhombic space groups were tested. The best CC was ob-
tained in space groupP21212 and the second best inP212121. In addition, unlike the other six
orthorhombic groups tested, these two showed substantial contrast in terms of the CC between
129
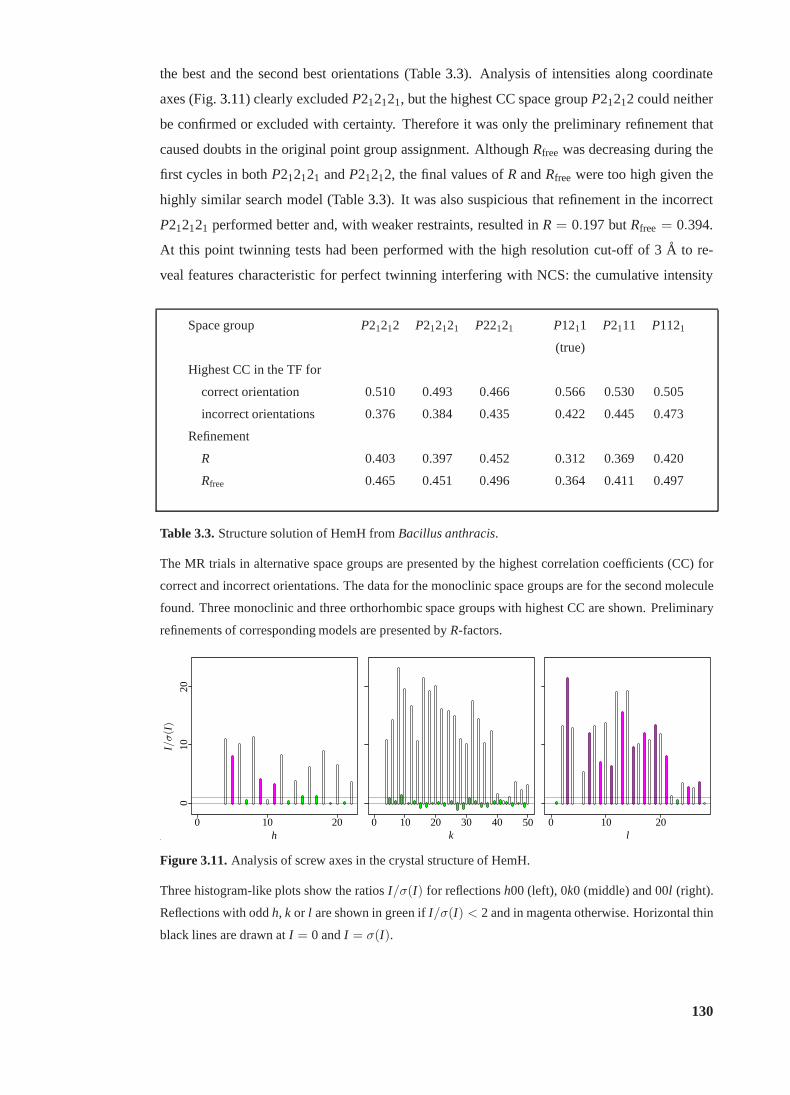
the best and the second best orientations (Table3.3). Analysis of intensities along coordinate
axes (Fig.3.11) clearly excludedP212121, but the highest CC space groupP21212 could neither
be confirmed or excluded with certainty. Therefore it was only the preliminary refinement that
caused doubts in the original point group assignment. AlthoughRfree was decreasing during the
first cycles in bothP212121 andP21212, the final values ofR andRfree were too high given the
highly similar search model (Table3.3). It was also suspicious that refinement in the incorrect
P212121 performed better and, with weaker restraints, resulted inR = 0.197 butRfree = 0.394.
At this point twinning tests had been performed with the highresolution cut-off of 3A to re-
veal features characteristic for perfect twinning interfering with NCS: the cumulative intensity
Space group P21212 P212121 P22121 P1211 P2111 P1121
(true)
Highest CC in the TF for
correct orientation 0.510 0.493 0.466 0.566 0.530 0.505
incorrect orientations 0.376 0.384 0.435 0.422 0.445 0.473
Refinement
R 0.403 0.397 0.452 0.312 0.369 0.420
Rfree 0.465 0.451 0.496 0.364 0.411 0.497
Table 3.3.Structure solution of HemH fromBacillus anthracis.
The MR trials in alternative space groups are presented by the highest correlation coefficients (CC) for
correct and incorrect orientations. The data for the monoclinic space groups are for the second molecule
found. Three monoclinic and three orthorhombic space groups with highest CC are shown. Preliminary
refinements of corresponding models are presented byR-factors.
00
0
0 1010
10
10 2020
20
20 30 40 50
I/σ(I
)
h k l
Figure 3.11.Analysis of screw axes in the crystal structure of HemH.
Three histogram-like plots show the ratiosI/σ(I) for reflectionsh00 (left), 0k0 (middle) and 00l (right).
Reflections with oddh, k or l are shown in green ifI/σ(I) < 2 and in magenta otherwise. Horizontal thin
black lines are drawn atI = 0 andI = σ(I).
130
distribution curve was lower than the reference curve for untwinned data, but higher than the
reference for the perfect twin without an additional effectof NCS (Fig.3.14d, p.139).
Therefore the data were reprocessed usingMOSFLM and SCALAin three possible mon-
oclinic point groups (with two-fold axes along different coordinated axes) and the MR trials
were performed in six possible space groups of typesP2 or P21. The results of the MR and
preliminary refinements for three best space groups are shown in Table3.3. In contrast to the
MR attempts in the orthorhombic space groups, the monoclinic MR model with the highest CC
refined to reasonableR-factors substantially lower than those for other monoclinic space groups.
This model was rebuilt, refined toR = 0.234 andRfree = 0.281 and deposited (PDB code 2c8j).
Because of the initially unnoticed twinning the completeness of the data in the trueP1211 space
group was only 82% (Fig.3.13b, p.138). The assignment ofP1211 was further supported by
the systematic absences fork = 2n + 1 (Fig.3.11) and by the partial twinning test (Fig.3.15b,
p.141) showing a twinning fraction of only 0.2, whereas it would have been 0.5 if the assignment
were wrong.
The final round of refinement included TLS parameters and was completed usingREFMAC
which had no twinned refinement implemented at the time of structure solution but anyway
produced lowerR-factors and better electron density than twinned refinement with SHELXL.
This was apparently because the twinning fraction was only 0.2 but the molecules in the crystal
had significant TLS mobility that needed to be accounted for.
An exactly orthorhombic cell was one reason of the late detection of twinning and initially
erroneous space group assignment. Another reason was that interfering NCS reduced the con-
trast of the perfect twinning test, and the use of all data including very noisy 2.5 to 2.1 resolution
range caused further decrease of contrast and made the test misleading. Therefore this example
underlines the importance of at least an awareness of the above phenomena while a better solu-
tion would be a twinning test taking into account both experimental errors and interfering NCS.
Further confusion with the symmetry assignment was at the stage of the MR and was caused
by pseudo-absences ath = 2n + 1 which were likely to be due to theP21(1)1 symmetry of the
OD-layers (Figs.3.12a and3.12c). In the rest of this section the symmetry of the OD-structure
of HemH is discussed in relation to the lattice symmetry and twinning tests.
3.4.2 Twin morphology
An individual crystal of the HemH twin belongs to the space group P1211 with a = 49.9,
b = 109.9, c = 59.4 A andβ = 90o. It is composed of two-dimensional layers in the plane
(010). Fig.3.12(a) presents a top view of a single layer and Fig.3.12(b) is a side view of
three adjacent layers. The asymmetric unit contains two molecules related by a NCS two-fold
screw rotation. If the two independent molecules are assigned to the same layer, the NCS axis
131
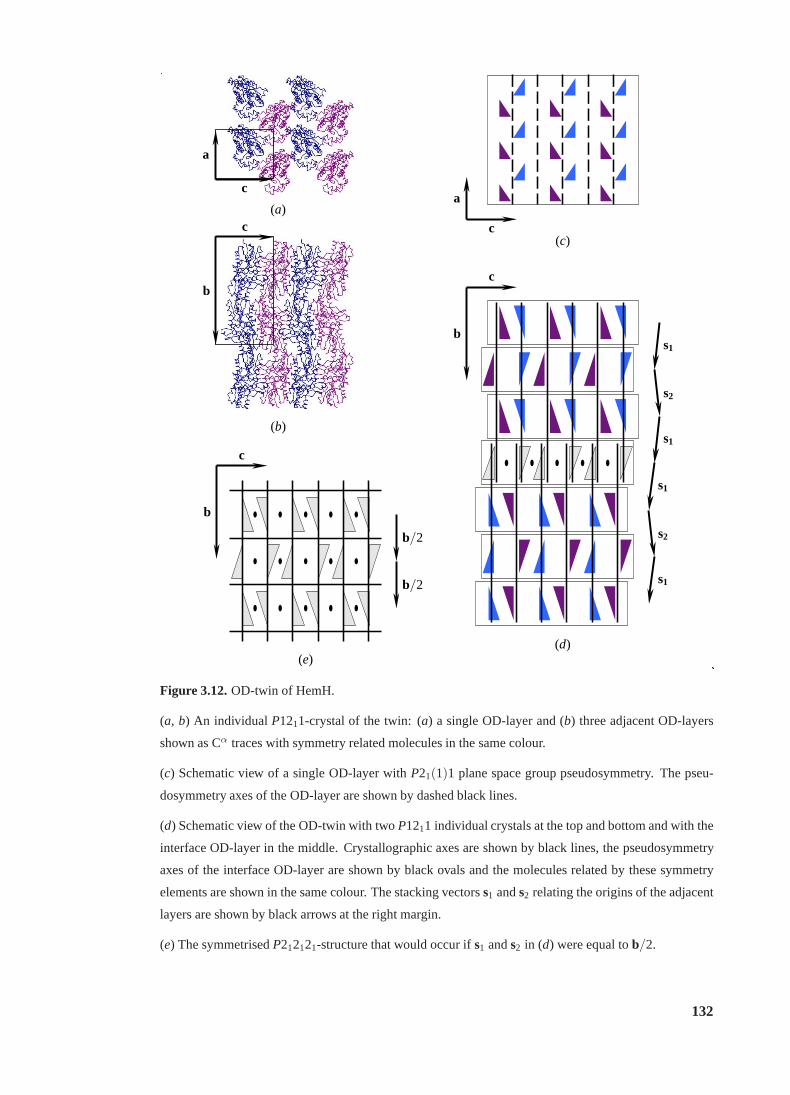
a
a
b
b
b
c
c
c
c
c
s1
s1
s1
s1
s2
s2
b/2
b/2
(a)
(b)
(c)
(d)(e)
Figure 3.12.OD-twin of HemH.
(a, b) An individual P1211-crystal of the twin: (a) a single OD-layer and (b) three adjacent OD-layers
shown as Cα traces with symmetry related molecules in the same colour.
(c) Schematic view of a single OD-layer withP21(1)1 plane space group pseudosymmetry. The pseu-
dosymmetry axes of the OD-layer are shown by dashed black lines.
(d) Schematic view of the OD-twin with twoP1211 individual crystals at the top and bottom and with the
interface OD-layer in the middle. Crystallographic axes are shown by black lines, the pseudosymmetry
axes of the interface OD-layer are shown by black ovals and the molecules related by these symmetry
elements are shown in the same colour. The stacking vectorss1 ands2 relating the origins of the adjacent
layers are shown by black arrows at the right margin.
(e) The symmetrisedP212121-structure that would occur ifs1 ands2 in (d) were equal tob/2.
132
relating them is an element of the approximateP21(1)1 plane space group symmetry of the layer
(§1.3.2). The adjacent layers are related by the crystallographic two-fold screw rotation.
Accordingly, the crystal belongs to an OD family of type I/B (Fig. 1.5h) with the groupoid
symmetryP21212 : P21(1)1 (No 11 in Table1.1). In contrast to the types I/A or II/A, the
monoclinic member of this family with maximum degree of order does not have translational
NCS, but instead is prone to twinning by pseudomerohedry (bymetric merohedry, as will be
shown below). Figs.3.12(c) and 3.12(d) are schematic representations of a single OD-layer
and of the OD-twin belonging to the OD-family under consideration. It is characteristic for
OD-twins in general that the interface OD-layer can be attributed to any of the two connected
individual crystals. The internal symmetry operations of this interface layer not only relate its
own molecules, but also molecules from adjacent individualcrystals (Fig.3.12d). Thus the NCS
and twin axes are necessarily aligned in such a twin.
There are two (imaginary) fully ordered structures composed of the same OD-layers as the
OD-twin under consideration. These belong to the space groups P21212 andP212121. The
second one (Fig.3.12e) is closer to the actual structure and is used as a reference.The origins
of individual layers in the reference structure are set to berelated byb/2. Accordingly, the
stacking vectorss1 ands2 relating the origins of the adjacent layers in the actual OD-structure
(Fig. 3.12d) are parameterised as follows,
s1 = b/2 + ε c
s2 = b/2− ε c. (87)
In this approximation, the components of the vectors1 alongb andc in the basis(a, b, c) are
1/2 andε, respectively, and the small component alonga is neglected. The regular sequences
(. . . s1 s2 s1 s2 . . .) occur inside the individual crystals, whereas the sequence (. . . s2 s1 s1 s2 . . .)
occurs at the interface, as shown in Fig.3.12(d).
The symmetryP21(1)1 of the layer is not exact. The coefficientε in (87) and the asymmetry
of the OD-layer were estimated as follows. The asymmetric unit of the refined HemH structure
was transformed by the two-fold screw rotation about an axis, which was parallel toa and
displaced from the origin byc/4. A rotated copy of the whole OD-layer would relate to its
fixed copy by translation. To find this translation, the asymmetric unit was further transformed,
molecules A and B were renamed to B and A, respectively, and B was translated by−a. The
transformed copy was then shifted to the position of the bestmatch with the fixed copy. The
projection of this shift onc was 5.14A, so
ε =εcc
≈ 5.14 A
59.4 A≈ 0.086. (88)
The r.m.s.d. over Cα atoms between fixed copy and shifted copy in its final positionwas 0.24
A. This value characterises the asymmetry of the OD-layer.
133
3.4.3 Lattice constraints
The symmetry of an OD-layer can be significantly perturbed and, in general, for an OD-layer
with approximate symmetryP21(1)1, the angle betweena andc is not necessarily exactly equal
to 90o.
However, as in the previous example (§3.3), the very ability of the crystal to form an OD-
twin requires thata is orthogonal toc to the same accuracy to which the individual crystal
has translational symmetry. Rotation about a symmetry axisof the interface OD-layer shows
that the basis vectorsa andc in the layer below the interface correspond to the basis vectors a
and−c in the layer above the interface. The translation bases in the two layers have to be in
exact agreement to form the twin interface, so the angles betweena, c anda, −c are equal and
thus 90o.
Hence, the lattice of the individual monoclinic crystal in question possesses specialised or-
thorhombic symmetry, the twinned crystal has zero obliquity angle and can be classified as a
twin by metric merohedry (§1.2.1). From the geometric point of view, the situation is exactly
the same as in the previous example,i.e. the twin axis is parallel to the composition plane
(Fig. 3.10c).
3.4.4 Idealised model of the OD-twin of HemH
In the idealised model of the OD-twin, the OD-layers have exact plane space group symmetry.
The cumulative distribution of normalised intensitiesP(Z) for a perfect twin and the cumulative
distribution of relative differences between twin-related reflectionsP(H) are derived below and
compared with the corresponding distributions for a twin with constant correlation of structure
factors, as discussed in§3.1.
The idealised model is built starting from the symmetrised structure in Fig.3.12(e). Let
structure factorsp1 and p2 represent two parts of this structure containing odd- and even-
numbered layers, respectively, so all the layers in a given partial structure have the same ori-
entation. The vector notations are used similarly to (17),
p = (p1 p2)T . (89)
Let ox, oy and oz be symmetry operations of the space groupP212121 of the symmetrised
structure. Bothp1 and p2 are symmetric relative to ˆox, whereas ˆoy and oz transform them one
into another,
oxp = p
oyp = ozp =
0 1
1 0
p. (90)
134
The individual crystals of the OD-twinf1 and f2 are assembled as follows. The substructures
p1 and p2 are shifted by+εc/2 and−εc/2, respectively, and merged intof1. In the individual
crystal f2 the shifts are applied with opposite signs.
Let ω be the phase angle corresponding to the shiftεc,
ω = 2πεl (91)
andt be the phase multiplier corresponding to the two times smaller shift,
t = eiω/2. (92)
Then, in vector notations (17) and (89), the relation betweenf andp is as follows,
f =
t t∗
t∗ t
p. (93)
Examination of the symmetry of the vectorf validates the above procedure. The shifts that
had been applied to the substructures were alongc. Therefore, the rotation ˆoz does not change
the shift, oz t = t oz, whereas the rotations ˆox and oy change its direction, ˆox t = t∗ ox and
oy t = t∗ oy. Thus, because of (90), the actions of these rotations on (93) are written as
oxf = ozf =
0 1
1 0
f
oyf = f
. (94)
As it should be, ˆoy is now a crystallographic symmetry operation, while ˆox and oz relate in-
dividual crystals and are therefore twin operations. (It iscorrect to call these operations twin
operations, as their translational components become inactive when they are applied to intensi-
ties.)
The individual crystals represented byf are shifted by±εc/2 compared to Fig.3.12(d).
These overall shifts simplify the equations and, of course,are cancelled out as soon as structure
factors are converted into intensities.
3.4.5 Covariance model
The biomolecules forming the crystal under consideration have no internal symmetry and there-
fore the structuresp1 andp2 do not contain fragments related by non-crystallographic translation
and do not correlate,
Epp∗T =
12 0
0 12
. (95)
135
Here, the partial structures are normalised by one half to make the complete structure normalised
by one.
Because of (93) and (95),
E ff∗T =
1 cosω
cosω 1
. (96)
Equation (25) is restored by letting
ρ = cosω. (97)
With this notation, all the results of§3.1are applicable but only for the section of the data with
a fixed indexl , on whichω linearly depends. However, the goal is to derive distributions for the
whole data set, not for eachl -section individually.
The parameterρ enters the probability distributionsP(Z) andP(H) (§3.1) asρ2 = cos2ω.
The period of this function is∆ω = π. The period of this function in terms ofl follows from
(88) and (91),
∆l =∆ω2πε
=12ε
≈ 5.8. (98)
In particular,l ≈ 11.6n and l ≈ 5.8 + 11.6n for integern correspond to complete correlation
and anti-correlation of structure factors of the two individual crystals, respectively (ρ = ±1),
and the intensities of reflections with thesel are symmetric relative to the twin operation and
do not contribute to the “twin-like” behaviour of intensitystatistics. In contrast, the structure
factors forl ≈ 2.9 + 5.8n do not correlate (ρ = 0), so the intensity statistics of this fraction of
the reflections is purely “twin-like”. The overall intensity statistics are therefore a mixture of
different distributions.
In the 2.1A data set from the HemH twinned crystal, the range ofl is 0 to 28 (0 to 19 for 3A
resolution cut-off). This includes 4.8 (3.3) periods (98) of the correlation squaredρ2 = cos2ω.
The distributions for such a case of modulated correlation can be derived from the corresponding
distributions for the case of constant correlation by averaging over a period ofl . Equivalently,
the averaging can be overω, which linearly depends onl . The range for averaging overω can
be from 0 toπ/2, the half-period of the function cos2ω, as the latter is symmetric. The moment
generating function (MGF) is a linear transformation of theprobability distribution function and
therefore the former can be averaged instead of the latter.
Formally, the averaging overω means thatω is considered as a uniformly distributed random
variable, a nuisance variable to be integrated out.
Two theoretical models, one with constantρ as in§3.1, and one, in whichρ is the cosine of
a continuous random variable as in (97), are further referred to as the constant correlation model
(CCM) and modulated correlation model (MCM), respectively.
136
3.4.6 Second moment of normalised intensities
The MGF of the random variableZ in the case of MCM is the average of the MGF (45) overω.
Substitutions (46) and (97) give
LZ(t) =2π
∫ π
2
0
dω
1− t + 14(1− β2)t2 sin2ω
. (99)
The integration is performed using substitution
cotω =
√
1 +1− β2
4t2
1− tcotω′ (100)
to give
LZ(t) =1
√1− t
√
1− t + 14(1− β2)t2
. (101)
The second derivative of this function is the second moment of Z for the MCM,
E(Z2) =7 + β2
4. (102)
This equation can also be obtained by substitution of mean value, E(ρ2) = 0.5 for ρ2 in the
expression forE(Z2|ρ), as the latter is a linear function ofρ2, equations (46) and (51).
In other words, the second moments ofZ in the MCM and in the CCM withρ2 = 0.5
coincide. Accordingly, the experimental and simulated distributions were compared with both
references, see below.
In particular, the second moment ofZ for a perfect twin in both models equals 7/4. This
is an intermediate value between the standard references for untwinned and perfectly twinned
data, 2 and 3/2, respectively.
The resolution range suitable for twinning tests was chosento be 9.0 to 3.0A using the plots
in Fig. 3.13and following the protocol described in§1.2.3. Note that the plot in Figs.3.13(a)
is not indicative of twinning. This is because (i) the twinning fraction is only 0.2 and (ii) the
difference between the twinned and untwinned second momentof Z is twice less in the MCM-
twin compared to a twin in which the effect of NCS is absent.
Both the set of experimental intensities and the sets of intensities calculated using the refined
model of HemH (PDB code 2c8j) were averaged relative to the twin operation to generate per-
fectly twinned data sets. Corresponding plots of the secondmoment ofZ against resolution are
shown in Figs.3.14(a) and3.14(b). Both curves reasonably well match the theoretical prediction
of 7/4.
3.4.7 Cumulative distribution of normalised intensities
In the untwinned case (β = ±1), the MGF (101) equals(1− t)−1 and corresponds to the general
reference for untwinned cases (49).
137
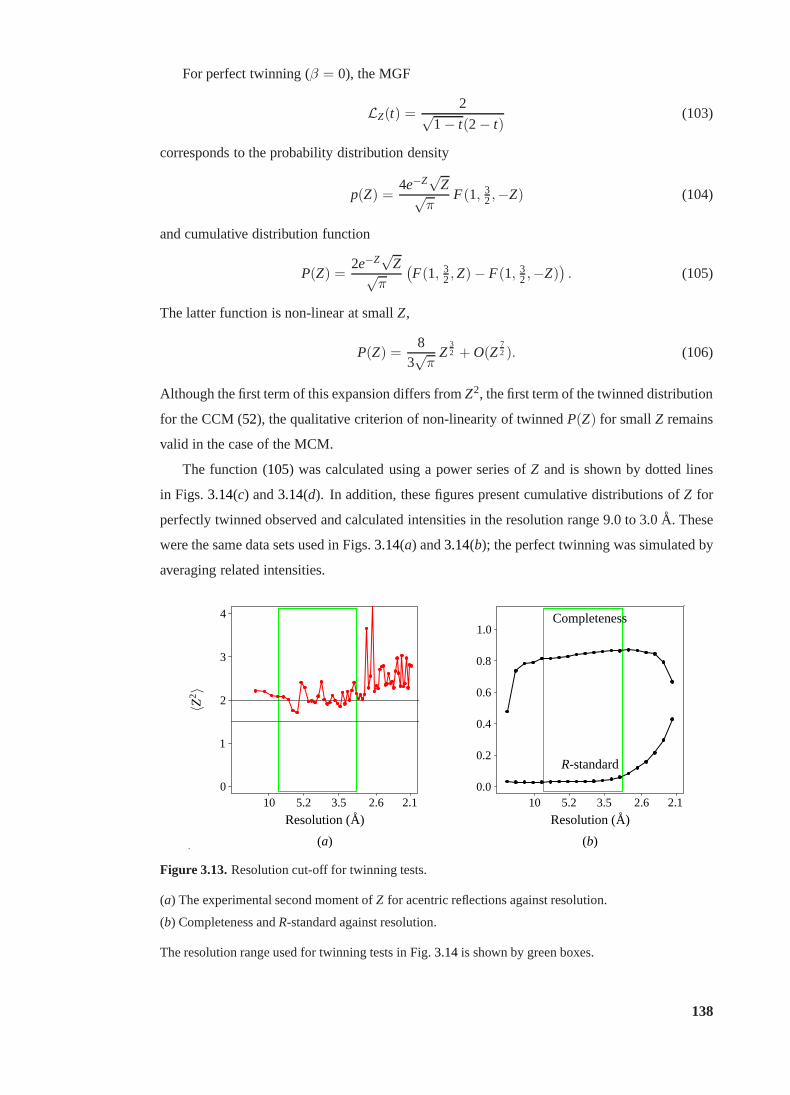
For perfect twinning (β = 0), the MGF
LZ(t) =2√
1− t(2− t)(103)
corresponds to the probability distribution density
p(Z) =4e−Z
√Z√
πF(1, 3
2,−Z) (104)
and cumulative distribution function
P(Z) =2e−Z
√Z√
π
(
F(1, 32,Z) − F(1, 3
2,−Z))
. (105)
The latter function is non-linear at smallZ,
P(Z) =8
3√π
Z32 + O(Z
72 ). (106)
Although the first term of this expansion differs fromZ2, the first term of the twinned distribution
for the CCM (52), the qualitative criterion of non-linearity of twinnedP(Z) for smallZ remains
valid in the case of the MCM.
The function (105) was calculated using a power series ofZ and is shown by dotted lines
in Figs.3.14(c) and3.14(d). In addition, these figures present cumulative distributions ofZ for
perfectly twinned observed and calculated intensities in the resolution range 9.0 to 3.0A. These
were the same data sets used in Figs.3.14(a) and3.14(b); the perfect twinning was simulated by
averaging related intensities.
0
1
2
3
4
2.12.63.55.210
Resolution(A)
〈Z2〉
0.0
0.2
0.4
0.6
0.8
1.0
2.12.63.55.210
Resolution(A)
Completeness
R-standard
(a) (b).
.
Figure 3.13.Resolution cut-off for twinning tests.
(a) The experimental second moment ofZ for acentric reflections against resolution.
(b) Completeness andR-standard against resolution.
The resolution range used for twinning tests in Fig.3.14is shown by green boxes.
138
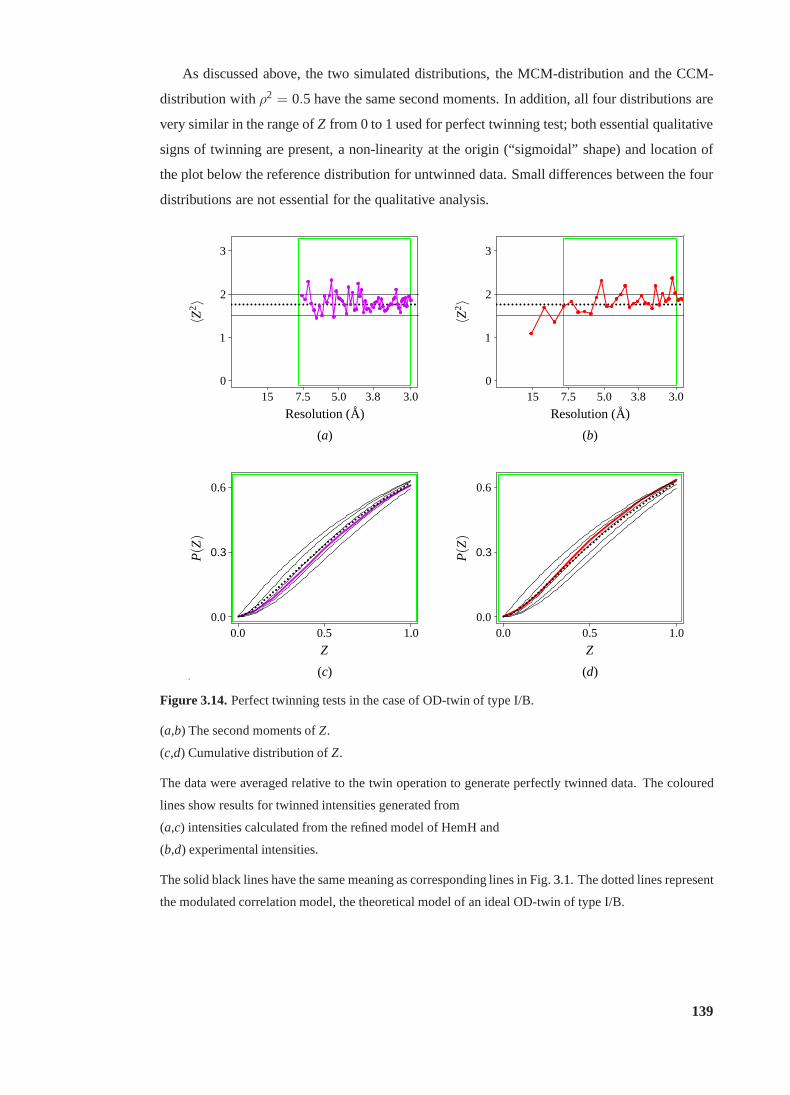
As discussed above, the two simulated distributions, the MCM-distribution and the CCM-
distribution withρ2 = 0.5 have the same second moments. In addition, all four distributions are
very similar in the range ofZ from 0 to 1 used for perfect twinning test; both essential qualitative
signs of twinning are present, a non-linearity at the origin(“sigmoidal” shape) and location of
the plot below the reference distribution for untwinned data. Small differences between the four
distributions are not essential for the qualitative analysis.
0
1
2
3
3.03.85.07.515
Resolution(A)
〈Z2〉
0
1
2
3
3.03.85.07.515
Resolution(A)
〈Z2〉
0.3
0.00.0 0.5
0.6
1.0
Z
P(Z
)
0.3
0.00.0 0.5
0.6
1.0
Z
P(Z
)
(a) (b)
(c) (d).
.
Figure 3.14.Perfect twinning tests in the case of OD-twin of type I/B.
(a,b) The second moments ofZ.
(c,d) Cumulative distribution ofZ.
The data were averaged relative to the twin operation to generate perfectly twinned data. The coloured
lines show results for twinned intensities generated from
(a,c) intensities calculated from the refined model of HemH and
(b,d) experimental intensities.
The solid black lines have the same meaning as correspondinglines in Fig.3.1. The dotted lines represent
the modulated correlation model, the theoretical model of an ideal OD-twin of type I/B.
139
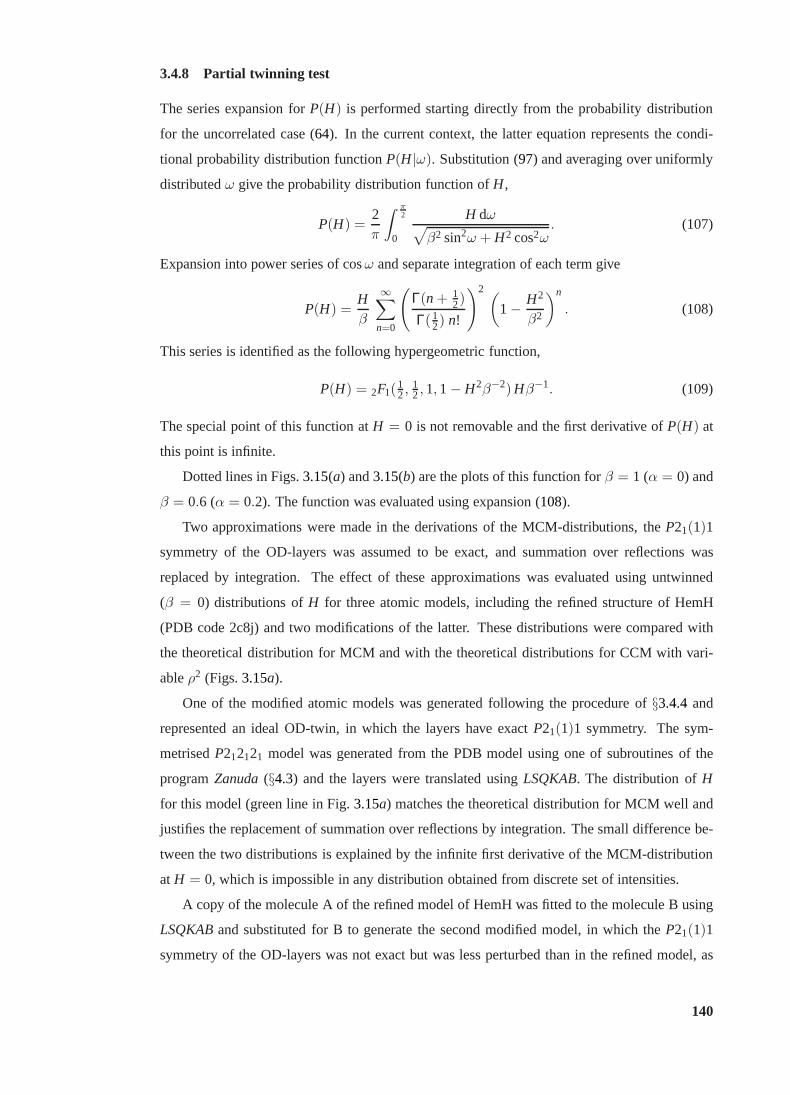
3.4.8 Partial twinning test
The series expansion forP(H) is performed starting directly from the probability distribution
for the uncorrelated case (64). In the current context, the latter equation represents the condi-
tional probability distribution functionP(H|ω). Substitution (97) and averaging over uniformly
distributedω give the probability distribution function ofH,
P(H) =2π
∫ π
2
0
H dω√
β2 sin2ω + H2 cos2ω. (107)
Expansion into power series of cosω and separate integration of each term give
P(H) =Hβ
∞∑
n=0
(
Γ(n + 12)
Γ(12) n!
)2(
1− H2
β2
)n
. (108)
This series is identified as the following hypergeometric function,
P(H) = 2F1(12,
12,1,1− H2β−2) Hβ−1. (109)
The special point of this function atH = 0 is not removable and the first derivative ofP(H) at
this point is infinite.
Dotted lines in Figs.3.15(a) and3.15(b) are the plots of this function forβ = 1 (α = 0) and
β = 0.6 (α = 0.2). The function was evaluated using expansion (108).
Two approximations were made in the derivations of the MCM-distributions, theP21(1)1
symmetry of the OD-layers was assumed to be exact, and summation over reflections was
replaced by integration. The effect of these approximations was evaluated using untwinned
(β = 0) distributions ofH for three atomic models, including the refined structure of HemH
(PDB code 2c8j) and two modifications of the latter. These distributions were compared with
the theoretical distribution for MCM and with the theoretical distributions for CCM with vari-
ableρ2 (Figs.3.15a).
One of the modified atomic models was generated following theprocedure of§3.4.4and
represented an ideal OD-twin, in which the layers have exactP21(1)1 symmetry. The sym-
metrisedP212121 model was generated from the PDB model using one of subroutines of the
programZanuda(§4.3) and the layers were translated usingLSQKAB. The distribution ofH
for this model (green line in Fig.3.15a) matches the theoretical distribution for MCM well and
justifies the replacement of summation over reflections by integration. The small difference be-
tween the two distributions is explained by the infinite firstderivative of the MCM-distribution
atH = 0, which is impossible in any distribution obtained from discrete set of intensities.
A copy of the molecule A of the refined model of HemH was fitted tothe molecule B using
LSQKABand substituted for B to generate the second modified model, in which theP21(1)1
symmetry of the OD-layers was not exact but was less perturbed than in the refined model, as
140
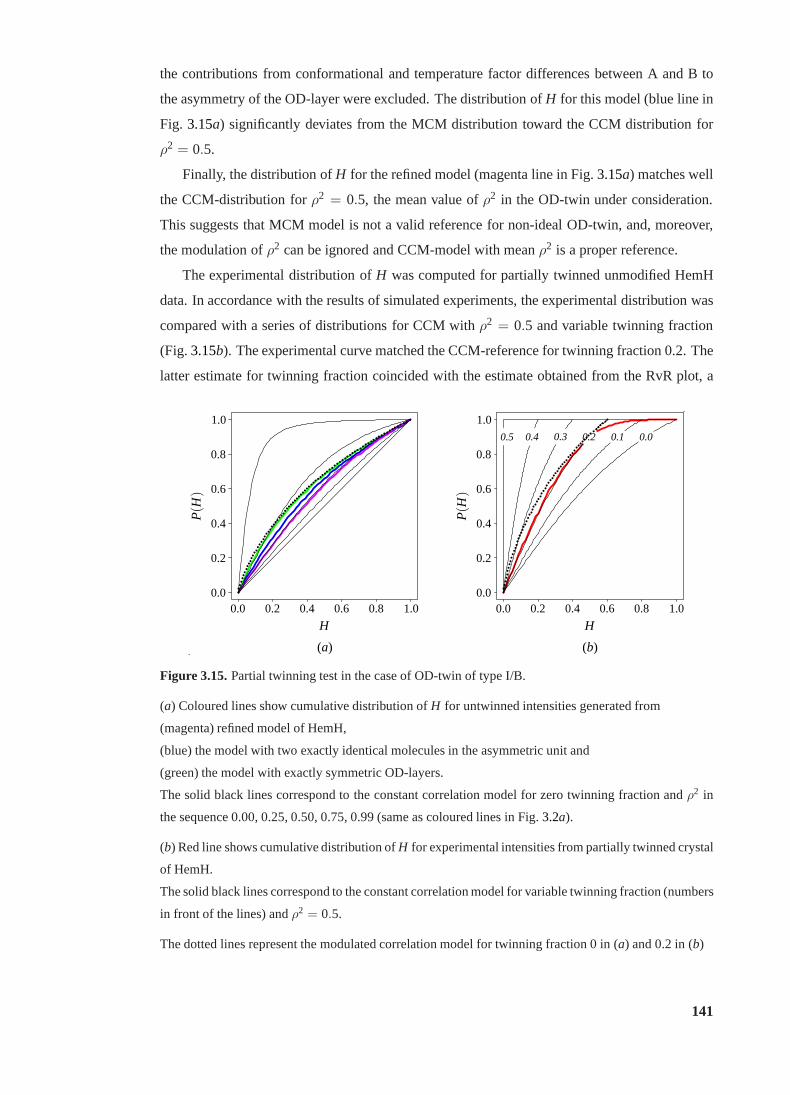
the contributions from conformational and temperature factor differences between A and B to
the asymmetry of the OD-layer were excluded. The distribution ofH for this model (blue line in
Fig. 3.15a) significantly deviates from the MCM distribution toward the CCM distribution for
ρ2 = 0.5.
Finally, the distribution ofH for the refined model (magenta line in Fig.3.15a) matches well
the CCM-distribution forρ2 = 0.5, the mean value ofρ2 in the OD-twin under consideration.
This suggests that MCM model is not a valid reference for non-ideal OD-twin, and, moreover,
the modulation ofρ2 can be ignored and CCM-model with meanρ2 is a proper reference.
The experimental distribution ofH was computed for partially twinned unmodified HemH
data. In accordance with the results of simulated experiments, the experimental distribution was
compared with a series of distributions for CCM withρ2 = 0.5 and variable twinning fraction
(Fig.3.15b). The experimental curve matched the CCM-reference for twinning fraction 0.2. The
latter estimate for twinning fraction coincided with the estimate obtained from the RvR plot, a
0.00.0
0.2
0.2
0.4
0.4
0.6
0.6
0.8
0.8
1.0
1.0
H
P(H
)
0.00.10.20.30.40.5
0.00.0
0.2
0.2
0.4
0.4
0.6
0.6
0.8
0.8
1.0
1.0
H
P(H
)
(a) (b).
.
Figure 3.15.Partial twinning test in the case of OD-twin of type I/B.
(a) Coloured lines show cumulative distribution ofH for untwinned intensities generated from
(magenta) refined model of HemH,
(blue) the model with two exactly identical molecules in theasymmetric unit and
(green) the model with exactly symmetric OD-layers.
The solid black lines correspond to the constant correlation model for zero twinning fraction andρ2 in
the sequence 0.00, 0.25, 0.50, 0.75, 0.99 (same as coloured lines in Fig.3.2a).
(b) Red line shows cumulative distribution ofH for experimental intensities from partially twinned crystal
of HemH.
The solid black lines correspond to the constant correlation model for variable twinning fraction (numbers
in front of the lines) andρ2 = 0.5.
The dotted lines represent the modulated correlation modelfor twinning fraction 0 in (a) and 0.2 in (b)
141
robust estimate based on both experimental and calculated intensities (Fig.3.16). Accordingly,
the experimental distribution ofH was quite different from the MCM-distribution for twinning
fraction 0.2 (dotted line in Fig.3.15b), although the latter seemed more adequate given the
large-scale organisation of the OD-twin.
3.4.9 Concluding remarks
The assumption (97) entails the presence of sectionsl = l0 in reciprocal space in which twin
related intensities exactly coincide. In addition, the differences between twin related intensities
in the domainsl0 − δl < l < l0 + δl are small and quadratically depend onδl . The presence
of such domains cause, in particular, the presence of an irremovable special point inP(H) at
H = 0 with infinite first derivative. Exactly symmetric sectionsas well as the singularity at
H = 0 would disappear, if the assumptionρ = κ cosω with 0 < κ < 1 were used in place of
(97). In the new model,κ < 1 would account for the perturbation of symmetry in the OD-layers.
In reality, the exact symmetry of the OD-layers never occursin the macromolecular OD-
structures. The asymmetry of the OD-layers can be characterised by the r.m.s.d. over Cα-atoms
between the OD-layer in the refined crystal structure and thesymmetrised OD-layer. This mag-
nitude equals 0.24A for the OD-structure of HemH. The tests with experimental and simulated
data showed that the effect of modulated correlations should be completely disregarded even
with this small asymmetry. Accordingly, the distributionsof Z andH derived for the constant
correlation model (Figs.3.1 and3.2) were sufficiently good references for the corresponding
distributions in the case of non-ideal macromolecular OD-twin. Further tuning of the modulated
correlation model was therefore unnecessary.
Rcalctwin
Rob
stw
in
α
ρ2
0.0 0.2 0.4 0.6 0.8
0.0
0.2
0.4
0.6
0.8
0.00.51.00.0
0.1
0.2
0.3
0.4
0.5
.
.
Figure 3.16.Effect of interfering NCS onRtwin. Red square on the RvR plot corresponds to OD-twin of
HemH. Green points in the background present scatter plot derived from the PDB (Fig.3.3b).
142
Another parameter of the OD-structure under consideration, ε defines the relative positions
of the OD-layers and the period ofρ as a function of the indexl . In the actual crystal structure
of HemH,ε = 0.086 and the whole range of indexl accommodates five periods of the function
ρ. In an imaginary structure with more than ten times smallerε, the functionρ would be a de-
creasing function of resolution in the whole range ofl . The latter structure should be considered
as the structure withP212121 space group pseudosymmetry. Exact crystallographic symmetry
P212121 would occur in the limiting cases ofε = 0 (Fig. 3.12e) andε = 1/2 (different fully
ordered structure). The pseudosymmetric case would be characterised by a narrower range of
ρ and it would be reasonable to expect that the constant correlation model would remain appli-
cable. The “constant correlation statistics” of the actualHemH data are restored for a different
reason, owing to asymmetry of the OD-layers (Fig.3.15a).
The analysis of twins in the PDB showed that the alignment of NCS and twin axes and
consequent correlation of twin-related intensities are characteristic for a large fraction of protein
twins (§3.2.5). An OD-twin can be considered as a limiting case of such twins, as the correlation
between twin-related structure factors in the ideal OD-twin varies in the range from−1 to 1 with
the majority of values close to limits. The distributions ofZ andH derived from the constant
correlation model proved to be good references for an OD-twin and therefore are likely to be
good references for the general case of twin with interfering NCS.
Both the twin of the C-terminal domain of gp2-protein (§3.3) and the twin of HemH are
twins by metric merohedry. These structures present two different mechanisms through which
an orthorhombic lattice is restored in a monoclinic structure. In the first example, the structural
elements controlling the lattice symmetry are NCS-relatedone-dimensional filaments spanning
the crystal in two different directions. In the second example, these are two-dimensional OD-
layers. A common feature of the two cases is that strongly bound “infinite” associations of
molecules dictate the lattice symmetry, which is higher than the holohedry of the point group of
the individual crystals.
143
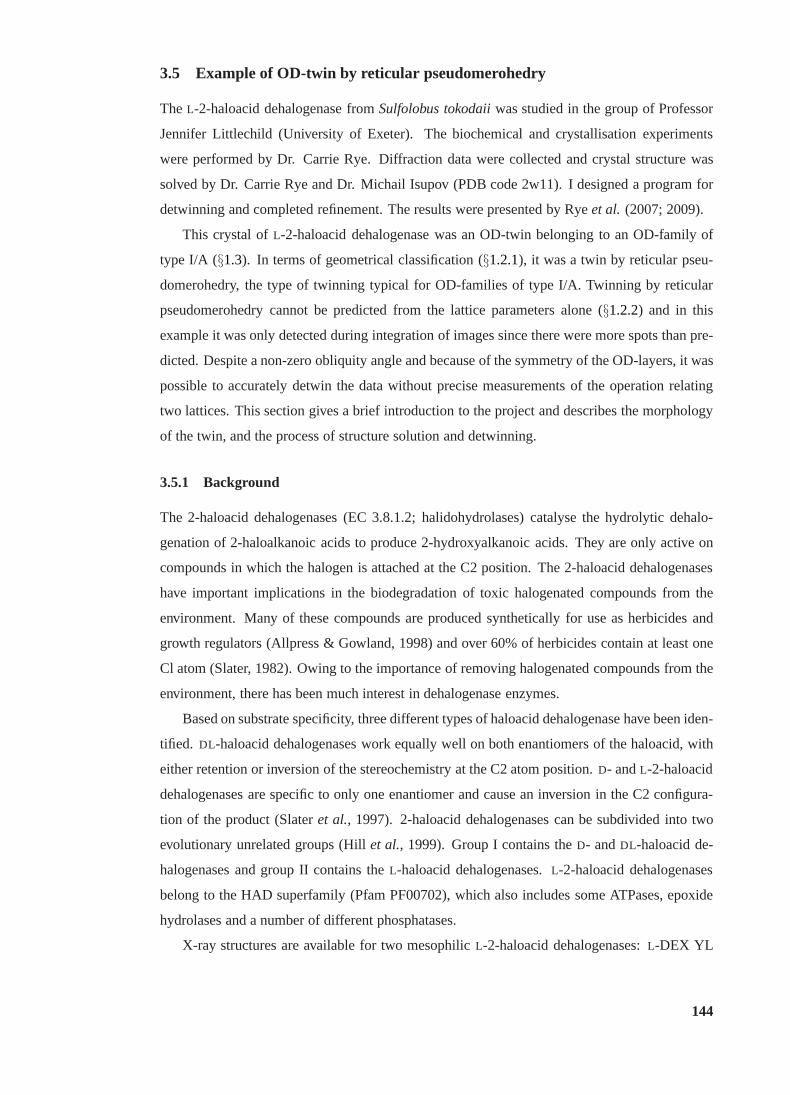
3.5 Example of OD-twin by reticular pseudomerohedry
TheL-2-haloacid dehalogenase fromSulfolobus tokodaiiwas studied in the group of Professor
Jennifer Littlechild (University of Exeter). The biochemical and crystallisation experiments
were performed by Dr. Carrie Rye. Diffraction data were collected and crystal structure was
solved by Dr. Carrie Rye and Dr. Michail Isupov (PDB code 2w11). I designed a program for
detwinning and completed refinement. The results were presented by Ryeet al. (2007; 2009).
This crystal ofL-2-haloacid dehalogenase was an OD-twin belonging to an OD-family of
type I/A (§1.3). In terms of geometrical classification (§1.2.1), it was a twin by reticular pseu-
domerohedry, the type of twinning typical for OD-families of type I/A. Twinning by reticular
pseudomerohedry cannot be predicted from the lattice parameters alone (§1.2.2) and in this
example it was only detected during integration of images since there were more spots than pre-
dicted. Despite a non-zero obliquity angle and because of the symmetry of the OD-layers, it was
possible to accurately detwin the data without precise measurements of the operation relating
two lattices. This section gives a brief introduction to theproject and describes the morphology
of the twin, and the process of structure solution and detwinning.
3.5.1 Background
The 2-haloacid dehalogenases (EC 3.8.1.2; halidohydrolases) catalyse the hydrolytic dehalo-
genation of 2-haloalkanoic acids to produce 2-hydroxyalkanoic acids. They are only active on
compounds in which the halogen is attached at the C2 position. The 2-haloacid dehalogenases
have important implications in the biodegradation of toxichalogenated compounds from the
environment. Many of these compounds are produced synthetically for use as herbicides and
growth regulators (Allpress & Gowland, 1998) and over 60% ofherbicides contain at least one
Cl atom (Slater, 1982). Owing to the importance of removing halogenated compounds from the
environment, there has been much interest in dehalogenase enzymes.
Based on substrate specificity, three different types of haloacid dehalogenase have been iden-
tified. DL-haloacid dehalogenases work equally well on both enantiomers of the haloacid, with
either retention or inversion of the stereochemistry at theC2 atom position.D- andL-2-haloacid
dehalogenases are specific to only one enantiomer and cause an inversion in the C2 configura-
tion of the product (Slateret al., 1997). 2-haloacid dehalogenases can be subdivided into two
evolutionary unrelated groups (Hillet al., 1999). Group I contains theD- andDL-haloacid de-
halogenases and group II contains theL-haloacid dehalogenases.L-2-haloacid dehalogenases
belong to the HAD superfamily (Pfam PF00702), which also includes some ATPases, epoxide
hydrolases and a number of different phosphatases.
X-ray structures are available for two mesophilicL-2-haloacid dehalogenases:L-DEX YL
144

from Pseudomonassp. YL (Hisanoet al., 1996) and DhlB fromXanthobacter autotrophicus
GJ10 (Frankenet al., 1991). Both of these enzymes are homodimers, with each subunit having a
core domain of a Rossmann-fold-like six-stranded parallelβ-sheets flanked by fiveα-helices and
a four-helix-bundle subdomain. The monomeric structure ofa putative haloacid dehalogenase
(PH0459) from the thermophilic archaeonPyrococcus horikoshiiOT3 has also recently been
reported (Araiet al., 2006).
The dehalogenase enzyme under consideration is fromSulfolobus tokodaiistrain 7, which
was isolated from Beppu hot springs in Kyushu, Japan in 1983.S. tokodaiiis able to con-
vert hydrogen sulphide to sulphate and grows optimally at 353 K in an aerobic acidic sulphur-
rich environment. The genome has been sequenced using the whole-genome shotgun method
(Kawarabayasiet al., 2001). The putativeL-2-haloacid dehalogenase sequence has been iden-
tified from the genome sequence and has 31% sequence identityto L-DEX YL, 28% to DhlB
and 29% to PH0459. TheS. tokodaiidehalogenase has been cloned, overexpressed, purified
and shown to have haloacid dehalogenase activity. Crystalsof two complexes, with inorganic
phosphate (orthorhombic form) andL-lactate (monoclinic form) have been obtained and anal-
ysed (Ryeet al., 2009). The structure solution and refinement of the monoclinic crystal (Rye
et al., 2007), a twin by reticular pseudomerohedry, is described below.
3.5.2 Structure solution
The monoclinic crystals belonged to the space groupC2 with unit-cell parametersa = 127.59,
b = 58.08, c = 51.19 A andβ = 97.23o. The solvent content of the crystals, which contain
two subunits in the asymmetric unit, has been estimated at 37%;VM = 1.96A3Da−1 (Matthews,
1968). The X-ray diffraction data were collected at 100 K at Daresbury SRS station 10.1 (Cianci
et al., 2005) using wavelength 1.729A and a MAR 225 CCD detector and processed using the
programsDENZOandSCALEPACK(Otwinowski & Minor, 1997) to giveRsym = 9.6% and
completeness 97.6% in the resolution range 25 to 1.9A.
The MR was carried out with the programMOLREPusing the haloacid dehalogenase from
X. autotrophicus(PDB code 1qq5), which has 28% sequence identity to theS. tokodaiidehalo-
genase. The MR solution could only be found when the search model was trimmed according to
its sequence alignment to the target protein. This was carried out using the model modification
option ofMOLREP(Lebedevet al., 2007). The structure was refined usingREFMAC5.2 and
the model was rebuilt using the programCoot (Emsley & Cowtan, 2004). Initial refinement
gaveR = 0.42 andRfree = 0.48. After several cycles of manual model rebuilding/refinement,
the model was subjected to theARP/wARPprotocol (Perrakiset al., 1999). The resulting model
was refined to a crystallographicR-factor of 0.21 and anRfree of 0.27. These still appeared to be
145
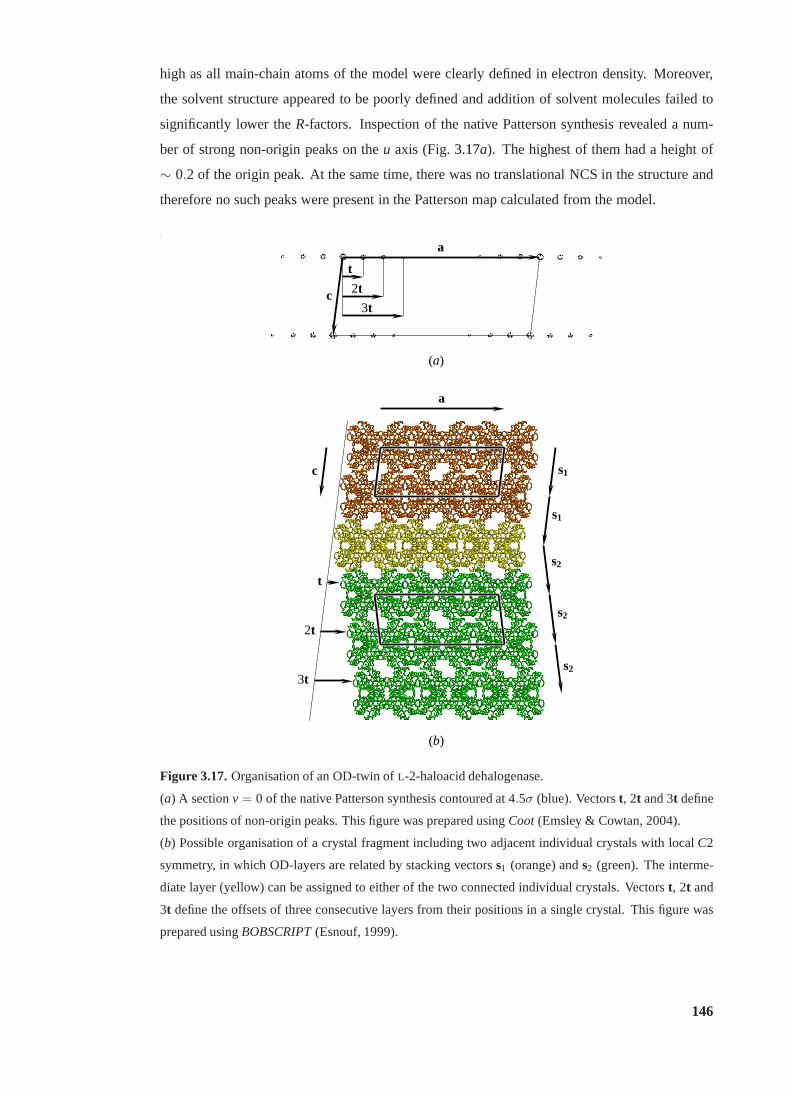
high as all main-chain atoms of the model were clearly definedin electron density. Moreover,
the solvent structure appeared to be poorly defined and addition of solvent molecules failed to
significantly lower theR-factors. Inspection of the native Patterson synthesis revealed a num-
ber of strong non-origin peaks on theu axis (Fig.3.17a). The highest of them had a height of
∼ 0.2 of the origin peak. At the same time, there was no translational NCS in the structure and
therefore no such peaks were present in the Patterson map calculated from the model.
a
a
c
c
t
t
2t
2t
3t
3t
s1
s1
s2
s2
s2
(a)
(b)
Figure 3.17.Organisation of an OD-twin ofL-2-haloacid dehalogenase.
(a) A sectionv = 0 of the native Patterson synthesis contoured at 4.5σ (blue). Vectorst, 2t and 3t define
the positions of non-origin peaks. This figure was prepared usingCoot(Emsley & Cowtan, 2004).
(b) Possible organisation of a crystal fragment including twoadjacent individual crystals with localC2
symmetry, in which OD-layers are related by stacking vectors s1 (orange) ands2 (green). The interme-
diate layer (yellow) can be assigned to either of the two connected individual crystals. Vectorst, 2t and
3t define the offsets of three consecutive layers from their positions in a single crystal. This figure was
prepared usingBOBSCRIPT(Esnouf, 1999).
146
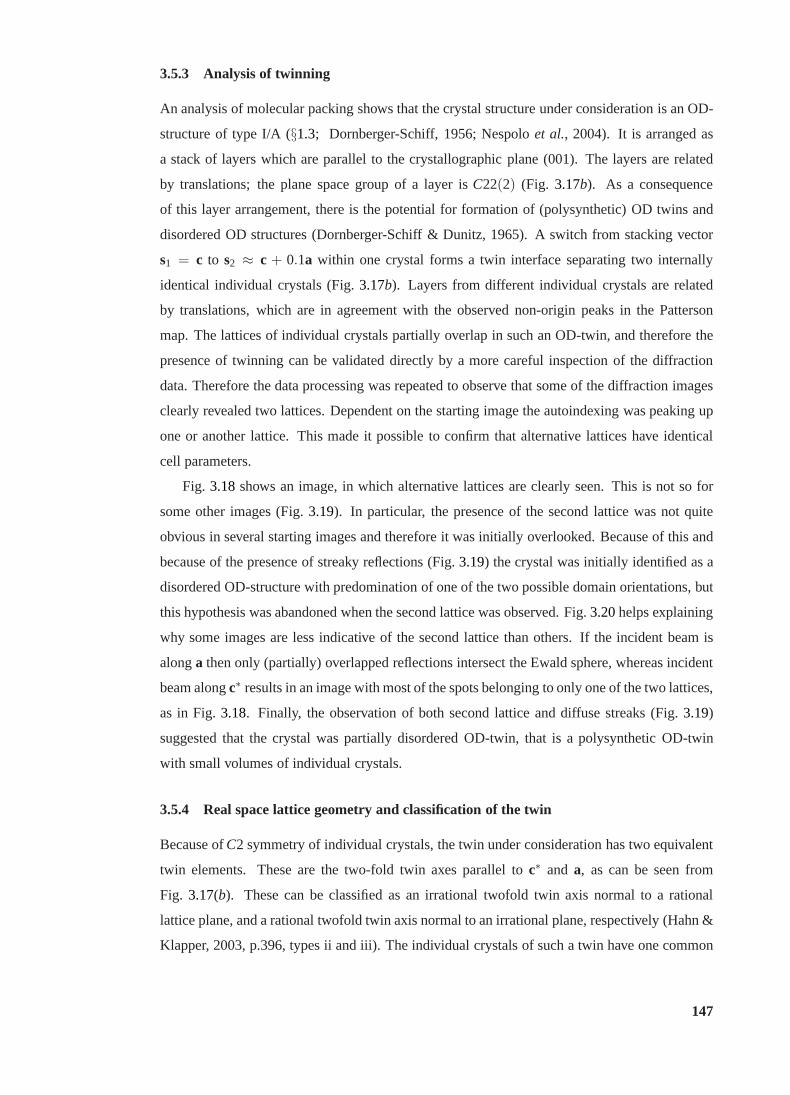
3.5.3 Analysis of twinning
An analysis of molecular packing shows that the crystal structure under consideration is an OD-
structure of type I/A (§1.3; Dornberger-Schiff, 1956; Nespoloet al., 2004). It is arranged as
a stack of layers which are parallel to the crystallographicplane (001). The layers are related
by translations; the plane space group of a layer isC22(2) (Fig. 3.17b). As a consequence
of this layer arrangement, there is the potential for formation of (polysynthetic) OD twins and
disordered OD structures (Dornberger-Schiff & Dunitz, 1965). A switch from stacking vector
s1 = c to s2 ≈ c + 0.1a within one crystal forms a twin interface separating two internally
identical individual crystals (Fig.3.17b). Layers from different individual crystals are related
by translations, which are in agreement with the observed non-origin peaks in the Patterson
map. The lattices of individual crystals partially overlapin such an OD-twin, and therefore the
presence of twinning can be validated directly by a more careful inspection of the diffraction
data. Therefore the data processing was repeated to observethat some of the diffraction images
clearly revealed two lattices. Dependent on the starting image the autoindexing was peaking up
one or another lattice. This made it possible to confirm that alternative lattices have identical
cell parameters.
Fig. 3.18shows an image, in which alternative lattices are clearly seen. This is not so for
some other images (Fig.3.19). In particular, the presence of the second lattice was not quite
obvious in several starting images and therefore it was initially overlooked. Because of this and
because of the presence of streaky reflections (Fig.3.19) the crystal was initially identified as a
disordered OD-structure with predomination of one of the two possible domain orientations, but
this hypothesis was abandoned when the second lattice was observed. Fig.3.20helps explaining
why some images are less indicative of the second lattice than others. If the incident beam is
alonga then only (partially) overlapped reflections intersect theEwald sphere, whereas incident
beam alongc∗ results in an image with most of the spots belonging to only one of the two lattices,
as in Fig.3.18. Finally, the observation of both second lattice and diffuse streaks (Fig.3.19)
suggested that the crystal was partially disordered OD-twin, that is a polysynthetic OD-twin
with small volumes of individual crystals.
3.5.4 Real space lattice geometry and classification of the twin
Because ofC2 symmetry of individual crystals, the twin under consideration has two equivalent
twin elements. These are the two-fold twin axes parallel toc∗ and a, as can be seen from
Fig. 3.17(b). These can be classified as an irrational twofold twin axis normal to a rational
lattice plane, and a rational twofold twin axis normal to an irrational plane, respectively (Hahn &
Klapper, 2003, p.396, types ii and iii). The individual crystals of such a twin have one common
147
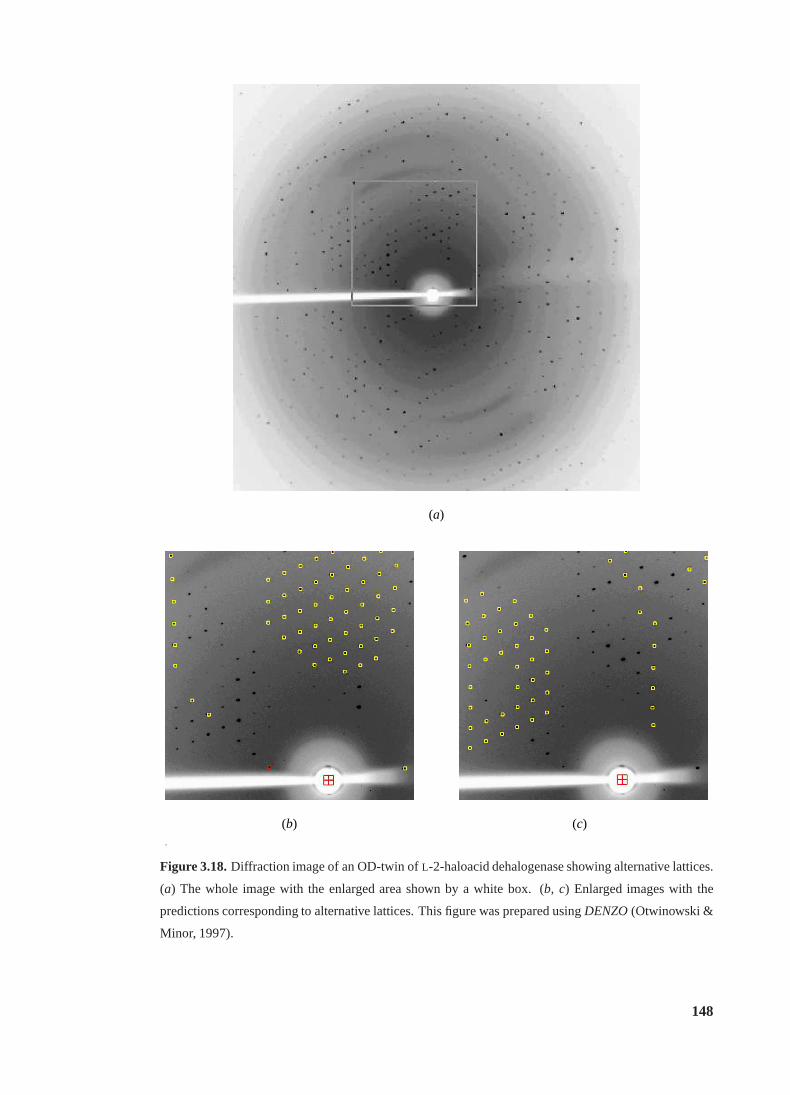
(a)
(b) (c).
Figure 3.18.Diffraction image of an OD-twin ofL-2-haloacid dehalogenase showing alternative lattices.
(a) The whole image with the enlarged area shown by a white box. (b, c) Enlarged images with the
predictions corresponding to alternative lattices. This figure was prepared usingDENZO(Otwinowski &
Minor, 1997).
148
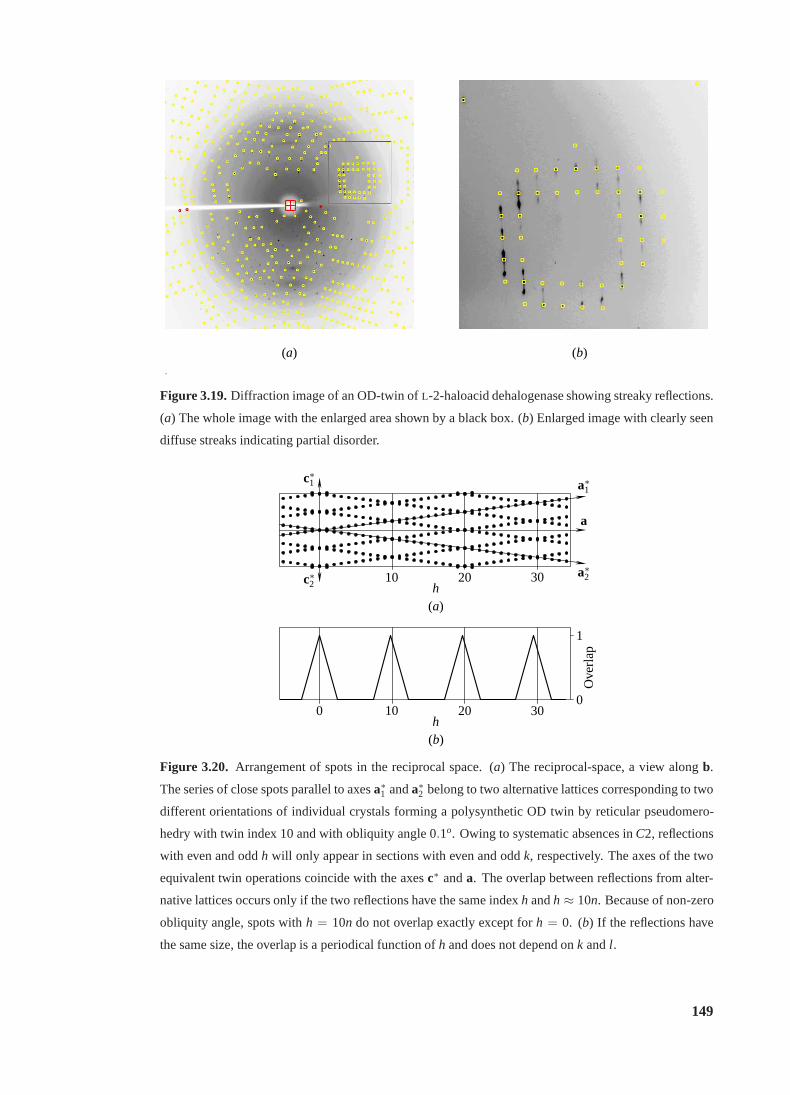
(a) (b).
Figure 3.19.Diffraction image of an OD-twin ofL-2-haloacid dehalogenase showing streaky reflections.
(a) The whole image with the enlarged area shown by a black box. (b) Enlarged image with clearly seen
diffuse streaks indicating partial disorder.
c∗1
c∗2
a∗1
a
a∗2h
10 20 30
(a)
h0
010 20 30
1
Ove
rlap
(b)
Figure 3.20. Arrangement of spots in the reciprocal space. (a) The reciprocal-space, a view alongb.
The series of close spots parallel to axesa∗1 anda∗2 belong to two alternative lattices corresponding to two
different orientations of individual crystals forming a polysynthetic OD twin by reticular pseudomero-
hedry with twin index 10 and with obliquity angle 0.1o. Owing to systematic absences inC2, reflections
with even and oddh will only appear in sections with even and oddk, respectively. The axes of the two
equivalent twin operations coincide with the axesc∗ anda. The overlap between reflections from alter-
native lattices occurs only if the two reflections have the same indexh andh ≈ 10n. Because of non-zero
obliquity angle, spots withh = 10n do not overlap exactly except forh = 0. (b) If the reflections have
the same size, the overlap is a periodical function ofh and does not depend onk andl .
149
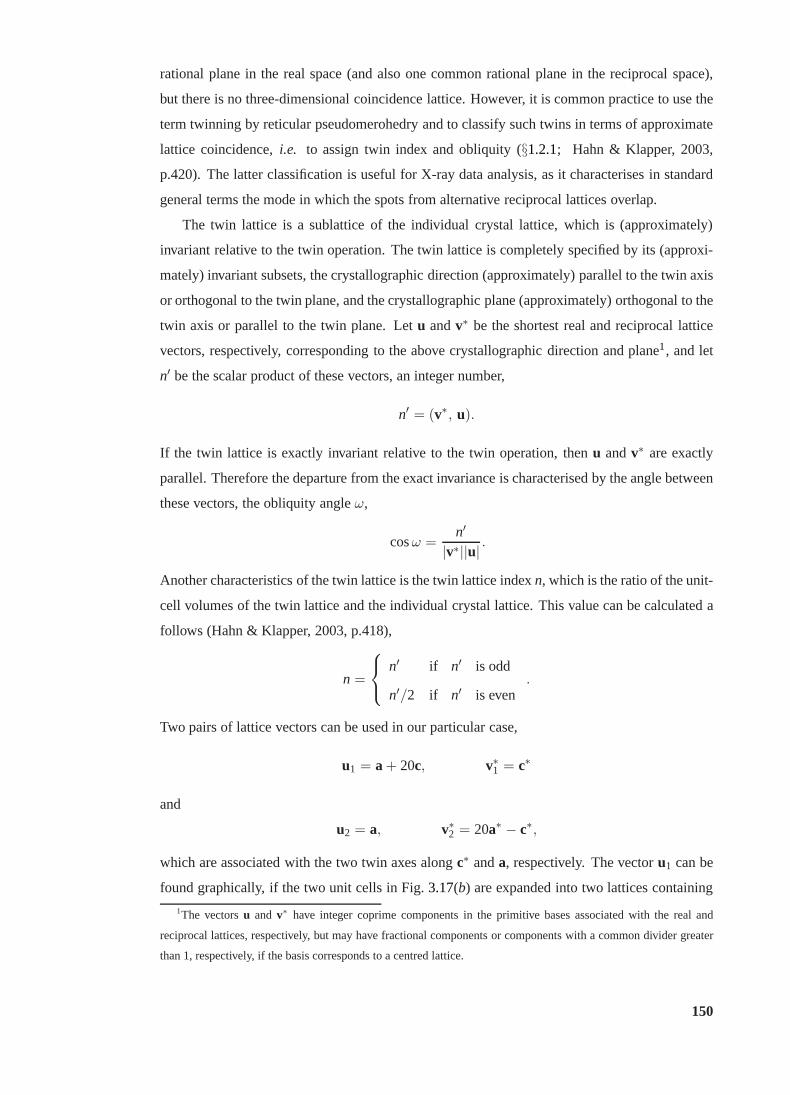
rational plane in the real space (and also one common rational plane in the reciprocal space),
but there is no three-dimensional coincidence lattice. However, it is common practice to use the
term twinning by reticular pseudomerohedry and to classifysuch twins in terms of approximate
lattice coincidence,i.e. to assign twin index and obliquity (§1.2.1; Hahn & Klapper, 2003,
p.420). The latter classification is useful for X-ray data analysis, as it characterises in standard
general terms the mode in which the spots from alternative reciprocal lattices overlap.
The twin lattice is a sublattice of the individual crystal lattice, which is (approximately)
invariant relative to the twin operation. The twin lattice is completely specified by its (approxi-
mately) invariant subsets, the crystallographic direction (approximately) parallel to the twin axis
or orthogonal to the twin plane, and the crystallographic plane (approximately) orthogonal to the
twin axis or parallel to the twin plane. Letu andv∗ be the shortest real and reciprocal lattice
vectors, respectively, corresponding to the above crystallographic direction and plane1, and let
n′ be the scalar product of these vectors, an integer number,
n′ = (v∗, u).
If the twin lattice is exactly invariant relative to the twinoperation, thenu andv∗ are exactly
parallel. Therefore the departure from the exact invariance is characterised by the angle between
these vectors, the obliquity angleω,
cosω =n′
|v∗||u| .
Another characteristics of the twin lattice is the twin lattice indexn, which is the ratio of the unit-
cell volumes of the twin lattice and the individual crystal lattice. This value can be calculated a
follows (Hahn & Klapper, 2003, p.418),
n =
n′ if n′ is odd
n′/2 if n′ is even.
Two pairs of lattice vectors can be used in our particular case,
u1 = a + 20c, v∗1 = c∗
and
u2 = a, v∗2 = 20a∗ − c∗,
which are associated with the two twin axes alongc∗ anda, respectively. The vectoru1 can be
found graphically, if the two unit cells in Fig.3.17(b) are expanded into two lattices containing
1The vectorsu and v∗ have integer coprime components in the primitive bases associated with the real and
reciprocal lattices, respectively, but may have fractional components or components with a common divider greater
than 1, respectively, if the basis corresponds to a centred lattice.
150
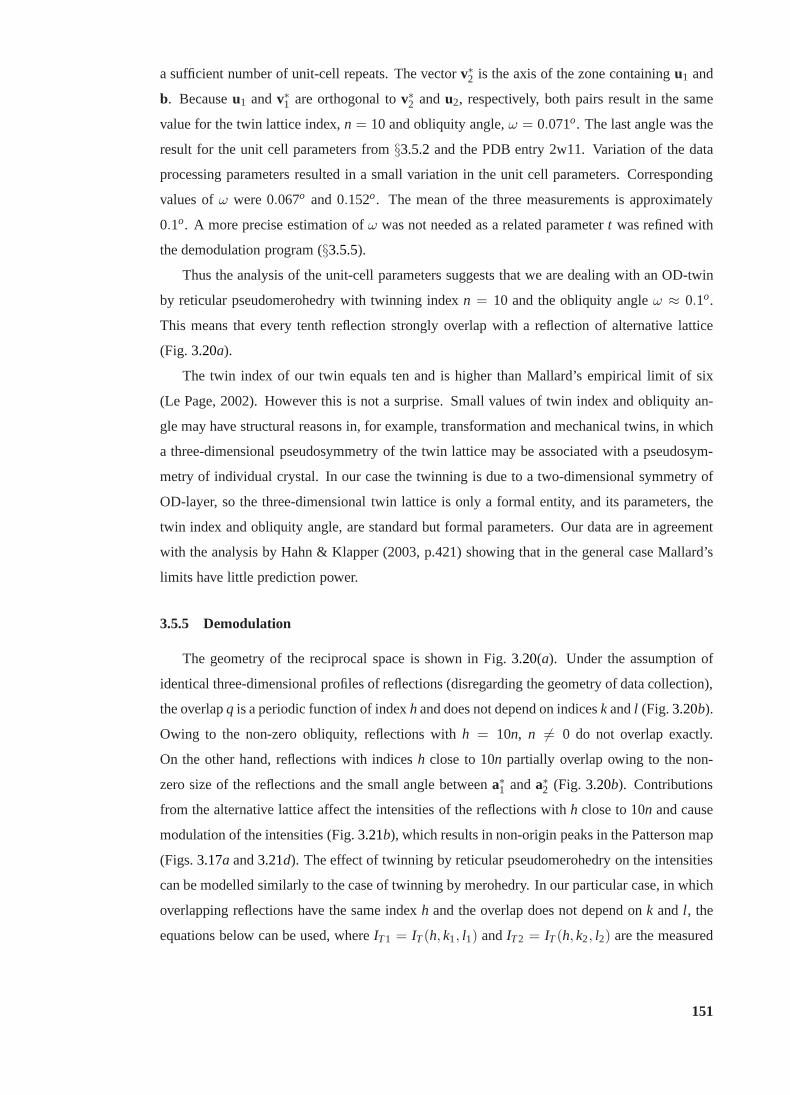
a sufficient number of unit-cell repeats. The vectorv∗2 is the axis of the zone containingu1 and
b. Becauseu1 andv∗1 are orthogonal tov∗2 andu2, respectively, both pairs result in the same
value for the twin lattice index,n = 10 and obliquity angle,ω = 0.071o. The last angle was the
result for the unit cell parameters from§3.5.2and the PDB entry 2w11. Variation of the data
processing parameters resulted in a small variation in the unit cell parameters. Corresponding
values ofω were 0.067o and 0.152o. The mean of the three measurements is approximately
0.1o. A more precise estimation ofω was not needed as a related parametert was refined with
the demodulation program (§3.5.5).
Thus the analysis of the unit-cell parameters suggests thatwe are dealing with an OD-twin
by reticular pseudomerohedry with twinning indexn = 10 and the obliquity angleω ≈ 0.1o.
This means that every tenth reflection strongly overlap witha reflection of alternative lattice
(Fig. 3.20a).
The twin index of our twin equals ten and is higher than Mallard’s empirical limit of six
(Le Page, 2002). However this is not a surprise. Small valuesof twin index and obliquity an-
gle may have structural reasons in, for example, transformation and mechanical twins, in which
a three-dimensional pseudosymmetry of the twin lattice maybe associated with a pseudosym-
metry of individual crystal. In our case the twinning is due to a two-dimensional symmetry of
OD-layer, so the three-dimensional twin lattice is only a formal entity, and its parameters, the
twin index and obliquity angle, are standard but formal parameters. Our data are in agreement
with the analysis by Hahn & Klapper (2003, p.421) showing that in the general case Mallard’s
limits have little prediction power.
3.5.5 Demodulation
The geometry of the reciprocal space is shown in Fig.3.20(a). Under the assumption of
identical three-dimensional profiles of reflections (disregarding the geometry of data collection),
the overlapq is a periodic function of indexhand does not depend on indicesk andl (Fig.3.20b).
Owing to the non-zero obliquity, reflections withh = 10n, n 6= 0 do not overlap exactly.
On the other hand, reflections with indicesh close to 10n partially overlap owing to the non-
zero size of the reflections and the small angle betweena∗1 anda∗2 (Fig. 3.20b). Contributions
from the alternative lattice affect the intensities of the reflections withh close to 10n and cause
modulation of the intensities (Fig.3.21b), which results in non-origin peaks in the Patterson map
(Figs.3.17a and3.21d). The effect of twinning by reticular pseudomerohedry on the intensities
can be modelled similarly to the case of twinning by merohedry. In our particular case, in which
overlapping reflections have the same indexh and the overlap does not depend onk and l , the
equations below can be used, whereIT1 = IT(h, k1, l1) andIT2 = IT(h, k2, l2) are the measured
151
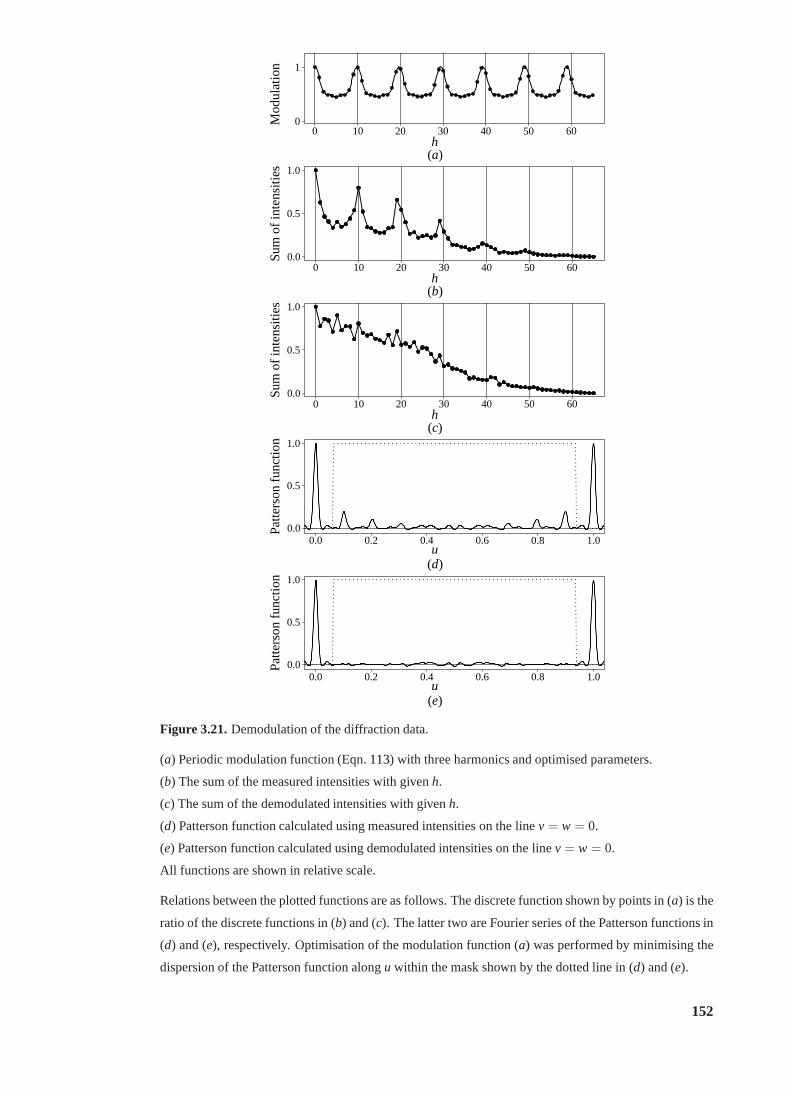
Mod
ulat
ion
0
1
h0 10 20 30 40 50 60
(a)
Sum
ofin
tens
ities
0.0
0.5
1.0
h0 10 20 30 40 50 60
(b)S
umof
inte
nsiti
es
0.0
0.5
1.0
h0 10 20 30 40 50 60
(c)
Patte
rson
func
tion
0.0
0.5
1.0
u0.0 0.2 0.4 0.6 0.8 1.0
(d)
Patte
rson
func
tion
0.0
0.5
1.0
u0.0 0.2 0.4 0.6 0.8 1.0
(e)
Figure 3.21.Demodulation of the diffraction data.
(a) Periodic modulation function (Eqn.113) with three harmonics and optimised parameters.
(b) The sum of the measured intensities with givenh.
(c) The sum of the demodulated intensities with givenh.
(d) Patterson function calculated using measured intensities on the linev = w = 0.
(e) Patterson function calculated using demodulated intensities on the linev = w = 0.
All functions are shown in relative scale.
Relations between the plotted functions are as follows. Thediscrete function shown by points in (a) is the
ratio of the discrete functions in (b) and (c). The latter two are Fourier series of the Patterson functions in
(d) and (e), respectively. Optimisation of the modulation function (a) was performed by minimising the
dispersion of the Patterson function alongu within the mask shown by the dotted line in (d) and (e).
152
(twinned) intensities andI1 = I(h, k1, l1) and I2 = I(h, k2, l2) are the detwinned intensities of
two overlapping reflections from the alternative lattices,
IT 1 = (1− α) I1 + αq(h) I2
IT 2 = (1− α) I2 + αq(h) I1. (110)
The difference from the case of twinning by merohedry is thatthe contribution from the alterna-
tive lattice depends on both the twinning fractionα and the overlapq(h).
A good estimate of the twinning fractionα can be obtained by comparing the intensities of
non-overlapping reflections from the alternative latticesprovided that the two sets of intensities
are on the same scale. Although less accurate, an estimate ofα can also be obtained using inten-
sities from a single lattice. For example, the reflections with h = 10 overlap with the reflections
from the second lattice, while the reflections withh = 15 do not overlap. The mean intensity for
h = 10 is about twice larger than the mean intensity forh = 15, as follows from Fig.3.20(a).
Consequently, the contributions from the two lattices intoh = 10 are approximately the same
and therefore the twinning fractionα is approximately 1/2 (the mean untwinned intensities for
the two values ofh are assumed to be approximately equal).
Our twinned crystal appears to be a polysynthetic twin with many twin interfaces, as sug-
gested by the lack of well-defined edges. Therefore the individual crystals of this twin appear to
be too small to be cut out for data collection. Deconvolutionof partially overlapped reflections
during data processing is not yet possible with standard software for protein crystallography.
Therefore, the improvement of integrated data was required, a detwinning procedure taking into
account the non-uniform overlap of the reflections from the two lattices. In principle, this can
be performed using the system of equations (110). However, it was found thatα is close to
1/2. Thus, as in the case of perfect twinning by merohedry, detwinning would not work for
reflections withq(h) close to 1. Fortunately, detwinning becomes feasible owingto the inter-
nal symmetry of a single OD layer. The Fourier transform amplitude of the layer’s electron
density has point-group symmetry that includes twin operations. This means that overlapping
reflections from the two lattices have very similar intensities. Moreover, the higher the overlap
the closer the intensities are (indeed,Rsym with respect to the twin operation for the subset of
reflections withh = 10n is 4.1% for observed and 11.9% for calculated intensities).Also, the
less the overlap the less the contribution is from the alternative lattice and therefore less accurate
estimates for intensities from the alternative lattice arerequired in (110). Thus, for the pairs of
reflections related by (110), we assume that
I1 = I2 (111)
and (110) can be rewritten as
IT = [1− α+ αq(h)] I = q(h) I . (112)
153
This means that detwinning can be performed by pure demodulation, where the detwinned in-
tensity is derived solely from the original intensity multiplied by a coefficient dependent onh.
Similarly to q(h) in (110), the coefficient ˜q(h) in (112) can be modelled by a periodic function
of h, wheret approximately equals 1/10 and its exact value depends on theobliquity angle,
q(h) = c0 + c1 cos(2πth) + c2 cos(4πth) + . . . (113)
Thus, the detwinning procedure must involve refinement oft, on which the overlap strongly
depends. The coefficientc0 is defined by the equation ˜q(0) = 1, which follows fromq(0) = 1
and (112).
The demodulation was performed using a specially writtenFORTRANprogram. Firstly,
optimisation of the parameterst, c1, c2, . . . (113) was performed by minimising the dispersion
of the Patterson function on the linev = w = 0 within a mask excluding an area around the
origin (Figs. 3.21d and 3.21e). This was performed for zero to six harmonics in expansion
(113). Secondly, the original data were demodulated by dividingthe intensities by the corre-
sponding value of ˜q(h). Subsequently, restrained refinement usingREFMACwas performed
against each demodulated data set, starting each time from the same atomic model. The best
R = 0.162 andRfree = 0.225 were obtained for the approximation (113) containing three har-
monics. The corresponding modulation function ˜q(h) is shown in Fig.3.21(a). The refined
value oft corresponds to an obliquity angle of 0.13o, which agrees with the values derived from
the unit-cell parameters. The demodulated data gave a relatively smooth plot of∑
k
∑
l I(h, k, l)
againsth (Fig.3.21c) and the corresponding Patterson map contained no strong non-origin peaks
(Fig. 3.21e). The demodulated data were used in the final round of model correction and refine-
ment.
To examine the effect of twinning on the atomic model and electron density, the model from
the PDB was refined against both detwinned and original twinned data with all other refinement
parameters being identical. In spite of differentR-factors (R = 0.193 andRfree = 0.258 for
twinned andR = 0.159 andRfree = 0.220 for detwinned data) no significant differences in the
electron density could be seen and neither atomic coordinates norB-factors were significantly
different in the two refined models (the r.m.s.d. was 0.06A for coordinates of Cα atoms and 1.6
A2 for B-factors of all protein atoms). With water and two lactate molecules removed, refine-
ment against the two data sets, original and demodulated, revealed minor differences in the two
resultant maps at the positions of the removed atoms. In particular, the density for the O3-atom
of the lactate of chain A was almost missing. This observation is consistent with poorly defined
solvent electron density after initial model building and refinement before twinning was noticed.
We therefore anticipate that detwinning in cases like this can provide a small improvement in the
refinement and help manual or automated model building but will not be critical for the quality
of the final model.
154
3.5.6 Concluding remarks
The OD structures with a large number of twin interfaces are considered as partially disordered
OD structures (Dornberger-Schiff & Dunitz, 1965). They produce elongated streaky reflections
on the diffraction images. Apparently, we have a case that isintermediate between a polysyn-
thetic OD twin and a disordered OD structure, as diffuse streaks are present in some images
(Fig. 3.19). Nevertheless, the demodulation procedure remains applicable to such cases (Wang
et al., 2005).
Macromolecular crystals are characterised by a clearly defined hierarchy of building blocks
and by the different strengths of interactions between them. Because of this, protein crystals are
frequently composed of symmetric layers with asymmetric interfaces between them. In some of
these cases there is the potential for the formation of OD twins by reticular pseudomerohedry.
The procedure described above is applicable to the majorityof such twins: (i) the exact twin
operation can be identified based on the organisation of the crystal and (ii) higher symmetry
of OD layers can be further utilised to reduce detwinning to asimple demodulation, thereby
avoiding the problem with singularity atα = 1/2.
In the case under consideration the detection of twinning byreticular pseudomerohedry
involved two steps, inspection of the Patterson map and detection of the alternative lattice. This
is a quite general and practical approach. The inspection ofthe Patterson map is a quick test
that immediately excludes irrelevant cases. The check for an alternative lattice is necessary
if non-origin peaks are found in the Patterson map, as these peaks can be due to twinning or
pseudotranslation. The alternative approach, predictionof twinning from unit-cell parameters
and Mallard’s limits (Le Page, 2002) is not sensible for growth twins as demonstrated by Hahn
& Klapper (2003, p.421) and confirmed by this particular caseof twinning with the twin index
of ten.
155
4 False-origin MR-solutions
In the case of translational pseudosymmetry, the vector relating equivalent origins in the true
space group also relates equivalent origins in the pseudosymmetry space group with smaller unit-
cell. However, the inverse statement is not in general correct. A translation relating origins in a
pseudosymmetry space group may convert the structure into afalse structure, in which some of
the NCS axes become crystallographic andvice versaand one of the pseudo-origins becomes the
crystallographic origin. If the TF had picked up such a falsesolution, the subsequent refinement
would stall at high values ofRandRfree despite misleadingly good quality of the electron density
maps. Such false structures are here referred to as false-origin structures, or false-origin MR-
solutions.
The first two sections of this chapter describe two cases, in which false-origin MR-solutions
were encountered in the course of structure determination.In each case, the analysis of pseu-
dosymmetry and possible methods of resolving the false-origin problem are presented. To au-
tomatically handle the false-origin MR solutions, as well as other cases of incorrectly specified
symmetry, I have developed the programZanuda, which is described in the third section of this
chapter. The program was successfully used to correct the symmetry assignment in a compli-
cated case in which both NCS by translation and NCS interfering with twinning were present
(§4.4). An OD-structure of type I/A with yet another type of space group ambiguity is analysed
in (§4.5).
156
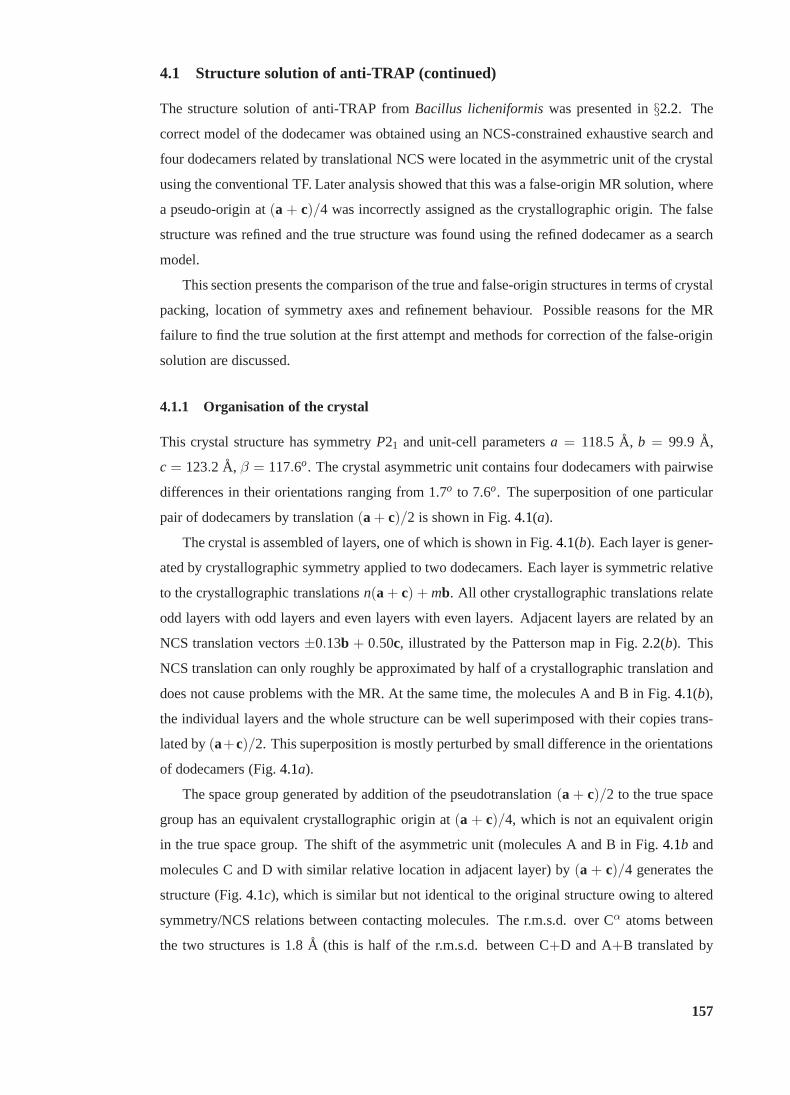
4.1 Structure solution of anti-TRAP (continued)
The structure solution of anti-TRAP fromBacillus licheniformiswas presented in§2.2. The
correct model of the dodecamer was obtained using an NCS-constrained exhaustive search and
four dodecamers related by translational NCS were located in the asymmetric unit of the crystal
using the conventional TF. Later analysis showed that this was a false-origin MR solution, where
a pseudo-origin at(a + c)/4 was incorrectly assigned as the crystallographic origin.The false
structure was refined and the true structure was found using the refined dodecamer as a search
model.
This section presents the comparison of the true and false-origin structures in terms of crystal
packing, location of symmetry axes and refinement behaviour. Possible reasons for the MR
failure to find the true solution at the first attempt and methods for correction of the false-origin
solution are discussed.
4.1.1 Organisation of the crystal
This crystal structure has symmetryP21 and unit-cell parametersa = 118.5 A, b = 99.9 A,
c = 123.2 A, β = 117.6o. The crystal asymmetric unit contains four dodecamers withpairwise
differences in their orientations ranging from 1.7o to 7.6o. The superposition of one particular
pair of dodecamers by translation(a + c)/2 is shown in Fig.4.1(a).
The crystal is assembled of layers, one of which is shown in Fig. 4.1(b). Each layer is gener-
ated by crystallographic symmetry applied to two dodecamers. Each layer is symmetric relative
to the crystallographic translationsn(a + c) + mb. All other crystallographic translations relate
odd layers with odd layers and even layers with even layers. Adjacent layers are related by an
NCS translation vectors±0.13b + 0.50c, illustrated by the Patterson map in Fig.2.2(b). This
NCS translation can only roughly be approximated by half of acrystallographic translation and
does not cause problems with the MR. At the same time, the molecules A and B in Fig.4.1(b),
the individual layers and the whole structure can be well superimposed with their copies trans-
lated by(a+c)/2. This superposition is mostly perturbed by small difference in the orientations
of dodecamers (Fig.4.1a).
The space group generated by addition of the pseudotranslation (a + c)/2 to the true space
group has an equivalent crystallographic origin at(a + c)/4, which is not an equivalent origin
in the true space group. The shift of the asymmetric unit (molecules A and B in Fig.4.1b and
molecules C and D with similar relative location in adjacentlayer) by(a + c)/4 generates the
structure (Fig.4.1c), which is similar but not identical to the original structure owing to altered
symmetry/NCS relations between contacting molecules. Ther.m.s.d. over Cα atoms between
the two structures is 1.8A (this is half of the r.m.s.d. between C+D and A+B translated by
157
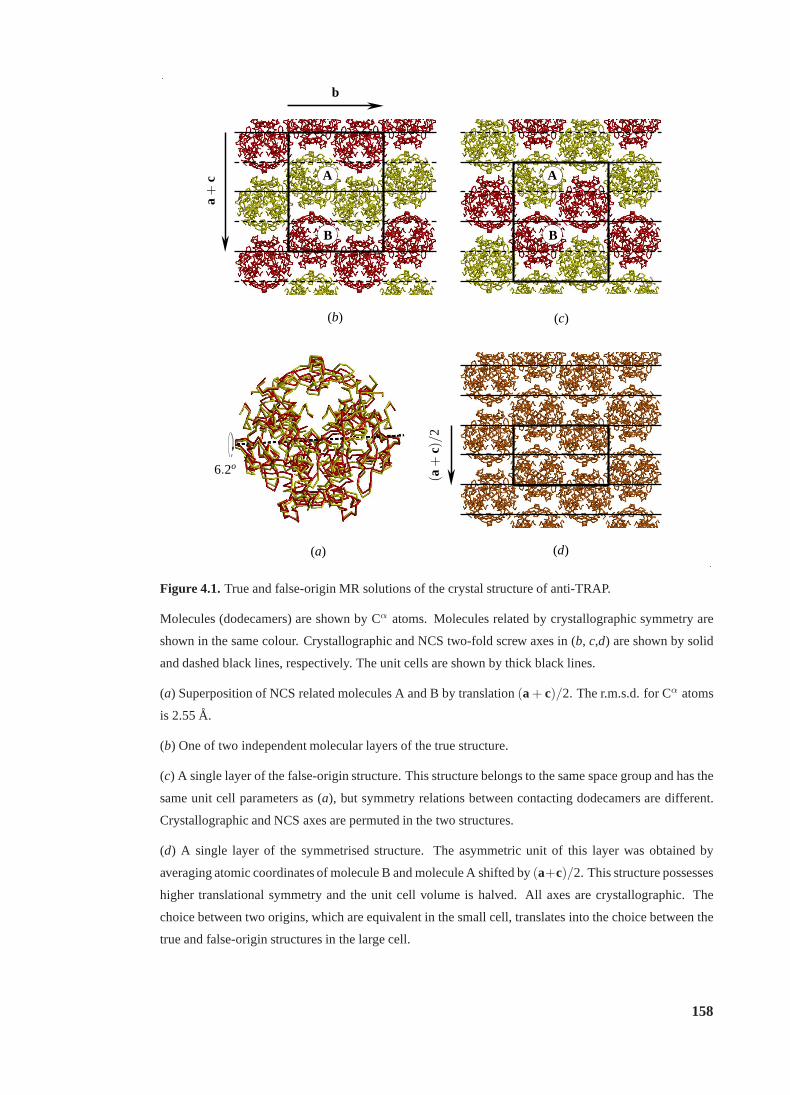
6.2o
(a+
c)/2
b
a+
c AA
BB
(a)
(b) (c)
(d)
Figure 4.1.True and false-origin MR solutions of the crystal structureof anti-TRAP.
Molecules (dodecamers) are shown by Cα atoms. Molecules related by crystallographic symmetry are
shown in the same colour. Crystallographic and NCS two-foldscrew axes in (b, c,d) are shown by solid
and dashed black lines, respectively. The unit cells are shown by thick black lines.
(a) Superposition of NCS related molecules A and B by translation(a+ c)/2. The r.m.s.d. for Cα atoms
is 2.55A.
(b) One of two independent molecular layers of the true structure.
(c) A single layer of the false-origin structure. This structure belongs to the same space group and has the
same unit cell parameters as (a), but symmetry relations between contacting dodecamers are different.
Crystallographic and NCS axes are permuted in the two structures.
(d) A single layer of the symmetrised structure. The asymmetric unit of this layer was obtained by
averaging atomic coordinates of molecule B and molecule A shifted by(a+c)/2. This structure possesses
higher translational symmetry and the unit cell volume is halved. All axes are crystallographic. The
choice between two origins, which are equivalent in the small cell, translates into the choice between the
true and false-origin structures in the large cell.
158
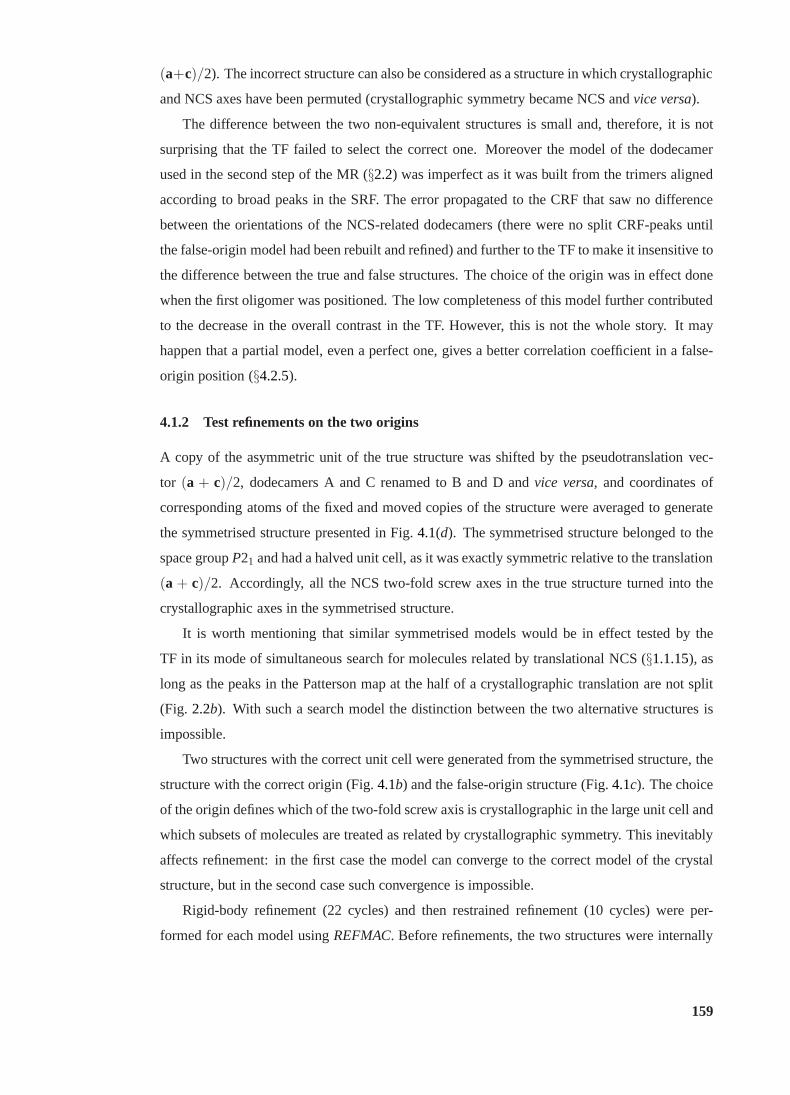
(a+c)/2). The incorrect structure can also be considered as a structure in which crystallographic
and NCS axes have been permuted (crystallographic symmetrybecame NCS andvice versa).
The difference between the two non-equivalent structures is small and, therefore, it is not
surprising that the TF failed to select the correct one. Moreover the model of the dodecamer
used in the second step of the MR (§2.2) was imperfect as it was built from the trimers aligned
according to broad peaks in the SRF. The error propagated to the CRF that saw no difference
between the orientations of the NCS-related dodecamers (there were no split CRF-peaks until
the false-origin model had been rebuilt and refined) and further to the TF to make it insensitive to
the difference between the true and false structures. The choice of the origin was in effect done
when the first oligomer was positioned. The low completenessof this model further contributed
to the decrease in the overall contrast in the TF. However, this is not the whole story. It may
happen that a partial model, even a perfect one, gives a better correlation coefficient in a false-
origin position (§4.2.5).
4.1.2 Test refinements on the two origins
A copy of the asymmetric unit of the true structure was shifted by the pseudotranslation vec-
tor (a + c)/2, dodecamers A and C renamed to B and D andvice versa, and coordinates of
corresponding atoms of the fixed and moved copies of the structure were averaged to generate
the symmetrised structure presented in Fig.4.1(d). The symmetrised structure belonged to the
space groupP21 and had a halved unit cell, as it was exactly symmetric relative to the translation
(a + c)/2. Accordingly, all the NCS two-fold screw axes in the true structure turned into the
crystallographic axes in the symmetrised structure.
It is worth mentioning that similar symmetrised models would be in effect tested by the
TF in its mode of simultaneous search for molecules related by translational NCS (§1.1.15), as
long as the peaks in the Patterson map at the half of a crystallographic translation are not split
(Fig. 2.2b). With such a search model the distinction between the two alternative structures is
impossible.
Two structures with the correct unit cell were generated from the symmetrised structure, the
structure with the correct origin (Fig.4.1b) and the false-origin structure (Fig.4.1c). The choice
of the origin defines which of the two-fold screw axis is crystallographic in the large unit cell and
which subsets of molecules are treated as related by crystallographic symmetry. This inevitably
affects refinement: in the first case the model can converge tothe correct model of the crystal
structure, but in the second case such convergence is impossible.
Rigid-body refinement (22 cycles) and then restrained refinement (10 cycles) were per-
formed for each model usingREFMAC. Before refinements, the two structures were internally
159
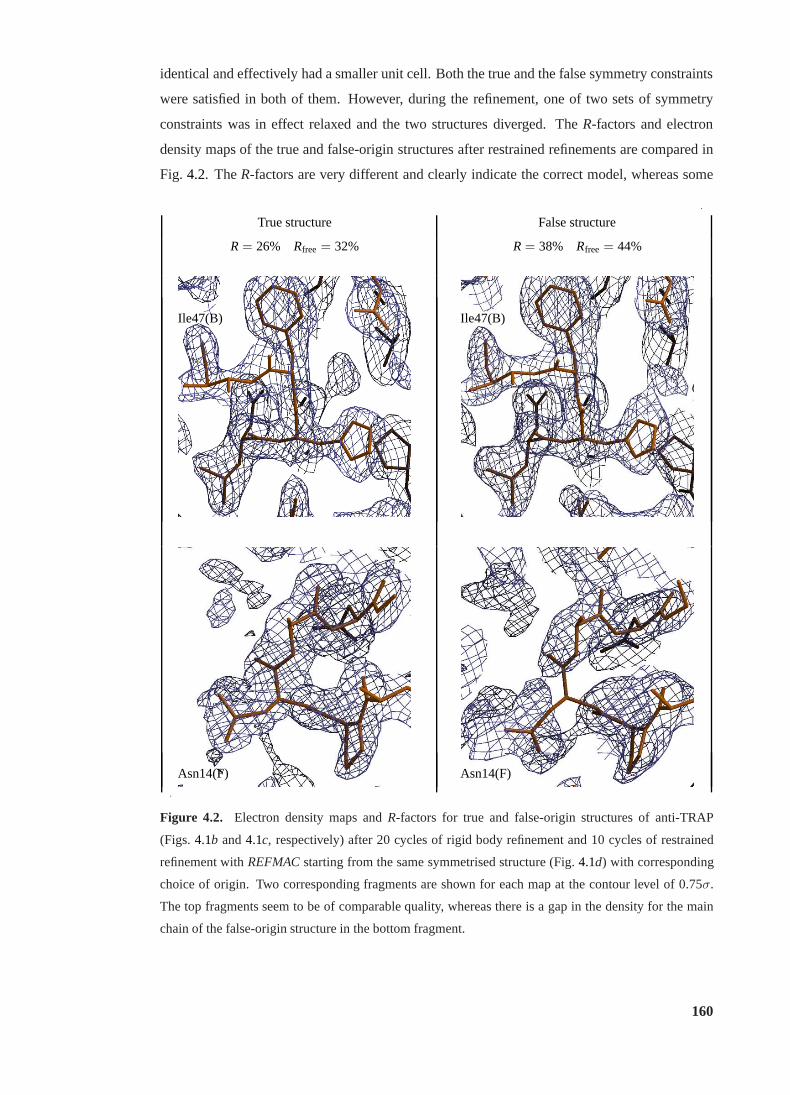
identical and effectively had a smaller unit cell. Both the true and the false symmetry constraints
were satisfied in both of them. However, during the refinement, one of two sets of symmetry
constraints was in effect relaxed and the two structures diverged. TheR-factors and electron
density maps of the true and false-origin structures after restrained refinements are compared in
Fig. 4.2. TheR-factors are very different and clearly indicate the correct model, whereas some
·
Truestructure Falsestructure
R = 26% Rfree = 32% R = 38% Rfree = 44%
Ile47(B) Ile47(B)
Asn14(F) Asn14(F)
·
Figure 4.2. Electron density maps andR-factors for true and false-origin structures of anti-TRAP
(Figs.4.1b and4.1c, respectively) after 20 cycles of rigid body refinement and 10 cycles of restrained
refinement withREFMACstarting from the same symmetrised structure (Fig.4.1d) with corresponding
choice of origin. Two corresponding fragments are shown foreach map at the contour level of 0.75σ.
The top fragments seem to be of comparable quality, whereas there is a gap in the density for the main
chain of the false-origin structure in the bottom fragment.
160
corresponding fragments of the two maps seem to be of a similarly good quality. However some
other fragments of the electron density from the false structure are so much distorted that even
the main chain atoms are not in the density. Nevertheless, the interpretable fragments of such
maps can be used for partial correction of the model (§2.2.3) and may cause an impression that
the model is in general correct but needs further improvement and refinement.
4.1.3 Comments on restoring the true structure
The electron density for the false structure was good enoughto rebuild individual dodecamers
almost to their final appearance in the actual course of structure determination. The new do-
decameric search model was sufficient for the MR to distinguish between the true and false
origins. However, the awareness of the possibility of false-origin solution might have simplified
this work dramatically and would have saved time spent in attempts to reduce theR-factor by
model improvement. The first step that should have been undertaken just after the MR was the
comparison of two rigid-body refinements, with the MR-modeland with the MR-model shifted
by (a + c)/4. Because of the high similarity between the search and the target proteins, it
seems likely that the correct model could have been identified at this earlier stage of structure
determination.
Further experiments with correction of symmetry usingZanuda(§4.3) showed that the se-
ries of refinements on alternative origins and space groups starting from the symmetrised model
do not necessarily succeed in indicating the true structure. The same effect could be expected
for a poor MR-model and, therefore, some rebuilding and refinement of false-origin structure
could be a necessary step in identification of the correct structure. The experience with the
anti-TRAP structure solution demonstrated that such modelrebuilding and refinement are fea-
sible. Moreover, the refinement can be performed against thereduced data corresponding to the
pseudosymmetry space group with a smaller unit cell (Oksanen et al., 2006,§1.1.15).
161
4.2 Structure solution of GAF domain of CodY
CodY protein fromBacillus subtiliswas studied in the group of Professor Anthony Wilkinson
(YSBL). The crystals of the GAF (N-terminal) domain of CodY in the apo form were grown,
and the structure solved by Dr. Elena Blagova and Dr. Vladimir Levdikov (PDB code 2gx5;
Levdikov et al., 2009). I helped with the correction of symmetry and used this structure in
further false-origin related tests.
In this case there were two possible space groups with two alternative origins in each. The
correct structure was established by rigid body refinement in P1 followed by merging the refined
structure relative to the two-fold rotations giving the smallest r.m.s.d. over Cα atoms. More
details are given in§4.2.3.
This section presents details of the structure determination and the discussion on possible
approaches to the structure correction: refinements in candidate groups and origins starting from
the symmetrised structure, and MR with the dimeric and single subunit search models. The
discussion is illustrated by drawings demonstrating the location of symmetry elements in four
alternative structures.
4.2.1 Background
The crystal of the apo CodY GAF-domain belonged to the space group P4322 with unit cell
dimensionsa = 90.2 andc = 205.6 A and diffracted to 1.74A. The crystal had translational
pseudosymmetry with translation vectorc/2 and the r.m.s.d. over the related Cα atoms 1.8A.
The asymmetric unit contained four subunits.
The initial MR solution for the apo CodY GAF-domain crystal structure was found by Dr.
Vladimir Levdikov. Search models were generated from the crystal structure of the CodY GAF-
domain in complex with isoleucine (PDB code 2b18; Levdikovet al., 2006).
The asymmetric unit of the holo-structure contained one subunit, which formed a dimer with
a symmetry related molecule. After the solution of the apo-form, it was found that the dimers
in the holo and apo structures were topologically identical, however, the relative orientations of
subunits in the two dimers differed by 14o. As a result, an attempt to solve the crystal structure
of the apo form using the holo-dimer as a search model had failed.
The MR using a single subunit was successful, but it was not a trivial task because the apo
and holo forms of the protein had significant conformationaldifferences and, in addition, even
the complete subunit comprised only a quarter of the asymmetric unit in the crystal of the apo
form. Various options ofMOLREPwere tried with different truncated versions of the subunit.
One of the MR runs inP4122 gave a structure formed by dimers topologically similar to dimers
in the holo structure. A significant drop ofRfree during the initial refinement withREFMACand
162
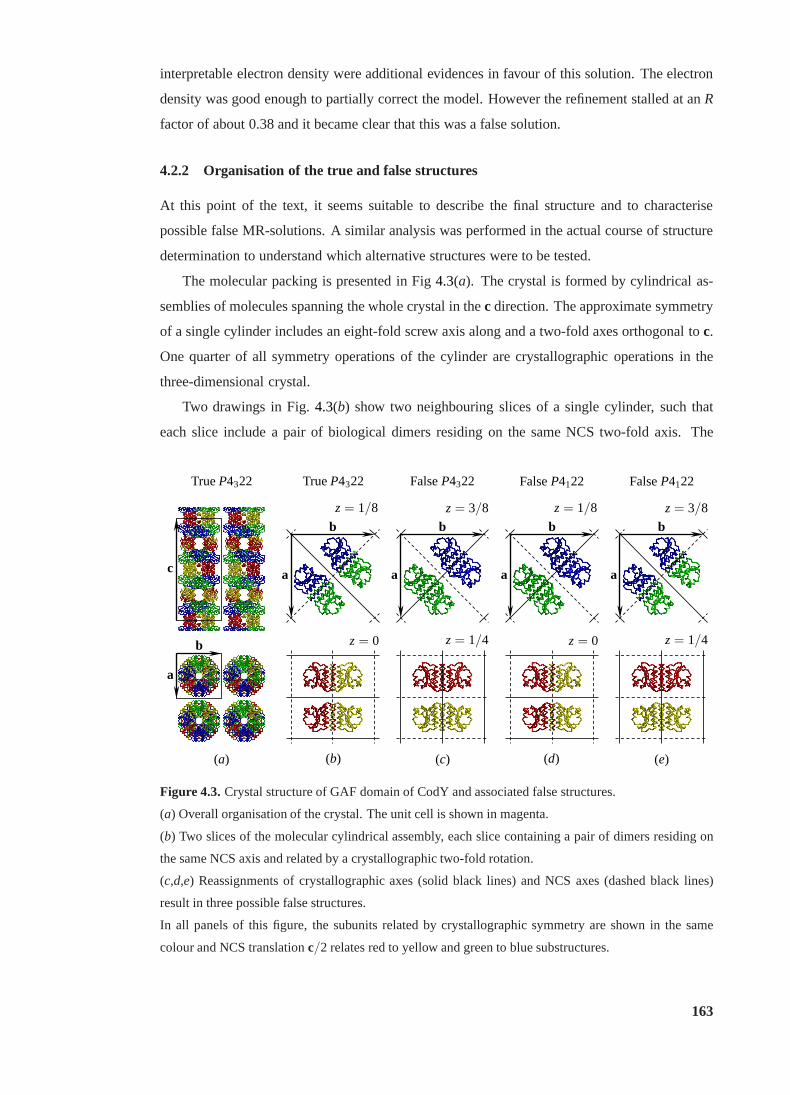
interpretable electron density were additional evidencesin favour of this solution. The electron
density was good enough to partially correct the model. However the refinement stalled at anR
factor of about 0.38 and it became clear that this was a false solution.
4.2.2 Organisation of the true and false structures
At this point of the text, it seems suitable to describe the final structure and to characterise
possible false MR-solutions. A similar analysis was performed in the actual course of structure
determination to understand which alternative structureswere to be tested.
The molecular packing is presented in Fig4.3(a). The crystal is formed by cylindrical as-
semblies of molecules spanning the whole crystal in thec direction. The approximate symmetry
of a single cylinder includes an eight-fold screw axis alongand a two-fold axes orthogonal toc.
One quarter of all symmetry operations of the cylinder are crystallographic operations in the
three-dimensional crystal.
Two drawings in Fig.4.3(b) show two neighbouring slices of a single cylinder, such that
each slice include a pair of biological dimers residing on the same NCS two-fold axis. The
(a) (b) (c) (d) (e)
a
aaaa
b
b b b b
c
z = 0 z = 0
z = 1/8 z = 1/8
z = 1/4 z = 1/4
z = 3/8 z = 3/8
TrueP4322TrueP4322 FalseP4322 FalseP4122 FalseP4122
Figure 4.3.Crystal structure of GAF domain of CodY and associated falsestructures.
(a) Overall organisation of the crystal. The unit cell is shownin magenta.
(b) Two slices of the molecular cylindrical assembly, each slice containing a pair of dimers residing on
the same NCS axis and related by a crystallographic two-foldrotation.
(c,d,e) Reassignments of crystallographic axes (solid black lines) and NCS axes (dashed black lines)
result in three possible false structures.
In all panels of this figure, the subunits related by crystallographic symmetry are shown in the same
colour and NCS translationc/2 relates red to yellow and green to blue substructures.
163
dimers in the pair are related by the crystallographic two-fold axis in the plane of the drawing
and by the NCS two-fold axis orthogonal to this plane. The adjacent pairs of dimers are rotated
relative each other by 45o. Thus the crystallographic axis makes a half-turn by the fifth pair, so
the first and the fifth pairs are related by an NCS translation of c/2 and eight pairs span the unit
cell.
Letting the axes in the bottom drawing of Fig4.3(b) exchange their crystallographic nature,
i.e. letting the crystallographic axes become NCS andvice versa, results in a different structure
shown in Fig4.3(e), which however would have the same unit cell parameters andpseudosym-
metry space group as the original structure. All structuresrelated by such permutations of the
crystallographic and NCS axes can be enumerated by considering two adjacent pairs of dimers,
as the crystallographic axes relating the subunits in thesepairs (plus translationa) are genera-
tors of the space group. Two possibilities for each of two pairs result in four possible structures
belonging to two different space groupsP4122 andP4322 (Figs.4.3b-e). The origin for a given
combination of crystallographic axes is defined by the standard setting of the corresponding
space group.
Therefore, similarly to the anti-TRAP case, the presence oftranslational pseudosymmetry in
this example creates a potential for false MR-solutions. Inparticular, a false-origin MR-solution
is possible in the trueP4322 space group (Fig.4.3c). In addition, two false MR-solutions are
possible in the enantiomorphic space groupP4122 (Figs.4.3d and4.3e). A particular solution
can be identified by the crystallographic nature of the two-fold axes relating the subunits in the
biological dimers. In practice this can be done by examiningthe four subunits forming the asym-
metric unit using molecular graphics,e.g. Coot. The number of subunits making the biological
dimer with their own symmetry equivalents and, if this number equals two, the orientations of
such subunits uniquely define one of the four possible structures shown in Fig.4.3, where this
number equals zero, four, two and two in (b), (c), (d) and (e), respectively. Such an analysis was
used to identify the solutions obtained in the test MR runs.
4.2.3 Structure correction using refinement inP1
Rigid body refinement in theP1 space group followed by the restoration of the higher symmetry
seemed a promising technique from the point of view of automation of the false structure cor-
rection in the general case. Therefore, this method was usedin the actual course of the structure
solution of the CodY GAF-domain.
The P4122 model and the data were transformed into a smaller unit cell (c′ = c/2, space
groupP4222) to produce a synthetic structure, in which all the axes shown in Fig.4.3(b) (both
crystallographic and NCS) were crystallographic. The nextstep was restrained refinement of
164
the synthetic structure. This was done to eliminate influence of wrong crystallographic con-
straints,i.e. to move the structure away from the local minimum of the falsesolution, towards
the structure, which equally well matches all four alternative structures (Figs.4.3b-e).
The refined structure was expanded intoP1 with correct cell dimensions and rigid body
refinement was performed to drop theR-factor from 0.64 to 0.38. After that, the potential crys-
tallographic axes (Fig.4.3) were tested by visual inspection of the overlap between thestructure
and the copy rotated by the tested operation. The transformations were performed by match-
ing two subunits usingLSQKAB(Collaborative Computational Project, Number 4, 1994).Coot
(Emsley & Cowtan, 2004) was used to visualise overlapping structures. The axes giving the
best overlap (visually this overlap was almost exact) suggested the organisation of the crystal
as illustrated in Figs.4.3(a) and4.3(b). The redundant molecules were removed and the new
structure was transformed into and further refined in the space groupP4322.
In effect, the method used here allowed testing of more than the four alternative structures
shown in Fig.4.3. It also ruled out the possibility of lower symmetry and twinning, which
was hard to reject with confidence from the twinning tests likely affected by pseudosymmetry.
This was done at the expense of some extra manual work at the stage of testing the potential
crystallographic operations, but this was an acceptable price for the confidence in the correct
symmetry assignment.
4.2.4 Structure correction using the MR with a dimeric model
It is typical to start the MR trials from the available oligomeric models. In this particular case,
the trials with the holo-dimer failed owing to significant conformational differences between
the holo- and apo-dimers. Interestingly if these attempts were successful, the correct structure
would be found and the potential problem with the false MR-solution would not be noticed.
Indeed, the only configuration in which the asymmetric unit can be assembled from complete
dimers is the correct one shown in Fig4.3(b). Furthermore, a dimer from the refined false-origin
structure could have been used as a search model. InP4322 it gave a CC of 0.45 for the correct
structurevs. the second best CC of 0.32, whereas inP4122 the best CC was 0.35. Note, however,
that such high contrast is only because of the packing constraints and it would have arisen even
if the configuration in Fig.4.3(b) were incorrect. Had the correct configuration been any other
than that in Fig.4.3(b), such an approach would only replace one false solution by another.
Because the CodY GAF-domain structure was a particularly difficult case for refinement owing
to high flexibility of the protein, it was important to have confidence in the symmetry and origin
assignment, but this could not be gained with this method.
165
In general, the presence of translational pseudosymmetry makes any oligomeric search mod-
els vulnerable to false MR-solutions. If such model is used as a search MR-model, then space
group or origin correction may need to be considered at some point of structure refinement.
The crystal structure of human deoxycytidine kinase (§1.2.3, Elisabetta Sabini, personal com-
munication) is an example of a crystal with pseudotranslation, in which two of four symmetry-
independent subunits form a single dimer and two other subunits form dimers with their symme-
try mates, so a configuration with two complete dimers in the asymmetric unit must be a false
structure.
Note, however, that in the case of anti-TRAP (§4.1), the asymmetric unit of the pseudosym-
metry space group contained two complete dodecamers and theuse of dodecameric search
model derived from the refined false-origin structure in thesecond round of the MR was a
valid procedure in the sense that it did nota priori reject any of the possible configurations.
Moreover, even if one of the two-fold axes of the dodecamer were aligned with the crystallo-
graphic two-fold axes, this procedure would remain valid, as long as the crystallographic axes
were screw axes. In other words, from the point of view of origin correction, the MR-search
with the dodecameric model in the case of anti-TRAP is the analogue of the MR-search with
a single-subunit model in the case of CodY GAF-domain. The problems associated with the
“single-subunit” search model are discussed below.
4.2.5 Structure correction using the MR with single-subunit model
Table4.1presents the results of the MR searches for the first copy of the CodY GAF-domain (no
fixed partial model) with two search models, a single subunitfrom the refined false structure and
subunit A from the final structure deposited in the PDB. Two runs ofMOLREPwere performed
for each model and for each of two possible space group, a run in the “single model” mode
and a run in the “double model” mode, which implicitly deals with the model composed of two
subunits related by NCS translation (§1.1.15). The position of the first found molecule relative to
the crystallographic axes defines the positions of the remaining molecules. Therefore, these data
are sufficient to identify which configuration is going to be found at the end of the one-by-one
MR search for four subunits.
It may seem strange that in the “single-model” search the best CC is higher inP4322 (0.273)
than inP4122 (0.253) for the search model refined in the incorrectP4122. However, these are
the correlations for the first subunit found, whereas the model refined inP4122 was complete
and contained four subunits. Moreover, the refined model waspartially rebuilt and was much
closer to the final than to initial model. The best CC for the complete MR solutions was almost
the same in the two space groups (0.458 inP4322 vs. 0.457 inP4122) because both solutions
166
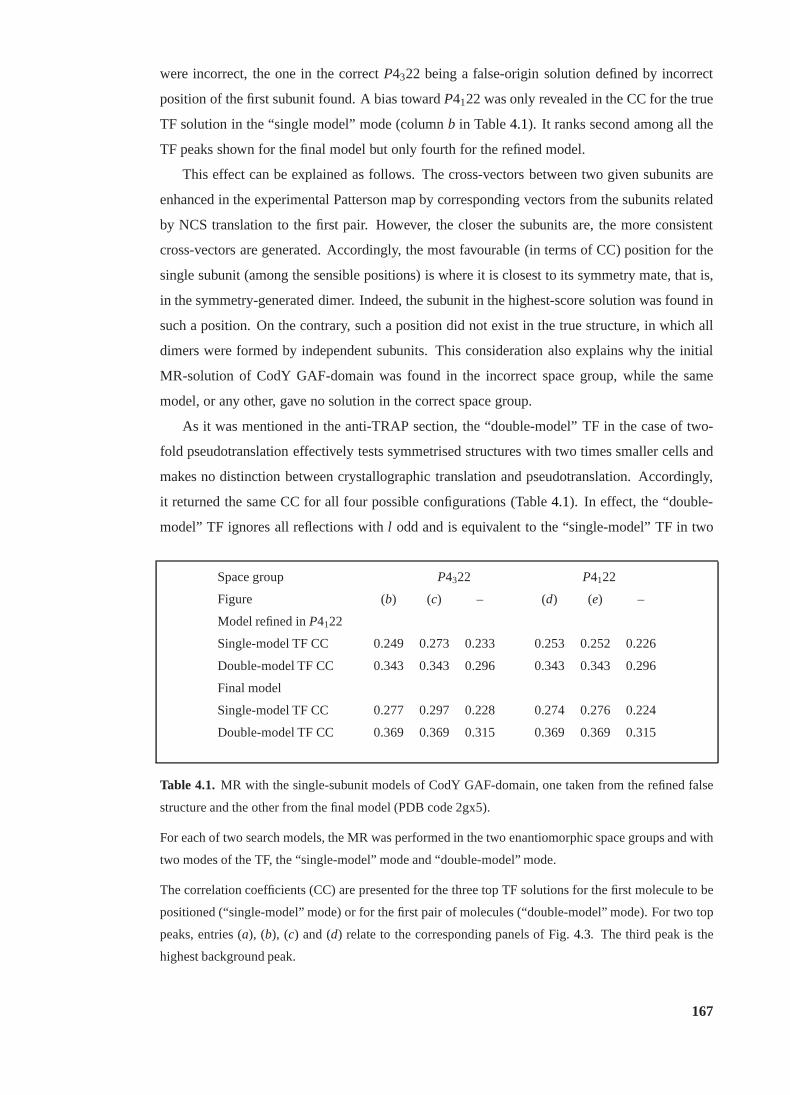
were incorrect, the one in the correctP4322 being a false-origin solution defined by incorrect
position of the first subunit found. A bias towardP4122 was only revealed in the CC for the true
TF solution in the “single model” mode (columnb in Table4.1). It ranks second among all the
TF peaks shown for the final model but only fourth for the refined model.
This effect can be explained as follows. The cross-vectors between two given subunits are
enhanced in the experimental Patterson map by corresponding vectors from the subunits related
by NCS translation to the first pair. However, the closer the subunits are, the more consistent
cross-vectors are generated. Accordingly, the most favourable (in terms of CC) position for the
single subunit (among the sensible positions) is where it isclosest to its symmetry mate, that is,
in the symmetry-generated dimer. Indeed, the subunit in thehighest-score solution was found in
such a position. On the contrary, such a position did not exist in the true structure, in which all
dimers were formed by independent subunits. This consideration also explains why the initial
MR-solution of CodY GAF-domain was found in the incorrect space group, while the same
model, or any other, gave no solution in the correct space group.
As it was mentioned in the anti-TRAP section, the “double-model” TF in the case of two-
fold pseudotranslation effectively tests symmetrised structures with two times smaller cells and
makes no distinction between crystallographic translation and pseudotranslation. Accordingly,
it returned the same CC for all four possible configurations (Table4.1). In effect, the “double-
model” TF ignores all reflections withl odd and is equivalent to the “single-model” TF in two
Space group P4322 P4122
Figure (b) (c) – (d) (e) –
Model refined inP4122
Single-model TF CC 0.249 0.273 0.233 0.253 0.252 0.226
Double-model TF CC 0.343 0.343 0.296 0.343 0.343 0.296
Final model
Single-model TF CC 0.277 0.297 0.228 0.274 0.276 0.224
Double-model TF CC 0.369 0.369 0.315 0.369 0.369 0.315
Table 4.1. MR with the single-subunit models of CodY GAF-domain, one taken from the refined false
structure and the other from the final model (PDB code 2gx5).
For each of two search models, the MR was performed in the two enantiomorphic space groups and with
two modes of the TF, the “single-model” mode and “double-model” mode.
The correlation coefficients (CC) are presented for the three top TF solutions for the first molecule to be
positioned (“single-model” mode) or for the first pair of molecules (“double-model” mode). For two top
peaks, entries (a), (b), (c) and (d) relate to the corresponding panels of Fig.4.3. The third peak is the
highest background peak.
167
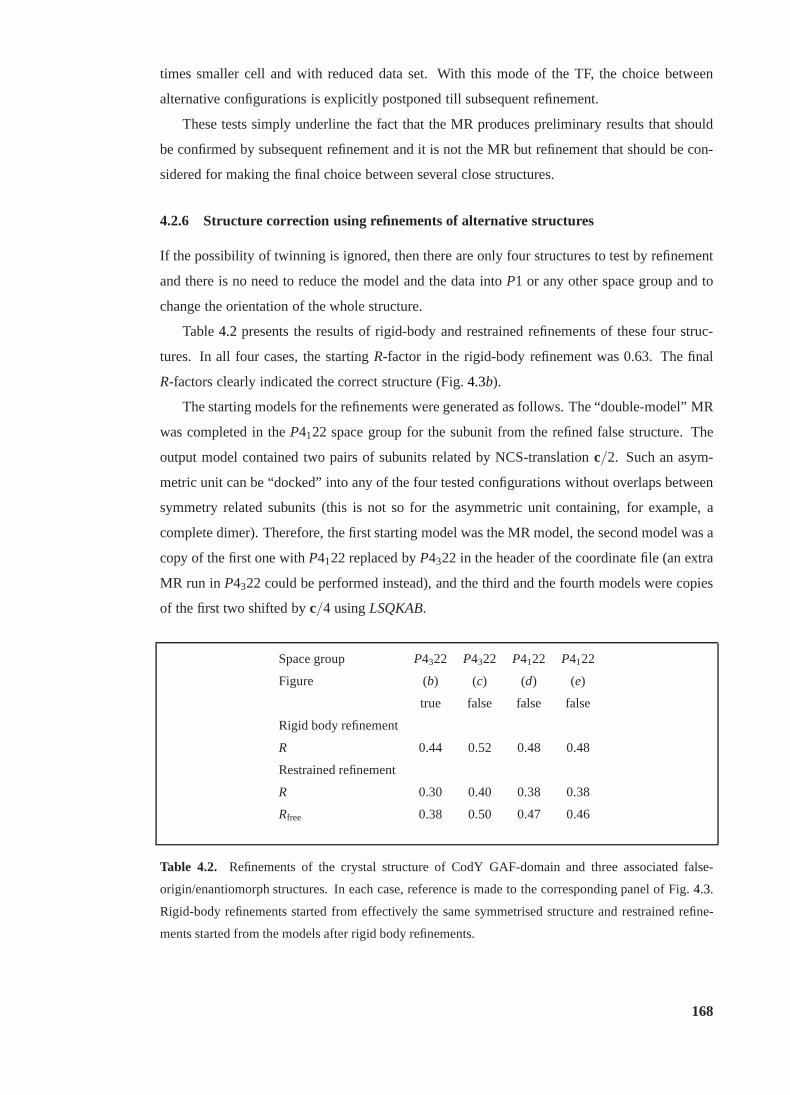
times smaller cell and with reduced data set. With this mode of the TF, the choice between
alternative configurations is explicitly postponed till subsequent refinement.
These tests simply underline the fact that the MR produces preliminary results that should
be confirmed by subsequent refinement and it is not the MR but refinement that should be con-
sidered for making the final choice between several close structures.
4.2.6 Structure correction using refinements of alternative structures
If the possibility of twinning is ignored, then there are only four structures to test by refinement
and there is no need to reduce the model and the data intoP1 or any other space group and to
change the orientation of the whole structure.
Table4.2 presents the results of rigid-body and restrained refinements of these four struc-
tures. In all four cases, the startingR-factor in the rigid-body refinement was 0.63. The final
R-factors clearly indicated the correct structure (Fig.4.3b).
The starting models for the refinements were generated as follows. The “double-model” MR
was completed in theP4122 space group for the subunit from the refined false structure. The
output model contained two pairs of subunits related by NCS-translationc/2. Such an asym-
metric unit can be “docked” into any of the four tested configurations without overlaps between
symmetry related subunits (this is not so for the asymmetricunit containing, for example, a
complete dimer). Therefore, the first starting model was theMR model, the second model was a
copy of the first one withP4122 replaced byP4322 in the header of the coordinate file (an extra
MR run in P4322 could be performed instead), and the third and the fourth models were copies
of the first two shifted byc/4 usingLSQKAB.
Space group P4322 P4322 P4122 P4122
Figure (b) (c) (d) (e)
true false false false
Rigid body refinement
R 0.44 0.52 0.48 0.48
Restrained refinement
R 0.30 0.40 0.38 0.38
Rfree 0.38 0.50 0.47 0.46
Table 4.2. Refinements of the crystal structure of CodY GAF-domain and three associated false-
origin/enantiomorph structures. In each case, reference is made to the corresponding panel of Fig.4.3.
Rigid-body refinements started from effectively the same symmetrised structure and restrained refine-
ments started from the models after rigid body refinements.
168
This protocol is easy for both manual implementation and automation, as the asymmetric
unit is neither expanded nor reduced and its orientation remains the same in the tested structures.
However, the automated procedure of symmetry correction may need to be more general and
able to deal with pseudosymmetric twins and to restore the crystallographic symmetry of a
structure refined in lower space group.
4.2.7 Concluding remarks
The cases of anti-TRAP, CodY GAF-domain and UDP-glucose 4-epimerase (PDB code 2c20;
Au et al., 2006, not included in this thesis), as well as the examples of incorrect space group
assignment from the PDB (§3.2.4) suggested that a program that would automatically verify the
symmetry and origin assignments and correct them if necessary might be useful.
The method of structure correction that involved refinementin P1 performed well in the
cases of CodY GAF-domain and UDP-glucose 4-epimerase and seemed suitable for a variety
of pseudosymmetry cases and for cases with incorrectly assigned space group. In effect, this
approach allows evaluation of all possible subgroups of thepseudosymmetry space group, so,
in particular, it is able to distinguish between pseudosymmetry interfering with twinning and
higher symmetry, as well as between true and false origins. The automation of this approach
required a program determining (pseudo)symmetry space group of the structure defined inP1
and evaluating potential crystallographic operations in such a structure. Such a program was
written and is discussed in the next section.
169
4.3 Zanuda, a program for symmetry validation and correction
The programZanudapresented in this section is designed to validate and correct symmetry and
origin assignments. It was developed in the group of Dr. Murshudov (YSBL); I wrote theFOR-
TRANroutines and combined them with atcsh-script, and Dr. Paul Young developed aJava-
interface for the YSBL-software web-server (http://www.ysbl.york.ac.uk/YSBLPrograms/).
Three types of target cases are characterised, then the current version of the program is
demonstrated using the test cases of CodY GAF-domain (§4.2) and, finally, some technical
details of the program and possible improvements are discussed.
4.3.1 Target cases
The first class of cases thatZanudais designed for includes the structures with translational
pseudosymmetry, such as anti-TRAP (§4.1) and the CodY GAF-domain (§4.2), in which false
MR-solutions are possible with the same point group symmetry and unit cell parameters as in
the true structure. The warning signs are highR-factor and the presence of significant peaks in
the Patterson map corresponding to a rational fraction of crystallographic translation.
The untwinned cases with incorrectly assigned lower symmetry constitute the second target
class. A large number of such cases were found during the search for twins in the PDB using
RvR scatter plot (§3.2.4). This type of mistake does not affect significantly and may even slightly
improve the refinement statistics. One of the reasons for such mistakes is that highR-factors
from a false-origin MR solution has been erroneously interpreted as an indication of twinning.
The third class includes twinned cases with interfering NCSand with an incorrectly as-
signed higher symmetry. An example is presented in the next section (§4.4), the crystal structure
analysis of oxidoreductase fromThermotoga maritima.
4.3.2 Zanuda run with test case
The pseudosymmetry operation is a global operation on a given structure, which matches related
molecules with a high accuracy but not exactly. The pseudosymmetry space group (PSSG) of a
given structure is a space group that includes all exact symmetry operations and all pseudosym-
metry operations on the structure.
For example, the crystal structure of the GAF-domain of CodY(§4.2) belongs to the space
groupP4322 witha = 90.2 andc = 205.6 A. The PSSG is generated by pseudotranslationc/2.
Therefore the PSSG isP4222 with the samea as in the true space group andc halved.
Zanudahandles a set of subgroups of the PSSG (details are in§4.3.3). Different subgroups
may belong to the same abstract space group and are thereforeassigned an internal reference
number. In the current example, the PSSG has Ref 35 (Figs.4.4and 4.5).
170
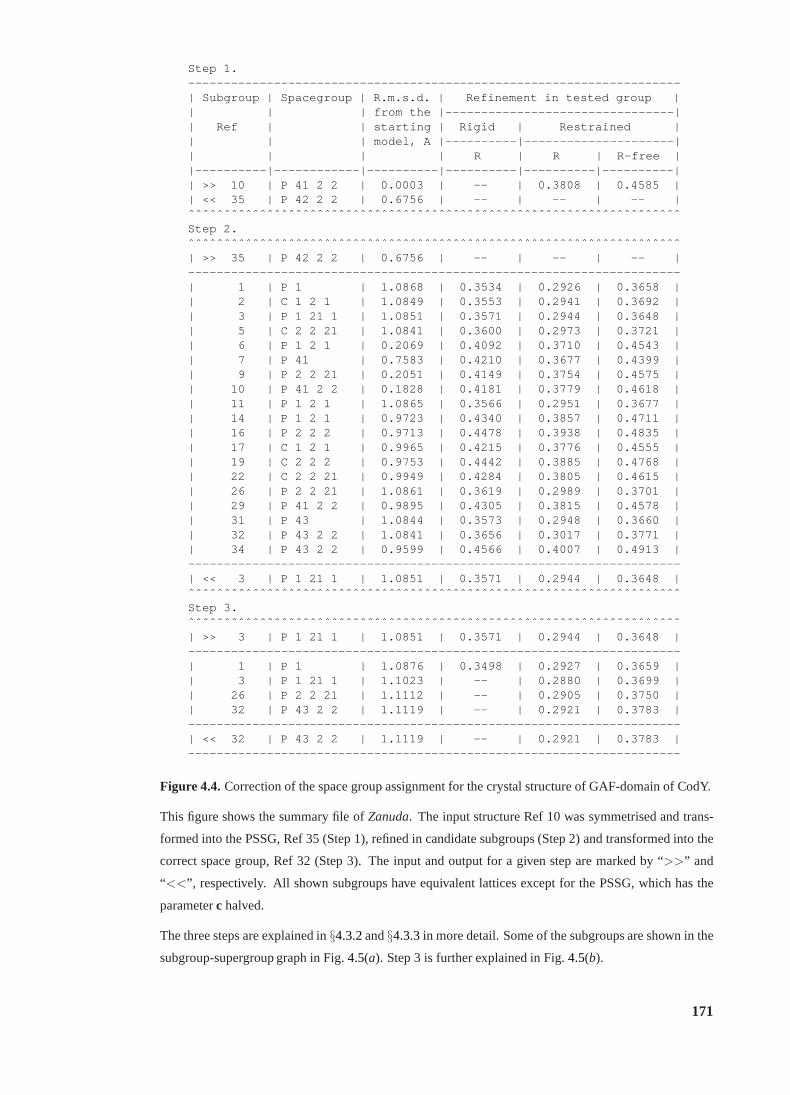
Step 1.-------------------------------------- ------------------------------ -| Subgroup | Spacegroup | R.m.s.d. | Refinement in tested group || | | from the |--------------------------------|| Ref | | starting | Rigid | Restrained || | | model, A |----------|---------------------|| | | | R | R | R-free ||----------|------------|----------|-- --------|----------|---------- || >> 10 | P 41 2 2 | 0.0003 | -- | 0.3808 | 0.4585 || << 35 | P 42 2 2 | 0.6756 | -- | -- | -- |ˆˆˆˆˆˆˆˆˆˆˆˆˆˆˆˆˆˆˆˆˆˆˆˆˆˆˆˆˆˆˆˆˆˆˆˆˆˆ ˆˆˆˆˆˆˆˆˆˆˆˆˆˆˆˆˆˆˆˆˆˆˆˆˆˆˆˆˆˆ ˆStep 2.ˆˆˆˆˆˆˆˆˆˆˆˆˆˆˆˆˆˆˆˆˆˆˆˆˆˆˆˆˆˆˆˆˆˆˆˆˆˆ ˆˆˆˆˆˆˆˆˆˆˆˆˆˆˆˆˆˆˆˆˆˆˆˆˆˆˆˆˆˆ ˆ| >> 35 | P 42 2 2 | 0.6756 | -- | -- | -- |-------------------------------------- ------------------------------ -| 1 | P 1 | 1.0868 | 0.3534 | 0.2926 | 0.3658 || 2 | C 1 2 1 | 1.0849 | 0.3553 | 0.2941 | 0.3692 || 3 | P 1 21 1 | 1.0851 | 0.3571 | 0.2944 | 0.3648 || 5 | C 2 2 21 | 1.0841 | 0.3600 | 0.2973 | 0.3721 || 6 | P 1 2 1 | 0.2069 | 0.4092 | 0.3710 | 0.4543 || 7 | P 41 | 0.7583 | 0.4210 | 0.3677 | 0.4399 || 9 | P 2 2 21 | 0.2051 | 0.4149 | 0.3754 | 0.4575 || 10 | P 41 2 2 | 0.1828 | 0.4181 | 0.3779 | 0.4618 || 11 | P 1 2 1 | 1.0865 | 0.3566 | 0.2951 | 0.3677 || 14 | P 1 2 1 | 0.9723 | 0.4340 | 0.3857 | 0.4711 || 16 | P 2 2 2 | 0.9713 | 0.4478 | 0.3938 | 0.4835 || 17 | C 1 2 1 | 0.9965 | 0.4215 | 0.3776 | 0.4555 || 19 | C 2 2 2 | 0.9753 | 0.4442 | 0.3885 | 0.4768 || 22 | C 2 2 21 | 0.9949 | 0.4284 | 0.3805 | 0.4615 || 26 | P 2 2 21 | 1.0861 | 0.3619 | 0.2989 | 0.3701 || 29 | P 41 2 2 | 0.9895 | 0.4305 | 0.3815 | 0.4578 || 31 | P 43 | 1.0844 | 0.3573 | 0.2948 | 0.3660 || 32 | P 43 2 2 | 1.0841 | 0.3656 | 0.3017 | 0.3771 || 34 | P 43 2 2 | 0.9599 | 0.4566 | 0.4007 | 0.4913 |-------------------------------------- ------------------------------ -| << 3 | P 1 21 1 | 1.0851 | 0.3571 | 0.2944 | 0.3648 |ˆˆˆˆˆˆˆˆˆˆˆˆˆˆˆˆˆˆˆˆˆˆˆˆˆˆˆˆˆˆˆˆˆˆˆˆˆˆ ˆˆˆˆˆˆˆˆˆˆˆˆˆˆˆˆˆˆˆˆˆˆˆˆˆˆˆˆˆˆ ˆStep 3.ˆˆˆˆˆˆˆˆˆˆˆˆˆˆˆˆˆˆˆˆˆˆˆˆˆˆˆˆˆˆˆˆˆˆˆˆˆˆ ˆˆˆˆˆˆˆˆˆˆˆˆˆˆˆˆˆˆˆˆˆˆˆˆˆˆˆˆˆˆ ˆ| >> 3 | P 1 21 1 | 1.0851 | 0.3571 | 0.2944 | 0.3648 |-------------------------------------- ------------------------------ -| 1 | P 1 | 1.0876 | 0.3498 | 0.2927 | 0.3659 || 3 | P 1 21 1 | 1.1023 | -- | 0.2880 | 0.3699 || 26 | P 2 2 21 | 1.1112 | -- | 0.2905 | 0.3750 || 32 | P 43 2 2 | 1.1119 | -- | 0.2921 | 0.3783 |-------------------------------------- ------------------------------ -| << 32 | P 43 2 2 | 1.1119 | -- | 0.2921 | 0.3783 |-------------------------------------- ------------------------------ -
Figure 4.4.Correction of the space group assignment for the crystal structure of GAF-domain of CodY.
This figure shows the summary file ofZanuda. The input structure Ref 10 was symmetrised and trans-
formed into the PSSG, Ref 35 (Step 1), refined in candidate subgroups (Step 2) and transformed into the
correct space group, Ref 32 (Step 3). The input and output fora given step are marked by “>>” and
“<<”, respectively. All shown subgroups have equivalent lattices except for the PSSG, which has the
parameterc halved.
The three steps are explained in§4.3.2and§4.3.3in more detail. Some of the subgroups are shown in the
subgroup-supergroup graph in Fig.4.5(a). Step 3 is further explained in Fig.4.5(b).
171
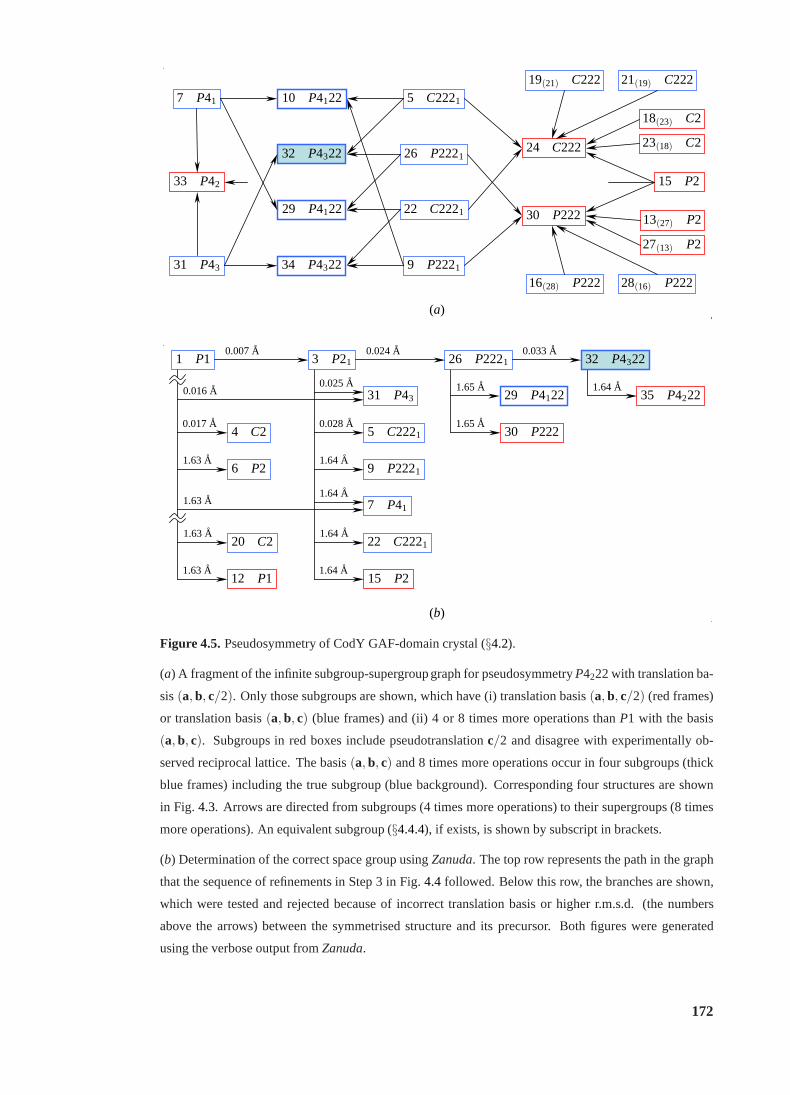
1 P1
4 C2
6 P2
20 C2
12 P1
3 P21
31 P43
5 C2221
9 P2221
7 P41
22 C2221
15 P2
26 P2221
29 P4122
30 P222
32 P4322
35 P4222
0.007A
0.016A
0.017A
1.63A
1.63A
1.63A
1.63A
0.024A
0.025A
0.028A
1.64A
1.64A
1.64A
1.64A
0.033A
1.65A
1.65A
1.64A
(b)
7 P41
33 P42
31 P43
10 P4122
32 P4322
29 P4122
34 P4322
5 C2221
26 P2221
22 C2221
9 P2221
19(21) C222
24 C222
30 P222
16(28) P222
21(19) C222
18(23) C2
23(18) C2
15 P2
13(27) P2
27(13) P2
28(16) P222
(a)
Figure 4.5.Pseudosymmetry of CodY GAF-domain crystal (§4.2).
(a) A fragment of the infinite subgroup-supergroupgraph for pseudosymmetryP4222 with translation ba-
sis(a, b, c/2). Only those subgroups are shown, which have (i) translationbasis(a, b, c/2) (red frames)
or translation basis(a, b, c) (blue frames) and (ii) 4 or 8 times more operations thanP1 with the basis
(a, b, c). Subgroups in red boxes include pseudotranslationc/2 and disagree with experimentally ob-
served reciprocal lattice. The basis(a, b, c) and 8 times more operations occur in four subgroups (thick
blue frames) including the true subgroup (blue background). Corresponding four structures are shown
in Fig. 4.3. Arrows are directed from subgroups (4 times more operations) to their supergroups (8 times
more operations). An equivalent subgroup (§4.4.4), if exists, is shown by subscript in brackets.
(b) Determination of the correct space group usingZanuda. The top row represents the path in the graph
that the sequence of refinements in Step 3 in Fig.4.4 followed. Below this row, the branches are shown,
which were tested and rejected because of incorrect translation basis or higher r.m.s.d. (the numbers
above the arrows) between the symmetrised structure and itsprecursor. Both figures were generated
using the verbose output fromZanuda.
172
The protocol for correction of the space group assignment isdemonstrated using the crys-
tal structure of GAF-domain of CodY. The input model was the false-enantiomorph structure
(Fig. 4.3e). The protocol included three steps (Figs.4.4and 4.5).
Several actions on the input model were performed at Step 1. In particular, the PSSG was
identified and the space group of the input model was assigned(Ref 10). In this particular case
the input model was not truncated as it contained identical subunits and no solvent. Manipu-
lations with the input model in a general case are discussed in §4.3.3. TheR andRfree for the
input model (modified in a general case) were reported as a reference, to be compared with the
final R-factors. The model was transformed by the operations from the PSSG and the coordi-
nates of related atoms were averaged to generate a symmetrised model belonging to the PSSG
(Ref 35). The r.m.s.d. over Cα atoms (these would be P-atoms for the DNA chains) between the
symmetrised and input models was reported. The X-ray data were expanded into point group 1.
Step 2 was a series of refinements in selected subgroups of thePSSG. Two selection criteria
were applied. A subgroup was selected, if (i) it had the same translational basis as the input
model and (ii) was not equivalent to a previously selected subgroup relative to the actual point
group of the data. The first criterion ensured that the translational crystallographic symmetry of
the model agreed with the experimentally observed one, see Figs. 4.4 and4.5. (Therefore the
PSSG is the only subgroup shown in Figs.4.4 that has a reduced cell.) The second selection
criterion was used to reject redundant subgroups (details are in §4.4.4). In all refinements, the
starting models were generated by expansion of the symmetrised model into lower-symmetry
space group and therefore were internally identical. The X-ray data expanded at Step 1 were re-
duced into the asymmetric unit of the corresponding point group by averaging related intensities.
The protocol of twelve cycles of rigid body refinement against 3 A resolution data and 24 cy-
cles of restrained refinement against all data had been adopted after tests with several structures
selected from the PDB.
The structure with the bestRfree in Step 2 (Ref 3) was selected for Step 3. It was expanded
into P1, refined and symmetry elements were added one by one with a round of refinements
after each addition. The symmetry operation to be added nextwas one of the operations unused
in the last refined structure. The selection criterion was the minimum r.m.s.d. over Cα atoms
between the refined structure and its copy transformed by thetested operation. The sequence
of refinements was terminated when no symmetry element couldbe added without reducing the
size of the unit cell. As an illustration, Step 3 for the CodY GAF-domain structure is presented
in Fig. 4.5(b) as a path in the subgroup-supergroup graph. The result of Step 3 was a sequence
of subgroups, each of them scored byRfree after rigid body and then restrained refinements. A
large jump inRfree would indicate that selection of the next subgroup in the sequence was not
justified and its precursor would be accepted as the likely true space group of the structure in
173
question. If no jump inRfree occurred (Fig.4.4), the last subgroup in the sequence was accepted.
There were several structures in Step 2 givingRfree very similar to the best value (Ref 3).
However, this ambiguity is not a problem, as all these structures belonged to subgroups of the
true space group (Ref 32) and any of them would have given the correct solution in Step 3. The
actual problem is to have at least one structure converged tothe right minimum (§4.3.4).
4.3.3 Preparation and transformations of the model
Step 1 in Fig.4.4 includes modification of input model and definition of the PSSG, all its sub-
groups and transformations between the subgroups. In orderto clearly define the asymmetric
units of the subgroups and transformations between them, the model is truncated to a set of com-
pact and chemically identical subunits composed of one or more polypeptide or DNA chains.
These subunits are also treated as rigid groups in rigid bodyrefinements. The PSSG is defined
to include all operations of the crystal space group and the NCS operations satisfying the limit
of 3 A for the r.m.s.d. between the modified model and its pseudosymmetry-related copy. This
limit was chosen based on the expected radius of convergenceof rigid body refinement. These
procedures are described below in more detail.
In particular, paragraphs (i) and (ii) below describe a model modification procedure which
allows handling of input models comprising identical chains with different gaps, hetero-oligomers
composed of two or more different chains as in the twinned pseudosymmetric PDB entry 1upp,
as well as theSHELXLoutput, in which the chains are defined by gaps in residue numbering,
not by chain identifiers. With minor modification, the described algorithm is suitable for han-
dling ligands if present, but this option has not yet been implemented. Further development may
include merging subunits into oligomers to define biologically sensible asymmetric units in the
subgroups of the PSSG. Subsequent paragraphs explain determination of (iii) the PSSG, (iv) its
subgroups and, for all of them, (v) the space group names and transformations to the standard
settings. The last two paragraphs describe how the transformations between the subgroups are
(vi) stored and (vii) applied to a model belonging to a particular subgroup.
(i) The solvent and hydrogen atoms are removed before the total sequence of residues con-
stituting the asymmetric unit is aligned with itself using aslightly modified version of the al-
gorithm by Needleman & Wunsch (1970). The large off-diagonal values in the score matrix
indicate matching fragments of the total sequence. The total sequence is thus cut into segments
of several types, the segments of the same type having the same sequence of residues. Atoms
missing in one segment are also removed from the other segments of the same type. The atoms
belonging to the segments of a given type are counted. The segment type containing maximum
number of atoms is used as a reference type. If the number of segments belonging to any other
174
type is not the same as in the reference type, then all segments of this type are removed. At this
point, the numbers of segments in all the types are equal and the segments of the same type have
identical chemical composition.
(ii) The segments are merged into subunits using a clustering algorithm. The entities to
cluster are the types of identical segments. The reciprocaldistance between two types is the
number of identical interatomic contacts shorter than 3A made by all the pairs of correspond-
ing segments from the two types. (The correspondence between segments is also found using
clustering algorithm.) There could be more than one distance between two types owing to the
contacts with symmetry related segments. The shortest distance and corresponding symmetry
operations are used when two types and their segments are merged. Other distances are recalcu-
lated to include contacts with both precursors of the new joint type. At the end of this procedure,
all segment types are merged into a single type or into several types with no conserved contacts
between them. In the latter case, the type including the reference type is preserved, the others are
removed. At this point the atomic model consists of chemically identical and spatially compact
subunits, which can be used to define asymmetric unit of the PSSG and as rigid groups in rigid
body refinement.
(iii) The PSSG is defined as follows. The (approximate) rotational lattice symmetry is ex-
amined using the procedure described in§3.2.1. The coset decomposition of the rotational point
group of the lattice relative to the point group of the crystal is performed. The representatives
of the cosets are tested to find out if they are rotational components of the operations from the
PSSG. To check this, one copy of the structure is fixed and the second copy is rotated by the
representative operation and translated to best fit the fixedcopy. If there remain subunits in the
fixed structure having no counterpart in the moved structure, or the overall match between the
two structures is worse than the tolerance limit, the rotation operation is rejected. If the opera-
tion passes the test, it becomes an element of the PSSG with the translation component defined
during the test. When all representatives are tested, the set of operations is assembled containing
all operations of the input space group and the operations that passed the test. This set of opera-
tions is expanded to a group using multiplication, that is, if a product of two operations already
belongs to the set, then it is ignored, else it is added to the set. The resultant space group is the
PSSG.
(iv) The subgroup structure of the PSSG is represented as a table with rows representing
subgroups and columns representing elements of the PSSG (Table 4.3). An element expands a
subgroup to another subgroup. Accordingly, each table cellcontains the reference to a row. If
the cell refers to the row it belongs to, then the column represents an element of the subgroup
represented by the row. The table is generated starting fromthe first row representing subgroup
containing only the identity element (P1 with original unit cell parameters). The element and the
175
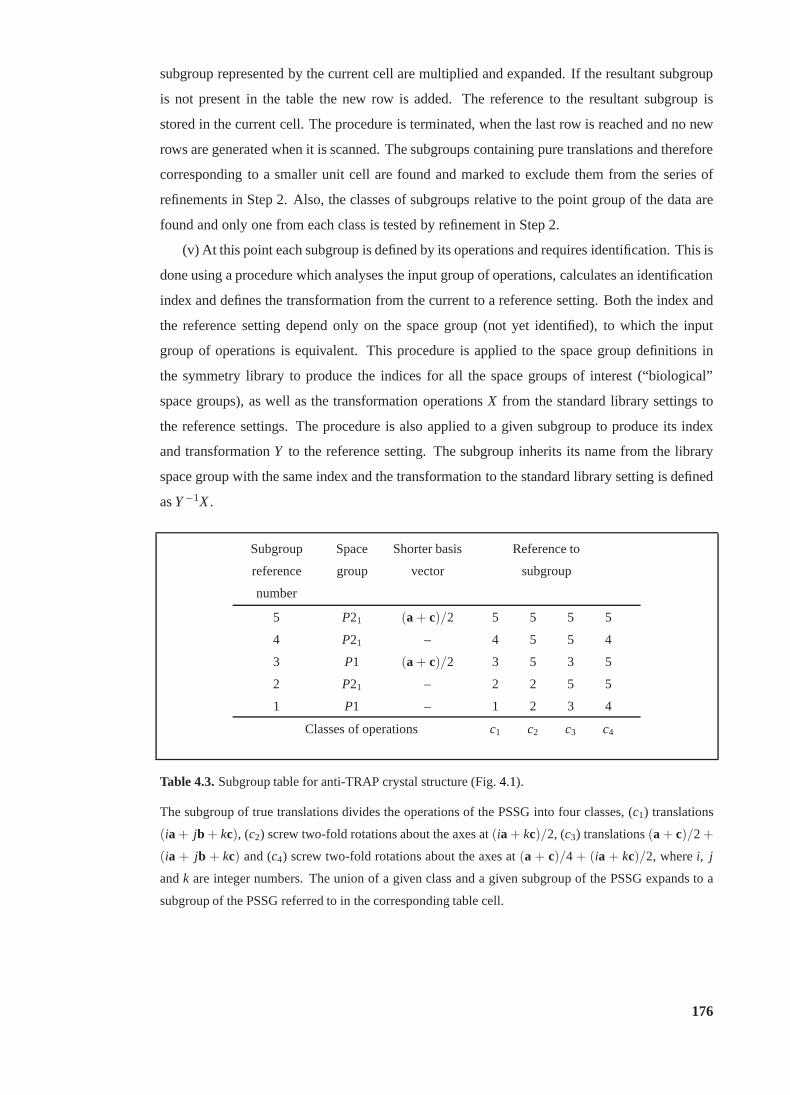
subgroup represented by the current cell are multiplied andexpanded. If the resultant subgroup
is not present in the table the new row is added. The referenceto the resultant subgroup is
stored in the current cell. The procedure is terminated, when the last row is reached and no new
rows are generated when it is scanned. The subgroups containing pure translations and therefore
corresponding to a smaller unit cell are found and marked to exclude them from the series of
refinements in Step 2. Also, the classes of subgroups relative to the point group of the data are
found and only one from each class is tested by refinement in Step 2.
(v) At this point each subgroup is defined by its operations and requires identification. This is
done using a procedure which analyses the input group of operations, calculates an identification
index and defines the transformation from the current to a reference setting. Both the index and
the reference setting depend only on the space group (not yetidentified), to which the input
group of operations is equivalent. This procedure is applied to the space group definitions in
the symmetry library to produce the indices for all the spacegroups of interest (“biological”
space groups), as well as the transformation operationsX from the standard library settings to
the reference settings. The procedure is also applied to a given subgroup to produce its index
and transformationY to the reference setting. The subgroup inherits its name from the library
space group with the same index and the transformation to thestandard library setting is defined
asY−1X.
Subgroup
reference
number
Space
group
Shorter basis
vector
Reference to
subgroup
5 P21 (a + c)/2 5 5 5 5
4 P21 – 4 5 5 4
3 P1 (a + c)/2 3 5 3 5
2 P21 – 2 2 5 5
1 P1 – 1 2 3 4
Classes of operations c1 c2 c3 c4
Table 4.3.Subgroup table for anti-TRAP crystal structure (Fig.4.1).
The subgroup of true translations divides the operations ofthe PSSG into four classes, (c1) translations
(ia + jb + kc), (c2) screw two-fold rotations about the axes at(ia + kc)/2, (c3) translations(a + c)/2 +
(ia + jb + kc) and (c4) screw two-fold rotations about the axes at(a + c)/4 + (ia + kc)/2, wherei, j
andk are integer numbers. The union of a given class and a given subgroup of the PSSG expands to a
subgroup of the PSSG referred to in the corresponding table cell.
176
(vi) The subgroups names and transformations to the standard setting are stored in an aux-
iliary file and can be accessed through the subgroup reference number. To simplify the trans-
formations between subgroups, the asymmetric units of all the subgroups are also defined in
advance; the PSSG operations, one per subunit, transforming the asymmetric unit ofP1 into the
asymmetric unit of given subgroup are stored in the auxiliary file. This approach also requires
that the subunits are stored in the coordinate files in a particular order. In addition, the asymmet-
ric units of all subgroups are made reasonably compact and located close to the origin to ensure
convenient representations in the graphical programs.
(vii) The routine that transforms the structures from one subgroup to the other has two
modes. In the first mode it reads two numbers, the “from” subgroup number and the “to”
subgroup number, the coordinate file corresponding to the “from” subgroup and the auxiliary
file. Using the transformations stored in the auxiliary file it expands the asymmetric unit intoP1
and then transforms each subunit into the equivalent position in the asymmetric unit of the “to”
subgroup. Coordinates of all subunits at the same position are averaged and the total r.m.s.d.
is reported. New coordinates are saved. In the second mode, the “to” subgroup number is not
defined, so the routine tests operations from the PSSG, whichare not present in the “from”
subgroup (actually it tests coset representatives), to findone giving the lowest r.m.s.d. between
the input and symmetrised structures. The “from” subgroup and this operation define the “to”
subgroup. If the required operation does not exist, then no output file is created. The first and
the second modes are used in Step 2 and Step 3 in Fig.4.4, respectively.
4.3.4 Starting model and refinements
In the first version ofZanuda, the input model was symmetrised (Step 1 in Fig.4.4) and refined in
a series of subgroups starting fromP1, the next subgroup being generated from the previous one
by the best scoring symmetry element (Step 3 in Fig.4.4). This protocol was replicated from the
protocol used for the manual correction of the CodY GAF-domain structure (§4.2.3). In the latter
case, starting from a symmetrised model was indeed necessary, otherwise refinement did not
escape from the local minima associated with the input falsestructure, even refinement with the
correct space group and origin. On the other hand, the symmetrised model could, in the general
case, be too far from the correct global minimum to reach the latter using refinement inP1.
This was observed in tests with the crystal structure of the glutaminase domain of glucosamine
6-phosphate synthase (Isupovet al., 1996). It was known for this structure that in the original
model (PDB code 1gdo) the space group was incorrectly assigned asP21 instead ofP212121,
and the symmetry assignment was later corrected (PDB code 1xff). Restoring the true symmetry
would be very easy were it not for Step 1, in which the model wassymmetrised. Because of
177
pseudotranslation, which was present in this structure, the space group to which the model was
transformed at Step 1 (i.e. the PSSG) was not the true space group but its supergroup withtwice
smaller cell. Therefore, this transformation resulted in significant shifts of molecules from their
correct positions and refinement inP1 was unable to return them back. Thus the symmetrisation
of the input model is an essential step in some instances but an additional obstacle in others.
This problem was solved by adding Step 2 (Fig.4.4) including refinements of the symmetrised
structure in several subgroups of the PSSG, so the input for Step 3 was not the symmetrised
structure, but the structure giving the bestRfree in Step 2.
In addition, the table ofR-factors generated in Step 2 may be useful in the cases of twinning
interfering with pseudosymmetry, in which theR-factor difference between the true and false
structures can be marginal, especially if the input model isan MR solution which has not yet
been rebuilt. So,Zanudagenerates the structure with currently most probable symmetry, while
this table may suggest returning to the symmetry validationwith the improved model.
Nevertheless, Step 2 is not a general solution for the problem of false local minima in rigid
body refinement. Perhaps the starting model should not be intentionally symmetrised and the
ability of the MR to find a global minimum, although approximately, should be utilised. So
the current protocol is likely to be replaced by one in which the starting model is generated
by the MR inP1. Of course, the contrast of the TF inP1 is small, but the advantage is that
no symmetry is assumed in advance. On the other hand, the problem under consideration is to
correct the structure, not to solve it. Therefore, since an approximate structure is known, the
peaks in both RF and TF can be selected in accordance with thisstructure. In theory, the second
run of TF (one molecule fixed) provides all necessary information on the relative positions of all
the molecules. In practice, several molecules may need to bepositioned directly using the TF to
ensure clearer peaks for the remaining molecules.
4.3.5 Concluding remarks
In general,Zanudais intended to close the gap between the intrinsic inaccuracy of the MR and
the local character of the optimisation performed by refinement, which therefore requires the
starting model with, at the least, correctly assigned symmetry.
The program has already helped to validate several structures. An example of a difficult
case, in whichZanudadetermined the symmetry of a pseudosymmetric twin, is presented in the
next section.
178
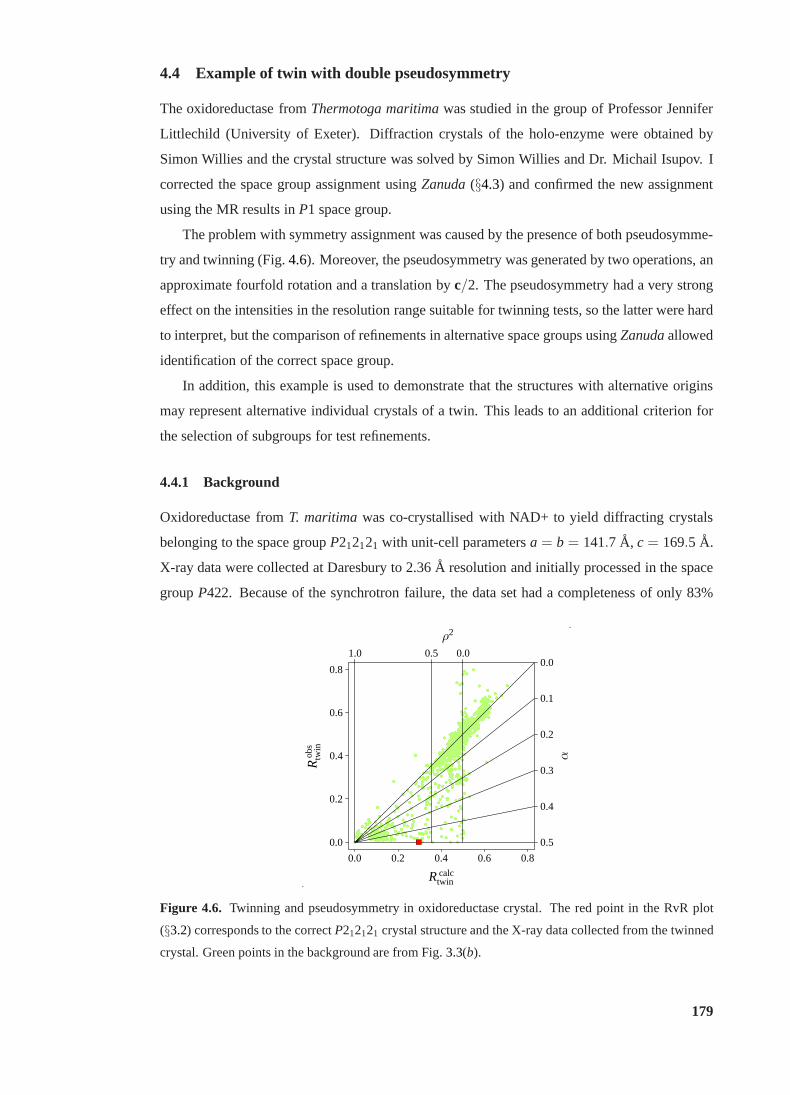
4.4 Example of twin with double pseudosymmetry
The oxidoreductase fromThermotoga maritimawas studied in the group of Professor Jennifer
Littlechild (University of Exeter). Diffraction crystalsof the holo-enzyme were obtained by
Simon Willies and the crystal structure was solved by Simon Willies and Dr. Michail Isupov. I
corrected the space group assignment usingZanuda(§4.3) and confirmed the new assignment
using the MR results inP1 space group.
The problem with symmetry assignment was caused by the presence of both pseudosymme-
try and twinning (Fig.4.6). Moreover, the pseudosymmetry was generated by two operations, an
approximate fourfold rotation and a translation byc/2. The pseudosymmetry had a very strong
effect on the intensities in the resolution range suitable for twinning tests, so the latter were hard
to interpret, but the comparison of refinements in alternative space groups usingZanudaallowed
identification of the correct space group.
In addition, this example is used to demonstrate that the structures with alternative origins
may represent alternative individual crystals of a twin. This leads to an additional criterion for
the selection of subgroups for test refinements.
4.4.1 Background
Oxidoreductase fromT. maritimawas co-crystallised with NAD+ to yield diffracting crystals
belonging to the space groupP212121 with unit-cell parametersa = b = 141.7 A, c = 169.5 A.
X-ray data were collected at Daresbury to 2.36A resolution and initially processed in the space
groupP422. Because of the synchrotron failure, the data set had a completeness of only 83%
Rcalctwin
Rob
stw
in
α
ρ2
0.0 0.2 0.4 0.6 0.8
0.0
0.2
0.4
0.6
0.8
0.00.51.00.0
0.1
0.2
0.3
0.4
0.5
.
.
Figure 4.6. Twinning and pseudosymmetry in oxidoreductase crystal. The red point in the RvR plot
(§3.2) corresponds to the correctP212121 crystal structure and the X-ray data collected from the twinned
crystal. Green points in the background are from Fig.3.3(b).
179
and intensities for indicesh00, 0k0 and 00l were not measured. It was however desirable to solve
the structure using this data set in order to find out whether there was substrate binding suitable
for structural studies and whether this crystal form was worth pursuing for further experiments.
MR trials were performed usingMOLREP. A single subunit of the previously solved apo-
structure was used as a search model.MOLREPdetected a pseudo-translation vectorc/2; the
height of the corresponding peak in the Patterson map was 0.28 in relation to the origin peak.
Therefore the TF search was conducted using two subunits related by this vector (§1.1.15).
As the reflections along the crystal axes were not measured, all eight space groups with point
group symmetry 422 and primitive lattice were tested. In sixof them,MOLREPfound only
one pair of subunits because of packing constraints (§1.1.9). The TF-scores in the remaining
two space groups as well asR-factors after rigid body refinements were similar, but one of them
(P4212, R = 33.2%, Rfree = 39.2%) was much better than the other (P42212, R = 39.0%,
Rfree = 45.9%) in restrained refinement (REFMAC).
Model correction and TLS-refinement inP4212 resulted inR = 29.9% andRfree = 34.3%.
These values were still too high suggesting that an incorrect assignment of space group or origin
might have happened.
4.4.2 Twinning tests
In many cases the perfect twinning tests could be used to check whether the data were processed
in a higher symmetry point group. In this particular case thestandard analysis was not applicable
because of the pseudotranslation, which made the intensitystatistics “less twinned” than the
reference statistics for the untwinned case (Fig.4.7).
The “sigmoidal” cumulative distribution ofZ (the second derivative is positive at the origin)
is a more universal indicator of twinning, which usually works even in the presence of pseu-
dotranslation (Leeet al., 2003) or correlated structure factors (§1.2.3, §3.1.6; Fig. 3.1a). The
cumulative distribution ofZ in this example was “sigmoidal” for all data (Fig.4.7a) but not for
the data in the resolution range 8–3A (Fig. 4.7c). Such behaviour could be attributed to the
effect of strong pseudosymmetry by rotation, which would completely disguise twinning at low
resolution. On the other hand, high values ofR-standard in high-resolution shells (Fig.4.7d)
suggested that the cumulative distribution ofZ for all data could also be misleading owing to the
experimental errors, compare with Fig.1.3.
The minor evidence of twinning discussed here was insufficiently convincing to exclude
the originally assigned space groupP4212 and, therefore, the comparison of refinements in all
possible space groups includingP4212 was necessary.
180
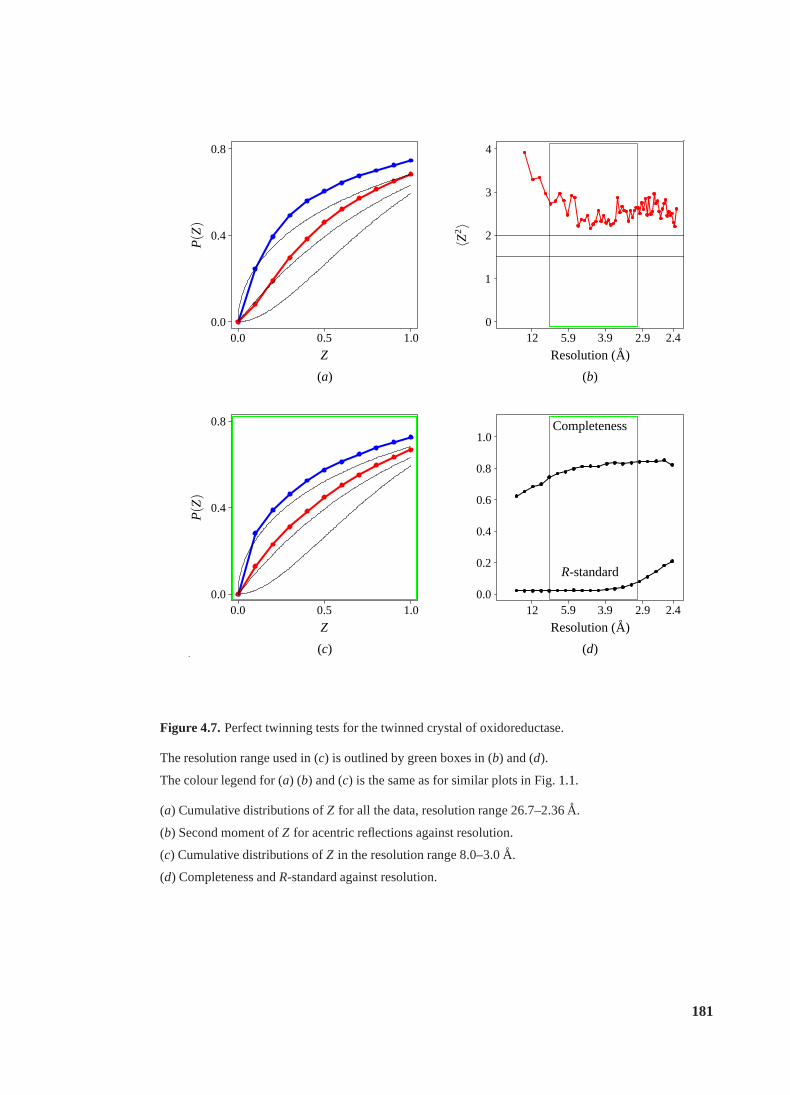
0.00.0
0.4
0.5
0.8
1.0
Z
P(Z
)
0
1
2
3
4
2.42.93.95.912
Resolution(A)
〈Z2〉
0.00.0
0.4
0.5
0.8
1.0
Z
P(Z
)
0.0
0.2
0.4
0.6
0.8
1.0
2.42.93.95.912
Resolution(A)
Completeness
R-standard
(a) (b)
(c) (d).
.
Figure 4.7.Perfect twinning tests for the twinned crystal of oxidoreductase.
The resolution range used in (c) is outlined by green boxes in (b) and (d).
The colour legend for (a) (b) and (c) is the same as for similar plots in Fig.1.1.
(a) Cumulative distributions ofZ for all the data, resolution range 26.7–2.36A.
(b) Second moment ofZ for acentric reflections against resolution.
(c) Cumulative distributions ofZ in the resolution range 8.0–3.0A.
(d) Completeness andR-standard against resolution.
181
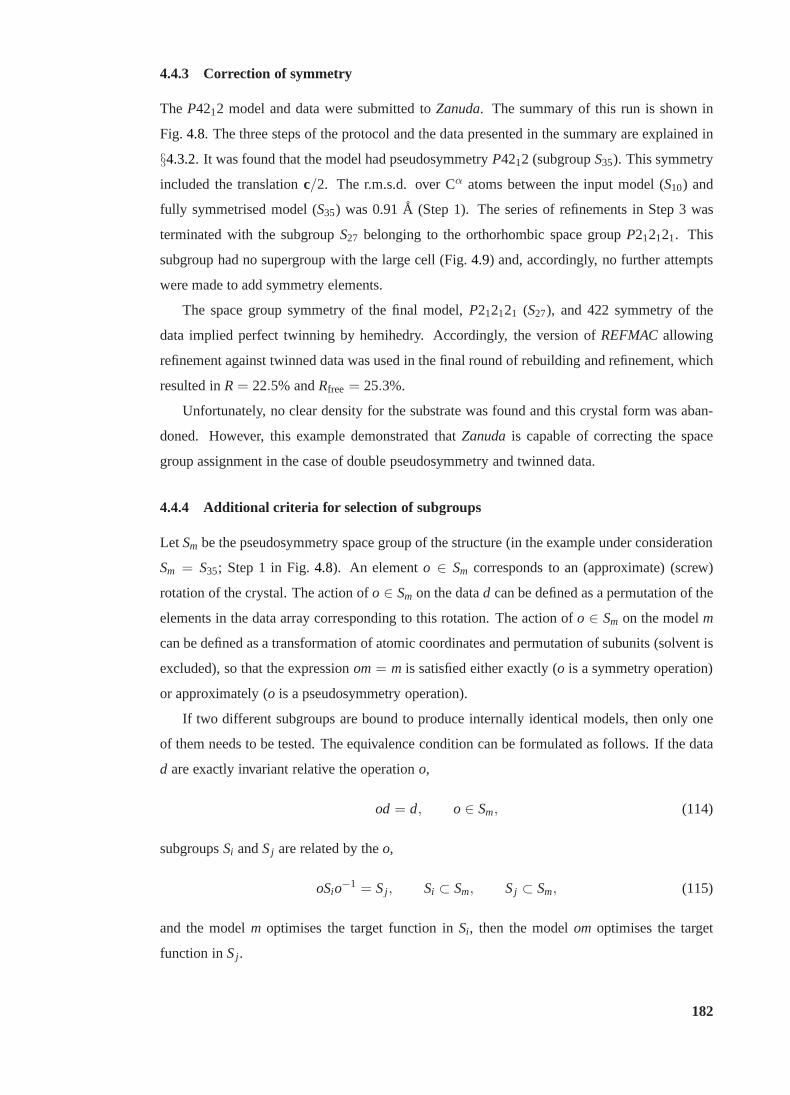
4.4.3 Correction of symmetry
The P4212 model and data were submitted toZanuda. The summary of this run is shown in
Fig. 4.8. The three steps of the protocol and the data presented in thesummary are explained in
§4.3.2. It was found that the model had pseudosymmetryP4212 (subgroupS35). This symmetry
included the translationc/2. The r.m.s.d. over Cα atoms between the input model (S10) and
fully symmetrised model (S35) was 0.91A (Step 1). The series of refinements in Step 3 was
terminated with the subgroupS27 belonging to the orthorhombic space groupP212121. This
subgroup had no supergroup with the large cell (Fig.4.9) and, accordingly, no further attempts
were made to add symmetry elements.
The space group symmetry of the final model,P212121 (S27), and 422 symmetry of the
data implied perfect twinning by hemihedry. Accordingly, the version ofREFMACallowing
refinement against twinned data was used in the final round of rebuilding and refinement, which
resulted inR = 22.5% andRfree = 25.3%.
Unfortunately, no clear density for the substrate was foundand this crystal form was aban-
doned. However, this example demonstrated thatZanudais capable of correcting the space
group assignment in the case of double pseudosymmetry and twinned data.
4.4.4 Additional criteria for selection of subgroups
Let Sm be the pseudosymmetry space group of the structure (in the example under consideration
Sm = S35; Step 1 in Fig.4.8). An elemento ∈ Sm corresponds to an (approximate) (screw)
rotation of the crystal. The action ofo ∈ Sm on the datad can be defined as a permutation of the
elements in the data array corresponding to this rotation. The action ofo ∈ Sm on the modelm
can be defined as a transformation of atomic coordinates and permutation of subunits (solvent is
excluded), so that the expressionom= m is satisfied either exactly (o is a symmetry operation)
or approximately (o is a pseudosymmetry operation).
If two different subgroups are bound to produce internally identical models, then only one
of them needs to be tested. The equivalence condition can be formulated as follows. If the data
d are exactly invariant relative the operationo,
od = d, o ∈ Sm, (114)
subgroupsSi andSj are related by theo,
oSio−1 = Sj , Si ⊂ Sm, Sj ⊂ Sm, (115)
and the modelm optimises the target function inSi , then the modelom optimises the target
function inSj .
182
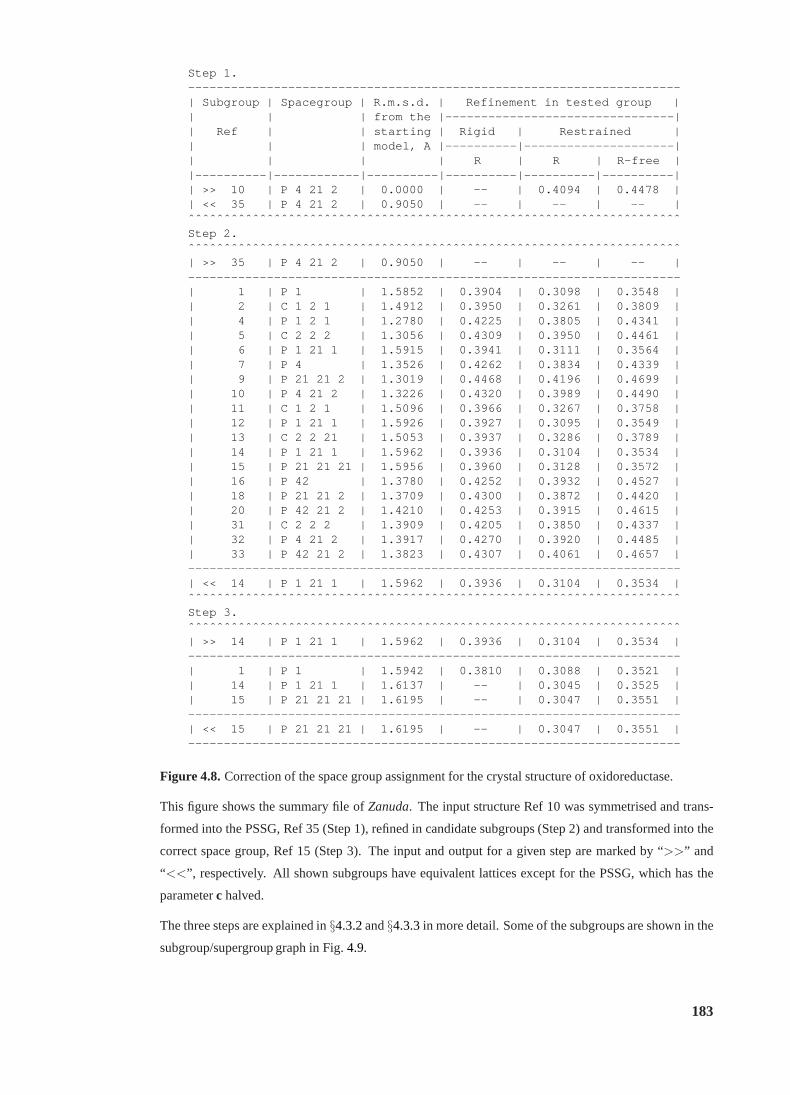
Step 1.-------------------------------------- ------------------------------ -| Subgroup | Spacegroup | R.m.s.d. | Refinement in tested group || | | from the |--------------------------------|| Ref | | starting | Rigid | Restrained || | | model, A |----------|---------------------|| | | | R | R | R-free ||----------|------------|----------|-- --------|----------|---------- || >> 10 | P 4 21 2 | 0.0000 | -- | 0.4094 | 0.4478 || << 35 | P 4 21 2 | 0.9050 | -- | -- | -- |ˆˆˆˆˆˆˆˆˆˆˆˆˆˆˆˆˆˆˆˆˆˆˆˆˆˆˆˆˆˆˆˆˆˆˆˆˆˆ ˆˆˆˆˆˆˆˆˆˆˆˆˆˆˆˆˆˆˆˆˆˆˆˆˆˆˆˆˆˆ ˆStep 2.ˆˆˆˆˆˆˆˆˆˆˆˆˆˆˆˆˆˆˆˆˆˆˆˆˆˆˆˆˆˆˆˆˆˆˆˆˆˆ ˆˆˆˆˆˆˆˆˆˆˆˆˆˆˆˆˆˆˆˆˆˆˆˆˆˆˆˆˆˆ ˆ| >> 35 | P 4 21 2 | 0.9050 | -- | -- | -- |-------------------------------------- ------------------------------ -| 1 | P 1 | 1.5852 | 0.3904 | 0.3098 | 0.3548 || 2 | C 1 2 1 | 1.4912 | 0.3950 | 0.3261 | 0.3809 || 4 | P 1 2 1 | 1.2780 | 0.4225 | 0.3805 | 0.4341 || 5 | C 2 2 2 | 1.3056 | 0.4309 | 0.3950 | 0.4461 || 6 | P 1 21 1 | 1.5915 | 0.3941 | 0.3111 | 0.3564 || 7 | P 4 | 1.3526 | 0.4262 | 0.3834 | 0.4339 || 9 | P 21 21 2 | 1.3019 | 0.4468 | 0.4196 | 0.4699 || 10 | P 4 21 2 | 1.3226 | 0.4320 | 0.3989 | 0.4490 || 11 | C 1 2 1 | 1.5096 | 0.3966 | 0.3267 | 0.3758 || 12 | P 1 21 1 | 1.5926 | 0.3927 | 0.3095 | 0.3549 || 13 | C 2 2 21 | 1.5053 | 0.3937 | 0.3286 | 0.3789 || 14 | P 1 21 1 | 1.5962 | 0.3936 | 0.3104 | 0.3534 || 15 | P 21 21 21 | 1.5956 | 0.3960 | 0.3128 | 0.3572 || 16 | P 42 | 1.3780 | 0.4252 | 0.3932 | 0.4527 || 18 | P 21 21 2 | 1.3709 | 0.4300 | 0.3872 | 0.4420 || 20 | P 42 21 2 | 1.4210 | 0.4253 | 0.3915 | 0.4615 || 31 | C 2 2 2 | 1.3909 | 0.4205 | 0.3850 | 0.4337 || 32 | P 4 21 2 | 1.3917 | 0.4270 | 0.3920 | 0.4485 || 33 | P 42 21 2 | 1.3823 | 0.4307 | 0.4061 | 0.4657 |-------------------------------------- ------------------------------ -| << 14 | P 1 21 1 | 1.5962 | 0.3936 | 0.3104 | 0.3534 |ˆˆˆˆˆˆˆˆˆˆˆˆˆˆˆˆˆˆˆˆˆˆˆˆˆˆˆˆˆˆˆˆˆˆˆˆˆˆ ˆˆˆˆˆˆˆˆˆˆˆˆˆˆˆˆˆˆˆˆˆˆˆˆˆˆˆˆˆˆ ˆStep 3.ˆˆˆˆˆˆˆˆˆˆˆˆˆˆˆˆˆˆˆˆˆˆˆˆˆˆˆˆˆˆˆˆˆˆˆˆˆˆ ˆˆˆˆˆˆˆˆˆˆˆˆˆˆˆˆˆˆˆˆˆˆˆˆˆˆˆˆˆˆ ˆ| >> 14 | P 1 21 1 | 1.5962 | 0.3936 | 0.3104 | 0.3534 |-------------------------------------- ------------------------------ -| 1 | P 1 | 1.5942 | 0.3810 | 0.3088 | 0.3521 || 14 | P 1 21 1 | 1.6137 | -- | 0.3045 | 0.3525 || 15 | P 21 21 21 | 1.6195 | -- | 0.3047 | 0.3551 |-------------------------------------- ------------------------------ -| << 15 | P 21 21 21 | 1.6195 | -- | 0.3047 | 0.3551 |-------------------------------------- ------------------------------ -
Figure 4.8.Correction of the space group assignment for the crystal structure of oxidoreductase.
This figure shows the summary file ofZanuda. The input structure Ref 10 was symmetrised and trans-
formed into the PSSG, Ref 35 (Step 1), refined in candidate subgroups (Step 2) and transformed into the
correct space group, Ref 15 (Step 3). The input and output fora given step are marked by “>>” and
“<<”, respectively. All shown subgroups have equivalent lattices except for the PSSG, which has the
parameterc halved.
The three steps are explained in§4.3.2and§4.3.3in more detail. Some of the subgroups are shown in the
subgroup/supergroup graph in Fig.4.9.
183
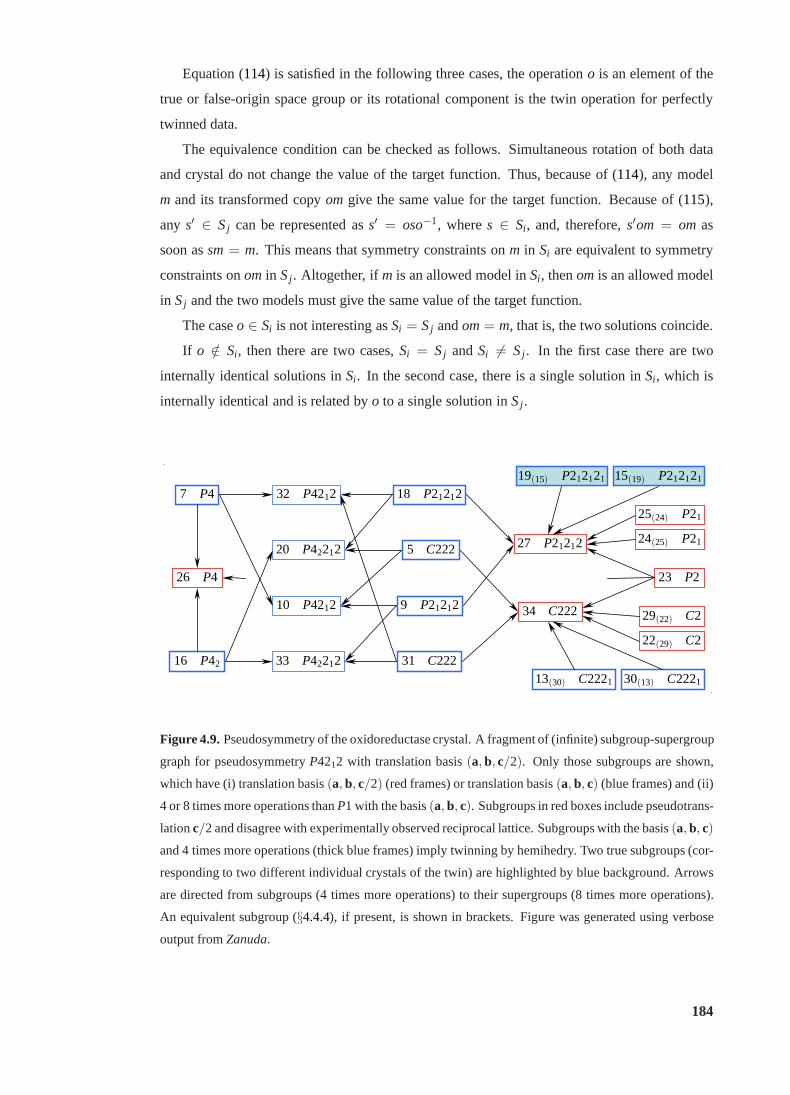
Equation (114) is satisfied in the following three cases, the operationo is an element of the
true or false-origin space group or its rotational component is the twin operation for perfectly
twinned data.
The equivalence condition can be checked as follows. Simultaneous rotation of both data
and crystal do not change the value of the target function. Thus, because of (114), any model
m and its transformed copyom give the same value for the target function. Because of (115),
any s′ ∈ Sj can be represented ass′ = oso−1, wheres ∈ Si , and, therefore,s′om = om as
soon assm= m. This means that symmetry constraints onm in Si are equivalent to symmetry
constraints onom in Sj . Altogether, ifm is an allowed model inSi , thenom is an allowed model
in Sj and the two models must give the same value of the target function.
The caseo ∈ Si is not interesting asSi = Sj andom= m, that is, the two solutions coincide.
If o /∈ Si , then there are two cases,Si = Sj andSi 6= Sj . In the first case there are two
internally identical solutions inSi . In the second case, there is a single solution inSi , which is
internally identical and is related byo to a single solution inSj .
7 P4
26 P4
16 P42
32 P4212
20 P42212
10 P4212
33 P42212
18 P21212
5 C222
9 P21212
31 C222
19(15) P212121
27 P21212
34 C222
13(30) C2221
15(19) P212121
25(24) P21
24(25) P21
23 P2
29(22) C2
22(29) C2
30(13) C2221
Figure 4.9.Pseudosymmetry of the oxidoreductase crystal. A fragment of (infinite) subgroup-supergroup
graph for pseudosymmetryP4212 with translation basis(a, b, c/2). Only those subgroups are shown,
which have (i) translation basis(a, b, c/2) (red frames) or translation basis(a, b, c) (blue frames) and (ii)
4 or 8 times more operations thanP1 with the basis(a, b, c). Subgroups in red boxes include pseudotrans-
lationc/2 and disagree with experimentally observed reciprocal lattice. Subgroups with the basis(a, b, c)
and 4 times more operations (thick blue frames) imply twinning by hemihedry. Two true subgroups (cor-
responding to two different individual crystals of the twin) are highlighted by blue background. Arrows
are directed from subgroups (4 times more operations) to their supergroups (8 times more operations).
An equivalent subgroup (§4.4.4), if present, is shown in brackets. Figure was generated using verbose
output fromZanuda.
184
Both non-trivial cases are present in the example under consideration. Leto be a fourfold
rotation aboutc. Equation (114) holds, as the data are processed inP4212. Orthorhombic
subgroupsS15 etc. do not includeo. In other words, thiso, if considered as a point group
operation, is the twin operation for the orthorhombic subgroups. It can be shown that
o S13 o−1 = S30 o S30 o−1 = S13 (C2221)
o S15 o−1 = S19 o S19 o−1 = S15 (P212121)
o S5 o−1 = S5 o S31 o−1 = S31 (C222)
o S9 o−1 = S9 o S18 o−1 = S18 (P21212)
(116)
Therefore, pairsS13, S30 (space group symmetryC2221) andS15, S19 (space group symmetry
P212121) define internally identical structures which are different individual crystals of the twin,
whereas pairsS5, S31 (space group symmetryC222) andS9, S18 (space group symmetryP21212)
define internally different structures although belongingto the same space group. In the second
case the structures corresponding to different individualcrystals belong to the same subgroup
and global optimisation would return one of the two structures by chance.
It makes sense to ignore the redundant subgroups (e.g.corresponding to the second individ-
ual crystal of a perfect twin by hemihedry) in order to avoid confusion with identical R-factors.
This will also save some computing time. ThereforeZanudaimplements the following selection
procedure based on (114), (115). The external loop runs overSi ⊂ Sm. If the currentSi has
not been previously flagged as redundant, the internal loop runs overo ∈ Sm satisfying (114) to
find all Sj 6= Si satisfying (115) and to flag them as redundant. Because of this selection rule,
S13 andS15 are tested in the second step in Fig.4.8, whereasS30 andS19 are ignored. On the
other hand, both subgroupsS5 andS31 with space group symmetryC222 and both subgroupsS9
andS18 with space group symmetryP21212 were tested: ifS5 (S9) is true, thenS31 (S18) is a
false-origin solution, andvice versa.
Had the partial twinning been recognised and the data processed in 222, then (114) would
not hold for fourfold rotationo aboutc and all orthorhombic subgroups with the large cell would
be tested. This would make sense, as the individual crystal of larger size would give a lower R-
factor than another individual crystal.
4.4.5 Alternative methods of structure correction
The space groupP212121 was confirmed using MR with the data expanded toP1 space group.
Twelve subunits were positioned in a single run ofMOLREPand theP1-model was completed
using TF peaks, which had not been used in the partial model but were persistently appearing
at all twelve TF steps with high scores; the subunits corresponding to these peaks were placed
usingLSQKAB. The correct symmetry was restored similarly to Step 3 in Fig. 4.8.
185
In manual tests involving MR searches and refinements in several space groups (an alterna-
tive to the MR inP1), additional refinements on the alternative origin atc/4 would be needed
in P42212, P4212,C222 andP21212 (but not inC2221 andP212121, in which the structure with
the alternative origin is the structure of the second individual crystal of the twin).
If the reflectionsh00, 0k0 and 00l had been accurately measured, the assumption of twinning
by hemihedry and the systematic absences would necessarilypoint to P212121 space group.
Tests of alternative origins would not be needed and straightforward MR would produce the
correct solution. In this case, the comparison of refinementin P212121 with two refinements in
P42212 (two non-equivalent origins) would confirm or reject the hypothesis of twinning. On the
other hand, the automatic comparison of all possible subgroups gives more confidence in the
final result.
Comparison of refinements in several subgroups is particularly important if there are no
systematic absences along two or all three axes. For example, human deoxycytidine kinase
formsP21212 twinned crystals, in which the axis of four-fold twin operation is alonga and maps
systematic absences onto non-zero intensities (Elisabetta Sabini, personal communication).
186
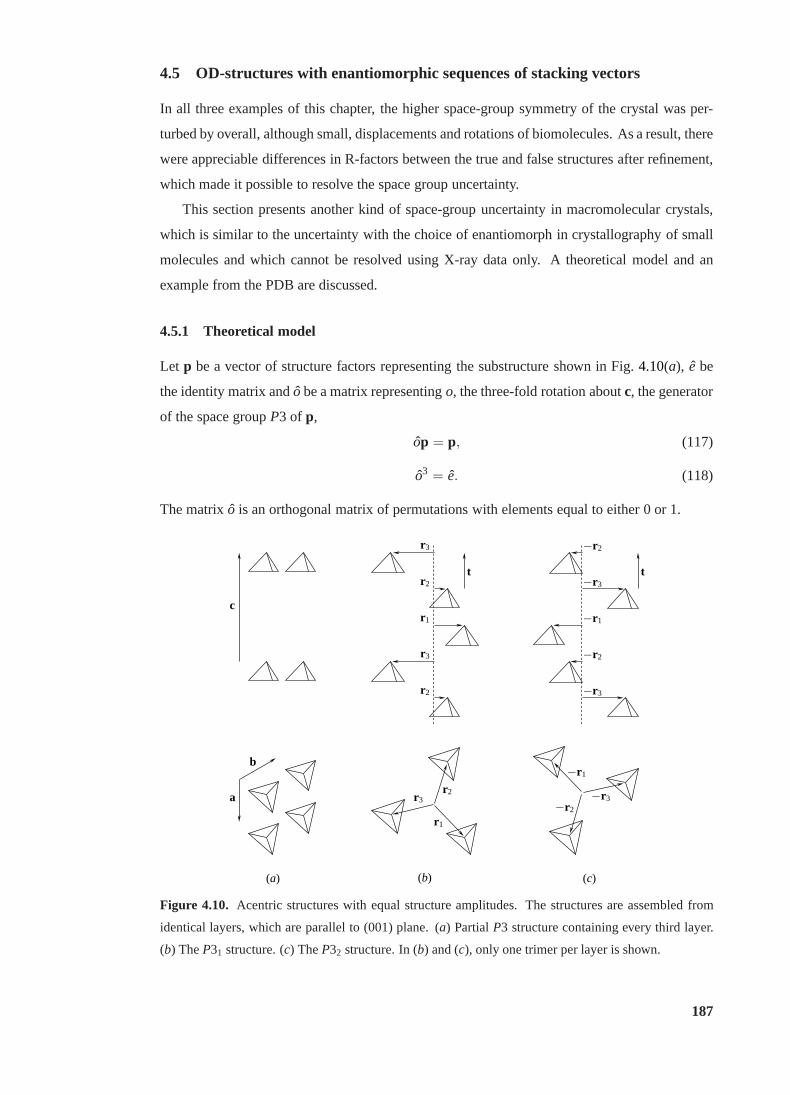
4.5 OD-structures with enantiomorphic sequences of stacking vectors
In all three examples of this chapter, the higher space-group symmetry of the crystal was per-
turbed by overall, although small, displacements and rotations of biomolecules. As a result, there
were appreciable differences in R-factors between the trueand false structures after refinement,
which made it possible to resolve the space group uncertainty.
This section presents another kind of space-group uncertainty in macromolecular crystals,
which is similar to the uncertainty with the choice of enantiomorph in crystallography of small
molecules and which cannot be resolved using X-ray data only. A theoretical model and an
example from the PDB are discussed.
4.5.1 Theoretical model
Let p be a vector of structure factors representing the substructure shown in Fig.4.10(a), e be
the identity matrix and ˆo be a matrix representingo, the three-fold rotation aboutc, the generator
of the space groupP3 of p,
op = p, (117)
o3 = e. (118)
The matrixo is an orthogonal matrix of permutations with elements equalto either 0 or 1.
r1
r1
r2
r2
r2
r3
r3
r3
−r1
−r1
−r2
−r2
−r2
−r3
−r3
−r3
tt
a
b
c
(a) (b) (c)
Figure 4.10. Acentric structures with equal structure amplitudes. The structures are assembled from
identical layers, which are parallel to (001) plane. (a) PartialP3 structure containing every third layer.
(b) TheP31 structure. (c) TheP32 structure. In (b) and (c), only one trimer per layer is shown.
187
Let t and ˆr i be complex diagonal matrices representing translationst = c/3 andr i (r i+1 =
o r i), respectively,
t3 = e, (119)
ot = t o, (120)
or i = r i+1o. (121)
Notations (117) to (121) are used to analyse the structures in Figs.4.10(b) and4.10(c). In
particular, it is shown below that the two structures (i) have the same structure amplitudes, (ii)
belong to different space groups but (iii) belong to the sameOD family, so if one structure
physically exists, another is also possible.
(i) The matrix
v = r1 + t r2 + t2r3 (122)
represents the positions of trimers in Figs.4.10(b). The set of trimers in Figs.4.10(b) can
be mapped into the set of trimers in Fig.4.10(c) in such a manner that the reference points
of corresponding trimers would be related by inversion. Therefore, the positions of trimers in
Fig.4.10(c) are represented by ˆv∗ and the two structures are represented by the following vectors
of the structure factors,
f1 = vp, (123)
f2 = v∗p. (124)
Let w be a real diagonal matrix of weighting coefficients. Becausev is also diagonal, the
weighted sums of intensities for the two structures coincide,
f∗T1 w f1 = p∗T v∗w vp = p∗T v w v∗p = f∗T
2 w f2. (125)
In particular, if w contains a single non-zero element, the equation (125) means the two cor-
responding intensities are equal. Therefore, the structures f1 and f2 produce exactly the same
structure amplitudes.
Note that the absence of anomalous signal inp was not assumed. Thus, in contrast to the true
enantiomorphic structures, the structures with enantiomorphic sequences of stacking vectors can
not be distinguished using anomalous signal.
(ii) Using equations (117) to (124), the vectorsf1 andf2 are expressed as follows,
f1 = 3 π r1 p, (126)
f2 = 3 π∗ r∗1 p, (127)
where
3π = e+ t o + (t o)2. (128)
188
Equations (123), (124) and (126), (127) represent two equivalent ways of assembling the struc-
turesf1 andf2 from layers. In (123) and (124) the two structures are assembled from translated
copies of the reference layer, while in (126) and (127) the complete structures are generated
from the reference layer by screw rotations. If the layers had symmetryP11(1), the first proce-
dure would result into twoP1 structures with the same structure amplitudes and the second one
would produceP31 andP32 structures with different structure amplitudes. Note however that
none of the last four structures is OD because theP11(1) layers can only occur in the type III
(Fig. 1.5d), in which any two contacting layers are related via a screw two-fold axis parallel to
the layers.
The symmetry off1 andf2 can formally be identified as follow. Because of (118), (119) and
(120), the matrixπ is a projector,
π π = π, (129)
which commutes with own complex conjugate,
π∗π = π π∗. (130)
Because of (130), π∗π is a real matrix, whereas ˆπ itself is not. (π can be reduced to block
diagonal form with five types of block. The blocks corresponding to reflections withl 6= 3n and
eitherh 6= 0 or k 6= 0 contain complex elements, as the elements oft for these reflections are
complex numbers.) Therefore,
π∗π 6= π. (131)
Thus, (126) and (127) for a generic vector ˆr1p result in
π f1 = f1 π∗f1 6= f1 (132)
and
π∗f2 = f2 π f2 6= f2 (133)
If a vector of structure factors is invariant relative to ˆπ, then it is invariant relative to any matrix
from the groupG1 = {e, t o, t2o2} andvice versa. Similarly, invariance relative to ˆπ∗ means
invariance relative toG2 = {e, t∗o, t∗2o2}. The matrix groupsG1 andG2 represent space groups
P31 andP32, respectively.
Altogether, given a generic vectorr1, the structuresf1 and f2 are different and belong to
different space groups although both are composed of identical layers and produce the same
structure amplitudes.
(iii) In both structuresf1 andf2 the consecutive pairs of adjacent layers are related by three
alternating stacking vectors,
si = r i − r i−1 + t, s4 = s1 (134)
189
Because of (120) and (121), these vectors are equivalent relative to the symmetryP(3)11 of the
layer and therefore the two structures are OD-structures (§1.3) from the same OD-family of type
II/A, with maximum degree of order but with enantiomorphic sequences of the stacking vectors,
(. . . , s1, s2, s3, . . .) in f1 and(. . . , s3, s2, s1, . . .) in f2.
Intermolecular contacts in two ideal OD-structures are identical and therefore both structures
could in principle exist either in two separate single crystals or simultaneously in allotwin. The
intensities from individual crystals of such allotwin would be equal. If, in addition, the individual
crystals were large and therefore the interference term were negligible, the intensity statistics
would not deviate from untwinned statistics.
Two special cases are possible, in which the structuresf1 and f2 are identical. Ifs1 =
ma+nb, then both structures belong toP3 space group withc′ = t. If s1 = ±(a−b)/3+ma+nb,
then both structures belong toR3 space group withc′ = c in hexagonal obverse or reverse
settings.
4.5.2 Example
The 2.6A crystal structure of proliferating cell nuclear antigen (PCNA; PDB code 1axc; Gulbis
et al., 1996) belongs to the space groupP3221 with unit-cell parametersa = 83.5 A, c = 233.9
A. The structure possessesR32 pseudosymmetry (Cα r.m.s.d. from the symmetrised structure is
0.83A) and therefore it was selected as a test case forZanuda. Surprisingly, the refinement in
two different space groups,P3221 (symmetry of the PDB model) andP3121 gave very similarR-
factors. The pseudosymmetry could not be a reason for this space group uncertainty. Therefore
further analysis has been performed. A comparison of the twoalternative structures with the
symmetrisedR32-structure showed that these were OD-structures from thesame OD-family of
type I/A with P(3)21 symmetry of the OD-layers. Compared to the theoretical model above,
the symmetries of both the single layer and the complete structure include additional operations,
two-fold rotations. Therefore, the orthogonal projectionof stacking vector on the plane(001)
is necessarily orthogonal to one of the two-fold axes. Except for this constraint, the theoretical
model remains valid and explains the space group uncertainty in the crystal structure under
consideration.
Validation of the space group assignment was performed as follows. The solvent was re-
moved and the protein trimer constituting the asymmetric unit of the PDB model was sym-
metrised to generate a structure in which the OD-layers wereexactly symmetric relative to the
plane space groupP(3)21. This model was refined inP3221 space group. The symmetrised
trimer was shifted by 0.7053(a+b) to generate the starting model for refinement in space group
190
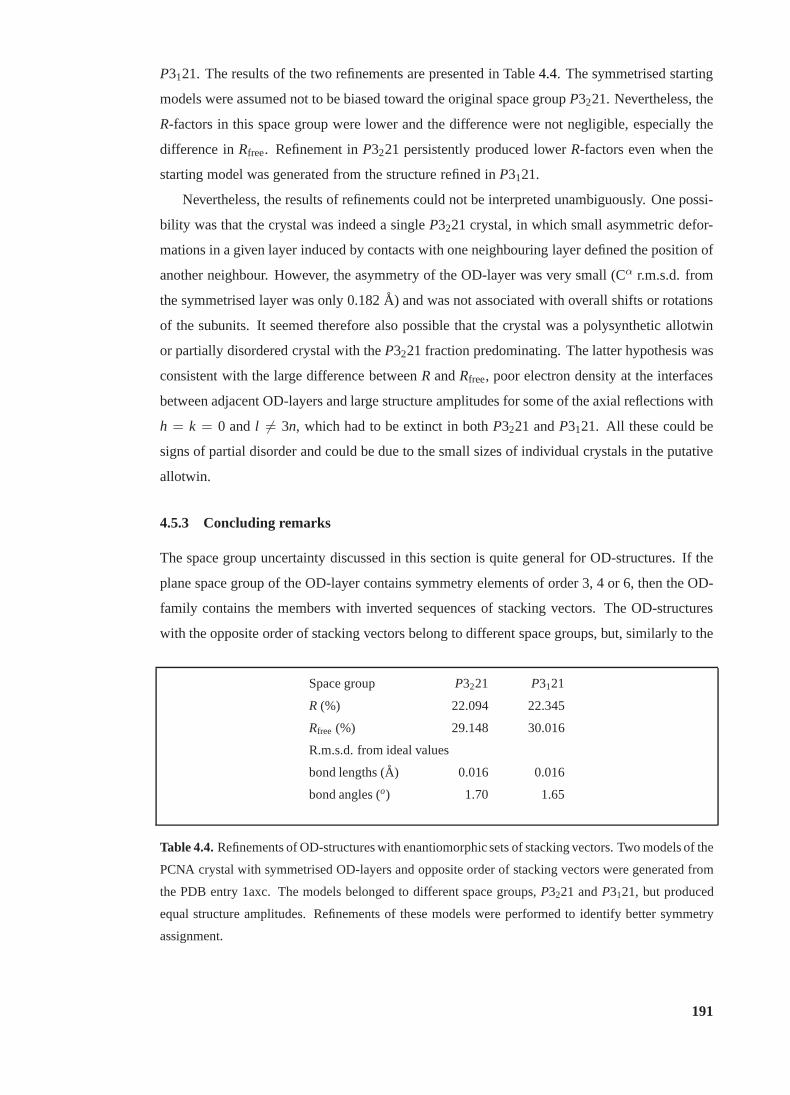
P3121. The results of the two refinements are presented in Table4.4. The symmetrised starting
models were assumed not to be biased toward the original space groupP3221. Nevertheless, the
R-factors in this space group were lower and the difference were not negligible, especially the
difference inRfree. Refinement inP3221 persistently produced lowerR-factors even when the
starting model was generated from the structure refined inP3121.
Nevertheless, the results of refinements could not be interpreted unambiguously. One possi-
bility was that the crystal was indeed a singleP3221 crystal, in which small asymmetric defor-
mations in a given layer induced by contacts with one neighbouring layer defined the position of
another neighbour. However, the asymmetry of the OD-layer was very small (Cα r.m.s.d. from
the symmetrised layer was only 0.182A) and was not associated with overall shifts or rotations
of the subunits. It seemed therefore also possible that the crystal was a polysynthetic allotwin
or partially disordered crystal with theP3221 fraction predominating. The latter hypothesis was
consistent with the large difference betweenR andRfree, poor electron density at the interfaces
between adjacent OD-layers and large structure amplitudesfor some of the axial reflections with
h = k = 0 andl 6= 3n, which had to be extinct in bothP3221 andP3121. All these could be
signs of partial disorder and could be due to the small sizes of individual crystals in the putative
allotwin.
4.5.3 Concluding remarks
The space group uncertainty discussed in this section is quite general for OD-structures. If the
plane space group of the OD-layer contains symmetry elements of order 3, 4 or 6, then the OD-
family contains the members with inverted sequences of stacking vectors. The OD-structures
with the opposite order of stacking vectors belong to different space groups, but, similarly to the
Space group P3221 P3121
R (%) 22.094 22.345
Rfree (%) 29.148 30.016
R.m.s.d. from ideal values
bond lengths (A) 0.016 0.016
bond angles (o) 1.70 1.65
Table 4.4.Refinements of OD-structures with enantiomorphic sets of stacking vectors. Two models of the
PCNA crystal with symmetrised OD-layers and opposite orderof stacking vectors were generated from
the PDB entry 1axc. The models belonged to different space groups,P3221 andP3121, but produced
equal structure amplitudes. Refinements of these models were performed to identify better symmetry
assignment.
191
structures with inverted atomic coordinates, produce the same structure amplitudes. Moreover,
the OD-family contains allotwins and partially disorderedstructures, in which domains with
opposite sequences of stacking vectors coexist.
In all these cases, the X-ray data and especially macromolecular X-ray data of limited reso-
lution are insufficient for an unambiguous characterisation of the actual crystal structure. Never-
theless, a simple approach, in which the macromolecular crystal is considered as a single crystal
belonging to the space group producing betterR-factor, is sufficient for model building and
structure analysis. Locally, the electron density maps andintermolecular contacts are almost
identical in the alternative space groups and therefore allotwins and partially disordered struc-
tures would be handled with reasonable accuracy. Simultaneous refinement of two individual
crystals for better treatment of allotwin is unlikely to be possible because of too many correlated
parameters. However, it seems feasible to account for the interference between domains of a
partially disordered structure.
192
5 Conclusions
NCS is a feature of macromolecular structures, which, if present, typically raises extra problems
with the structure solution. For example, the presence of NCS implies the use of multi-body MR
complicated by low signal-to-noise ratio. In special casesof translational pseudosymmetry or
twinning interfering with NCS, the space group assignment can be a problem. Accordingly, the
two particular issues raised in this work are the use of NCS-guided MR for structure solution
and the validation of symmetry assignment.
5.1 Non-standard MR protocols
Several examples of structures that could not have been solved routinely using MR are presented
in this thesis. The methods that have facilitated the structure solutions are summarised below.
5.1.1 NCS-constrained exhaustive search
Three methods that can be generally classified as NCS-constrained exhaustive searches are pre-
sented in this thesis. They differ in whether all available NCS constraints are used for structure
solution or only some of them. These methods are applicable to crystal structures of oligomeric
proteins, oligomers possessing hierarchical structure and being “oligomers of oligomers”. Three
relevant examples are presented in which smaller oligomerswere known from homologous
structures, but larger oligomers were either unknown or very different from those formed by
homologues,
(i) Thioredoxin peroxidase B from human erythrocytes (§2.1, PDB code 1qmv),
(ii) Anti-TRAP protein fromBacillus licheniformis(§2.2),
(iii) Hydroxycinnamoyl-CoA hydratase-lyase fromPseudomonas fluorescens(§2.3, PDB code
2j5i).
In the method used for solving (ii), only one of two unknown parameters was scanned and
another was found by subsequent TF searches. Therefore thismethod is
• faster;
• applicable to oligomers with only one symmetry axis and is therefore more general;
• is easier for manual use and for general implementation, as the search models for the TF
do not need to be generated explicitly.
• delivers an additional validation criterion, the integrity of the larger oligomer.
193
Therefore this method is recommended as the next option to try after the standard one-by-one
search and is worthy of implementing in MR pipelines.
The other two methods are useful in specific circumstances. Method (i) uses all NCS con-
straints and provides the highest possible contrast in the TF search, so it was used for the struc-
ture determination of a large non-spherical oligomer with relatively low sequence identity to the
search model. Method (iii) was used in the presence of translational NCS to avoid the effect of
long cross-vectors on the TF search.
5.1.2 Substructure solution using NCS-constrained exhaustive search
Another variation of the general method was used in the course of structure solution of the
tridecameric portal protein from phage SPP1 (§2.6, PDB code 2jes). Here the substructure of
thirteen Hg atoms was not found using direct methods but was found using NCS-constrained
exhaustive search against isomorphous differences. This example shows that the MR method,
which is usually less efficient for substructure solution than direct methods, can nevertheless
be the best choice if information on NCS is available and the whole substructure is therefore
defined by a small number of variable parameters.
5.1.3 Refinement of partial structures
Refinement of a partial structure was a critical step of the MRsolution of
(i) E1-helicase from bovine papillomavirus-1 (§2.4, PDB code 2v9p) and
(ii) Hypothetical protein MTH685 fromM. thermautotrophicus(§2.5).
Two different approaches were used: (i) NCS-constrained refinement of four internal parame-
ters of a hexamer, the maximum value of the CRF being the target function and (ii) restrained
refinements of partial structures and the use of refined domains as search models in subsequent
rounds of MR.
The idea of method (i) is to increase the radius of convergence by reducing both spatial and
angular resolution. An implementation of this method for a general oligomeric or multidomain
model may use the spherical harmonic representation of the data and model generated at the RF
step of the MR to refine a composition model before the TF step.
Method (ii) requires the presence of two or more identical molecules in the asymmetric unit,
but does not require a point group symmetry relation betweenthem. Restrained refinement used
in this method allows utilisation of high resolution data, which otherwise are useless for MR.
It was found that the completeness of a partial model of about30% is sufficient for its efficient
refinement and for substantial improvement of the search models derived from it.
194
5.2 Symmetry validation and correction
Several issues concerning crystal symmetry and twinning are discussed in this thesis and sum-
marised below. These include the effect of twinning on the atomic model, the interference of
twinning with NCS and pseudosymmetry, data processing and detwinning in the case of twin-
ning by reticular merohedry and a program for symmetry validation and correction.
5.2.1 Twinning by (pseudo)merohedry
In this type of twin, all reflections from one individual crystal overlap with the reflection from
any other individual crystal. This is the most frequent, or,at least, most frequently reported case
of twinning in macromolecular crystals. An analysis of the PDB was performed using R-factors
between twin related intensities, observed and calculated, to generate a comprehensive collec-
tion of such twins. The examples found were used for testing twinned refinement implemented
in the new version ofREFMAC(Garib Murshudov, personal communication).
An atomic model represents only one individual crystal and no phases can be ascribed to
a contribution from other individuals into the observed intensities. The atomic model cannot
be significantly affected by the latter contribution as the refinement program will treat it as
noise provided reasonably strong stereochemical restraints. However, the analysis of the PDB
revealed several models refined against twinned data, whichwere significantly corrupted. It
seemed likely that in these cases an unnoticed twinning and too highR-factors may have lead to
an incorrect assessment of model quality and resulted in further refinement, likely with weaker
restraints, involving overfitting of the models towards thetwinned data. One such model was
rebuilt and refined to show that untwinned refinement as such cannot be responsible for any
significant changes in the model or electron density map. It was therefore concluded that the
main role of twinned refinement is to produce more usual low values of R-factors and thus
exclude overfitting, and that the main problem associated with twinning is an awareness of its
presence.
The analysis of the PDB showed that in about a half of all twinsthe twin axis was approx-
imately parallel to an NCS axis. In such circumstances the structure factors related by twin
operation correlate and therefore the contrast of twinningtests decreases. The high occurrence
of this special case of twinning and additional complications that it causes simulated a theo-
retical analysis resulting in a simple analytical expression for the distributions ofZ andH for
variable twinning fraction and correlation. These distributions can be used as references in the
perfect and partial twinning tests, respectively, in the presence of correlation.
In addition, three examples with different correlation of twin-related structure factors were
analysed in detail:
195
(i) a twin with NCS but without correlation (C-terminal domain of large terminase subunit
from phage SPP1,§3.3);
(ii) an OD-twin with a significant correlation, in which the symmetry of OD-layers induced
both twinning and NCS (Ferrochelatase-1 fromBacillus anthracis, §3.4, PDB code 2c8j);
(iii) a twin with a very strong correlation caused by interference of twinning and pseudosym-
metry (Oxidoreductase fromThermotoga maritima, §4.4).
The presence of twinning caused no problems with the space group assignment in (i). The
twinning tests had not been performed until refinement in (ii) as the MR gave a solution with a
great contrast in one of the higher symmetry space groups. Inaddition, this space group could
not be rejected with certainty because of pseudo-absences induced by the symmetry of OD-
layers. The twinning tests were not conclusive in (iii) and the lower symmetry space group and
twinning could only be confirmed using refinements in a seriesof space groups consistent with
the cell parameters.
Case (iii) highlights a problem of distinguishing pseudosymmetry interfering with twinning
in a lower symmetry space group from a higher symmetry. The analysis of the PDB showed
that the lower symmetry space group was incorrectly assigned in many cases and that some of
these models were significantly corrupted because of refinements with some of the symmetry
constraints being in effect ignored. It was therefore concluded that a specialised program is
needed that could validate or correct symmetry assignment during or after refinement and model
building.
5.2.2 Twinning by reticular pseudomerohedry
This type of twinning is characterised by overlap of only a fraction of all the reflections. It
is either very rare in macromolecular crystals or usually remain unnoticed, as it creates less
problems with symmetry assignment, structure solution andrefinement compared to twinning
by (pseudo)merohedry. Two cases were discussed in this thesis,
(i) the twinned crystal of lipase B fromCandida antarctica(§1.3.4, §3.2.5, PDB code 1lbs)
with a very small obliquity angle and a low twin index of three;
(ii) the twinned crystal ofL-2-haloacid dehalogenase fromSulfolobus tokodaii(§3.5, PDB
code 2w11) with a small but appreciable obliquity angle and alarge twin index of ten.
The two cases differ in how the diffraction data were processed and in potential mistakes that
could have been made.
196
The twinned data (i) with low obliquity angle and twin index were indexed and processed
in the large unit cell (of the twin lattice) and therefore twinning could have been mistaken for
pseudotranslation. The integrated data were reindexed to remove non-overlapping reflections
from the smaller individual crystal and to detwin overlapping reflections.
The autoindexing of the data (ii) with larger obliquity angle and twin index resulted in the
correct cell dimension so the twinning could have remained unnoticed. As the spots from one
of the individual crystals were not integrated, the data correction only involved the detwinning
of overlapping reflections, which, however, was more sophisticated in this case because of equal
sizes of individual crystals and significant obliquity angle.
The raw data were available in example (ii) and therefore tworefinements of the complete
final model were compared, against twinned and detwinned data. No significant differences
between the two resultant models were found although the difference between R-factors was
about 5%. However, the difference map from an incomplete model was more distorted for
twinned than for detwinned data. This difference can be of some importance for model building,
which, as in the case of twinning by (pseudo)merohedry, could lead to a misinterpretation of a
weak density and a corrupted model if twinning were ignored.This may be especially relevant
to poorly ordered segments with low electron density.
An additional problem associated with cases like (i) is to distinguish between twinning
and pseudotranslation. From the general point of view, thisis again a problem of identifica-
tion of the correct symmetry, but a possible mistake is an assignment of incorrect translational
symmetry (i.e. unit cell parameters), not the point group symmetry as it was for twinning by
(pseudo)merohedry.
The two twins by reticular pseudomerohedry presented in this thesis are OD-twins, as are
the twins encountered by Ian Tickle and Gleb Bourenkov (personal communications). Both
twining and NCS in all these structures are due to the symmetry of OD-layers and, therefore,
twin-related structure factors of overlapped reflections strongly correlate and detwinning can be
replaced by demodulation (§3.5).
5.2.3 False origin solutions
A new class of false solutions, which can occur in the presence of pseudotranslation, is charac-
terised in this thesis. In some crystals, there exist equivalent origins in a pseudosymmetry space
group (PSSG) with a smaller unit cell, which are not equivalent in the true space group with a
larger unit cell. Assignment of a false origin during MR structure solution leads to a false model
which differ from the true model by
• a large overall shift of the while crystal structure relative to fixed crystallographic axes
197
• small translations, rotations and distortion of individual molecules to accommodate new
symmetry constraints.
The large overall shift of the whole structure does not affect the structure amplitudes but it
cannot be corrected by local optimisation, rigid body or restrained refinements. Small differ-
ences between the true and false structures owing to changedsymmetry constraints introduce
significant errors even in the relative coordinates of atomsin any particular molecule, corrupt
some fragments of electron density and increase R-factors.
Three examples of false origin MR solutions are presented inthis thesis, which were en-
countered in the actual courses of structure determination. This are the structures of Anti-TRAP
protein fromBacillus licheniformis(§4.1), GAF (N-terminal) domain of apo CodY protein from
Bacillus subtilis(§4.2, PDB code 2gx5) and Oxidoreductase fromThermotoga maritima(§4.4).
Three approaches to the origin correction are discussed,
(i) MR with oligomeric models,
(ii) Refinements in alternative origins,
(iii) Refinement inP1 followed by restoring the correct space group.
It was found that approach (i) can be misleading. Approach (ii) appeared to have a larger
radius of convergence than (iii). However, approach (iii) is more general as it in effect tests all
relevant subgroups of the PSSG and can in principle handle both false origin solutions and cases
of twinning interfering with pseudosymmetry mistaken for higher crystallographic symmetry.
The analysis of twinning interfering with pseudosymmetry and false origin solutions simu-
lated development ofZanuda, a specialised program for symmetry validation and correction.
5.2.4 Program for symmetry validation and correction
Three cases are outlined above, in which an incorrect symmetry assignment is hard or impossible
to correct using the experimental data only. These are
• erroneous higher symmetry assigned to a pseudosymmetric twin,
• erroneous lower symmetry and twinning, whereas the higher symmetry space group is a
correct assignment,
• assignment of a false origin.
All these errors can in principle be corrected by refinement in P1 followed by the deter-
mination of the space group symmetry of the refined model. Because of possible bias of the
198
input model toward incorrect space group and because of poorconvergence of refinement inP1
a more sophisticated protocol was implemented, which includes
• merging the model into the PSSG,
• refinements in subgroups of the PSSG,
• expanding the structure with the lowestRfree into P1,
• restoring higher symmetry by adding symmetry elements one after another and refinement
after each addition.
In future development ofZanudathe following issues need to be addressed,
• Better refinement protocol with larger radius of convergence,
• Better thanRfree criterion for comparing the space groups,
• NCS-guided detection of twinning by reticular merohedry mistaken for pseudotranslation.
5.3 Outline on symmetry assignment
Very generally, the problem of symmetry assignment can be divided into crystallographic and
statistical parts. The first include an accumulation of knowledge on the possible organisation
of crystalline matter and the use of this knowledge for characterisation of particular structures.
Point and space group symmetry of a single crystal are only a small and indeed simplest part
of the whole subject. Even for protein crystallography, in which the crystal is only a tool for
determination of protein structure, a more detailed knowledge of the organisation of crystal twins
and partially disordered structures may be important for utilisation of experimental diffraction
data. This thesis concerned only this aspect of the subject and provides several examples either
interesting from structural point of view or difficult for interpretation, and describes the program
Zanudafor symmetry validation.
However the statistical part of the subject is no less important. For example, a simple cri-
terion of smallerRfree does not work for comparison of refinements in different space groups,
and anad hoctolerance limit for differences between twoRfree values is used inZanudafor this
purpose. This approach needs to be replaced by proper hypothesis testing. This could be, for
example, a likelihood test, or the linear model analysis of the quadratic approximation to the
likelihood function. Further development of the symmetry validation program may require the
use of unmerged intensities, as the radiation damage to a crystal may be a reason for its apparent
lower symmetry. Advanced statistical methods will be absolutely necessary for approaching this
problem.
199
5.4 Impact on structure refinement and the resulting model
This thesis is dedicated to rather unusual crystal structures and methods for their solution. How-
ever some useful experience on structure refinement emergedduring these analyses.
It was noticed that the complete atomic model well and properly refined against twinned
data does not suffer in a major way if subjected to untwinned refinement, nor indeed does the
electron density corresponding to this model. However, while is true for the major features of
the structure, those for which the density is weak may be better defined after twinned refinement.
Accordingly, there are two valid ways to build a model using twinned data: (i) to use untwinned
refinement in the beginning of the model building and switch to twinned refinement for the final
model correction or (ii) to use twinned refinement from the very beginning. Either approach has
disadvantages although both, if refinements are done carefully, will result in correct models with
the differences in their atomic parameters within experimental uncertainties. The things to care
about are strong restraints, validation of main- and side-chain torsion angles and avoiding any
over-interpretation of the density,e.g.postponing the building of alternative conformations and
poorly ordered loops and solvent molecules till the very last moment.
These common practices are especially important for (i), asweak restraints and hasty mod-
elling combined with untwinned refinement against twinned data can lead to a substantially
corrupted model, which would not be possible to revert to thecorrect one by any refinement
without rebuilding. The model building follows path (i) if twinning is unnoticed, and this pos-
sibility means that the above rules need always to be obeyed.Path (ii) can cause troubles if an
untwinned structure belonging to a higher symmetry space group has been mistaken for twinned
structure and is refined in lower symmetry as if it were a pseudosymmetric twin. In this case
the corruption of the model is revealed in large differencesbetween molecules which are in fact
related by crystallographic symmetry. Here, NCS restraints can be a possible precaution. How-
ever it is always better to handle the model in the correct space group, to carry out the twinning
test at an early stage, and to validate the model symmetry after some rebuilding if there were
any uncertainties with the symmetry assignment or twinningdetection.
All above relates only to refinement in the correct space group or any of its subgroups,
whether or not the data are twinned. The major errors in symmetry assignment, such as assign-
ment of supergroup or false origin, would inevitably lead tosignificant coordinate errors and
corrupted electron density, in at least some of its regions.Both unnoticed twinning and major
errors in symmetry assignment are monitored byRfree, so a large value with no clear hints in the
density for further steps of model correction may well indicate a need for symmetry validation.
For real confidence in obtaining the best set of coordinates in crystals which are twinned,
procedures such as those described in this thesis provide useful insights.
200
References
Afonine, P. V., Grosse-Kunstleve, R. W. & Adams, P. D. (2005). The Phenixrefinement framework.
CCP4 Newslett.42, contribution 8.
Allpress, J. D. & Gowland, P. C. (1998). Dehalogenases: environmental defence mechanism and model
of enzyme evolution.Biochem. Educ.26, 267–276.
Alvarez-Rua, C., Borge, J. & Garcıa-Granda, S. (2000).OVIONE: a new vector-search rotation-function
program for macromolecular crystallography.J. Appl. Cryst.33, 1436–1444.
Antson, A. A., Dodson, E. J., Dodson, G., Greaves, R. B., Chen, X. & Gollnick, P. (1999). Structure of
thetrp RNA-binding attenuation protein, TRAP, bound to RNA.Nature (London), 401, 235–242.
Antson, A. A., Otridge, J., Brzozowski, A. M., Dodson, E. J.,Dodson, G. G., Wilson, K. S., Smith,
T. M., Yang, M., Kurecki, T. & Gollnick, P. (1995). The structure oftrp RNA-binding attenuation
protein.Nature (London), 374, 693–700.
Arai, R., Kukimoto-Niino, M., Kuroishi, C., Bessho, Y., Shirouzu, M. & Yokoyama, S. (2006). Crystal
structure of the probable haloacid dehalogenase PH0459 from Pyrococcus horikoshiiOT3. Prot.
Sci. 15, 373–377.
Argos, P., Ford, G. C. & Rossmann, M. G. (1975). An application of the molecular replacement technique
in direct space to a known protein structure.Acta Cryst. A31, 499–506.
Asojo, O. A., Boulegue, C., Hoover, D. M., Lu, W. & Lubkowski, J. (2003). Structures of thymus and
activation-regulated chemokine (TARC).Acta Cryst. D59, 1165–1173.
Au, K., Berrow, N. S., Blagova, E., Boucher, I. W., Boyle, M. P., Brannigan, J. A., Carter, L. G., Dierks,
T., Folkers, G., Grenha, R., Harlos, K., Kaptein, R., Kalliomaa, A. K., Levdikov, V. M., Meier,
C., Milioti, N., Moroz, O., Muller, A., Owens, R. J., Rzechorzek, N., Sainsbury, S., Stuart, D. I.,
Walter, T. S., Waterman, D. G., Wilkinson, A. J., Wilson, K. S., Zaccai, N., Esnouf, R. M. & Fogg,
M. J. (2006). Application of high-throughput technologiesto a structural proteomics-type analysis
of Bacillus anthracis. Acta Cryst. D62, 1267–1275.
Bahnson, B. J., Anderson, V. E. & Petsko, G. A. (2002). structural mechanism of enoyl-CoA hydratase:
three atoms from a single water are added in either an E1cb stepwise or concerted fashion.Bio-
chemistry, 41, 2621–2629.
Bailey, S. W., Frank-Kamenetskii, V. A., Goldsztaub, S., Kato, A., Pabst, A., Schulz, H., Taylor, H. F. W.,
Fleischer, M. & Wilson, A. J. C. (1977). Report of the International Mineralogical Association
(IMA)–International Union of Crystallography (IUCr) Joint Committee on Nomenclature.Acta
Cryst. A33, 681–684.
Bamford, D. H., Grimes, J. M. & Stuart, D. I. (2005). What doesstructure tell us about virus evolution?
Curr. Opin. Struct. Biol.15, 655–663.
201
Benning, M. M., Taylor, K. L., Liu, R.-Q., Yang, G., Xiang, H., Wesenberg, G., Dunaway-Mariano, D. &
Holden, H. M. (1996). Structure of 4-chlorobenzoyl coenzyme A dehalogenase determined to 1.8
A resolution: an enzyme catalyst generated via adaptive mutation.Biochemistry, 35, 8103–8109.
Bentley, G. A. & Houdusse, A. (1992). Some applications of the phased translation function in macro-
molecular structure determination.Acta Cryst. A48, 312–322.
Berman, H. M., Battistuz, T., Bhat, T. N., Bluhm, W. F., Bourne, P. E., Burkhardt, K., Feng, Z., Gilliland,
G. L., Iype, L., Jain, S., Fagan, P., Marvin, J., Padilla, D.,Ravichandran, V., Schneider, B., Thanki,
N., Weissig, H., Westbrook, J. D. & Zardecki, C. (2002). The Protein Data Bank.Acta Cryst.D58,
899–907.
Bonev, I. (1972). On the terminology of the phenomena of mutual crystal orientation.Acta Cryst. A28,
508–512.
Borge, J.,Alvarez-Rua, C. & Garcıa-Granda, S. (2000). A new vector-search rotation function: image-
seeking functions revisited in macromolecular crystallography.Acta Cryst. D56, 735–746.
Bragg, W. L. & Howells, E. R. (1954). X-ray diffraction by imidazole methaemoglobin.Acta Cryst. 7,
409–411.
Bricogne, G. (1974). Geometric sources of redundancy in intensity data and their use for phase determi-
nation.Acta Cryst. A30, 395–405.
Britton, D. (1972). Estimation of twinning parameter for twins with exactly superimposed reciprocal
lattices.Acta Cryst. A28, 296–297.
Brooks, B. R., Bruccoleri, R. E., Olafson, B. D., States, D. J., Swaminathan, S. & Karplus, M. (1983).
CHARMM: a program for macromolecular energy, minimization, and dynamics calculations.J.
Comput. Chem.4, 187–217.
Brunger, A. T. (1990). Extension of molecular replacement: a new search strategy based on Patterson
correlation refinement.Acta Cryst. A46, 46–57.
Brunger, A. T., (1992).X-PLOR. Version 3.1. A system for X-ray Crystallography andNMR. Yale Univ.
Press, New Haven, CT.
Brunger, A. T., Adams, P. D., Clore, G. M., DeLano, W. L., Gros, P., Grosse-Kunstleve, R. W., Jiang,
J.-S., Kuszewski, J., Nilges, M., Pannu, N. S., Read, R. J., Rice, L. M., Simonson, T. & Warren,
G. L. (1998).Crystallography & NMR System: a new software suite for macromolecular structure
determination.Acta Cryst. D54, 905–921.
Buerger, M. J. (1959).Vector Space. New York: John Wiley.
Camacho, A. G., Gual, A., Lurz, R., Tavares, P. & Alonso, J. C.(2003).Bacillus subtilisbacteriophage
SPP1 DNA packaging motor requires terminase and portal proteins.J. Biol. Chem.278, 23251–
23259.
Chapman, M. S., Tsao, J. & Rossmann, M. G. (1992).Ab initio phase determination for spherical viruses:
parameter determination for spherical-shell models.Acta Cryst. A48, 301–312.
202
Choi, H. J., Kang, S. W., Yang, C. H., Rhee, S. G. & Ryu, S. E. (1998). Crystal structure of a novel human
peroxidase enzyme at 2.0A resolution.Nat. Struct. Biol.5, 400–406.
Cianci, M., Antonyuk, S., Bliss, N., Bailey, M. W., Buffey, S. G., Cheung, K. C., Clarke, J. A., Der-
byshire, G. E., Ellis, M. J., Enderby, M. J., Grant, A. F., Holbourn, M. P., Laundy, D., Nave, C.,
Ryder, R., Stephenson, P., Helliwell, J. R. & Hasnain, S. S. (2005). A high-throughput structural
biology/proteomics beamline at the SRS on a new multipole wiggler. J. Synchrotron Rad.12,
455–466.
Cochran, W. & Howells, E. R. (1954). X-ray diffraction by a layer structure containing random displace-
ments.Acta Cryst. 7, 412–415.
Collaborative Computational Project, Number 4 (1994). TheCCP4 suite: programs for protein crystal-
lography.Acta Cryst. D50, 760–763.
Cowtan, K. D. & Main, P. (1993). Improvement of macromolecular electron-density maps by the simul-
taneous application of real and reciprocal space constraints.Acta Cryst. D49, 148–157.
Crowther, R. A. (1972). The fast rotation function. InThe Molecular Replacement Method, edited by
M. G. Rossmann, pp. 173–178. New York: Gordon & Breach.
Crowther, R. A. & Blow, D. M. (1967). A method of positioning aknown molecule in an unknown crystal
structure.Acta Cryst. 23, 544–548.
Cygler, M. & Desrochers, M. (1989). A full-symmetry translation function based on electron density.
Acta Cryst. A45, 563–572.
Czjzek, M., Arnoux, P., Haser, R. & Shepard, W. (2001). Structure of cytochromec7 from Desul-
furomonas acetoxidansat 1.9A resolution.Acta Cryst. D57, 670–678.
Dauter, Z., Botos, I., LaRonde-LeBlanc, N. & Wlodawer, A. (2005). Pathological crystallography: case
studies of several unusual macromolecular crystals.Acta Cryst. D61, 967–975.
DeLano, W. L. & Brunger, A. T. (1995). The direct rotation function: rotational Patterson correlation
search applied to molecular replacement.Acta Cryst. D51, 740–748.
Dornberger-Schiff, K. (1956). On order–disorder structures (OD-structures).Acta Cryst. 9, 593–601.
Dornberger-Schiff, K. & Dunitz, J. D. (1965). Pseudo-orthorhombic diffraction patterns and OD struc-
tures.Acta Cryst. 19, 471–472.
Dornberger-Schiff, K. & Grell-Niemann, H. (1961). On the theory of order–disorder (OD) structures.
Acta Cryst. 14, 167–177.
Dornberger-Schiff, K. & Schmittler, H. (1971). The determination of cyclicity, hexagonality and other
properties of polytypes.Acta Cryst. A27, 216–219.
Dube, P., Tavares, P., Lurz, R. & van Heel, M. (1993). The portal protein of bacteriophage SPP1: a DNA
pump with 13-fold symmetry.EMBO J. 12, 1303–1309.
203
Eberhard, E. D. & Gerlt, J. A. (2004). Evolution of function in the crotonase superfamily: the stereo-
chemical course of the reaction catalyzed by 2-ketocyclohexanecarboxyl-CoA hydrolase.J. Am.
Chem. Soc.126, 7188–7189.
Emsley, P. & Cowtan, K. (2004).Coot: model-building tools for molecular graphics.Acta Cryst. D60,
2126–2132.
Enemark, E. J. & Joshua-Tor, L. (2006). Mechanism of DNA translocation in a replicative hexameric
helicase.Nature (London), 442, 270–275.
Engel, C. K., Mathieu, M., Zeelen, J. P., Hiltunen, J. K. & Wierenga, R. K. (1996). Crystal structure of
enoyl-coenzyme A (CoA) hydratase at 2.5 angstroms resolution: a spiral fold defines the CoA-
binding pocket.EMBO J. 15, 5135–5145.
Esnouf, R. M. (1999). Further additions toMolScript version 1.4, including reading and contouring of
electron-density maps.Acta Cryst. D55, 938–940.
Evans, P. (2006). Scaling and assessment of data quality.Acta Cryst. D62, 72–82.
Evans, P. R. (1997). Scala.Jnt CCP4/ESF-EACMB Newslett. Protein Crystallogr.33, 22–24.
Fiser, A. & Sali, A. (2003).Modeller: generation and refinement of homology-based protein structure
models.Methods Enzymol.374, 461–491.
Flack, H. D. (1983). On enantiomorph-polarity estimation.Acta Cryst. A39, 876–881.
Flack, H. D. (1987). The derivation of twin laws for (pseudo-)merohedry by coset decomposition.Acta
Cryst. A43, 564–568.
Franken, S. M., Rozeboom, H. J., Kalk, K. H. & Dijkstra, B. W. (1991). Crystal structure of haloalkane
dehalogenase: an enzyme to detoxify halogenated alkanes.EMBO J. 10, 1297–1302.
Friedel, G. (1926).Lecons de Cristallographie. Paris: Blanchard.
Fujinaga, M. & Read, R. J. (1987). Experiences with a new translation-function program.J. Appl. Cryst.
20, 517–521.
Gerlt, J. A. & Babbitt, P. C. (2001). Divergent evolution of enzymatic function: mechanistically diverse
superfamilies and functionally distinct suprafamilies.Annu. Rev. Biochem.70, 209–246.
Giacovazzo, H. L., Monaco, H. L., Viterbo, D., Scordari, F.,Gilli, G., Zanotti, G. & Catti, M. (1992).
Fundamentals of Crystallography. Oxford: Oxford University Press.
Glykos, N. M. & Kokkinidis, M. (2003). Structure determination of a small protein through a 23-
dimensional molecular-replacement search.Acta Cryst. D59, 709–718.
Grell, H. & Dornberger-Schiff, K. (1982). Symbols for OD groupoid families referring to OD structures
(polytypes) consisting of more than one kind of layer.Acta Cryst. A38, 49–54.
Grimmer, H. (2003). Determination of all misorientations of tetragonal lattices with low multiplicity;
connection with Mallard’s rule of twinning.Acta Cryst. A59, 287–296.
204
Grininger, M., Ravelli, R. B. G., Heider, U. & Zeth, K. (2004). Expression, crystallization and crystallo-
graphic analysis of DegS, a stress sensor of the bacterial periplasm.Acta Cryst. D60, 1429–1431.
Grosse-Kunstleve, R. W. & Adams, P. D. (2001). Patterson correlation methods: a review of molecular
replacement withCNS. Acta Cryst. D57, 1390–1396.
Guasch, A., Pous, J., Ibarra, B., Gomis-Ruth, F. X., Valpuesta, J. M., Sousa, N., Carrascosa, J. L. & Coll,
M. (2002). Detailed architecture of a DNA translocating machine: the high-resolution structure of
the bacteriophage phi29 connector particle.J. Mol. Biol. 315, 663–676.
Guillet, V., Lapthorn, A., Fourniat, J., Benoit, J.-P., Hartley, R. W. & Mauguen, Y. (1993). Crystalliza-
tion and prelilminary X-ray investigation of barster, the intracellular inhibitor of barnase.Proteins
Struct. Funct. Genet.17, 325–328.
Gulbis, J. M., Kelman, Z., Hurwitz, J., O’Donnell, M. & Kuriyan, J. (1996). Structure of the C-terminal
region of p21WAF1/CIP1 complexed with human PCNA.Cell, 87(2), 297–306.
Guo, P., Peterson, C. & Anderson, D. (1987). Prohead and DNA-gp3-dependent ATPase activity of the
DNA packaging protein gp16 of bacteriophage phi29.J. Mol. Biol. 197, 229–236.
Hahn, T. & Klapper, H. (2003). Twinning of crystals. InPhysical Properties of Crystals, edited by A. Au-
thier, vol. D of International Tables for Crystallography, chap. 3.3. Dordrecht: Kluwer Academic
Publishers.
Hao, Q. (2006). Macromolecular envelope determination andenvelope-based phasing.Acta Cryst. D62,
909–914.
Harada, Y., Lifchitz, A., Berthou, J. & Jolles, P. (1981). A translation function combining packing and
diffraction information: an application to lysozyme (high-temperature form).Acta Cryst. A37,
398–406.
Hendrix, R. W. (1978). Symmetry mismatch and DNA packaging in large bacteriophages.Proc. Natl
Acad. Sci. USA, 75, 4779–4783.
Herbst-Irmer, R. & Sheldrick, G. M. (1998). Refinement of twinned structures withSHELXL97. Acta
Cryst. B54, 443–449.
Herbst-Irmer, R. & Sheldrick, G. M. (2002). Refinement of obverse/reverse twins.Acta Cryst. B58,
477–481.
Hill, K. E., Marchesi, J. R. & Weightman, A. J. (1999). Investigation of two evolutionarily unrelated
halocarboxylic acid dehalogenase gene families.J. Bacteriol. 181, 2535–2547.
Hisano, T., Hata, Y., Fujii, T., Liu, J. Q., Kurihara, T., Esaki, N. & Soda, K. (1996). Crystal structure ofL-
2-haloacid dehalogenase fromPseudomonas sp.YL. An α/β hydrolase structure that is different
from theα/β hydrolase fold.J. Biol. Chem.271, 20322–20330.
Hubbard, P. A., Yu, W., Schulz, H. & Kim, J.-J. P. (2005). Domain swapping in the low-similarity iso-
merase/hydratase superfamily: The crystal structure of rat mitochondrial∆3, ∆2-enoyl-CoA iso-
merase.Prot. Sci. 14, 1545–1555.
205
Huber, R. (1965). Die automatisierte Faltmolekulmethode. Acta Cryst. 19, 353–356.
Isidro, A., Santos, M. A., Henriques, A. O. & Tavares, P. (2004). The high-resolution functional map of
bacteriophage SPP1 portal protein.Mol. Microbiol. 51, 949–962.
Isupov, M. N. & Lebedev, A. A. (2008). NCS-constrained exhaustive search using oligomeric models.
Acta Cryst. D64, 90–98.
Isupov, M. N., Obmolova, G., Butterworth, S., Badet-Denisot, M.-A., Badet, B., Polikarpov, I., Lit-
tlechild, J. A. & Teplyakov, A. (1996). Substrate binding isrequired for assembly of the active
conformation of the catalytic site in Ntn amidotransferases: evidence from the 1.8A crystal struc-
ture of the glutaminase domain of glucosamine 6-phosphate synthase.Structure, 4, 801–810.
Jamrog, D. C., Zhang, Y. & Phillips Jr, G. N. (2003).SOMoRe: a multi-dimensional search and optimiza-
tion approach to molecular replacement.Acta Cryst. D59, 304–314.
Jekow, P., Schaper, S., Gunther, D., Tavares, P. & Hinrichs, W. (1998). Crystallization and preliminary X-
ray crystallographic studies of the 13-fold symmetric portal protein of bacteriophage SPP1.Acta
Cryst. D54, 1008–1011.
Jeong, J. I., Lattman, E. E. & Chirikjian, G. S. (2006). A method for finding candidate conformations for
molecular replacement using relative rotation between domains of a known structure.Acta Cryst.
D62, 398–409.
Jones, T. A., Zou, J.-Y., Cowan, S. W. & Kjeldgaard, M. (1991). Improved methods for building protein
models in electron density maps and the location of errors inthese models.Acta Cryst. A47,
110–119.
Kawarabayasi, Y., Hino, Y., Horikawa, H., Jin-no, K., Takahashi, M., Sekine, M., Baba, S., Ankai,
A., Kosugi, H., Hosoyama, A., Fukui, S., Nagai, Y., Nishijima, K., Otsuka, R., Nakazawa, H.,
Takamiya, M., Kato, Y., Yoshizawa, T., Tanaka, T., Kudoh, Y., Yamazaki, J., Kushida, N., Oguchi,
A., Aoki, K., Masuda, S., Yanagii, M., Nishimura, M., Yamagishi, A., Oshima, T. & Kikuchi,
H. (2001). Complete genome sequence of an aerobic thermoacidophilic crenarchaeon,Sulfolobus
tokodaiistrain 7.DNA Res.8, 123–140.
Keegan, R. M. & Winn, M. D. (2008).MrBUMP: an automated pipeline for molecular replacement.Acta
Cryst. D64, 119–124.
Keillor, J. W., Lherbet, C., Castonguay, R., Lapierre, D., Martinez-Oyanedel, J., Fothergill-Gilmore, L. A.
& Walkinshaw, M. D. (2003). Expression, purification, crystallization and preliminary crystallo-
graphic analysis ofTrypanosoma bruceiphosphofructokinase.Acta Cryst. D59, 532–534.
Kissinger, C. R., Gehlhaar, D. K. & Fogel, D. B. (1999). Rapidautomated molecular replacement by
evolutionary search.Acta Cryst. D55, 484–491.
Kovacs, J. A. & Wriggers, W. (2002). Fast rotational matching.Acta Cryst. D58, 1282–1286.
Krissinel, E. & Henrick, K. (2004). Secondary-structure matching (SSM), a new tool for fast protein
structure alignment in three dimensions.Acta Cryst. D60, 2256–2268.
206
Krissinel, E. & Henrick, K. (2005). Detection of protein assemblies in crystals. InFirst International
Symposium CompLife 2005, Konstanz, Germany, September 25–27, 2005, Proceedings, edited
by M. R. Berthold, R. Glen, K. Diederichs, O. Kohlbacher & I. Fischer, pp. 163–174. Berlin,
Heidelberg: Springer-Verlag.
Ladner, R. C., Heidner, E. J. & Perutz, M. F. (1977). The structure of horse methaemoglobin at 2.0A
resolution.J. Mol. Biol. 114, 385–413.
Langs, D. A. (1975). Translation vector functions based on adeconvolution of the Patterson function
provided by transform methods.Acta Cryst. A31, 543–550.
Laskowski, R. A., MacArthur, M. W., Moss, D. S. & Thornton, J.M. (1993).PROCHECK: a program to
check the stereochemical quality of protein structures.J. Appl. Cryst.26, 283–291.
Le Page, Y. (2002). Mallard’s law recast as a Diophantine system: fast and complete enumeration of
possible twin laws by [reticular] [pseudo] merohedry.J. Appl. Cryst.35, 175–181.
Lebedev, A. A., Krause, M. H., Isidro, A. L., Vagin, A. A., Orlova, E. V., Turner, J., Dodson, E. J.,
Tavares, P. & Antson, A. A. (2007). Structural framework forDNA translocation via the viral
portal protein.EMBO J. 26, 1984–1994.
Lebedev, A. A., Vagin, A. A. & Murshudov, G. N. (2006). Intensity statistics in twinned crystals with
examples from the PDB.Acta Cryst. D62, 83–95.
Lebedev, A. A., Vagin, A. A. & Murshudov, G. N. (2008). Model preparation inMOLREPand examples
of model improvement using X-ray data.Acta Cryst. D64, 33–39.
Lee, S., Sawaya, M. R. & Eisenberg, D. (2003). Structure of superoxide dismutase fromPyrobaculum
aerophilumpresents a challenging case in molecular replacement with multiple molecules, pseudo-
symmetry and twinning.Acta Cryst. D59, 2191–2199.
Leonard, P. M., Brzozowski, A. M., Lebedev, A., Marshall, C.M., Smith, D. J., Verma, C. S., Wal-
ton, N. J. & Grogan, G. (2006). The 1.8A resolution structure of hydroxycinnamoyl-coenzyme
A hydratase-lyase (HCHL) fromPseudomonas fluorescens, an enzyme that catalyses the transfor-
mation of feruloyl-coenzyme A to vanillin.Acta Cryst. D62, 1494–1501.
Leonard, P. M., Marshall, C. M., Dodson, E. J., Walton, N. J. &Grogan, G. (2004). Purification,
crystallization and preliminary X-ray crystallographic analysis of hydroxycinnamoyl-coenzyme
A hydratase-lyase (HCHL), a crotonase homologue active in phenylpropanoid metabolism.Acta
Cryst. D60, 2343–2345.
Leslie, A. G. W. (1992).Jnt CCP4/ESF-EACMB Newslett. Protein Crystallogr.26.
Leslie, A. G. W. (2006). The integration of macromolecular diffraction data.Acta Cryst. D62, 48–57.
Levdikov, V. M., Blagova, E., Colledge, V. L., Lebedev, A. A., Williamson, D. C., Sonenshein, A. L.
& Wilkinson, A. J. (2009). Structural rearrangement accompanying ligand binding in the GAF
domain of CodY fromBacillus subtilis. J. Mol. Biol. 390, 1007–1018.
207
Levdikov, V. M., Blagova, E., Joseph, P., Sonenshein, A. L. &Wilkinson, A. J. (2006). The structure
of CodY, a GTP- and isoleucine-responsive regulator of stationary phase and virulence in gram-
positive bacteria.J. Biol. Chem.281, 11366–11373.
Li, T., Ji, X., Sun, F., Gao, R., Cao, S., Feng, Y. & Rao, Z. (2002). Crystallization and preliminary
X-ray analysis of recombinant histone HPhA from the hyperthermophilic archaeonPyrococcus
horikoshiiOT3.Acta Cryst. D58, 870–871.
Lilien, R. H., Bailey-Kellogg, C., Anderson, A. C. & Donald,B. R. (2004). A subgroup algorithm to
identify cross-rotation peaks consistent with non-crystallographic symmetry.Acta Cryst. D60,
1057–1067.
Litvin, D. B. (1977). The molecular replacement method. II.The translation function problem; a new
translation function.Acta Cryst. A33, 62–70.
Liu, Q., Weaver, A. J., Xiang, T., Thiel, D. J. & Hao, Q. (2003). Low-resolution molecular replacement
using a six-dimensional search.Acta Cryst. D59, 1016–1019.
Long, F., Vagin, A. A., Young, P. & Murshudov, G. N. (2008).BALBES: a molecular-replacement
pipeline.Acta Cryst. D64, 125–132.
Lougheed, J. C., Holton, J. M., Alber, T., Bazan, J. F. & Handel, T. M. (2001). Structure of melanoma
inhibitory activity protein, a member of a recently identified family of secreted proteins.Proc. Natl
Acad. Sci. USA, 98, 5515–5520.
Lunin, V. Y., Lunina, N. L. & Baumstark, M. W. (2007). Estimates of the twinning fraction for macro-
molecular crystals using statistical models accounting for experimental errors.Acta Cryst. D63,
1129–1138.
Lurz, R., Orlova, E. V., Gunther, D., Dube, P., Droge, A., Weise, F., van Heel, M. & Tavares, P. (2001).
Structural organisation of the head-to-tail interface of abacterial virus.J. Mol. Biol. 310, 1027–
1037.
Main, P. & Rossmann, M. G. (1966). Relationship among structure factors due to identical molecules in
different crystallographic environments.Acta Cryst. 21, 67–72.
Makino, D. L., Henschen-Edman, A. H., Larson, S. B. & McPherson, A. (2007). Bence Jones KWR
protein structures determined by X-ray crystallography.Acta Cryst. D63, 780–792.
Makino, D. L., Henschen-Edman, A. H. & McPherson, A. (2005a). Four crystal forms of a Bence-Jones
protein.Acta Cryst. F61, 79–82.
Makino, D. L., Larson, S. B. & McPherson, A. (2005b). Preliminary analysis of crystals of panicum
mosaic virus (PMV) by X-ray diffraction and atomic force microscopy.Acta Cryst. D61, 173–
179.
Mancheno, J. M., Martin-Benito, J., Martinez-Ripoll, M., Gavilanes, J. G. & Hermoso, J. A. (2003).
Crsytal and electron microscopy structures of sticholysinII actinoporin refeal insights into the
mechanism of membrane pore formation.Structure, 11, 1319–1328.
208
Matthews, B. W. (1968). Solvent content of protein crystals. J. Mol. Biol. 33, 491–497.
McCoy, A. J., Grosse-Kunstleve, R. W., Adams, P. D., Winn, M.D., Storoni, L. C. & Read, R. J. (2007).
Phasercrystallographic software.J. Appl. Cryst.40, 658–674.
Mighell, A. D. & Rodgers, J. R. (1980). Lattice symmetry determination.Acta Cryst. A36, 321–326.
Millward, G. R., Ramdas, S., Thomas, J. M. & Barlow, M. T. (1983). Evidence for semi-regularly ordered
sequences of mirror and inversion symmetry planes in ZSM-5/ZSM-11 shape-selective zeolitic
catalysts.J. Chem. Soc. Faraday Trans. 2, 79, 1075–1082.
Modis, Y., Filppula, S. A., Novikov, D. K., Norledge, B., Hiltunen, J. K. & Wierenga, R. K. (1998). The
crystal structure of dienoyl-CoA isomerase at 1.5A resolution reveals the importance of aspartate
and glutamate sidechains for catalysis.Structure, 6, 957–970.
Morais, M. C., Choi, K. H., Koti, J. S., Chipman, P. R., Anderson, D. L. & Rossmann, M. G. (2005).
Conservation of the capsid structure in tailed dsDNA bacteriophages: the pseudoatomic structure
of phi29.Mol. Cell, 18, 149–159.
Morales, R., Kachalova, G., Vellieux, F., Charon, M.-H. & Frey, M. (2000). Crystallographic studies of
the interaction between the ferredoxin-NADP+ reductase and ferredoxin from the cyanobacterium
Anabaena: looking for the elusive ferredoxin molecule.Acta Cryst. D56, 1408–1412.
Morgan, N., Pereira, I. A. C., Andersson, I., Adlington, R. M., Baldwin, J. E., Cole, S. E., Crouch,
N. P. & Sutherland, J. D. (1994). Substrate specificity of recombinant streptomyces clabuligerus
deacetoxycepalosporin C synthase.Bioorg. Med. Chem. Lett.4, 1595–1600.
Morita, M., Tasaka, M. & Fujisawa, H. (1993). DNA packaging ATPase of bacteriophage T3.Virology,
193, 748–752.
Muirhead, H., Cox, J. M., Mazzarella, L. & Perutz, M. F. (1967). Structure and function of haemoglobin:
III. A three-dimensional fourier synthesis of human deoxyhaemoglbin at 5.5A resolution.J. Mol.
Biol. 28, 117–150.
Muller, P., Herbst-Irmer, R., Spek, A. L. & Schneider, T. R.(2006).Crystal Structure Refinement: A
Crystallographer’s Guide to SHELXL. Oxford: Oxford University Press.
Muraki, M., Ishimura, M. & Harata, K. (2002). Interactions of wheat-germ agglutinin with
GlcNAcβ1,6Gal sequence.Biochim. Biophys. Acta, 1569, 10–20.
Murshudov, G. N., Vagin, A. A. & Dodson, E. J. (1997). Refinement of macromolecular structures by the
maximum-likelihood method.Acta Cryst. D53, 240–255.
Mursula, A. M., van Aalten, D. M. F., Hiltunen, J. K. & Wierenga, R. K. (2001). The crystal structure of
3-2-enoyl-CoA isomerase.J. Mol. Biol. 309, 845–853.
Murzin, A. G., Brenner, S. E., Hubbard, T. & Chothia, C. (1995). SCOP: a structural classification of
proteins database for the investigation of sequences and structures.J. Mol. Biol. 247, 536–540.
209
Nakai, T., Ishijima, J., Masui, R., Kuramitsu, S. & Kamiya, N. (2003). Structure ofThermus ther-
mophilusHB8 H-protein of the glycine-cleavage system, resolved by asix-dimensional molecular-
replacement method.Acta Cryst. D59, 1610–1618.
Narbad, A. & Gasson, M. J. (1998). Metabolism of ferulic acidvia vanillin using a novel CoA-dependent
pathway in a newly isolated strain ofPseudomonas fluorescens. Microbiology, 144, 1397–1405.
Navaza, J. (1987). On the fast rotation function.Acta Cryst. A43, 645–653.
Navaza, J. (1990). Accurate computation of the rotation matrices.Acta Cryst. A46, 619–620.
Navaza, J. (1993). On the computation of the fast rotation function.Acta Cryst. D49, 588–591.
Navaza, J. (2001). Implementation of molecular replacement in AMoRe. Acta Cryst. D57, 1367–1372.
Navaza, J., Panepucci, E. H. & Martin, C. (1998). On the use ofstrong Patterson function signals in
many-body molecular replacement.Acta Cryst. D54, 817–821.
Navaza, J. & Vernoslova, E. (1995). On the fast translation functions for molecular replacement.Acta
Cryst. A51, 445–449.
Needleman, S. B. & Wunsch, C. D. (1970). A general method applicable to the search for similarities in
the amino acid sequence of two proteins.J. Mol. Biol. 48, 443–453.
Nespolo, M. & Ferraris, G. (2004). Applied geminography – symmetry analysis of twinned crystals and
definition of twinning by reticular polyholohedry.Acta Cryst. A60, 89–95.
Nespolo, M., Ferraris, G., Durovic, S. & Takeuchi, Y. (2004). Twins vs. modular crystal structures.Z.
Kristallogr. 219, 773–778.
Nordman, C. E. & Nakatsu, K. (1963). Interpretation of the Patterson function of crystals containing a
known molecular fragment. The structure of an alstonia alkaloid. J. Am. Chem. Soc.85, 353–354.
Oksanen, E., Jaakola, V.-P., Tolonen, T., Valkonen, K.,Akerstrom, B., Kalkkinen, N., Virtanen, V. &
Goldman, A. (2006). Reindeerβ-lactoglobulin crystal structure with pseudo-body-centred non-
crystallographic symmetry.Acta Cryst. D62, 1369–1374.
Oliveira, L., Alonso, J. C. & Tavares, P. (2005). A defined in vitro system for DNA packaging by the
bacteriophage SPP1: insights into the headful packaging mechanism.J. Mol. Biol. 353, 529–539.
Oliveira, L., Henriques, A. O. & Tavares, P. (2006). Modulation of the viral ATPase activity by the portal
protein correlates with DNA packaging efficiency.J. Biol. Chem.281, 21914–21923.
Orlova, E. V., Dube, P., Beckmann, E., Zemlin, F., Lurz, R., Trautner, T. A., Tavares, P. & van Heel, M.
(1999). Structure of the 13-fold symmetric portal protein of bacteriophage SPP1.Nat. Struct. Biol.
6, 842–846.
Orlova, E. V., Gowen, B., Droge, A., Stiege, A., Weise, F., Lurz, R., van Heel, M. & Tavares, P. (2003).
Structure of a viral DNA gatekeeper at 10A resolution by cryo-electron microscopy.EMBO J. 22,
1255–1262.
210
Otwinowski, Z. & Minor, W. (1997). Processing of X-ray diffraction data collected in oscillation mode.
Methods Enzymol.276, 307–326.
Pavelcik, F. (2006). Phased rotation, conformation and translation function: theory and computer pro-
gram.J. Appl. Cryst.39, 483–486.
Pena, V., Liu, S., Bujnicki, J. M., Luhrmann, R. & Wahl, M. C.(2007). Structure of a multipartite protein-
protein interaction domain in splicing factor Prp8 and its link to Retinitis Pigmentosa. Mol. Cell,
25, 615–624.
Perrakis, A., Morris, R. M. & Lamzin, V. S. (1999). Automatedprotein model building combined with
iterative structure refinement.Nat. Struct. Biol.6, 458–463.
Potterton, L., McNicholas, S., Krissinel, E., Gruber, J., Cowtan, K., Emsley, P., Murshudov, G. N., Cohen,
S., Perrakis, A. & Noble, M. (2004). Developments in theCCP4 molecular-graphics project.Acta
Cryst. D60, 2288–2294.
R Development Core Team, (2005).R: A Language and Environment for Statistical Computing. R Foun-
dation for Statistical Computing, Vienna, Austria. http://www.R-project.org.
Rees, D. C. (1980). The influence of twinning by merohedry on intensity statistics.Acta Cryst. A36,
578–581.
Rossmann, M. G. & Blow, D. M. (1962). The detection of sub-units within the crystallographic asym-
metric unit.Acta Cryst. 15, 24–31.
Rossmann, M. G. & Blow, D. M. (1963). Determination of phasesby the conditions of non-
crystallographic symmetry.Acta Cryst. 16, 39–45.
Rossmann, M. G. & Blow, D. M. (1964). Solution of the phase equations representing non-
crystallographic symmetry.Acta Cryst. 17, 1474–1475.
Rossmann, M. G., Blow, D. M., Harding, M. M. & Coller, E. (1964). The relative positions of independent
molecules within the same asymmetric unit.Acta Cryst. 17, 338–342.
Rudolph, M. G., Kelker, M. S., Schneider, T. R., Yeates, T. O., Oseroff, V., Heidary, D. K., Jennings,
P. A. & Wilson, I. A. (2003). Use of multiple anomalous dispersion to phase highly merohedrally
twinned crystals of interleukin-1β. Acta Cryst. D59, 290–298.
Rye, C. A., Isupov, M. N., Lebedev, A. A. & Littlechild, J. A. (2007). An order–disorder twin crystal of
L-2-haloacid dehalogenase fromSulfolobus tokodaii. Acta Cryst. D63, 926–930.
Rye, C. A., Isupov, M. N., Lebedev, A. A. & Littlechild, J. A. (2009). Biochemical and structural studies
of a L-haloacid dehalogenase from the thermophilic archaeonSulfolobus tokodaii. Extremophiles,
13, 179–190.
Sanders, C. M., Kovalevskiy, O. V., Sizov, D., Lebedev, A. A., Isupov, M. N. & Antson, A. A. (2007).
Papillomavirus E1 helicase assembly maintains an asymmetric state in the absence of DNA and
nucleotide cofactors.Nucleic Acids Res.35, 6451–6457.
211
Schroder, E., Littlechild, J. A., Lebedev, A. A., Errington, N., Vagin, A. A. & Isupov, M. N. (2000).
Crystal structure of decameric 2-Cys peroxiredoxin from human erythrocytes at 1.7A resolution.
Structure, 8, 605–615.
Schuermann, J. P. & Tanner, J. J. (2003). MRSAD: using anomalous dispersion from S atoms collected
at CuKα wavelength in molecular-replacement structure determination. Acta Cryst. D59, 1731–
1736.
Schwarzenbacher, R., Godzik, A., Grzechnik, S. K. & Jaroszewski, L. (2004). The importance of align-
ment accuracy for molecular replacement.Acta Cryst. D60, 1229–1236.
Schwarzenbacher, R., Godzik, A. & Jaroszewski, L. (2008). The JCSG MR pipeline: optimized align-
ments, multiple models and parallel searches.Acta Cryst. D64, 133–140.
Schwede, T., Kopp, J., Guex, N. & Peitsch, M. C. (2003).SWISS-MODEL: an automated protein
homology-modeling server.Nucleic Acids Res.31, 3381–3385.
Scouloudi, H. (1960). The crystal structure of myoglobin. VI. Seal myoglobin.Proc. R. Soc. A258,
181–201.
Shan, L., Lu, J.-X., Gan, J.-H., Wang, Y.-H., Huang, Z.-X. & Xia, Z.-X. (2005). Structure of the F58W
mutant of cytochromeb5: the mutation leads to multiple conformations and weakens stacking
interactions.Acta Cryst. D61, 180–189.
Sheldrick, G. M. (2008). A short history ofSHELX. Acta Cryst. A64, 112–122.
Sheriff, S., Klei, H. E. & Davis, M. E. (1999). Implementation of a six-dimensional search using the
AMoRetranslation function for difficult molecular-replacementproblems.J. Appl. Cryst.32, 98–
101.
Shevtsov, M. B., Chen, Y., Gollnick, P. & Antson, A. A. (2005). Crystal structure ofBacillus subtilis
anti-TRAP protein, an antagonist of TRAP/RNA interaction.Proc. Natl Acad. Sci. USA, 102,
17600–17605.
Simpson, A. A., Tao, Y., Leiman, P. G., Badasso, M. O., He, Y.,Jardine, P. J., Olson, N. H., Morais,
M. C., Grimes, S., Anderson, D. L., Baker, T. S. & Rossmann, M.G. (2000). Structure of the
bacteriophage phi29 DNA packaging motor.Nature (London), 408, 745–750.
Slater, J. H. (1982). New microbes to tackle toxic compounds. S. Afr. J. Sci.78, 101–104.
Slater, J. H., Bull, A. T. & Hardman, D. J. (1997). Microbial dehalogenation of halogenated alkanoic
acids, alcohols and alkanes.Adv. Microb. Physiol.38, 133–176.
Smith, D. E., Tans, S. J., Smith, S. B., Grimes, S., Anderson,D. L. & Bustamante, C. (2001). The bac-
teriophage phi29 portal motor can package DNA against a large internal force.Nature (London),
413, 748–752.
Strokopytov, B. V., Fedorov, A., Mahoney, N. M., Kessels, M., Drubin, D. G. & Almo, S. C. (2005).
Phased translation function revisited: structure solution of the cofilin-homology domain from yeast
actin-binding protein 1 using six-dimensional searches.Acta Cryst. D61, 285–293.
212
Strop, P., Brzustowicz, M. R. & Brunger, A. T. (2007).Ab initio molecular-replacement phasing for
symmetric helical membrane proteins.Acta Cryst. D63, 188–196.
Stuart, A. & Ord, J. K. (1994).Distribution Theory, vol. 1 of Kendall’s Advanced Theory of Statistics,
chap. 3. London: Edward Arnold.
Stuart, A., Ord, J. K. & Arnold, S. (1999).Classical Inference and the Linear Model, vol. 2A of Kendall’s
Advanced Theory of Statistics, chap. 17. Oxford: Oxford University Press.
Stubbs, M. T. & Huber, R. (1991). An analytical packing function employing Fourier transforms.Acta
Cryst. A47, 521–526.
Sugishima, M., Sakamoto, H., Kakuta, Y., Omata, Y., Hayashi, S., Noguchi, M. & Fukuyama, K. (2002).
Crystal structure of rat apo-heme oxygenase-1 (HO-1): mechanism of heme binding in HO-1
inferred from structural comparison of the apo and heme complex forms.Biochemistry, 41, 7293–
7300.
Suhre, K. & Sanejouand, Y. H. (2004).ElNemo: a normal mode web-server for protein movement anal-
ysis and the generation of templates for molecular replacement.Nucleic Acids Res.32, W610–
W614.
Tavares, P., Santos, M. A., Lurz, R., Morelli, G., de Lencastre, H. & Trautner, T. A. (1992). Identification
of a gene inBacillus subtilisbacteriophage SPP1 determining the amount of packaged DNA.J.
Mol. Biol. 225, 81–92.
Ten Eyck, L. F. (1977). Efficient structure-factor calculation for large molecules by the fast Fourier trans-
form. Acta Cryst. A33, 486–492.
Tollin, P. (1966). On the determination of molecular location.Acta Cryst. 21, 613–614.
Tollin, P. & Rossmann, M. G. (1966). A description of variousrotation function programs.Acta Cryst.
21, 872–876.
Tong, L. (2001). How to take advantage of non-crystallographic symmetry in molecular replacement:
‘locked’ rotation and translation functions.Acta Cryst. D57, 1383–1389.
Tong, L. & Rossmann, M. G. (1990). The locked rotation function.Acta Cryst. A46, 783–792.
Trame, C. B. & McKay, D. B. (2001). Structure ofHaemophilus influenzaeHslU protein in crystals with
one-dimensional disorder twinning.Acta Cryst. D57, 1079–1090.
Trapani, S., Abergel, C., Gutsche, I., Horcajada, C., Fita,I. & Navaza, J. (2006). Combining experimental
data for structure determination of flexible multimeric macromolecules by molecular replacement.
Acta Cryst. D62, 467–475.
Trapani, S. & Navaza, J. (2006). Calculation of spherical harmonics and Wignerd functions by FFT. Ap-
plications to fast rotational matching in molecular replacement and implementation intoAMoRe.
Acta Cryst. A62, 262–269.
Trapani, S., Siebert, X. & Navaza, J. (2007). The concept of resolution in the domain of rotations.Acta
Cryst. A63, 126–130.
213
Truglio, J. J., Theis, K., Feng, Y., Gajda, R., Machutta, C.,Tonge, P. J. & Kisker, C. (2003). Crystal
structure ofMycobacterium tuberculosisMenB, a key enzyme in vitamin K2 biosynthesis.J. Biol.
Chem.278, 42352–42360.
Trus, B. L., Cheng, N., Newcomb, W. W., Homa, F. L., Brown, J. C. & Steven, A. C. (2004). Structure and
polymorphism of the UL6 portal protein of herpes simplex virus type 1.J. Virol. 78, 12668–12671.
Tsao, J., Chapman, M. S. & Rossmann, M. G. (1992).Ab initio phase determination for viruses with high
symmetry: a feasibility study.Acta Cryst. A48, 293–301.
Uppenberg, J., Oehrner, N., Norin, M., Hult, K., Kleywegt, G. J., Patkar, S., Waagen, V., Anthonsen, T.
& Jones, T. A. (1995). Crystallographic and molecular-modeling studies of lipase B fromCandida
antarctica reveal a stereospecificity pocket for secondary alcohols.Biochemistry, 34, 16838–
16851.
Vagin, A. & Teplyakov, A. (1997).MOLREP: an automated program for molecular replacement.J. Appl.
Cryst. 30, 1022–1025.
Vagin, A. & Teplyakov, A. (1998). A translation-function approach for heavy-atom location in macro-
molecular crystallography.Acta Cryst. D54, 400–402.
Vagin, A. & Teplyakov, A. (2000). An approach to multi-copy search in molecular replacement.Acta
Cryst. D56, 1622–1624.
Vagin, A. A. (1983). Ph.D. thesis, Institute of Crystallography, Moscow.
Vagin, A. A. & Isupov, M. N. (2001). Spherically averaged phased translation function and its application
to the search for molecules and fragments in electron-density maps.Acta Cryst.D57, 1451–1456.
Vaguine, A. A., Richelle, J. & Wodak, S. J. (1999).SFCHECK: a unified set of procedures for evaluating
the quality of macromolecular structure-factor data and their agreement with the atomic model.
Acta Cryst. D55, 191–205.
Valpuesta, J. M. & Carrascosa, J. L. (1994). Structure of viral connectors and their function in bacterio-
phage assembly and DNA packaging.Q. Rev. Biophys.27, 107–155.
Wang, J., Kamtekar, S., Berman, A. J. & Steitz, T. A. (2005). Correction of X-ray intensities from single
crystals containing lattice-translocation defects.Acta Cryst. D61, 67–74.
Wilson, A. J. C. (1949). The probability distribution of X-ray intensities.Acta Cryst. 2, 318–321.
Winn, M. D., Isupov, M. N. & Murshudov, G. N. (2001). Use of TLSparameters to model anisotropic
displacements in macromolecular refinement.Acta Cryst. D57, 122–133.
Yeates, T. O. (1988). Simple statistics for intensity data from twinned specimens.Acta Cryst.A44, 142–
144.
Yeates, T. O. & Fam, B. C. (1999). Protein crystals and their evil twins. Structure, 7, R25–R29.
Yeates, T. O. & Rini, J. M. (1990). Intensity-based domain refinement of oriented but unpositioned molec-
ular replacement models.Acta Cryst. A46, 352–359.
214
Zhang, X.-J. & Matthews, B. W. (1994). Enhancement of the method of molecular replacement by incor-
poration of known structural information.Acta Cryst. D50, 675–686.
Zhou, Z. & Gong, W. (2004). Co-crystallization ofLeptospira interroganspeptide deformylase with a
potent inhibitor and molecular-replacement schemes with eight subunits in an asymmetric unit.
Acta Cryst. D60, 137–139.
215