on the aerodynamics of tractor-trailers - extra materials
TRANSCRIPT

On the Aerodynamics of Tractor-Trailers
M. Hammache and F. Browand
Dept. of Aerospace and Mechanical Engineering, University of SouthernCalifornia
Abstract
Wind tunnel experiments on the aerodynamics of tractor-trailer models showthat the drag on the model is sensitive to the width of the tractor-trailer gap(G) and to the angle of yaw with respect to wind direction. At zero-yaw,relatively low drag is measured up to a critical gap width G/÷A ª 0.5, where Ais the cross-sectional area. At the critical width the drag experiences a sharpand large increase; most of the drag contribution is attributed to the traileralone. As the gap is widened further, tractor and trailer become increasinglydecoupled from each other and the drag reaches a near-plateau, rising muchmore gradually.
DPIV measurements in horizontal planes in the gap show that the flow issteady and consists of a relatively stable, symmetric toroidal vortex when thewidth is below critical. The symmetry breaks down at the critical gap, asevidenced by intermittent ejections of flow from the cavity to either side of themodel. These ejections are believed to be at the origin of the sharp increase intrailer drag. As the gap width is increased further, the nature of the flowtransitions from cavity-like to wake-like.
These observations can be qualitatively extended to moderate yaw angles(up to ~4 degrees), but the size of the critical gap width diminishes with yawangle. At higher angles, the drag rises much faster with gap width.
The second part of this paper discusses the drag savings that can berealized by arranging two truck-like models in a tandem. Four tandems wereformed by combining two models; each of the models was either "rounded"(i.e. lower drag) or "blunt" (higher drag). The drag of any tandem is generallylower than the sum of the drags of the models in isolation. However, the dragsavings also depends on the choice of models (rounded vs. blunt) and onwhich model is placed in front. A rounded model followed by a blunt modelachieves the most relative drag savings, while reversing the order produces thetandem with the least savings.

186 M. Hammache and F. Browand
Introduction
At typical cruising highway speeds, most of the fuel consumed by a large scaleroad vehicle is expended to simply overcome aerodynamic drag, even in theabsence of unfavorable wind conditions. The remaining fuel expenditure isneeded to overcome the rolling resistance on tires and internal losses. The fuelefficiency of tractor-trailers, which account for the greatest portion of heavyvehicle traffic by a large margin, is influenced by the shape and physicaldimensions of these vehicles. Shape and scale are themselves severelyconstrained by economic considerations (the parallelepiped shape of trailers ismeant to optimize volume loading) and by regulatory constraints (truckdimensions are fixed and drag-reduction devices cannot exceed specifiedlimits).
A look at the evolution of tractor-trailer design over the last severaldecades reveals gradual aerodynamic improvements to the front of vehicles,namely from the front of the tractor to the front of the trailer, but very littlehas been done to improve the back of trailers. Tractors have benefited fromtremendous improvements, such as the adoption of the aero-shield as anintegrated part of the cab. The problem of the gap between tractor and trailer,which is an important source of drag, has been partly mitigated by theintroduction of cab extenders that effectively reduce the size of the gap but donot eliminate it entirely.
In contrast, trailers have seen little modification, aside from the roundingof their vertical leading edges in the front. The fact that hard-shell trailers aredesigned to be loaded from the back makes the implementation of dragreduction devices in the back particularly challenging. Truck operators areextremely reluctant to deal with any type of physical device that may interferewith routine loading and unloading operations.
The main objective of this paper is to investigate the impact of tractor-trailer gap width on the drag forces experienced by a truck. The study relies ondetailed measurements performed on truck models in a wind tunnel. Thesemodels are not replicas of actual trucks that can be seen on the roads, butrather truck-like shapes. While these shapes are simplified to the extent thatthey do not incorporate any of the secondary features of real vehicles (such asmirrors, handlebars, cab extenders, etc…), they do capture the first ordereffects that account for virtually all aerodynamic forces acting on a real truck.Also, it is worth noting that Reynolds number matching is not achievable inour flow facility because of limitations on model size and flow speeds.However, the experiments discussed here are not meant to simulate the flowaround an actual tractor trailer. Instead, the goal is to unveil relevant flowphysics that can be generalized, at least to a first order, to higher Reynoldsnumbers. The simplified shapes also have the advantage of lending themselvesto numerical computations. The elimination of detailed features on the modelsallows numerical computations to be conducted without the costly burden of

On the Aerodynamics of Tractor-Trailers 187
complicated grids. As a result, the present data constitutes a suitablebenchmark for various Computational Fluid Dynamics codes.
The truck models were mounted on a turn-table, which allows simulationsof side wind by turning the truck with respect to the incoming free-stream.The turntable rotation is motorized and allows wind tunnel tests to beperformed at angles of yaw up to 30 degrees. Digital particle imagevelocimetry (DPIV) measurements were obtained of the flow field in the gapbetween tractor and trailer at different combinations of gap width and angle ofyaw. The tractor and trailer were mounted on separate force balances thatmeasured three forces (drag, side and lift) and three moments (yawing,pitching and rolling), although this paper is restricted to a discussion of dragand side force measurements. The use of two separate balances allowed a betterunderstanding of the respective contributions of tractor and traileraerodynamic loads to the aggregate loads exerted on the truck as a whole.
In the second part of this paper, we examine the aerodynamic drag of twotrucks in a tandem configuration at zero-yaw. Considerable fuel savings foreach vehicle in a platoon of road vehicles (in comparison to the same vehiclestraveling in isolation) have been observed in the past. The present experimentsserve to quantify the drag savings and unveil some surprising and counter-intuitive characteristics of dual-vehicle platoons. Some of these results arebelieved to be applicable to multi-vehicle platoons as well.
The flow facility
Experiments were conducted in the test section of the Dryden wind tunnel atUSC, a re-circulating flow facility with a top speed of 30 m/s. The test sectionis octagonal in cross section; the sides of the octagon are 1.37 m apart. For thepurpose of ground vehicle studies, a ground-plane has been placed in the windtunnel such that 5 sides of the octagon lie above the plane. The ground-planeis actually a shallow box that spans the width of the wind tunnel, 1.37 m, andis approximately 5.8 m in length. The ground-plane box houses a stepper-motor-controlled traverse that opens and closes the gap by moving the trailerin the downstream direction. The position of the tractor is fixed. Both tractorand trailer rest on an interior turntable of diameter 1.22 m to allow the modelsto be yawed with respect to the flow direction, as shown in Figure 1. Theground-plane box is mounted in the tunnel at a very slight angle of attack (onedegree) to compensate for boundary layer growth on the walls of the windtunnel. The front edge of the box, which is aligned with the end of thecontraction section and the beginning of the test section, is rounded to avoidleading-edge separation. The surface of the ground-plane consists of asandwich of punched plates—the smallest holes, 1mm in diameter on 4 mmcenters, are in the topmost plate. Slight suction is applied to the plenumbelow the porous top surface to maintain a thin boundary layer. The pressuregradient, dCp/dx—measured along the wind tunnel ceiling—is approximatelyzero (±0.003/m) when the tunnel is empty.

188 M. Hammache and F. Browand
The measurements are performed at a wind tunnel speed of approximately26 m/s. The model Reynolds number for the tests, based upon the squareroot of the truck cross-sectional area, ÷A, is about 310,000.
Figure 1. Detail of turntable and traverse mechanism inside ground plane.
The truck models
All models are made of high-density Spyder-foam and machined on a CNCmachine. The use of this material allows for rapid prototyping, whereby theshape could be modified quickly and accurately, which reduces turnaroundtime. The models are roughly 1/15-scale, with no linkage between tractor andtrailer. Figure 2 shows a schematic of the tractor and trailer shapes. The tractormodel is covered with netting material that consists of a thin plastic mesh.Thanks to the netting, the tractor surface is made rough, which keeps theboundary layer attached but makes the boundary layer thicker. The verticalleading edges of the tractor are rounded to a radius of curvature of 4.55 cm tokeep the flow from separating prematurely.

On the Aerodynamics of Tractor-Trailers 189
Figure 2. Schematics of tractor and trailer with dimensions.
As Figure 1 illustrates, the position of the tractor is fixed with respect to theturn-table, while the trailer is mounted on a motorized traverse so that the gapwidth between the two bodies can be varied continuously. The vertical leadingedges on the front face of the trailer are also rounded with a radius ofcurvature of 4.55 cm.
The effect of leading edge rounding on the drag
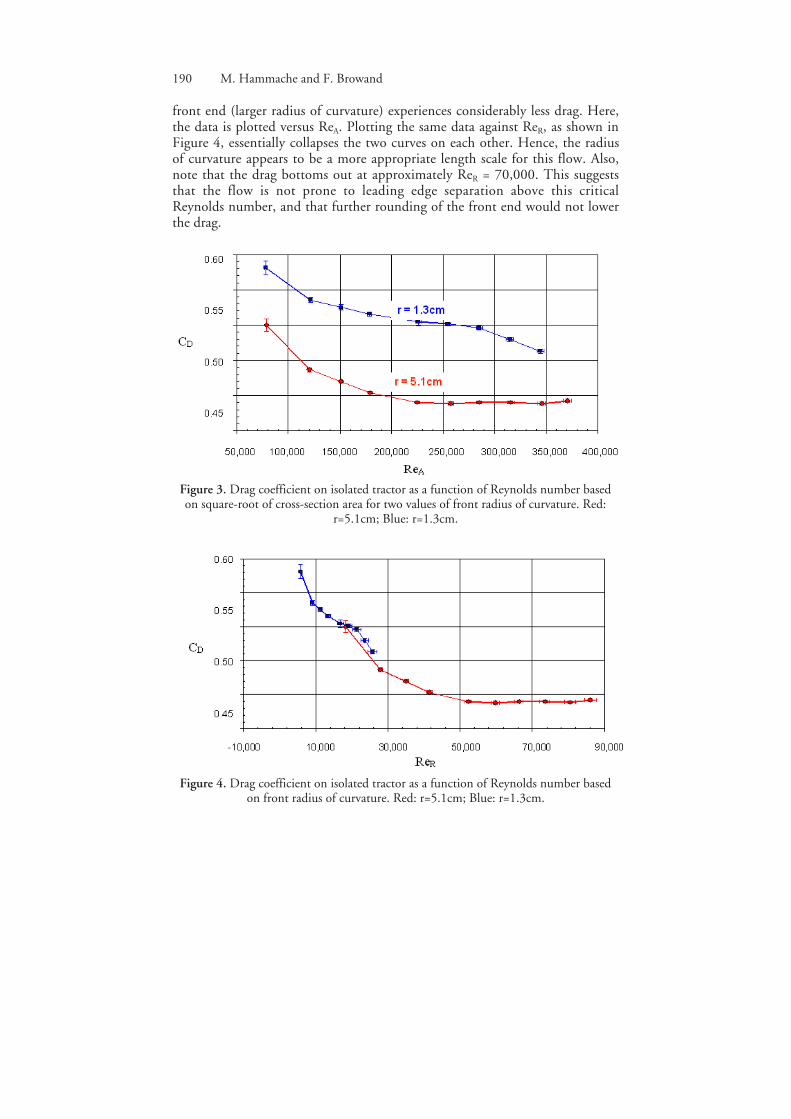
The drag of a road vehicle (or any body shape in general) is greatly influencedby the degree of bluntness at the front end, e.g. Cooper (1985). In the presentcase, the degree of bluntness is determined by the radius of curvature at theleading-edges of the tractor and trailer. The optimal radius of curvature wasestimated by conducting experiments on a number of tractors having varyingradii of curvature. The drag was measured for these shapes as a function ofwind tunnel speed. Given wind velocity, U, two Reynolds numbers can bedefined; one based on the square-root of the cross-sectional area (ReA =U÷A/ n), and the other based on the radius of curvature of the front leadingedges (ReR = UR/n).
The importance of leading-edge rounding is demonstrated in Figure 3,which is a plot of drag coefficient of an isolated tractor for two values of theradius of curvature over a range of velocities. The tractor with a less blunt
190 M. Hammache and F. Browand
front end (larger radius of curvature) experiences considerably less drag. Here,the data is plotted versus ReA. Plotting the same data against ReR, as shown inFigure 4, essentially collapses the two curves on each other. Hence, the radiusof curvature appears to be a more appropriate length scale for this flow. Also,note that the drag bottoms out at approximately ReR = 70,000. This suggeststhat the flow is not prone to leading edge separation above this criticalReynolds number, and that further rounding of the front end would not lowerthe drag.
Figure 3. Drag coefficient on isolated tractor as a function of Reynolds number basedon square-root of cross-section area for two values of front radius of curvature. Red:
r=5.1cm; Blue: r=1.3cm.
Figure 4. Drag coefficient on isolated tractor as a function of Reynolds number basedon front radius of curvature. Red: r=5.1cm; Blue: r=1.3cm.

On the Aerodynamics of Tractor-Trailers 191
Drag coefficient versus gap width
The drag on the tractor and trailer as a function of gap width are plotted inFigure 5. In the range of G/÷A of 0.1 to 0.5, the trailer experiences less dragthan the tractor, due to the shielding effect. Note that at very small gap width,below 0.1, the reverse is true. The extreme proximity of the tractor essentiallyraises the base pressure on the tractor and reduces its drag. A similarphenomenon can be expected in car racing; the trailing car can take advantageof the suction effect obtained in drafting, but if the gap is reduced below acritical value, the lower drag advantage shifts to the lead car.
As the gap opens up beyond approximately 0.5, the drag on the trailerexperiences a dramatic increase. This increase persists up to G/÷A ofapproximately 0.7, then stabilizes (or at least slows down its ascent). At thesame time, the tractor also sees a very modest increase then decrease in drag.As the gap width is increased, the trailer contribution to total drag is by far themajor one.
Figure 5. Drag coefficient versus gap width.
DPIV measurements in the gap of a single tractor-trailer
Whole-field velocity measurements were obtained for various combinations ofgap width and angles of yaw, though the present discussion is limited to zero-yaw cases. A total of 350 instantaneous realizations were acquired for eachcase. A detailed discussion of the DPIV technique can be found in Fincham &Spedding (1997). Changes of the flow structure in the gap region were

192 M. Hammache and F. Browand
investigated by performing conditional-averaging. At low gap width, typicallybelow G/÷A ~ 0.5, the flow is generally steady and consists of what looks like atoroidal vortex in the gap. A horizontal slice through the gap at mid-heightshows a symmetric flow field. The average velocity field and associatedstreamline patterns are shown in Figure 6. The pair of counter-rotatingvortices seen in this figure is relatively steady in the sense that all instantaneousrealizations are very similar to the average flow field.
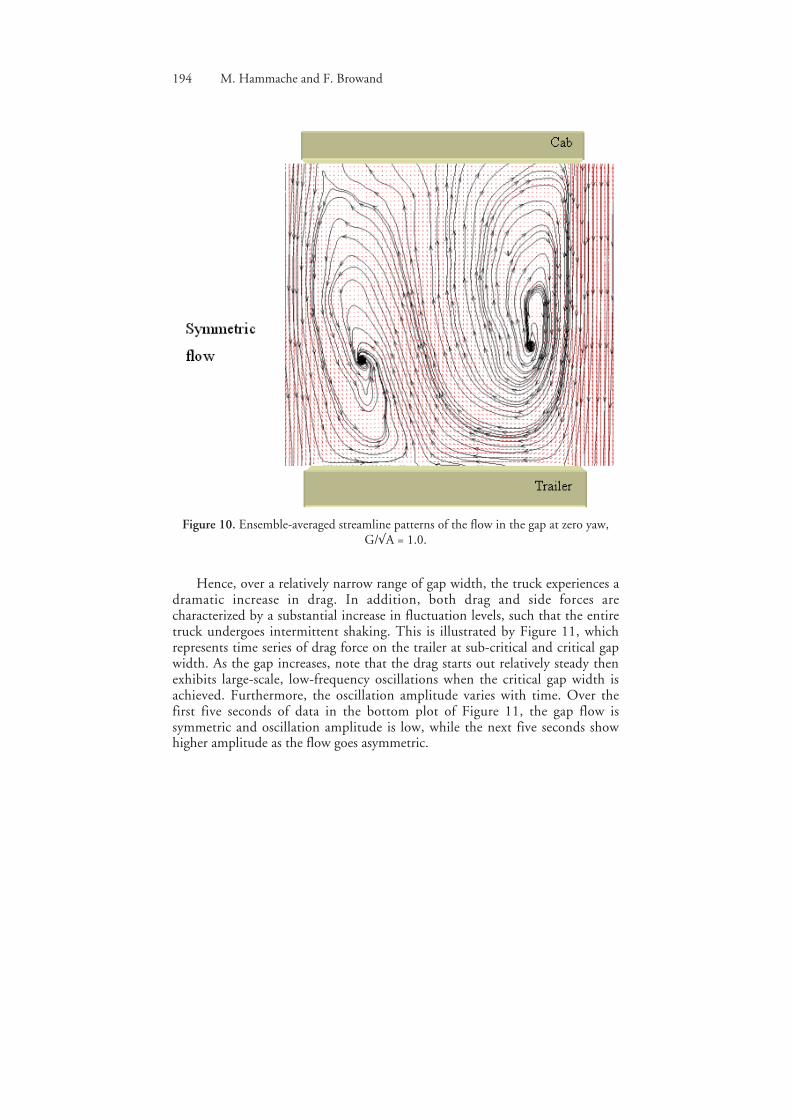
As the gap width is increased, the flow in the gap is symmetric part of thetime only. Intermittent symmetry breakdown is observed, whereby the flowexits the gap region as shown in Figures 7 through 9. Hence a conditionalaverage of these datasets is labeled “asymmetric flow”. Note that the onset ofthis asymmetry coincides with the initial rise in drag on the trailer and persistsuntil the normalized gap width reaches approximately 1.0, where the flow isonce again mostly symmetric. This is shown in Figure 10. Drag measurementssuch as those in Figure 5 indicate that the drag has reached a high plateau andthat restoration of a symmetric flow pattern (on average) is not accompaniedby a decrease in drag. At higher gap width, the flow structure is best describedby a “wake mode” than “cavity mode” because the gap is so large that the flowpattern is no longer influenced by the proximity of the trailer to the tractor.
Figure 6. Time-averaged streamline patterns of the flow in the gap at zero yaw, G/÷A= 0.28.

Figure 7. Ensemble-averaged streamline patterns of the flow in the gap at zero yaw,G/÷A = 0.55. (a) symmetric flow, (b) asymmetric flow.
Figure 8. Ensemble-averaged streamline patterns of the flow in the gap at zero yaw,G/÷A = 0.65. (a) symmetric flow, (b) asymmetric flow.
Figure 9. Ensemble-averaged streamline patterns of the flow in the gap at zero yaw,G/÷A = 0.75. (a) symmetric flow, (b) asymmetric flow.
On the Aerodynamics of Tractor-Trailers 193
194 M. Hammache and F. Browand
Figure 10. Ensemble-averaged streamline patterns of the flow in the gap at zero yaw,G/÷A = 1.0.
Hence, over a relatively narrow range of gap width, the truck experiences adramatic increase in drag. In addition, both drag and side forces arecharacterized by a substantial increase in fluctuation levels, such that the entiretruck undergoes intermittent shaking. This is illustrated by Figure 11, whichrepresents time series of drag force on the trailer at sub-critical and critical gapwidth. As the gap increases, note that the drag starts out relatively steady thenexhibits large-scale, low-frequency oscillations when the critical gap width isachieved. Furthermore, the oscillation amplitude varies with time. Over thefirst five seconds of data in the bottom plot of Figure 11, the gap flow issymmetric and oscillation amplitude is low, while the next five seconds showhigher amplitude as the flow goes asymmetric.

Figure 11. Time series of drag on trailer at sub-critical (top) and critical (bottom) gapwidth. Bottom plot is a portion of a longer time series.
Drag and side force measurements
The drag data shown in Figure 5 is limited to zero-yaw cases. Similarmeasurements were performed for both drag and side force over a range of gapwidth and angles of yaw. The drag data is shown in Figure 12 and that of sideforces in Figure 13. The angle of yaw is varied in the range zero to 16 degrees,in increments of one and two degrees. At each yawed position, the non-dimensional gap width G/÷A is increased from zero to a maximum value of1.6 then reduced back to zero. As a result, all the surface maps are roughlysymmetric with respect to a vertical plane as illustrated in Figure 12(a).However, due to hysteresis effects, small differences in drag and side forcelevels are observed in some cases as the gap is opened or closed.
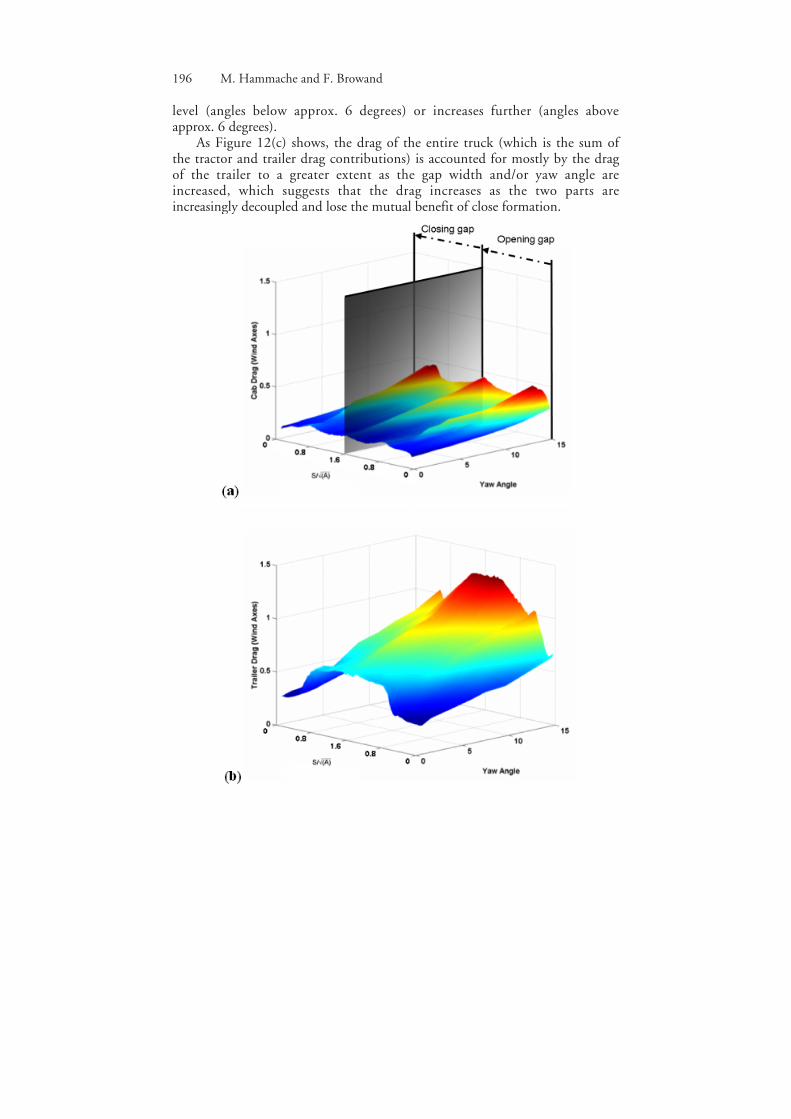
The drag on the tractor increases with the angle of yaw. In addition, itexhibits a peak as shown by a ridge along a line of approximately constantG/÷A. As was shown in Figure 5 in the zero-yaw case, this maximum isreached when the gap width is approximately half the square-root of frontalarea. At higher angles of yaw, the location of the peak shifts to smaller gapwidths. Note that at higher yaw angles, the drag drops from its peak, buteventually resumes its ascent. This is seen along the line G/÷A=1.6. It is likelythat the tractor drag will increase further than shown here if G/÷A is increasedfurther.
The trailer drag data is plotted in Figure 12(b). Again, the presence of alocalized ‘ridge’ along which the drag reaches a local maximum can be seen, inparticular for yaw angles above approx. 6 degrees. However, beyond this ridge,the drag on the trailer does not drop from its peak. It either stays at a plateau
On the Aerodynamics of Tractor-Trailers 195
196 M. Hammache and F. Browand
level (angles below approx. 6 degrees) or increases further (angles aboveapprox. 6 degrees).
As Figure 12(c) shows, the drag of the entire truck (which is the sum ofthe tractor and trailer drag contributions) is accounted for mostly by the dragof the trailer to a greater extent as the gap width and/or yaw angle areincreased, which suggests that the drag increases as the two parts areincreasingly decoupled and lose the mutual benefit of close formation.

Figure 12. Surface maps of drag force on tractor (a), trailer (b) and entire truck (c) as afunction of yaw angle and gap width.
Figure 13 is a plot of the side force using the same conventions as inFigure 12. The same nearly-constant G/÷A “ridge” identified earlier is againseen here. However, the cab experiences a decrease in side force along thisridge, while the trailer experiences an increase. The side force on the wholetruck (obtained by adding the two side forces on tractor and trailer) almosteliminates the ridge (with the exception of angles of yaw at the upper end ofthe range). The total side force is independent of gap width and increases withangle of yaw.
On the Aerodynamics of Tractor-Trailers 197

198 M. Hammache and F. Browand
Figure 13. Surface maps of side force on tractor (a), trailer (b) and entire truck (c) as afunction of yaw angle and gap width.
Two trucks in tandem
As stated above, the drag of a truck is largely influenced by the gap widthbetween tractor and trailer. A natural extension of the present study is toexamine the drag acting on two trucks in a tandem configuration as a functionof the gap separating them. Since all models have the same cross-sectional area(A), gap separation is again divided by ÷A to make it non-dimensional. Allmeasurements are restricted to zero angles of yaw.
Since trucks are designed to carry cargo, it is important to preserve thebox-like shape that characterizes the trailer. Hence, it is worthwhile to study

On the Aerodynamics of Tractor-Trailers 199
the drag behavior of simplified shapes before conducting experiments on theactual truck models. The simplest shape that can be studied is a simpleparallelepiped, which would also be the least aerodynamic. This shape isshown in Figure 14(a) with contributions from fore-body drag, base drag andskin friction. The simplest modification involves adding a faceplate withrounded vertical edges, such that the critical edge Reynolds numbermentioned earlier is achieved. This shape is shown in Figure 15(b). Adding thefaceplate dramatically reduces drag without compromising the volume-maximizing shape of the body.
Clearly, the drag acting on these bodies is mostly pressure drag; skinfriction is minimal. Adding the faceplate reduces the drag by about half, due toa substantial drop in the fore-body pressure drag. This further illustrates theimportance of front-end rounding discussed earlier.
Figure 14. Two basic shapes: (a) a simple parallelepiped; (b) same parallelepiped butwith rounded vertical front edges.
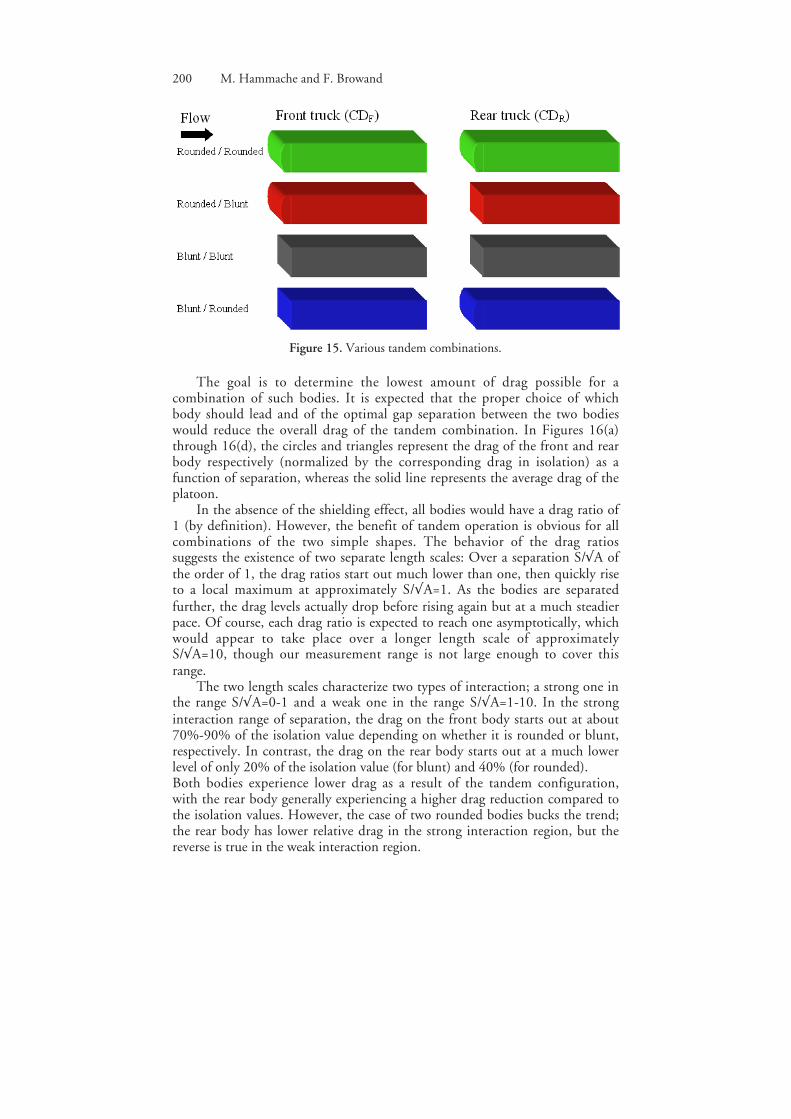
The two simple body geometries can be arranged in four possiblecombinations, depending on which body is put in the lead position, as shownin Figure 15, and the drag acting on each body is measured separately as afunction of the gap separating the two bodies. An average drag for the pair ofbodies is defined as the sum of the individual drags in the tandem divided bythe sum of the individual drags in isolation.
CDAvg = (CDF + CDR)/(CDF iso + CDR iso)
The drag in isolation is defined as the drag of a body alone in the wind tunnel.
200 M. Hammache and F. Browand
Figure 15. Various tandem combinations.
The goal is to determine the lowest amount of drag possible for acombination of such bodies. It is expected that the proper choice of whichbody should lead and of the optimal gap separation between the two bodieswould reduce the overall drag of the tandem combination. In Figures 16(a)through 16(d), the circles and triangles represent the drag of the front and rearbody respectively (normalized by the corresponding drag in isolation) as afunction of separation, whereas the solid line represents the average drag of theplatoon.
In the absence of the shielding effect, all bodies would have a drag ratio of1 (by definition). However, the benefit of tandem operation is obvious for allcombinations of the two simple shapes. The behavior of the drag ratiossuggests the existence of two separate length scales: Over a separation S/÷A ofthe order of 1, the drag ratios start out much lower than one, then quickly riseto a local maximum at approximately S/÷A=1. As the bodies are separatedfurther, the drag levels actually drop before rising again but at a much steadierpace. Of course, each drag ratio is expected to reach one asymptotically, whichwould appear to take place over a longer length scale of approximatelyS/÷A=10, though our measurement range is not large enough to cover thisrange.
The two length scales characterize two types of interaction; a strong one inthe range S/÷A=0-1 and a weak one in the range S/÷A=1-10. In the stronginteraction range of separation, the drag on the front body starts out at about70%-90% of the isolation value depending on whether it is rounded or blunt,respectively. In contrast, the drag on the rear body starts out at a much lowerlevel of only 20% of the isolation value (for blunt) and 40% (for rounded).Both bodies experience lower drag as a result of the tandem configuration,with the rear body generally experiencing a higher drag reduction compared tothe isolation values. However, the case of two rounded bodies bucks the trend;the rear body has lower relative drag in the strong interaction region, but thereverse is true in the weak interaction region.

Figure 16. Drag curves for various combinations of simplified bodies. o front-bodydrag; D rear-body drag; ___ average drag. (a) blunt lead and trail; (b) blunt lead -
rounded trail; (c) rounded lead- blunt trail; (d) rounded lead and trail.
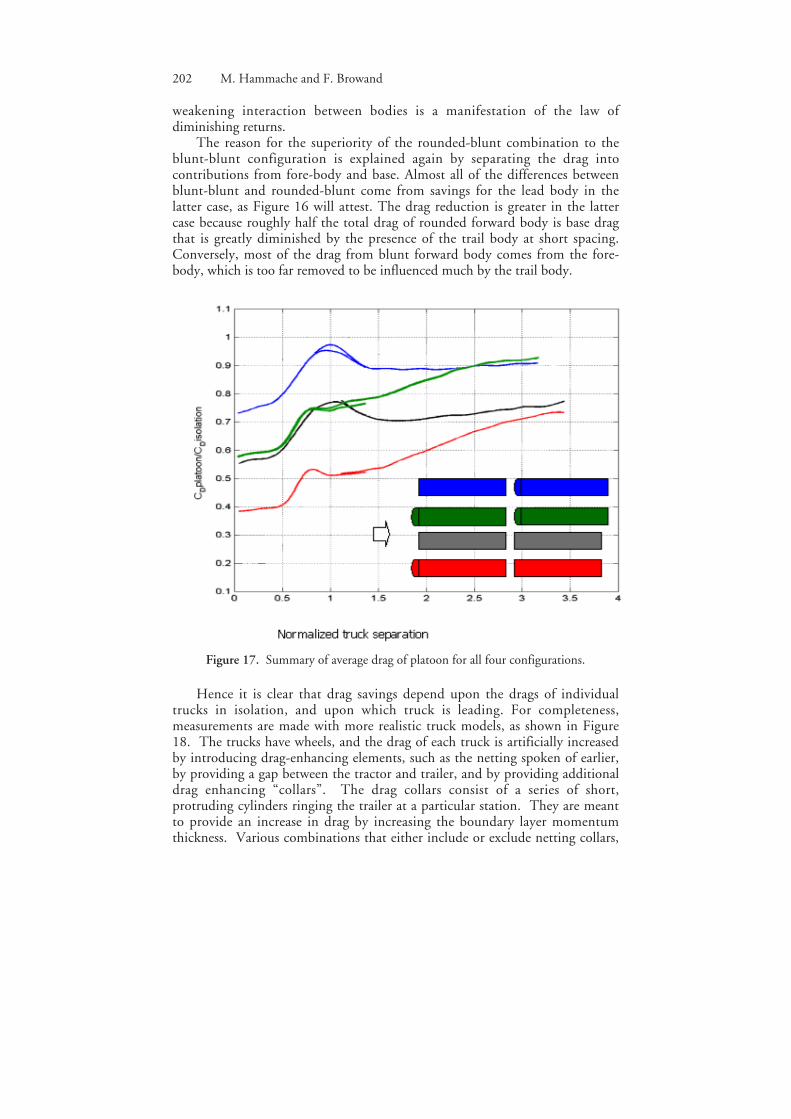
The total drag savings for the pair of bodies is given by the plot of averagedrag ratio as defined earlier. The average drag ratios for the four configurationsare plotted on Figure 17.
The tandem configuration that experiences the least amount of total dragis that of a rounded body in the front and a blunt body in the rear.Conversely, when the relative positions of the two bodies are switched, thehighest possible total drag results. Note that when the two bodies areidentical, the total drag ratio is essential identical in the region of stronginteraction, regardless of whether the bodies are both rounded or both blunt.As the gap is increased beyond S/÷A=1, the tandem of two blunt bodiesexperiences further drag ratio drop and starts to behave like the lowest dragcase (rounded followed by blunt) as S/÷A approaches 3.5. On the other hand,the tandem of two rounded bodies sees an increasing drag ratio with increasinggap spacing, and gradually converges to the highest drag case (blunt followedby rounded). As S/÷A increases beyond 2.5, the pair of rounded bodies intandem appears to benefit less and less from the tandem configuration; the
On the Aerodynamics of Tractor-Trailers 201
202 M. Hammache and F. Browand
weakening interaction between bodies is a manifestation of the law ofdiminishing returns.
The reason for the superiority of the rounded-blunt combination to theblunt-blunt configuration is explained again by separating the drag intocontributions from fore-body and base. Almost all of the differences betweenblunt-blunt and rounded-blunt come from savings for the lead body in thelatter case, as Figure 16 will attest. The drag reduction is greater in the lattercase because roughly half the total drag of rounded forward body is base dragthat is greatly diminished by the presence of the trail body at short spacing.Conversely, most of the drag from blunt forward body comes from the fore-body, which is too far removed to be influenced much by the trail body.
Figure 17. Summary of average drag of platoon for all four configurations.
Hence it is clear that drag savings depend upon the drags of individualtrucks in isolation, and upon which truck is leading. For completeness,measurements are made with more realistic truck models, as shown in Figure18. The trucks have wheels, and the drag of each truck is artificially increasedby introducing drag-enhancing elements, such as the netting spoken of earlier,by providing a gap between the tractor and trailer, and by providing additionaldrag enhancing “collars”. The drag collars consist of a series of short,protruding cylinders ringing the trailer at a particular station. They are meantto provide an increase in drag by increasing the boundary layer momentumthickness. Various combinations that either include or exclude netting collars,

On the Aerodynamics of Tractor-Trailers 203
or gap, result in truck models having drag coefficients in isolation in the rangeCD ª 0.5 – 0.7.
Figure 18. Truck models in tandem configuration. With netting and “collars”, theCD for each truck in isolation ª 0.7.
The drag data for the realistic models is plotted in Figure 19. The datapoints collapse on a single curve within the range covered by the simplifiedshapes. This indicates that the data total drag savings for the models in Figure18 in tandem is independent of the choice of leading and trailing truck. Notealso that the drag ratio rises gradually with gap spacing and that the localmaxim at S/÷A=1 vanishes. The effect of the critical gap is not so dramatic formodels having a distributed drag including wheels and drag collars.
Also, the entire data set is bounded by the “blunt - rounded” and“rounded - blunt” cases on the upper and lower end, respectively. Theselimiting cases delineate the maximum and minimum drag savings for anytandem configuration. For comparison purposes, the road test data of Bonnet& Fritz (2000) (who used real trucks) is included, along with its computedaverage. The average drag ratio for the road test appears to agree best with the“blunt – blunt” and “rounded – blunt” where there is overlap.

204 M. Hammache and F. Browand
Figure 19. Average drag of platoons. The circles represent data obtained by arrangingthe models shown in Figure 18 in various tandem combinations.
Summary Conclusions
The present experiments reveal the impact of on the drag of a single tractor-trailer truck. A combination of force balance and whole-field velocitymeasurements demonstrates a direct link between the level of drag forces andthe nature of the fluid flow patterns within the gap. At moderate widths astable toroidal vortex is present in the gap and drag levels are relatively low.The symmetry of the flow pattern breaks down at a width of approximatelyhalf the square-root of frontal area, which leads to intermittent flow separationoff the front of the trailer and a non-linear increase of drag forces on the trailerand on the truck as whole. Most of the drag contribution is attributed to thetrailer alone; the tractor is affected much more moderately and only in anarrow band of gap width near the critical value of G/÷Aª0.5. A similarprocess of drag rise also occurs at moderate angles of yaw. However, the dragincrease is more pronounced and occurs at a lower critical gap width as theangle of yaw is increased. At more extreme angles of yaw the tractor and trailerare rather like independent bodies that do not benefit from close-formationand their drag behavior is much less a function of spacing.
The benefits of close-formation also apply to trucks in tandem. The totaldrag for all tandems tested is lower than the sum of the drags of the models inisolation, though the drag savings vary with the degree of bluntness of each
On the Aerodynamics of Tractor-Trailers 205
model and on which model is placed in front. The highest relative dragreduction is achieved by a rounded model followed by a blunt model, whilethe reverse order achieves the least drag reduction.
References
K. R. Cooper: The effect of front-edge rounding and rear-edge shaping on the aerodynamicdrag of bluff vehicles in ground proximity. SAE paper No. 850288 (1985)
A.M. Fincham & G.R. Spedding: Low cost, high resolution DPIV for measurement ofturbulent fluid flow. Exps. Fluids 23, (1997)
C. Bonnet & H. Fritz: Fuel consumption reduction experienced by two Promote-Chauffeurtrucks in electronic tow bar operation. SAE Paper No. 00FTT73 (2000).
