on the effects of chemistry and turbulence-chemistry …€¦ · · 2017-11-151 on the effects of...
TRANSCRIPT

1
On the effects of chemistry and turbulence-chemistry interaction models for Diesel combustion
F.A. Tap*, D. Goryntsev, A. Starikov – Dacolt International BV (The Netherlands) C. Meijer, L.M.T. Somers – Eindhoven University of Technology (The Netherlands) G. Hardy – FPT Motorenforchung AG (Switserland) 1. Introduction Turbulent combustion modeling in a RANS or LES context poses the challenge of closing the chemical reaction rate on the sub-grid level. Many turbulent combustion models exist in literature [1]. Such turbulent combustion models have two main ingredients: (i) chemistry and (ii) turbulence-chemistry interactions. The various combustion models then differ mainly by (i) how the chemistry is calculated (level of detail, canonical flame model) and (ii) how turbulence is assumed to affect the reaction rate on the sub-grid level (turbulence-chemistry interaction - TCI). In this work, an advanced combustion model based on tabulated chemistry [2] is used for 3D CFD modeling of dodecane spray flames from the Engine Combustion Network (ECN) [3] and a heavy-duty Diesel engine case. The combustion model has two main features: (i) the Flamelet Generated Manifold (FGM) chemistry reduction technique [4], in this case based on auto-ignition trajectories of homogeneous fuel/air mixtures, computed with detailed chemical reaction mechanisms and (ii) presumed-PDF turbulence-chemistry interaction (TCI) modeling. The FGM look-up tables are generated with Tabkin, a dedicated software program for the generation of CFD look-up tables for advanced combustion models [5]. The look-up tables have 5 dimensions: pressure, temperature, mixture fraction, mixture fraction variance and progress variable. The effects of the chemical mechanism and the effect of turbulence-chemistry interaction modeling are investigated. Simulation results are compared to global experimental data available for the Spray A conditions from ECN. Then, a similar investigation is done for a heavy-duty Diesel engine. 2. ECN Spray A CFD simulations have been carried out under Spray A conditions [6], using the OpenFOAM+libICE CFD software [7,8] with a custom FGM model implementation. All simulations have exactly the same settings for numerics and physical models. Firstly, two different chemical mechanisms are compared: a detailed mechanism [9] with 1278 species and 9861 reactions and a reduced mechanism [10] with 111 species and 467 reactions, optimized for direct use in 3D CFD simulations. For each simulation a look-up table is generated with Tabkin, using equal settings for table discretization and progress variable definition. Each table contains PDF-averaged data over mixture fraction space. Figure 1 presents a global validation of the Spray A simulations at three different initial temperatures. As flame lift-off largely depends on auto-ignition processes for these cases, a nearly linear relationship exists between these two quantities. Generally speaking, the agreement between the CFD simulations and experiments is satisfying, with the largest deviation observed for the 1000 K case. Then, it is remarkable
* Corresponding author: [email protected]

2
that the reduced mechanism seems to yield better agreement than the detailed mechanism, although differences remain small.
Figure 1: Ignition delay vs. flame lift-off length
For the 900 K case, the flame structures are compared in Figure 2. For both the flame temperature and OH mass fraction there are hardly any differences between the two reaction mechanisms. The detailed chemistry mechanism yields slightly higher peak values of OH mass fraction.
Temperature [K] Reduced chemistry
Temperature [K] Detailed chemistry
OH mass fraction [-] Reduced chemistry
OH mass fraction [-] Detailed chemistry
Figure 2: Flame structure comparison for the 900K case. The white contour represents the stoichiometric line. Then, for the reduced chemistry case, the TCI is switched off by forcing the mixture fraction variance look-up parameter to zero in the CFD simulation. The effect on flame structure and peak OH values is now more pronounced (Figure 3). The effect of the PDF is to broaden the flame front; without TCI, the flame brush becomes thinner and peak OH values increase.
3
OH mass fraction [-]
With TCI OH mass fraction [-]
Without TCI Figure 3: OH mass fraction with and without TCI, 900K case.
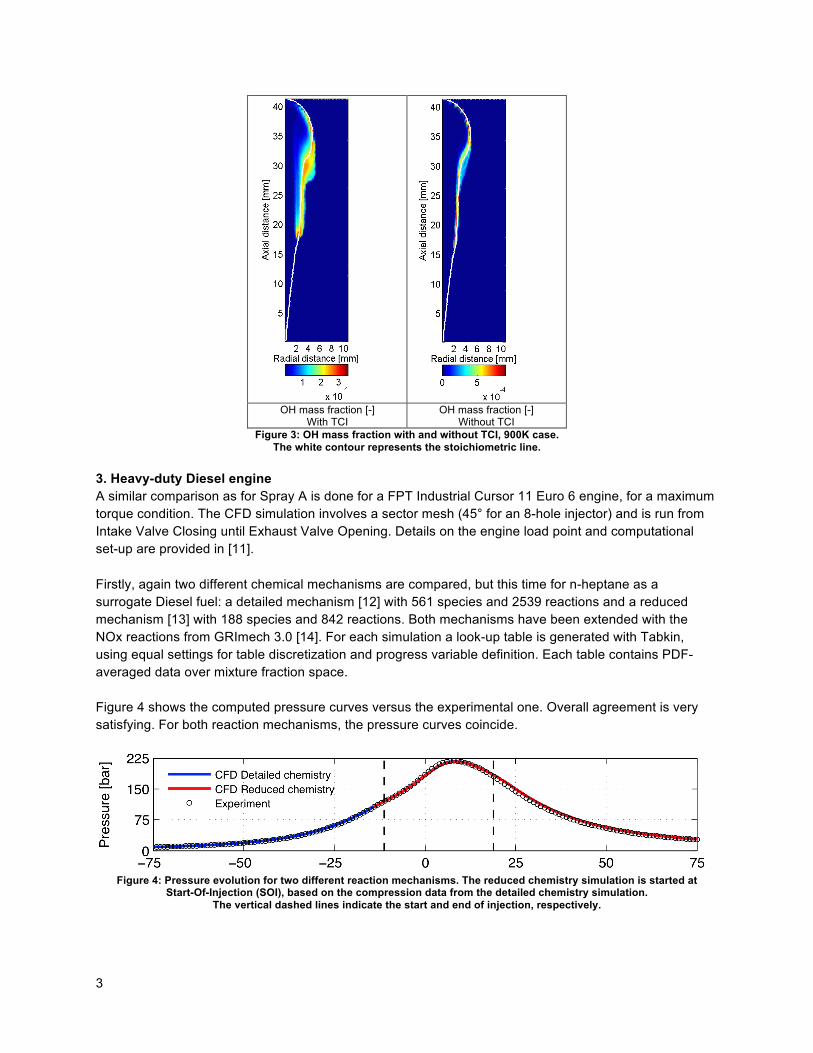
The white contour represents the stoichiometric line. 3. Heavy-duty Diesel engine A similar comparison as for Spray A is done for a FPT Industrial Cursor 11 Euro 6 engine, for a maximum torque condition. The CFD simulation involves a sector mesh (45° for an 8-hole injector) and is run from Intake Valve Closing until Exhaust Valve Opening. Details on the engine load point and computational set-up are provided in [11]. Firstly, again two different chemical mechanisms are compared, but this time for n-heptane as a surrogate Diesel fuel: a detailed mechanism [12] with 561 species and 2539 reactions and a reduced mechanism [13] with 188 species and 842 reactions. Both mechanisms have been extended with the NOx reactions from GRImech 3.0 [14]. For each simulation a look-up table is generated with Tabkin, using equal settings for table discretization and progress variable definition. Each table contains PDF-averaged data over mixture fraction space. Figure 4 shows the computed pressure curves versus the experimental one. Overall agreement is very satisfying. For both reaction mechanisms, the pressure curves coincide.
Figure 4: Pressure evolution for two different reaction mechanisms. The reduced chemistry simulation is started at
Start-Of-Injection (SOI), based on the compression data from the detailed chemistry simulation. The vertical dashed lines indicate the start and end of injection, respectively.
4
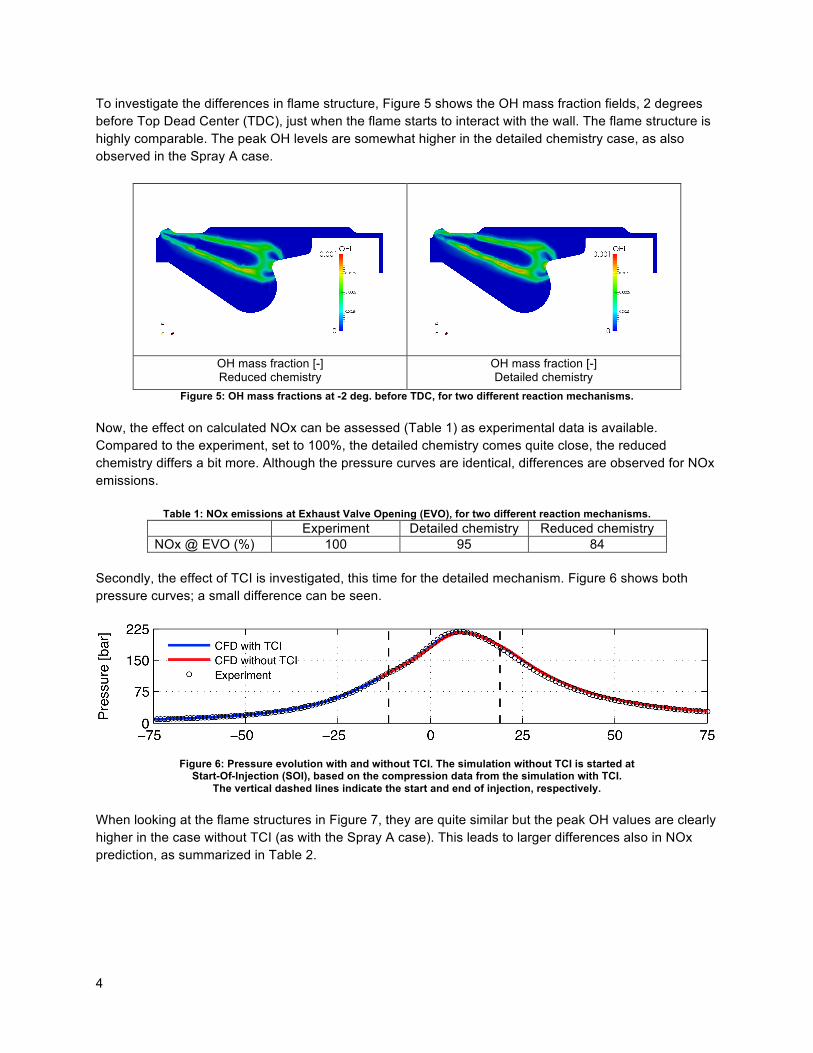
To investigate the differences in flame structure, Figure 5 shows the OH mass fraction fields, 2 degrees before Top Dead Center (TDC), just when the flame starts to interact with the wall. The flame structure is highly comparable. The peak OH levels are somewhat higher in the detailed chemistry case, as also observed in the Spray A case.
OH mass fraction [-] Reduced chemistry
OH mass fraction [-] Detailed chemistry
Figure 5: OH mass fractions at -2 deg. before TDC, for two different reaction mechanisms. Now, the effect on calculated NOx can be assessed (Table 1) as experimental data is available. Compared to the experiment, set to 100%, the detailed chemistry comes quite close, the reduced chemistry differs a bit more. Although the pressure curves are identical, differences are observed for NOx emissions.
Table 1: NOx emissions at Exhaust Valve Opening (EVO), for two different reaction mechanisms. Experiment Detailed chemistry Reduced chemistry NOx @ EVO (%) 100 95 84
Secondly, the effect of TCI is investigated, this time for the detailed mechanism. Figure 6 shows both pressure curves; a small difference can be seen.
Figure 6: Pressure evolution with and without TCI. The simulation without TCI is started at
Start-Of-Injection (SOI), based on the compression data from the simulation with TCI. The vertical dashed lines indicate the start and end of injection, respectively.
When looking at the flame structures in Figure 7, they are quite similar but the peak OH values are clearly higher in the case without TCI (as with the Spray A case). This leads to larger differences also in NOx prediction, as summarized in Table 2.

5
OH mass fraction [-] With TCI
OH mass fraction [-] Without TCI
Figure 7: OH mass fractions at -2 deg. before TDC, with and without TCI.
Table 2: NOx emissions at Exhaust Valve Opening (EVO), with and without TCI Experiment With TCI Without TCI NOx @ EVO (%) 100 95 76
4. Conclusion An FGM combustion model is used to simulate ECN Spray A flames and a heavy-duty Diesel engine case. The use of chemistry look-up tables allows investigating both reduced and detailed reaction mechanisms at very modest computational cost. Also, turbulence-chemistry interactions (TCI) can be easily switched on or off. For both the reduced and detailed chemistry mechanisms, the global flame parameters like ignition delay and flame lift-off are quite similar for both the Spray A and the Diesel engine case. Some minor differences are observed for peak OH mass fractions; for the Diesel engine case, such small differences prove of importance for NOx predictions. Enabling or disabling TCI leads to larger differences in peak OH mass fractions and NOx emissions than using reduced or detailed reaction mechanisms, for both the Spray A and Diesel engine cases. The results illustrate the relative importance of each key ingredient of the turbulent combustion model, e.g. chemistry and turbulence-chemistry interaction. 5. References
1. T. Poinsot and D. Veynante, Theoretical and numerical combustion. R.T. Edwards (2001). 2. Tap, F. and Schapotschnikow, P., SAE Technical Paper 2012-01-0152. 3. Engine Combustion Network. Ecn. http://www.sandia.gov/ecn/, 2014. 4. J.A. van Oijen and L.P.H. de Goey, Combust. Sci. Technol. 161 (2000), pp. 113–137. 5. http://www.dacolt.com/tabkin. 6. C. Meier, MSc Thesis, Eindhoven University of Technology (2015). 7. OpenFOAM Foundation. http://www.openfoam.org, 2014. 8. Politecnico di Milano. Libice. http://www.engines.polimi.it/, 2014. 9. Mehl M., W.J. Pitz, C.K. Westbrook, H.J. Curran, Proc. Comb. Inst. 33:193-200 (2011). 10. Z. Luo et al., Combustion Theory and Modelling, 2014. 11. G. D’Errico et al., SAE Technical Paper 2015-01-0375. 12. M. Mehl et al., Proc. Comb. Inst. 33:193-200 (2011). 13. T.F. Lu and C.K. Law, Combust. Flame (144), pp.24–36, 2006. 14. G. P. Smith et al., http://www.me.berkeley.edu/gri_mech/.