on the financial performance of socially responsible mutual funds
DESCRIPTION
On the Financial Performance of Socially Responsible Mutual Funds. When “Goody-two-shoes” goes “Bad-to-the-bone”. SRI: The Goals. Provide competitive financial returns while fostering better social and environmental performance SRI mutual funds are one SRI vehicle. Bloomberg’s definition. - PowerPoint PPT PresentationTRANSCRIPT

On the Financial Performance of Socially
Responsible Mutual Funds
When “Goody-two-shoes” goes “Bad-to-the-bone”
SRI: The Goals
Provide competitive financial returns while fostering better social and environmental performance
SRI mutual funds are one SRI vehicle

Bloomberg’s definition

Strategies to achieve objectives
Selection or Screening: Investing in companies that meet certain social and/or environmental performance criteria,
Shareholder activism: using their rights as shareowners to encourage companies to be better corporate citizens, or
Community investment: allocating some of the fund’s assets for investment in disadvantaged urban and rural communities.

Socially Responsible Investing in the U.S.
$2.16 trillion in 2003
Community Investing
$14 billion
Shareholder Advocacy Only
$7 billion
Screening Only$1702 billion
Screening + Shareholder$441 billion


Mutual Fund Screen Types
($ Billions)
10.3
11.2
14.1
16.6
22
23.8
28.8
28.9
31.1
93.4
124
0 20 40 60 80 100 120 140 160
Community Impact
Human Rights
Other*
Products/Services
Equal Employment Opportunity
Defense/Weapons
Gambling
Environment
Labor Relations
Alcohol
Tobacco
Total Assets (billions)

How are they Performing Financially?
The Good The Bad The Ugly
SRI the good #1: Popularity
A total of $2.16 trillion in assets were identified in professionally managed portfolios using one or more of the three core SRI strategies: Screening, Shareholder Advocacy and Community Investing
More than one out of every nine dollars under professional management in the United States today is involved in socially responsible investing.
Assets under management in screened portfolios rose 7% between 2001 and 2003. Meanwhile the broader universe of all professional managed portfolios fell 4% during the same time period.

Growth of SRI Investments ($ Billions) 1997-2003
$5$4$84
$529
$1,185
$736
$265
$1,497
$2,159
$922
$8
$592
$2,320
$897
$2,010 $2,164
$14
$441$448
$2,143
$0
$500
$1,000
$1,500
$2,000
$2,500
Screening Shareholder Both Community Total
1997 1999
2001 2003

Why are they so popular?Why are they so popular? May be Corporate Breakdowns May be Corporate Breakdowns in the Newsin the News
General Electric
Tyco
Enron
Arthur Andersen
Qwest
Xerox
Worldcom
Adelphia

The Good #2: Reported Performance against broad indices

The Good #3: Papers from the mid-nineties Luck (1993, 1998) finds half of the DSI’s
outperformance is due to stock selection, which was, in turn, a function of the social screens
SRI mutual funds actually outperform a sample of matched conventional funds (Statman 2000; Guerard 1997; Kurtz 1997; Mallin, Saadouni and Briston 1995; Luther and Matatko 1994; Luther, Matatko and Corner 1992)
There is a “social factor”, which affects returns. If so, this would need to be estimated and utilized in risk management of socially screened portfolios.

The Bad #1: The Reality

The Bad #2: The Actual Performance Against Broad Indices
1YR 3YR 5YR 10YR
Bond Funds 11 11 10 7Percentage beating LBI 27% 27% 10% 0%Balanced funds 9 8 8 7Percentage beating SP500/ LBI 11% 25% 13% 29%
Large Equity 45 43 34 15Percentage beating SP500 20% 26% 38% 33%Small and Mid Cap Equity 21 21 21 9Percentage beating SP400 19% 19% 14% 33%International Equity 11 11 7 3Percentage beating MSCI WORLD 36% 18% 14% 0%All Funds 97 94 80 41Percentage beating benchmark 21.65% 22.68% 19.59% 10.31%

The Bad #3: Modern Portfolio Theory
Number of Securities
Portfolio Variance
SCREENING PORTFOLIO
NON SCREENING PORTFOLIO

The Bad #4: Recent Findings Studies by Bauer, Kees, and Roger, 2002; Goldreyer
and Diltz 1999; Plantinga and Scholtens 2001; and Sauer, 1997; and Geczym, Stambaugh and Levin, 2003. • SRMF tend to underperform
• If SRMF beat a broad benchmark, it has to do with style investments rather that social investment
• SRI constraint imposes large costs on investors. Entine (2003) questions the validity of screening
methodologies being used and the very legitimacy of the business of SRI.

The Bad # 5: The Rhetoric
"The fact is that social investors as a demographic tend to be better-educated and more affluent than the general population." – Michael Jantzi (Research Associate)
“Over 70% of largest socially responsible mutual funds got top marks from Morningstar, Lipper in 2003” (Socialinvest.org)
“Analysis of expense ratios finds SRI funds neither more or less costly than unscreened funds of similar type” (Socialinvest.org)
Change of tone from 1995-2004: from “we beat broad benchmarks” to “you can potentially perform as well as a regular.”

The Ugly #1: Entrenchment The SRI has been very aggressive towards its
critics. Timothy Middleton (CNBC): “I always attract
critics who assert that SRMF are just as good as the other funds.”
Entine, Miami University Geczy, Stambaugh and Levin (2003) have
been demolished by SRI-Advisor.com- “unsound research design , sloppy work”
Stone, Siena College
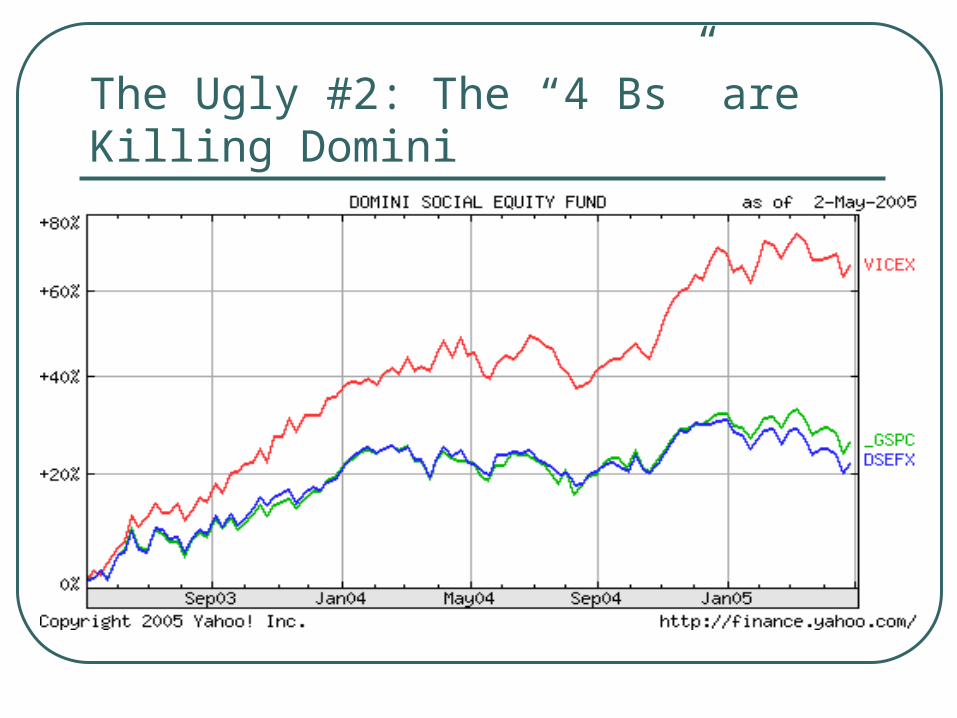
The Ugly #2: The “4 Bs” are Killing Domini

So, How do they perform? Girard, Rahman and Stone (2005): “Between
and within financial performance” Entine (2003) and Geczym, Stambaugh and
Levin, 2003 report that SRI constraint imposes large costs on investors.
Orlitzky, Schmidt and Rynes (2003): “There is a positive association between corporate social performance and financial performance.” It would take “1,000 papers” to change the overall conclusions of their research.

Our methodology We use monthly return in 117 Socially Responsible
Mutual Funds from 1984 to 2003 to investigate:• Selectivity--the ability to select “better securities” (as
compared to Lippers benchmark)• Diversification-- the cost associated with poor
diversification (as compared to Lippers benchmark)• Net Selectivity-- the “true” cost associated with an
investment product • Market timing-- the ability to accurately overweight
(underweight) cash in the expectation of bearish (bullish) market.
Time and cross-sectional analysis of performance

The Model
gminTiMarket
t,pt,ft,mppt,ft,p )RR(RR
ySelectivitNetationDiversific
)RR()( t,ft,mpt,m
t,p
)RR()RR( t,ft,mt,m
t,pt,ft,p
tptftmptftmpptftp RRRRRR ,2
,,,,,, )()(
ySelectivit
Data
20 years span: 1984-2003 117 SRI funds including 7 dead funds Funds have at least 13 month of data 18 Lippers Benchmark Monthly estimate of Selectivity,
Diversification, Net Selectivity and Market timing
Estimates are annualized

Findings: Net Selectivity
Net Selectivity (# of Months)
10 years (121)
5 Years (180)
3 Years (203)
1 year (228)
All funds -9.32%*** -8.75%*** -8.00%*** -7.34% Equity Funds -8.74%*** -8.10%* -8.49% -7.86%
Balanced Funds -8.80%*** -7.89%** -7.51%* -9.10% Bond Funds -7.19%*** -7.12%*** -7.06%*** -6.98%**

Selectivity and Net Selectivity Over Time (5-year span)
-0.14
-0.12
-0.1
-0.08
-0.06
-0.04
-0.02
0
0.02
0
10
20
30
40
50
60
70
Selectivity
Net Selectivity
# of Funds

Market Timing (5-year span)
0%
10%
20%
30%
40%
50%
60%
70%
80%
90%
100%
-5
-4
-3
-2
-1
0
1
2
3
4
5% with significant positive market timing
% with significant negative market timing ability
Market timing Ability

Determinants of Performance: Size and Age
Three-year Average (Constant)
Size # of Month
N (obs)
Selectivity -0.060*** 0.00000049 -0.00026575* 88 Diversification -0.068*** -0.0000001 0.0006773*** 88 Net Selectivity 0.009 0.00000059 -0.00041152*** 88 Market Timing -2.726 0.0000564 0.0156603 88

Determinants of Performance: Ethical Screens and Activism
Three-year Average (Constant) # of Screens Proxy Voting N (obs) Selectivity 0.042* -0.01526105** 0.01128622 58
Diversification -0.004 -0.0050942 0.0448974 58 Net Selectivity 0.046** -0.01016690* -0.03361118 58 Market Timing -1.116 -0.1042311 2.0183459 58
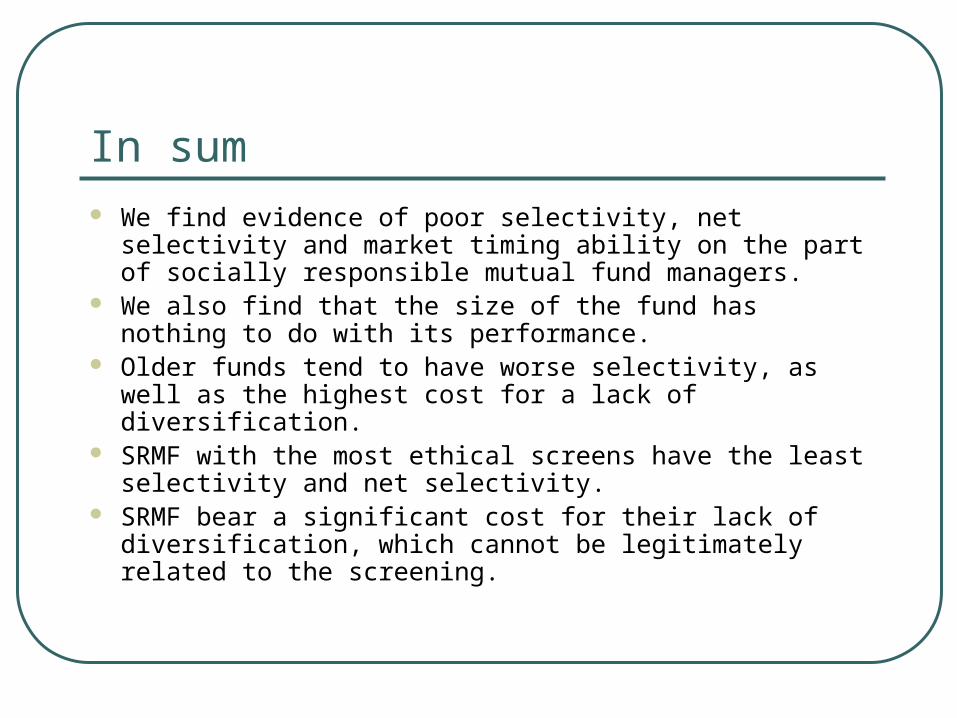
In sum We find evidence of poor selectivity, net selectivity and
market timing ability on the part of socially responsible mutual fund managers.
We also find that the size of the fund has nothing to do with its performance.
Older funds tend to have worse selectivity, as well as the highest cost for a lack of diversification.
SRMF with the most ethical screens have the least selectivity and net selectivity.
SRMF bear a significant cost for their lack of diversification, which cannot be legitimately related to the screening.

Conclusion Is it possible to maintain economic returns
while expressing a social concern about corporate conduct?
In accordance with modern portfolio theory, we find that a social responsible constraint entails a cost in the form of a lower reward-to-risk (diversification cost) and this cost can be viewed as a contribution to the cause. However, our paper also shows that SRMF entails costs associated with poor portfolio management skills, this cost is unnecessary and cannot be justified by any ideology.

On the Future of SRMF… Our findings concur with Levine (2003) who contends that
the SRI industry fails to incorporate reliable, objective standards for measuring a firm’s corporate social performance into commonly used ratings or other approaches of assessment.
Individuals that perform the social screening task for their customers do so using subjective, proprietary, and ‘secret’ methodologies.
Simply put, the proprietary ‘black box’ approach, with its inherent subjectivity and lack of transparency, brings into question the validity of screening methodologies being used and the very legitimacy of the business of SRI.

They have to make a choice
The SRI industry is in between 2 chairs:• Client wealth maximization
• Social wealth maximization
They need to choose
Future Research?
Is there a Social Risk factor that explains the return generating process of individual stocks?
Unlikely…or it would have a negative loading
We definitely cannot measure it as the difference between social benchmark and non-social benchmark Returns

As Abraham Lincoln said…
“It has been my experience that folks who have no vices have very few virtues”