on the local filtration properties during cake...
TRANSCRIPT

I
THESIS FOR THE DEGREE OF LICENTIATE OF ENGINEERING
On the local filtration properties during cake filtration
Studies on LignoBoost lignin and the influence of ionic strength
JULIE DURRUTY
Forest Products and Chemical Engineering Department of Chemical and Biological Engineering
CHALMERS UNIVERSITY OF TECHNOLOGY
Göteborg, Sweden, 2014

II
On the local filtration properties during cake filtration
Studies on LignoBoost lignin and the influence of ionic strength
JULIE DURRUTY
© JULIE DURRUTY, 2014
Technical report no 2014:27
ISSN 1652-943X
Forest Products and Chemical Engineering
Department of Chemical and Biological Engineering
Chalmers University of Technology
SE-412 96 Gothenburg
Sweden
Telephone +46 (0)31 772 1000
Main supervisor and examiner: Professor Hans Theliander
Co-supervisor: Doctor Tuve Mattsson
Cover:
[Left: Orion forest in Estérençuby, France, by Andre Durruty. Middle: ESEM image of titanium dioxide. Right: schematic diagram of cake filtration]
Printed by Chalmers Reproservice
Gothenburg, Sweden, 2014

III
Onthelocalfiltrationpropertiesduringcakefiltration
StudiesonLignoBoostligninandtheinfluenceofionicstrength
JULIE DURRUTY
Forest Products and Chemical Engineering Department of Chemical and Biological Engineering
Chalmers University of Technology
ABSTRACT
The Kraft pulping technology has been thoughtfully investigated and developed over the past hundred years and more; it is currently the most commonly-used method of pulping in the world. A new and promising opportunity for Kraft pulp mills would be to take a step towards becoming biorefineries by implementing technologies able to extract and convert the organic by-products, such as lignin, into a wide range of value-added products and chemicals. The LignoBoost process is a new technique designed to extract lignin during the Kraft process with a high degree of purity, making it suitable for the manufacturing of e.g. carbon fibres.
Filtration, performed by dead-end filtration, is one of the key steps of the LignoBoost process. The process has been recently implemented on a large scale; in order to optimize the efficiency of the filtration stage further, obtaining information pertaining to both the physical properties of the extracted lignin and the filtration properties of the cake formed is of great interest. Furthermore, it is necessary to deepen knowledge regarding the impact of inter-particle interactions, such as electrostatic forces, which occur during filtration as well as to determine the local filtration properties, for the development of better models of the filtration process. The work presented here is based on two main studies. The first investigated the local and average filtration properties of the cake formed from a softwood lignin extracted using the LignoBoost process; the material was also characterized using a number of different methods. The second studied the influence of the electrostatic interactions on the local filtration properties of titanium dioxide, the model material that was chosen, by altering the ionic strength of the initial filtration slurry.
The results showed that the LignoBoost lignin investigated was an easy-to-filter material, forming weakly compressible filter cakes over the filtration pressure range studied of 2 to 28 bar. Furthermore, it was shown that the initial concentration of the lignin slurry did not influence the filtration properties over the range investigated, i.e. 6.7 to 17 vol%. From the titanium dioxide filtration experiments, it was shown that the increase in the ionic strength of the suspension decreased both the solidosity and the filtration resistance of the cake formed whilst increasing its compressibility. These results could be explained by an extensive agglomeration, with the formation of bigger and looser agglomerates, which occurs when the electrostatic repulsive interactions between the particles are decreased. Several constitutive relationships for the modelling of the filtration process could also be fitted successfully to the local data obtained during the filtration of LignoBoost lignin and titanium dioxide.
Keywords: LignoBoost process, softwood lignin, dead-end filtration, compressible filter cake, local filtration properties, particles interactions, constitutive relationships.

IV
V
List of Publications
This thesis is based on the following papers, which can be found at the end of the manuscript:
I. Local and average filtration properties of Kraft softwood lignin J. Durruty, T. Mattsson and H. Theliander Accepted for publication in Nordic Pulp and paper
II. The influence of ionic strength on the local filtration properties of titanium dioxide T. Mattsson, J. Durruty, J. Wetterling and H. Theliander Submitted to Filtration
Results relating to this work have also been presented at the following conferences:
Influence of ionic strength on the local filtration properties of TiO2
T. Mattsson, J. Wetterling, J. Durruty and H. Theliander (Oral presentation) FILTECH, Weisbeden, Germany, October 22-24, 2013 Local and average filtration properties of softwood LignoBoost lignin J. Durruty, T. Mattsson and H. Theliander (Poster presentation) 15th Nordic Filtration Symposium, Lund, Sweden, September 9-10, 2014 Local and average filtration properties of Kraft softwood lignin J. Durruty, T. Mattsson and H. Theliander (Oral presentation) FPS 2014, European Conference on Fluid Particle Separation, Lyon, France, October 15-17, 2014

VI

VII
Contribution report
Paper I. Main author. The experiments were planned and the results evaluated, together with Dr. Tuve Mattsson and Prof. Hans Theliander. The author performed all the experiments, the data analyses involved and the modelling work.
Paper II. Co-author. The experiments were planned and the results evaluated, together with Mr. Jonas Wetterling, Dr. Tuve Mattsson and Prof. Hans Theliander. The author was responsible for the experimental work together with Mr. Jonas Wetterling and contributed to the data analyses involved.

VIII

IX
Contents
1 Introduction ............................................................................................................................. 1
1.1 The biorefinery concept ..................................................................................................... 1
1.2 Pulp mills as biorefineries ................................................................................................. 2
1.3 The filtration unit operation ............................................................................................... 3
2 Objectives ................................................................................................................................. 5
3 Overview of lignin ................................................................................................................... 7
3.1 Content and function of lignin in wood ............................................................................. 7
3.2 Structure and properties of lignin ...................................................................................... 7
3.3 Possible applications of lignin ......................................................................................... 10
3.4 The extraction of lignin from black liquor ...................................................................... 11
3.4.1 Background .............................................................................................................. 11
3.4.2 The LignoBoost process ........................................................................................... 12
4 Theoretical aspects of dead-end filtration .......................................................................... 15
4.1 Cake build-up during dead-end filtration ........................................................................ 15
4.2 Modelling of cake build- up ............................................................................................ 17
4.2.1 The Darcy equation .................................................................................................. 17
4.2.2 The classical filtration equation ............................................................................... 18
4.2.3 The case of compressible filter cakes ....................................................................... 19
4.3 Constitutive relationships ................................................................................................ 20
4.3.1 Empirical constitutive relationships ......................................................................... 20
4.3.2 Permeability relationships ........................................................................................ 21
4.3.2.1 The Kozeny-Carman equation .............................................................................. 21
4.3.2.2 Cell models ........................................................................................................... 22
4.4 Electrostatic and other particle interactions during filtration .......................................... 23
5 Overview of techniques for measuring local filtration properties .................................... 25
5.1 Local pressure .................................................................................................................. 25
5.2 Local solid content ........................................................................................................... 25
6 Materials and characterization techniques ........................................................................ 27
6.1 Materials .......................................................................................................................... 27
6.1.1 LignoBoost lignin ..................................................................................................... 27
6.1.2 Titanium dioxide ...................................................................................................... 27

X
6.2 Characterization techniques ............................................................................................. 27
6.2.1 Environmental scanning electron microscope (ESEM) ........................................... 27
6.2.2 Size of particles/agglomerates .................................................................................. 27
6.2.3 Other particle properties ........................................................................................... 27
7 The filtration equipment ...................................................................................................... 29
8 Experimental conditions and procedure ............................................................................. 31
8.1 LignoBoost lignin filtration experiments ........................................................................ 31
8.2 Titanium dioxide experiments ......................................................................................... 32
8.2.1 Sedimentation ........................................................................................................... 32
8.2.2 Filtration ................................................................................................................... 32
9 Evaluation of the experimental filtration data ................................................................... 33
9.1 Hydrostatic pressure profile ............................................................................................. 33
9.2 Determination of the filtration properties ........................................................................ 34
9.2.1 Average properties ................................................................................................... 34
9.2.2 Local properties ........................................................................................................ 34
9.3 Fitting of the local filtration data ..................................................................................... 35
9.4 Comparison between average and local measurements .................................................. 36
10 Results and discussion .......................................................................................................... 37
10.1 Characterization ............................................................................................................... 37
10.1.1 LignoBoost lignin (Paper I) ...................................................................................... 37
10.1.2 Titanium dioxide (Paper II) ...................................................................................... 39
10.1.2.1 Particle properties ............................................................................................. 39
10.1.2.2 Influence of salt addition on the size of the particles/agglomerates ................. 40
10.2 LignoBoost lignin filtration experiments (Paper I) ......................................................... 42
10.2.1 Local filtration properties ......................................................................................... 42
10.2.2 Average filtration properties .................................................................................... 44
10.3 Titanium dioxide experiments (Paper II) ......................................................................... 46
10.3.1 Influence of ionic strength on titanium dioxide sedimentation ................................ 46
10.3.2 Influence of ionic strength on titanium dioxide filtration ........................................ 46
10.3.2.1 Local filtration properties ................................................................................. 46
10.3.2.2 Average filtration resistance ............................................................................. 48
10.3.3 Fitting of the filtration models ................................................................................. 48
11 Conclusions ............................................................................................................................ 51

XI
12 Proposals for future work .................................................................................................... 53
13 Acknowledgments ................................................................................................................. 55
14 Nomenclature ........................................................................................................................ 57
15 References .............................................................................................................................. 59

XII

Introduction
1
1 Introduction
1.1 Thebiorefineryconcept
The technological advancements that have taken place during the past century are unique in the history of human civilization, considering their relative great extent and fast speed rate. General living standards also increased drastically in this time period as a benefit of these important technological advancements. This can be attested by the tremendous growth in the world’s population in approximately one hundred years: from around 1.6 billion in 1900 to over 7 billion in 2014. The development of the petroleum based industry is one of the main contributors to this rapid and important increase in technological development and general living standards. Today, society relies on a large number of products such as transportation fuels, materials, energy and chemicals that originate mainly from fossil oil. However, the world’s resources of natural oil are expected to be depleted in the coming century. Furthermore, their use contributes to the emission of carbon dioxide and climate changes. More sustainable alternatives to fossil oil must therefore be found rapidly and implemented into society in order to maintain current standards of living and minimize damage to the environment.
Solar energy, wind and biomass are the natural, abundant and sustainable resources currently expected to replace fossil oil for the generation of energy in the future. Nevertheless, of these three possible alternatives, biomass is the only resource that can support the production of consumer material commodities. In this perspective, the concept of biorefinery was developed and is of great importance (Ragauskas et al., 2006). According to the International Energy Agency, a biorefinery is “the sustainable processing of biomass into a spectrum of marketable products ranging from energy, food, feed, chemicals and materials applications”.
Processing biomass to use as an alternative to fossil oil is still challenging, however, mainly because of the heterogeneity of its composition. Compared with crude oil, biomass also faces the issues of having a lower carbon density and consisting of solid materials, with the latter making its collection and transport more complicated. On the other hand, oil resources need to be cracked, decomposed and functionalized for the production of chemicals and materials, whereas biomass already consists of functionalized building blocks, such as carbohydrate, protein and phenolic groups. Therefore, the key to a cost-effective biorefinery industry is the ability to design processes that are capable of separating biomass into its major compounds efficiently, thus making the best use of each respective fraction needed in the various products and chemicals. The possible biomass feedstocks for a biorefinery can be classified into four groups corresponding to four sectors of origin (Cherubini, 2010):
1. Agriculture crops and residues
2. Forest wood and plants
3. Industries (process residues and leftovers) and households (municipal solid waste and wastewater)
4. Aquaculture (algae and seaweeds)

Introduction
2
Among these possible feedstocks, wood has the advantage of being the most abundant organic material found on Earth, growing during the all year and furthermore, it does not compete directly with the food industry.
1.2 Pulpmillsasbiorefineries
Wood is mainly composed of cellulose (40-50 %), heterogeneous polysaccharides known as hemicelluloses (15-25 %) and lignin (20-35 %). Technologies focusing on the separation of the components of wood have been well established since the 19th century with the massive development of the pulp and paper industry. The Kraft pulping process is the most commonly used of the various pulping techniques currently employed. Its main advantage is that it produces a paper pulp with stronger cellulosic fibres than those obtained using the alternatives: mechanical, sulphite and soda pulping processes. Furthermore, this process also allows for an efficient and economical recovery of the cooking chemicals used, i.e. hydroxide and hydrosulphide ions.
In the Kraft pulping operation, lignin and part of the hemicelluloses are dissolved in the cooking liquor while the undissolved cellulose and hemicelluloses of the original wood chips form the paper pulp. Thus, only about half of the original wood material is used for the production of paper pulp, making lignin the main organic byproduct of the Kraft pulp industry. The dissolved materials, together with the spent cooking chemicals, are known as “black liquor” after the cook. The lignin dissolved in black liquor is today almost exclusively used as an internal combustion fuel in the recovery boiler. The amount of lignin generated in a modern Kraft pulp mill, however, is greater than the amount required to run the pulping process. Although this excess varies, it represents more than 10 to 20 % of the total amount of dissolved lignin in a modern mill (Gosselink, 2011). Furthermore, the capacity of the recovery boiler is usually the bottleneck of the pulping process, limiting the quantity of pulp that can be produced. In this case, it can therefore be beneficial to extract the excess amount of lignin from the black liquor. This removal of lignin decreases the heat load of the recovery boiler, thereby leaves capacity for the recovery of more cooking chemicals, and leads finally to an increase in the quantity of pulp that can be produced. Furthermore, the amount of lignin extracted is more than sufficient to cover the entire energy demand of the process if it is used directly as a solid biofuel, i.e. replacing fossil oil. The excess can be used directly in the mill as a solid biofuel, i.e. replacing fossil oil, or sold and exported elsewhere. Finally, incorporating the lignin extraction process into the pulping process may act as a kidney in the Kraft process, being beneficial in removing certain non-process elements such as aluminum and silica (Öhman et al., 2007a).
Lignin is also the major biomass compound based on aromatic units, i.e. leading to relatively high carbon content, which is available on a large scale. Lignin is thereby a particularly interesting potential raw material for the production of a large amount of different value added chemicals, as presented in Section 3.3. Thus, a promising opportunity for Kraft pulp mills would be to take a step towards becoming a biorefineries by implementing processes designed to efficiently extract and convert the available excess of lignin (and the other organic byproducts) into valuable products and chemicals. The Borregaard pulp mill in Norway is a good example of a well-established industrial biorefinery where more than 90 % of the wood input is converted into valuable products and chemicals. Furthermore, while the demand for printing paper continues to decrease with the fast development of new information technologies, the demand for lignin and other lignocellulosic raw materials is expected to increase drastically in coming years. Indeed, the inevitable depletion of fossil oil and growing environmental concerns will increase the needs and, consequently also, the profits of

Introduction
3
alternative technologies that use, for example, lignin as a raw material for the synthesis of valuable products and chemicals. Such technologies are therefore the object of intensive research; many are currently under development and some are already commercialized, as at Borregaard in Norway. Among potential lignin applications, the production of carbon fibres can, for example, be cited as being a very lucrative prospect (Kadla et al., 2002). Efficient methods of extracting and purifying lignin are necessary if lignin is to be used in the production of carbon fibres, for example. The LignoBoost process is a new technique designed to extract lignin from black liquor with a high degree of purity (Öhman et al., 2007), which was not achievable using the existing method for lignin extraction. A LignoBoost demonstration pilot plant was started up in 2007 in Bäckhammar (Sweden) and a first commercial LignoBoost unit was successfully brought on line in Plymouth (Domtar, USA) in 2013 (Macdonald, 2013). About 117 Mt of Kraft pulp is generated worldwide every year (Sixta, 2006). This corresponds approximately to 50 Mt of Kraft lignin solid materials. If 10 to 20 % of this amount were to be recovered using the LignoBoost process, a minimum of 4.5 to 9 Mt of lignin could be available worldwide each year for the synthesis of valuable products and chemicals. Furthermore, this would be achievable without making any major changes in existing pulping process, and would also be beneficial in enabling a possible increase in the amount of pulp produced in Kraft pulp mills. In the LignoBoost process, the dissolved lignin first undergoes acid precipitation at controlled pH and temperature: the further filtration of the precipitated lignin is therefore one of the main unit operations of the LignoBoost process. A description of the LignoBoost process is presented in Section 3.4.2.
1.3 Thefiltrationunitoperation
Filtration is a common non-heated unit operation used to separate solids from liquids, and is widely employed in, for example, food, mineral and pulp and paper industries. Efficient filtration unit operations are also essential in the emerging biorefinery industry in which raw material and products often consist of solid materials. Filtration in particular is one of the main unit operations of the LignoBoost process for extracting lignin from Kraft black liquor. Solid liquid separation by filtration is performed using a porous medium that allows the fluid to pass through it while it retains the solid particles (King, 1980). Dead-end filtration, deep-bed filtration and cross-flow filtration (“membrane filtration”) are the three existing filtration techniques; this work focuses only on the former, i.e. dead-end filtration. In dead-end filtration, the solid particles accumulate on top of the filter medium, thereby forming a filter cake. The driving force of the operation is the pressure difference across the filter media and the filter cake that is formed, which overcomes the flow resistance of the filter media and the filter cake. The pressure difference is obtained either by having a higher pressure at the solid suspension side, using e.g. simply gravity or, more commonly, centrifugal force or a piston press in a sealed environment, or by decreasing the pressure at the filtrate side, i.e. vacuum filtration. Once the filtration is terminated, the filter cake may be subjected to expression followed by a washing stage in order to increase the dry content and purity of the cake. Sometimes gas is also blown through the cake to displace the remaining liquor. Cake build up, expression, washing and gas blowing are the four steps generally embraced by the term “dead-end filtration”.
The efficiency of the filtration process depends mainly on the shape and size of the particles, the solid structure of the filter cake formed and its compressibility, the viscosity of the liquid and, finally, the maximum pressure difference allowable across the filter cake and the filter media. In order to evaluate the filterability of a material, two main filtration properties are

Introduction
4
usually considered: the solid content of the filter cake, known as the “cake solidosity”, and the flow resistance of the filter cake formed, known as the “filtration resistance”. The higher the solidosity and the lower the filtration resistance of the cake, the better the efficiency of the filtration process.
All filter cakes have a more or less compressible structure in which the local solidosity increases at increased local solid compressive pressure. A more compact solid structure is therefore found towards the bottom of compressible filter cakes, which also leads to an increase in the local filtration resistance. Depending on the degree of compressibility, this effect may have an important impact on the filtration behaviour of the material and, consequently, on the design of the filtration unit. However, the theoretical modelling of the filtration behaviour of compressible filter cakes is still a challenge. The determination of the local filtration properties that vary in the direction of the flow for compressible filter cakes is one important step that must be taken in order to achieve this objective. Another important aspect also under investigation is the understanding of the various particle-particle/slurry interaction mechanisms that occur during the cake build-up stage, such as friction or electrostatic forces. The shape and size of the solid particles and agglomerates, which influence the resulting structure and filtration properties of the filter cake, are influenced directly by these interactions. Therefore, a final objective to be achieved in the field of modelling the filtration process would be a description of the filtration properties of a material in terms of its particles and suspension properties.

Objectives
5
2 Objectives
The LignoBoost process is a new technology that could be implemented by most modern pulp mills in order to extract the excess lignin generated during the Kraft pulping process. The long term objective of this work is to optimize further the efficiency of the filtration stages of the LignoBoost process that has recently been implemented on an industrial scale. In order to achieve this objective, it is necessary to deepen the knowledge not only about the physical particle properties and cake filtration properties of the lignin obtained using the LignoBoost process but also about the mechanisms of inter-particle interactions occurring during the filtration process. The thesis is therefore divided into two separate studies.
The first part of this work (Paper I) investigates the local and average filtration properties of a softwood LignoBoost lignin extracted at the Bäckhammar pulp mill in Sweden. The influences of the slurry concentration and the applied filtration pressure were studied for two types of filter media; the LignoBoost lignin used was also characterized using several methods. To the author’s knowledge, no local filtration data of industrial LignoBoost lignin has been published before. This is probably due to two factors: the very recent availability of industrial LignoBoost lignin material and the experimental measurements involved in collecting local filtration data, which are more complicated than for average filtration data. However, local filtration data may be very relevant for optimizing the filtration efficiency of a material, for instance in order to investigate the compressibility behaviour of the filter cake formed during cake build-up. The second part of this work (Paper II) focuses on the influence of the electrostatic inter-particle interactions on the local filtration properties. Here, a general perspective was considered, with titanium dioxide being chosen as the model material. The ionic strength of titanium dioxide in suspension, which influences the electrostatic interactions, was altered through the addition of sodium chloride; the corresponding local and average filtration properties were determined at varying applied filtration pressure. The influence of the ionic strength on titanium dioxide particle agglomeration and sedimentation was also investigated. As far as is known, no local filtration data of such titanium dioxide systems is available in the literature even though local data, as already mentioned, may provide precious information on the compressibility behaviour of the filter cake formed during the cake build-up process.

Objectives
6

Overview of lignin
7
3 Overviewoflignin
3.1 Contentandfunctionoflignininwood
The word “lignin” is derived from lignum, the Latin for wood. Lignin is indeed one of the main components of wood, together with cellulose and hemicelluloses. Consequently, lignin is the second most abundant biopolymer found on Earth after cellulose. Lignin is also the only biomaterial based on aromatic units that is available on a large scale.
The content of lignin in wood differs between wood species. These are usually categorized into two groups: softwood (gymnosperm, i.e. conifers) and hardwood (angiosperm, i.e. deciduous or broad-leaved). One main difference between these two categories is the respective types of wood cells. Softwoods are the older wood species and have a microscopic structure composed of a very few types of cells. Hardwoods, on the other hand, are relatively younger species and have developed a more elaborated microscopic structure, with a larger number of different types of cells. In the temperate climate zone, the amount of lignin in softwood varies between 26 and 32 % and is usually about 20 to 26 % in hardwood (Sjöström, 1993).
One main function of lignin is to act as “glue” in the cell wall matrix of constituents: it keeps the cells from collapsing in on themselves by “gluing” them to each other. Thus, lignin provides the structural strength, rigidity and resistance to environmental stresses that are specific to wood materials (Sjöström, 1993). Finally, the hydrophobic nature of lignin prevents water from absorbing into the cell wall, thus playing an important role in the transport of water into the vascular tissues.
3.2 Structureandpropertiesoflignin
The structure of lignin is generally presented as a complex, three dimensional, randomly cross-linked matrix of phenyl propane units. Its structure is therefore singular compared to the more ordered repeating units found in other biopolymers, e.g. proteins and carbohydrates. Another particularity of lignin compared to the other biomolecules is that it is optically inactive: its asymmetrical carbons are racemic.
The chemistry and biosynthesis of lignin are still not fully understood: its structure is therefore not defined exactly and it is currently the object of extensive investigation. Nevertheless, it is known that lignin building blocks consist of three different phenyl propane units: Coniferyl alcohol, Sinapyl alcohol and p-Coumaryl alcohol, Fig. 1. The relative occurrence of the building blocks depends on the species of the plant, Table 1. The Coniferyl alcohol unit is almost exclusive in native softwood lignin while the Sinapyl alcohol is more dominant in native hardwood lignin (Henriksson, 2009).

Overview of lignin
8
Figure 1. Building blocks of native lignin.
Table 1. Composition of monolignols of three species of plants (Henriksson, 2009).
Plant type p-Coumaryl alcohol (%)
Coniferyl alcohol (%) Sinapyl alcohol (%)
Softwood 5 95 0 Hardwood 0-8 25-50 45-75
Grass 5-35 35-80 20-55
The linkages between the different lignin building blocks are currently considered to be random. Approximately two-thirds of the chemical bonds are ether linkages (C-O-C), with the remaining one third being carbon-carbon linkages (C-C). The different types of bonds and their relative occurrence vary between the wood species, as presented in Table 2. The -O-4 bond is the most common type of linkage found in native lignin (Henriksson et al., 2010).

Overview of lignin
9
Table 2. Frequencies of the different types of linkage found in native softwood and hardwood lignins per 100 C9 units (Henriksson et al., 2010).
Type of bond Structure Softwood Hardwood
-O-4
40-50 50-60
-5
10-12 3
5-5
13 3
4-O-5
3 3
-
3 3
Bonds to 1-position
1-3 3
The main functional groups found in native lignin are hydroxyl (aromatic and aliphatic), methoxyl, carbonyl, and carboxyl groups. The relative amount of the lignin functional groups present in lignin depends on the wood specie in question, as shown in Table 3. Brunow (2001) proposed an example of a softwood lignin structure showing the functional groups and the different linkages found in native lignin, see Fig. 2. The reactivity of lignin is affected by the proportion of these functional groups. For instance, an important property of lignin for the Kraft pulping process is its solubility in alkaline solution, which results from the ionization of the hydroxyl and carboxyl functional groups. The extraction technique applied to separate lignin from the other wood constituents substantially affects its structure: the resulting lignin is therefore distinguished from native lignin and referred to as “technical lignin”.

Overview of lignin
10
Table 3. Functional groups in native lignins (per 100 C6C3 units), Sjöström (1993).
Functional group Softwood lignin Hardwood lignin Methoxyl 92-97 139-158
Phenolic hydroxyl 15-30 10-15 Benzyl alcohol 30-40 40-50
Carbonyl 10-15
Figure 2. Example of a softwood lignin structure as proposed by Brunow (2001), showing the main lignin functional groups (the carboxyl groups are absent).
3.3 Possibleapplicationsoflignin
Potential applications of lignin can be classified in three main groups corresponding to an estimated period of time needed to reach the market economy (Gosselink, 2011). The first is the current and near term applications of lignin as a source of carbon molecules in the production and application of various kinds of energy and power, such as fuel and syngas. The second category includes medium term applications, where lignin is used as a macromolecule for the production of e.g. wood adhesives, carbon fibers and polyurethane foams. The final group consists, in general, of longer term applications where lignin is degraded into its monomers for the obtention of aromatic building blocks, such as benzene, toluene, phenol and aromatic acids. Table 4 shows some possible uses of lignin corresponding to this classification.

Overview of lignin
11
Table 4. Potential applications of lignin (Holladay et al., 2007; Higson 2011).
Lignin Fuel and syngas
products Macromolecule- derived products
Monomer-derived products Hydrocarbons Phenols Oxidized
products Methanol
DME Ethanol
Mixed alcohols Fisher-Tropsch
liquids C1-C7 gases
Carbon fibres Polymer extenders
Thermoset resins Composites Adhesives
Binders Preservatives
Pharmaceuticals Polyols
Benzene Toluene Xylene
Cyclohexane Styrene
Biphenyls
Phenol Substituted
phenols Catechols Cresols
Resorcinols Eugenol Syringols Coniferols Guaiacols
Vanillin Vanillic acid
DMSO Aromatic acids Aliphatic acids Syringaldehyde
Aldehydes Quinones
Cyclohexanol B-keto adipate
Among the products proposed, carbon fibres can be highlighted as a very interesting potential application of lignin (Kadla et al., 2002). Materials made from carbon fibres have indeed the particular advantage of being strong and lightweight. The ability to produce carbon fibres from biomass feedstock, which is an abundant and renewable resource, would therefore have a great industrial impact. The aircraft, automotive and sport sectors would most likely use carbon fibres to a large extend if this material were to become readily available. Consequently, an important and increasing number of studies are currently being undertaken to develop technologies able to convert lignin into carbon fibres efficiently. One main objective is to avoid lowering the mechanical strength of the carbon fibres produced when using lignin vis-à-vis what is currently being obtained using mainly polyacrylonitrile (PAN). When such new technologies become available the popular, old and caustic maxim “you can do anything with lignin except make money” (which is already misleading) will definitely belong in the past.
Nevertheless, the conversion of lignin into high valuable products such as carbon fibres requires an original lignin feedstock with a notably high degree of purity. This can be reached by extracting lignin from Kraft black liquor using the LignoBoost process (Celzard et al., 2008).
3.4 Theextractionofligninfromblackliquor
3.4.1 BackgroundIn order to be considered effective, the extraction of lignin from black liquor should fulfill the following objectives:
‐ High yield of the extracted lignin ‐ Low amount of impurities in the extracted lignin ‐ Relatively simple and robust procedure, with a low energy demand and low
consumptions of chemicals and water
The two main existing techniques for lignin extraction are acid precipitation, followed by filtration and displacement washing, and ultrafiltration.

Overview of lignin
12
The use of acid to precipitate lignin has been shown to provide a higher lignin yield at a lower estimated cost (Uloth and Wearing, 1989a & b), making this the method that is preferred. However, performing ultrafiltration prior to precipitation can be beneficial in some cases, e.g. in lowering the filtration resistance of difficult-to-filter lignin that originates from hardwood (Wallmo et al., 2009a).
The acid precipitation of lignin, followed by filtration and washing, is a relatively old technique that was first used industrially in 1942 (Westvaco Company, in USA) (Pye, 2008). The efficiency of the procedure depends mainly on three parameters: pH, temperature and ionic strength. A pH varying between 9.5-10.5 and a temperature of 60-80 have shown to improve both the precipitation yield of lignin from black liquor and the corresponding filtration properties of the lignin obtained (Öhman and Theliander, 2007b; Zhu, 2014a). A higher ionic strength of the initial black liquor was also observed to lead to an increased precipitation yield (Zhu, 2014b). Furthermore, using carbon dioxide as the acidifying agent was found to be advantageous regarding the operational costs. Carbon dioxide also has the advantage of not disturbing the sulphur balance of the Kraft pulping process as is the case with sulphuric acid, which is the other main acidifying candidate (Wallmo, 2007). Subjecting the black liquor to heat treatment before precipitation has also been found to improve filtration properties (Öhman et al., 2007c). Furthermore, the dry solid content of the initial black liquor was shown to be important with respect to the extraction efficiency of lignin (Loufti et al., 1991). The intake of black liquor should therefore be placed after the liquor has passed through part of the evaporation train in the Kraft pulping process line.
3.4.2 TheLignoBoostprocessThe LignoBoost process is an improved version of the acid precipitation extraction technique, performed at controlled pH and temperature (Öhman et al., 2007a). The main difference is the addition of an extra filtration stage (without washing) and of a re-slurring step where the pH is decreased before the final washing stage, which allows a much higher degree of purity to be achieved regarding the extracted lignin.
In the old process, part of the precipitated lignin was re-dissolved during the washing stage; a loss in solid lignin of around 13-23% was recorded during washing (Öhman et al., 2006). In addition to lowering the yield of the lignin extracted, the partial re-dissolution could lead to clogging of the filter media and/or of the filter cake if lignin precipitated again, which had severe consequences on the efficiency of the washing stage. Complete clogging results in virtually no washing flow, while partial clogging favours the existence of a preferred flow path within the filter cake, thereby resulting in a very uneven washing of the cake (Öhman et al., 2006).
The re-dissolution of lignin during washing was found to be the consequence of large gradients in both the pH and ionic strength of the lignin filter cake. Indeed, lignin is extracted at a pH value of about 10 while the acid wash water has a pH of about 2-3. Furthermore, a relatively high amount of ions (mainly sodium) is trapped in the precipitated lignin (Öhman et al., 2006). The sodium salts were found to be easily displaced by the wash liquor (thus rapidly decreasing the ionic strength): the pH value, however, was shown to remain rather high due to the high buffering capacity of the system (lignin and some salts). Wash water of low ionic strength, coupled with a relatively high pH, are conditions that favour the re-dissolution of lignin in the wash water. Nevertheless, a further small decrease in the pH results in the re-precipitation of the lignin dissolved and can, therefore, lead to blinding of the pores in the filter cake.

Overview of lignin
13
The LignoBoost process, which is a two-stage separation process, allows lignin dissolution during the washing stage to be minimized, thereby avoiding possible plugging of the filter cake and/or the filter media. A schematic diagram of the LignoBoost process is presented in Fig. 3. In this process, prior to the washing stage, the filter cake is re-dispersed in acid water with a pH that has been adjusted to that of the final wash water using sulphuric acid. The re-slurring water is usually taken from the spent wash water stream in order to minimize the consumption of both water and sulphuric acid, Fig. 3. The main changes in pH and ionic strength thus take place simultaneously in the re-slurring tank. This means that the pH gradient in the final washing stage is very small; the ionic strength gradient is also reduced considerably by the dilution in the re-slurring tank water. Therefore, even though some minor amount of lignin is still being dissolved during the final washing stage because of the small ionic strength gradient, plugging problems are no longer encountered. Washing can thus be performed and a good degree of efficiency is achieved. Moreover, an additional lignin precipitation was found to occur during the re-slurring stage because of the low pH of the re slurring water. Consequently, an increase in the total lignin yield is achieved using the LignoBoost process even when the residual amount of lignin re-dissolved during the final washing stage is taken into consideration. This improved washing efficiency means that the investments costs can be reduced; the size of the filter area and the volume of the acid wash water can also be decreased. Since part of the spent wash water is recirculated to the black liquor stream, the reduction in the amount of wash water used is also beneficial in terms of the energy demand of the evaporator, Fig. 3.
Figure 3. Schematic diagram of the LignoBoost process. AP = acid precipitation stage;
DW = dewatering stage.

Overview of lignin
14

Theoretical aspects of dead-end filtration
15
4 Theoreticalaspectsofdead‐endfiltration
4.1 Cakebuild‐upduringdead‐endfiltration
A schematic representation of cake formation during dead-end filtration is presented in Fig. 4; the cases of a compressible filter cake (left) and an incompressible filter cake (right) are shown. In reality all filter cakes form more or less compressible structures.
Figure 4. Schematic diagram of cake formation during dead-end filtration. Left: a compressible cake. Right: an incompressible cake.
The liquid flows through the filter media because of the applied piston pressure, as illustrated in Fig. 4. The solid particles do not pass through the filter, so they accumulate on top of it. This results in the formation of a cake with a more or less homogeneous solid density in the direction of the flow, depending on the degree of compressibility. The solid density of a filter cake is often described as its “solidosity”, which is defined as the volume-based fraction of solids within it. The expression of the average solidosity,∅ , of the filter cake is given by Eq. 1 and by Eq. 2 during cake build-up. Solidosity can also be related to porosity , Eq. 3.
∅
Eq. 1
∅ ≡
1
Eq. 2
1 Eq. 3

Theoretical aspects of dead-end filtration
16
As the liquid flows through the cake it acts on the solid through skin friction, which results in a drag force being exerted on the particles. A one-dimensional force balance performed on a small element of the filter cake, at a time of the filtration experiment, can be written as Eq. 4. Gravitational and inertial forces are not included in this force balance; neither is the atmospheric pressure, which appears on both sides of this equation.
∆
,,
Eq. 4
where is the piston pressure applied (which is also equal to the pressure drop over the filter cell ∆ ), the sum of the liquid drag on the solid particles, the cross- sectional area of the filter cell and the local liquid pressure or hydrostatic pressure.
The solid stress ratio ,
is usually interpreted as a pressure: the local compressive pressure
of the solid during filtration, i.e. , ,, assuming point contact between the material
particles.
When the filter cake starts to form, it induces a resistance towards the flow of liquid passing through it, the cake filtration resistance, which gives a measure of how easy or difficult a material is to filter. The average filtration resistance of a filter cake can be defined by Eq. 5.
1≡1
Eq. 5
where is the average filtration resistance of the filter cake, the pressure drop over the filter cake and the local specific filtration resistance. The total pressure applied on any cross section of height of the filter cell is constant and equal to the applied piston pressure in addition to the atmospheric pressure, Eq. 4. Therefore, it may only be time dependent as a function of the filtration mode set for the applied piston pressure. The three filtration modes possible during cake build- up are: constant pressure filtration, constant flow rate filtration, and variable pressure and flow rate. The filtration experiments in this work were performed at constant pressure.
Even when the total applied pressure is constant, it should be remembered that both the solid compressive pressure and the hydrostatic pressure are varying not only with time but also spatially in the direction of the flow, i.e. all the more the solid particles fasten into the packaging structure. At constant applied pressure, the solid compressive pressure increases with time and in the direction of the flow, while a corresponding decrease in local hydrostatic pressure is observed as the liquid transmits its pressure load to the solid via skin friction.
It is the increasing drag on the solid particles over time and in the direction of the flow that may cause the solid particles to be packed more compactly over time and the closer from the base of the filter cake. In the general case of a compressible filter cake, the solid structure cannot sustain the increase in drag so a new, more compact, structure is gradually formed by the rearrangement and/or deformation of the particles/agglomerates. The compressibility of the filter cake usually levels out when the solid compressive pressure is high enough, i.e. when a sufficiently stable compact structure has been achieved. A more compact structure formed over time and in the direction of the flow also results in an increase in the filtration resistance over time and in the direction of the flow.

Theoretical aspects of dead-end filtration
17
The extent to which a filter cake is compressible can be evaluated by investigating the influence of the solid compressive pressure on its solidosity and filtration resistance. During cake build-up, this can be determined by making local measurements during the filtration experiment. A range of solid compressive pressures is covered over time at one given position in the filter cake, so a study of the local influence of the solid compressive pressure during cake build- up can be performed at one single height within the filter cake. The solid particles in compressible filter cakes move within the filter cake during filtration; the velocities of both the liquid and the solid are also spatially dependant. The liquid velocity increases in the direction of the flow since the size of the flow channels are smaller where the structure of the cake is being compressed. Furthermore, a high slurry concentration has the potential of accentuating the variation in the velocity of the liquid passing through a compressible filter cake (Bai and Tien, 2005). The mobility of the solid particles within the filter cake becomes all the more limited as the structure of the cake becomes compact, and it therefore decreases with time and in the direction of the flow.
4.2 Modellingofcakebuild‐up
4.2.1 TheDarcyequationIn 1856, Darcy proposed a correlation describing the flow through a porous solid bed as a function of the pressure drop (Darcy, 1856). The Darcy equation can be applied locally to describe the flow of liquid passing through a differential element of a filter cake being formed during filtration, Eq. 6. It should be noted that this equation is only valid for incompressible structures. In the original relation proposed by Darcy, the influence of the fluid viscosity was not included. The equation presented below is even though referred to as Darcy’s equation, and considers an incompressible differential element of the filter cake.
Eq. 6
where is the coordinate of the superficial fluid velocity , the local permeability of the cake and the fluid viscosity.
The permeability is a characteristic of a solid bed which describes its ability to allow a fluid to pass through it, and is usually considered as being related only to the geometry of the bed. Therefore, correlations relating the permeability to the solidosity and to the diameter of the particles or their surface area are of interest, see Section 4.3.2. However, in the case of filtration, this characteristic of a solid bed is commonly presented in term of resistance to flow. The relation between the permeability of a cake and its filtration resistance is defined by Eq. 7. The main advantage of using filtration resistance over permeability is that the influence of pressure is smaller. When doing so, the pressure dependency of the cake structure included in is divided between the properties and .
1
Eq. 7
where is the solid density of the particles.
Eq. 6 can then be expressed in terms of flow resistance using Eq.7, which gives Eq. 8.
1
Eq. 8

Theoretical aspects of dead-end filtration
18
In order to solve the above equation, two constitutive relationships are needed that relate and respectively to . In practice, correlations relating and to are preferred because they have a more direct physical meaning. Eq. 8 can also be rewritten in terms of (Eq. 9
below) using the spatial derivative of Eq. 4, which gives .
1
Eq. 9
4.2.2 TheclassicalfiltrationequationThe classical filtration equation is used to describe the formation of a cake over time. It also allows for the determination of its average filtration resistance, as defined by Eq. 5. This equation was proposed by Ruth in 1935 and was obtained by an integration of the Darcy equation over the entire filter cake; using Eq. 7 it can be expressed in terms of filtration resistance as Eq. 10. The relation is based on the assumption of the filter cake being incompressible, which implies that:
‐ the velocity of the solid particles is zero ‐ the velocity of the superficial fluid is constant over the entire filter cake and can be
considered equal to the filtrate velocity, i.e. , where is the volume of the filtrate
‐ the solidosity is constant over the entire filter cake and is equal to its average solidosity
‐ the filtration resistance is constant over the entire filter cake and is equal to its average filtration resistance
∅ ∅1
Eq. 10
The pressure drop over the filter cake is often difficult to measure experimentally. It is usually more convenient to use the pressure drop over the entire filter cell, i.e. the filter cake and the filter media, which is equal to the filtration pressure, Eq. 11. In order to express the pressure drop over the filter media, ,a filter media resistance is introduced:
∆ Eq. 11
The classical filtration equation is obtained by combining Eqs. 10 and 11, and is often written as Eq. 12:
∆
Eq. 12
where is the mass of solids per unit filtrate volume, which can be considered constant for incompressible filter cakes.
Plotting against gives a straight line during cake formation at constant applied pressure.
The average filtration resistance can then be determined from the slope of the line obtained.

Theoretical aspects of dead-end filtration
19
The resistance of the filter media can also be deduced from its interception with the ordinate axis.
Eq. 12 also works well for weakly compressible filter cakes in the determination of by
plotting against when experiments are performed at constant applied filtration pressure.
The filter media has often a very low flow resistance compared to the cake (apart from a few seconds at the beginning of the experiment), so the pressure drop across the filter cake is virtually constant when performing experiments at constant applied pressure. Furthermore, in the case of weakly compressible filter cakes (or more compressible filter cakes if blinding effects are avoid) that are subjected to a constant pressure drop over the filter cake, the average filtration resistance is often virtually constant regardless of the height of the filter cake. This last statement can be verified by plotting the dimensionless height of the filter cake versus pressure to see if the same profile is obtained regardless of its true height. It can also
be confirmed by the fact that the plot of versus gives a straight line for Eq. 12. If the plot
that is obtained is not linear, it is then clear that the cake is very compressible and/or there are severe blinding effects. The pressure drop over the filter cake, and therefore its average filtration resistance, might not be stabilized at the early stage of the filtration process, as already mentioned, due to the relatively high flow velocity when the filter cake is very thin (Hermia, 1988). Consequently a straight line is not usually obtained from the start and the calculated average filtration resistance does not describe the early stage of filtration.
Eq. 12 is also used at times in its integrated form to determine by measuring the volumes of filtrate obtained at some chosen experimental times. However, the differential expression is more accurate since it considers instant values: this makes the detection and exclusion of eventual flow variations possible whereas the integrated expression includes, and averages out, such experimental errors.
4.2.3 ThecaseofcompressiblefiltercakesWhen the solid structure is compressible, the liquid velocity in Eq. 6 should be replaced by the liquid velocity relative to the velocity of the solid particles, since they are also in motion within such cakes. The Darcy equation was therefore modified by Shirato et al. (1969) in order to extend its use to embrace compressible solid packing by taking the velocity of the solid particles into account, Eq. 13.
1
Eq. 13
where is the superficial velocity of the solid material in the direction.
Tiller and Shirato (1964) introduced a correction factor scaling the product in Eq. 12 in order to consider the variations in and over the cake, that result from the compressibility of the filter cake. The “ factor” accounts for the variations of the velocities of both the liquid and the solid within the filter cake during filtration. It is a function of the initial concentration of the slurry and the pressure applied; it was also found to approach unity for a highly diluted slurry.

Theoretical aspects of dead-end filtration
20
4.3 Constitutiverelationships
4.3.1 EmpiricalconstitutiverelationshipsA number of empirical relationships have been proposed in order to solve Eqs. 8, 9 and 13, which relate the local filtration resistance and the local solidosity to the local compressive solid pressure. These constitutive relationships can be used to evaluate the degree of compressibility of a filter cake. The filtration resistance and the solidosity are often modelled as power law functions of the solid compressive pressure, which is considered as being the only independent variable. The following relationships are some common examples of such correlations. Eqs. 14 and 15 were proposed by Tiller (1955) and Eqs. 16 and 17 by Tiller and Leu (1980) to describe the local filtration properties during cake build-up as a function of the local solid compressive pressure.
for and for Eq. 14 for and for Eq. 15
1 Eq. 16
1
Eq. 17
where , , , , , and are parameters, an arbitrarily chosen low pressure and and the and values determined experimentally at the local pressure .
The two simple power laws initially proposed by Tiller, i.e. Eqs. 14 and 15, have the disadvantage of requiring the local properties to be determined at low solid pressure , which is often difficult to do experimentally. Furthermore, they also predict that the filtration properties will approach zero at very low solid pressures, which is physically impossible. The other set of correlations proposed later on by Tiller and Leu, in Eqs. 16 and 17, avoid this physical incoherence by introducing the additional parameters and : these may be interpreted as the respective values of and obtained at zero solid compressive pressure, i.e. at the top of the filter cake. The parameters and also give an indication of the degree of compressibility of the filter cake material being investigated: high values of and correspond to a high degree of compressibility.
Experimental local data is needed in order to determinate the value of the parameters of these empirical constitutive relationships; this has to be done for every filtration system investigated. Average filtration data is often more simple to determinate experimentally, so expressions of the average filtration properties as a function of the parameters of the empirical correlations are also used. The average filtration resistance and average solidosity during cake build-up can be defined by Eqs. 5 and 2, respectively. The integration of Eqs. 5 and 2 using the Tiller and Leu relationships expressing the local properties, Eqs. 16 and 17, gives the average filtration properties relations as functions of the empirical relationships parameters, Eqs. 18 and 19. Eq. 9 was also used to develop Eq. 19 using a quasi-steady state approximation of a constant over the entire filter cake.
1 /1 / 1
Eq. 18

Theoretical aspects of dead-end filtration
21
∅
11
1 / 11 / 1
Eq. 19
These relations are valid for 1 and 1.
Collecting the fitted parameters obtained when experimental filtration data of several materials known to be more or less compressible, allowed a classification of the material to be constructed (Leu, 81), Table 5. This classification is based on the values of the Tiller and Leu parameters, Eqs. 16 and17, and characterizes a material filter cake with respective to its degree of compressibility.
Table 5. Classification of material based on the parameters of the empirical constitutive relationships proposed by Tiller and Leu, (Leu, 81).
Pressure dependency of the filter cake material
Parameter weak moderate strong
[-] 0.20 0.60 1.20
[m/kg] 109 1010 1011
[-] 0.05 0.15 0.30
[-] 0.30 0.20 0.10
4.3.2 Permeabilityrelationships
4.3.2.1 TheKozeny‐CarmanequationThe Kozeny-Carman equation (Kozeny, 1927) is used to describe the flow of liquid through a porous bed as a function of the pressure drop at laminar conditions, the liquid viscosity and the structure of the bed, Eq. 20. It considers a bed structure composed of an assemblage of tortuous capillaries. It is based on the Hagen-Poiseuilles equation that describes the laminar flow of a Newtonian fluid in a cylinder. A good accuracy of the Kozeny-Carman equation was obtained in the case of rigid particles with a narrow size distribution and being relatively large in size.
11
Eq. 20
where is the Kozeny-Carman constant, which depends on the geometry of the particles and the porosity of the bed, and is the specific surface area of the particles.
By comparing Eq. 20 to Darcy’s equation, Eq. 6, an expression of the permeability as a function of the cake structure can be obtained, Eq. 21.
1
Eq. 21
Theoretical aspects of dead-end filtration
22
Assuming that the solid is composed of perfect spheres, the specific surface area of the particle can be replaced by the particle diameter according to 6/ . A value of 4.8 is also often used in the case of solid spheres. The permeability in Eq. 21 can be replaced by the filtration resistance using Eq. 7. Consequently, Eq. 21 can be rewritten as Eq. 22:
172.8
1
1∅
Eq. 22
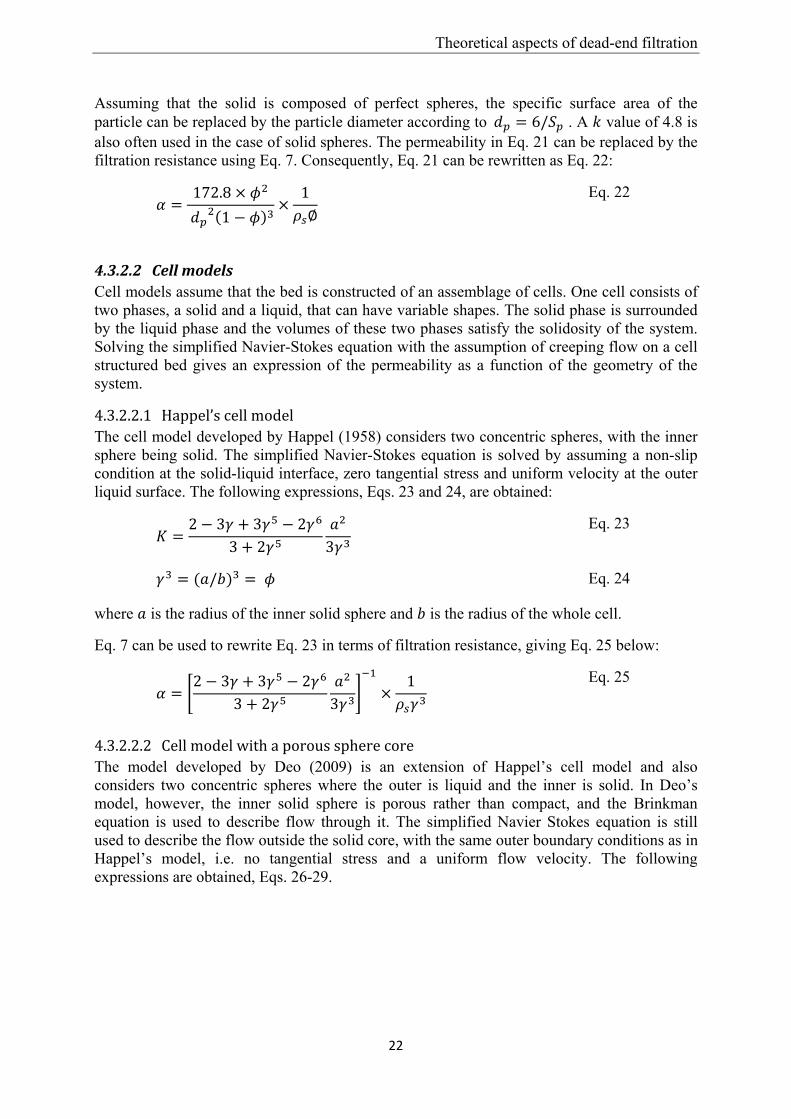
4.3.2.2 CellmodelsCell models assume that the bed is constructed of an assemblage of cells. One cell consists of two phases, a solid and a liquid, that can have variable shapes. The solid phase is surrounded by the liquid phase and the volumes of these two phases satisfy the solidosity of the system. Solving the simplified Navier-Stokes equation with the assumption of creeping flow on a cell structured bed gives an expression of the permeability as a function of the geometry of the system.
4.3.2.2.1 Happel’scellmodelThe cell model developed by Happel (1958) considers two concentric spheres, with the inner sphere being solid. The simplified Navier-Stokes equation is solved by assuming a non-slip condition at the solid-liquid interface, zero tangential stress and uniform velocity at the outer liquid surface. The following expressions, Eqs. 23 and 24, are obtained:
2 3 3 23 2 3
Eq. 23
/ Eq. 24
where is the radius of the inner solid sphere and is the radius of the whole cell.
Eq. 7 can be used to rewrite Eq. 23 in terms of filtration resistance, giving Eq. 25 below:
2 3 3 23 2 3
1
Eq. 25
4.3.2.2.2 CellmodelwithaporousspherecoreThe model developed by Deo (2009) is an extension of Happel’s cell model and also considers two concentric spheres where the outer is liquid and the inner is solid. In Deo’s model, however, the inner solid sphere is porous rather than compact, and the Brinkman equation is used to describe flow through it. The simplified Navier Stokes equation is still used to describe the flow outside the solid core, with the same outer boundary conditions as in Happel’s model, i.e. no tangential stress and a uniform flow velocity. The following expressions are obtained, Eqs. 26-29.

Theoretical aspects of dead-end filtration
23
2 1 32 1 14 30
9 1 23 10 1
3
2 1 3 2 5 5 1 15
9 1 23 10 1
3
Eq. 26
sinh 1
1 cosh 1 sinh 1
Eq. 27
/
Eq. 28
/ /
Eq. 29
where and are the permeability and solidosity of the inner sphere, respectively.
Eq. 7 can be used to rewrite Eq. 26 in terms of filtration resistance, giving Eq. 30:
∅
Eq. 30
4.4 Electrostaticandotherparticleinteractionsduringfiltration
The main inter-particle interactions that occur during cake build-up are friction, interlocking between particles and forces such as van der Waals and electrostatic interactions. The inter-particle interactions govern the micro solid structure of the filter cake being formed, thereby influencing its filtration properties greatly. The physical surface of the particles may also affect the flow resistance during filtration due to liquid friction.
Electrostatic interactions were shown to be very significant for particles on a micrometer scale or smaller (Fu and Dempsey, 1998; Wakeman et al., 1989). They are governed by the structure and the surface charge of the solid particles. Modifying either the pH or the ionic strength of the surrounding liquid are possible ways of reducing the electrostatic repulsive interactions between particles and, in turn, favour agglomeration. Studies have shown that modification of the particle surface charge by varying the pH of the slurry had a significant effect on the resulting porosity and filtration resistance of the cake (Mattsson et al., 2011; Larue et al., 2003). A decrease in the surface charge of particles, resulting in a more porous cake structure and decrease in the filtration resistance, was for example obtained for titanium dioxide when the filtration slurry had a lower pH (Mattson et al., 2011). Altering the ionic strength of titanium dioxide suspensions was also shown to have an impact on the charged

Theoretical aspects of dead-end filtration
24
diffuse layer of the surface of the titanium dioxide particles (Zhao et al., 2004). A decrease in the thickness of the diffuse layer was obtained with suspensions of high ionic strength, resulting in an extensive flocculation of the particles and a decrease in the flow resistance, during ceramic microfiltration of titanium dioxide.

Overview of techniques for measuring local filtration properties
25
5 Overview of techniques for measuring local filtrationproperties
5.1 Localpressure
Measuring the hydrostatic pressure during a filtration experiment is relatively easy when compared to the solid compressive pressure. Therefore, it is often preferred to measure directly the hydrostatic pressure and to use it to estimate the solid compressive pressure. Pressure probes can be mounted inside the filter cell; several configurations have been proposed for their location. Pressure probes that are mounted at the bottom of the filter cell and through the filter media (Johansson and Theliander, 2003) have been shown to provide more accurate measurements compared to alternate configurations, such as attached to the cell wall (Chase and Willis, 1992) or extending downwards from the top of the filter cell (Okamura and Shirato, 1955). Proximity to the wall may affect the actual flow of the filtrate and the solid build-up of the cake, whereas using probes mounted downwards from the top of the cell allows free flow paths to form around them so the measurements made may not describe the actual hydrostatic pressure within the filter cake structure that is being formed.
5.2 Localsolidcontent
The local solid content of a filter cake can be measured through several techniques. A relatively simple and inexpensive one is cake dissection when filtration is complete (Meeten, 1993; Yim and Song 2008). This, however, is a destructive method and means that the local solid content cannot be determined continuously during a filtration experiment. Non-destructive and continuous methods for measuring solidosity can be performed using e.g. NMR, for which a high level of accuracy is possible (error of less than 1%) (La Heij et al., 1996). Methods measuring the attenuation of and x-rays are also non-destructive and continuous (Bergström, 1992; Johansson and Theliander, 2003), in which an estimated error of 2 % can be achieved (Mattsson et al., 2011). The time resolution and error of measurement can nevertheless be improved by using a strong radiation source. Conductivity measurements can also be performed as a non-destructive and continuous technique, although it requires either conductive material or the addition of an electrolyte: errors of about 5 % have been reported using this method (Chase and Willis, 1992). Cake coloration has also been used to measure its local solid content, but this technique is limited by the height of the coloured layer and requires a complex procedure of cake formation (Hutto, 1957).

Overview of techniques for measuring local filtration properties
26

Materials and characterization techniques
27
6 Materialsandcharacterizationtechniques
6.1 Materials
6.1.1 LignoBoostligninThe lignin used in this work was a softwood lignin extracted from black liquor using the LignoBoost process at the Bäckhammar mill in Sweden.
6.1.2 TitaniumdioxideThe titanium dioxide used in this work was a 98% pure anatase powder. Anatase is one of the three natural mineral forms of titanium dioxide and is commonly used as a model material for filtration. Titanium dioxide is also of particular interest to this study because of its small particle size. Small particles enhance surface-related phenomena such as inter-particle electrostatic forces. The influence of electrostatic forces was studied by altering the ionic strength of the anatase suspensions through additions of sodium chloride.
6.2 Characterizationtechniques
6.2.1 Environmentalscanningelectronmicroscope(ESEM)Micrograph images of LignoBoost lignin in moist environment and dried titanium dioxide powder were taken with an environmental scanning electron microscope (ESEM), a Zeiss EVO HD15, in order to evaluate the shape and sizes of the particles/agglomerates. An advantage of using an ESEM microscope rather than a scanning electron microscope (SEM) is the possibility of operating under humid conditions. This is beneficial in the case of organic materials such as lignin, where drying might have a significant impact on the structure of porous agglomerates, see Section 10.1.1. In the case of inorganic crystals such as titanium dioxide, a dry mode is preferred as the images produced tend to be much sharper.
6.2.2 Sizeofparticles/agglomeratesThe sizes of the particles/agglomerates were determined using a laser diffraction technique performed in highly diluted conditions with a Malvern Instruments Mastersizer 2000 capable of detecting particle sizes between 0.02 µm and 2000 µm. In the case of titanium dioxide, the influence of ionic strength on the particle/agglomerate size was also evaluated using a Mettler-Toledo Focused Beam Reflectance Measurement (FBRM) G400 probe. The probe employs a rotating laser beam with high speed optics that scans a circular path of the sample; it provides a chord length distribution by crossing particles on any straight line between two edge points. Measurements are performed using backscattered light technique and the chord lengths detected ranged from 1 µm to 1000 µm.
6.2.3 OtherparticlepropertiesThe particle properties were characterized using various techniques. B.E.T. surface area measurements were performed on dried samples using a Micromeritics Tristar 3000 with nitrogen as the adsorption gas. The solid density of the dried particles was measured by a Micromeritics Accupyc 1330. In the case of lignin, the dry content of the initial powder was determined with a Sartorius device MA30. Finally, in the case of titanium dioxide, a ZetaPALS from Brookhaven Instruments was used to determine the ζ-potential of the particles.

Materials and characterization techniques
28

The filtration equipment
29
7 Thefiltrationequipment The filtration equipment used in this work was designed for filtration, expression and washing experiments: a picture and a corresponding schematic diagram of the device are presented in Fig. 5 a. and b. The pneumatic cylindrical piston is able to deliver a filtration pressure of up to 6 MPa at the piston-slurry interface. The filtration cell is 0.175 m in height and 0.06 m in inner diameter; its lower section is composed of a Plexiglas cylinder measuring 0.115 m in height, which enables visual observation during filtration experiments. The base of the filter cell consists of a perforated steel plate that supports the filter media and allows for the flow of the filtrate during experiments.
Figure 5 a. and b. Picture and corresponding schematic diagram of the filtration equipment. 1) Piston press, 2) two sealing O-rings coated in grease to facilitate piston motion within the cell and prevent backflow of the slurry, 3) 241Am -source facing the detector at the other side of the filtration cell, placed on a movable rack, 4) filtration cell with water-filled capillaries of different heights mounted at the bottom, 5) recipient to collect the filtrate, placed on a mass balance, 6) pressure transducers and 7) recording computer unit.
The following data is measured and recorded during a filtration experiment by means of a computer connected to the filtration device:
‐ the piston position: every two seconds. ‐ the filtrate mass, collected in a vessel placed on a mass balance (Mettler Toledo SB
32000 with a repeatability of 0.5 g): every two seconds. ‐ the local hydrostatic pressure at eight different heights: every two seconds (see below). ‐ the total -radiation counts that pass through a local slice of the filter cell: every
minute for the LignoBoost lignin experiments, and every five minutes for the titanium dioxide experiments (see below and Section 9.2.2).
The local hydrostatic pressure is determined using eight water-filled capillary tubes of different heights mounted at the bottom of the filter cell and connected to pressure transducers, Fig. 5 b. The pressure transducers (Kristal Instrument AG) have a maximum

The filtration equipment
30
measurement error of 10 kPa. A schematic diagram of a capillary tube is shown in Fig. 6. Each capillary tubes has an opening of 0.6 mm in diameter at its top, which is parallel to the direction of the flow, and a sharp conical top to minimize flow disturbances. Other openings are located between 0.5 and 12 mm above the filter media, depending on the height of the tube. Calibration to atmospheric pressure was performed before each filtration experiment was started. Determination of the local solid concentration during a filtration experiment is performed using a 241Am -source and detector placed on a movable rack that is located at each side of the filtration cell, Fig. 5. The 241Am -source and detector are lead-shielded, with only a thin uncovered slit centred on each item and facing towards each other, Fig. 7. The openings are 24 mm wide, 3 mm high for the source and 1 mm high for the detector. Both are 20 mm deep to assure a well-collimated beam. Thus the -radiations that pass through a precise slice of the filter cell can be recorded; the local solidosity can be calculated from the attenuation of the -radiations that is measured, see Section 9.2.2. The position of the slice of filter cell being investigated is determined by the position of the movable rack, which was chosen to be at 12 mm from the filter media. The attenuation of rays is mainly the result of the photoelectric effect and Compton scattering (Bertin, 1975), since the energy interval investigated was 36 to 91 keV. Further information regarding the filtration unit can be found elsewhere (Johansson and Theliander, 2003).
Figures 6 (left) and 7 (right). Fig. 6: Schematic representation of a water-filled capillary tube with a hole parallel to the direction of flow and a sharp conical top. Fig. 7: Frontal representation of the cylindrical lead-shielded 241Am - source and detector showing the thin, central, unshielded openings.

Experimental conditions and procedure
31
8 Experimentalconditionsandprocedure
8.1 LignoBoostligninfiltrationexperiments
The concentrations of the slurry and the piston pressures applied that were investigated in the LignoBoost lignin filtration experiments performed, in which two types of filter media were used, are presented in Table 6. The actual applied pressure was determined from the value recorded by the local pressure probes at the beginning of the experiment, see Section 9.1. The local filtration properties were determined during the filtration experiments at a given position in the filter cake, i.e. 12 mm form the filter media, see Section 9.2.2. A large range of local solid compressive pressure could be covered by combining the results obtained from the different filtration experiments performed at various constant applied piston pressures.
One of the filter media used was a regenerated cellulose membrane filter (Sartorius stedim, type 184, pore size 0.45 m) placed on a grade 5 Munktell paper filter support; the other was a cellulose nitrate filter (Sartorius stedim, type 113, pore size 0.45 m) placed on a grade 5 Munktell paper filter support, and is referred to as NC in Table 6.
Table 6. The slurry concentrations and corresponding applied piston pressures investigated. (NC) denotes the experiments in which a cellulose nitrate filter media was used.
Conc. of lignin slurry [vol%] Applied piston pressure [MPa] 6.7 0.2 0.5 0.6 9.2 0.34 0.85 1.17 1.7(NC) 2.78(NC)15.6 1.9 2.15 2.36 2.57 17 0.3(NC) 1.17 2.26
For each slurry concentration investigated, three liters of slurry were prepared using deionized water. The pH value was adjusted to 2.8 using sulphuric acid in order to avoid any dissolution of the lignin into the water due to deprotonation of its phenolic groups. The colour of the filtrates obtained after filtration was transparent, indicating that no substantial amount of lignin was dissolved in the water during the experiments, which were performed at room temperature (approx. 20 ).
The slurry was left under continuous stirring for a minimum of 12 hours before a series of filtration experiments was started. At too high stirring rate, a foam-like layer at the top of the lignin slurry was observed, so a moderate stirring rate was used in order to avoid gas bubbles forming in the suspension feed.
After filtration, the filter cakes were subjected to expression for about one hour at the applied filtration pressure. The filter cakes were finally collected, weighed and placed in an oven for a minimum of 24 hours. The dried filter cakes were also weighed: these weights were used to calculate the average filtration properties, see Section 9.2.1.
The filtration experiments were rapid, having a duration time of between 3 and 22 min. In comparison, the duration time of the filtration experiments with titanium dioxide was 2 to 15 hours using the same filter-press apparatus and similar applied pressures. The softwood LignoBoost lignin investigated is therefore considered to be an easy-to-filter material. The short filtration duration time meant, on the other hand, that the local filtration properties could not be evaluated at an applied pressure higher than 0.6 MPa for the lowest slurry

Experimental conditions and procedure
32
concentration: a minimum of one minute was required to determine the local filtration properties, see Section 9.2.2.
8.2 Titaniumdioxideexperiments
8.2.1 SedimentationThe sedimentation behaviour of titanium dioxide at varying levels of ionic strength was investigated. The ionic strength of the suspensions was regulated using sodium chloride. Mixed suspensions of 100 mL in volume, with a solid concentration of 10 vol%, were prepared in tube vessels using deionized water. A total amount of 30 such vessels were used into which sodium chloride was added in a concentration varying from 0 to 15 kg/m3. The samples were allowed to settle for a period of three months before the average sediment solidosity was determined by measuring the height of the sediment obtained.
8.2.2 FiltrationThe influence of ionic strength on the local filtration properties of titanium dioxide was investigated by considering slurries with three different ion concentrations, corresponding to no addition of sodium chloride and additions of sodium chloride of 2 and 10 kg NaCl/m3, respectively. The local filtration properties were calculated from the local measurements performed at 12 mm from the filter media. Three filtration experiments were performed for each ionic strength level corresponding to constant applied pressures of 0.7, 1.4 and 2.1 MPa, respectively. A large range of local solid compressive pressures was covered for each ionic strength level by combining the results obtained from the three applied pressure filtration experiments. In the case of the slurry without an addition of salt, a repeated filtration experiment was performed at the applied pressure of 2.1 MPa.
Four liters of slurry with a solid concentration of 10 vol % were prepared, using deionized water for each of the ionic strength levels investigated. The slurry was left under continuous stirring for a minimum of 12 hour before the series of filtration experiments began: these were performed at room temperature, i.e. 20 . The filter media consisted of a regenerated cellulose membrane (Sartorius stedim, type 184, nominal pore size 0.2 μm) placed on a grade 5 Munktell filter paper for support.
The filtration experiments were relatively slow, having a duration time of between 2 and 15 hours. After the filtration was terminated, the filter cake that had been formed was pressed at the applied filtration pressure during 4 to 12 hours until a uniform solid content was obtained throughout the cake, which was evaluated using -ray measurements. The filter cake was then weighed and dried at 105 before being weighed again. The latter weights were used to calculate the average filtration properties, see Section 9.2.1.

Evaluation of the experimental filtration data
33
9 Evaluationoftheexperimentalfiltrationdata
9.1 Hydrostaticpressureprofile
Hydrostatic pressure profiles are obtained from the local hydrostatic pressure that was measured continuously at the various capillary holes height during the filtration experiments. Large oscillations in the local pressures can be observed during the experiment if cracks are formed in the filter cake or air is trapped in the slurry and, subsequently, in the filter cake. Thus, data corresponding to “failed” experiments could be excluded from the study. Examples of the absolute hydrostatic pressure profiles obtained for a successful and a non-successful filtration experiment are presented in Figs. 8 and 9, respectively.
Figure 8. Absolute local hydrostatic pressure versus time at different heights from the filter medium, obtained for a successful experiment. The curves correspond to the height of the holes of the capillary tubes. The piston pressure applied was 5 bar.
Figure 9. Absolute local hydrostatic pressure versus time at different heights from the filter medium, obtained for a non-successful experiment. The curves correspond to the height of the holes of the capillary tubes. The piston pressure applied was 1 bar.
All the local hydrostatic pressures measured at the beginning of a filtration experiment are equal to the absolute applied pressure, i.e. the applied piston pressure in addition to the atmospheric pressure, because no solid filter cake has been formed yet. The applied piston pressures presented in Table 6 were therefore deduced from the initial absolute hydrostatic pressure that was measured. Friction between the liquid and the solid during filtration causes a decrease in the local hydrostatic pressure at a given position in the filter cake, see Section 4.1. The pressure decreases observed in the pressure profile start when the filter cake being formed reaches the capillary holes. Expression starts when there is no more slurry above the filter cake and the piston reaches the surface of the cake.

Evaluation of the experimental filtration data
34
9.2 Determinationofthefiltrationproperties
9.2.1 Averageproperties
‐ Average solidosity
The average solidosity was calculated using Eq. 1. After an extended time of expression, the wet cake was weighed before being put in an oven (105 ) for a minimum of 24 hours. The resulting dry cake was weighed; based on these weights, the volumes of the solid and liquid in Eq. 1 were then determined using the known densities of both. In the case of LignoBoost lignin, the average cake solidosity was also determined at the end of the cake build-up phase, before expression. The position of the piston recorded at the end of the cake build-up phase was used to determine the total volume of the cake before expression. The piston position recorded at the end of expression together with the average solidosity value calculated after expression was used to determine the volume of solids at the end of the cake build-up phase.
‐ Average filtration resistance
The average filtration resistance was calculated using the classical filtration theory equation, Eq. 12 and the measured experimental data. was assumed to be constant and taken as the ratio of the weighed dry solid mass of filter cake over the total filtrate volume collected
during the filtration experiment. Plotting against resulted in a straight line for all of the
filtration experiments, so the assumptions made in order to apply the classical filtration theory equation were therefore considered valid.
9.2.2 Localproperties
‐ Local solidosity
The local solidosity was determined from the -attenuation measurements, which were evaluated using the Beer-Lambert law of absorption, Eq. 31.
,, , . ↔
,,
, ,
Eq.31
where is the recorded number of counts, , the number of counts obtained for the empty filter cell, , and , the attenuation coefficients of the liquid and solid phases, respectively, and the average path of the -radiation taken as the inner diameter of the filter cell.
The attenuation coefficient of water was obtained using the -attenuation measurements performed on a filtration cell filled with deionized water, which gave , = 19.6 m-1.The attenuation coefficient of lignin was determined in a similar way, using a filtration cell filled with pure lignin after an extended time of expression, with a value of , = 24.6 m-1 being obtained. The attenuation coefficients of lignin and water are relatively close to each other. Therefore, the time resolution of the measurements is relatively low and rather long measuring times are needed for very accurate results. The filtration rate, on the other hand, was rather high and thus limited the measuring time so, as a compromise, a time interval of 60 s was chosen. Considering that the radiation intensity describes a Poisson distribution, a 95 % confidence interval of ± 0.04 for the solidosity absolute value was found. The method for

Evaluation of the experimental filtration data
35
calculating a Poisson distribution confidence interval can be found in the literature (Nelson, 1970). The attenuation coefficient of titanium dioxide was determined by calibrating the -attenuation measurements performed on filter cakes after expression, using the average solidosity of each consolidated cake that was determined from its weight, see Section 9.2.1. An attenuation coefficient of , = 189 m-1 was obtained, with a relative deviation between the solidosity values of 1.5 %. Furthermore, the 95 % confidence interval determined for the solidosity values of titanium dioxide was found to be ± 0.006 in absolute value.
‐ Local filtration resistance
Eq. 8 was used to determine the local filtration resistance. The solid velocity was neglected compared to the liquid velocity in the flow direction for the differential element of the filter cake investigated in the local study, because the materials investigated formed weakly compressible filter cakes. Since the local solidosity was obtained at a height of 12 mm from
the filter media, was estimated from the difference between the local liquid pressures
measured at the two highest capillary tubes hole heights, i.e. 12 and 9 mm.
The superficial flow velocity, , was considered to be constant through the whole filter cake and equal to the superficial filtrate velocity, since the materials investigated formed weakly compressible filter cakes. For the relatively fast LignoBoost lignin filtration experiments, was calculated using the filtrate mass recorded continuously during the experiments and the known filter cell area. Droplet discretization was neglected: a single water droplet weighs around 0.03 g while the inherent measurement error of the scales is 0.5 g. In the titanium dioxide experiments, which sometimes lasted for 15 hours, evaporation of the collected filtrate from the vessel placed on the mass balance (Fig. 13) could not, however, be neglected. An evaporation rate of about 2 g per hour can be estimated from the filtrate mass recorded after expression was completed whilst the total mass of filtrate collected was about 330 g. The flow velocity during the titanium dioxide experiments was therefore determined from the position of the piston which was recorded continuously.
9.3 Fittingofthelocalfiltrationdata
The local filtration properties and local pressure data obtained during the LignoBoost lignin and titanium dioxide filtration experiments were fitted simultaneously to the empirical constitutive relationships, Eqs. 16 and 17, in order to evaluate the pressure dependency of the filter cakes formed. Matlab was the software used for the mathematical regression and the optimization routine was “fmincon”. The fitting parameters , , , and were determined in such a way that the local filtration resistance and the local solidosity made a similar contribution to the residual. For titanium dioxide, the parameter , which can be interpreted as the cake solidosity at no solid compressive pressure, was directly approximated to the average sediment solidosity measured during the sedimentation experiments, see Section 8.2.1. This is reasonable because the solid pressure within the sediment is very small.
In the case of titanium dioxide, local filtration data was used to evaluate the performance of the three filtration models described in Section 4.4, i.e. the Kozeny-Carman equation, Happel’s cell model and the cell model with a porous sphere core. “fmincon” was used as the optimization routine. The fitting parameter for the Kozany-Carman equation (Eq. 22) was the particle diameter, whereas the parameter estimated for Happel’s cell model (Eq. 25) and the cell model with a porous core (Eq. 30) was an inner solid sphere of diameter 2 . In the case

Evaluation of the experimental filtration data
36
of the cell model with a porous core, the permeability of the inner sphere was estimated using Happel’s cell model, Eq. 23. The inner sphere was also assumed to have a solidosity corresponding to a rhombohedral close-packing configuration, i.e. 0.74, and to be built up of spherical solid particles, the diameters of which correspond to the B.E.T. measurements of the titanium dioxide used.
9.4 Comparisonbetweenaverageandlocalmeasurements
A comparison between the average and local experimental measurements could also be made by comparing the average filtration resistance obtained experimentally using Eq. 12 to the average filtration resistance calculated using Eq. 18, based on the parameters obtained from the fitting of the local data. The pressure drop over the filter cake in Eq. 18 was approximated to the applied filtration pressure since the resistance of the filter media evaluated using Eq. 12 was negligible compared to the resistance of the filter cake. In the case of LignoBoost lignin, the average solidosity determined experimentally after the cake build-up phase (see Section 9.2.1) was also compared to the average solidosity calculated using Eq. 19, based on the parameters obtained from the fitting of the local data.

Results and discussion
37
10 Resultsanddiscussion
The results obtained from the two studies on which this thesis is based are summarized in this chapter. The first section discusses the characterization results obtained. The second and third sections respectively present and discuss the experimental data and modelling results determined from the LignoBoost lignin filtration experiments (Paper I) and titanium dioxide sedimentation and filtration experiments (Paper II).
10.1 Characterization
10.1.1 LignoBoostlignin(PaperI)It can be observed in the micrograph images of moist lignin obtained using ESEM that the lignin agglomerates are built up of small, non-spherical, particles about 2 µm in size, Fig. 10c. Furthermore, it can also be seen that the size of these agglomerates varies from about 8 µm to several hundred µm, Figs. 10a and 10b.
Figure 10a (up-left), b (up-right) and c (down). ESEM micrographs of moist lignin powder at three different magnifications.
The results obtained from laser diffraction, B.E.T, solid density and dry content measurements performed on the LignoBoost lignin investigated are shown in Table 7. The particle size distribution determined by laser diffraction is also presented in Fig. 11. The lignin suspension used for the laser diffraction measurements was highly diluted; sulphuric acid was used to adjust the pH value to 2.8 to avoid any dissolution of lignin into the water by deprotonation of its phenolic groups.

Results and discussion
38
Table 7. Lignin properties and particle sizes determined by laser diffraction. D(x) indicates that x % of the particles by volume are smaller than the value stated.
Laser diffraction measurements
B.E.T. specific surface area [m2/g] Dry content
[w%] Solid density
[kg/m3] D(10) [µm]
D(50) [µm]
D(90) [µm]
Air-dried lignin
Freeze-dried lignin
2.5 8.9 43.9 15.4 33.4 61.6 1346
Figure 11: Size distribution of the lignin particles/agglomerates based on volume.
The results of the laser diffraction measurements presented in Table 7 show that 80 % of the lignin particles/agglomerates, based on total volume, measure between 2.5 and 43.9 µm in diameter, with a volume-based average of about 9 µm. These results are in accordance with the sizes of the particles and agglomerates observed in the micrographs image of moist lignin taken using ESEM. Single particles of about 2 µm were notably observed in the pictures, which corresponds well to the smallest particle size range determined by laser diffraction, i.e. D(10) = 2.5 µm ,Table 7.
The B.E.T. surface area of the air-dried and freeze-dried samples of lignin powder was measured; the results obtained were 15.4 m2/g and 33.4 m2/g, respectively. Assuming perfectly smooth and spherical particles, these surface areas correspond to particle diameters of 0.28 µm and 0.13 µm, respectively. These are considerably smaller than the diameters measured and observed by laser diffraction and ESEM, which were of about 2 µm for the single lignin particles. The underestimation of the size of the particles based on the B.E.T. surface area is a consequence of the irregularities in shape of the real lignin particles together with the porosity of the actual particles and agglomerates. Compared to perfectly solid and spherical particles, the increase in the surface area measured due to these deviations leads to an underestimation of the size of the actual particles.
The specific surface area obtained for the freeze-dried lignin was twice as large as the area obtained for air-dried lignin. These results can also be related to the porosity of the lignin particles and agglomerates, as illustrated in Fig. 12. The structure of an organic porous agglomerate tends to collapse when it is air-dried because the water capillary forces between the solid particles that compose the agglomerate increase whilst the water trapped inside is evaporating. However, this behaviour does not occur if the agglomerate is freeze-dried: the

Results and discussion
39
water trapped between the particles increases slightly in volume while freezing before being sublimated. Thereby, in addition to the fact that the internal particles and agglomerate pores do not collapse, a possible scenario is that single particles move apart, which also leads to an increase in specific surface area, Fig. 12.
Figure 12. The influence of two drying techniques on a porous agglomerate structure.
10.1.2 Titaniumdioxide(PaperII)
10.1.2.1 ParticlepropertiesThe single particles in the micrograph images of dry titanium dioxide powder taken using ESEM, Figs. 13a and 13b, appear to be smaller than 0.5 µm and the agglomerates are in the size range of 2 - 20 µm.
The results of the measurements of laser diffraction, B.E.T., solid density and ζ-potential performed on the titanium dioxide samples are shown in Table 8. The particle size distribution determined by laser diffraction is presented in Fig. 14.
Figures 13a (left) and b (right). ESEM micrographs of dried titanium dioxide powder at two different magnifications.

Results and discussion
40
Table 8. Properties and particle sizes of the titanium dioxide samples determined by laser diffraction. D(x) indicates that x % of the particles by volume are smaller than the value stated.
Laser diffraction measurements
B.E.T. specific surface area [m2/g]
(Air-dried sample)
Solid density [kg/m3]
(Air-dried sample)
ζ-potential [mV]
(TiO2 in deionised water) D(10) [µm]
D(50) [µm]
D(90) [µm]
0.28 0.63 10.9 9.8 3810 -22 ± 2
Figure 14. Size distribution of the titanium dioxide particles/agglomerates based on volume.
The results of the laser diffraction measurements presented in Fig. 14 show two separate size ranges for the titanium dioxide particles/agglomerates, with a first dominant peak at about 0.6 µm and a second peak at about 11 µm. Furthermore, as presented in Table 8, 80 % of the particles/agglomerates based on total volume measure between 0.28 and 10.9 µm in diameter, with a volume-based average diameter of about 0.63 µm. These results are in good accordance with the sizes observed in the micrograph images taken using ESEM.
The particle diameter corresponding to the B.E.T. specific surface area obtained for the air-dried titanium dioxide (i.e. 9.8 m2/g) is 0.16 µm, assuming perfectly smooth and spherical particles. The substantial underestimation of the B.E.T. particle diameter compared to what was obtained and observed by laser diffraction and ESEM is a consequence of both the porosity and the irregularities in shape of the real titanium dioxide particles, which differ from perfectly smooth solid spheres.
10.1.2.2 Influenceofsaltadditiononthesizeoftheparticles/agglomeratesThe influence of salt addition on the size distribution of TiO2 particles and agglomerates was investigated using two different methods: FBRM and laser diffraction measurements. The suspensions investigated had a significantly different concentration of solids depending on the method used: the solution subjected to FBRM had a solid concentration of 1% by volume whereas a highly diluted suspension was used for laser diffraction measurements. Neither of these methods could be used with the slurry concentration used in the filtration experiments, i.e. 10 vol%, due to a light saturation of the equipment when the solid concentration was too high. Saturation occurs at a solid concentration higher than 2 % by volume for the FBRM, while only highly diluted suspensions can be subjected to laser diffraction if errors due to multiple scattering are to be avoided.

Results and discussion
41
The chord length distribution of the particles/agglomerates obtained by FBRM for different amounts of salt additions is presented in Fig. 15.
Figure 15. Chord length distribution measured using FBRM for suspension of varying ionic strengths.
An increase in the size distribution of the titanium dioxide particles/agglomerates can be observed after the addition of salt, Fig 15. This shows that an extensive agglomeration occurs in suspensions with higher ionic strengths, i.e. when the electrical repulsive forces between the solid particles are sufficiently reduced due to the particle surface charge being shielded by the added electrolytes. No difference in the distribution of the chord length was observed between the unsalted suspension and the 1 kg NaCl/m3 suspension. An extensive agglomeration was observed, however, at an electrolyte concentration of 2 kg NaCl/m3. It is therefore most likely that a shift towards the attractive forces having a greater influence than the repulsive forces takes place between 1 and 2 kg NaCl/m3.
The size distribution of particles/agglomerates measured by laser diffraction of a highly diluted titanium dioxide suspension at varying ionic strengths is presented in Fig. 16 and Table 9.
Figure 16. Volume-based particle size distribution obtained with laser diffraction for different amounts of salt added.

Results and discussion
42
The laser diffraction measurements also show a clear increase in the size of the particles/agglomerates after sodium chloride additions of 2 kg/m3 and 10 kg/m3. Furthermore, while the size distribution of the suspension with no salt addition shows two separate size ranges, a shift towards a single, large size range peak can be observed after the addition of salt. This result describes clearly the extensive particle agglomeration that occurs at a higher ionic strength: the small particles/agglomerates measuring about 0.63 µm in diameter gather to form agglomerates with an average diameter of about 6.4 µm, Table 9.
Two main differences appear when the results obtained from the two methods used are compared. Firstly, the ranges in the particle size detected by laser diffraction are significantly smaller, especially for the no salt addition level. This can be explained partly by the fact that the FBRM device does not detect sizes smaller than 1 µm. Furthermore, the suspension measured by FBRM has a much higher solid concentration, which is supposed to promote the formation of bigger and looser agglomerates that would not be stable under highly diluted conditions. Secondly, the size distributions of the particles/agglomerates obtained for the salt addition levels of 2 kg/m3 and 10 kg/m3 are very similar when laser diffraction is used, whilst a clear difference between the two profiles can be seen with FBRM. It is possible that this result also indicates the existence of bigger and looser agglomerates that would only form in suspensions with a sufficiently high concentration of solids, and would therefore only be detected by FBRM measurements.
10.2 LignoBoostligninfiltrationexperiments(PaperI)
10.2.1 Localfiltrationproperties
‐ Influences of the slurry concentration and pressure
The local filtration properties obtained during the LignoBoost lignin filtration experiments are shown as a function of the local solid compressive pressure in Figs. 17 and 18 for the different slurry concentrations investigated. The local data is all based on measurements made at a height of 12 mm from the filter media. The results of the empirical constitutive relationships fitted to the local data are also shown as solid lines in Figs. 17 and 18. The fitted parameters obtained are given in Table 10.
Table 9. Particle sizes of the titanium dioxide suspension obtained at varying ionic strengths using laser diffraction. D(x) indicates that x % of the particles by volume are smaller than the value stated. NaCl addition [kg/m3] D(10) [µm] D(50) [µm] D(90) [µm]
0 0.28 0.63 10.9 2 2.55 6.49 13.7 10 3.17 6.32 12.4

Results and discussion
43
Figure 17. Local filtration resistance as a function of the local solid pressure for the different concentrations of lignin slurry investigated. The solid line represents the local filtration resistance calculated by fitting Eq. 16 to experimental local data.
Figure 18. Local solidosity as a function of the local solid pressure for the different concentrations of lignin slurry investigated. The solid line represents the local solidosity calculated by fitting Eq. 17 to experimental local data.
In Figs. 17 and 18 it can be seen that same local filtration properties are obtained at same solid compressive pressures, regardless of the concentration of the slurry. This shows that the slurry concentration does not influence the local filtration properties of the lignin filter cakes in the range investigated. Furthermore, by comparing the obtained parameters in Table 10 to the classification shown in Table 5, it can be concluded that the LignoBoost lignin investigated in this study forms weakly compressible filter cakes.
Table 10. Parameters obtained by fitting the semi-empirical relationships Eqs. 11 and 12 to the experimental local data.
[m/kg] [Pa] [-] [-] [-] 1.10 5210 0.281 0.315 0.074
‐ Filter media
No influence of the filter media was observed when the filtration results obtained using the two types of filter media, i.e. a regenerated cellulose membrane filter and a cellulose nitrate filter (Figs. 19 and 20), were compared. The interaction between the lignin and the filter media used are therefore small or/and similar.

Results and discussion
44
Figures 19 (left) and 20 (right). Local filtration resistance and local solidosity versus solid compressive pressure obtained using a regenerated cellulose membrane and a nitrate cellulose membrane, for slurries with lignin concentrations of 9.2 vol% and 17 vol% and at solid pressures between 0.03 and 1 MPa.
10.2.2 AveragefiltrationpropertiesIn Fig. 21, the average filtration resistance calculated using the classical filtration theory (Eq. 12) is plotted versus the applied filtration pressure for the different slurry concentrations investigated. The average filtration resistance, determined by Eq. 18 using the local data fitted parameters reported in Table 10, is also presented in the figure as a solid line. In Fig. 22, the average solidosity of the filter cakes determined at the end of cake build-up is plotted versus the applied filtration pressure for the different slurry concentrations investigated. No significant variation in average solidosity was obtained after one hour of expression (the relative difference was less than 2%). The average cake solidosity, determined by Eq. 19 using the local data fitted parameters reported in Table 10, is also presented in Fig. 22 as a solid line.

Results and discussion
45
Figure 21. Average filtration resistance versus filtration pressure obtained for different slurry concentrations. The solid line represents the average filtration resistance calculated using Eq. 18.
Figure 22. Average cake solidosity at the end of cake build-up phase versus filtration pressure obtained for different slurry concentrations. The solid line represents the average solidosity calculated using Eq. 19
It was observed that the slurry concentration did not influence either the average filtration resistance or the average solidosity of the filter cake. The height of the filter cake, which depends on the initial concentration of the slurry, does not therefore influence the structure of the filter cake formed within the range investigated. The cakes measured between 23 to 62 mm in height, which corresponds to the range of cake heights obtained on an industrial scale. This indicates that a relatively high concentration of solids can be used safely in industrial applications. Furthermore, the average filtration resistance values obtained experimentally were between 2 and 6.10-11 m/kg, showing that the LignoBoost lignin investigated is relatively easy to filter in the pressure range in question. Consequently, relatively high filtration pressures can be used industrially, and a relatively small filter area can be used.
The average filtration properties calculated by Eqs. 18 and 19 using the local data fitted parameters reported in Table 10 were in good agreement with the experimental average data. This shows a good accordance between the local and average measurements performed. It also shows that the average measurements can be used to estimate the filtration resistance of the weakly compressible cakes that are obtained using the investigated LignoBoost lignin, with a fairly high degree of accuracy.

Results and discussion
46
10.3 Titaniumdioxideexperiments(PaperII)
10.3.1 InfluenceofionicstrengthontitaniumdioxidesedimentationThe average sediment solidosity obtained for solid suspensions with varying concentrations of salt can be seen in Fig. 23.
Figure 23. Average sediment solidosity at varying ionic strengths.
A clear decrease in the average sediment solidosity can be observed as the ionic strength of the suspension increases. The more porous structure obtained after the addition of salt is the result of the extensive agglomeration which takes place when decreasing the repulsive interactions between the solid particles, see Section 10.1.2.2. The major decrease in solidosity occurs between sodium chloride additions of 1 and 2 kg /m3. This corresponds well with the shift in particle size between the same salt concentrations that was observed using FBRM, see Section 10.1.2.2. The influence of the ionic strength on the average sediment solidosity was shown to level out from a sodium chloride concentration of 2 kg/m3: only a very small change was observed for further additions of salt. An electrolyte concentration of 2 kg/m3 can therefore be considered sufficient to shield the surface charge of the titanium dioxide particles efficiently. A clear, if small, decrease in sediment solidosity can nevertheless be noted between concentrations of 2 and 10 kg/m3, which concurs with the FBRM measurements, where a small increase in chords lengths distribution could also be seen between these two salt additions.
10.3.2 Influenceofionicstrengthontitaniumdioxidefiltration
10.3.2.1 LocalfiltrationpropertiesThe local filtration resistance and the local solidosity of titanium dioxide filter cakes obtained for slurries with different initial concentrations of salt are presented in Figs. 24 and 25, respectively. The local data is all based on measurements made at 12 mm from the filter media. The results of fitting the empirical relationships to the local data are also shown as solid and dotted lines in these figures. The corresponding fitted parameters are presented in Table 11.

Results and discussion
47
Figure 24. Local specific filtration resistance as a function of the local solid pressure at varying ionic strengths. The solid and dotted lines represent the local filtration resistance calculated from the empirical relationship in Eq. 16.
Figure 25. Local filter cake solidosity as a function of the local solid pressure at varying ionic strengths. The solid and dotted lines represent the local solidosity calculated from the empirical relationship in Eq 17.
The local filtration resistance and the local solidosity are seen to decrease significantly after additions of 2 and 10 kg/m3 of sodium chloride. These results concur with the extensive agglomeration observed with increased ionic strength, which leads to a more porous cake structure, and is in agreement with the observations made in the sedimentation experiments, see Section 10.3.1. No significant difference in the filtration properties was observed between the two salt additions either. This is also in agreement with the results obtained during the sedimentation and laser diffraction experiments.
Only a weak pressure dependency of the filter cake can be observed at no salt addition, when particle agglomeration is hindered by the electrostatic repulsive forces. The more porous cake structure obtained at higher ionic strengths, on the other hand, appears to be more compressible. Also, a significantly higher pressure dependency was observed in the early stage of the filtration process after the addition of salt. This is possibly the result of the breaking up of the structure that was formed by the larger and looser agglomerates observed in the FBRM measurements, see Section 10.1.2.2.
Although the empirical relationships investigated could successfully describe the local filtration resistance, the local solidosity, however, could not be accurately described over the entire pressure range investigated. The steep increase in solidosity obtained after the addition of salt at low solid pressures could not be fitted without overestimating the solidosity at higher solid pressures. Therefore, Eq. 17 cannot fully describe the local solidosity of such systems. The values of the fitted parameters obtained (shown in Table 11) describe a relatively weak pressure dependency of all the systems investigated according to the material classification presented in Table 5.

Results and discussion
48
10.3.2.2 AveragefiltrationresistanceThe average filtration resistance obtained for the different applied filtration pressures and estimated using the classical filtration theory, Eq. 12, is presented in Fig. 26. The average filtration resistance calculated from Eq. 18, using the local data fitted parameters presented in Table 11, is also shown as solid and dotted lines in the figure.
Figure 26. Average specific filtration resistances calculated using Eq. 12. The solid and dotted lines represent the average filtration resistances calculated using Eq. 18.
The average filtration data obtained experimentally was in good accordance with the average values calculated from the local data fitted parameters obtained. There is therefore a good agreement between the local and average experimental measurements. It also shows that the average measurements can be used to estimate the filtration resistance of the weakly compressible titanium dioxide filter cakes formed at the varying additions of sodium chloride investigated, with a fairly high degree of accuracy.
10.3.3 FittingofthefiltrationmodelsThe Kozeny-Carman equation, Happel’s cell model and the porous sphere model were fitted to the local data obtained in order to evaluate their ability to describe the relationship between the local solidosity and the local filtration resistance of the filter cake. The results obtained from the fitting of the three models, using the local data obtained with the 10 kg NaCl/m3 slurry, are shown in Fig. 27. The result of the fitting of the porous sphere model at varying
Table 11. Parameters obtained by fitting the constitutive relationships Eqs. 16 and 17 to the experimental local filtration data. NaCl addition
[kg/m3] ∙ 10
[m/kg] [Pa] [-] *[-] [-]
0 66.87 0.01 0.022 0.35 0.020 2 2.069 15.50 0.272 0.16 0.099
10 1.765 20.35 0.291 0.14 0.114 * values measured in the sedimentation experiments

Results and discussion
49
ionic strength of the initial slurry is presented in Fig. 28. The fitted parameters obtained using the three models, obtained for the three ionic strengths of the initial slurry studied, are shown in Table 12.
Figure 27. Performance of the three filtration models fitted to experimental data obtained at a sodium chloride addition of 10 kg/m3.
Figure 28. Fitting of the cell model with a porous sphere core to the local filtration properties obtained at the three ionic strength investigated.
Table 12. Particle diameters obtained by fitting the filtration models to the local filtration properties of anatase for sodium chloride additions of 0, 2 and 10 kg/m3.
All three filtration models could successfully describe the relationship between the local solidosity and the local filtration resistance that were determined experimentally. The fitted theoretical particle diameters obtained from the three models were, in general, significantly lower than those determined by laser diffraction and observed in the ESEM pictures. However, the sizes of the particle diameters obtained from the model fittings were in the range of those calculated from the BET measurement, i.e. 0.15 µm. Fitting the porous sphere model to the local data of the slurry with no salt addition gave a theoretical particle diameter in good agreement with the smallest particles size range detected by laser diffraction, i.e. approx. 0.28 µm. An increase in the value of the fitted theoretical particle diameter was, on the other hand, observed after the addition of salt. The extensive agglomeration that occurs at higher ionic strength leads therefore to an increase of the effective particle size that affects the flow resistance. The effective particle sizes obtained from these models do not, however, describe the complete actual formation of agglomerates.
d0 kg NaCl/m3 [µm] d2 kg NaCl/m3 [µm] d10 kg NaCl/m3 [µm] Kozeny-Carman 0.135 0.185 0.186
Happel´s cell model 0.134 0.187 0.189 Porous sphere model 0.269 0.355 0.353

Results and discussion
50

Conclusions
51
11 Conclusions
The main conclusions drawn from Papers I and II are presented below.
Paper I
The LignoBoost lignin investigated was shown to be an easy-to-filter material, forming weakly compressible filter cakes over the filtration pressure range studied of 0.2 to 2.8 MPa.
It was observed that the slurry concentration did not influence the cake filtration properties. Consequently, the height of the filter cake was found to have no influence on the resulting solid structure. The filter cakes measured between 23 and 62 mm in height, which is in the size range of cake heights obtained on an industrial scale.
Semi-empirical relationships (Tiller and Leu, 1980) describing the influence of the local solid pressure on the local cake filtration properties could successfully be fitted to the local filtration data obtained.
The two filter media used, i.e. regenerated cellulose and nitrate cellulose membranes, gave similar results, showing a weak and/or similar interaction with lignin.
Paper II
A more porous titanium dioxide sediment structure was obtained at higher ionic strengths after the addition of sodium chloride. This could be explained by the surface charge of the particles being shielded when the amount of electrolytes in the suspension is increased. The electrostatic repulsive forces between the solid particles decrease, which leads to an extensive particles agglomeration and thus a more porous solid structure.
The local filtration properties of titanium dioxide were also influenced by the ionic strength of the suspension. A lower local filtration resistance and local solidosity were obtained at higher ionic strengths. This, too, is the result of the extensive agglomeration that occurs after salt addition.
Titanium dioxide formed weakly compressible filter cakes, with an increasing compressibility at higher ionic strengths: the more porous cake structures formed by the larger agglomerates were also found to be more deformable.
After the addition of salt, a significantly higher compressibility in the system was observed at the lower pressure range. It is possible that this result describes the breaking up of an initial agglomerate solid structure formed by larger and looser agglomerates.
Empirical relationships (Tiller and Leu, 1980) could successfully be fitted to the local specific filtration resistance obtained experimentally at varying local solid compressive pressures. However, the equations could not describe the local solidosity obtained after salt additions over the entire range of solid pressures investigated. This is due to the significantly higher compressibility of the system observed at low pressure and increased ionic strength.
The three filtration models studied, i.e. the Kozeny-Carman equation, the Happel’s cell model and the cell model with a porous sphere core, could successfully describe the relationship between the local solidosity and the local specific filtration resistance of the filter cakes obtained experimentally.

Conclusions
52

Proposals for future work
53
12 Proposalsforfuturework
Lignin is extracted from black liquor during the LignoBoost process. The black liquor may have a relatively high content of ions, e.g. sodium and potassium. Investigating the influence of ionic strength on the filtration of LignoBoost lignin might therefore be of interest.
A softwood LignoBoost lignin was investigated in this work. As composition of the original wood may affect the filterability of LignoBoost lignin, it is suggested to undertake studies of how the type of wood (softwood vs hardwood) and the hemicelluloses content, such as e.g. Xylan influence the filtration process efficiency.

Proposals for future work
54

Acknowledgments
55
13 Acknowledgments
Chalmers Energy Initiative and the research institute Innventia are gratefully acknowledged for the financial support received and the supply of the LignoBoost lignin raw material, respectively.
I would like to thank:
My main supervisor and examiner, Prof. Hans Theliander, for providing me with the opportunity of working within this interesting field of research. I am grateful for the support, rewarding guidance and discussions we had throughout the duration of this work.
My co-supervisor, Dr. Tuve Mattsson, for his commitment, continuous encouragement and productive guidance.
My co-author, Mr. Jonas Wetterling, for the valuable contribution he made. Mr. Tommy Friberg and Ms. Lena Fogelquist for their skillful advices with some of
the experimental work and for ordering the experimental resources required. Ms. Susanne Bylin, Ms. Anna Palme and Ms. Kerstin Jedvert for their explanations
regarding the use of the FBRM, BET and ESEM equipments, respectively. Ms. Eva Kristenson and Ms. Målin Larsson for their prompt help with administrative
tasks. Ms. Maureen Sondell for her efficiency regarding the linguistic review of the articles
and the thesis. All my colleagues and friends (past and present) at Chalmers, for creating a friendly
and interesting working environment. All my friends and family in France, Euskal Herria (Bask country), Sweden or
elsewhere: je vous aime!

Acknowledgments
56

Nomenclature
57
14 Nomenclature
filtration area [m2]
parameter [m/(kg Pan)]
radius of the inner cell sphere [m]
cell radius [m]
mass of solids per unit of filtrate volume [kg/m3]
average path of the -radiation [m]
liquid drag force on solid particles [N]
parameter [Pa-β]
permeability [m2]
permeability of the inner sphere [m2]
height of the filter cake formed [m]
parameter [-]
parameter [Pa]
pressure drop over the filter cake [Pa]
local liquid pressure [Pa]
pressure drop over the filter media [Pa]
applied piston pressure [Pa]
local solid pressure [Pa]
parameter [Pa]
Δ pressure drop over the filter cell [Pa]
resistance of the filter medium [m-1]
specific surface area [m-1]
time [s]
volume of filtrate [m3]
volume of solid in the cake [m3]
total volume of the cake [m3]

Nomenclature
58
superficial liquid velocity [m/s]
superficial solid velocity [m/s]
distance from the filter medium [m]
Greek letters
local specific filtration resistance [m/kg]
parameter [m/kg]
average specific filtration resistance [m/kg]
parameter [m/kg]
parameter [-]
local porosity of the filter cake [-]
number of counts [-]
, number of counts for the empty filter cell [-]
viscosity of the fluid [Pa·s]
, attenuation coefficient of lignin [m-1]
, attenuation coefficient for the liquid phase [m-1]
, attenuation coefficient for the solid phase [m-1]
, attenuation coefficient of titanium dioxide [m-1]
, attenuation coefficient of water [m-1]
solid density [kg/m3]
∅ average solidosity [-]
local solidosity [-]
parameter [-]
solidosity of the inner sphere [-]
parameter [-]

References
59
15 References
Bai, R. and Tien, C. (2005). Further work on cake filtration analysis. Chemical Engineering Science, 60, 301-313.
Bergström, L. (1992). Sedimentation of Flocculated Alumina Suspensions: g-Ray Measurements and Comparison with Model Predictions. Journal of the Chemical Society, Faraday Transactions, 88, 3201-3211.
Bertin, E. P. (1975). Principles and Practice of X-ray Spectrometric Analysis. Plenum Press, New York, USA.
Brunow, G. (2001). Methods to Reveal the Structure of Lignin. In: Biopolymers. Volume 1. Lignin, Humic Substances and Coal, (Eds.) Hofrichter, M. and Steinbüchel, Vol. 1, Wiley-VCH Verlag GmbH, 106.
Celzard, A., Fierro, V., Amaral-Labat, G., Pizzi, A., Fredon, E. and Mareche, J-F. (2008). Carbon materials derived from lignin. Nordic Wood Biorefinery Conference (NWBC), Proceedings, March 11-13, Stockholm, Sweden.
Chase, G.G. and Willis, M.S. (1992). Compressive cake filtration. Chemical Engineering Science, 47, 1373-1381.
Cherubini, F. and Strømman, A.H. (2011). Principles of Biorefining. Biofuels, Academic Press. Amsterdam, 3-24.
Darcy, H. P. G. (1856). Les Fontaines Publiques de la Ville de Dijon. Victor Dalamont, Paris, France.
Deo, S. (2009). Stokes Flow Past a Swarm of Deformed Porous Spheroidal Particles with Happel Boundary Condition. Journal of Porous Media, 12, 4, 347-359.
Fathi-Najafi, M. and Theliander, H. (1995). Determination of local filtration properties at constant pressure filtration. Sep. Tech., 5,165-178.
Fu, L.F. and Dempsey, B.A. (1998) . Modeling the effect of particle size and charge on the structure of the filter cake in ultrafiltration. Journal of Membrane Science, 149, 221-240.
Gosselink, R.J.A. (2011). Lignin as a renewable aromatic resource for the chemical industry. Ph.D. thesis (Online), 20-25. Wageningen University, The Netherlands.
Grace, H. P. (1953). The resistance and compressibility of filter cakes. Chemical Engineering Progress, 49 (6), 303-318.
Happel, J. (1958). Viscous Flow in Multiparticle Systems: Slow Motion of Fluids Relative to Beds of Spherical Particles. AIChE Journal, 4, 2, 197-201.
Henriksson, G. (2008). The Ljungberg Textbook. Wood Chemistry, Gellerstedt G. (Ed.). Lignin (6), 2.
Henriksson, G. (2009). Lignin. In: Ek, M., Gellerstedt, G. and Henriksson, G. (Eds.). Pulp and paper chemistry and technology. Volume 1, Wood chemistry and wood biotechnology. Walter de Gruyter, Berlin, Germany.

References
60
Henriksson, G., Li, G., Zhang, L. and Lindström, M.E. (2010). Lignin Utilization. In: Thermochemical Conversion of Biomass to Liquid Fuels and Chemicals, Ed. M. Crocker, Royal Society of Chemistry, 223-262.
Hermia, J. (1988). Consideration upon the use of constant pressure cake filtration law. Particle Technology in Relation to Filtration Separation. Antwerp, Belgium, 1-9.
Higson, A. (2011). Lignin. Factsheet: Overview of the current and potential market for lignin based materials. www.nnfcc.co.uk
Holladay, J.E., Bozell, J.J., White, J.F. and Johnson, D. (2007). Top value added chemicals from biomass. Volume II – results of screening for potential candidates from biorefinery lignin. Pacific Northwest National Laboratory and the National Renewable Energy Laboratory. Prepared for the US Department of Energy under contract number DE-ACOS-76RL01830.
Hutto, F. B. (1957). Distribution of porosity in filter cakes. Chemical Engineering Progress, 53, 328-32.
Johansson, C. and Theliander, H. (2003). Measuring concentration and pressure profiles in dead-end filtration. Filtration, 3, 114-120.
Johansson, C. (2005). Pressure and solidosity profiles in cake filtration. An experimental study of filtration properties of lignin from bioethanol production and model materials. Ph.D. thesis, 35. Chalmers University of Technology, Gothenborg, Sweden.
Kadla, J.F., Kubo, S., Venditti, R.A, Gilbert, R.D., Compere, A.L. and Griffith, W. (2002). Lignin-based carbon fibers for composite fiber applications. Carbon, 40 (15), 2913-2920.
King, C. J. (1980). Separation Processes. Mc-Graw-Hill, New-York, USA. 2nd edition.
Kozeny, J. (1927). Über Kapillare Leitung des Wassers im Boden. Sitzungsberichte der Akademia der Wissenschaften in Wien, Mathematisch-Naturwissenschaftliche, 136, IIa, 271-306.
La Heij, E.J., Kerkhof, P.J.A.M., Kopinga, K. and Pel, L. (1996). Determining porosity profiles during filtration and expression of sewage sludge by NMR imaging. AIChE Journal, 42, 953-959.
Larue, O., Vorobiev, E., Vu, C. and Durand, B. (2003). Electrocoagulation and coagulation by iron of latex particles in aqueous suspensions. Separation and Purification Technology, 31, 177-192.
Leu, W.-F. (1981). Cake filtration. PhD thesis, University of Houston, Department of Chemical Engineering, Texas, USA.
Loufti, H., Blackwell, B. and Uloth, V. (1991). Lignin recovery from kraft black liquor: preliminary process design. Tappi J., 74(1), 203-210.
Macdonald, C. (2013). Betting on Biochemicals. Pulp and Paper Canada, 12.
Mattsson, T., Sedin, M. and Theliander, H. (2011). Zeta-potential and local filtration properties: Constitutive relationships for TiO2 from experimental filtration measurements. Chemical Engineering Science, 66, 4573-4581.

References
61
Meeten, G.H. (1993). A dissection method for analysing filter cakes. Chemical Engineering Science, 48, 2391-2398.
Nelson, W. (1970). Confidence intervals for the ratio of two poisson means and poisson predictor intervals. IEEE Transactions of reliability, R-19(2), 42-49.
Öhman, F., Wallmo, H. and Theliander, H. (2007a). A novel method for washing lignin precipitated from kraft black liquor: Laboratory trials. Nordic Pulp and Paper Research Journal, 22(1), 9-16.
Öhman, F., Wallmo,H. and Theliander, H. (2007c). Precipitation and filtration of lignin from black liquor of different origin. Nordic Pulp & Paper Research Journal, 22(2), 188-193.
Öhman, F. and Theliander, H. (2006): Washing lignin precipitated from kraft black liquor. Paperi J.Puu, 88(55),287-292.
Öhman, F. and Theliander, H. (2007b). Filtration properties of lignin precipitated from black liquor. Tappi Journal, 6(7), 3-9.
Okamura, S. and Shirato, M. (1955). Liquid Pressure Distribution within Cakes in the Constant Pressure Filtration. Chemical Engineering, 19, 104-110.
Pye, E. K. (2008). Industrial Lignin Production and Applications. Biorefineries-Industrial Processes and Products. Wiley-VCH Verlag GmbH.
Ragauskas, A. J., Williams, C. K., Davison, B. H., Britovsek, G., Cairney, J., Eckert, C. A., Frederick, W. J., Jr., Hallett, J. P., Leak, D. J. and Liotta, C. L. et al. (2006). The path forward for biofuels and biomaterials. Science (Washington, DC, USA), 311(5760), 484-489.
Ruth, B., F. (1935). Studies in filtration iii. Derivation of general filtration equations. Industrial and Engineering Chemistry, 27, 707-723.
Shirato, M., Sambuichi, M., Kato, H. and Aragaki, T. (1969). Internal flow mechanism in filter cakes. AIChE Journal 15, 405-409.
Sixta, H. (2006). Handbook of pulp. Vol.1 Wiley-VCH, 9.
Sjöström, E. (1993). Wood Chemistry: Fundamentals and Applications, Gulf Professional Publishing.
Theliander, H. (1990). On the filtration properties of lime mud. Nordic Pulp and Paper Resources J., 5 (2), 74-82.
Tiller, F.M. and Hrong, L.L. (1983). Hydraulic deliquoring of filter cakes-1. Reverse flow in filter presses, AIChE J., 29(2), 297-305.
Tiller, F.M. and Shirato, M. (1964). The role of porosity in filtration: VI. New definition of filtration resistance. AIChE Journal, 10 (1), 61-67.
Tiller, F.M. and Leu, W.F. (1980). Basic data fitting in filtration. Journal of the Chinese Institute of Chemical Engineers 11, 61-70.
Tiller, F.M. (1955). The role of porosity. Part II: Analytical equations for constant rate filtration. Chemical Engineering Progress, 51:282-290.

References
62
Tomani, P. (2010). The LignoBoost process. Cellulose Chemistry and Technology, 44(1-3), 53-58.
Uloth, V.C. and Wearing, J.T. (1989a). Kraft lignin recovery: acid precipitation versus ultrafiltration. Part I: Laboratory test results. Pulp and Paper Canada, 90, 67-71.
Uloth, V.C. and Wearing, J.T. (1989b). Kraft lignin recovery: acid precipitation versus ultrafiltration. Part II: Technology and economics. Pulp and Paper Canada, 90, 34-37.
Wakeman, R.J., Thuraisingham, S.T. and Tarleton, E.S. (1989). Colloid science in solid/liquid separation technology: is it important? Filtration and Separation, 26, 277-283.
Wallberg, O. and Jönsson, A.S. (2006). Separation of lignin in kraft cooking liquor from a continuous digester by ultrafiltration at temperatures above 100°C. Desalination, 195, 187-200.
Wallmo, H., Richards, T. and Theliander, H. (2007). Lignin precipitation from Kraft black liquors: kinetics and carbon dioxide absorption. Paperi ja Puu, 89(7-8), 436-442.
Wallmo, H., Theliander, H., Jönsson, A.S., Wallberg, O. and Lindgren,K. (2009a). The influence of hemicelluloses during the precipitation of lignin in kraft black liquor. Nordic Pulp and Paper Research Journal, 24, 165-171.
Wallmo, H., Wimby, M. and Anders, L. (2009b). Increase production in our recovery boiler with LignoBoost-Extract valuable lignin for biorefinery production and replacement of fossil fuels. TAPPI Engineering, Pulping, Environmental Conference Memphis, Tennessee, USA.
Yim, S.S. and Song, Y.M. (2008). Porosity distribution in highly compressible cake: Experimental and theoretical verification of the dense skin. Korean Journal of Chemical Engineering, 25, 1524-1531.
Zhu, W., Westman, G. and Theliander, H. (2014a). Investigation and Characterization of Lignin Precipitation in the LignoBoost Process. Journal of Wood Chemistry and Technology, 34(2), 77-97.
Zhu, W., Westman, G. and Theliander, H. (2014b). The molecular properties and carbohydrate content of lignins precipitated from black liquor. Holzforschung. ISSN (Online) 1437-434X,ISSN(Print)0018-3830,DOI:10.1515/hf-2014-0062.