on the measurement of sustainability of rural water supply
TRANSCRIPT

Munich Personal RePEc Archive
On the measurement of sustainability of
rural water supply in India: A
Supervaluationist–Degree Theory
approach
Kesavan, Pushpangadan and Gangadhara, Murugan
Centre for Development Studies, Prasanth Nagar, Ulloor,
Trivandrum, Kerala, India
11 February 2008
Online at https://mpra.ub.uni-muenchen.de/8781/
MPRA Paper No. 8781, posted 18 May 2008 04:40 UTC

On the Measurement of Sustainability of Rural Water Supply in India:
A Supervaluationist – Degree Theory approach*
K. Pushpangadan and G. Murugan
Centre for Development Studies
Trivandrum, India
E-mail: [email protected]
ABSTRACT
The paper proposes an empirical methodology for understanding the nature and behavior
of Sustainable Development as a vague and multidimensional concept by a case study of
participatory and demand determined Rural Drinking water Supply systems in India. It
combines for the first time, two of the most influential models – ‘Supervaluationism’ and
‘Degree Theory’- on the measurement of ‘Vagueness’, for timely public intervention in
reversing the process of Un-sustainability. Analysis clearly brings out the role of
institutional, financial and environmental factors that should be part of Public Policy, for
ensuring sustainability of potable water supply.
2
On the Measurement of Sustainability of Rural Water Supply in India:
A Supervaluationist – Degree Theory approach
K. Pushpangadan and G. Murugan
Centre for Development Studies
Trivandrum, India
E-mail: [email protected];
Introduction
Provision of drinking water to the entire rural population in India is facing a serious
challenge due to the inability of existing schemes sustain its supply. This phenomenon
known as ‘falling back’ of covered habitations/villages with drinking water to uncovered
ones has been observed for the last two decades1. As a result, a major part of
investment in rural water supply becomes sunk in nature on a continuing basis. No
serious attempt has been made so far to assess the magnitude of this social loss. This is
the first objective of the paper. The other major concern of sector specialists and policy
makers is the lack of any theoretical framework to analyse the ‘falling back’ occurrence
and its empirical evaluation for policy decisions2. The second objective is, therefore, to
develop an analytical framework and evolve an empirical methodology for policy
formulation. It may be emphasized that all objectives are exploratory in nature in the
theory and measurement of sustainable development in rural water supply as is
demonstrated in the present paper.
According to the definition of sustainability by the Brundtland Commission
Report (1987) and by Solow (1993, 2000), the essence of sustainable development is
steady flow of resources from an asset without any reduction from one generation to the
other. Obviously, re-emergence of habitations/villages as uncovered in water supply
violates the condition of sustainability, the steady flow of resources even during its
1 Habitation/village is the smallest unit of human settlement used for defining drinking water availability in
rural India. A habitation/village is covered, according to government of India norm, with potable water if
40 lpcd (liter per capita per day) is provided within a distance of 1.6 Km in the plains and 100 meter in
hilly regions. 2 For such concerns in the water sector, see Biswas and Totojada (ed.) (2006).

3
lifetime of schemes. Viewed from this angle, one can analyze the falling back event
within the framework of sustainable development.
In this context, it may be noted that the concept of sustainable development has been in
the rhetoric for nearly a quarter of a century without much empirical content. It is
virtually an ‘empty box’ empirically except in sector-specific analysis of Fisheries and
Forestry. Water resource professionals even consider that its (sustainability) "usefulness,
irrespective of its conceptual attraction and widespread acceptance, can only be marginal,
unless it can be used operationally and effectively in the real world"3. In this context two
aspects of measurement of sustainability are of particular interest to policy makers, sector
specialists and development professionals. To the sector specialists and planners, such an
attempt provides the framework for 'the development process which could be planned
and implemented in such a way that it could become inherently sustainable'4. The second
equally important aspect of such an empirical exercise is to identify the parameters that
should be monitored and evaluated continuously so that timely intervention reverses the
transition of systems to non-sustainability. Such an exercise provides a basis for timely
public and institutional intervention to reverse the process of ‘falling back’.
Obviously, one faces several hurdles to make the concept of sustainability in the water
sector operational. Among them, three issues are particularly important. First is to choose
an appropriate definition from among the several existing ones. A cursory look at the
existing definitions indicate that it is complex and multi-dimensional in nature and spread
over diverse disciplines such as Hydro-geology, Public health engineering,
Environmental science, Sociology, Economics and Management5. This leads us to the
second issue, i.e., the identification of the multidimensional nature of sustainability and
its measurement. Having identified the empirical measures of attributes that contribute
negatively or positively to sustainability, the last issue (third) is the choice of quantitative
tool for discriminating the systems as sustainable/non-sustainable one. Since the concept
is ‘vague’, as convincingly argued by Solow (2000), the tool should be capable of
3 Biswas (2006): p.76. 4 Tortajada (2006): p.15.
5 See Bredtland (1987), Worldbank (2000), Solow (2000) and Asian Development Bank (2006), among
others.

4
modeling ‘vagueness’6. Recent advances in the modeling of ‘vagueness’ identify three
methods: (i) Epistemic method; (ii) Supervaluationism; and (iii) Degree theory7.
According to Qizilbash (2001, 2006), Epistemic view treats the dimension within the
classical logic (true or false) but not in between (degree of truth/falsehood). Therefore it
has very little relevance for the present analysis. The remaining two - Supervaluationism
and Degree theory - are both equally competent to model vagueness. There is no
superiority of one over the other since both of them have advantages and disadvantages.
Since Degree theory and Supervaluationism have rough borderlines, our approach for the
present study is decided after choosing the admissible dimensions in the specification of
sustainability.
The outline of the paper is as follows. Section 2 deals with the quantification of
the ‘falling back’ of drinking water and the money value of social loss across states and
union territories. Next section, III, summarizes the basic framework used for the analysis.
Section IV provides the operational version of the basic frame work including the
specification of multidimensional sustainability and models of vagueness in demand-
driven rural water supply. The fifth section reports the results based on the operational
model and the Socio economic determinants of sustainability. Finally, the last section
concludes with implication on public policy.
II
Estimation of falling back of coverage and social loss
In order to estimate the social loss, one needs the magnitude of ‘falling back’ in coverage
and the cost of providing it. On the coverage there are two sources of information; one
published by the Department of Drinking Water Supply (DDWS), Government of India;
and the other by National Sample Survey Organization (NSSO). Data published in the
web page of DDWS do not have uniformity in collection and its reliability is unknown.
Moreover it is based on potential supply from capacity created and, hence, does not
reflect actual coverage. In the case of National Sample Survey Organization, information
6 See Hopwood et. al. (2005) for a survey on various definitions on Sustainability
7 Qizilbash (2001, 2006)

5
obtained is based on a scientific methodology and implemented uniformly across all
states by an independent organization. Moreover it is based on the actual consumption8.
Therefore we have opted for NSSO surveys in 1993 and 2002 for the coverage
estimation.
Figure 1. Change in Coverage of Rural Water Supply by States, 2002 and 1993
Coverage
An
dh
ra P
rad
esh
Aru
na
cha
l Pra
de
shA
ssa
m Bih
ar
Go
a
Gu
jara
tH
ari
yan
aH
ima
cha
l Pra
de
sh
Jam
mu
&K
ash
mir
Ka
rna
taka
Ke
rala
Ma
dh
ya P
rad
esh
Ma
ha
rash
tra
Ma
nip
ur
Me
gh
ala
ya
Miz
ora
mN
ag
ala
nd
Ori
ssa
Pu
nja
b
Ra
jast
ha
nS
ikki
mT
am
il N
ad
uT
rip
ura
Utte
r P
rad
esh
We
st B
en
ga
lA
nd
am
an
&N
ico
ba
r Ch
an
dig
arh
Da
dra
Na
ga
r H
ave
liD
am
an
&D
iuD
elh
i
La
ksh
ad
we
ep
Po
nd
ich
ery
-80
-60
-40
-20
0
20
40
60
80
100
120
Source: NSSO (1993, 2002)
The percentage of population covered with potable water shows a declining trend during
the period, 1993-2002, for 12 states and 1 union territory as indicated by Figure 1. The
magnitude of this reverse process – popularly known as “falling back” - is the highest in
Nagaland followed by Sikkim, Mizoram, Pondicherry and the least in Punjab. It should
be noted that this lower coverage during the period is taking place at a time when there is
investment to the tune of millions of rupees in the state and central Government. This
has to be converted to value terms in order to assess the social loss.
To assess the social cost of falling back, estimate of affected population and the cost of
per capita coverage are required. Preliminary investigations show that such data are not
readily available. The affected population due to falling back is estimated from the
percentage of covered population available in 1993 and 2002 NSSO surveys in the
8 See for further details, Pushpangadan et. al.(1996)

6
following way. The 1993 and 2002 rural population is obtained by projecting the Census
figures in 1991 and 2001. Applying the ratio of coverage of NSSO to the projected
population figures for the respective years, the covered populations have been obtained.
The difference between the two covered populations shows the loss/gain in coverage of
drinking water during the period (Table 1). The negative coverage of population in Table
1 does not tally with the negative change in coverage from NSSO reports of Fig.1. Loss
of coverage is valid in all states except that of West Bengal, Punjab and Tamil Nadu. This
might be due to the difference in the population estimated or could also be that the life of
many systems might have expired during the decade. The loss estimated need to be
converted to value terms by appropriate per capita cost for each state. This information is
not readily available and hence the per capita cost of Kerala in 2007 is used for
evaluation. The value of social loss for the states and Union Territories are reported in
Table 1.
Table 1: Social loss from falling back of coverage by states,
1993 -2002
States/Union
Territories
Change in population
Coverage (in 000's)
Social Loss
( In 2007Prices,in
Rs. millions)
Andhra Pradesh 11906
Arunachal Pradesh 111
Assam 2033
Bihar 19196
Goa -23 80.5
Gujarat 3529
Hariyana 1217
Himachal Pradesh -168 586.8
Jammu&Kashmir 1210
Karnataka 2983
Kerala -933 3265.8
Madhya Pradesh 5440
Maharashtra -1437 5029.0
Manipur -147 514.5

7
Meghalaya 255
Mizoram -71 247.5
Nagaland -1557 5448.0
Orissa 4966
Punjab 1024
Rajasthan 7052
Sikkim -124 432.7
Tamil Nadu 1152
Tripura -159 556.5
Utter Pradesh 37453
West Bengal 2602
Andaman&Nicobar 61
Chandigarh 117
Dadra Nagar
Haveli 59
Daman&Diu 9
Delhi 740
Lakshadweep 2
Pondicherry -14 50.5
Total 16211.8 Source: NSSO (1993, 2002) and Census (1991, 2001)
If the population in the Table 1 is positive it implies an increase in coverage and a
negative sign denotes the decrease (falling back). Social loss occurs only where the
coverage declines. This is evaluated for states with decline in coverage. The total loss is
of the order of 16212 Million Indian Rupees (231.60 Million Pounds). In order to cover
the population again the cost will be more or less of the same order and hence the total
social loss would be double (Rs. 32424 Million) the cost estimated. 9 Social loss is seen
to be highest in Nagaland followed by Maharashtra and the least in Pondicherry. This
amount is very substantial indeed for a developing country. An understanding of the
9 Strictly speaking the opportunity cost of this capital should also be added to arrive at the total social loss
of falling back.

8
factors contributing to the falling back problem is required for preventing such social
waste in the future. Such an attempt is taken up in the next section.
From the growth literature, this problem belongs to the sustainability of an asset
since the yield is not steady during the life of the asset. Therefore a theoretical
foundation can be evolved from sustainable development literature. This is being
attempted in the following sections.
III
Theoretical Background
In this section, we formulate the basic framework of our analysis emerging from the
complex nature of sustainable development and its measurement as a vague predicate.
3.1 Sustainability: definition, nature and concept
There exist several definitions on sustainability. An important landmark in this
direction is the one in Brundtland Commission Report (BCR, 1987). According to BCR,
“...Sustainable development is a process of change in which the exploitation of resources,
the direction of investments, the orientation of technological development, and
institutional change are all in harmony and enhance both current and future potential to
meet human needs and aspirations”. Several attempts are being made to operationalise
this concept across different sectors and economies. A step towards operationalisation of
this concept in water supply is contained in the project appraisal document of the World
Bank (2000) and the evaluation report of the Asian Development Bank (2006).
According to the Bank documents “Sustainability implies that the system works through
out its life and beyond, and is able to generate adequate cash flow for future
expansion/renewal.” This definition will be followed with some modifications in the
present analysis. The next issue is to deal with the imprecise nature of the concept. This
aspect is best stated by Solow (2000). To quote him,10
“--- sustainability is an essentially
vague concept and it would be wrong to think of it as being precise, or even capable of
being made precise”. The vagueness needs more elaboration since the methodology for
empirical analysis depends crucially on it.
10
See Solow (2000); p.132

9
3.1.1 The Vagueness of Sustainability
In the literature, three distinguishing features have characterized vagueness
though not mutually exclusive11
. The first one is that they ‘allow’ for borderline cases. In
the present case of drinking water, this means that whether a system is sustainable or non-
sustainable is difficult to judge. The second characteristic is that a sharp boundary
between cases cannot be drawn. This condition is also applicable to water supply sector
since it is incapable to draw a specific clear cut demarcating line between cases that are
sustainable and non sustainable. The third is that it is susceptible to ‘sorites paradox’12
or
paradox of the heap. Obviously this condition is very well applicable in the
measurements of sustainability also. In order to demonstrate that sustainability satisfies
sorites paradox, consider the case of an aquifer where there exists sufficient quantity of
ground water to be made use of by the community for both drinking and irrigation
purposes. The community as well as the farmers continuously draws water from the
aquifer over and above its recharge level. Such continuous extraction ultimately reaches a
stage where the aquifer dries up, wells becoming non sustainable. After certain level, the
graduality principle applies and the sustainable system becomes non-sustainable.
Therefore it satisfies the third criterion, ‘sorites paradox’. Sustainability satisfies all the
three features of vague predicate. It may also be noted that all the three conditions are
related but not independent. Now we are in a position to depict the basic framework of
analysis.
3.2. The Basic Theoretical Framework
Having been identified the concept as a vague predicate; the basic framework for the
analysis is summarized in Figure 2.
The first box, 2.1 in Figure 2 contains set of all water supply systems in the region
and the last box, 2.4, provides the subset of sustainable systems after eliminating the non-
11
Qizilbash (2001, 2006) 12
Greek paradoxes were usually formulated in terms of a sequence of questions. “Does one grain of wheat
make a heap? Do two grains of wheat make a heap? Do three grains of wheat make a heap...Do ten
thousand grain of wheat make a heap? It is to be understood that the grains are properly piled up, and that a
heap must contain reasonably many grains, If one admit that one grain does not constitute a heap, and are
unwilling to make a fuss without the addition of any single grain, you are eventually forced to admit that
ten thousand grains do not make a heap.” Williamson quoted in Martinetti (2006b).

10
sustainable systems using the methods broadly outlined in boxes 2.2 and 2.3 Let us
elaborate these boxes. Box 2.2 provides the complexity and the broad areas to which
multidimensional nature of the concept belongs. A review of literature, particularly of
World Bank (2000) and Asian Development Bank (2006) indicates the broad admissible
dimensions in the complex nature of sustainability of potable water supply. Box (2.2)
points out the broad dimensions for any specification of the concept. Such specifications
should include attributes from: (1) Source; (2) Technology; (3) Quality; (4) Institution;
(5) Finance; and (6) Human Behaviour. The broad dimensions of sustainability are
discussed below.
Source: Source refers to a natural water source - surface or sub-surface - from
which water is extracted, treated and distributed to the needy community. It may be noted
a perennial water source is a prerequisite for sustainability of a system.
Technology: By technology we mean the devices used to extract water from
source, process and deliver to the users. Right selection of technology is important in the
sustainability of the system. It may be noted that its impact on sustainability can be
measured only its interaction with other factors such as water source, quality etc.
Quality: The next broad parameter that affects the potable supply of water is its
quality. The relevance of quality to sustainability depends on two aspects. Water
extracted from the source should be amenable for treatment to attain potable standards
before delivery. The second one is that even if the quality is good on delivery point the
users should also perceive that quality is good. If both dimensions are not met then the
system is non sustainable.

1
Figure 2
Basic Theoretical Framework for Sustainability Analysis
Box 2.1
All Water
Supply
Systems
Box 2.3
Models of vagueness
– Epistemic Approach
– Supervaluationism
– Degree Theory
Box 2.2
Factors of Sustainability
Source
Technology
Quality
Institutions
Finance
Human Behavior
Box 2.4
Sustainable
Systems

1
Institution: According to North (1990), “Institutions are rules of the game in a
society or, more formally, are the humanly devised constraints that shape human
interaction”. He further elaborates that Institutions can reduce uncertainty by making
available a well-knit structure to every day life. In the present context formulation of
rules and regulation for the transparent and efficient functioning of the systems that
ensures sustainability. This would mean identification of rules and regulations for the
efficient operation, maintenance and management of water supply systems.
Finance: Sustainability in terms of finance implies that the system generates
adequate cash flow for future expansion or renewal. If such adequate cash flow cannot be
generated the system cannot sustain.
Human Behaviour: The last pre requisite for sustainability is appropriate Human
behaviour. This constitutes personal, domestic and environmental hygiene and awareness,
among others.
The next task is to identify the quantitative tool for measuring sustainability as a
‘vague predicate’. This requires methods that model ‘vagueness’. As indicated in Box 2.3
in Fig.2, ‘vagueness’ can be modeled in three ways: (i) epistemic approach; (ii)
supervaluationism; and (iii) degree theory13
. The epistemic method treats, vagueness in
the classical tradition, only true or false. ‘Vagueness’ arises because of the ignorance
about the border lines. The chief weakness of epistemic approach is “that they assume
that it is lack of knowledge which gives rise to vagueness”14
. The method, does not
address two of the three characteristics of a vague concept mentioned above and hence
not considered for the present analysis.
Unlike epistemic view, supervaluationism and degree theory explicitly model
‘vagueness’. Yet, there are sharp differences in the two methods in identifying non
sustainable systems. In supervaluationism all dimensions have to be classified into ‘core’
and ‘non core’ and a range of critical values for each dimension. It may be noted that a
dimension becomes core only if it appears in all admissible specifications of
sustainability. Systems that fall at or below the lowest critical level in each dimension is
definitely non sustainable. In the case of core attribute, it is ‘core non-sustainable’ (core-
13
See Qizilbash (2001, 2006); Martinetti (2006a) 14
Qizilbash (2001, 2006)

2
ns). Similarly systems that fall above the highest critical level in all dimensions are
sustainable. Systems that are neither core-ns nor sustainable belong to the ‘margins of
sustainability’. Hereafter such systems are grouped as marginal systems.
Degree theory drops classical logic, and assumes more than two truth-values,
which comes in degrees. There are many forms of degree theory. The one, which is
applied in economics, is the Fuzzy set approach that quantifies the degree of truth in
borderline cases. More specifically it measures the degree of truth on the [0, 1] interval
with 0 measuring falsehood and 1 indicating truth.
The framework for measurement of vagueness in the present analysis is
conditional upon the operational version of the framework, which is taken up next.
IV
The Operational Version of Basic Framework
The major concern in this section is the methodology of data collection and the
measurement of attributes/dimensions in the specification. It also contains empirical
model of the basic framework, which combines supervaluationism and degree theory.
4.1 Data and methodology
Two most common rural water supply systems in Kerala are (i) publicly owned
systems and (ii) collectively owned demand driven systems. Unlike publicly owned
systems, demand based systems has complete participation of users at all levels of
decision making including operation and maintenance and collection of revenue. As a
result, the system satisfies all dimensions of sustainability as envisaged in the basic frame
work in Fig.2. Therefore the selection of samples is restricted to demand based systems
alone.
4.1.1. Sample:
Demand-driven systems, a recent phenomenon in the state, started in 1999
assisted by World bank in the provision of Rural drinking water on an experimental basis.
Initially 4 districts15
(Trichur, Palakkad, Malappuram and Kozhikode) were selected in
the state for implementing the project16
.
15
District is the third tier of administrative unit in India. 16
See www.jalanidhi.com for details.

3
Samples were selected from all the four experimental districts. Selection of
samples involved two stages. In the first stage, systems were selected at random from the
total systems in the district. The second stage of sampling was the selection of
beneficiary households from the list maintained by the beneficiary committee17
of each
system. The number of households per system varies from 20 to 75. Sample size was
limited to 10% of beneficiary households with a minimum of 3 from each system and
selected at random using circular systematic approach. It may be noted that there is only
one Beneficiary Group (BG) for every system in the sample except one mega system in
Malappuram. Since the system is intended to serve a large area and number of
households several BGs have been formed for administering distribution of water
equitably and for collection of revenue. Accordingly the mega system has 69 BGs with
an apex body for inter BG co-ordination. The details of the samples are given in Table 2.
Table 2. Sample Systems and Households by District
District No of systems No of Households
Trichur 143 867
Palakkad 250 1045
Malappuram 179 1175
Kozhikode 217 1031
Total 789 4118
Source: Kerala Rural Water Supply and Sanitation Agency
A combination of the following approaches was used for the collection of data.
Participatory Rural Appraisal Techniques were used to identify various dimensions of
sustainability and its measurement. Such information was then incorporated into
structured questionnaire, pre tested and modified. These questionnaires were then
administered at the system level as well as at the household level. The data so collected
were verified or supplemented using ‘Transit Walk Methods’. Secondary sources of data
if available were also used for the analysis wherever required.
17
Beneficiary committee is the democratically elected representatives from the beneficiaries to administer
maintain and operate the water supply system.

1
Figure 3. Location Map of Districts

1
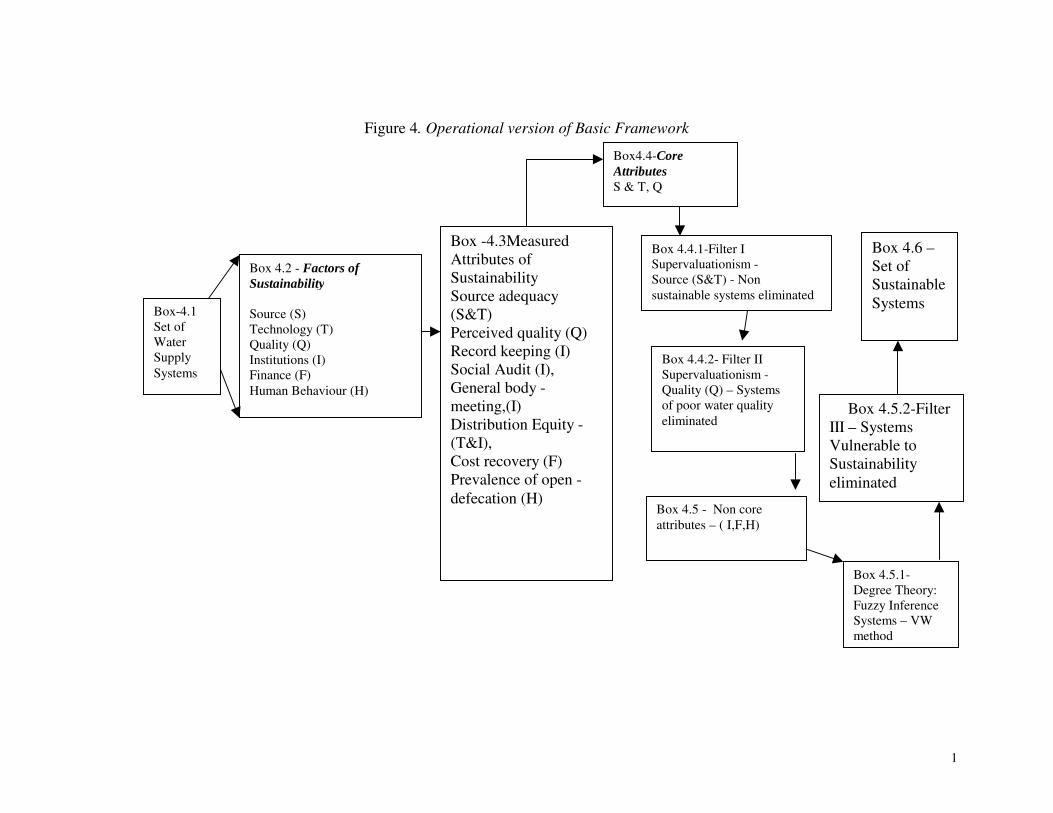
4.2 Measurement of Attributes
Here the task is to define the specific attributes from the broad dimensions in Box 4.2,
Figure 4. The measurable dimensions are given in Box 4.3, Figure 4. It may be noted that
eight attributes were selected that influence sustainability on a priori grounds. These were
then sharpened empirically as discussed below.
(i) Source adequacy (S&T): Source adequacy is taken as an attribute of Source
and Technology together. The range of critical values of source adequacy in
sustainability is as follows. The upper limit is adequate supply throughout the
year. If the source is not able to provide water to all connections for at least 5
or more days in a year, then it is the lower limit of the attribute. The attribute
takes the following values:
Source adequacy (SA) = 1, if inadequate supply
= 0, Otherwise.
(ii) Quality (Q): It is postulated that if the quality of water is not of potable
standards, the users may not participate in the collective management of the
systems even if supply is assured. The same is true if the perceived quality is
also poor. In both cases, the systems would not be sustainable in the long run.
In our survey only perceived quality is measured since laboratory tests are
seldom conducted. In other words, the upper limit is that quality is perceived
to be good by all households.18
. Therefore, the lower limit of the attribute is
the existence of quality problem if 10 % households perceive quality
problems.
Quality = 1 if at least 10 % of the households perceive poor quality
= 0 otherwise
(iii) Institutions: One interaction measure and three independent measures were
considered for measurement. They are (1) Record keeping (RK), (2) Social audit (SA),
(3) General body meeting in a year (GB), and (4) Distributional equity (DE). Of these,
18
Demand driven systems taken for analysis are comparatively small and tiny in size. Hence it may not be
possible for each system to carryout regular laboratory check. An alternative to is the observations and
opinion of the beneficiaries using water from experience, like cloth get reddish colour on washing, salinity,
bad smell etc.
2
distributional equity is the interaction of the operations of the system with the technology.
Theses attributes were sharpened in the following way.
Institutional rule of the system stipulates that RK has five key records. It involves:
(i) maintenance of log book in pumping stations; (ii) minutes book to record the activities
and important decisions in the general body and committee meetings; (iii) membership
register showing the members and their details; (iv) receipt book to record transactions;
and (v) accounts register showing the inflow and outflow of transactions. If all the above
five records are not maintained or maintained but not up to date, then RK is poor and
assigned the value 1, otherwise 0. Obviously this implies the possibility of non
sustainability of the system. It is a prerequisite that the General body (GB) of the
beneficiaries should meet at least once in a year. GB is assigned value 1 if no general
body meeting has been convened in year; otherwise 0. Social audit implies annual
verification of all the records held by the system by the elected members from among the
beneficiaries themselves. Their report is placed before the general body for discussion
and approval. If there is no social audit, SA is assigned 1; otherwise 0. Distributional
equity (DE) is measured through household surveys. If at least ten percent of the
households surveyed in a system report that they don’t get adequate quantity of water
such systems are assigned ‘1’, otherwise ‘0’. The sharpening of the attributes is:
(1) RK = 1, if record keeping is poor,
= 0, otherwise;
(2)GB = 1, if no general body meeting have been convened in a year,
= 0, otherwise;
(3) SA = 1, if there is no social audit,
= 0, otherwise;
(4) DE = 1 if at least ten percent of households do not get adequate water
= 0, otherwise
(iv) Finance: Full cost recovery is required for sustainability, which may not be
politically feasible considering the merit good nature of the commodity - rural water
supply - in developing countries. Therefore the capital required for replenishment and
renewal of the system for the next generation is assumed to be a social responsibility of
Government. Schemes under analysis; it is only required to collect the cost of operation

3
and maintenance, hence there is no range of critical values but there is only one value for
cost recovery (CR). Accordingly
CR = 1 if the revenue is inadequate to meet the operation and maintenance cost,
= 0 otherwise.
(v) Human behaviour: Influence of human behaviour on sustainability depends on
personal, household and environmental hygiene. Several indicators are required for
capturing this dimension. However a common indicator which captures the three
components is the practice of open defecation (OD). It also has impact on quality of
water owing to source pollution and perceived nature of quality. This dimension is
sharpened according to the following way. If, there is the prevalence of open defecation
in at least one of the beneficiary households surveyed. Then,
OD = 1, if open defecation is prevalent in at least one household
surveyed,
= 0, otherwise.
Having sharpened all the attributes of sustainability, let us examine the appropriate model
for measuring vagueness.
4.3. Methods of Modeling Vagueness
As mentioned earlier the present analysis confines to models of supervaluationism
and Degree theory. Even though Supervaluationism and degree theory have both merits
and demerits in modeling vagueness, the former has not been much used in Economics,
while the latter had limited application19
. One plausible reason for not using
supervaluationism is the need for prior knowledge on various dimensions; to be classified
as ‘core’ and ‘non-core’. Hence a universal application of the methodology is not
possible. In this case, degree theory has an advantage since it does not require a
distinction between ‘core’ and ‘non core’ among the attributes. A combined use of the
methods is not yet applied in the development context. In the present analysis both the
methods are used for the following reasons. Supervaluationism identifies schemes at the
margin of sustainability but do not provide sufficient information for a policy
intervention for arresting the transition process towards non sustainability. Policy
intervention requires an understanding of the degree of sustainability and its relative
19
Quizilbash (2001)

4
dimensions. This is only possible by the use of ‘degree theory’ and hence we use it for
identifying such systems. Such a methodology is an important tool for policy makers, to
detect and reverse the transition of systems towards non sustainability. Now, let us
examine the details of the combined methodology of supervaluationism and degree
theory.
4.3.1 Supervaluationism
Supervaluationism as mentioned earlier requires the classification of attributes
into core and non core categories. This dual classification of dimensions is illustrated
clearly in the case of multi-dimensional poverty before it is applied to sustainability. A
dimension is defined to be core if it is included in all admissible specifications of poverty.
By this definition nutrition is a core dimension, without which multi dimensional poverty
cannot be specified. If a person is at or below the critical level of nutrition, then such a
person is ‘core poor’ even if he/she is non-poor20
in other dimensions in the specification
say, education, housing, etc. In this context, only one dimension (the nutrition level) is
needed for classifying a person as poor or non poor. The task for the present analysis is to
see whether there are any core dimensions in the specification of sustainability of
drinking water system. Of the eight measured attributes, two of them (water source and
its quality) are core attributes. If the source is inadequate then the system is non-
sustainable irrespective of the nature of sustainability of the remaining seven dimensions
in the specification. The second core is the quality of water. If quality of water is not of
potable standards, then the system is core non-sustainable irrespective of the
sustainability of the remaining six attributes. This clearly brings out the point that, if a
system is core non-sustainable, then one does not worry about the remaining attributes.
The core attributes and its role in the analysis of sustainability of drinking water are given
in Box 4.4 in Fig.4.
Two ‘core’ attributes source of water (S&T) and its Quality (Q), as is evident
from Box 4.4 in Figure 4 exist in water supply. Now the question is whether they
function simultaneously or in sequence. Only if the source sustains on a perennial basis
the next attribute, quality arises. Therefore source has to be analyzed first followed by
20
Consider the case of three dimension poverty in nutrition, education and housing. A person is core–poor
(nutrition), even if he/she is literate and owns a dwelling place. See Qizilbash (2006: pp. 20-22) for details.

5
quality in a sequential way as both are important for the existence of the system. Since
the method needs to be applied in sequence, we call it as ‘sequential supervaluationism’
(SS). To be more specific the SS methodology is necessitated because quality of water of
potable standards arises only if source has adequate quantity to be distributed among the
beneficiaries.
Supervaluationism classifies systems into three categories on the basis of the
range of critical values of all the dimensions in the specification. They are (i) core non
sustainable systems21
(ii) sustainable systems and (iii) marginal systems (systems falling
on the margins of sustainability). Sustainable systems are those systems at or above the
upper limit of all eight admissible dimensions. The systems that are at or below the lower
limit of critical values of core dimensions belong to the ‘core non sustainable’ group. The
residual systems are margins of sustainability, which we call as marginal systems22
. In
other words they are neither core non-sustainable nor sustainable. It may be noted that the
marginal systems gradually fall either to sustainable group or to core non sustainable.
From the policy perspective our interest is more towards systems that fall at or below the
lower limit on non core attributes so that immediate policy intervention can reverse the
process. Now the challenging task is how to identify the marginal systems that require
immediate policy intervention for reversing the process. One way of identification of the
group is the use of fuzzy inference system in degree theory.
4.3. 2. Fuzzy Inference System.
There are three methods in fuzzy inference system that can be used for the present
analysis. They are (i) Totally fuzzy and absolute approach of Cerioli and Zani; (ii)
Totally fuzzy and relative approach by Chelli and Lemmi; and (iii) the approach
suggested by Vero and Werquin.23
Among them Vero-Werquin (VW) approach is the
only method that avoids “….excessive importance being assigned to correlated indicators
and redundant variables.” 24
In the estimation of VW model, two stages are involved. In the first stage an
indicator ‘fi’ (frequency) is calculated. In the second stage, a two step estimation is used
21
Super true according to Fine See Qizilbash (2001, 2006). 22
See Qizilbash (2001, 2006) for more details. 23
See for details Deutsch and Silber (2006) p.156. 24
See Vero (2006) p.218.

6
involving the transformation of ‘fi’ to the membership function (the details of which is
given later in eq.(1) and eq.(2). The membership function provides an estimate of the
degree of sustainability among the marginal systems. Before we undertake a detailed
analysis of such an estimation technique the methodology is illustrated in the case of
three attributes and six systems.
Let ‘K’ (=3) be the number of attributes and ‘n’ (=6) be the number of systems
and ‘fi’ (i=1,2,…6) proportion of systems that are at least as sustainable as system ‘i’
considering all the indicators and systems. The three attributes are Record keeping (RK),
Distributional equity (DE) and cost recovery (CR). It may be noted that a value of 1 for
an attribute denotes that the value is at or below the lower limit of that attribute and ‘0’
otherwise. For example if RK=1then the system follows a very poor record keeping that
eventually leads to a non sustainable situation. If RK= 0 Record keeping is perfect, there
is every chance that the system will be sustainable in that dimension. Coming to the
second dimension i.e. DE =1, if inequity exists in the distribution and 0 for perfect equity.
CR =1 if revenue is insufficient for meeting O&M expenditures, other wise 0. Obviously
1 indicates non sustainabe and 0 sustainable in that dimension.
Consider cases of extreme systems first. System 2, where values of all attributes
are 1, shows that they are at or below the lower limit of all attributes. Since this is on the
bottom line no other system can be classified to be below; though there can have systems
at par. This would mean that this is a system in the worst position, hence cannot have any
one else below this. As there is no other member in the system at par or below that of
system 2 since it is deprived in all dimensions (RK, DE, and CR) and has the highest
chance of becoming a non sustainable one. Hence the proportion of systems as
Illustration of the Computation of ‘fi’ and Membership
Function
Systems RK DE CR fi ms(i)
1 0 1 0 4/6 0.23 2 1 1 1 1/6 1 3 0 1 0 4/6 0.23 4 0 0 0 6/6 0 5 0 1 1 2/6 0.61 6 1 0 1 2/6 0.61
7
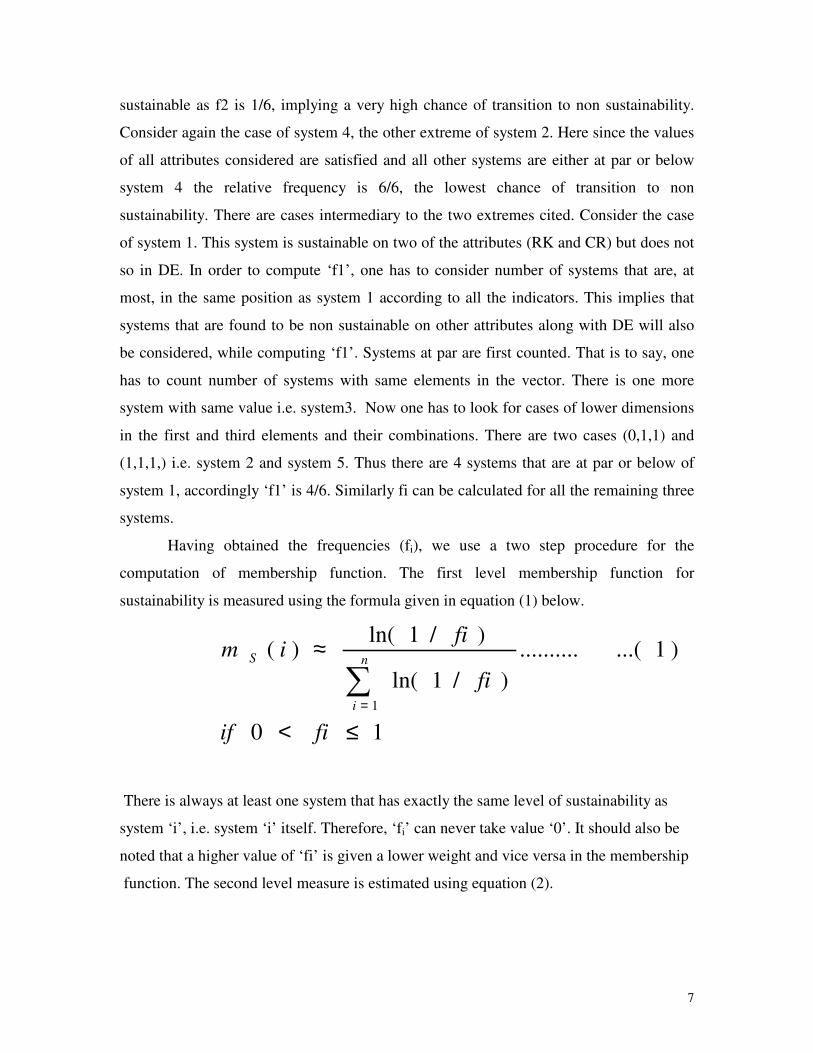
sustainable as f2 is 1/6, implying a very high chance of transition to non sustainability.
Consider again the case of system 4, the other extreme of system 2. Here since the values
of all attributes considered are satisfied and all other systems are either at par or below
system 4 the relative frequency is 6/6, the lowest chance of transition to non
sustainability. There are cases intermediary to the two extremes cited. Consider the case
of system 1. This system is sustainable on two of the attributes (RK and CR) but does not
so in DE. In order to compute ‘f1’, one has to consider number of systems that are, at
most, in the same position as system 1 according to all the indicators. This implies that
systems that are found to be non sustainable on other attributes along with DE will also
be considered, while computing ‘f1’. Systems at par are first counted. That is to say, one
has to count number of systems with same elements in the vector. There is one more
system with same value i.e. system3. Now one has to look for cases of lower dimensions
in the first and third elements and their combinations. There are two cases (0,1,1) and
(1,1,1,) i.e. system 2 and system 5. Thus there are 4 systems that are at par or below of
system 1, accordingly ‘f1’ is 4/6. Similarly fi can be calculated for all the remaining three
systems.
Having obtained the frequencies (fi), we use a two step procedure for the
computation of membership function. The first level membership function for
sustainability is measured using the formula given in equation (1) below.
10
)1...(..........
)/1ln(
)/1ln()(
1
≤<
≈∑
=
fiif
fi
fiim
n
i
S
There is always at least one system that has exactly the same level of sustainability as
system ‘i’, i.e. system ‘i’ itself. Therefore, ‘fi’ can never take value ‘0’. It should also be
noted that a higher value of ‘fi’ is given a lower weight and vice versa in the membership
function. The second level measure is estimated using equation (2).

8
In Eqn (2), µs(i) is defined as the ratio of the difference between one’s own value
of ms(i) and the minimum in the range to the difference between the minimum and
maximum of ms(i). This is made clearer by looking at the membership value calculated
for our example given above. The range of degrees of membership varies from 0 to 1. A
system which has a truth value of 1 is non sustainable. At the other end if a system has
value equal to 0 is sustainable in all dimensions. System 2 in the example is non
sustainable since it has value 1 in the membership function. By definition system 4 gets
‘0’ in the membership function implying that it is sustainable in all dimensions. By this
logic any system nearing 0 is becoming sustainable. On the contrary, systems
approaching 1 is in transition to non sustainablility. Thus systems, 1 and 3, are close to 0
and hence satisfying most of the dimensions. Whereas systems, 5 and 6, are close to
membership value 1 and hence are having a higher degree of non sustainability. It is
necessary to have a demarcation between the non sustainable and sustainable systems.
Average value of µs (i) is taken as the line of sustainability, which is 0.44 in our example.
This means that systems with membership value 0.44 or above are in transition towards
non sustainability of varying degrees. This would mean that approximately three schemes
whose membership value close to 1 are non sustainable. The remaining is sustainable. By
this criteria systems 2, 5 and 6 are non sustainable and systems 1, 3 and 4 are sustainable.
Now we generalize the above empirical model to a large number of systems and
attributes.25
25
The frequency table is calculated using a computer program
)2..(..........)]([)]([
)]([)()(
imMinimMax
imMinimi
SS
SSS −
−≈µ

9
V
Empirical analysis
In this section empirical application of the sequential supervaluationism is applied to 789
samples for the classification of the systems into core-non sustainable and marginal
systems. The marginal systems were then analyzed for the estimation of degree of truth
using VW method of fuzzy inference. The marginal systems are then examined for
establishing the relation between socio-economic factors and sustainability.
5.1 Supervaluationism - Results
In the sequential supervaluationism as shown in Fig.4 -filter 1 and 2 is applied to 789
samples by taking source as the first core. The results are shown in Table 3.
Table 3. Core - Non-Sustainable Systems by District ( Core : Source)
No of systems
District Sustainable Non
Sustainable
Total
Trichur 128 (90) 15 (10) 143 (100)
Palakkad 230 (92) 20 (8) 250 (100)
Malappuram 168 (93.9) 11 (6.1) 179 (100)
Kozhikode 184 (84.7) 33 (15.3) 217 (100)
Total 710 (90) 79 (10) 789 (100)
Source: Primary survey. Note: numbers in parenthesis are percentages
On an average 10% (79) of the systems are core non-sustainable in source: the highest in
Kozhikode (15.3%) and the least in Malappuram (8%). Reasons for such inter district
variation could be the hydro-geological conditions in the districts, which require further
probing. Now let us examine the core-sustainability of the remaining 710 (789-79)
systems taking quality of water as the second core. The results are summarized in
Table 4.

10
Table 4. Core – Non Sustainable Systems by District
(Core : Quality)
No of systems
District Sustainable Non
Sustainable
Total
Trichur 69(54) 59(46) 128(100)
Palakkad 159 (69) 71 (31) 230 (100)
Malappuram 108 (67.7) 60 (33.3) 168 (100)
Kozhikode 128(69.4) 56(30.6) 184(100)
Total 464(65.35) 246 (34.65) 710 (100)
Source: Primary survey. Note: numbers in parenthesis are percentages
Average core non sustainability due to quality is 35% (246) of 710 systems
considered. Quality problem is found to be severe in Trichur district, but more or less the
same among the remaining three districts. Our findings based on the perceptions of the
households are also supported by other scientific analysis undertaken recently by the
scientists of Indian Institute of Science and water quality monitoring carried out in the
open wells in the state by the Socio Economic Unit Foundation. Reasons for non
sustainability in quality vary from place to place. Observations from the field show that
in some of the locations it is because of nature itself (hydro-geological conditions etc.)
where as it is man made in certain others (Agricultural and industrial pollution). Reasons
for variations in quality can be assessed only through detailed laboratory check followed
by investigation on the perceptions among the households.
From the supervaluationist analysis it is evident that almost 41% of the systems in
the state are found to be non sustainable by core attributes, source and quality. Further it
varies from 36.4% in Palakkad to 52% in Trichur. Non sustainability of systems ranging
from 1/3rd
to half due to the two core factors, alone requires an immediate policy
intervention for correction.

11
According to supervaluationist theory the remaining 464 systems are either ‘super
sustainable’ or in the ‘margins of sustainability’26
. In order to identify the ‘super
sustainable’27
systems one needs to have upper limits for all core and non core factors.
However one of the non core factors, ‘cost recovery’, allows only for recovery of
operation and maintenance cost. An upper limit of this dimension should include a
recovery component on capital cost of the project, for intergenerational equity. As major
portion of the capital cost is subsidized by the state and the tariff system does not
envisage any recovery of capital cost, super true category cannot be identified. Hence we
assume that the remaining systems belong to the margins of sustainability and are treated
as marginal systems.
From the policy point of view this group needs to be prioritized so that public
intervention can reverse the process. Policy intervention depends crucially on a
methodology, which enables such identification. As mentioned earlier this is possible
through Fuzzy inference system (VW method) in the degree theory.
5.2 Fuzzy Inference System - Results
In this analysis our effort is to locate the systems with higher possibility of falling back to
non sustainability. This has to be estimated from the 453 marginal systems identified
earlier28
. As mentioned above systems that are in transition are identified by applying the
two step membership function outlined above and the results are given in Table 6.
Table 6 shows that a little more than one third of the marginal systems are in
transition to non sustainable status. Percentage of systems below the line of sustainability
is maximum in Trichur and minimum in Palakkad. This would mean that all together 151
systems require immediate public intervention for correcting the ‘reversing’ process in
the ‘non core’ attributes. This suggests that public policy should be reoriented in order to
strengthen the institutions that limit the ‘reversing’ process. The above findings point to
the need for a restructuring of the present institutional set up of providing rural water
supply system through public provision for sustainable drinking water supply.
26
Marginal system=Total system -Core non sustainable systems by source and quality. 27
Each of the core attributes do have a lower and upper limits within which Super sustainable are systems
whose values attribute all above upper limit of all attributes. 28
Though 464 systems are in the marginal category only 453 have been found suitable for analysis.
12
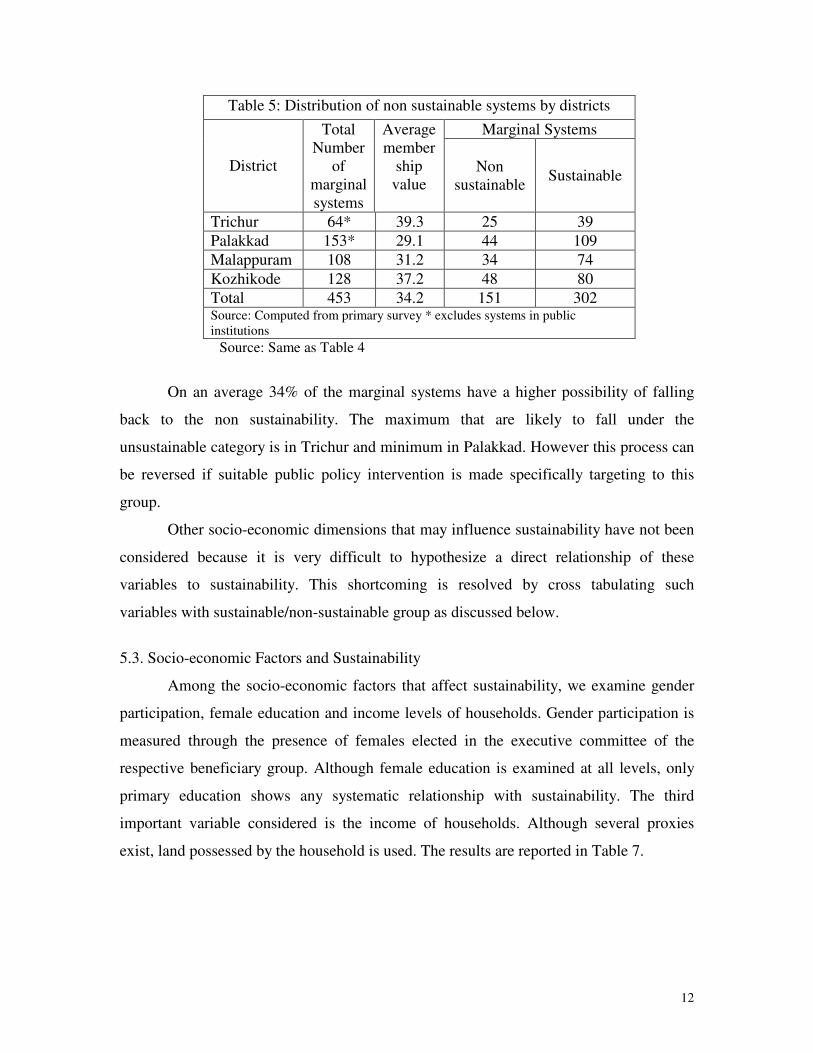
Table 5: Distribution of non sustainable systems by districts
Marginal Systems
District
Total
Number
of
marginal
systems
Average
member
ship
value Non
sustainable Sustainable
Trichur 64* 39.3 25 39
Palakkad 153* 29.1 44 109
Malappuram 108 31.2 34 74
Kozhikode 128 37.2 48 80
Total 453 34.2 151 302 Source: Computed from primary survey * excludes systems in public
institutions
Source: Same as Table 4
On an average 34% of the marginal systems have a higher possibility of falling
back to the non sustainability. The maximum that are likely to fall under the
unsustainable category is in Trichur and minimum in Palakkad. However this process can
be reversed if suitable public policy intervention is made specifically targeting to this
group.
Other socio-economic dimensions that may influence sustainability have not been
considered because it is very difficult to hypothesize a direct relationship of these
variables to sustainability. This shortcoming is resolved by cross tabulating such
variables with sustainable/non-sustainable group as discussed below.
5.3. Socio-economic Factors and Sustainability
Among the socio-economic factors that affect sustainability, we examine gender
participation, female education and income levels of households. Gender participation is
measured through the presence of females elected in the executive committee of the
respective beneficiary group. Although female education is examined at all levels, only
primary education shows any systematic relationship with sustainability. The third
important variable considered is the income of households. Although several proxies
exist, land possessed by the household is used. The results are reported in Table 7.

13
Source: Same as Table 5
It is interesting to note that higher the gender participation higher the degree of
sustainability in all the districts. In the case of female education, the degree of
sustainability and education are positively related only in Trichur and Palakkad but not in
Malappuram and Kozhikode. For income, average land possessed per household does not
show any systematic relationship and hence not reported29
. However, firm conclusions
require further multi level statistical analysis.
VI
Summary and Conclusions
Falling back of covered habitations/villages to uncover has been observed in rural water
supply for the last two and a half decades. This has far reaching consequences both for
the community as well as to the government. As regards the community the beneficiaries
of such systems are forced to draw water from non-potable sources thereby affecting their
health and livelihood. The second is the loss of resources to the exchequer and social
loss. However, only the latter has been examined in this study. The former could not be
29
However the income proxy is found to have a positive relationship with sustainability in the case of
coastal and non coastal regions. See Pushpangadan and Murugan, (2007) for details.
Table 6: Socio-economic factors and Sustainability by Districts
Distrct
Nature of
Systems
Total
number of
Marginal
Systems
No Gender
Participation
Female
education
Sustainable 39 24.4 1.6 Trichur
Non
sustainable
25 34.8 4.4
Sustainable 109 15.5 2.3 Palakkad
Non
Sustainable
44 27.9 6.2
Sustainable 74 14.7 10.8 Malappuram
Non
Sustainable
34 26.4 6.2
Sustainable 80 7.3 2.7 Kozhikode
Non
Sustainable
48 12.8 1.1

14
addressed due to unavailability of data. The estimated loss for the period 1993 - 2002 is
estimated to be 32422 Million Indian Rupee. This resource waste can be avoided if it is
analyzed in the framework of Sustainable Development. Sustainable development
literature shows that it is a concept in multidimensional and vague in nature. This is
operationalised using the multidimensional specification implied in World Bank
documents and supervaluationism and degree theory models of measuring vagueness for
a sample of 789 demand driven participatory rural water supply systems in rural Kerala.
For the application of ‘supervaluationism’, ‘core’ attributes have to be identified. They
are adequacy of water supply (source) and perceived quality of water. Since source is of
first priority of any sustainable system, it is taken up first. If the system is sustainable in
source then quality attribute becomes the second core for measurement of sustainability.
Therefore the analysis becomes ‘sequential supervaluationism’ in nature. The first core
analysis shows that about 10% of 789 systems are non sustainable in source, highest in
Kozhikode and the least in Malappuram. The remaining sustainable systems in core 1, is
further analysed for core 2 i.e. quality. The results show that 35% of 710 systems are
found to be core non sustainable in quality, the highest in Palakkad and the lowest in
Kozhikode. Sequantial supervaluationism suggests that about 41% of the systems are non
sustainable in core attributes (source and quality). It varies from 36.4% in Palakkad to
52% in Trichur. According to supervaluationist theory the remaining 464 systems are
either super sustainable or in the margins of sustainability. However lack of information
limits the estimation of super sustainable systems. Hence all the 464 systems are treated
as systems belonging to margins of sustainability for policy prescriptions. But for the
estimation data limitations restrict the number to 453.
For policy purposes one needs to identify systems in the marginal group for immediate
intervention. This group for immediate policy intervention is obtained by applying fuzzy
inference system (VW method) in degree theory. Fuzzy inference analysis shows that 151
schemes are in transition towards non-sustainability. This is highest in Trichur and lowest
in Palakkad.
A preliminary investigation of relating other socio-economic variables to sustainability
indirectly indicates that gender has an important role in the sustainability of systems and
female education a partial role. Income of the households does not show any systematic

15
relation ship to sustainability, which may be due to the survival nature of the commodity
for life.
The study clearly shows the immediate intervention of policy makers by introducing
institutional innovations and appropriate governance structure.
* Paper presented in the Development Economics Seminar series organized by the School
of Social Sciences, University of Manchester, UK, on 12th
February 2008. Authors
express their sincere thanks to Kunal Sen for the invitation, and T.G. Arun and Katsushi
Imai for organizing the seminar. We owe our deep indebtedness to V.N.
Balasubramaniam, Lancaster Business School, Lancaster University for enabling us to
present the paper. The services of Soni Paul are duly acknowledged for computational
assistance. Of course the usual disclaimer applies.
1
Figure 4. Operational version of Basic Framework
Box 4.6 –
Set of
Sustainable
Systems
Box 4.5.1-
Degree Theory:
Fuzzy Inference
Systems – VW
method
Box 4.5 - Non core
attributes – ( I,F,H)
Box-4.1
Set of
Water
Supply
Systems
Box4.4-Core Attributes
S & T, Q
Box 4.2 - Factors of Sustainability
Source (S)
Technology (T)
Quality (Q)
Institutions (I)
Finance (F)
Human Behaviour (H)
Box 4.5.2-Filter
III – Systems
Vulnerable to
Sustainability eliminated
Box -4.3Measured
Attributes of
Sustainability
Source adequacy
(S&T)
Perceived quality (Q)
Record keeping (I)
Social Audit (I),
General body -
meeting,(I)
Distribution Equity -
(T&I),
Cost recovery (F)
Prevalence of open -
defecation (H)
Box 4.4.1-Filter I
Supervaluationism -
Source (S&T) - Non
sustainable systems eliminated
Box 4.4.2- Filter II
Supervaluationism -
Quality (Q) – Systems
of poor water quality
eliminated

2
�����������
Asian Development Bank, (2006), Piloting Participatory Assessment – Methodologies in
Sri Lanka and Vietnam, Project No: TA – 6224 – REG. www.adb.org
Biswas, A.K. (2006), “Water Management and Environmental Challenge” in Biswas,
A.K. and Tortajada, C. (ed) Towards a Sustainable Water Systems, Oxford University
Press, New Delhi.
Census, (1991), Government of India, New Delhi, Final Population Totals.
Census, (2001) Government of India, New Delhi, Final Population Totals.
Deutsch, J. and Silber, J. (2006), “The Fuzzy Set Approach to Multidimensional Poverty
Analysis: Using the Shapley Decomposition to Analyze the Determinants of Poverty in
Israel” in Lemmi, A. and Betti, G. (ed), Fuzzy Set Approach to Multidimensional
Poverty Measurement, Springer Science and Business Media, New York.
Fustier, B. (2006), “The Mathematical Frame Work for Fuzzy Logic” in Lemmi, A. and
Betti, G. (ed), Fuzzy Set Approach to Multidimensional Poverty Measurement, Springer
Science + Business Media, New York.
Government of India (GOI), (2007), Bharat Nirman Programme, Ministry of Rural Areas
and Employment, Rajiv Gandhi National Drinking Water Mission, NewDelhi.
http://ddws.gov.in.bharatnirman.water.html
---- (2007), www. jalanidhi.com
Hopwood,B, Mellor, M, and O’Brien,G. (2005), Sustainable Development : Mapping
Different Approaches, Sustainable Development Vol XIII, pp.38-52.
Martinetti, E.C, (2006a), “Capability Approach and Fuzzy Set Theory: Description,
Aggregation and Inference Issues” in Lemmi, A. and Betti, G. (ed), Fuzzy Set Approach
to Multidimensional Poverty Measurement, Springer Science + Business Media, New
York.
…., (2006b), “Complexity and Vagueness in the Capability Approach: Stengths or
Weaknesses” University of Pavia, Italy, (Mimeo)
National Sample Survey Organisation (NSSO), (1998), Housing Condition in India -
Report No.429, Government of India (GOI), Ministry of Statistics and Programme
Implementation, New Delhi. http://mospi.nic.in
-----------, (2004), Housing condition in India - Report No.488, Government of India
(GOI),Ministry of Statistics and Program Implementation, New Delhi. http://mospi.nic.in

3
North, D.C. (1990), Institutions, Institutional Change and Economic Performance,
Cambridge University Press, Cambridge.
…., (2006), “Social Returns from Drinking Sanitation and Hygiene Education,” The
ICFAI Journal of Urban Policy, Vol.1, No. 2, pp. 16-32.
Pushpangadan, K, and Murugan, G, (2007), Dynamics of Rural Water Supply in Coastal
Kerala: A Sustainable Development View, Paper presented in the National Seminar on
‘Crisis in Drinking Water’ organised by the Centre for Development Alternatives,
Gandhinagar, Gujarat.
----------- (2008): Technical note Part B, in Report on Sustainability Evaluation Exercise
Vth series, submitted to World Bank New Delhi, Mimeo.
----, -----, and Navaneetham, K. (1996), Travel Time, User Rate and Cost of Supply:
Drinking Water in Kerala, India. Working Paper No: 266, Centre for Development
Studies, Trivandrum.
Qizilbash, M. (2001), Vague Language and Precise Measurements: The Case of Poverty,
Discussion Paper No. 20001-5, School of Economic and Social Studies, University of
East Anglia, UK.
----, (2006), “Philosophical Accounts of Vagueness, Fuzzy Poverty Measures and
Multidimentionality,” in A. Lemmi and G. Betti (eds), Fuzzy Set Approach to
Multidimensional Poverty Measurement, Springer Science + Business Media, New York.
Solow, R. (1993), “An Almost Practical Step Towards Sustainability,” Resources Policy;
p.162,172
----, (2000), “Sustainability: An Economist’s Perspective,” in Robert N. Stavins (ed)
Economics of Environment, W.W. Norton & Co, New York.
Tortajada,C, (2006), “Sustainable Development: A Critical Assessment of Past and
Present”, in Biswas, A.K. and Tortajada, C. (ed) Towards a Sustainable Water Systems,
Oxford University Press, New Delhi.
Vero, J. (2006), “A Comparison of Poverty According to Primary Goods, Capabilities
and Outcomes: Evidence from French School Leavers’ Surveys,” in A. Lemmi and G.
Betti (eds), Fuzzy Set Approach to Multidimensional Poverty Measurement, Springer
Science + Business Media, New York.
World Bank (2000), Project Appraisal Document on Kerala Rural Water Supply and
Environmental Sanitation Project, New Delhi (Mimeo)
World Commission on Environment and Development (Brundtland Commission) (1987),
Our Common Future, Oxford University Press, London.