on the origin of hot spots: a study of method in the ... · on the origin of hot spots: a study of...
TRANSCRIPT
On the Origin of Hot Spots:A Study of Method in
the Statistical Analysis Thereof
Oliver HatfieldSupervisor: Dr Jochen Einbeck
23rd May 2014
Oliver Hatfield
On the Origin of Hot Spots
Introduction - Volcanoes and Hot Spots
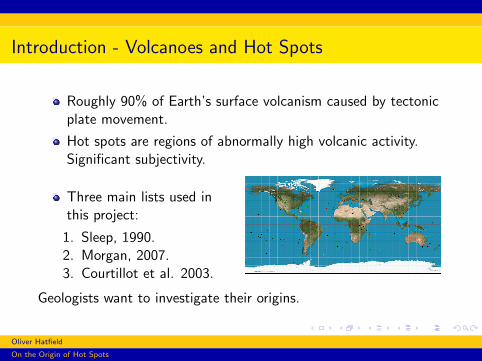
Roughly 90% of Earth’s surface volcanism caused by tectonicplate movement.
Hot spots are regions of abnormally high volcanic activity.Significant subjectivity.
Three main lists used inthis project:
1. Sleep, 1990.2. Morgan, 2007.3. Courtillot et al. 2003.
Geologists want to investigate their origins.
Oliver Hatfield
On the Origin of Hot Spots
The Plume Hypothesis
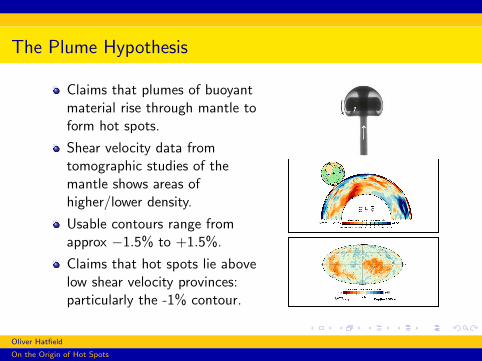
Claims that plumes of buoyantmaterial rise through mantle toform hot spots.
Shear velocity data fromtomographic studies of themantle shows areas ofhigher/lower density.
Usable contours range fromapprox −1.5% to +1.5%.
Claims that hot spots lie abovelow shear velocity provinces:particularly the -1% contour.
Oliver Hatfield
On the Origin of Hot Spots
The Plate Hypothesis
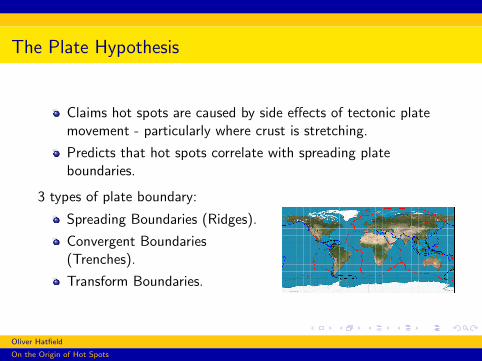
Claims hot spots are caused by side effects of tectonic platemovement - particularly where crust is stretching.
Predicts that hot spots correlate with spreading plateboundaries.
3 types of plate boundary:
Spreading Boundaries (Ridges).
Convergent Boundaries(Trenches).
Transform Boundaries.
Oliver Hatfield
On the Origin of Hot Spots
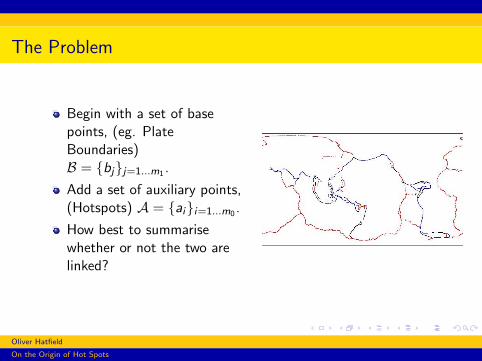
The Problem
Begin with a set of basepoints, (eg. PlateBoundaries)B = {bj}j=1...m1 .
Add a set of auxiliary points,(Hotspots) A = {ai}i=1...m0 .
How best to summarisewhether or not the two arelinked?
Oliver Hatfield
On the Origin of Hot Spots
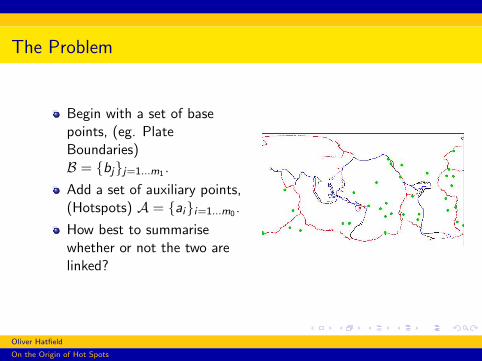
The Problem
Begin with a set of basepoints, (eg. PlateBoundaries)B = {bj}j=1...m1 .
Add a set of auxiliary points,(Hotspots) A = {ai}i=1...m0 .
How best to summarisewhether or not the two arelinked?
Oliver Hatfield
On the Origin of Hot Spots
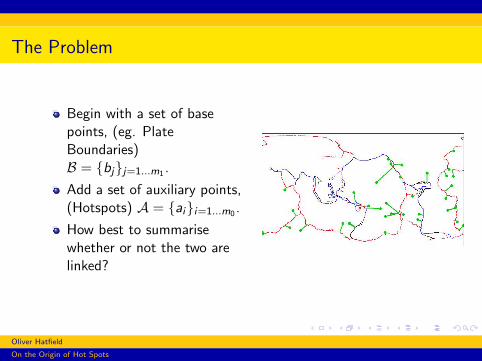
The Problem
Begin with a set of basepoints, (eg. PlateBoundaries)B = {bj}j=1...m1 .
Add a set of auxiliary points,(Hotspots) A = {ai}i=1...m0 .
How best to summarisewhether or not the two arelinked?
Oliver Hatfield
On the Origin of Hot Spots
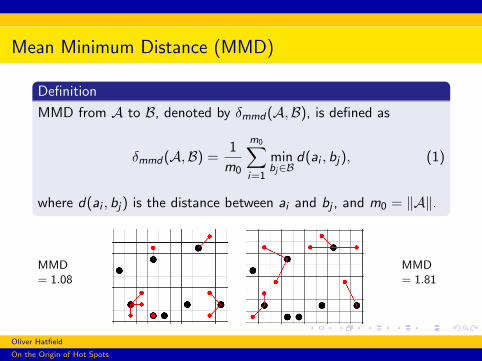
Mean Minimum Distance (MMD)
Definition
MMD from A to B, denoted by δmmd(A,B), is defined as
δmmd(A,B) =1
m0
m0∑i=1
minbj∈B
d(ai , bj), (1)
where d(ai , bj) is the distance between ai and bj , and m0 = ‖A‖.
MMD= 1.08
MMD= 1.81
Oliver Hatfield
On the Origin of Hot Spots

Assessing Correlation Strength
Estimate P(X ≤ xA), where xA is the observed MMD from A toB, and X is a random variable for δmmd(C,B), for a random set C.
Method 1: Monte Carlo method.Take n samples of new points, Ck , and let Xk be the MMD ofset Ck to B. Let pA = 1
n
∑nk=1 1Xk≤xA .
E (pA) =1
n
n∑k=1
E (1Xk≤xA)
= P(X ≤ xA)
Oliver Hatfield
On the Origin of Hot Spots
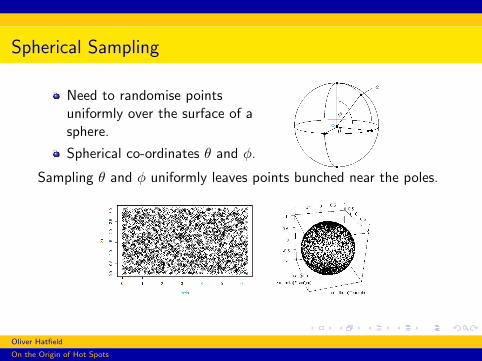
Spherical Sampling
Need to randomise pointsuniformly over the surface of asphere.
Spherical co-ordinates θ and φ.
Sampling θ and φ uniformly leaves points bunched near the poles.
Oliver Hatfield
On the Origin of Hot Spots
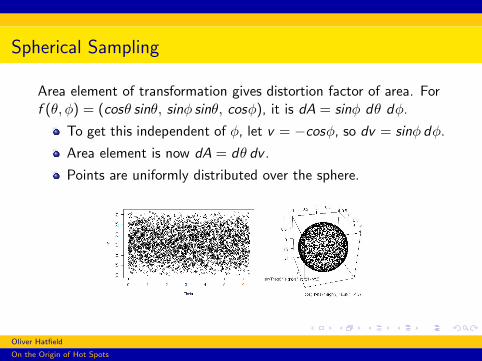
Spherical Sampling
Area element of transformation gives distortion factor of area. Forf (θ, φ) = (cosθ sinθ, sinφ sinθ, cosφ), it is dA = sinφ dθ dφ.
To get this independent of φ, let v = −cosφ, so dv = sinφ dφ.
Area element is now dA = dθ dv .
Points are uniformly distributed over the sphere.
Oliver Hatfield
On the Origin of Hot Spots

Assessing Correlation Strength
Method 2 - Central Limit Theorem:Let minbj d(ai , bj) = di .
δmmd(A,B) =1
m0
m0∑j=1
minbj∈B
d(ai , bj) = d . (2)
Therefore d−µs/√m0∼ N (0, 1), by the Central Limit Theorem.
Thus, estimate P(X ≤ xA) using a normal distribution.Estimate µ and s from sample output.
Oliver Hatfield
On the Origin of Hot Spots
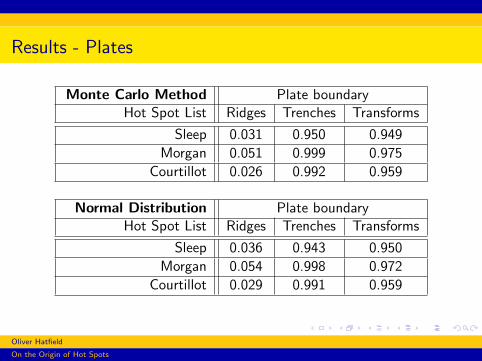
Results - Plates
Monte Carlo Method Plate boundaryHot Spot List Ridges Trenches Transforms
Sleep 0.031 0.950 0.949
Morgan 0.051 0.999 0.975
Courtillot 0.026 0.992 0.959
Normal Distribution Plate boundaryHot Spot List Ridges Trenches Transforms
Sleep 0.036 0.943 0.950
Morgan 0.054 0.998 0.972
Courtillot 0.029 0.991 0.959
Oliver Hatfield
On the Origin of Hot Spots

Plates - Randomisation
To see if hot spot lists were subjectively chosen to minimise MMD,randomise sets of hot spots from across all lists, find pA for each.
Oliver Hatfield
On the Origin of Hot Spots
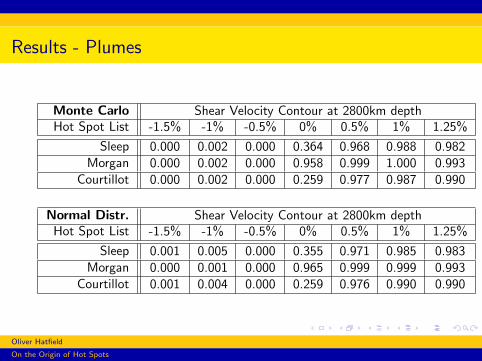
Results - Plumes
Monte Carlo Shear Velocity Contour at 2800km depthHot Spot List -1.5% -1% -0.5% 0% 0.5% 1% 1.25%
Sleep 0.000 0.002 0.000 0.364 0.968 0.988 0.982Morgan 0.000 0.002 0.000 0.958 0.999 1.000 0.993
Courtillot 0.000 0.002 0.000 0.259 0.977 0.987 0.990
Normal Distr. Shear Velocity Contour at 2800km depthHot Spot List -1.5% -1% -0.5% 0% 0.5% 1% 1.25%
Sleep 0.001 0.005 0.000 0.355 0.971 0.985 0.983Morgan 0.000 0.001 0.000 0.965 0.999 0.999 0.993
Courtillot 0.001 0.004 0.000 0.259 0.976 0.990 0.990
Oliver Hatfield
On the Origin of Hot Spots
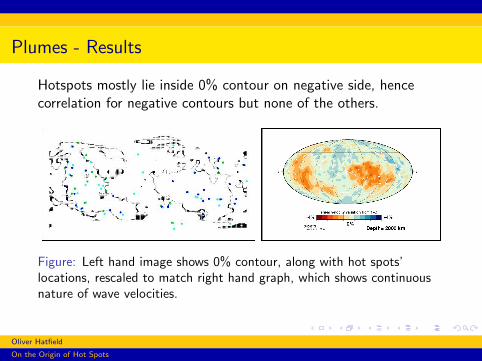
Plumes - Results
Hotspots mostly lie inside 0% contour on negative side, hencecorrelation for negative contours but none of the others.
Figure: Left hand image shows 0% contour, along with hot spots’locations, rescaled to match right hand graph, which shows continuousnature of wave velocities.
Oliver Hatfield
On the Origin of Hot Spots

Plumes - Randomisation
To see if hot spot lists were subjectively chosen to minimise MMD,randomise sets of hot spots from across all lists, find pA for each.
Oliver Hatfield
On the Origin of Hot Spots
Conclusion
MMD is a characteristic which summarises the closeness oftwo sets of points.
Plate Hypothesis predicts that hot spots correlate withspreading plate boundaries, but not the others. MMD agreeswith this.
Plume Hypothesis observes (but does not appear to predict)that hotposts correlate with −1% shear wave velocity contour.MMD confirms this, but nothing unique about that contour.
Results are marginally stronger for plumes than plates.
Correlation does not imply causation!
Oliver Hatfield
On the Origin of Hot Spots
References
Foulger, Gillian R
Plates vs Plumes.
Wiley-Blackwell, (2010).
Sleep, N. H.
Hotspots and Mantle Plumes: Some Phenomenology
Journal of Geophysical Research, 95: 6715-6736 (1990).
Morgan, W.J. and Phipps Morgan, W.
Plate velocities in the hotspot reference frame
Geological Society of America, 430: 65 - 78 (2007).
Courtillot, V. , Davaillie, A. , Besse, J. et al.
Three distinct types of hotspots in the Earth’s mantle .
Earth and Planetary Science Letters, 205 : 295-308 (2003).
Oliver Hatfield
On the Origin of Hot Spots