on the use of a measurement correlation service for
TRANSCRIPT
On the Use of a Measurement Correlation Servicefor Measurement Federations
Jeferson Campos Nobre∗, Leandro Lisboa Penz†, Muriel Figueredo Franco ‡, Lisandro Zambenedetti Granville‡∗ University of Vale do Rio dos Sinos, Brazil
† Arista Networks, Ireland‡ Federal University of Rio Grande do Sul, Brazil
[email protected], [email protected], {mffranco, granville}@inf.ufrgs.br
Abstract—The diversity of services that operate in the In-ternet has increased significantly in the last years. Performanceproblems in these services cause important financial losses. Toensure that these problems do not occur, service levels need tobe monitored. One of the main techniques for such monitoringinvolves the use of active measurement mechanisms. However,these mechanisms are expensive in terms of resources consump-tion due to the activation of measurement sessions. Measurementsessions usually cover only a fraction of what could be measured,which leads to service level problems being missed. Measurementfederations can help network administrators in different tasks,such as controlling the activation of active measurement sessions.In this context, measurement correlation can be deployed in orderto improve this control in such federations. The main contributionof the present work is the proposal of a data transformationservice that provides measurement correlation. This service isused to enable cooperation features in measurement federations,while decreasing resource consumption. Besides that, statisticaltests that can be used to compose such correlation are presented.The proposed solution is evaluated using an active measurementdataset from the Brazilian National Research and EducationNetwork (Rede Nacional de Ensino e Pesquisa - RNP). Ourresults provide insights regarding measurement correlation fromfederated measurement points and can be used for the design ofbetter application to control active measurement sessions.
I. INTRODUCTION
Significant progress has been made in increasing the ca-pacity and accessibility of networking infrastructures overthe last decades. Alongside, the diversity of applications andservices that operate in such infrastructures has increasedas well. Unfortunately, such progress is not always directlytranslated into improved performance of all applications andusers. Performance issues can vary because of traffic con-gestion to packet loss caused by intermediate link failures.Service level monitoring tools must be scalable and capable ofdetecting performance issues in a timely and efficient manner.Considering such tools, measurement mechanisms are one ofthe most used.
Service level monitoring can be performed using either pas-sive or active mechanisms. Network conditions are monitoredin a non-intrusive way with passive mechanisms (e.g., IP FlowInformation EXport - IPFIX [1]), since traffic is not createdby the monitoring process itself. Active measurements (e.g.,One-Way Active Measurement Protocol - OWAMP [2]), onthe other hand, are intrusive because they inject monitoringtraffic on the network infrastructure to deliver performancemetrics. The service level monitoring is usually performedthrough active mechanisms because it usually presents betteraccuracy and privacy features than passive ones. On the basisof active mechanisms, a larger monitoring coverage increasesthe consumed resources (e.g., CPU cycles and memory foot-
print) and network load due to the amount of sessions activatedto measure a destination. The best practice to tackle thisproblem is to define the measurement sessions considering theexpertise and knowledge of the network administrator. For this,measurement federations can be a valuable tool.
Measurement federations could help network operatorstroubleshoot perceived abnormalities as well as improve net-work middleware regarding service level issues. Examples ofthose federations are the ones implemented using the PER-Formance Service Oriented Network monitoring ARchitecture(perfSONAR) toolkit [3]. In this context, active measurementmechanisms are one of the most important measurementtools in such federations. However, the sole employment ofa measurement federation does not improve the capabilitiesof these mechanisms in important aspects, such as scalabilityand efficiency. The current best practice regarding activemeasurements mechanisms, for example, usually covers only afraction of the network flows that should be observed in orderto save resources. This can lead to performance problems beingmissed. Besides, this practice is labor-intensive for the networkadministrator and inefficient considering highly dynamic net-work infrastructures, since administrator reactions are neces-sary to reconfigure the active measurement mechanisms formonitoring different network destinations. On the basis ofthese issues, novel approaches are needed to improve theoperation of active measurement mechanisms in measurementfederations.
Despite the fact that measurement federations are com-posed of programmable nodes, control loops are not used formeasurement sessions activation. It makes difficult the employ-ment of active mechanisms. However, approaches based onmeasurement correlation have been effective to enable controlloops for measurement session activation [4]. Based on this,in this paper, we present a solution to enable the measurementcorrelation on federations. This solution extends some of ourpreliminary concepts and results [5]. The main contributionsof this work are: i) the support for improved measurementcoverage considering federations with significant measurementcorrelation among participating nodes; ii) the definition ofa measurement correlation service considering a well-knownmeasurement federation; and iii) the analysis of statistical teststo perform measurement correlation. The proposed solutionwas evaluated using a dataset from MonIPE, a perfSONAR-based measurement federation related to the IPE Network. Thisnetwork is supported by the Brazilian National Research andEducation Network (Rede Nacional de Ensino e Pesquisa -RNP).
The remaining of this paper is organized as follows. InSection II, we describe the background and related work on
2018 IEEE Symposium on Computers and Communications (ISCC)
978-1-5386-6950-1/18/$31.00 ©2018 IEEE 00243

active measurement mechanisms and measurement federations.In Section III, we detail our proposal to introduce destinationcorrelation in measurement federations. In Section IV, wepresent an experimental evaluation. Finally, in Section V, wediscuss conclusions and future work.
II. BACKGROUND AND RELATED WORK
In this section, we first cover one of the most promi-nent active measurement mechanisms, the One-way ActiveMeasurement Protocol (OWAMP), which is designed to mea-sure one-way latency, packet loss, packet duplication, andjitter on an end-to-end basis. After that, some widely knownmeasurement federations are presented. In addition, we detailthe perfSONAR, a network measurement toolkit that providesfederated measurements. Finally, we present the related work.
A. One-way Active Measurement Protocol
The IETF IP Performance Metrics (IPPM) Working Group(WG) proposed open mechanisms that permit the exchangeof packets to collect metrics for one-way (One-way ActiveMeasurement Protocol - OWAMP) [2] packet delay and lossacross Internet paths in an interoperable manner. OWAMPactually consists of two inter-related protocols: OWAMP-Control and OWAMP-Test. OWAMP-Control is layered overTCP and used to initiate, start, and stop test sessions andfetch their results. OWAMP-Test, on the other hand, uses UDPto exchange test packets between two measurement nodes.Together, these protocols enable the standardized execution ofone-way measurements.
The OWAMP tool is an implementation of OWAMP,developed by the Internet2 Consortium. This tool comprisesseveral applications for the execution of active measurementtasks, such as owping and owstats. One of these applicationsis powstream, which creates a continuous stream of one-way latency tests by aligning together multiple OWAMP testsessions. This application works by contacting a daemon onthe remote host. Powstream produces data in two formats: rawowamp data files and summary statistics. The data files arethe same binary format saved from owping and can be parsedusing owstats.
B. Measurement Federations
Sophisticated tools are necessary to monitor large andcomplex networks, since this requires a great deal of effort andexpertise from network administrators. Network measurementtoolkits can encompass monitoring and diagnostic tools inorder to aid administrators on their daily tasks. In this context,measurement federations are defined as a group of integratedmanagement stations running such toolkits.
Measurement federations can aid network administratorteams and increase productivity considering available compu-tational and human resources. The focus of these federations isto provide a measurement infrastructure capable of monitoringnetwork performance and troubleshooting related issues. Someexamples of such federations are the PERFormance ServiceOriented Network monitoring ARchitecture (perfSONAR) andthe Measurement Lab (M-Lab).
The perfSONAR, which is key to this paper, is a net-work measurement toolkit designed to provide federated mea-surements. It is the result of an international collaborationfor network monitoring, composed of several organizations,such as Internet2, Energy Sciences network (ESnet), Indi-ana University, and the GEANT Project. There are several
perfSONAR instances deployed world wide and many ofwhich are available for open testing. The perfSONAR toolkitincludes OWAMP, Bandwidth Test Controller (BWCTL), andnuttcp tools. Besides that, the toolkit provides an interface formeasurement scheduling, storage of data in uniform formats,and scalable methods to retrieve data. Figure 1 depicts thearchitecture of perfSONAR measurement framework.
Fig. 1. perfSONAR Measurement Architecture.
There is an inherent human and computational cost relatedto the deployment of active measurement mechanisms, such asOWAMP, and their continuous operation, i.e., the managementof measurement sessions. This cost is strongly influencedby the size and complexity of the network infrastructure.Even using measurement federations, these costs decrease themeasurement coverage, because it is usually not possible tomonitor all network flows. In this context, solutions to improvethe control of measurement mechanisms as well as increasetheir efficiency are vital.
C. Related Work
The use of measurement correlation to tackle the problemof SLA monitoring was investigated in the context of some re-search initiatives over the past years. Some of these initiativesare discussed as follows.
Abdelkefi et al. [6] proposed an approach called “Service-quality Characterization of Internet-path” (SCI) to detectabrupt changes in network metrics using active measurements.SCI uses delay and loss measurements collected from vantagepoints at the two ends of an Internet path. These measure-ments are transformed into performance signals, in whichabrupt changes are detected using Principal Component Pursuit(PCP). The detected abrupt changes in aggregate delay andaverage delay, together with the loss information, are furthermapped as different types of events causing degradations andfailures in the service within the path. The authors evaluatedon the dataset collected from a real operational environment.
Zhang et al. [7] investigated a “content filter”-based mea-surement recommendation scheme that recommends pertinentmeasurement traces from a pool of candidate samples to assistnetwork operators and application users. Such recommenda-tions are complimented with Bayesian Inference-based domain
2018 IEEE Symposium on Computers and Communications (ISCC)
978-1-5386-6950-1/18/$31.00 ©2018 IEEE 00244
reputation meta-information to strengthen the veracity informa-tion of the recommended traces. The proposed scheme ranksand recommends the most pertinent traces based on similaritymatching with a target trace/path for which the operator/userneeds help to perform some specific measurement correlationanalysis. However, the authors performed the evaluation onlyusing synthetic traces.
III. MEASUREMENT CORRELATION IN FEDERATIONS
Novel techniques in the area of monitoring and trou-bleshooting have been proposed to tackle resource consump-tion issues. One of the proposed concepts is the use of corre-lated peers to enable embedded and collaborative active SLAmonitoring [4]. Network devices are correlated peers whenthey have similar measurement results considering specificmetrics. The similarity is quantified through destination scores[4].
Destination scores [4] can be used to provide correlationfeatures in measurement federations (’ds’ in Equation 1).For example, specific parts of a network may require moreattention due to unexpected events. Thus, the moving averagedistance of past measurement results to Service Level Objec-tive (SLO) for the destinations can increase the probabilityof measuring such destinations. As depicted in Equation 1,this average consists of calculating the simple arithmetic meanover values contained in fixed-size subset of a time series(window size, ’ws’ in Equation 1) which is permanently shiftedas new data arrives (sliding window). Besides that, the timeelapsed from the last measurement for a given destinationalso composes the destination score. This aims at maintainingfrequent measurements on destinations.
ds = (1
ws
i+ws−1∑
j=i
aj) + ts (1)
In this section, we present an architecture to deploy mea-surement correlation considering the perfSONAR toolkit. Inaddition, we describe some statistical tests that can be usedfor such correlation.
A. Proposed Architecture
We instantiate our proposed architecture considering theperfSONAR toolkit. This choice is based on the deployedinfrastructure on the Brazilian NREN (MonIpe). The keyconcept of perfSONAR is that each service performs a net-work performance measurement and analysis function. Someexamples of such services are Measurement Point (initiationof performance tests), Measurement Archive (performancemonitoring results storing), Transformation Service (operationson data sets), Resource Protector (arbitration on the resourcesconsumption), and Lookup (locating other instances).
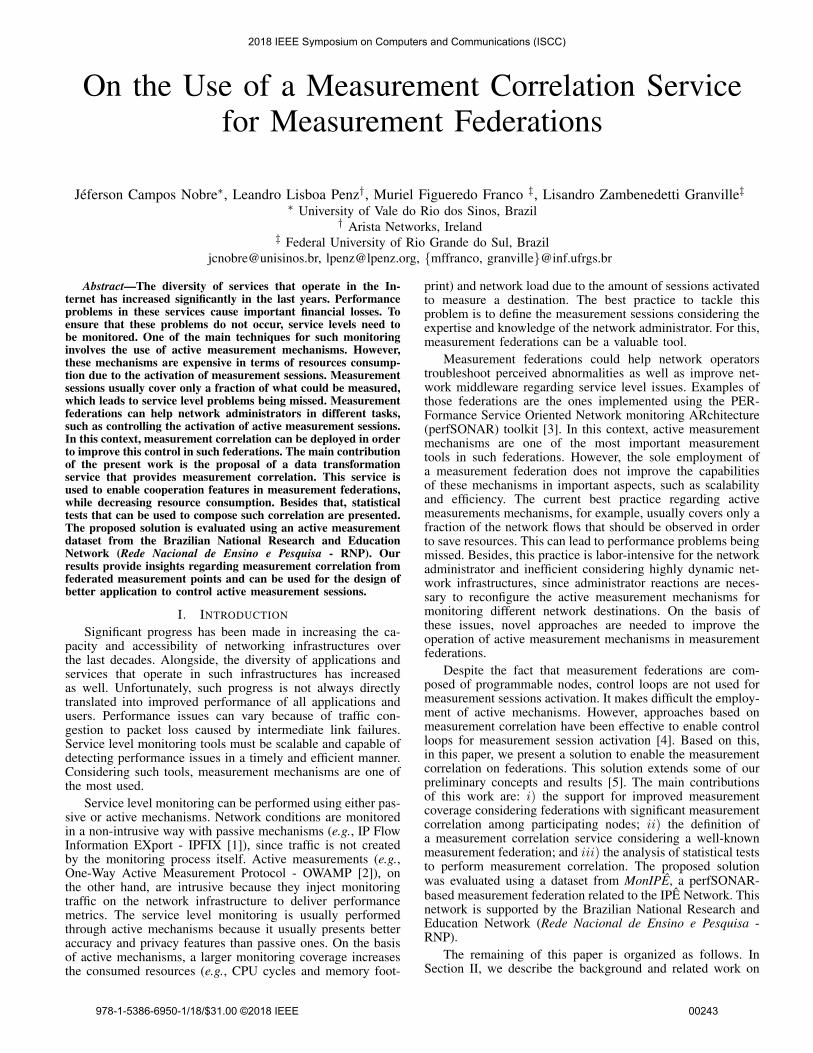
In order to support measurement correlation, we describea Transformation Service (TrS) for Measurement Correlation(MC). The flow and basic operations of our architecture arepresented in Fig. 3. TrSs perform operations on data sets thathave potential to be stored and replayed. Thus, this serviceprovides a conduit for popular operations. Some roles of TrSsare aggregation, concatenation, correlation, and translation.The TrS MC uses the Measurement Archive (MA) serviceto collect raw and aggregated OWAMP powstream data fromthe perfSONAR Measurement Points (MPs). Then, statisticalfunctions are employed to compare collected measurementsresults. The result of a TrS MC operation is the evaluation of
Transformation Service:Measure Correlation
(TrS MC)
MeasurementArchive(MA)
correlationresults
MeasurementPoint(MP)
activationrequest
correlationdata
measurementsample
Fig. 2. Architecture flow and basic operations
destination scores. It is not necessary to run the MC TrS onthe same machine providing the MA service.
The TrS MC is designed to run statistics over changingdatasets. Thus, it can collect measurement results betweenarbitrary points and considers distributed services, i.e., it canbe deployed in different federation nodes regarding MA andMP services. In this context, the TrS MC is compatible witharchitectures for federated measurement that provide a backendfor measurement results storage and a defined interface for datacollection and sharing. Besides, the measurement correlationcan be further automated if the federation supports registrationmanagement and location of distributed services.
B. Statistical Tests for Measurement Correlation
We propose the use of parametric and non-parametricstatistics for measurement correlation. Statistical hypothesesabout parameters concern the behavior of observable randomvariables. In parametric tests, the hypothesis is that the datafollows a probability distribution model that can be describedby a fixed set of parameters. Thus, it is possible to use theparameters to infer the probability of seen and unseen values.Some parametric statistics, for instance, assume a Normalunderlying data distribution that has, as parameters, a fixed(maybe unknown) mean and variance. On the other hand, non-parametric statistics assume no probability distribution for thedata, and do not use probability distribution parameters. Inthe present work, we employ parametric and non-parametricstatistics which can be divided in two classes: correlationcoefficients and distribution tests.
The measurement correlation can be performed using cor-relation coefficients produced by different tests. Such coef-ficients are a measure of statistical dependency between 2random variables, varying between -1 (total negative correla-tion) and +1 (total positive correlation). The Pearson product-moment correlation coefficient is a parametric correlationmeasure that represents the linear dependency between twovariables. In addition, non-parametric correlation tests, suchas the Spearman rank correlation coefficient and the Kendallrank correlation coefficient can be also used.
The distribution tests are used to verify whether samplesoriginate from the same distribution, usually providing ameasure that varies between 0 and +1 (statistical significance).The Student’s t-test (null hypothesis assumes that the meansand variances of two samples are equal) and Welch’s t-test(null hypothesis assumes that only the means of two samplesare equal). These tests are generalized as Analysis of Variance(ANOVA) tests. Since t-tests consider statistical parameters,they are classified as parametric tests. For exactness, it isrequired normality of the samples. Besides, t-test requires thatthe sample variance follows a scaled χ
2 distribution. In order
2018 IEEE Symposium on Computers and Communications (ISCC)
978-1-5386-6950-1/18/$31.00 ©2018 IEEE 00245

Fig. 3. Logical Topology of the Points of Presence of the IPE Network.
to avoid that, it is required a large sample size to decrease theeffect of the sample variance on such tests (Slutsky’s theorem).When the normality assumption does not hold, non-parametricstatistics should be considered. We propose the use of 3 non-parametric tests: the Kruskal-Wallis ANOVA, the WilcoxonSigned-Rank test, and the Kolmogorov-Smirnov test. Suchnon-parametric tests can often have better statistical power innon-normal data.
IV. EVALUATION
The objective of the evaluation described in this sectionis to assess the feasibility and effectiveness of a measurementcorrelation service considering different statistical tests. First,we depict the employed experimental setup. After that, we de-scribe the experiments performed using these dataset. Finally,a discussion about these experiments is presented.
A. Dataset
The set of traces used to perform the analysis of ourproposal are logs produced by the OWAMP powstream tool,which measures latency using a continuous stream of one-way tests between two hosts. The logs were collected fromthe perfSONAR deployment in the Monitoring Service of theIPE network (MonIPE). Operated by the Brazilian NREN(RNP). The IPE network is composed of 27 Points of Presence(PoPs), one in each Brazilian state. Figure 3 shows a graphillustrating the logical topology of the IPE network. EachPoP is represented by a square and identified by the nameof its host city. The connections are represented by the edges(data transfer rates are described using colors). Besides therepresented edges, smaller links connect up to 1200 campiand other university locations (e.g., research facilities andhospitals). The IPE network is connected to other NRENs,such as the Latin American Advanced Networks Cooperation(RedCLARA)1 and the american Internet22.
The powstream data were exported as compressed dumpsfrom the perfSONAR Measurement Archive (MA). Thesedumps contain measurements results from October, 2014.The powstream logs are stored as a structured databasein 3 tables: map events powstream, powstream, and pow-stream value buckets. The map events powstream table has
1RedCLARA - http://www.redclara.net/2Internet2 - http://www.internet2.edu/
-1
-0.5
0
0.5
1
0 50 100 150 200 250 300
Corr
ela
tion S
core
# Measurement
PearsonSpearman
Kendall
Fig. 4. Correlation Coefficients - Porto Alegre MP / Curitiba MPs → SaoPaulo MP.
measurement metadata (e.g., source/destination IP addresses).The powstream table stores general measurements propertiesmetrics (e.g., loss, minimum and maximum delay, and dupli-cates). The powstream value buckets table keeps the individ-ual measurements results, which come from the perfSONARMeasurement Points (MPs). The product of the 3 tables (i.e.,a SQL INNER JOIN) has approximately 700.000 lines perday. We employ an open data approach, thus the pre-processeddataset is shared through Harvard Dataverse [8].
In order to perform the evaluation of the proposed service,we pre-processed the logs through several steps accordingto the operation of the Transformation Service (TrS) forMeasurement Correlation (MC). The first step was to sort thedata by time and storing it in a raw CSV file that has onlythe delay information that we will be using. The second stepwas to use a moving average for the average delay so that wecan match measurement results even when they are recordedat slightly different times. We used a width of 30 minutes forthe moving average, producing samples at every 5 minuteswhen data is available. The pre-processing would be executedby another TrS (considering the perfSONAR architecture).After pre-processing, the TrS for MC retrieves matching datacorresponding to the measured delays of two paths insidethe network, and analyzes them using parametric and non-parametric correlation statistics.
B. Performed Experiments
The first experiment is the evaluation of the TrS MCconsidering measurements results from 2 perfSONAR MPs,Porto Alegre and Curitiba, towards another perfSONAR MP,Sao Paulo (all MPs are represented in Figure 3). We selectedthese MPs due to regional proximity (i.e., as a conveniencesampling). Then, these delay data is used to evaluate the TrSMC using different statistical tests.
We proposed in Section III to use correlation coefficientsand distribution tests to perform measurement correlation.Considering such coefficients, the Pearson product-momentcorrelation coefficient is used as the parametric correlation testand the Spearman rank correlation coefficient and the Kendallrank correlation coefficient are used as the non-parametriccorrelation tests. The results presented in the Figure 4 considerthe correlation of delay data from Porto Alegre MP andCuritiba MP towards Sao Paulo MP.
2018 IEEE Symposium on Computers and Communications (ISCC)
978-1-5386-6950-1/18/$31.00 ©2018 IEEE 00246
0
0.1
0.2
0.3
0.4
0.5
0.6
0.7
0.8
0.9
1
0 50 100 150 200 250 300
Corr
ela
tion S
core
# Measurement
StudentWelch
Kruskal-WallisWilcoxon
Kolmogorov���Smirnov
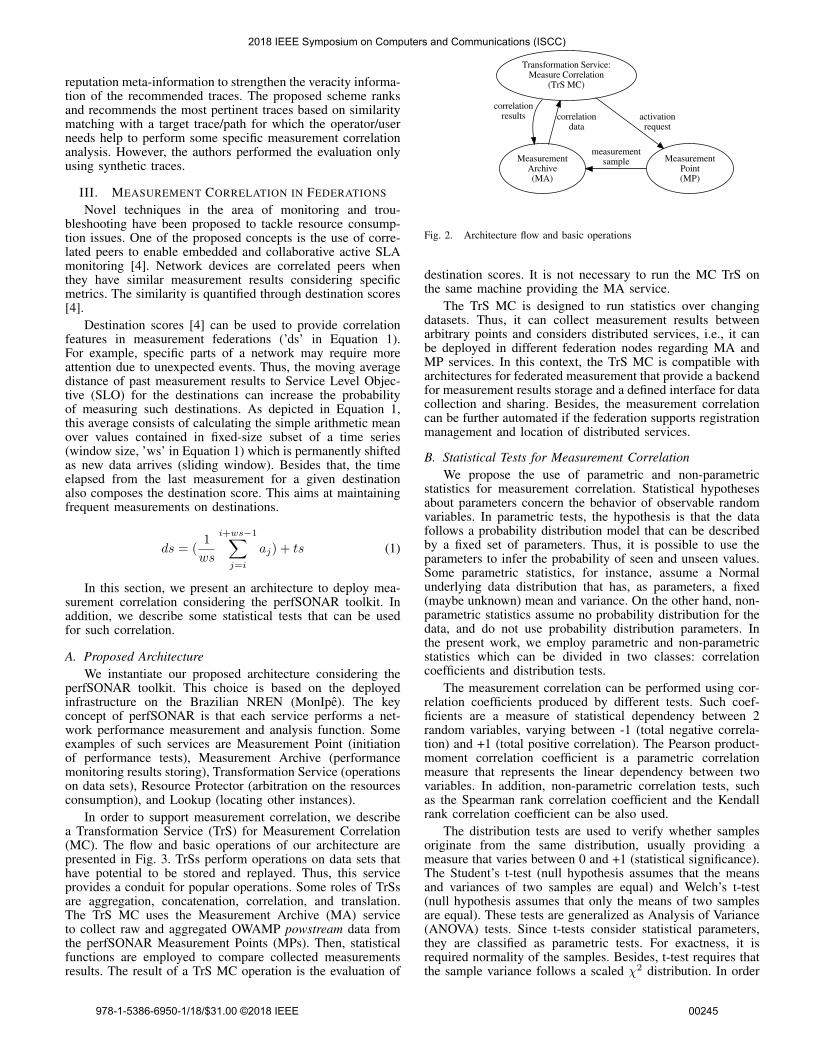
Fig. 5. Distribution Tests - Porto Alegre MP / Curitiba MPs → Sao PauloMP.
The different correlation coefficients depicted on the curvesof Figure 4 present a high concordance. In this context, itis possible to say that any of the coefficient can be used inthe TrS MC for the employed dataset. The Pearson product-moment correlation coefficient produce better results whennormality holds for sample data, thus, non-parametric tests canbe employed in more datasets. On the other hand, since therank correlation needs the definition of the ranks before theactual calculation of the correlation coefficient, this leads tomore costly computations.
The measurement correlation can be performed using dis-tribution tests. Such tests are used to verify whether samplesoriginate from the same distribution. In the present evaluation,we employed the tests described in Section III: the Student’s t-test and Welch’s t-test, both parametric; and 3 non-parametrictests, the Kruskal-Wallis ANOVA, the Wilcoxon Signed-Ranktest, and the Kolmogorov-Smirnov test. The results presentedin the Figure 5 consider the correlation of delay data fromPorto Alegre MP and Curitiba MP towards Sao Paulo MP.
The distribution tests depicted on the Figure 5 present amoderate concordance considering the employed dataset. Itis possible to say that the parametric t-tests (Student’s andWelch’s), the non-parametric Kruskal-Wallis ANOVA, and theWilcoxon Signed-Rank test had similar results. Thus, theycan be used in a similar manner in the TrS MC (consideringthe employed delay data). Regarding the Kolmogorov-Smirnovtest, the results diverge from the other tests.
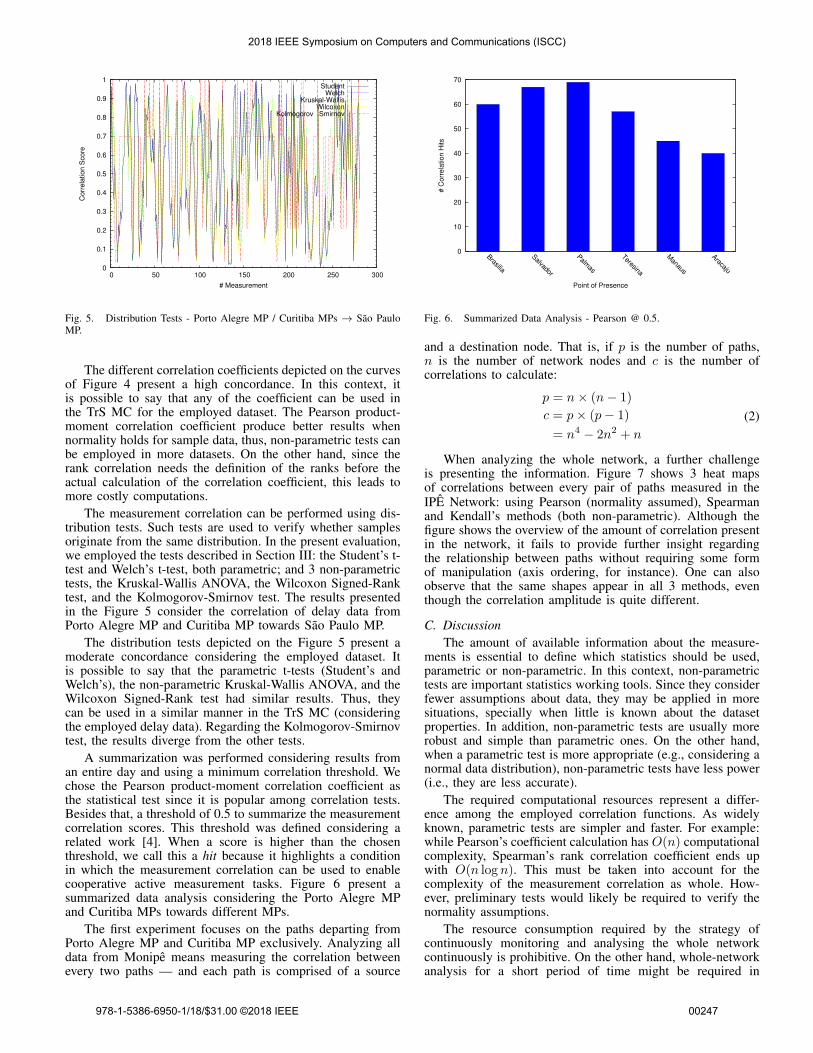
A summarization was performed considering results froman entire day and using a minimum correlation threshold. Wechose the Pearson product-moment correlation coefficient asthe statistical test since it is popular among correlation tests.Besides that, a threshold of 0.5 to summarize the measurementcorrelation scores. This threshold was defined considering arelated work [4]. When a score is higher than the chosenthreshold, we call this a hit because it highlights a conditionin which the measurement correlation can be used to enablecooperative active measurement tasks. Figure 6 present asummarized data analysis considering the Porto Alegre MPand Curitiba MPs towards different MPs.
The first experiment focuses on the paths departing fromPorto Alegre MP and Curitiba MP exclusively. Analyzing alldata from Monipe means measuring the correlation betweenevery two paths — and each path is comprised of a source
0
10
20
30
40
50
60
70
Brasilia
Salvador
Palmas
Teresina
Manaus
Aracaju
# C
orr
ela
tion H
its
Point of Presence
Fig. 6. Summarized Data Analysis - Pearson @ 0.5.
and a destination node. That is, if p is the number of paths,n is the number of network nodes and c is the number ofcorrelations to calculate:
p = n× (n− 1)
c = p× (p− 1)
= n4− 2n2 + n
(2)
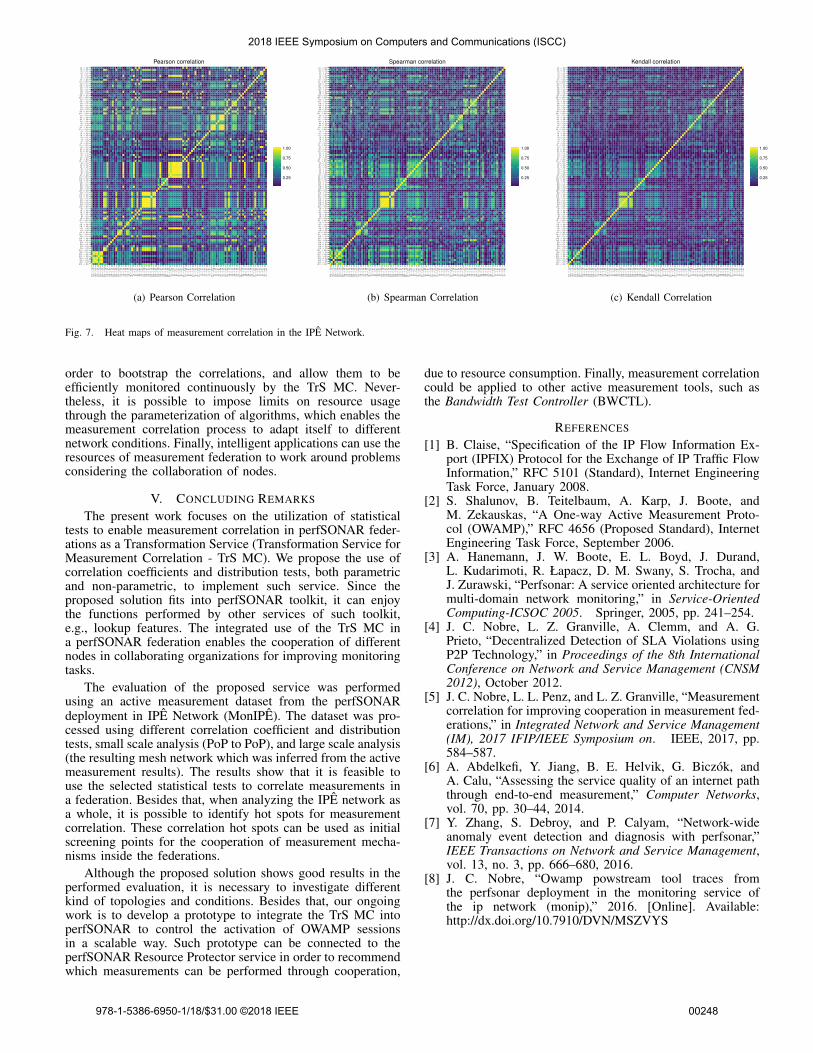
When analyzing the whole network, a further challengeis presenting the information. Figure 7 shows 3 heat mapsof correlations between every pair of paths measured in theIPE Network: using Pearson (normality assumed), Spearmanand Kendall’s methods (both non-parametric). Although thefigure shows the overview of the amount of correlation presentin the network, it fails to provide further insight regardingthe relationship between paths without requiring some formof manipulation (axis ordering, for instance). One can alsoobserve that the same shapes appear in all 3 methods, eventhough the correlation amplitude is quite different.
C. Discussion
The amount of available information about the measure-ments is essential to define which statistics should be used,parametric or non-parametric. In this context, non-parametrictests are important statistics working tools. Since they considerfewer assumptions about data, they may be applied in moresituations, specially when little is known about the datasetproperties. In addition, non-parametric tests are usually morerobust and simple than parametric ones. On the other hand,when a parametric test is more appropriate (e.g., considering anormal data distribution), non-parametric tests have less power(i.e., they are less accurate).
The required computational resources represent a differ-ence among the employed correlation functions. As widelyknown, parametric tests are simpler and faster. For example:while Pearson’s coefficient calculation has O(n) computationalcomplexity, Spearman’s rank correlation coefficient ends upwith O(n log n). This must be taken into account for thecomplexity of the measurement correlation as whole. How-ever, preliminary tests would likely be required to verify thenormality assumptions.
The resource consumption required by the strategy ofcontinuously monitoring and analysing the whole networkcontinuously is prohibitive. On the other hand, whole-networkanalysis for a short period of time might be required in
2018 IEEE Symposium on Computers and Communications (ISCC)
978-1-5386-6950-1/18/$31.00 ©2018 IEEE 00247
am −> baam −> dfam −> piam −> pram −> seam −> spam −> toba −> am
ba −> dfba −> piba −> prba −> rsba −> seba −> spba −> to
ce −> amce −> bace −> dfce −> pice −> sece −> spce −> to
df −> amdf −> badf −> pidf −> prdf −> sedf −> spdf −> to
pa −> bapa −> dfpa −> pipa −> prpa −> rspa −> sepa −> sppa −> topb −> bapb −> dfpb −> pipb −> prpb −> rspb −> sepb −> sppi −> ampi −> bapi −> dfpi −> prpi −> rspi −> sepi −> sppi −> to
pr −> ampr −> bapr −> dfpr −> pipr −> rspr −> sepr −> sppr −> to
rs −> amrs −> bars −> dfrs −> pirs −> prrs −> sers −> sprs −> to
sc −> amsc −> basc −> dfsc −> pisc −> prsc −> sesc −> spsc −> to
se −> amse −> base −> dfse −> pise −> prse −> rsse −> spse −> to
sp −> amsp −> basp −> dfsp −> pisp −> prsp −> rssp −> sesp −> to
to −> amto −> bato −> dfto −> pito −> prto −> rsto −> seto −> sp
am
−>
ba
am
−>
df
am
−>
pi
am
−>
pr
am
−>
se
am
−>
sp
am
−>
to
ba
−>
am
ba
−>
df
ba
−>
pi
ba
−>
pr
ba
−>
rs
ba
−>
se
ba
−>
sp
ba
−>
to
ce
−>
am
ce
−>
ba
ce
−>
df
ce
−>
pi
ce
−>
se
ce
−>
sp
ce
−>
to
df −
> a
md
f −
> b
ad
f −
> p
id
f −
> p
rd
f −
> s
ed
f −
> s
pd
f −
> t
op
a −
> b
ap
a −
> d
fp
a −
> p
ip
a −
> p
rp
a −
> r
sp
a −
> s
ep
a −
> s
pp
a −
> t
op
b −
> b
ap
b −
> d
fp
b −
> p
ip
b −
> p
rp
b −
> r
sp
b −
> s
ep
b −
> s
pp
i −
> a
mp
i −
> b
ap
i −
> d
fp
i −
> p
rp
i −
> r
sp
i −
> s
ep
i −
> s
pp
i −
> t
op
r −
> a
mp
r −
> b
ap
r −
> d
fp
r −
> p
ip
r −
> r
sp
r −
> s
ep
r −
> s
pp
r −
> t
ors
−>
am
rs −
> b
ars
−>
df
rs −
> p
irs
−>
pr
rs −
> s
ers
−>
sp
rs −
> t
osc −
> a
msc −
> b
asc −
> d
fsc −
> p
isc −
> p
rsc −
> s
esc −
> s
psc −
> t
ose
−>
am
se
−>
ba
se
−>
df
se
−>
pi
se
−>
pr
se
−>
rs
se
−>
sp
se
−>
to
sp
−>
am
sp
−>
ba
sp
−>
df
sp
−>
pi
sp
−>
pr
sp
−>
rs
sp
−>
se
sp
−>
to
to −
> a
mto
−>
ba
to −
> d
fto
−>
pi
to −
> p
rto
−>
rs
to −
> s
eto
−>
sp
0.25
0.50
0.75
1.00
Pearson correlation
(a) Pearson Correlation
am −> baam −> dfam −> piam −> pram −> seam −> spam −> toba −> amba −> dfba −> piba −> prba −> rsba −> seba −> spba −> to
ce −> amce −> bace −> dfce −> pice −> sece −> spce −> to
df −> amdf −> badf −> pidf −> prdf −> sedf −> spdf −> to
pa −> bapa −> dfpa −> pipa −> prpa −> rspa −> sepa −> sppa −> topb −> bapb −> dfpb −> pipb −> prpb −> rspb −> sepb −> sppi −> ampi −> bapi −> dfpi −> prpi −> rspi −> sepi −> sppi −> to
pr −> ampr −> bapr −> dfpr −> pipr −> rspr −> sepr −> sppr −> to
rs −> amrs −> bars −> dfrs −> pirs −> prrs −> sers −> sprs −> to
sc −> amsc −> basc −> dfsc −> pisc −> prsc −> sesc −> spsc −> to
se −> amse −> base −> dfse −> pise −> prse −> rsse −> spse −> to
sp −> amsp −> basp −> dfsp −> pisp −> prsp −> rssp −> sesp −> to
to −> amto −> bato −> dfto −> pito −> prto −> rsto −> seto −> sp
am
−>
ba
am
−>
df
am
−>
pi
am
−>
pr
am
−>
se
am
−>
sp
am
−>
to
ba
−>
am
ba
−>
df
ba
−>
pi
ba
−>
pr
ba
−>
rs
ba
−>
se
ba
−>
sp
ba
−>
to
ce
−>
am
ce
−>
ba
ce
−>
df
ce
−>
pi
ce
−>
se
ce
−>
sp
ce
−>
to
df −
> a
md
f −
> b
ad
f −
> p
id
f −
> p
rd
f −
> s
ed
f −
> s
pd
f −
> t
op
a −
> b
ap
a −
> d
fp
a −
> p
ip
a −
> p
rp
a −
> r
sp
a −
> s
ep
a −
> s
pp
a −
> t
op
b −
> b
ap
b −
> d
fp
b −
> p
ip
b −
> p
rp
b −
> r
sp
b −
> s
ep
b −
> s
pp
i −
> a
mp
i −
> b
ap
i −
> d
fp
i −
> p
rp
i −
> r
sp
i −
> s
ep
i −
> s
pp
i −
> t
op
r −
> a
mp
r −
> b
ap
r −
> d
fp
r −
> p
ip
r −
> r
sp
r −
> s
ep
r −
> s
pp
r −
> t
ors
−>
am
rs −
> b
ars
−>
df
rs −
> p
irs
−>
pr
rs −
> s
ers
−>
sp
rs −
> t
osc −
> a
msc −
> b
asc −
> d
fsc −
> p
isc −
> p
rsc −
> s
esc −
> s
psc −
> t
ose
−>
am
se
−>
ba
se
−>
df
se
−>
pi
se
−>
pr
se
−>
rs
se
−>
sp
se
−>
to
sp
−>
am
sp
−>
ba
sp
−>
df
sp
−>
pi
sp
−>
pr
sp
−>
rs
sp
−>
se
sp
−>
to
to −
> a
mto
−>
ba
to −
> d
fto
−>
pi
to −
> p
rto
−>
rs
to −
> s
eto
−>
sp
0.25
0.50
0.75
1.00
Spearman correlation
(b) Spearman Correlation
am −> baam −> dfam −> piam −> pram −> seam −> spam −> toba −> am
ba −> dfba −> piba −> prba −> rsba −> seba −> spba −> to
ce −> amce −> bace −> dfce −> pice −> sece −> spce −> to
df −> amdf −> badf −> pidf −> prdf −> sedf −> spdf −> to
pa −> bapa −> dfpa −> pipa −> prpa −> rspa −> sepa −> sppa −> topb −> bapb −> dfpb −> pipb −> prpb −> rspb −> sepb −> sppi −> ampi −> bapi −> dfpi −> prpi −> rspi −> sepi −> sppi −> to
pr −> ampr −> bapr −> dfpr −> pipr −> rspr −> sepr −> sppr −> to
rs −> amrs −> bars −> dfrs −> pirs −> prrs −> sers −> sprs −> to
sc −> amsc −> basc −> dfsc −> pisc −> prsc −> sesc −> spsc −> to
se −> amse −> base −> dfse −> pise −> prse −> rsse −> spse −> to
sp −> amsp −> basp −> dfsp −> pisp −> prsp −> rssp −> sesp −> to
to −> amto −> bato −> dfto −> pito −> prto −> rsto −> seto −> sp
am
−>
ba
am
−>
df
am
−>
pi
am
−>
pr
am
−>
se
am
−>
sp
am
−>
to
ba
−>
am
ba
−>
df
ba
−>
pi
ba
−>
pr
ba
−>
rs
ba
−>
se
ba
−>
sp
ba
−>
to
ce
−>
am
ce
−>
ba
ce
−>
df
ce
−>
pi
ce
−>
se
ce
−>
sp
ce
−>
to
df −
> a
md
f −
> b
ad
f −
> p
id
f −
> p
rd
f −
> s
ed
f −
> s
pd
f −
> t
op
a −
> b
ap
a −
> d
fp
a −
> p
ip
a −
> p
rp
a −
> r
sp
a −
> s
ep
a −
> s
pp
a −
> t
op
b −
> b
ap
b −
> d
fp
b −
> p
ip
b −
> p
rp
b −
> r
sp
b −
> s
ep
b −
> s
pp
i −
> a
mp
i −
> b
ap
i −
> d
fp
i −
> p
rp
i −
> r
sp
i −
> s
ep
i −
> s
pp
i −
> t
op
r −
> a
mp
r −
> b
ap
r −
> d
fp
r −
> p
ip
r −
> r
sp
r −
> s
ep
r −
> s
pp
r −
> t
ors
−>
am
rs −
> b
ars
−>
df
rs −
> p
irs
−>
pr
rs −
> s
ers
−>
sp
rs −
> t
osc −
> a
msc −
> b
asc −
> d
fsc −
> p
isc −
> p
rsc −
> s
esc −
> s
psc −
> t
ose
−>
am
se
−>
ba
se
−>
df
se
−>
pi
se
−>
pr
se
−>
rs
se
−>
sp
se
−>
to
sp
−>
am
sp
−>
ba
sp
−>
df
sp
−>
pi
sp
−>
pr
sp
−>
rs
sp
−>
se
sp
−>
to
to −
> a
mto
−>
ba
to −
> d
fto
−>
pi
to −
> p
rto
−>
rs
to −
> s
eto
−>
sp
0.25
0.50
0.75
1.00
Kendall correlation
(c) Kendall Correlation
Fig. 7. Heat maps of measurement correlation in the IPE Network.
order to bootstrap the correlations, and allow them to beefficiently monitored continuously by the TrS MC. Never-theless, it is possible to impose limits on resource usagethrough the parameterization of algorithms, which enables themeasurement correlation process to adapt itself to differentnetwork conditions. Finally, intelligent applications can use theresources of measurement federation to work around problemsconsidering the collaboration of nodes.
V. CONCLUDING REMARKS
The present work focuses on the utilization of statisticaltests to enable measurement correlation in perfSONAR feder-ations as a Transformation Service (Transformation Service forMeasurement Correlation - TrS MC). We propose the use ofcorrelation coefficients and distribution tests, both parametricand non-parametric, to implement such service. Since theproposed solution fits into perfSONAR toolkit, it can enjoythe functions performed by other services of such toolkit,e.g., lookup features. The integrated use of the TrS MC ina perfSONAR federation enables the cooperation of differentnodes in collaborating organizations for improving monitoringtasks.
The evaluation of the proposed service was performedusing an active measurement dataset from the perfSONARdeployment in IPE Network (MonIPE). The dataset was pro-cessed using different correlation coefficient and distributiontests, small scale analysis (PoP to PoP), and large scale analysis(the resulting mesh network which was inferred from the activemeasurement results). The results show that it is feasible touse the selected statistical tests to correlate measurements ina federation. Besides that, when analyzing the IPE network asa whole, it is possible to identify hot spots for measurementcorrelation. These correlation hot spots can be used as initialscreening points for the cooperation of measurement mecha-nisms inside the federations.
Although the proposed solution shows good results in theperformed evaluation, it is necessary to investigate differentkind of topologies and conditions. Besides that, our ongoingwork is to develop a prototype to integrate the TrS MC intoperfSONAR to control the activation of OWAMP sessionsin a scalable way. Such prototype can be connected to theperfSONAR Resource Protector service in order to recommendwhich measurements can be performed through cooperation,
due to resource consumption. Finally, measurement correlationcould be applied to other active measurement tools, such asthe Bandwidth Test Controller (BWCTL).
REFERENCES
[1] B. Claise, “Specification of the IP Flow Information Ex-port (IPFIX) Protocol for the Exchange of IP Traffic FlowInformation,” RFC 5101 (Standard), Internet EngineeringTask Force, January 2008.
[2] S. Shalunov, B. Teitelbaum, A. Karp, J. Boote, andM. Zekauskas, “A One-way Active Measurement Proto-col (OWAMP),” RFC 4656 (Proposed Standard), InternetEngineering Task Force, September 2006.
[3] A. Hanemann, J. W. Boote, E. L. Boyd, J. Durand,L. Kudarimoti, R. Łapacz, D. M. Swany, S. Trocha, andJ. Zurawski, “Perfsonar: A service oriented architecture formulti-domain network monitoring,” in Service-OrientedComputing-ICSOC 2005. Springer, 2005, pp. 241–254.
[4] J. C. Nobre, L. Z. Granville, A. Clemm, and A. G.Prieto, “Decentralized Detection of SLA Violations usingP2P Technology,” in Proceedings of the 8th InternationalConference on Network and Service Management (CNSM2012), October 2012.
[5] J. C. Nobre, L. L. Penz, and L. Z. Granville, “Measurementcorrelation for improving cooperation in measurement fed-erations,” in Integrated Network and Service Management(IM), 2017 IFIP/IEEE Symposium on. IEEE, 2017, pp.584–587.
[6] A. Abdelkefi, Y. Jiang, B. E. Helvik, G. Biczok, andA. Calu, “Assessing the service quality of an internet paththrough end-to-end measurement,” Computer Networks,vol. 70, pp. 30–44, 2014.
[7] Y. Zhang, S. Debroy, and P. Calyam, “Network-wideanomaly event detection and diagnosis with perfsonar,”IEEE Transactions on Network and Service Management,vol. 13, no. 3, pp. 666–680, 2016.
[8] J. C. Nobre, “Owamp powstream tool traces fromthe perfsonar deployment in the monitoring service ofthe ip network (monip),” 2016. [Online]. Available:http://dx.doi.org/10.7910/DVN/MSZVYS
2018 IEEE Symposium on Computers and Communications (ISCC)
978-1-5386-6950-1/18/$31.00 ©2018 IEEE 00248