on the use of fuzzy c-regression truncated …eprints.utm.my/id/eprint/32330/1/mohd.saifullah...
TRANSCRIPT

ON THE USE OF FUZZY C-REGRESSION TRUNCATED MODELS
FOR HEALTH INDICATOR IN INTENSIVE CARE UNIT
MOHD SAIFULLAH BIN RUSIMAN
UNIVERSITI TEKNOLOGI MALAYSIA

ON THE USE OF FUZZY C-REGRESSION TRUNCATED MODELS
FOR HEALTH INDICATOR IN INTENSIVE CARE UNIT
MOHD SAIFULLAH BIN RUSIMAN
A thesis submitted in fulfilment of the
requirements for the award of the degree of
Doctor of Philosophy (Mathematics)
Faculty of Science
Universiti Teknologi Malaysia
JULY 2012

iii
To my beloved mother, father, wife and children

iv
ACKNOWLEDGEMENTS
IN THE NAME OF ALLAH, THE MOST BENEFICENT AND
THE MOST MERCIFUL
Praises and thanks to Allah for His grace bestowed upon me, so that I can
complete the thesis, although there are several obstacles and challenges throughout
my exploration and journey of producing this research thesis. Peace and blessings be
upon the Prophet Muhammad S.A.W., chieftain of the universe and the narrator who
struggles to uphold the rule of Allah on earth.
On this occasion, I wish to express my sincere appreciation and gratitude to
the honorable Assoc. Prof. Dr. Robiah Adnan, Prof. Dr. Efendi Nasibov and Dr.
Jacob Kavikumar as project supervisors for all their advices, guidances and
constructive criticisms in order to complete this thesis. Most of their invaluable
comments and suggestions would be preciously appreciated. Their tireless dedication
will always be remembered and learnt. My appreciation also goes to the general
hospital, Johor Bahru, especially Dr. Tan Cheng Cheng for his guidance and
assistance in obtainting the data. Special thanks are also extended to all lecturers and
staffs of the Faculty of Science, UTM, and the Faculty of Science & Arts, Dokuz
Eylul University, Turkey for their guidance and cooperation during my studies. Next,
I wish to extend my gratitude to my colleagues, Assoc. Prof. Dr. Azme, Kamil,
Norazmi, Dr. Kek, Dr. Tay, Shamsidah, Nooreini, Haji Azmi, Ustaz Sakor, Deniz
Güler, Özlem Gürünlü Alma, Suzan Kantarcı, Sezin Tunaboylu and all my friends in
FSTPi for their assistances, advices, support, ideas and insights.
My deepest gratitude and love I wish to my beloved wife, Siti Rohana bte
Abdul Manaf for all the support, advice, encouragement and sacrifice. Without her,
this research is impossible. Hopefully, the family we have will forever be blessed
and graced by Allah in this world and the hereafter. I would also like to extend my
gratitude to my beloved children, Muhammad Sodrurrifaat, Sayyidah Khadijah,
Sayyidah Fatimah and arwah Mohd Shahid, Mohd Thahidithani, Mohd Sofi,
Saidatusshahidah and Saidatulkhoiriyah. May Allah bestow His blessing and let
them be sholeh and sholehah, and pray that they will be successful in this world and
hereafter. My deepest gratitude is also extended to my mother, Gimah bte Karno and
my father, Allahyarham Rusiman bin Kasan for their support, love, care and prayers
for my success. Not forgetting my beloved mother-in-law, Aminah bte Kayat, father-
in-law, Allahyarham Abdul Manaf bin Hidayat, my siblings, sisters and brothers-in-
law. May Allah be always with them and bestow His grace upon them and success in
this life and hereafter. Lastly, many thanks go to those who have contributed directly
and indirectly to the completion of my work in this Ph.D thesis. May our lives
always in the pleasures and blessings of Allah always.

v
ABSTRACT
Two new techniques for clustering data, namely the fuzzy c-regression
truncated models (FCRTM) and fuzzy c-regression least quartile difference (LQD)
models (FCRLM) were proposed in this thesis in analyzing a nonlinear model. These
new models include their functions, the estimation techniques and the explanation of
the five procedures. The stepwise method was used for variable selection in the
FCRTM and FCRLM models. The number of clusters was determined using the
compactness-to-separation ratio, NEWF . The various values of constant, k (k = 0.1,
0.2, ..., ∞) in generalized distance error and various values of fuzzifier, w (1< w <3)
were used in order to find the lowest mean square error (MSE). Then, the data were
grouped based on cluster and analyzed using truncated absolute residual (TAR) and
the least quartile difference (LQD) technique. The FCRTM and FCRLM models
were tested on the simulated data and these models can approximate the given
nonlinear system with the highest accuracy. A case study in health indicator
(simplified acute physiology score II (SAPS II score) when discharge from hospital)
at the intensive care unit (ICU) ward was carried out using the FCRTM and FCRLM
models as mentioned above. Eight cases of data involving six independent variables
(sex, race, organ failure, comorbid disease, mechanical ventilation and SAPS II score
when admitted to hospital) with different combinations of variable types in each case
were considered to find the best modified data. The comparisons among the fuzzy c-
means (FCM) model, fuzzy c-regression models (FCRM), multiple linear regression
model, Cox proportional-hazards model, fuzzy linear regression model (FLRM),
fuzzy least squares regression model (FLSRM), new affine Takagi Sugeno fuzzy
models, FCRTM models and FCRLM models were carried out to find the best model
by using the mean square error (MSE), root mean square error (RMSE), mean
absolute error (MAE) and mean absolute percentage error (MAPE). The results
showed that the FCRTM models were found to be the best model, having the lowest
MSE, RMSE, MAE and MAPE. This new modelling technique could be proposed as
one of the best models in analyzing mainly a complex system. Hence, the health
indicator in the ICU ward could be monitored by managing six independent variables
and other management quality variables in the hospital management.

vi
ABSTRAK
Dua teknik baru di dalam data kluster, yang dinamakan model terpangkas
c-regresi kabur (FCRTM) dan model beza kuartil terkecil (LQD) c-regresi kabur
(FCRLM) dicadangkan dalam tesis ini dalam menganalisis model tak linear. Model-
model baru ini meliputi fungsi-fungsi, teknik anggaran dan penjelasan tentang lima
prosedur. Kaedah langkah demi langkah digunakan dalam pemilihan pembolehubah
bagi model FCRTM dan FCRLM. Bilangan kluster ditentukan dengan menggunakan
nisbah kepadatan-kepada-pemisahan, NEWF . Pelbagai nilai pemalar, k (k = 0.1, 0,2 ,
..., ∞) dalam ralat jarak umum dan pelbagai nilai pekali kabur, w (1 <w <3) telah
digunakan untuk mencari nilai terendah ralat kuasa dua min (MSE). Kemudian, data
dikumpulkan berdasarkan kluster dan dianalisis menggunakan kaedah ralat mutlak
terpangkas dan kaedah beza kuartil terkecil. Model FCRTM dan FCRLM diuji ke
atas data simulasi dan model ini boleh menganggar sistem tak linear yang diberikan
dengan ketepatan yang lebih tinggi. Satu kajian kes terhadap penunjuk kesihatan
(skor II bagi ringkasan akut fisiologi (SAPS II) apabila keluar dari hospital) di wad
Unit Rawatan Rapi (ICU) menggunakan model FCRTM dan FCRLM seperti yang
dinyatakan di atas telah dijalankan. Lapan kes data yang melibatkan enam
pembolehubah tak bersandar (jantina, bangsa, kegagalan organ, penyakit sedia ada,
pengudaraan mekanikal dan skor SAPS II apabila dimasukkan ke hospital) dengan
gabungan pembolehubah berlainan jenis dalam setiap kes dipertimbangkan untuk
mencari data diubahsuai yang terbaik. Perbandingan di antara model c-purata kabur
(FCM), model c-regresi kabur (FCRM), model regresi linear berganda, model Cox
kadaran-bahaya, model regresi linear kabur (FLRM), model regresi kuasa dua
terkecil kabur (FLSRM), model baru kabur hubungan Takagi-Sugeno, model
FCRTM dan FCRLM telah dijalankan untuk mencari model terbaik dengan
menggunakan MSE, ralat punca kuasa dua min (RMSE), ralat mutlak min (MAE)
dan peratus ralat mutlak min (MAPE). Keputusan menunjukkan bahawa model
FCRTM menjadi model yang terbaik dengan nilai MSE, RMSE, MAE dan MAPE
yang terendah. Teknik pemodelan yang baru ini boleh dicadangkan sebagai salah
satu model yang terbaik dalam menganalisis terutamanya sistem yang kompleks.
Oleh itu, penunjuk kesihatan di wad ICU boleh dipantau oleh enam pembolehubah
tak bersandar dan lain-lain pembolehubah pengurusan kualiti di dalam pengurusan
hospital.

vii
TABLE OF CONTENTS
CHAPTER TITLE PAGE
DECLARATION
DEDICATION
ACKNOWLEDGEMENTS
ABSTRACT
ABSTRAK
TABLE OF CONTENTS
LIST OF TABLES
LIST OF FIGURES
LIST OF ABBREVIATIONS/ SYMBOLS
LIST OF APPENDICES
ii
iii
iv
v
vi
vii
xii
xvi
xix
xxix
1 INTRODUCTION
1.1 Introduction
1.2 Research Background
1.3 A Brief History of Intensive Care Unit in
Malaysia
1.4 Problem Statement
1.5 Research Objectives
1.6 The Scope of the Study
1.6.1 Data Scope
1.6.2 Model Scope
1.7 Research Contribution
1.8 Research Importance
1.9 Thesis Organisation
1
1
1
4
6
7
10
10
11
13
13
15

viii
2 LITERATURE REVIEW
2.1 Introduction
2.2 Research Background
2.2.1 Research Background of ICU
2.2.2 Research Background of AHP
2.3 Application of Fuzzy Modelling
2.3.1 Fuzzy Modelling in Medical
. 2.3.2 Fuzzy Modelling in Computer Science
2.3.3 Fuzzy Modelling in Science
2.3.4 Fuzzy Modelling in Engineering
2.3.5 Fuzzy Modelling in Social Science
2.4 Summary
18
18
18
18
29
35
35
38
41
49
53
54
3 RESEARCH METHODOLOGY
3.1 Introduction
3.2 Multiple Linear Regression Model
3.3 Analytical Hierarchy Process (AHP) Technique
3.4 Introduction to Fuzzy Modelling
3.4.1 Introduction to Fuzzy Logic
3.4.1.1 Fuzzy Sets and Membership
Functions
3.4.1.2 Classification of Fuzzy Sets
3.4.1.3 Linguistic Variable and Rules Bases
3.4.1.4 Fuzzy Logic Models
3.5 Fuzzy C-Means (FCM) Model
3.6 Fuzzy C-Regression Models (FCRM)
3.7 The New Affine Takagi Sugeno (T-S) Fuzzy
Models
3.8 Fuzzy Linear Regression Model (FLRM)
3.9 Fuzzy Least Squares Regression Model
(FLSRM)
3.10 The First Proposed Models : Fuzzy
C-Regression Truncated Models (FCRTM)
57
57
58
62
64
65
67
71
73
75
79
85
90
102
110
116

ix
3.10.1 Input-Output Data Partitioned by the
FCRM Clustering Algorithm and
Selecting the Best Variable by Stepwise
Method
3.10.2 Determining the Number of Clusters
3.10.3 Minimizing MSE Value by Using
Generalized Distance Errors
3.10.4 Minimizing MSE Value by Changing
Fuzzifier,w (1<w<3)
3.10.5 Making New FCRM Models Based on
Truncated Absolute Residual Method
3.11 The Second Proposed Models : Fuzzy
C-Regression LQD Models (FCRLM)
3.12 Cross Validation Technique
117
119
119
121
122
125
127
4 SIMULATION OF DATA
4.1 Introduction
4.2 Simulation of Data by S-Plus Program
4.3 Fuzzy C-Regression Truncated Models
(FCRTM)
4.3.1 Input-Output Data Partitioned by the
FCRM Clustering Algorithm and Selecting
the Best Variable by Stepwise Method
4.3.2 Determining the Number of Clusters
4.3.3 Minimizing MSE Value Using Generalized
Distance Errors
4.3.4 Minimizing MSE Value by Changing
Fuzzifier (1<w<3)
4.3.5 Making New FCRM Models Based on
Truncated Absolute Residual Method
4.4 Fuzzy C-Regression LQD Models (FCRLM)
4.5 Summary
129
129
129
130
130
133
135
137
139
141
143

x
5 DATA BACKGROUND AND MODELLING
HEALTH INDICATOR USING MULTIPLE
LINEAR REGRESSION (MLR),
ANALYTICAL HIERARCHY PROCESS
(AHP) AND FUZZY C-MEANS (FCM)
MODEL
5.1 Introduction
5.2 Data Background
5.3 Multiple Linear Regression (MLR) Model
5.4 Analytical Hierarchy Process (AHP)
5.5 Fuzzy C-Means (FCM) Model
145
145
146
149
153
157
6 MODELLING HEALTH INDICATOR USING
FUZZY C-REGRESSION TRUNCATED
MODELS (FCRTM) & FUZZY
C-REGRESSION LQD MODELS (FCRLM)
6.1 Introduction
6.2 Fuzzy C-Regression Truncated Models
(FCRTM)
6.2.1 Input-Output Data Partitioned by the
FCRM Clustering Algorithm and
Selecting the Best Variable by Stepwise
Method
6.2.2 Determining the Number of Clusters
6.2.3 Minimizing MSE Value by Using
Generalized Distance Errors
6.2.4 Minimizing MSE Value by Changing
Fuzzifier (1<w<3)
6.2.5 Making New FCRM Models Based on
Truncated Absolute Residual Method
6.3 Fuzzy C-Regression LQD Models (FCRLM)
160
160
161
161
170
173
175
177
180

xi
7 MODELLING HEALTH INDICATOR USING
OTHER MODELS
7.1 Introduction
7.2 Fuzzy Linear Regression Model
7.2.1 Tanaka Model
7.2.2 Ni Model
7.3 Fuzzy Least Squares Regression Model
7.4 Fuzzy C-Regression Models (FCRM)
7.5 New Affine Takagi Sugeno Fuzzy Models
7.5.1 Input-Output Data Partitioned by the
FCRM Clustering Algorithm
7.5.2 Determining the Number of Clusters
7.5.3 Fuzzy Rule Construction
7.5.4 Checking and Repartitioning of Antecedent
Fuzzy Sets
7.5.5 Fine-Tuning of the Antecedent and
Consequent Parameters
7.6 Multiple Linear Regression Model
7.7 Summary
183
183
184
184
185
186
187
189
189
190
191
191
194
198
201
8 CONCLUSIONS AND RECOMMENDATIONS
8.1 Introduction
8.2 Conclusions
8.3 Recommendations for Further Research
208
208
208
213
REFERENCES 215
Appendices A-F 228-270
xii
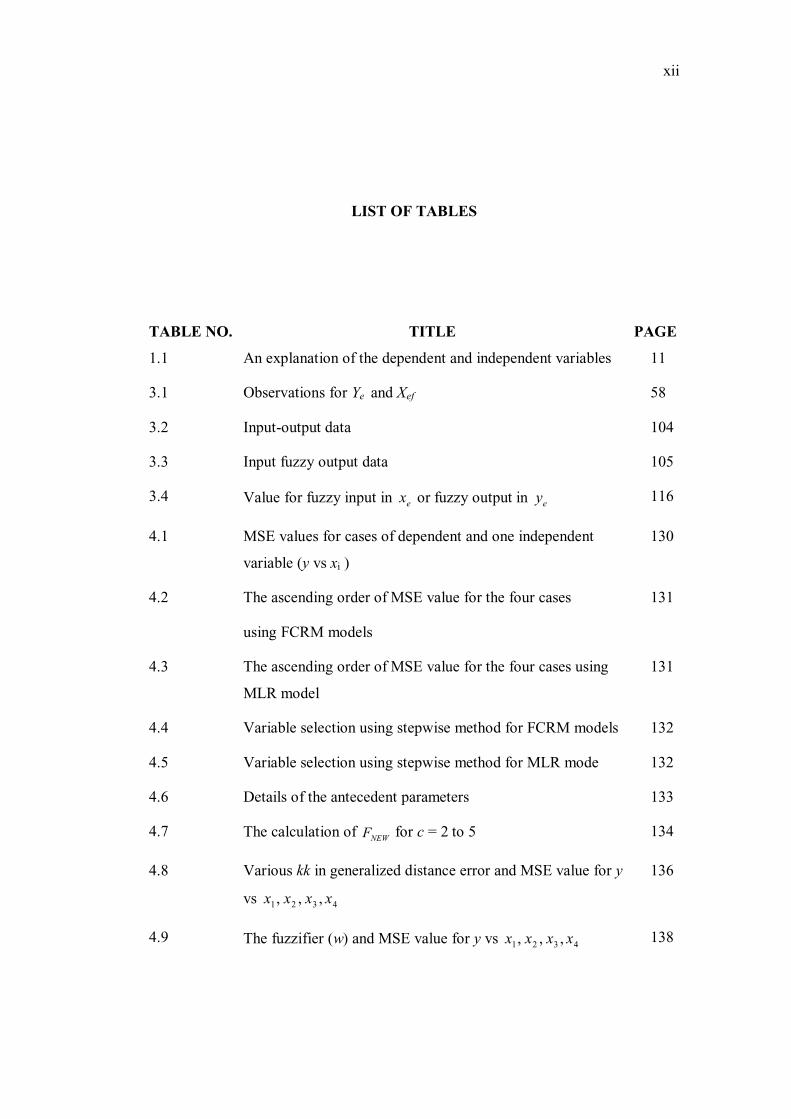
LIST OF TABLES
TABLE NO. TITLE PAGE
1.1 An explanation of the dependent and independent variables 11
3.1 Observations for Ye and Xef 58
3.2 Input-output data 104
3.3 Input fuzzy output data 105
3.4 Value for fuzzy input in ex or fuzzy output in ey
116
4.1 MSE values for cases of dependent and one independent
variable (y vs xi )
130
4.2 The ascending order of MSE value for the four cases
using FCRM models
131
4.3 The ascending order of MSE value for the four cases using
MLR model
131
4.4 Variable selection using stepwise method for FCRM models 132
4.5 Variable selection using stepwise method for MLR mode 132
4.6 Details of the antecedent parameters 133
4.7 The calculation of NEWF for c = 2 to 5 134
4.8 Various kk in generalized distance error and MSE value for y
vs 4321
, , , xxxx
136
4.9 The fuzzifier (w) and MSE value for y vs 4321
, , , xxxx 138

xiii
4.10 MSE value for the percentage of truncated data based on
ascending.order of absolute value of residuals
140
4.11 MSE value for the percentile range data based on ascending
order of absolute value of residuals
142
4.12 MSE, RMSE, MAE and MAPE value summary for all models
(simulation data)
144
5.1 A summary of the dependent and independent variables 148
5.2 Statistical test in detecting influential and outliers data 149
5.3 VIF value for each independent variables 150
5.4 Analysis of Variance (ANOVA) for MLR model 151
5.5 Coefficients for MLR model 152
5.6 Paired-comparison matrix for organ failures 154
5.7 Probabilities or weightage for organ failures 155
5.8 Paired-comparison matrix for comorbid diseases 156
5.9 Probabilities or weightage for comorbid diseases 157
5.10 The value of c and F value for s2sadm (6x ) 158
5.11 Details of the s2sadm variable 159
6.1 Different case of multivariate data (Y vs 1x , 2
x , 3x , 4
x ,
5x , 6x )
162
6.2 Dependent vs one independent variable (Y vs xi ) 163
6.3 Ascending order of MSE value for the 9 cases using FCRM
models
164
6.4 Variable selection using stepwise method for FCRM models 165
6.5 Details of the antecedent parameters 166
6.6 NEWF and number of clusters (c) for Y vs ix 171

xiv
6.7 The calculation of NEWF and the number of clusters (c)
for Y vs 654321 , , ,, , xxxxxx
172
6.8 Various kk in generalized distance error and MSE value for y
vs 654321 , , ,, , xxxxxx
174
6.9 The fuzzifier (w) and MSE value for y vs 654321 , , ,, , xxxxxx 176
6.10 MSE value for the percentage of truncated data based on
ascending order absolute value of residuals
177
6.11 Information for s2sdisc in two clusters 180
6.12 MSE value for the percentile range based on ascending order
absolute value of residuals
181
7.1 Details of the antecedent parameters (Tanaka Model) 185
7.2 Details of the antecedent parameters (Ni Model) 186
7.3 Details of the antecedent parameters (Chang Model) 187
7.4 Details of the antecedent parameters (FCRM Models) 188
7.5 Details of the antecedent parameters (New affine T-S fuzzy
models)
190
7.6 NEWF
and the number of clusters (c) for y vs ix 190
7.7 NEWF
and the number of clusters (c) for 6431
, , , vs xxxxy 191
7.8 Calculation for overlap checking for antecedents 192
7.9 Antecedent and consequent value for k = 0 (beginning teration) 194
7.10 Antecedent and consequent value for k = 3 (last iteration) 195
7.11 Calculation for overlap checking for antecedent 196
7.12 Index data, e with standardized Pearson residuals > 3 198
7.13 VIF value for each independent variables 199

xv
7.14 Analysis of variance (ANOVA) and coefficients for MLR
model
200
7.15 Summarization of the models used in modelling health
indicator
202
8.1 MSE, MSE proportion, RMSE, MAE and MAPE value
summary for all models (health indicator data)
211

xvi
LIST OF FIGURES
FIGURE NO. TITLE PAGE
1.1 Flow chart of research framework 8
1.2 Eight cases of data and eleven models using the best
modified data
9
2.1 Statistical modelling in medical and ICU field 55
2.2 Statistical modelling in fuzzy models 56
3.1 Flow chart of AHP decision hierarchy 63
3.2 A fuzzy logic system which accepts imprecise data/vague
statement
66
3.3 Features of membership function 69
3.4 Example of a fuzzy set with small (S), medium small (MS),
medium (M), medium large (ML) and large (L)
70
3.5 Sample three part gaussian shaped membership function 70
3.6
3.7
Normal fuzzy set
Subnormal fuzzy set
71
71
3.8 Convex fuzzy set 72
3.9 Nonconvex fuzzy set 72
3.10 Intersection of two convex sets 73
3.11 Configuration of a pure fuzzy system 74
3.12 Application of rules for food management example 75

xvii
3.13 Mapping of input space to output space 76
3.14 Sugeno fuzzy control system 77
3.15 Three rules and two inputs for Sugeno FIS 79
3.16 Hard, fuzzy and probabilistic label vectors for c = 3 classes 81
3.17
3.18
The FCM graph with two clusters
The FCRM graph with two clusters
84
90
3.19 Illustration for inappropriate premise structure 96
3.20 Illustration for overlap of two bell-shaped fuzzy sets 97
3.21 Flow chart of new affine T-S fuzzy model algorithm 101
3.22 Fuzzy set of parameter A:A
Δ
= “approximate α ” 103
3.23 Explanation of fuzzy linear regression model ee xAAY10
+= 105
3.24 Fuzzy output 106
3.25 Degree of fitting of *
eY to a given fuzzy data eY . 107
3.26 Flow chart of FCRTM models algorithm 124
3.27 Flow chart of FCRLM models algorithm 126
4.1 Plot for NEWF vs the number of clusters (c) 135
4.2 Plot for MSE value vs various kk in generalized distance
error for y vs 4321
, , , xxxx
137
4.3 Plot for MSE value vs fuzzifier (w) for y vs 4321
, , , xxxx 138
4.4 Plot for MSE value vs percentage of truncated data for y vs
4321, , , xxxx
141
4.5 Plot for MSE value vs percentile range case for y vs
4321, , , xxxx
142
5.1 Normal Q-Q plot for unstandardized residual 150
5.2 Plot for s2sadm based on cluster 158

xviii
5.3 Plot for s2sadm membership function (FCM Clustering) 159
6.1 Plot for individual clustering 168
6.2 Plot for individual membership function 169
6.3 Membership function plot for Y vs 654321 , , ,, , xxxxxx 170
6.4 Plot for NEWF vs the number of clusters (c) for
Y vs 654321 , , ,, , xxxxxx
173
6.5 Plot for MSE value vs various kk in generalized distance
error for y vs 654321 , , ,, , xxxxxx
175
6.6 Plot for MSE value vs fuzzifier (w) for y vs
654321 , , ,, , xxxxxx
176
6.7 Plot for MSE value vs percentage of truncated data
for y vs 654321 , , ,, , xxxxxx
178
6.8 Plot for MSE value vs percentile range case for y vs
654321 , , ,, , xxxxxx
181
7.1 Plot for individual membership function 193
7.2 Membership function plot for 1
x and 4x 197
7.3 Normal Q-Q plot for unstandardized residual 199

xix
LIST OF ABBREVIATIONS / SYMBOLS
A - Any arbitrary number (matrix)
ia0 - Constant for T-S models
)(' ba j - Inverse membership function for set AR
)('' ba j - Inverse membership function for set AL
gqaiq ..., ,1 , = - Individual consequent parameters for T-S models
A - Fuzzy set of A
ipA Inappropriate antecedent fuzzy set
iqA - Individual antecedent fuzzy sets
ACHS - Australian Council on Healthcare Standards
AFCRC - Adaptive fuzzy c-regression model with convexity
enhancement
AHP - Analytical hierarchy process
AIDS - Acquired Immunodeficiency Syndrome
AMI - Acute myocardial infarctions
ANN - Artificial neural network
APACHE - Acute physiology and chronic health evaluation
b - Level of existence corresponds to the level of membership
bigVAT - Big VAT
gb - Estimated regression coefficient for all N cases
)(egb - Estimated regression coefficient when eth case is omitted
BMI - Body mass index
c - Number of clusters
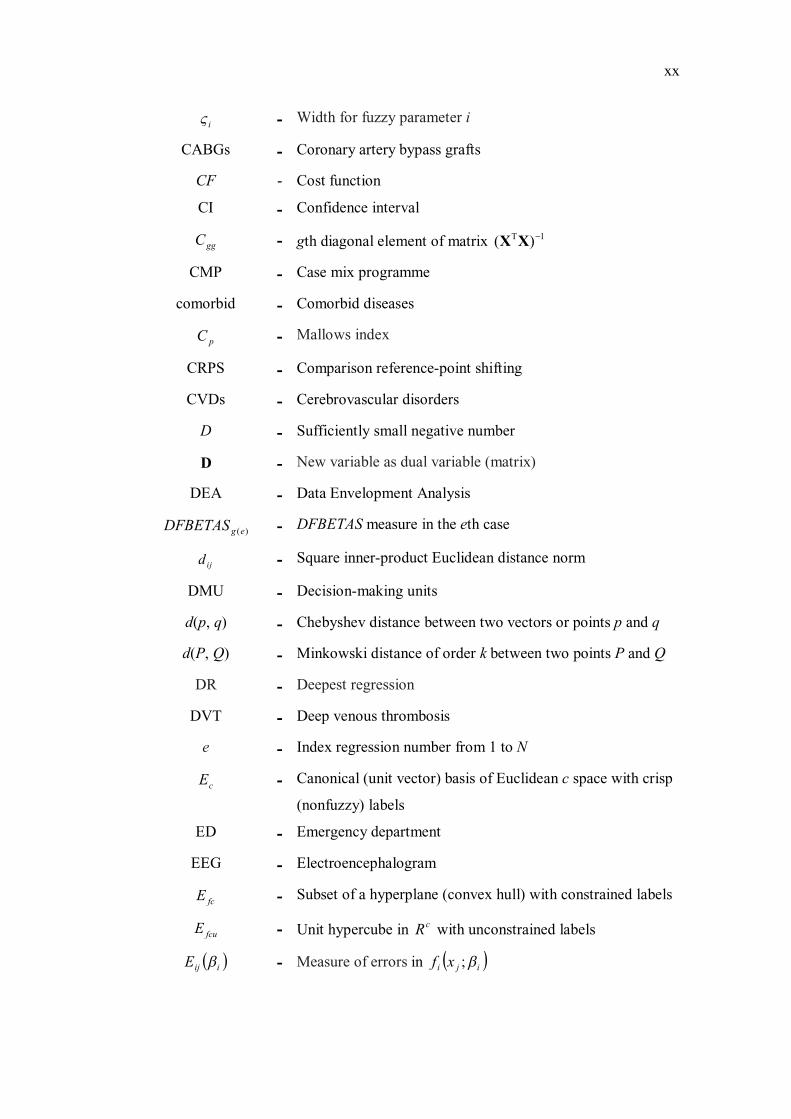
xx
iς - Width for fuzzy parameter i
CABGs - Coronary artery bypass grafts
CF - Cost function
CI - Confidence interval
ggC - gth diagonal element of matrix 1T
)(−XX
CMP - Case mix programme
comorbid - Comorbid diseases
pC - Mallows index
CRPS - Comparison reference-point shifting
CVDs - Cerebrovascular disorders
D - Sufficiently small negative number
D - New variable as dual variable (matrix)
DEA - Data Envelopment Analysis
)(egDFBETAS - DFBETAS measure in the eth case
ijd - Square inner-product Euclidean distance norm
DMU - Decision-making units
d(p, q) - Chebyshev distance between two vectors or points p and q
d(P, Q) - Minkowski distance of order k between two points P and Q
DR - Deepest regression
DVT - Deep venous thrombosis
e - Index regression number from 1 to N
cE - Canonical (unit vector) basis of Euclidean c space with crisp
(nonfuzzy) labels
ED - Emergency department
EEG - Electroencephalogram
fcE - Subset of a hyperplane (convex hull) with constrained labels
fcuE - Unit hypercube in cR with unconstrained labels
( )iijE β - Measure of errors in ( )iji xf β;

xxi
( )}{, im UE β - Ojective function for FCRM models
EM - Expectation maximization
E(εi ) - Expectation of random errors
f - Index regression number from 1 to g
F - Xie and Beni index
FAMIMO - Fuzzy algorithms for the control of Multi-Input Multi-Output
processes
FCCM - Fuzzy clustering for categorical multivariate data
FCM - Fuzzy c-means
comf - Compactness validity function
FCRLM - Fuzzy c-regression LQD models
FCRM - Fuzzy c-regression models
FCRTM - Fuzzy c-regression truncated models
FE - Fuzzy error
),( ii xf θ - Multiple linear regression equation for cluster i
FIS - Fuzzy inference system
FKM - Fuzzy k-means
FLRM - Fuzzy linear regression model
FLSRM - Fuzzy least squares regression model
FM - Fuzzy minimals
FMLE - Fuzzy maximum likelihood estimation
FMLS - Fuzzy membership function least-squares
NEWF - Compactness-to-separation ratio
FNNS - Fuzzy neural network system
sepf - Separation validity function
),( Axf - Fuzzy function of set A
),( AXf - Fuzzy model
g - Number of independent variables

xxii
GA - Genetic algorithm
GCS - Glasgow coma score
geFFCM - Generalized extensible fast fuzzy c-means
GFLM - General fuzzy linear model
GI - Gastro intestinal
GK - Gustafson-Kessel
GNP - Gross national product
h or H - Level sets or degree of the fitting of the fuzzy linear model
by the decision maker
H - Leverage hat matrix
eeh - Leverage value for eth observation
eh - Index for level sets
HIV - Human Immunodeficiency Virus
HR - Hazard ratio
I - Index fuzzy number from 1 to c
I - Induced the standard Euclidean norm (matrix)
IC - Integrated circuit
ICNARC - the Intensive Care National Audit & Research Centre
ICU - Intensive care unit
GI - Fuzzy clustering validity function
jI - The event when i is between 1 and c and 0=ijE
inf - Infremum
ISODATA - Iterative Self-Organizing Data Analysis Technique
IWS - Invariable weights system
JM - Judgment matrices
j - Index fuzzy number from 1 to N
),;( VUJ X or J - Objective function for FCM model
JJ - Vagueness of fuzzy linear

xxiii
ll - Constant in fuzzy linear regression model
k - Index fuzzy number from 1 to c
kk - Order kk in Minkowski distance
,21
kk - Small real positive constants
l - Iteration number
L - Left reference function
LFA - Logical framework analysis
LIFE - Laboratory for International Fuzzy Engineering
LMI - Linear matrix inequality
LMS - Least median of squares
LOS - Length of stay
LQD - Least quartile difference
LQS - Least quartile of squares
LR - Logistic regression
LS - Least square
LTS - Least trimmed squares
m - Number of alternatives in AHP technique
max - Maximum value of each rule output set
MAP - Mean arterial pressure
cnM - Sets of crisp c-partitions of S
MCTDCFCRM - Multi-Channels Time-Domain-Constrained FCRM
mecvent - Mechanical ventilator
MEDLINE - Medical literature analysis and retrievel system online
(Journal citations and abstracts for biomedical literature from
around the world)
MF - Membership function
fcnM - Sets of constrained of S
fcnuM - Sets of unconstrained of S
MLR - Multiple linear regression

xxiv
MICU - Medical intensive care unit
MPG - Miles per gallon
MPM - Mortality probability models
MRO - Multi-criteria Rank Ordering
MSE - Mean square error
eMSE - Mean square error with the deleted eth observation
n - Number of factors in AHP technique
N - Number of observations
in - Normal vector of the i-th linear hyper-plane or T
1]1,,...,[ −i
ni aa
N - Normal distribution
N - Number of observations
NARX - Nonlinear autoregressive exogenous model
NICU - Neonatal intensive care unit
OERI - Overall existence ranking index
)( jAOM - OERI function for set
COR - Crude odds ratio
OR - The algebraic sum of each rules output set
orgfail - Organ failures
p - Number of independent variables + 1
P - Factor in FLSRM membership function
pd - Probability distribution function
PRO - Peer review organization
PUD - Peptic ulcer disease
QQ plot - Quartile-quartile plot
R - Right reference function
2R or 2r - Coefficient of determination
2R or 2r - Adjusted version of 2R
CR - Mandani’s fuzzy implication

xxv
cR - Dimension in c space
rd - Random digit
reVAT - Revised VAT
RFRA - Robust fuzzy regression agglomeration
iR - ith for IF-THEN rule
2
gR - Coefficient of determination when gX is regressed on the
p-2 other X variables in the model
ROC - Receiver operator characteristic
RPCA - Robust parallel competitive agglomerative
RPSFR - Robust Proper Structure Fuzzy Regression
pR - Dimension in s and t space (x and y axis)
RR - Relative risk
sR - Dimension in s space (x axis)
tR - Dimension in t space (y axis)
S - Data set of ),( ii yx
s2sadm - Score of SAPS II admit
s2sdisc - Score of SAPS II discharge from hospital
SAPS II - Simplified acute physiology score II
SAS - Statistical Analysis System
SETAR - Self-Exciting Threshold Autoregressive
SGA - Standard genetic algorithm
SISO - Single-input single-output
sum - Sum of each rules output set
sup - Supremum
Supp - Support of the fuzzy set
TDCFCRM - Time-Domain-Constrained FCRM
et - Studentized deleted residual for eth observation
TS - Takagi-Sugeno
xxvi
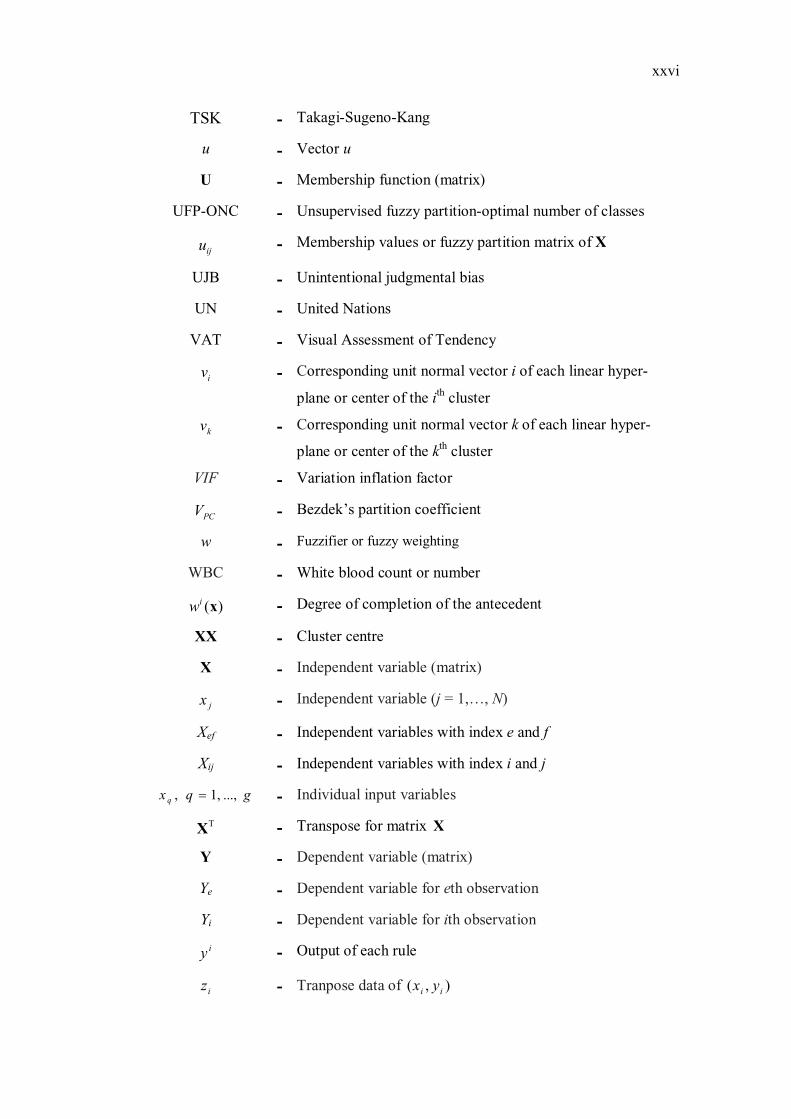
TSK - Takagi-Sugeno-Kang
u - Vector u
U - Membership function (matrix)
UFP-ONC - Unsupervised fuzzy partition-optimal number of classes
iju - Membership values or fuzzy partition matrix of X
UJB - Unintentional judgmental bias
UN - United Nations
VAT - Visual Assessment of Tendency
iv - Corresponding unit normal vector i of each linear hyper-
plane or center of the ith cluster
kv - Corresponding unit normal vector k of each linear hyper-
plane or center of the kth cluster
VIF - Variation inflation factor
PCV - Bezdek’s partition coefficient
w - Fuzzifier or fuzzy weighting
WBC - White blood count or number
)(xiw - Degree of completion of the antecedent
XX - Cluster centre
X - Independent variable (matrix)
jx - Independent variable (j = 1,…, N)
Xef - Independent variables with index e and f
Xij - Independent variables with index i and j
gqx q ..., ,1 , = - Individual input variables
TX - Transpose for matrix X
Y - Dependent variable (matrix)
Ye - Dependent variable for eth observation
Yi - Dependent variable for ith observation
iy - Output of each rule
iz - Tranpose data of ),( ii yx
xxvii
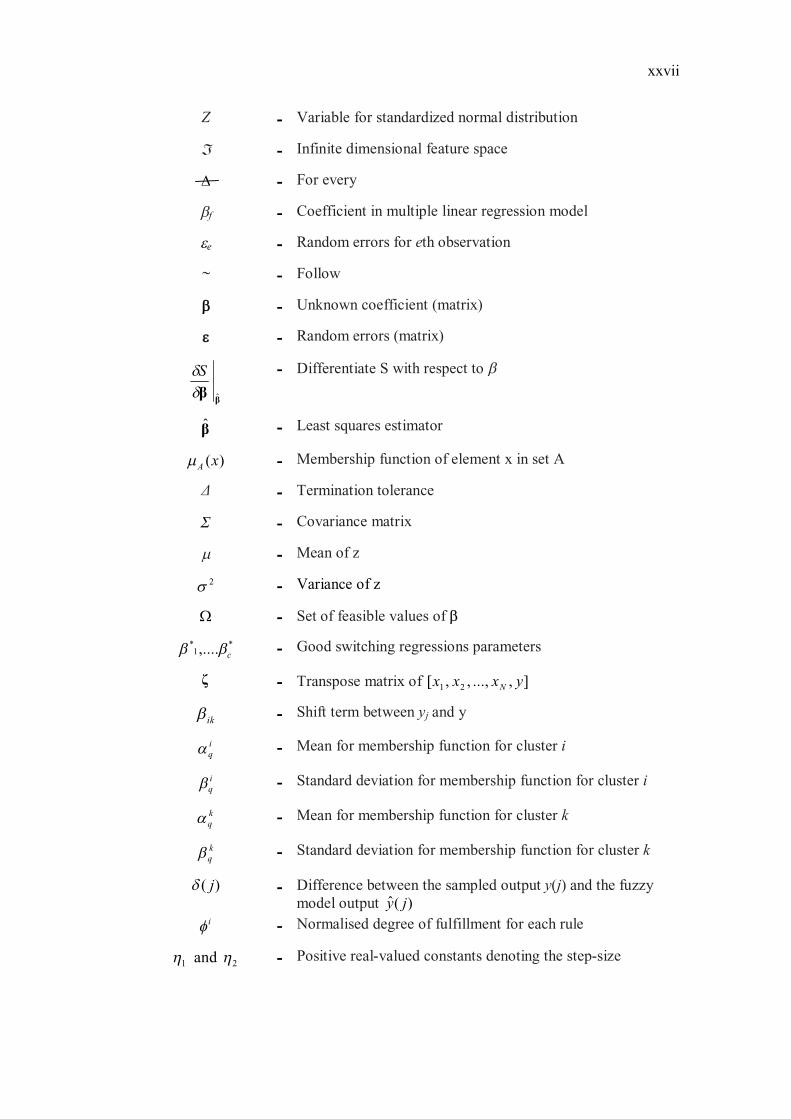
Z - Variable for standardized normal distribution
ℑ - Infinite dimensional feature space
Δ - For every
βf - Coefficient in multiple linear regression model
εe - Random errors for eth observation
~ - Follow
ββ - Unknown coefficient (matrix)
εε - Random errors (matrix)
ββ ˆ
δδS
- Differentiate S with respect to β
β - Least squares estimator
)(xAμ - Membership function of element x in set A
Δ - Termination tolerance
Σ - Covariance matrix
μ - Mean of z
2σ - Variance of z
Ω - Set of feasible values of β
*1
*,.... cββ - Good switching regressions parameters
ζ - Transpose matrix of ], ..., , ,[21
yxxx N
ikβ - Shift term between yj and y
iqα
- Mean for membership function for cluster i
iqβ
- Standard deviation for membership function for cluster i
kqα - Mean for membership function for cluster k
kqβ - Standard deviation for membership function for cluster k
)( jδ - Difference between the sampled output y(j) and the fuzzy
model output )(ˆ jy iφ - Normalised degree of fulfillment for each rule
21 and ηη - Positive real-valued constants denoting the step-size
xxviii
αβε - Termination threshold for antecedent parameter
abε - Termination threshold for consequent parameter
α - Center for fuzzy parameter
'α - New variable for α
)(bω - Subjective weighting function for b
)(1
bχ - Subjective weighting factors for )(' ba j
)(2
bχ - Subjective weighting factors for )('' ba j
λ - Level set for FLSRM model
Γ| | - λ - level set
S(β) - Function for least squares method
*U - Reasonable fuzzy partitioning
|,| ⟩⟨ ki vv - Absolute value of the standard inner-product of their unit
normal vectors
V(εe ) - Variance of random errors
*
iy - Estimated value for y
y - Output of fuzzy model

xxix
LIST OF APPENDICES
APPENDIX TITLE PAGE
A List of publications 228
B The summary of the literature reviews in medical and
ICU field
231
C The summary of the literature reviews in fuzzy
modelling
238
D The summary of the solved and unsolved problem in
the ICU field
249
E Patient data form 257
F Data for ICU patients in General Hospital, Johor
Bahru
261
CHAPTER 1
INTRODUCTION
1.1 Introduction
This chapter presents the introduction to this thesis. It begins by describing
the overall research background followed by a brief history of the intensive care unit
(ICU) in Malaysia. Problem descriptions, research objectives, scope of the study,
research importance and research contribution are also given. Finally, a brief
description of each chapter is stated.
1.2 Research Background
Lotfi A. Zadeh from University of California at Berkeley was the first to
propose fuzzy logic in 1965 with a fuzzy set theory. Fuzzy logic, when interpreted in
a wider sense, is the theory of fuzzy sets. The concept of fuzzy sets provides a
convenient way to represent various notions with imprecision, vagueness, or
fuzziness, e.g. young, tall, cold, etc., which we frequently employ in our everyday
life. As such, fuzzy logic has the rationale of more closely resembling than
traditional logic the way human beings actually think, where alternatives are not
black and white but shades of gray. Fuzzy logic has had notable success in various
engineering applications.
When interpreted in a narrower sense, fuzzy logic is an extension of ordinary
two-valued logic in such a way that the points in interval units are allowed as truth-

2
values. As the truth-values are generalized in such a way, usual truth-functional
operations are generalized accordingly. Fuzzy logic is controversial in some circles,
despite wide acceptance and a broad track record of successful applications. It is
rejected by some control engineers for validation and other reasons, and by some
statisticians who hold that probability is the only exact mathematical description of
uncertainty. Critics also argue that it cannot be a superset of ordinary set theory since
membership functions are defined in terms of conventional sets.
Fuzzy logic is a form of many-valued logic or probabilistic logic; it deals
with reasoning that is approximate rather than fixed and exact. In contrast with
traditional logic theory, where binary sets have two-valued logic: true or false, fuzzy
logic variables may have a truth value that ranges in degree between 0 and 1. Fuzzy
logic has been extended to handle the concept of partial truth, where the truth value
may range between completely true and completely false. Furthermore, when
linguistic variables are used, these degrees may be managed by specific functions.
Fuzzy logic has been applied to many fields, from control theory to artificial
intelligence. The reasoning in fuzzy logic is similar to human reasoning. It allows for
approximate values and inferences as well as incomplete or ambiguous data (fuzzy
data) as opposed to only relying on crisp data (binary choices). Fuzzy logic is able to
process incomplete data and provide approximate solutions to problems other
methods find difficult to solve.
Fuzzy logic and probabilistic logic are mathematically similar. Both have
truth values ranging between 0 and 1, but conceptually distinct, due to different
interpretations. Fuzzy logic corresponds to “degrees of truth”, while probabilistic
logic corresponds to “probability and likelihood”. As these values differ, fuzzy logic
and probabilistic logic yield different models of the same real-world situations.
Fuzzy logic and probability are different ways of expressing uncertainty. While both
fuzzy logic and probability theory can be used to represent subjective belief, fuzzy
set theory uses the concept of fuzzy set membership (i.e., how much a variable is in a
set), and probability theory uses the concept of subjective probability (i.e., how
probable/ possible do I think that a variable is in a set).
3
In statistics, fuzzy model was initiated by Tanaka (1982) who introduced
fuzzy linear regression model. In his study, he concentrated on the application of
fuzzy linear function to a regression analysis in a vague phenomenon. In the usual
regression model, deviations between the observed values and the estimated values
are supposed to be due to observation errors which must meet the normal
distribution. However, Tanaka assumed that these deviations or these fuzziness of
system parameters depend on the vagueness of the system structure. In other words,
the deviations are closely related to fuzziness of system parameters rather than
observation errors. We consider our data as input-output relations whose vagueness
of the system structure expressed by fuzzy parameters.
A significant advantage in the use of fuzzy model is that it can be used
without the need for early assumptions. If the error for a certain data is not normally
distributed, fuzzy model can still be used. In fact, many of the actual data around us
do not have a normal distribution. This contrasts with the multiple linear regression
model in which normality assumption of the residuals should be met first before
using multiple linear regression model. Therefore, all data types can be used in the
fuzzy model.
Here are other uses of fuzzy logic in our everyday life such as air
conditioners, cameras, digital image processing, rice cookers, dishwashers, elevators,
washing machines and other home appliances, video game artificial intelligence,
language filters on message boards and chat rooms for filtering out offensive text,
pattern recognition in Remote Sensing, automobile and other vehicle subsystems
(such as ABS and cruise control e.g. Tokyo monorail) and the massive engine used
in the new films, which helped show huge scale armies.
There are many advantages of using fuzzy model. Fuzzy model is
conceptually easy to understand. The mathematical concepts behind fuzzy reasoning
are very simple. What makes fuzzy interesting is the naturalness of its approach and
not its far-reaching complexity. Fuzzy logic is flexible. With any given system, it is
easy to manage it or layer more functionality on top of it without starting again from
scratch. Fuzzy logic is tolerant of imprecise data. Everything is imprecise if you look
closely enough, but more than that, most things are imprecise even on careful
4
inspection. Fuzzy reasoning builds this understanding into the process rather than
tacking it onto the end.
Fuzzy logic can model nonlinear functions of arbitrary complexity. You can
create a fuzzy system to match any set of input-output data. This process is made
particularly easy by adaptive techniques like ANFIS (Adaptive Neuro-Fuzzy
Inference Systems), which are available in the Fuzzy Logic Toolbox. Fuzzy logic
can be built on top of the experience of experts. In direct contrast to neural networks,
which take training data and generate opaque, impenetrable models, fuzzy logic lets
you rely on the experience of people who already understand your system. Fuzzy
logic can be blended with conventional control techniques. Fuzzy systems do not
necessarily replace conventional control methods. In many cases fuzzy systems
expand them and simplify their implementation. Fuzzy logic is based on natural
language. The basis for fuzzy logic is the basis for human communication.
Fuzzy modelling is applicable and a very vital computational model for a
wide variety of problems. These include pattern recognition, function approximation,
image processing, clustering, prediction and forecasting. It is a common practice to
use the trial and error method to find an appropriate fuzzy modelling for a given
problem. Modelling helps to make predictions more precise. There is no doubt that
modelling will preserve its importance in medical research as the problems become
more complex and difficult.
1.3 A Brief History of Intensive Care Unit in Malaysia
Intensive care for the critically ill patients is a necessary component of acute
hospital care. Although intensive care unit patients account for only 5% of in total
patients, it contributes a significant amount of health care resources. In the United
States, it accounts for 1% of the Gross National Product (GNP) and 15-20% of whole
hospital cost. This economic and institutional cost has increased the needs for
outcome evaluation and quality assurance. Clinical audits can provide a purpose
assessment of performance, effectiveness of therapy and utilisation of resources.

5
The first ICU in Malaysia was established in 1968. Since then, intensive care
unit has grown rapidly and it is now available in all tertiary care hospitals and
selected secondary care hospitals in the Ministry of Health. Rapid development of
medical and surgical subspecialties in the last decade resulted in increasing demands
for more ICU beds and provides momentum for its development. In a recent national
mortality audit, the lack of intensive care beds has been cited as a major contributing
factor in perioperative deaths (mortality in relation to surgery, often defined as death
within two weeks of a surgical procedure) in the Ministry of Health hospitals.
The condition in the United Kingdom in the early 1980’s was similar to what
we are currently experiencing in Malaysia. There was a great stress on the hospital
services as the demand for intensive care beds increases. More ICU beds were
opened up and high dependency units increased rapidly without proper assessment
for their needs. This chaotic development and the resulting of unequal distributions
of the facilities and poor patient outcome encouraged a call for a national audit.
Therefore in 1994, the Intensive Care National Audit & Research Centre
(ICNARC) was established in UK. It was sponsored by the intensive Care Society
and the Department of Health. Its major mission was to conduct a review on
intensive care practice using a Case Mix Programme (CMP) and to make suggestion
to the relevant health authorities. The findings of ICNARC and that of the National
Expert Group for the Department of Health prompted the British government to
spend £142.5 million in year 2000 to further improve intensive care throughout the
country. Through the CMP, the ICNARC also created a national database made
available to the clinicians and hospital managers for clinical review and planning
purposes.
In Australia and New Zealand, clinical indicators in intensive care were
developed by representatives of the Australian and New Zealand Intensive care
professional bodies and the Australian Council on Healthcare Standards (ACHS) to
assess key aspects of intensive care functions within a hospital. In Malaysia, The
National Audit on Adult Intensive Care Units is organized in 2002 and modelled on
the UK experiences. It is a quality improvement activity supported by the Bahagian
Perkembangan Perubatan and organized by a national committee comprising of

6
senior intensive care specialists in the Ministry of Health. This audit consists of two
parts. Part 1 is a review of the clinical practice of intensive care by way of
developing a national database. Part II is to assess three fundamental aspects of
intensive care functions within a hospital. They are the sufficiency of the intensive
care resource to meet hospital requirements, the comparison of patient outcome with
a national and/or international standard and the evaluation of complications of
treatment.
Assessment of the three fundamental aspects in intensive care unit is
important to the practitioners and function of an intensive care unit within a hospital.
Selection of indicators that address them is hard. There are many indicators that
could assess each of these areas. For the sake of ease and simplicity, we accept the
clinical indicators developed by ACHS (The Australian Council on Healthcare
Standard). A clinical indicator is a measure of the clinical management and outcome
of care and should be a useful instrument for clinicians to flag potential problems
and areas for improvement (The Committee for National Audit on Adult Intensive
Care Units, 2002).
1.4 Problem Statement
Intensive care practice is well established in Malaysia. The study on the ICU
was conducted in detail in 2002 by The Committee for National Audit on Adult
Intensive Care Units. Clinical practice, performance and outcome have been
published. The outcomes of intensive care in Ministry of Health ICUs have been
compared with other parts of the world. A clinical indicator developed by ACHS is
used in Malaysian hospitals to identify potential problems and for improvement of
service. ICU mortality rates are predicted using the logistic model in which the main
factor contributing to mortality is simplified acute physiology score II (SAPS II)
when discharge from hospital (s2sdisc). However, it serves only as a medical report
with no further action taken to reduce the death rate based on the conclusions from
the data analysis. For example, the motto in treating the patients who are really in

7
critical condition. So far, no mechanism is used to identify and treating high-risk
patients first.
In fuzzy c-regression models (FCRM), there are two important factors,
namely the fuzzy model (fuzzification and defuzzification) and the multiple linear
regression (MLR) model. Both factors are closely associated in producing the final
fuzzy c-regression models (FCRM). In this case, the MLR model used is the basic
model without considering the problem of outlier data. So, FCRM models common
issue is that it is vulnerable to outlier data. In any statistical studies, researchers want
to find the latest methods in reducing the value of the error. Several current methods
of addressing outlier in the MLR model which are robust against outliers can be
adapted in FCRM models.
1.5 Research Objectives
This research is an attempt to present a proper methodology and analysis of
modelling health indicator in the ICU. The objectives of this study are detailed as
below;
(i) To apply the data mining technique, that is, the analytical hierarchy
process (AHP) method in order to fuzzify binary health indicator data into
continuous data.
(ii) To identify the critical point of health indicator using fuzzy c-means
(FCM) model so as to categorize patients into “high risk” or “non-high
risk” patients.
(iii) To apply the existing models such as multiple linear regression (MLR)
model and fuzzy models specifically fuzzy linear regression model
(FLRM), fuzzy least squares regression model (FLSRM), fuzzy c-
regression models (FCRM) and new affine Takagi Sugeno fuzzy models
for the health indicator in the ICU.
(iv) To propose two new models which are fuzzy c-regression truncated
models (FCRTM) and fuzzy c-regression LQD (least quartile difference)

8
models (FCRLM) for the health indicator in the ICU.
(v) To make comparison among the models in order to find the best model in
modelling health indicator.
These objectives will be achieved by following the research framework as shown in
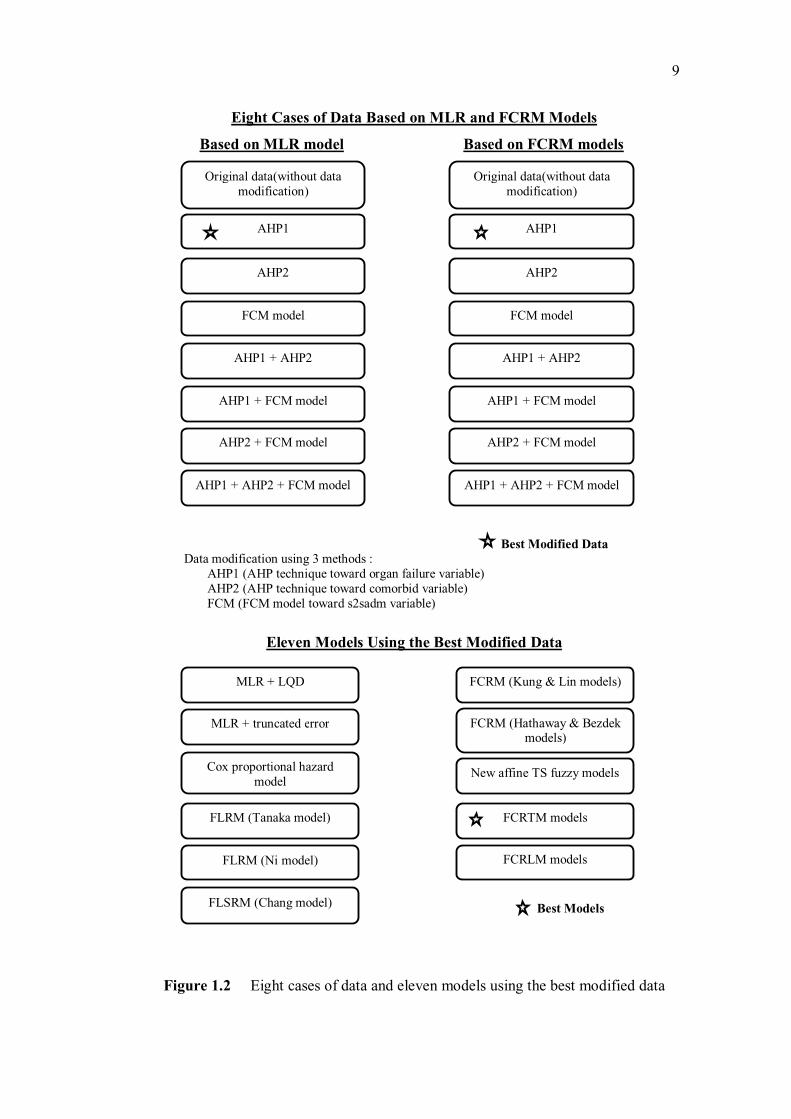
Figure 1.1 and Figure 1.2.
Figure 1.1 Flow chart of research framework
Multicollinearity
diagnostic
fullfilled
Assumption
of residual
fulfilled
Yes
My contribution/
proposed models in this
research
Other models:
Cox proportional hazard
model, FLRM (Tanaka &
Ni model), FLSRM (Chang
model), new affine TS
fuzzy models
Yes
No
No
Conclusion
Data collection
Stop
Outliers/influence
diagnostics
Fuzzification of data
using AHP
Identify critical point
of health indicator
(FCM model)
Multiple linear
regression model
Find the
best model
FCRM
models FCRLM
models FCRTM
models Other
models
9
Eight Cases of Data Based on MLR and FCRM Models
Based on MLR model Based on FCRM models
Best Modified Data
Data modification using 3 methods :
AHP1 (AHP technique toward organ failure variable)
AHP2 (AHP technique toward comorbid variable)
FCM (FCM model toward s2sadm variable)
Eleven Models Using the Best Modified Data
Best Models
Figure 1.2 Eight cases of data and eleven models using the best modified data
Original data(without data
modification)
AHP1
AHP2
FCM model
Original data(without data
modification)
AHP1
AHP2
FCM model
AHP1 + AHP2
AHP1 + FCM model
AHP2 + FCM model
AHP1 + AHP2 + FCM model
AHP1 + AHP2
AHP1 + FCM model
AHP2 + FCM model
AHP1 + AHP2 + FCM model
MLR + LQD
FLRM (Tanaka model)
FLSRM (Chang model)
New affine TS fuzzy models
FCRTM models
FCRLM models
FCRM (Hathaway & Bezdek
models)
Cox proportional hazard
model
MLR + truncated error
FLRM (Ni model)
FCRM (Kung & Lin models)

10
1.6 The Scope of The Study
The scope of the study will be divided into two subsections. The first section
discusses the scope of the data and followed by a discussion on the scope for the
model.
1.6.1 Data Scope
In this research, the data were obtained from the intensive care unit (ICU) of a
general hospital in Johor. The data collected by nurses were classified using cluster
sampling. It involves 1314 patients in the ICU from 1st January, 2001 to 25
th August,
2002. The dependent variable is the patients’ status with 0 and 1 codes are used
where 0 is coded for patients who are alive in the hospital or the ICU, whereas 1 is
coded for patients who died in the hospital or the ICU. There are seven independent
variables i.e. sex, race, organ failures (orgfail), comorbid diseases (comorbid),
mechanical ventilator (mecvent), score of SAPS II admit (s2sadm) and score of
SAPS II discharge from hospital (s2sdisc).
In this thesis, we excluded the patients’ status from the dependent variable
since the fuzzy clustering for binary data cannot be used. The s2sdisc score is 15
accumulated values for heart rate, blood pressure, age, body temperature, oxygen
pressure, urine result, urea serum level, white blood count, potassium serum level,
sodium serum level, bicarbonate serum level, bilirubin level, glasgow coma score,
chronic illness and type of admittance that have been proposed by Le Gall in 1993.
The level of health or health indicator in hospital is measured by the score of s2sdisc.
Then, s2sdisc variable is taken as the dependent variable since the s2sdisc and
patients’ status are determined at the same time. In fact, the highest correlation
among independent variables and patients’ status is between the patients’ status and
s2sdisc.

11
Table 1.1 : An explanation of the dependent and independent variables
No. Variable Name
Variable Type Note
1 sex Qualitative binary with 1=
‘Female’ and 2= ‘Male’
Gender of the patient
2 Race Qualitative category with 1=
‘Malay’, 2= ‘Chinese’, 3=
‘Indian’, 4= ‘Orang Asli, Sabah
& Sarawak Indigenous, citizen
abroad etc.’
Race of the patient
3 orgfail Qualitative binary with 1= No
organ failure 2= At least one
organ failure
Organ failure before and
during treatment in the
ICU
4 comorbid Qualitative binary with 1= Did
not suffer from comorbid
disease, 2= Suffer at least one
comorbid disease
Comorbid diseases
(existing diseases) before
being treated in the ICU
5 mecvent Qualitative binary with 1=
Patients do not use ventilator
machine, 2= Patients use
ventilator machine
Patients using ventilator
machine
6 s2sadm Quantitative discrete with
minimum value of 0
SAPS II score during the
first 24 hours in the wards
(SAPS II score admit)
7 s2sdisc Quantitative discrete with
minimum value of 0
SAPS II score during the
discharge from the
ward/hospital (SAPS II
score discharge)
1.6.2 Model Scope
Firstly, the analysis of influential and outlier in multiple linear regression
(MLR) model should be carried out to the data in order to discard the data due to the
assignable causes (human error, machine error and environment error). In this study,
we will also use the data mining technique, that is, analytical hierarchy process
(AHP) in order to fuzzify the binary data of comorbid disease and organ failure. This
technique will transform the binary data to the continuous data within interval [0,1]
which is expected to be more accurate and near to the real situation (Rao, 2006).
Then, the fuzzy c-means (FCM) model will be used for s2sadm variable since
the variable varies from 0 to 126. This technique will determine the best cluster for
12
this variable as FCM develops hyper-spherical-shaped clusters. In this technique, we
will identify the critical point for health indicator. It is important to cluster the
patients into “high risk” and “non-high risk”. A medical decision in ICU will be
suggested in order to treat intensively high risk patient first. This decision is
important to save the life of patients and decrease the mortality rate.
In this study, there are eight cases of data considered as a result of using AHP
technique and FCM model toward independent data. Eight cases involving six
independent variables with different combination of variable types in each case were
considered in order to find the best modified data using MLR and FCRM models.
The variables involved are sex (1x is binary), race (
2x is category), orgfail (3x is
binary or continuous), comorbid (4x is binary or continuous), mecvent (
5x is binary)
and s2sadm (6x is binary or continuous). Case 4 in the Section 6.2.1 is the beginning
data without any modification toward data.
After that, other models will be applied to the best modified data such as
multiple linear regression (MLR) model, MLR model with LQD technique, MLR
with truncated error, Cox proportional hazard model, fuzzy linear regression model
or FLRM (Tanaka and Ni model), fuzzy least squares regression model or FLSRM
(Chang model), fuzzy c-regression models or FCRM (Hathaway & Bezdek and
Kung & Lin model) and new affine TS fuzzy models. We also proposed new models
which are fuzzy c-regression truncated models (FCRTM) and fuzzy c-regression
LQD models (FCRLM).
The comparison among other models with FCRTM and FCRLM models will
be carried out including its assumption, function of model and the mean square error
(MSE). The model with the lowest MSE will be chosen as the best model. The
search of the best model is important in order to get the approximation of solution
which is closer to the exact solution for the health indicator.

13
1.7 Research Contributions
There are many benefits that can be gained from this study which can
contribute immensely, mainly to the hospital ICU. The contributions can be stated as
follows;
(i). The application of data mining technique that is analytic hierarchy process
(AHP) in order to fuzzify the binary data so that more accurate prediction can
be obtained.
(ii). The suggestion of critical point of health indicator using fuzzy c-means
(FCM) model which could be classified as a high risk patient. The making of
medical decision in ICU can be more reliable since high-risk patients should
be treated first.
(iii). The application of multiple linear regression (MLR) model, Cox proportional
hazard model, fuzzy linear regression model (FLRM), fuzzy least squares
regression model (FLSRM), fuzzy c-regression models (FCRM), new affine
Takagi Sugeno fuzzy models, fuzzy c-regression truncated models (FCRTM)
and fuzzy c-regression LQD models (FCRLM) for the health indicator in the
ICU.
(iv). The recommendation based on the better model in achieving better services
in the ICU, be applied not only in Malaysia but also in other countries.
1.8 Research Importance
Kao (1974) suggested a medical decision in the ICU field by applying the
motto “Treating High-risk Patients First”. However, he did not use this motto in his
study. In this study, we propose the health indicator of patients to be based on their
value of SAPS II of discharge (s2sdisc). The value of s2sdisc could be predicted by
FCRTM and FCRLM models based on the value of independent variables.
The patients admitted to the ICU are those who come from areas outside the
hospital or from within the hospital itself. Since there are many patients admitted to
the ICU, the difficulty is to apply the motto “Treating High-risk Patients First”. In

14
order to identify the high-risk patients, each patient should have a calculated
indicator of their level of health. The patients with high value level of health
indicator or classified as high risk patients should be treated immediately and
aggressively. This is the importance of the medical decision made in the ICU in
order to save the lives of patients with critical conditions. This decision is important
to the ICU management in order to decrease mortality rate. As a result, the quality
management in ICUs could be improved by decreasing the mortality rate.
Additionally, this medical decision making process has not been applied in ICU of
any hospitals in this world.
Chapter 2 indicates that many methods used in the ICU involve MLR model
and logistic regression model. The fuzzy models are still not a common method used
in the ICU. Only Pilz and Engelmann (1998) did a basic fuzzy rule which is given by
physician to determine the medical decision made in the ICU. For example, the five
conditions of mean arterial pressure (MAP) were determined by 25 fuzzy rules
which are the combination of heart rate (very high, high, normal, low and very low)
and blood pressure (very high, high, normal, low and very low) which could give a
confusing decision. However they did not use FCM and FCRM models to analyze
their data. Taking the idea of their work in the field of ICU may give this study a
challenge. Since the FCM, FCRM, FCRTM and FCRLM models have not yet been
explored in the ICU, we propose the use of these models in the ICU study. The
dependent variable used is s2sdisc or health indicator which corresponds and has
high correlation with mortality rate. In addition, there are not many rules used in this
modelling.
Takrouri (2004) made a medical decision in the ICU. He organized ICUs that
cared more for seriously ill patients. This has raised ethical and professional issues
related to some patients who had untreatable medical conditions or those who
sustained unsalvageable damage to their vital organs. However, he did not use any
logistic regression or fuzzy model in his research. The determination of the patients’
state of health becomes crucial when there are too many patients who need to be
admitted to the ICU and there is insufficient space in the ICU. In fact the application
of certain method is still needed in ICU’s management.

15
In order to improve the models, we use the data mining technique that is,
AHP technique to fuzzify the binary data of comorbid diseases and organ failures.
This technique will transform the binary data to a continuous data within [0,1]
interval which is expected to be more accurate and near to the real situation. In fact,
this technique is a new technique in analyzing data obtained from ICU.
In FCRM models, there are two important factors, namely the fuzzy model
(fuzzification and defuzzification) and the MLR model. Both factors are closely
associated in producing the final FCRM models. In this case, the MLR model used in
FCRM models is the basic model without considering the problem of outlier data.
So, FCRM models common issue is that it is vulnerable to outlier data. In any
statistical studies, researchers want to find the latest methods in minimizing the
errors.
Several current methods of addressing outlier in the MLR model can be
adapted in FCRM models such as least median squares (LMS), least trimmed squares
(LTS), deepest regression and least quartile difference (LQD) method. Because of
this reason, the new FCRTM and FCRLM models are proposed in this thesis which
are robust against outlier. FCRLM models are based on the existing LQD techniques
while FCRTM models are based on new ideas about the percentage of contaminated
data in the breakdown point. However, FCRTM models show better model in
modelling health indicator in the ICU. A significant advantage in the use of fuzzy
model is that it can be used for all data types without the need for early assumptions.
However, the disadvantage for multiple linear regression model is the residuals
should be first fulfill the assumption of normality.
1.9.1 Thesis Organisation
This thesis contains eight chapters. Chapter 1 is the introduction to the thesis.
This chapter gives an introduction to the research background, history of ICU,
problem description, research objectives, research scopes, research contribution,
research importance and a thesis organization.

16
Chapter 2 is the literature review that contains a discussion on the current and
past research on medical field especially in the ICU. The applications of fuzzy
modelling are also presented in several fields such as science, medicine, engineering,
computer, economics, management and so on. Previous studies on FCRM models are
also presented.
In Chapter 3, a detailed explanation of the nine models/technique used in this
thesis is presented. The models/technique discussed are multiple linear regression
(MLR) model, analytical hierarchy process (AHP) technique, fuzzy c-means (FCM)
model, fuzzy c-regression models (FCRM), fuzzy linear regression model (FLRM),
fuzzy least squares regression model (FLSRM), new affine Takagi Sugeno fuzzy
models, fuzzy c-regression truncated models (FCRTM) and fuzzy c-regression LQD
models (FCRLM).
Chapter 4 will discuss the analysis of the proposed model, fuzzy c-regression
truncated model (FCRTM) using simulated data. The simulated data are created
using S-Plus program. The simulated data consist of one dependent variable and four
independent variables. This chapter is important to make sure that simulated data are
suitable for the evaluation of the proposed models. Indeed, the proposed model
comprises 5 procedures whereby all the procedures need to be fulfilled to validate
the potentiality of the proposed model.
The discussion of data background and development of data mining
technique (analytic hierarchy process or AHP), fuzzy c-means (FCM) model and
multiple linear regression (MLR) model will be presented in Chapter 5. Here, the
binary data of comorbid diseases and organ failures will be fuzzified into the
continuous data with [0, 1] interval. The different types of comorbid diseases or
organ failures will be weighted based on their importance. AHP technique is
predicted to get the higher accuracy of prediction. The FCM model will be used to
identify the critical point of health indicator.
In Chapter 6, the development of the newly proposed model that are fuzzy c-
regression truncated models (FCRTM) and fuzzy c-regression LQD models
(FCRLM) will be discussed. Both models are models resulting from the modification

17
of FCRM models. It has five procedures to be followed. The difference of these two
models is in the fifth procedure. FCRTM models using truncated residual method,
while FCRLM models using the least quartile difference (LQD) technique. In the
first procedure, eight cases of data are considered for FCRM models. It includes the
original data for the six dependent variables and modified data for the orgfail,
comorbid and s2sadm variables of a binary and continuous data using AHP and FCM
model.
Chapter 7 discusses the analysis of other models such as multiple linear
regression (MLR) model, MLR model with LQD technique, MLR model with
truncated residual technique, Cox proportional hazards model, fuzzy linear
regression model 1 (Tanaka model), fuzzy linear regression model 2 (Ni model),
fuzzy least squares regression model (Chang model), fuzzy c-regression models 1
(Hathaway & Bezdek model), fuzzy c-regression models 2 (Kung & Lin model) and
new affine Takagi Sugeno fuzzy models. The overall comparisons among other
models with the FCRTM and FCRLM models are discussed to show the reliable and
potential of FCRTM and FCRLM models.
Chapter 8 concludes and summarizes the study of the modelling of health
indicator in the ICU and then discusses some important results and findings. The best
model which has the lowest MSE value will be revealed. Recommendations on areas
related to the findings and possible directions for future research in modelling health
indicator in the ICU are also presented here.

215
REFERENCES
Abonyi, J. and Feil, B. (2007). Cluster Analysis for Data Mining and System
Identification. USA: Springer.
Agresti, A. and Finlay, B. (1997). Statistical Methods for the Social Sciences. USA:
Prentice-Hall, Inc.
Akhavi, F. and Hayes, C. (2003). A Comparison of Two Multi-Criteria Decision-
Making Techniques. Proceedings Of The IEEE International Conference On
Systems Man And Cybernetics. 1: 956-961.
Andersen, E. B. (1997). Introduction to the Statistical Analysis of Categorical Data.
Berlin. Heidelberg: Springer-Verlag.
Angelov, P. (2004). An Approach for Fuzzy Rule-base Adaptation Using On-line
Clustering. International Journal of Approximate Reasoning. 35: 275–289.
Angus, D. C., Kelley, M. A., Schmitz, R. J., White, A., Popovich, J. (2000). Current
and Projected Workforce Requirements for Care of the Critically Ill and Patients
with Pulmonary Disease: Can We Meet the Requirements of an Aging
Population?. The Journal of the American Medical Association. 284(21): 2762-
2770.
Azme Khamis (2005). Application of Statistical and Neural Network Model for Oil
Palm Yield Study. Ph.D. Thesis. Universiti Teknologi Malaysia, Malaysia.
Babuska, R. (1988). Fuzzy Modeling for Control. Boston: Kluwer Academic
Publishers.
Banday, S. H. and Shah, M. A. (1994). Dictionary of Statistics. New Delhi: Anmol
Publications PVT LTD.
Bao, Y., Wu, Y., He, Y. and Ge, X. (2004). An Improved AHP Method in
Performance Assessment. Proceedings of the 5th World Congress on Intelligent
Control and Automation, 15-19th
June, 2004. Hangzhou, China, 177-180.
Barnett, V. and Lewis, T. (1994). Outliers in Statistical Data. England: John Wiley
& Sons Ltd.

216
Bargiella, A., Pedrycz, W. and Nakashima, T. (2007). Multiple Regression with
Fuzzy Data. Fuzzy Sets and Systems. 158: 2169-2188.
Belsley, D.A., Kuh, E.,Welsch, R.E. (1980). Regression Diagnosis, Identifying
Influential Data and Sources of Collinearity. New York: John Wiley & Sons,
Inc.
Berg, B. W., Vincent, D. S. and Hudson, D. A. (2004). Remote Critical Care
Consultation: Telehealth Projection of Clinical Specialty Expertise. Journal
Telemed Telecare. 9(2): 9-11.
Berget, I., Mevik, B. H. and Naes, T. (2008). New Modifications and Applications of
Fuzzy C-Means Methodology. Computational Statistics & Data Analysis. 52:
2403-2418.
Berenholtz, S. M., Dorman, T., Ngo, K. and Pronovost, J. (2002). Qualitative
Review of Intensive Care Unit Quality Indicators. Journal of Critical Care.
17(1): 1-12.
Bernholt, T., Nunkesser, R. and Schettlinger, K. (2007). Computing the Least
Quartile Difference Estimator in the Plane. Journal Computational Statistics and
Data Analysis. 52(2): 763-772.
Bezdek, J. C. (1974). Cluster Validity with Fuzzy Set. Journal Cybernetic. 3: 58–72.
Bezdek, J. C. (1981). Pattern Recognition with Fuzzy Objective Function
Algorithms. USA: Kluwer Academic Publishers.
Bolotin, A. (2005). Fuzzification of Linear Regression Models with Indicator
Variables in Medical Decision Makin. Proceedings of the International
Conference on Computational Intelligence for Modelling, Control and
Automation and International Conference on Intelligent Agents, Web
Technologies and Internet Commerce. 1: 572-576.
Breslow, M. J., Rosenfeld, B. A., Doerfler, M., Burke, G., Yates, G., Stone, D. J.,
Tomaszewicz, P., Hochman, R. and Plocher, D. W. (2004). Effect of a Multiple-
Site Intensive Care Unit Telemedicine Program on Clinical and Economic
Outcomes: An Alternative Paradigm for Intensivist Staffing. Journal of Society
of Critical Care Medicine. 32(1): 31-38.
Chang, Ping-Teng (1994). Fuzzy Regression Analysis. Ph.D. Dissertation, Kansas
State University, USA.
Chang, R. W. S., Jacobs, S. and Lee, B. (1988). Predicting Outcome among Intensive
Care Unit Patients Using Computerised Trend Analysis of Daily Apache II

217
Scores Corrected for Organ System Failure. Journal of Intensive Care Medicine.
14(5): 558-566.
Chao, C. T., Chen, Y. J. and Teng, C. C. (1996). Simplification of Fuzzy Neural
System Using Similarity Analysis. IEEE Transaction System, Man Cybernetic,
Part B. 26(2): 344-354.
Ch’en, S. H. (1985). Operations on Fuzzy Number with Function Principle. Tamkang
Journal Management of Science. 6: 13-25.
Chen, M. Y. and Linkens, D. A. (2004). Rule-Base Self-Generation and
Simplification for Data-Driven Fuzzy Models. Fuzzy Sets System. 142(2): 243–
265.
Chou, W. H. (2008). Using AHP to Assess a Plan of Training the Adolescent Golf
Player. Fifth International Conference on Fuzzy Systems and Knowledge
Discovery. 18-20th
October, 2008. Jinan Shandong, China, 575-579.
Chuang, C. C., Su, S. F. and Chen, S. S. (2001). Robust TSK Fuzzy Modeling for
Function Approximation with Outliers. IEEE Transactions on Fuzzy System.
9(6): 810–821.
Clark, M. C., Hall, L. O., Goldgof, D. B., Velthuizen, R., Murtaugh, R. and Silbiger,
M. S. (1999). Unsupervised Brain Tumor Segmentation Using Knowledge-Based
and Fuzzy Techniques. Fuzzy and Neuro-fuzzy Systems in Medicine. 1: 137-169.
Colpan, A., Akinci, E., Erbay, A., Balaban N. and Bodur, H. (2005). Evaluation of
Risk Factors for Mortality in Intensive Care Units: A Prospective Study from a
Referral Hospital in Turkey. American Journal of Infection Control. 33(1): 42-
47.
Cox, D.R. and Oakes, D. (1990). Analysis of Survival Data. London: Chapman &
Hall.
Croux, C., Rousseeuw, P. J. and Hossjer, O. (1994). Generalized S-estimators.
Journal of the American Statistical Association. 89: 1271-1281.
D’Urso, P. (2003). Linear Regression Analysis for Fuzzy/Crisp Input and
Fuzzy/Crisp Output Data. Computational Statistics & Data Analysis. 42: 47-72.
D’Urso, P. and Gastaldi, T. (2002). An “Orderwise” Polynomial Regression
Procedure for Fuzzy Data. Fuzzy Sets and Systems. 130: 1-19.
D’Urso, P. and Santoro, A. (2006). Goodness of Fit and Variable Selection in the
Fuzzy Multiple Linear Regression. Fuzzy Sets and Systems. 157: 2627-2647.
218
Devillez, A., Billaudel, P. and Lecolier, G. V. (2002). A Fuzzy Hybrid Hierarchical
Clustering Method with a New Criterion Able to Find the Optimal Partition.
Fuzzy Sets and System. 128(3): 323-338.
Dewan Bahasa dan Pustaka (1992). Istilah Matematik. Kuala Lumpur: Percetakan
Dewan Bahasa dan Pustaka.
Dewan Bahasa dan Pustaka (1999). Kamus Dwibahasa Bahasa Inggeris-Bahasa
Malaysia. Kuala Lumpur: Percetakan Dewan Bahasa dan Pustaka.
Dey, P. K., Hariharan, S. and Brookes, N. (2006). Managing Healthcare Quality
Using Logical Framework Analysis. Managing Service Quality. 6(2): 203-222.
Diamond, P. (1987). Least Squares Fitting of Several Fuzzy Variables. Proceedings
of the 2nd IFSA Congress. July 1987. Tokyo, Japan, 20-25.
Dickerson, J. A. and Kosko, B. (1996). Fuzzy Function Approximation with
Ellipsoidal Rules. IEEE Transaction Systems, Man Cybernetic. 26(4): 542-560.
Diez, J. L., Navarro, J. L. and Sala, A. (2007). A Fuzzy Clustering Algorithm
Enhancing Local Model Interpretability. Soft Computing Journal. 11: 973-983.
Diez, J. L., Sala, A. and Navarro, J. L. (2006). Target-Shaped Possibilistic Clustering
Applied to Local-Model Identification. Engineering Applications of Artificial
Intelligence. 19: 201-208.
Dobson, A. J. (1991). An Introduction to Generalized Linear Models. London:
Chapman & Hall.
Donoho, D. L. and Huber, P. J. (1983). The Notion of Breakdown Point. In A
Festschrift for Erich L. Lehmann (edited by Bickel, P. J., Doksum, K. A. and
Hodges, J. L.). Belmont, CA: Wadsworth, pp. 157–184.
Doring, C., Lesot, M. J. and Kruse, R. (2006). Data Analysis with Fuzzy Clustering
Methods. Computational Statistics & Data Analysis. 51: 192-214.
Draper, N. R. and Smith, H. (1981). Applied Regression Analysis (2nd Edition).
New York: John Wiley.
Dunn, J. C. (1973). A Fuzzy Relative of the ISODATA Process and Its Use in
Detecting Compact Well-Separated Clusters. Journal of Cybernetics. 3: 32-57.
Fan, J., Xie, W. and Pei, J. (1999). Subsethood Measure: New Definitions. Fuzzy
Sets System. 106(2): 201-209.
Fan, J. S., Kao, W. F., Yen, D. H. T., Wang, L. M., Huang, C. I. And Lee, C. H.
(2007). Risk Factors and Prognostic Predictors of Unexpected Intensive Care

219
Unit Admission within 3 Days after ED Discharge. The American Journal of
Emergency Medicine. 25(9): 1009-1014.
Fausett, L. V. (1999). Applied Numerical Analysis Using MATLAB. USA: Prentice
Hall, Inc.
Ferguson, T.S. (1967). On The Rejection of Outliers. Journal of Fourth Berkley
Symposium (University of California). 253-287.
Ferris, M. C., Mangasarian, O. L. and Wright, S. J. (2007). Linear Programming
With MATLAB. USA: Society for Industrial and Applied Mathematics.
Fiordaliso, A. (1998). Analysis Improvement of Takagi-Sugeno Fuzzy Rules Using
Convexity Constraints. IEEE International Conference on Tools with Artificial
Intelligence. 10-12th
November, 1998. Taipei, Taiwan, 232-235.
Flores-Sintas, A., Cadenas, J. M. and Martin, F.(2000). Partition Validity and
Defuzzification. Fuzzy Sets System. 112(3): 433-447.
Frair, L., Matson, J. O., Matson, J. E. (1998). An Undergraduate Curriculum
Evaluation with the Analytic Hierarchy Process. Proceeding FIE '98
Proceedings of the 28th Annual Frontiers in Education. 3: 992-997.
Garland, A. (2005). Improving the ICU (Part 1). American College of Chest
Physicians. 127: 2151-2164.
Gath, I. and Geva, A. B. (1989). Unsupervised Optimal Fuzzy Clustering. IEEE
Transaction Pattern Anal, Machine Intell. 11(7): 773-781.
Ghiaus, C. (2005). Experimental Estimation of Building Energy Performance by
Robust Regression. Journal of Energy and Buildings. 38: 582–587.
Grisales, V. H., Gauthier, A. and Roux, G. (2005). Fuzzy Model Identification of a
Biological Process Based on Input-Output Data Clustering. IEEE International
Conference on Fuzzy Systems. 927-932.
Gustafson, E. E. and Kessel, W. C. (1979). Fuzzy Clustering with a Fuzzy
Covariance Matrix. Proceeding IEEE CDC, San Diego. 761–766.
Hariharan, S., Dey P. K., Moseley H. S. L., Kumar, A. Y. and Gora, J. (2004). A
New Tool for Measurement of Process-Based Performance of Multispecialty
Tertiary Care Hospitals. International Journal of Health Care Quality Assurance.
17(6): 302-312.
Hathaway, R. J., and Bezdek, J. C. (1993). Switching Regression Models and
Fuzzy Clustering. Pattern Recognition Letters. 23: 151-160.
220
Hathaway, R. J., and Bezdek, J. C. (2002). Clustering Incomplete Relational Data
Using the Non-Euclidean Relational Fuzzy C-Means Algorithm. IEEE
Transactions on Fuzzy Systems. 1(3): 195-204.
Hathaway, R. J., and Bezdek, J. C. (2006). Extending Fuzzy and Probabilistic
Clustering to Very Large Data Sets. Computational Statistics & Data Analysis.
51: 215-234.
Hao, L. C. and Hui, J. Y. (2007). Group Prioritization in the Analytic Hierarchy
Process (AHP) by an Improved Fuzzy Preference Programming Approach.
International Conference on Wireless Communications, Networking and Mobile
Computing, WiCom 2007. 21-25th
September, 2007. Shanghai, China.
Hill, A. D., Vingilis, E., Martin, C. M., Hartford, K. and Speechley, K. N. (2007).
Interhospital Transfer of Critically Ill Patients: Demographic and Outcomes
Comparison with Nontransferred Intensive Care Unit Patients. Journal of
Critical Care. 22(4): 290-295.
Honda, K., Ohyama, T., Ichihashi, H. and Notsu, A. (2008). FCM-Type Switching
Regression with Alternating Least Squares Method. IEEE International
Conference on Fuzzy Systems. 10: 122-127.
Hoppner, F., Klawonn, F., Kruse, R., and Runkler, T. (1999). Fuzzy Cluster Analysis,
Methods for Classification, Data Analysis and Image Recognition. New Jersey:
John Wiley & Sons.
Hoppner, F. and Klawonn, F. (2003): Improved Fuzzy Partitions for Fuzzy
Regression Models. International Journal of Approximate Reasoning. 32: 85-
102.
Hoppner, F. and Klawonn, F. (2004). Learning Fuzzy Systems – An Objective
Function-Approach. Mathware & Soft Computing. 11: 143-162.
Hsiao, C. C. and Su, S. F. (2005). Robust TSK Fuzzy Modeling with Proper
Clustering Structure. SICE Annual Conference 2005 in Okayama University,
Japan. 1564-1569.
Huband, J. M., Bezdek, J. C. and Hathaway, R. J. (2005). BigVAT: Visual
Assessment of Cluster Tendency for Large Data Sets. Pattern Recognition
Society. 38: 1875-1886.
Hui Feng (2007). Bayesian and Nonbayesian Contributions to Fuzzy Regression
Analysis. Bayesian. Ph.D. Dissertation. University of Victoria, USA.

221
Hwang, S. and Chao, J. J. (1996). An Identification Algorithm in Fuzzy Relational
Systems. IEEE Proceeding of 1996 Asian Fuzzy System. 9: 254-259.
Jafelice, R. M., de Barros, L. C., Bassanezi, R. C. and Gomide, F. (2004). Fuzzy
Modeling in Symptomatic HIV Virus Infected Population. Bulletin of
Mathematical Biology. 66(6): 1597-1620.
Junoy, J. P. (1997). Measuring Technical Efficiency of Output Quality in Intensive
Care Units. International Journal of Health Care Quality Assurance. 10(3): 117-
124.
Kao, E. P. C. (1974). Study of Patient Admission Policies for Specialized Care
Facilities. IEEE Transactions on Systems, Man, and Cybernetics. 4(6): 505-512.
Kim, E., Park, M., Ji, S., and Park, M. (1997). A New Approach to Fuzzy Modeling.
IEEE Transaction on Fuzzy Systems. 5(3): 328–337.
Kim, B. and Bishu, R. R. (1998). Evaluation of Fuzzy Linear Regression Models by
Comparing Membership. Fuzzy Sets and Systems. 100: 343-352.
Kim, J. Y., Hwang, J. H., Kim, J. S., Hwang, Y. S., Kim, M. Y., Kang, J. S. and Min
I. S. (2004). Variations in ICU Mortality Rates and the Need for Quality
Improvement in Korea. Amsterdem Conference Isqua, IND19-10-04.
Kleinbaum, D. G. (1994). Logistic Regression : A Self-Learning Text. New York:
Springer-Verlag, Inc.
Knaus, W. A. , Wagner, D. P., Loirat, P., Cullen, D. J., Glaser, P., Mercier, P., Nikki,
P., Snyder, J. V., Le Gall, J. R., Draper, E. A., Campos, R. A., Kohles, M. K.,
Granthil, C., Nicolas, F., Shin, B., Wattel, F. and Zimmerman, J. E. (1982). A
Comparison of Intensive Care in the U.S.A. and France. The LANCET Journal.
320(8299): 642-646.
Kotnarowski, M. (2010). Measurement of Distance between Voters and Political
Parties – Different Approaches and Their Consequences. 3rd ECPR Graduate
Conference Dublin. 30 August – 1 September, 2010. Dublin, England.
Kung, C. C. and Lin, C. C. (2004). A New Cluster Validity Criterion for Fuzzy C-
Regression Model and Its Application to T-S Fuzzy Model Identification. IEEE
International Conference on Fuzzy Systems. 3: 1673-1678.
Kung, C. C. and Su, J. Y. (2007). Affine Takagi-Sugeno Fuzzy Modelling Algorithm
by Fuzzy C-Regression Models Clustering with a Novel Cluster Validity
Criterion. IET Control Theory Application. 1(5): 1255-1265.

222
Le Gall, J. R., Lemeshow, S. and Saulnier, F. (1993). A New Simplified Acute
Physiology Score (SAPS II) Based on a European/North American Multicenter
Study. Journal of American Medical Association. 270(24): 2957-2963.
Li, C. and Sun, Y. (2008). An Improved Ranking Approach to AHP Alternatives
Based on Variable Weights. Proceedings of the 7th World Congress on Intelligent
Control and Automation. 25- 27th
June, 2008. Chongqing, China.
Liao, T. W., Celmins, A. K. and Hammell, R. J. II (2003). A Fuzzy C-Means Variant
for the Generation of Fuzzy Term Sets. Fuzzy Sets System. 135(2): 279-303.
Lin, Y. and Cunningham, G. A. III (1995). A New Approach to Fuzzy-Neural
System Modeling. IEEE Transaction on Fuzzy Systems. 3(2): 190-198.
Leski, J. M. (2004). ε-Insensitive Fuzzy C-Regression Models: Introduction to ε-
Insensitive Fuzzy Modeling. IEEE Transactions on Systems, Man, and
Cybernetics. 34(1): 4-15.
Leski, J. M. (2004). Fuzzy C-Varieties/Elliptotypes Clustering in Reproducing
Kernel Hilbert Space. Fuzzy Sets System. 141(2): 259-280.
Marsus, M. (1993). Matrices and MATLAB : A Tutorial . USA: Prentice-Hall, Inc.
McMeekin, C. C. (1994). An Estimation Procedure to Detect and Remove
Unintentional Judgmental Bias (UJB) in the Analytic Hierarchy Process
Methodology. Engineering Management Conference IEEE International. 17 -
19th
October, 1994. Dayton North, USA.
Meadow, W., Hall, J., Frain, L., Ren, Y., Pohlman, A., Plesha-Troyke, S., Gresens,
W. and Lantos, J. (2003). Some are Old, Some are New: Life and Death in the
ICU. Seminars in Perinatology. 27(6): 471-479.
Mohd Saifullah Rusiman, Zalina Mohd Daud, Ismail Mohamad (2004). The
Comparison between Logit, Probit and Linear Probability Models toward
Mortality Rate at ICU General Hospital. Jurnal Statistika. 4(2), 129-138.
Mohd Saifullah Rusiman, Zalina Mohd Daud, Ismail Mohamad (2007).
Perbandingan Teori Model Binari (Comparisons of Theoritical Binary Models).
MATEMATIKA. 23(1): 51-66.
Mohd Saifullah Rusiman (2007). The Technique of Data Robustness in Logit
Modeling. Proceedings of 5th SEAMS-GMU International Conference on
Mathematics and Its Applications. 24-27th
July, 2007. Universiti Gadjah Mada,
Yogyakarta, Indonesia, 615-621.

223
Mohd Saifullah Rusiman, Robiah Adnan, Efendi Nasibov & Kavikumar Jacob
(2011). Modification of Continuous and Binary ICU Data in FCRM Models.
International Seminar on the Application of Science & Mathematics (ISASM)
2011. 1-3rd
November, 2011. PWTC, Kuala Lumpur, Malaysia.
Montgomery, D. C. and Peck, E. A. (1992). Introduction to Linear Regression
Analysis (2nd Edition). New York: John Wiley & Sons.
Mustafa, M. A. and Al-Bahar, J. F. (1991). Project Risk Analytic Assessment Using
the Hierarchy Process. IEEE Transactions on Engineering Management. 38(1):
46-52.
Neter, J., Wasserman, W. and Kutner, M.H. (1983). Applied Linear Regression
Models. New York: Richard D. Irwin, Inc.
Ni, Y. S. (2005). Fuzzy Correlation and Regression Analysis. Ph.D. Dissertation.
University of Oklahoma, USA.
Noortgate, N. V. D., Vogelaers, D., Afschrift, M. and Colardyn, F. (1999). Intensive
Care for Very Elderly Patients: Outcome and Risk Factors for In-Hospital
Mortality. British Geriatrics Society. 28: 253-256.
Norusis, M. J. (1993). SPSS for Windows Advanced Statistics Release 6.0. USA:
SPSS Inc.
Oh, C. H., Honda, K. and Ichihashi, H. (2001). Fuzzy Clustering for Categorical
Multivariate Data. IFSA World Congress and 20th NAFIPS International
Conference 2001. 4: 2154-2159.
Ohnishi, S. and Imai, H. (1998). Evaluation for a Stability of Fuzzy Decision Making
Using a Sensitivity Analysis. Fuzzy Information Processing Society - NAFIPS,
1998 Conference of the North American. 20 – 21th
August 1998, Pensacola
Beach, FL.
Owczarek, A. Gacek, A. and Leski J. M. (2005). Multi-Channels Time-Domain-
Constrained Fuzzy C-Regression Models. Advances in SoftComputing, 30: 263-
270.
Ozaki, M. (1999). A Fuzzy System for Dental Development Age Evaluation. Fuzzy
and Neuro-fuzzy Systems in Medicine. 2: 195-210.
Ozdemir, M. S. and Saaty, T. L. (2006). The Unknown in Decision Making What to
do About It. European Journal of Operational Research. 174: 349–359.
Pal, N. R. and Bezdek, J. C. (1995). On Cluster Validity for the Fuzzy C-Means
Model. IEEE Transaction Fuzzy System. 3(3): 370–379.

224
Pedryoz, W. (2005). Knowledge-Based Clustering: From Data to Information
Granules. John Wiley & Sons.
Perego, A. and Rangone, A. (1996). On Integrating Tangible and Intangible
Measures in AHP Applications: A Reference Framework. IEEE International
Conference on Systems, Man, and Cybernetics. 14-17th
October, 1996. Beijing,
China.
Pilz, U. and Engelmann, L. (1998). Integration of Medical Knowledge in an Expert
System for Use in Intensive Care Medicine. Fuzzy and Neuro-fuzzy Systems in
Medicine. 2: 290-315.
Powell, J. R. W. (2005). The Relationship between Time Spent in the Emergency
Department and Patient Outcomes in the Medical Intensive Care Unit. USA:
Dissertation of D’Youville College.
Pronovost, P. J. , Berenholtz, S. M., Ngo, K., McDowell, M., Holzmueller, C.,
Haraden, C., Resar, R., Rainey, T., Nolan, T. and Dorman, T. (2003). Developing
and Pilot Testing Quality Indicators in the Intensive Care Unit. Journal of
Critical Care. 18(3): 145-155.
Rao, G. S. (2006). Numerical Analysis. Daryaganj, New Delhi: New Age
International.
Rhee, H. S. and Oh, K. W. (1996). A Validity Measure for Fuzzy Clustering and Its
Use in Selecting Optimal Number of Clusters. Proceeding IEEE International
Conference in fuzzy system. 2: 1020-1025.
Rotshtein, A. (1999). Design and Tuning of Fuzzy Rule-Based Systems for Medical
Diagnosis. Fuzzy and Neuro-Fuzzy Systems in Medicine. 2: 243-289.
Rousseeuw, P. J. (1984). Least Median of Squares Regression. Journal American
Statistical Association. 79: 871–880.
Rousseeuw, P.J., Hubert, M. (1999). Regression Depth. Journal American Statistical
Association. 94 (446): 388–402.
Rousseeuw, P. J., Leroy, A. M. (1987). Robust Regression and Outlier Detection.
Wiley, NewYork.
Rovatti, R. (1996). Takagi-Sugeno Models as Approximators in Sobolev Norms: The
SISO Case. 5th Proceeding of IEEE Conference on Fuzzy Systems, New Orleans.
3: 1060-1066.
Ruiswyk, J. V., Hartz, A., Kuhn, E. and Rimm, A. (1991). Linking Process and
Outcome in Quality of Care Assesstment. IEEE Journal. 8: 2117-2120.

225
Rusiman, M. S., Nasibov, E., and Adnan, R. (2011). The Optimal Fuzzy C-
Regression Models (OFCRM) in Miles Per Gallon of Cars Prediction. IEEE
Student Conference on Research and Development (SCORED) 2011. 19-20th
December, 2011. Kelab Komuniti Taman Tasik Cyberjaya, Malaysia, 251-256.
S. Mahmoud Taheri (2003). Trends in Fuzzy Statistics. Austrian Journal Of
Statistics. 32(3): 239-257.
Saaty, T. L. (1977). A Scaling Method for Priorities in Hierarchical Structures.
Journal of Mathematical Psychology. 15(3): 234-281.
Saaty, T. L. and Hu, G. (1998). Ranking by Eigenvector Versus Other Methods in
the Analytic Hierarchy Process. Applied Mathematics Letters. 11(4): 121-125.
Schniederjans, M. J. (2004). Information Technology Investment : Decision-Making
Methodology. Singapore: World Scientific Publishing Company, Inc.
Siarry, P. and Guely, F. (1998). A Genetic Algorithm for Optimizing Takagi-Sugeno
Fuzzy Rule. Fuzzy Sets and Systems. 99: 37-47.
Silva, A., Cortez, P., Santos M. F., Gomes L. and Neves, J. (2005). Mortality
Assessment in Intensive Care Units Via Adverse Events Using Artificial Neural
Networks. Artificial Intelligence in Medicine. 36: 223-234.
Simchen, E., Sprung, C. L., Galai, N., Zitser-Gurevich, Y., Bar-Lavi, Y., Gurman,
G., Klein, M., Lev, A., Levi, L., Zveibil, F., Mandel, M., Mnatzaganian, G.
(2004). Survival of Critically Ill Patients Hospitalized in and out of Intensive
Care Units under Paucity of Intensive Care Unit Beds. Critical Care Medicine.
32(8): 1654-1661.
Sintas, A. F., Cadenas, J. M. and Martin, F. (2000). Partition validity and
defuzzication. Fuzzy Sets and Systems. 112 (2000): 433 - 447.
Sivanandam, S. N., Sumathi, S. and Deepa, S. N. (2007). Introduction to Fuzzy Logic
using MATLAB. Berlin : Springer-Verlag Heidelberg.
Skarmeta, A. F. G., Delgado, M. and Vila, M. A. (1999). About the Use of Fuzzy
Clustering Techniques for Fuzzy Model Identification. Fuzzy Sets System.
106(3): 179-188
Sloane, E. B., Liberatore, M. J., Nydick, R. L., Luo, W. and Chung, Q. B. (2002).
Clinical Engineering Technology Assessment Decision Support: A Case Study
Using the AHP. Proceedings of the Second Joint EMBS/BMES Conference. 23-
26th
October, 2002. Houston, USA.

226
Sugeno, M. and Kang, G. T. (1988). Structure Identification of Fuzzy Model. Fuzzy
Sets Systems. 28(1): 15-33.
Sugeno, M. and Yasukawa, T. (1993). A Fuzzy-Logic-Based Approach to
Qualitative Modeling. IEEE Transaction Fuzzy System. 1: 7-31.
Takagi, T. and Sugeno, M. (1985). Fuzzy Identification of Systems and its
Applications to Modeling and Control. IEEE Transaction Systems, Man
Cybernatic. 15: 116-132.
Takrouri, M. S. M. (2004). Intensive Care Unit. The Internet Journal of Health. 3(2),
ISSN 1528-8315.
Tanaka, H., Uejima, S. and Asai, K. Linear Regression Analysis with Fuzzy Model.
IEEE Transactions On Systems, Man, and Cybernetics. 6: 903-907.
The Committee for National Audit on Adult Intensive Care Units (2002). Protocol :
National Audit on Adult Intensive Care Units. Kuala Lumpur: Ministry of Health.
Ting, C. S. (2006). Stability Analysis and Design of Takagi–Sugeno Fuzzy Systems.
Information Sciences. 176: 2817-2845.
Tsekouras, G., Sarimveis, H., Kavakli, E. and Bafas, G. (2005). A Hierarchical
Fuzzy-Clustering Approach to Fuzzy Modeling. Fuzzy Sets System. 150(2): 245-
266.
Universiti Teknologi Malaysia (2007). UTM Thesis Manual July 2007. Johor Bahru:
UTM, Skudai.
Van Der Voort, P. H. J. (2005). Reducing ICU Mortality: To What Extent?.
Yearbook of Intensive Care and Emergency Medicine. 16: 755-759.
Wakabayashi, T., Itoh, K., Mitamura, T. and Ohuchi A. (1996). A Framework of an
Analytic Hierarchy Process Method Based on Ordinal Scale. Proceedings of the
Fifth IEEE International Conference on Fuzzy Systems. 8-11th
September, 1996.
New Orleans, USA.
Wang, L. X. (1994). Adaptive Fuzzy Systems and Control: Design and Stability
Analysis. New Jersey: Prentice-Hall.
Wang, L. X. (1997). A Course in Fuzzy Systems and Control. New Jersey: Prentice-
Hall.
Weisberg, S. (1985). Applied Linear Regression (2nd Edition). New York: John
Wiley & Sons.
227
Wolkenhauer, O. (2002). Fuzzy Regression Models, Fuzzy Clustering and Switching
Regression. Retrieved on 3rd
May, 2008 from http://www.sbi.uni-rostock.de
/uploads/tx_templavoila/SBI_Materials _Fuzzy-Regression.pdf.
Xie, X. L. and Beni, G. A. (1991). A Validity Measure for Fuzzy Clustering. IEEE
Transaction Pattern Anal. Machine Intelligent. 3(8): 841–846.
Xu, C. W. and Lu, Y. Z. (1987). Fuzzy Model Identification and Self-Learning for
Dynamic Systems. IEEE Transaction System, Man Cybernetic. 17: 683–689.
Yen, K. K., Ghoshray, S. and Roig, G. (1999). A Linear Regression Model Using
Triangular Fuzzy Number Coefficients. Fuzzy Sets and Systems. 106: 167-177.
Ympa, Y. P., Sakr, Y., Reinhart, K. and Vincent J. L. (2005). Has Mortality from
Acute Renal Failure Decreased? A Systematic Review of the Literature. The
American Journal of Medicine. 118(8): 827-832.
YongShen Ni (2005). Fuzzy Correlation and Regression Analysis. Doctor
Philosophy, University of Oklahoma, USA.
Yu, C. S. and Li, C. K. (2001). A Group Decision Making Fuzzy AHP Model and Its
Application to a Plant Location Selection Problem. IFSA World Congress and
20th NAFIPS International Conference. 25-28th
July, 2001. Vancouver, Canada.
Yuan, G. J. , Jia, L. and Li, Q. (2006). Research on Supply Chain performance
Evaluation Based on DEA/AHP model. Proceedings of the 2006 IEEE Asia-
Pacific Conference on Services Computing (APSCC'06). 26th
December, 2006.
Guangzhou, China.
Zadeh, L. A. (1965). Fuzzy Sets. Information and Control. 8 (3): 338–353.
Zhang, Y., Wang, W., Zhang, X. and Li Y. (2008). A Cluster Validity Index for
Fuzzy Clustering. Information Sciences Journal. 178: 1205–1218.
Zhang, Y. Zhang, H., Zhong, Z., Gao X. and Ni, Y. (2008). Objectively Evaluating
Environmental Comprehensive Quality by Improved AHP Method. The 2nd
International Conference on Bioinformatics and Biomedical Engineering, ICBBE
2008. 16-18th
May, 2008. Shanghai, China.