on the verge 2007
TRANSCRIPT

8/7/2019 On the verge 2007
http://slidepdf.com/reader/full/on-the-verge-2007 1/20
A policy brief for central governments in de-
veloped and developing countries, sub-sover-
eign national bodies, universities and research
institutes, community organisations, banks
and private investors, aid donors, multilateral
financial institutions, UN agencies and other
international organisations.
On the Verge of a
New Water Scarcity
A call for good governance and human ingenuity

8/7/2019 On the verge 2007
http://slidepdf.com/reader/full/on-the-verge-2007 2/20
SIWI Policy Brief: On the Verge of a New Water Scarcity
2
Table of Contents
Note to the Reader:
In spite of the fact that physical water scarcity is a dire reality
for millions of people, it is still not properly understood nor
recognised in many front-line discussions. An unfortunate con-
fusion regarding growing physical water scarcity distorts policy
formulation and effective action programmes. The scale and
magnitude of the challenge imply that “water scarcity will beeverybody’s business.” This policy brief, On the Verge of a New
Water Scarcity, looks closer into the issue, offers a set of distinc-
tions and concludes with structured policy suggestions.
How to Cite
Falkenmark, M., A. Berntell, A. Jägerskog, J. Lundqvist, M. Matz and H. Tropp. On the Verge of a New Water Scarcity:
A Call for Good Governance and Human Ingenuity. SIWI Policy Brief. SIWI, 2007.
Confusing Debate – Back to Basics 3
Recommendations for Policy Makers 3Is physical water scarcity an overlooked problem? 3Massive global change is adding new dimensions 4Climate change may make water-short regions even more water-short 4Time to prepare for multiple water scarcity? 4
Water Deficiency – Symptoms and Scale 5
Scarcity of what? 5Soil water deficiency has limited rural livelihoods in rainfed regions 5Blue water scarcity – growing competition for water in rivers and wells 5
Causes, Prospects, Implications 7
Water for plants and water for people 7Green water scarcity – the classic cause of famines 7Apparent versus real blue water scarcity 9
Wasteful use or large population? Blue water examples 11Apparent green water scarcity 12Meeting exploding water requirements for food and bioenergy 13
Policy Responses for Coping With Growing Water Scarcity 14
Water scarcity categories differ in terms of policy response 14Overcoming blue water scarcity through demand management, reallocation and water imports 15Overcoming green water scarcity through increasing water product ivity, land care and food imports 15Overarching governance components 16Concrete policy steps 18
References 19
The main author for the policy brief is Professor Malin
Falkenmark of the Stockholm International Water Institute
(SIWI). Contributing authors from SIWI include Mr. Anders
Berntell, Executive Director; Dr. Anders Jägerskog, Project
Director, SIWI Projects; Prof. Jan Lundqvist, Chair, Scien-
tific Programme Committtee; Mr. Manfred Matz, ProjectDirector, SIWI Help Desk; and Dr. Håkan Tropp, Project
Director, UNDP Water Governance Facility at SIWI.
Copyright © 2007, Stockholm International Water Institute (SIWI)
Design and production by Britt-Louise Andersson, SIWI. Cover Photo: Manfred Matz, SIWI.
Printed by Alfa Print, Sundbyberg, Sweden. The printing process has been certified according to the Nordic Swan
label for environmental quality. For electronic versions of this and other SIWI publications, visit www.siwi.org.
Photo: Katarina Andrzej ewska, SIWI

8/7/2019 On the verge 2007
http://slidepdf.com/reader/full/on-the-verge-2007 3/20
SIWI Policy Brief: On the Verge of a New Water Scarcity
3
Recommendations for Policy Makers
• Before attempting to boost water supplies, decision
makers should first seek to better manage demand.
Ways forward include decreasing losses in water supply
and irrigation systems, cutting subsidies to agriculture,
and putting in place realistic water-pricing measures.• When water scarcity is population-driven and demand
management in place, policy decisions on reallocation
of water resources need to be taken.
• Forward planning is essential in areas where water scar-
city is caused by seasonal changes and year-to-year
variation. This means taking action to store water and
food in good years.
• In arid areas where not enough rain falls, policy should
promote efficient farming practices that make the most
of all available water.
• On a global scale, policy decisions which reduce foodlosses should be taken.
• Policy makers must ensure that water governance is
flexible enough to make the best possible use of all
the water resources accessible.
• Stricter controls need to be put in place to curb water
pollution, as this will make more clean water accessible
to users.
For a fuller discussion of the recommendations, please see
page 14.
Is physical water scarcity an overlooked problem?
The 2006 Human Development Report, “Beyond Scarcity:
Power, Poverty and the Global Crisis,” (United Nations De-
velopment Programme 2006) considered water scarcity from
two points of view: (1) as a crisis arising from a lack of services
that provide safe water and (2) as a crisis caused by scarce water
resources. It concluded that the world’s water crisis is not relatedto the physical availability of water, but to unbalanced power
relations, poverty and related inequalities.
The focus now being placed on the importance of govern-
ance makes clear the importance of issues such as unfair power
structures, and weakly defined roles, rights and responsibili-
ties. These, it is felt, exacerbate natural water scarcity. This
way of thinking has been useful in that it has increased our
understanding of the need to manage demand as well as to
increase supply .
However, while governance remains a key challenge, we
also need to better understand the issue of ‘water crowding’– as increasing pressure is being placed on finite, erratically
available and vulnerable water resources. Recognising this is
the key to proper policy formulation.
Rather than addressing management/governance problems,
many countries still instinctively reach for supply-side solu-
tions such as desalination or the use of reservoirs and other
large-scale infrastructure. Such an approach is often the most
politically feasible option within the context of a country or
region’s water problems.
In certain situations, supply-oriented approaches are of
course needed. However, the sensible approach to greater physi-
Confusing Debate – Back to Basics

8/7/2019 On the verge 2007
http://slidepdf.com/reader/full/on-the-verge-2007 4/20
SIWI Policy Brief: On the Verge of a New Water Scarcity
4
Photo: Mats Lannerstad
cal water scarcity is to adopt a range of demand-management
measures before undertaking supply-side solutions. Examples
of such management measures would include decreasing water
losses in systems, reconsidering the volumes of water allocated
to agriculture, and reducing water losses from soils.
The World Bank is presently raising people’s awareness of the
increasing levels of water scarcity being seen in the Middle East-
North Africa (MENA) region (World Bank 2007). This problem
will only worsen as competition for limited or degraded resourcesintensifies. In fact, up to two-thirds of the world’s population
will be affected by water scarcity over the next few decades (Rijs-
berman 2006). But, improved water governance and demand
management could effectively address many of the water scarcity
problems faced by various regions – including MENA .
Massive global change is adding new dimensions
Various global changes are affecting water scarcity. Climate
change is influencing the physical avai lability of water. So too
is the massive increase seen in the world’s population, and the
growth of the water-hungry bioenergy sector, which is beingdriven by our awareness that oil stocks are limited.
Physical water scarcity will involve massive challenges for
the developing countries located in semiarid regions, as these
have to cope with rapidly expanding populations, and the need
to eradicate poverty and improve people’s quality of life. So,
to what degree might water scarcity delay the socio-economic
development of such countries? Examples such as Israel (which
lives with a high level of water shortage) suggest that water
scarcity does not in itself have to limit economic growth. In
fact, Israel has overcome this issue using methods which take
us somewhat outside the water sector – demonstrating that
economic diversification and the ability to adapt socially canovercome issues of water availability per se (Allan 2001).
However, in many poor developing countries, agriculture
is the backbone of development and poverty reduction efforts
– and such agriculture is a large-scale consumer of water. It
also needs to be remembered that, while physical availability
is to a large degree a product of climate, demand is dictated
by the size of the water-dependent population, the sectors of
society competing for it, and the level of water productivity
that has been achieved.
Climate change may make water-short regions evenmore water-short
On a global scale, climate change will probably increase pre-
cipitation on average – though it is difficult to predict this
accurately or incorporate it into future water scenarios (Alcamo
et al. 2000). However, the dry subtropical zones like MENA are
likely to become even drier. It’s also thought that, worldwide,
population growth and economic development will cause
greater water shortages and water stress than climate change
alone (Vörösmarty et al. 2000; Wallace 2000).
We can’t be certain how much warming to expect in different
regions. However, we do know that, as the climate becomes more
variable, both droughts and floods will become more common.
Brown and Lull (2006) recently suggested that water scarcity
due to average hydroclimatic conditions should be addressed
through water management and institutional measures (‘soft’
methods), while scarcity due to variability will often require the
construction of additional storage (‘hard’ methods).
Time to prepare for multiple water scarcity?
We are on the verge of a new and more serious era of waterscarcity, and it is clear that we will face increasingly complex
challenges. Water supply to different sectors will become more
challenging as supplies of blue water (e.g. water in rivers and
aquifers) become overstretched, while a scarcity of green water
(e.g. water in the soil) will limit food and biomass production.
Evidently water governance will have to be flexible enough
to allow the best possible use to be made of all the water
resources available.
Water professionals, policy makers and politicians need the
answers to a range of key questions. Will water scarcity ulti-
mately stall economic development? How large will the foodproduction problems be? How can different sectors’ competing
needs for water be managed? Through ‘more crop per drop’
approaches and ‘more money/value per drop’ approaches?
What barriers wil l obstruct efforts to manage demand? By how
much can water productivity realistica lly be increased? How
could changing consumption patterns affect water scarcity?
What regions will suffer food production problems as a result
of water shortages? What are the prospects for food trade and
thus a trade in the ‘virtual water’ needed to produce that food?
And, how will the massive global changes that are expected
to occur influence future water scarcity?

8/7/2019 On the verge 2007
http://slidepdf.com/reader/full/on-the-verge-2007 5/20
8/7/2019 On the verge 2007
http://slidepdf.com/reader/full/on-the-verge-2007 6/20
SIWI Policy Brief: On the Verge of a New Water Scarcity
6
Many rivers are already going more or less dry before they
reach their outflow (known as closure ). Environmental disasters
like the drying of the Aral Sea may therefore be duplicated
in many regions unless the problem is properly analysed and
countered. At the Third World Water Forum in Kyoto, the
International Water Management Institute, World Conserva-
tion Union and World Resources Institute jointly presented a
map showing that too much water was already being removed
from rivers in a broad belt stretching from north east China
to Mexico and the south west USA (Smakthin et al. 2003).
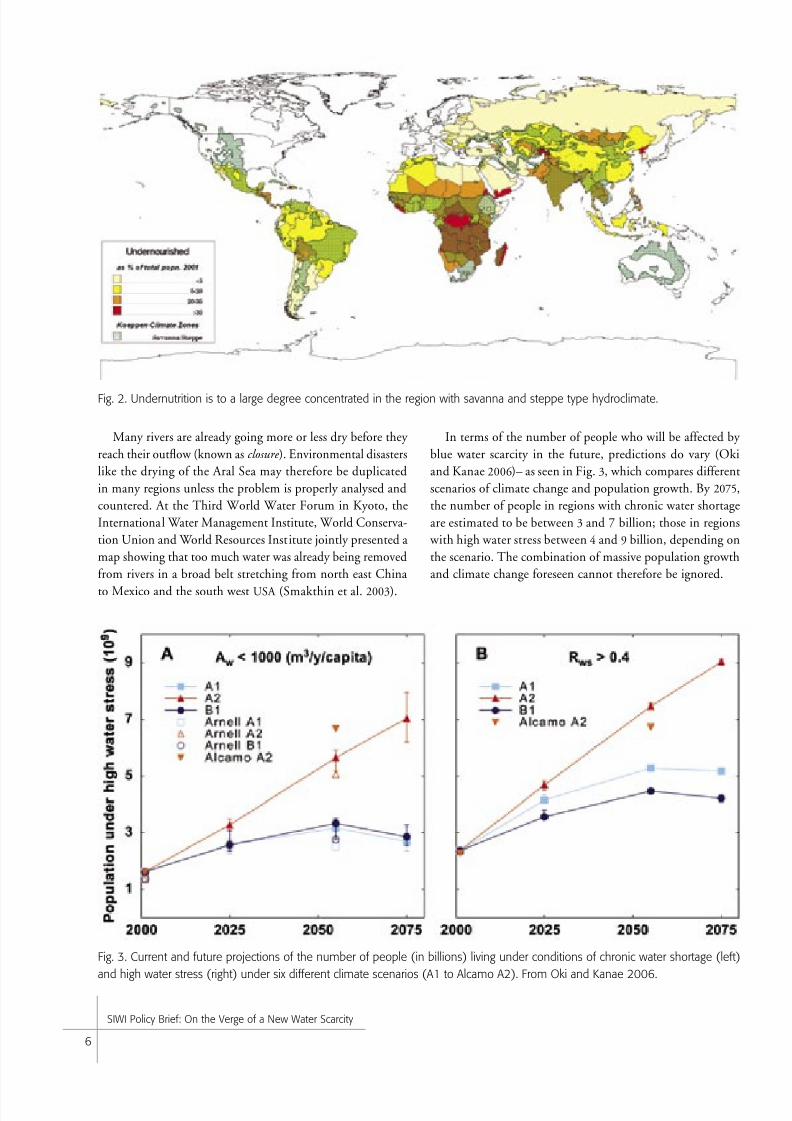
Fig. 2. Undernutrition is to a large degree concentrated in the region with savanna and steppe type hydroclimate.
Fig. 3. Current and future projections of the number of people (in billions) living under conditions of chronic water shortage (left)
and high water stress (right) under six different climate scenarios (A1 to Alcamo A2). From Oki and Kanae 2006.
In terms of the number of people who will be affected by
blue water scarcity in the future, predictions do vary (Oki
and Kanae 2006)– as seen in Fig. 3, which compares different
scenarios of climate change and population growth. By 2075,
the number of people in regions with chronic water shortage
are estimated to be between 3 and 7 billion; those in regions
with high water stress between 4 and 9 billion, depending on
the scenario. The combination of massive population growth
and climate change foreseen cannot therefore be ignored.

8/7/2019 On the verge 2007
http://slidepdf.com/reader/full/on-the-verge-2007 7/20
SIWI Policy Brief: On the Verge of a New Water Scarcity
7
Water for plants and water for people
As already noted, the term ‘water scarcity’ can refer to both
a scarcity of water in rivers and aquifers accessible for direct
use (blue water), and to a scarcity of water in the soil for cropand bioenergy production (green water). Both of the problems
can be either climate-driven or human-induced .
Water scarcity can roughly be divided into two categories:
“Apparent” – when there is plenty of water, but it is per-
ceived to be scarce because it is being used inefficiently
and wastefully with many losses.
“Real” – when insufficient rain is falling or because a
large population is having to depend on a limited re-source. These are the situations seen in arid climates and
closing river basins.
In addition, water scarcity can also be categorised as ‘tempo-
rary,’ when it occurs for only part of the year as a result of the
variability or seasonality of the water resource.
Green water scarcity – the classic cause of famines
Green water (the water in the root zone of the soil that controls
plant growth) can be scarce for several reasons. Some of these
reasons are climate- and soil-related, while others are related
to people’s activities. Reasons include:
• Too little rain to allow plant production
• The evaporation of all rainfall, leaving soils dry
• Problems with infiltration, so that rainfall runs off the
soil’s surface and doesn’t soak in
• Soils with poor water holding capacity, which means that
water percolates through the soil into the groundwater.
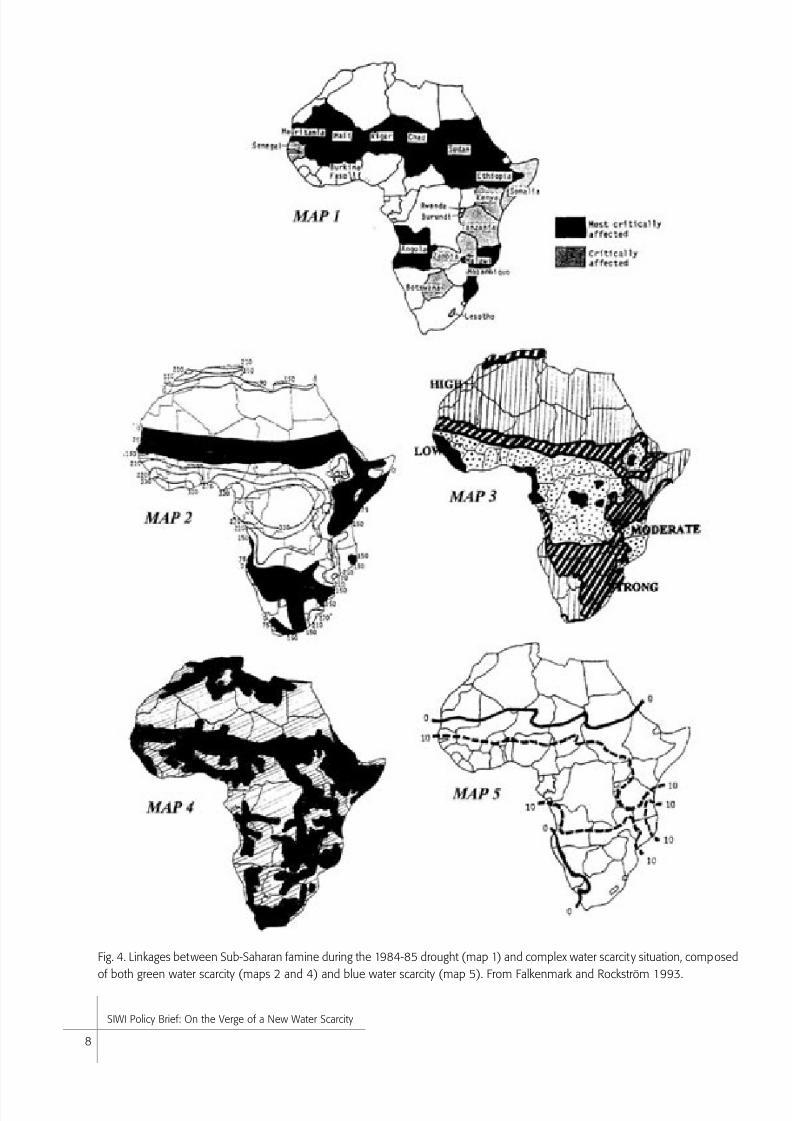
Green water scarcity occurs in different areas for different
reasons, as shown by the maps of Africa provided in Fig. 4
(Falkenmark and Rockström 1993). It can, for example, resultfrom natural causes such as arid climate and a high evaporative
demand in an area, which results in very little surplus being
available to infiltrate the soil. It also occurs naturally in areas
with a monsoon climate, where rain falls at particular times
of the year (map 2). This typically occurs in the Sahel region
and in southern Africa for instance. However, it can also be
caused by people’s activities, as causing soil degradation (e.g.
soil compaction), that can prevent water soaking into the root
zone of plants (see map 4).
Blue water scarcity is indicated by map 5, showing the limited
amount of runoff generated (centimetres per year). Map 3 shows
Causes, Prospects, Implications
the climate variability in terms of drought frequency linked to
El Niño and other atmospheric disturbances.
The congruence between the zone with severe famine dur-
ing the 1984-85 drought (map 1), green water scarcity (maps 2 and 4), blue water scarcity (map 5), and drought vulnerability
(map 3) suggests that a complex water scarcity situation severely
complicates both local food production and other kinds of eco-
nomic development in the rural parts of Sub-Saharan Africa.
Photo: Annika Börj e, SIWI
8/7/2019 On the verge 2007
http://slidepdf.com/reader/full/on-the-verge-2007 8/20
SIWI Policy Brief: On the Verge of a New Water Scarcity
8
Fig. 4. Linkages between Sub-Saharan famine during the 1984-85 drought (map 1) and complex water scarcit y situation, composed
of both green water scarcity (maps 2 and 4) and blue water scarcity (map 5). From Falkenmark and Rockström 1993.

8/7/2019 On the verge 2007
http://slidepdf.com/reader/full/on-the-verge-2007 9/20
SIWI Policy Brief: On the Verge of a New Water Scarcity
9
Apparent versus real blue water scarcity
The causes of blue water scarcity can be divided into fourcategories:
Demand-driven blue water scarcity – when demand is
high in relation to the amount of water available
Population-driven blue water scarcity – when high
population levels place pressure on the amount of water
physically available, leading to per capita water shortages.
Climate-driven blue water scarcity – when insufficient
rainfall means limited runoff (see Fig. 4, map 5)
Pollution-driven blue water scarcity – as water quality
can degrade to the point that it is unusable
The concepts of demand-driven ‘apparent’ scarcity and popula-
tion-driven ‘real’ water scarcity tend to dominate debates on
blue water, as discussed below.
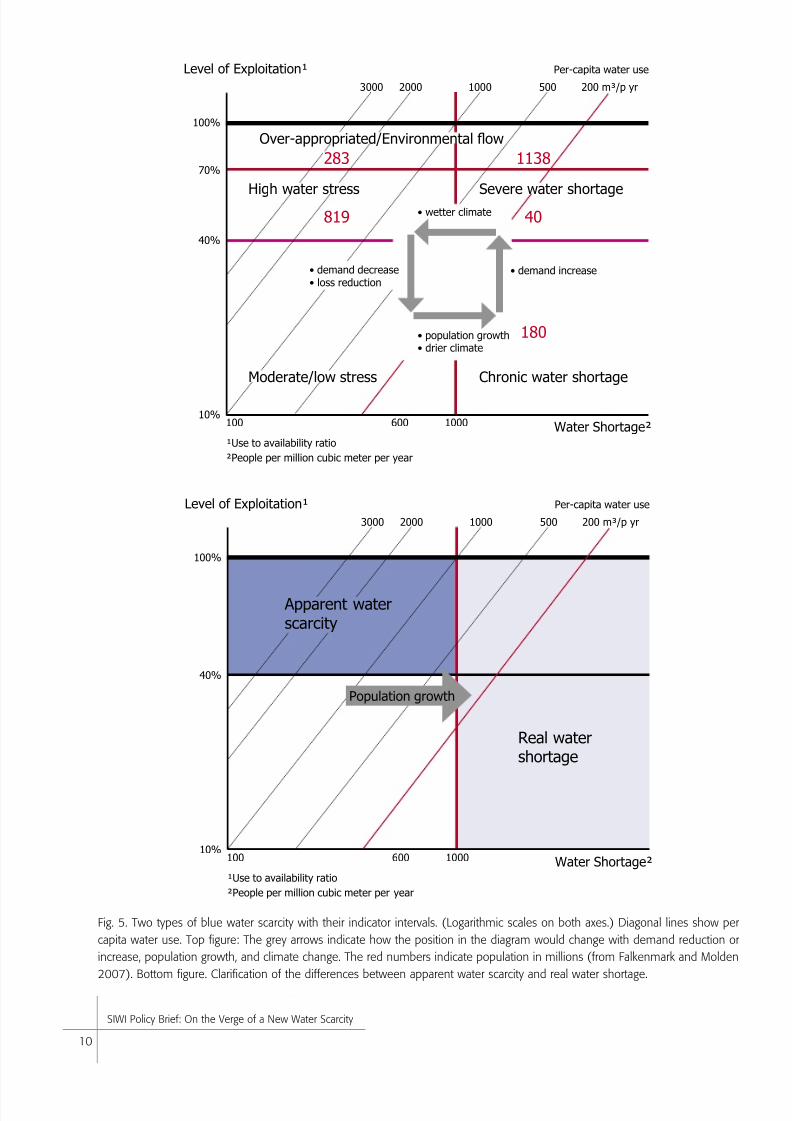
Demand-driven apparent scarcity can be measured by
examining how much water is being withdrawn from rivers
and aquifers (known as the use-to-availability indicator). In
line with this, in its 1997 Comprehensive Assessment of the
Freshwater Resources of the World, the UN set the withdrawal
of 40 percent of the resource as the line that distinguished thesituation of ‘high’ water stress from that of ‘low-to-moderate’
water stress.
Population-driven ‘real’ water shortages are related to the
number of people that have to share each unit of blue water
resource (known as the water crowding indicator). Nearly two
decades ago, it was observed that population levels higher than
1000 people per flow unit of the resource (1 million cubic meters
per year) indicate chronic water shortages (Falkenmark 1989).
Techniques to improve water productivity have improved
over the last 20 years, so these figures probably need to be re-
vised upwards now. However, they remain useful, and are stil lwidely used in campaigns to raise awareness of water scarcity
– because they are simple and easy to understand (Rijsberman
2006). Plus, combining the two indicators (use-to-availability
and water crowding ) gives us an idea of the degree of blue water
scarcity in a country or basin (see Fig. 5).
The figure also shows the number of people in the different
water scarcity intervals according to Falkenmark and Molden
(2007). Altogether 1.4 billion people live in overexploited river
basins in the sense that more than 70 percent of the resource
is already being allocated – the remaining 30 percent should
have been saved for the aquatic ecosystems (the so-called
Photo: Mats Lannerstad
8/7/2019 On the verge 2007
http://slidepdf.com/reader/full/on-the-verge-2007 10/20
SIWI Policy Brief: On the Verge of a New Water Scarcity
10
Fig. 5. Two types of blue water scarcity with their indicator intervals. (Logarithmic scales on both axes.) Diagonal lines show per
capita water use. Top figure: The grey arrows indicate how the position in the diagram would change with demand reduction or
increase, population growth, and climate change. The red numbers indicate population in millions (from Falkenmark and Molden
2007). Bottom figure. Clarification of the differences between apparent water scarcity and real water shortage.
Moderate/low stress
High water stress Severe water shortage
Over-appropriated/Environmental flow
Chronic water shortage
• demand decrease• loss reduction
• demand increase
• population growth• drier climate
• wetter climate
283 1138
819 40
180
100
40%
10%
100%
600 1000
3000 2000 1000 500
Level of Exploitation¹ Per-capita water use
Water Shortage²
²People per million cubic meter per year
200 m³/p yr
¹Use to availability ratio
70%
100
40%
10%
100%
600 1000
3000 2000 1000 500
Level of Exploitation¹ Per-capita water use
Water Shortage²
²People per million cubic meter per year
Population growth
Apparent waterscarcity
Real watershortage
200 m³/p yr
¹Use to availability ratio

8/7/2019 On the verge 2007
http://slidepdf.com/reader/full/on-the-verge-2007 11/20
SIWI Policy Brief: On the Verge of a New Water Scarcity
11
environmental flow). Most of these 1.4 billion are in fact in
basins with severe water shortage.
Wasteful use or large population? Blue water examples
If water scarcity is caused by large water losses or highly waste-
ful water demands, addressing it can be fairly straightforward.
Based on river basin data from the International Food Policy
Research Institute (IFPRI), Fig. 6 shows a number of river basinsin China (blue), India (green), Africa (red) and the USA (black).
The Chinese basins are reported to face only a moderate level
of demand (500 m³ per person per year). Per person per year
use in India and the USA , however, is much higher (700 m³
and 1000-3000 m³, respectively). This indicates that in India
and the USA people are using water wastefully, a situation that
could be addressed by demand management.
As populations grow, so too will the demand for water. Be-
cause only finite amounts of blue water are available, there is a
limit to the amount that can be used for irrigation. Once thatthreshold is reached, any extra agricultural activities will have
to rely on rainfall.
Fig. 6. Diagram relates “withdrawal to availability ratio” in percent (vertical axis) and “water crowding” in people per flow unit of 1
million m³/yr (horizontal scale) for a number of river basins. Diagonals show per-capita water use. Beyond 70% withdrawal level
basins are closed and no degrees of freedom are left. (Adapted from Falkenmark and Lannerstad 2004. Data: China, India and
U.S., year 1995, data source IFPRI (2002). Africa, recent years, various data sources.).

8/7/2019 On the verge 2007
http://slidepdf.com/reader/full/on-the-verge-2007 12/20
SIWI Policy Brief: On the Verge of a New Water Scarcity
12
Apparent green water scarcity
Apparent green water scarcity is
also a problem, particularly in the
semiarid tropics, again as the resultof large water losses. Figure 7 shows
a situation typical of smallholder
farming in the semiarid zone of
sub-Saharan Africa (Rockström
and Falkenmark 2000). On this
smallholding, rainfall actual ly pro-
vides about 90 percent of the crop’s
water requirements. However, only
about 1 ton per hectare is being pro-
duced (shown in the red square),
because 60 percent of the water thatfalls is lost.
Poor infi ltration is one cause of
this water loss, as some of the rain
runs off in fl ash fl oods. The poor
water holding capacity of the soil is
another, because the water that does
infi ltrate it is not held in the root
zone. Instead, it percolates through
and gathers as groundwater. And,
these problems are compounded by
the fact that dry weather has dam-
Photo: Manfred Matz, SIWI
Fig. 7. Water defi ciency and losses for a typical smallholder farmer in semiarid Africa. The
arrow indicates the gap between current yields (the small square) and potential yield without
water losses. Adapted from Rockström and Falkenmark 2000. ET = evapotranspiration.
Farmer’s Field
1009080706050403020100
100
90
80
70
60
50
40
30
20
10
0
Soil Water recharege
Green water loss
1 ton/ha0.5
0.2
2
3
4
5
6
Crop water requirementGreen water availability
% of crop water requirement
Productive green water use % of ET
Rain
defi ciency
Blue waterlossespercolation
Blue waterlossesrunoff
Yield gap
78

8/7/2019 On the verge 2007
http://slidepdf.com/reader/full/on-the-verge-2007 13/20
SIWI Policy Brief: On the Verge of a New Water Scarcity
13
Fig. 8. Water requirement (present water productivity levels) toproduce a standard supply of 3000 kilocalories per person per
day (20% animal protein) in 92 developing countries to first
achieve the 2015 Millennium Development Goal target, and
then eliminate undernutrition. From SEI 2005.
Fig. 9. Blue and green water contributions to hunger alleviation.
From SEI 2005.
Year
0
2000
4000
6000
8000
10000
20502030201520021990198019701960
km
3/y
r
aged the roots of the farmer’s plants – limiting their ability
to take up water. As a result, a lot of water simply evaporates
from the soil without benefiting the farmer.
All of these water losses could be avoided by applying some
simple management techniques. Soil conservation measures, for
example, could be used to improve infiltration and the water
holding capacity of the soil. Similarly, dryspell-related root
damage could be avoided by protective irrigation using locally harvested and stored rainwater – which could boost yields to 3
tons per hectare. Plus, if all run off could be avoided it might
be possible to increase the farmer’s yields to 7 tons per hectare
if the soil is not nutrient-deficient. However, stopping all run
off might lead to conflict with downstream users who rely on
it as a water supply.
Meeting exploding water requirements for food and
bioenergy
Food. As populations increase, more food will have to be pro-
duced using both rainfed and irrigated agriculture. But, becauseblue water resources have been overused in many countries,
irrigated agriculture will only be able to contribute a limited
amount to this, especially if a minimum amount of water is
allocated to protect and support aquatic ecosystems.
Researchers recently calculated the amount of water that crops
will require by 2030 and 2050 in order to alleviate hunger in
92 developing countries (see Fig. 8). They concluded that blue
water resources will only be able to supply around 15 percent
of the amount needed (Rockström et al. 2007). Most will have
to be met by rainfed agriculture – which means reducing the
huge water losses currently occurring (see Fig. 9).
The study also concluded that for developing countries tobecome self-sufficient in food production based on current prac-
tices, their cropping areas will have to expand by 50 percent by
2050. Of course, doubling the cropping area is not the only way
forward. As well as trading for food with better water-endowed
regions, such countries could also reduce post-harvest losses,
and ensure that food is better distributed throughout society.
A recent global study on economically driven diet changes
stresses that a rise in food production is not necessarily related
to a greater use of water. The potential for such decoupling does
exist. In fact, one recent study showed that reducing post-har-
vest losses by 50 percent might vastly reduce or even negatethe need for additional water to grow more food (Lundqvist
et al. 2007).
Bioenergy. Future water requirements will also increase
because there is likely to be a huge demand for biomass for
energy production. In fact, it is estimated that the amount of
additional water required for bioenergy production will be of a
similar order of magnitude to that required by the agricultural
sector (Berndes 2002).
There is no way to determine exactly how much biomass will
contribute to energy supply in the future. It has been estimated,
however, that somewhere between 3900 and 12,000 km³ per
year will be needed – a figure that already excludes those food
crop residues that could also be used (Lundqvist et al. 2007). If
15 percent of this water were to be contributed by irrigation, the
demand for blue water would rise by another 1200-3500 km³
per year.
Also the use of food crop residues as bioenergy is a difficult
issue, as such residues are also used to add organic matter to
soils. This is particularly important in the case of vulnerable
tropical soils. If all post-harvest residues are used to produce
bioenergy, there will be nothing left for soil amelioration.
2015 2030 2050
6000
5000
4000
3000
2000
1000
0
Additional Green
Additional Blue
km³/yr

8/7/2019 On the verge 2007
http://slidepdf.com/reader/full/on-the-verge-2007 14/20
SIWI Policy Brief: On the Verge of a New Water Scarcity
14
Water scarcity categories differ in terms of typical
policy responseThis section will identify some of the main policy approaches
available to combat water scarcity, and will consider both
blue water scarcity (relevant to conventional water uses such
as domestic water supply, industry, irrigation and wastewater
dilution), and green water scarcity (relevant to cropping, for-
estry and the production of food).
It must be remembered here, however, that blue water scarcity
can be either demand-driven (use-to-availability) or population-
driven (water crowding). Demand-driven water scarcity refers to
situations involving large-scale water losses or highly wasteful
water use, and can be applied to both blue and green water.Population-driven water scarcity , on the other hand, occurs
either naturally because resources are lacking due to climatic
conditions (causing most rainwater to evaporate, for example),
or as a result of human actions that lead to consumptive water
use and cause rivers and aquifers to become depleted (often as
a result of ineffective irrigation). It can also result from high
population pressure (per capita -related water shortage).
Policy Responses for Coping with Growing
Water Scarcity
Water scarcity can also occur temporarily. Such temporary
scarcity results from climatic variation (as there are practically noyears with ‘normal’ rainfall and streamflow). It may also occur
where river basins are closing, where dry season flow has vanished
in response to depletive water use (mainly irrigation).
Demand-driven blue or green water scarcity can be ad-
dressed by putting in place measures that bring down water
demand. Examples of such include the use of economic ‘dis-
incentives’ like lowering the subsidies available for irrigation,
which encourages more productive water use.
When water scarcity is population-driven, and in those cases
where demand management is already in place, society has to
adapt by reallocating resources, avoiding unnecessary waterdemands, and finding alternative ways of meeting the needs of
the water-dependent sectors of society. This means, for example,
the use of desalination, the importing of water and food, and
the harvesting of rainwater. When water scarcity is temporary
and linked to seasonal changes and climatic variation between
good years and bad, the natural solution is to “take out insur-
ance” through steps such as storing water and food.
Photo: Mats Lannerstad

8/7/2019 On the verge 2007
http://slidepdf.com/reader/full/on-the-verge-2007 15/20
SIWI Policy Brief: On the Verge of a New Water Scarcity
15
Fig. 10. Different measures for increasing water availability, in terms of their efficiency and the political challenge associated with
their use. The political challenge increases from the bottom to the top of the scale, because there are more interests to harmonise,
and thus the measures are more difficult to implement. WS system = Water supply system.
Reducinglosses in WS
systems
Foodimports
Changedconsumption
Watertransfers
Changedproduction
patterns
Green watermanagement
Relation between political challenge of measures and efficiency factor
Factor for increasing availability
Political challenge1
1) More interest to harmonize: the higher the more dif ficult
It must be recognised, however, that policy makers are
not always in a position to simply choose the policy option
they think most rational. The political context in which they
work largely determines what is politically feasible. Figure 10
highlights some key governance options and indicates how easy or difficult they are to implement. It represents the situation
in a specific country. However, it can be adapted so that it
reflects the situation in other countries – providing decision
makers with an analytical tool they can use when developing
an approach for improved water management. In this way,
it should help the user identify the easiest-to-implement and
most efficient measure that does not compromise economy and
ecology, as this is the measure that should be prioritised.
Overcoming blue water scarcity through demand man-
agement, reallocation and water importsDemand-driven blue water scarcity can be overcome by, for
example, reducing wasteful water use, cutting leaks in water
supply systems and losses in irrigation systems, and by reducing
exaggerated household water use and pollution (which frees
up more clean water).
Population-driven blue water scarcity, on the other hand, is
typically met by reallocation, raw water transfers from other
basins, the desalination of sea water, the use of groundwater
through pipelines, and bulk water imports.
Temporary blue water scarcity, by the same token, is best
tackled through water storage, resource allocation, rainwater
harvesting and the use of terracing in irrigated agriculture.
Policy makers need to be aware that a step-by-step approach
should be taken when adopting the different policy measures
needed to meet blue water scarcity. An example of such an ap-
proach would involve focusing first on managing demand . Thiscan be done by decreasing subsidies to agriculture, putting in
place realistic water-pricing measures, and reallocating water to
sectors which give higher economic returns per water unit used.
Other methods include supporting more efficient agricultural
techniques such as drip-irrigation and greenhouses for local
food production (as these minimise evaporation losses), and
relying more on virtual water imports.
Increasing supply (the second step) should only be under-
taken after strict demand-management measures have been
implemented. Once this has been done, however, methods
such as desalination and bulk water imports can be used toincrease the amount of water available.
Overcoming green water scarcity through increasing
water productivity, land care and food imports
Tackling ‘apparent’ green water scarcity When green water scarcity occurs despite the fact that sufficient
rain is falling (known as apparent green water scarcity ), it is the
result of soil problems related to infiltration, land degradation,
crusting and a poor organic matter content.
The obvious action in such cases is to implement soil con-

8/7/2019 On the verge 2007
http://slidepdf.com/reader/full/on-the-verge-2007 16/20
SIWI Policy Brief: On the Verge of a New Water Scarcity
16
servation measures such as conservation tillage in tandem
with mulching (to improve the soil’s water holding capacity).
Terracing and the bui lding of ‘diguettes’ (stone mounds) along
contour lines will also help to slow water running overland,
resulting in more infiltrating the soil. In semiarid regions where
intermittent dryspells damage the roots of crops, protective
irrigation using water gathered through local water harvest-
ing and stored in farm-scale water tanks can improve yieldsconsiderably, especially when adequate amounts of fertiliser are
provided. In regions where smallholder farming is practised,
extension services wil l play a fundamental role in encouraging
farmers to use such techniques.
Tackling ‘real’ green water scarcity Where green water scarcity is ‘real’ and the result of aridity
and lack of rain, crop and vegetable production will have to
rely on irrigation. Policy measures to combat such problems
should include the promotion of efficient farming practices,
and measures that encourage people to waste less food andto eat less water-hungry foods. Agricultural measures (such
as covering with mulches) will also be needed to avoid soils
drying out.
Increasing green water productivity will require the use of
governance mechanisms such as extension services and action
to address land rights issues. It will also require the implemen-
tation of a land care system that encourages society as a whole
to protect the productivity of the land that is available.
Addressing the need for bioenergy Demand for bioenergy will increase both because oil reserves
are limited and because policy makers are seeking more cli-
mate-friendly energy sources. Adequate policy action is neces-
sary, however, because bioenergy production has the potential
to be a large-scale consumer of both blue and green water.
This means incorporating bioenergy production into socio-
economic national planning. New policy should therefore aimto curb energy consumption by, for example, putting caps on
emissions or improving energy efficiency.
Overarching governance components
A range of different governance options are needed to address the
water scarcity problems outlined above. Governance measures
should make it easier to make the best possible use of the basic
water resources, by undertaking blue and green water manage-
ment, and by increasing re-use in a water-scarce region.
Policy responses also need to include measures to reduce
water losses in sectors such as irrigation and industry. They should also re-think water allocation based on economic prin-
ciples (‘more money per drop’), weighing such measures care-
fully against social and environmental considerations. Other
key steps include making more use of green water, improving
its management, and changing consumption and production
patterns. In certain cases, action should also be taken to put in
place and use large-scale water infrastructure and desalination
options, in order to cope with chronic water shortage.
Provide additional water through: Biggerpumps, higher dams, longer pipelines
Changing consumption patterns foragricultural products
Reducing water consumption in non-productive land use
Limit water use in economically nonviable but water consuming activities
Reducing water losses in water-supplysystems, industry and irrigation
Limit beyond which alldemand measures stilldo not help to achieve
a balance between useand availability (watercrowding)
Box 1
A step-by-step approach to managing water scarcity is illustrated here. Each step represents the most logical action to take first.
Actions should be taken in order, starting from the bottom of the ladder. But, remember that this only an example – political
and social realities may mean that some measures cannot always be put in place.
8/7/2019 On the verge 2007
http://slidepdf.com/reader/full/on-the-verge-2007 17/20
SIWI Policy Brief: On the Verge of a New Water Scarcity
17
Studies indicate that climate change will probably result in less
rainfall and higher temperatures in the world’s tropical semiarid
and Mediterranean climate zones (IIASA 2002). Thus, on aregional scale, climate change may be a key driver for change in
biomass production for food and energy, with this both affect-
ing and being affected by available water and land resources. (A
comprehensive review of recent scientific material on the conse-
quences of regional climate change on water resources and food
production was recently presented by Stern 2006.)
Decision makers must incorporate such foreseeable water
scarcity implications into the socio-economic national plan-
ning system, paying due attention to comparative advan-
tages of different sectors. Such planning should incorporate
long-term allocation of water. This should take account of both rural needs such as food and bioenergy production, and
employment/income generating activities on the one hand,
and urban needs on the other. Examples of such urban needs
would include health and income raising activities, especially
through domestic water provision and the provision of water
for industry. They must also consider the option of reusing
water where possible.
Policy makers will also have to take care to ensure that
adequate amounts of water are allocated to both up- and down-
stream water users. Adequate water (minimum streamflow)
will also have to be set aside to provide for the needs of aquatic
ecosystems. Decision makers also need to bear in mind that
in many areas blue water sources (including groundwater) are
shared between two or more countries.In the MENA region, water scarcity issues are already high
on the agenda – and this will soon also be the case in Southern
Africa. This is because they form an integral part of the larger
political context (Turton and Ashton 2007). In many areas in
various regions, including the MENA region, transboundary
water relations are a complex part of a wider web of political
relations linking water and issues of security – sometimes known
as the Hydropolitical Security Complex (Schulz 1995). Action
to address both political and water scarcity challenges in basins
that are highly volatile politically requires the sustained support
of the international community.Such international support is particularly relevant to in-
stitutional development, which must develop a ‘level playing
field’ that allows less powerful water users to negotiate a fair
share of the resource (Jägerskog 2003). Those living in a river
basin need to strive to share the potential benefits that can be
derived from a rational use of the water available in a basin. It
is however recognised that in those basins in which the political
actors are preoccupied with security considerations the prospects
for effective benefit sharing are slim (Phillips et al. 2006).
Efforts to balance land use, water use and the hea lth of eco-
systems would be helped by a broad application of Integrated
Photo: Manfred Matz, SIWI

8/7/2019 On the verge 2007
http://slidepdf.com/reader/full/on-the-verge-2007 18/20
SIWI Policy Brief: On the Verge of a New Water Scarcity
18
Water Resources Management (IWRM) that incorporates is-
sues of land use, creating Integrated Land and Water Resources
Management (ILWRM).
Concrete policy steps
When taking concrete policy steps, decision makers should
first focus on managing demand – efforts to increase supply
should be secondary to that.In this context, policy makers should work to translate the
following key recommendations into a clear and culturally
applicable legal and administrative framework.
Decrease water losses and increase productivity by
changing water use patterns. This can be achieved by
• using stricter demand-management techniques to effectively
reduce agricultural, industrial and domestic water losses
• improving green water management by, for example,
increasing rainwater harvesting
• increasing pollution abatement measures and water reuse• increasing the use of modern agricultural techniques
such as drip-irrigation and greenhouses, which minimise
evaporation losses.
Incorporate water into socio-economic national plan-
ning. This should be done by
• re-allocating water to sectors with higher economic
returns
• establishing clear land and water rights systems
• decreasing the subsidies given to irrigated agriculture,
thus encouraging more efficient water use
• planning imports of water-demanding goods, especially foods (i.e. by considering virtual water)
• adopting measures that will encourage people to eat
foods that require less water to produce
• planning for future bioenergy-generated water demands
• improving energy efficiency to curb climate change and de-
crease the amount of green water used to produce bioenergy
• adopting measures that will improve transboundary
water relations, allowing countries to share the benefits
that would be reaped from the rational use of resources.
Identifying the point at which optimum use has been made of available resources and then producing additional water by
• building desalination plants
• using pipe-lines to transport water.
Photo: Manfred Matz, SIWI
Photo: Getty Images
8/7/2019 On the verge 2007
http://slidepdf.com/reader/full/on-the-verge-2007 19/20
SIWI Policy Brief: On the Verge of a New Water Scarcity
19
References
Allan, J. A. 2001. The Middle East Water Question: Hydropolitics and the
Global Economy . London and New York, I. B. Tauris.Alcamo, J., Henrichs, T. and Rösch, T. 2000. World Water in 2025: Global
Modeling and Scenario Analysis for the World Commission on Water for
the 21st Century . Center for Environmental Systems Research (CESR), Uni-
versity of Kassel, Germany, (Kassel World Water Series Report No. 2).
Berndes, G. 2002. Bioenergy and Water – The Implications of Large Scale
Bioenergy Production for Water Use and Supply. Global Environmental
Change, Vol. 12, pp. 253-271.
Falkenmark, M. 1989. The Massive Water Scarcit y Now Threatening Africa
- Why Isn’t It Being Addressed? Ambio, Vol. 18, pp. 112-118.
Falkenmark, M. 2007. Shift in Thinking to Address the 21st Century Hunger
Gap: Moving Focus f rom Blue to Green Water Management. Water Re-
sources Management , Vol. 21, No. 1, pp. 3-18(16).
Falkenmark, M. and Lannerstad, M . 2005. Consumptive Water Use to Feed
Humanity – Curing a Blind Spot. Hydrology and Earth System Sciences, Vol.
9, Issue 1/2, pp.15-28.
Falkenmark, M., and Molden, D. 2007. Hard or Soft Landing. Wake Up to Reali-
ties of River Basin Closure. In press.
Falkenmark, M. and Rockström, J. 1993. Curbing Rural Exodus from Tropical
Drylands. Ambio, Vol. 22(7) , pp. 427-437.
Jägerskog, A. 2003. Why States Cooperate Over Shared Water: The Water Ne-
gotiations in the Jordan River Basin. Linköping Studies in Arts and Science,
No. 281. Linköping University.
Lannerstad, M. 2002. Consumptive Water Use Feeds the World and Makes Riv-ers Run Dry . MSc Thesis, Royal Institute of Technology (KTH), Stockholm.
Lundqvist, J., Barron, J., Berndes, G., Berntell, A., Falkenmark, M, Karlberg, L.,
Rockström, J. 2007. Water Pressure and Increases in Food and Bioenergy
Demand Implications of Economic Growth and Options for Decoupling.
Scenarios on Economic Growth and Resource Demand: Background Re-
port to the Swedish Environmental Advisory Council memorandum 2007:1.
Stockholm, Swedish Environmental Advisory Council. Accessible at: www.
sou.gov.se/MVH.
Ohlsson, L. and Turton, A.R. 1999. The Turning of a Screw: Social Resource Scarci-
ty as a Bottle-neck in adaption to water scarcity . London. University of London.
School of Oriental and African Studies, (SOAS Occasional Paper No. 19).
Oki T. and Kanae, S. 2006, Global Hydrological Cycles and World Water Re-
sources. Science, Vol. 313, pp. 1068-1072.Phillips, D.J., Daoudy, H. M., Öjendal, J., McCaffrey, S. and Turton, A. R. 2006.
Transboundary Water Cooperation as a Tool for Conflict Prevention and
Broader Benefit-Sharing. Stockholm, Swedish Ministry for Foreign Affairs.
Accessible at: www.egdi.gov.se.
Rijsberman, F. 2006. Water Scarcity: Fact or Fict ion? Agricultural Water Man-
agement , Vol. 80, Issues 1-3, pp. 5-22.
Rockström, J. and Falkenmark, M. 2000. Semiarid Crop Production from a
Hydrological Perspective: Gap Between Potential and Actual Yields. Critical
Reviews in Plant Sciences, Vol. 19(4), pp. 319-346.
Rockström J., Lannerstad, M. and Falkenmark, M. 2007. Assessing the Water
Challenge of a New Green Revolution in Developing Countries. Proceedings
of the National Academy of Sciences, Vol. 104, No. 15, pp. 6253-6260.
Schulz, M. 1995. Turkey, Syria and Iraq: A Hydropolitical Security Complex.
Leif Ohlsson (ed.), Hydropolitics: Confilicts over Water as a Development
Constraint . London, pp. 91-122.
Smakthin, V., Revenga, C. and Doll, P. 2004. Taking into Account Environmen-
tal Water Requirements in Global-scale Water Resources Assessments.
Comprehensive Assessment of Water Management in Agriculture Research
Report 2, Colombo, IWMI.
Turton, A.R., A shton, P., and Cloete, E. 2003. Transboundary Rivers, Sover-
eignty and Development: Hydropolitical Drivers in the Okavango River
Basin. African Water Issues Research Unit, Pretoria and GCI Geneva.
United Nations Development Programme Human Development Report Of fice.2006. Beyond Scarcity: Power, Poverty and the Global Water Crisis. New
York, (Human Development Report).
Vörösmarty, C.J., Green, P., Salisbury J., and Lammers, R. 2000. Global Water
Resources: Vulnerability from Climate Change and Population Growth. Sci-
ence, Vol. 289, pp. 284-288.
Wallace, J.S. 2000. Increasing Agricultural Water Use Efficiency to Meet Future
Food Production. Agriculture, Ecosystems & Environment , Vol. 82, pp.
105-119.
World Bank. 2007. Making the Most of Scarcity – Accountability for Better Wa-
ter Management Results in the Middle East and North Africa. Washington,
D.C. (MENA Development Report)

8/7/2019 On the verge 2007
http://slidepdf.com/reader/full/on-the-verge-2007 20/20
S I W I, SIWI D , - S, S P + • F + • [email protected] • www.siwi.org
On the Verge of a New Water Scarcity
In spite of the fact that physical water scarcity is a dire reality for
millions of people, it is still not properly understood nor recognised
in many front-line discussions. An unfortunate confusion regard-ing growing physical water scarcity distorts policy formulation
and effective action programmes. The scale and magnitude of
the challenge imply that “water scarcity is everybody’s business.”
This policy brief, “On the Verge of a New Water Scarcity: A Call for
Good Governance and Human Ingenuity,” looks closer into theissue, offers a set of distinctions and concludes with structured
policy suggestions.