on wire and arc additive manufacture of aluminiumepubs.surrey.ac.uk/850379/1/on wire and arc... ·...
TRANSCRIPT

On Wire and Arc Additive Manufacture
of Aluminium
Emma M. Ryan, BSc
A thesis submitted in partial fulfilment for the degree of
Doctor of Engineering
September 2018
University of Surrey
© Emma Ryan 2018

i
Abstract
Wire and arc additive manufacture (WAAM) is a process in which an arc is used to melt and
deposit beads of feedstock wire layer by layer onto a substrate and then subsequent layers to
create near-net shape components. WAAM has the potential to reduce costs and material
waste, as well as shorten lead-time, compared to conventional manufacturing methods.
WAAM is not currently commercially viable, however, and one of the largest barriers is lack
of reproducibility. This work investigates the influence of wire batch on reproducibility of the
WAAM of aluminium. Particular attention is given to the external appearance and porosity of
aluminium alloy 2319 (AA2319) components.
Components were manufactured using 1.2 mm diameter AA2319 welding wire from
different wire batches and manufacturers, and different process parameters. The surface
deposit that resulted from the process on some components, which was a visible indicator of
variability, was characterised using a qualitative coverage scale and five complementary
techniques: scanning electron microscopy, X-ray photoelectron spectroscopy, X-ray
diffraction, plasma focussed ion beam and Raman spectroscopy. Porosity of the components
was also measured. Batch-to-batch variation of wire was analysed, in particular, the surface
finish, diameter and composition.
Surface deposit composition and coverage did not depend on wire batch. The surface
deposit contained predominantly metal and metal oxide nanospheres, microspatter and
carbon-rich microparticles. For AA2319 components, the metal was aluminium and for
AA5183, the metals were magnesium and aluminium. There was a relationship between
surface deposit coverage and wire feed speed (WFS): the higher the WFS, the greater
percentage of surface deposit coverage. The results support the suggestion that surface
deposit formation is caused by condensation of vapour and microspatter from feedstock wire.
There was no statistically meaningful relationship between surface deposit coverage and
porosity and surface deposit formation does not appear to influence commercial viability of
WAAM.

ii
Wire batch was the dominant influence on porosity. Porosity ranged from 0.02 % to
6.0 % depending on wire batch used. There was no correlation between process parameters
and porosity for the range of parameters used. There is evidence to suggest that internal voids
and diameter of the wire affected porosity; wire with internal voids resulted in high porosity
and wire with smaller diameter resulted in high porosity. These features can affect hydrogen
content to the weld pool, arc stability, weld pool conduction and cooling rates, all of which
influence porosity formation.
The commercial viability of WAAM can be improved through control of feedstock
material. This work showed that porosity could be reproducibly reduced using wire
manufactured with a new manufacturing process that included diamond dies and a new
cleaning process. Wire manufactured from the same ingot of material as other batches using
the new process resulted in much lower porosity compared to the old process: 0.2 %
compared to 1.2 %. Results suggest that changes to the wire manufacturing process may have
produced wire with no internal voids and a larger diameter.

iii
Declaration of originality
This thesis and the work to which it refers are the results of my own efforts. Any ideas,
images or text resulting from the work of others (whether published or un-published) are fully
identified as such within the work and attributed to their originator in the text, bibliography or
in footnotes. This thesis has not been submitted in whole or in part for any other academic
degree or professional qualification. I agree that the University of Surrey has the right to
submit my work to the plagiarism detection service TurnitinUK for originality checks.
Whether or not drafts have been so-assessed, the University reserves the right to require an
electronic version of the final document (as submitted) for the assessment as above.
On Wire and Arc Additive Manufacture of Aluminium
Emma Ryan
September 2018
Academic Supervisors: Dr Mark J. Whiting and Prof. John F. Watts
Industrial Supervisor: Dr Tanya J. Sabin

iv
Acknowledgements
I would like to take the opportunity to thank everyone who has been part of this journey.
First and foremost, I would like to express my enormous gratitude to my wonderful parents
who have supported me every step of the way just as they always have and just as they
always will. I could not have done this without them
Nor could I have done this without the rest of my family, especially my granny, nana,
grandad, Val, Tim and Daisy for their love, generosity and words of wisdom.
My incredible supervisors, Dr Mark Whiting, Prof. John Watts, Dr Tanya Sabin and Prof.
Steve Burnage, have all been a never-ending source of patience, help, advice and kindness. I
have learned so much from all of them and would not have achieved what I have without
them.
Thank you to everyone from MiNMaT at the University of Surrey. Their help, particularly
when it was most needed, has made the journey easier. Thank you to Noelle Hartley for being
generally wonderful, to Debbie Carpenter for her unwavering patience and understanding,
Dave Jones for every polished sample, SEM spectra, duck feeding session, cup of tea and
scrabble game, Dr Steve Hinder for being an invaluable font of advice, Dr David Jesson for
encouraging me and being the inspiration for all the science communication work I do,
including the stand-up comedy, and Prof. Julie Yeomans for teaching me that it is important
to take care in all aspects.
My colleagues at Lockheed Martin have also been an important part of this project and its
successes. I was lucky to join the very welcoming Materials Team, who have been wonderful
colleagues and wonderful friends, and I find myself particularly fortunate to have an amazing
manager, Bryan Vaughan, who has been nothing but understanding, kind and funny during
my time at Lockheed. To the invaluable contributions of James Travis, Tom Geary, Rob
Naylor, Jamie Conroy and Marc Riley. Thank you to Chris Dent for sharing all his
experience over the years and the rest of the E3 floor plate. Thank you to Julie Bevan,
Richard Dunne and Manjit Thethi, for every PIRA form that was signed.

v
Fronius Ltd, TWI and Cranfield University have all provided resources including materials,
time, effort and answers to my many, many questions. For that, I am ever grateful.
To those of my friends that kept me sane, and those of my friends that didn’t – I owe you all.
To Daniel Hanlon, who has been with me through a lot of this journey and put up with so
much along the way. To Edd Hatton, who was there at the beginning and before that. Thank
you for being a part of it all.
Finally, thank you to everyone that reads this. I hope that you enjoy the thesis and find it
useful.
vi
Contents
Abstract ...................................................................................................................................... i
Declaration of originality ...................................................................................................... iii
Acknowledgements ................................................................................................................. iv
Chapter 1 Introduction .......................................................................................................... 1
1.1 Background ................................................................................................................. 1
1.2 Preliminary Aim and Objectives ................................................................................. 2
Chapter 2 Commercial Viability of Wire and Arc Additive Manufacture ........................... 3
2.1 Introduction ................................................................................................................. 3
2.2 Wire and Arc Additive Manufacture ........................................................................... 3
2.3 Aluminium and its Alloys ......................................................................................... 12
2.3.1 Applications ....................................................................................................... 13
2.3.2 AA2219 Properties............................................................................................. 15
2.4 Batch-to-Batch Variation of Wire ............................................................................. 17
2.5 Process Parameters .................................................................................................... 20
2.6 The Nature of the Surface Deposit ............................................................................ 23
2.7 Porosity...................................................................................................................... 26
2.8 Summary and Research Questions ............................................................................ 29
2.9 Amended Objectives ................................................................................................. 30
Chapter 3 Materials, Manufacture and Methods ................................................................ 31
3.1 Introduction ............................................................................................................... 31
3.2 Wire and Arc Additive Manufacture ......................................................................... 31
3.2.1 Material .............................................................................................................. 31
3.2.2 Process ............................................................................................................... 32
3.2.3 Geometry and Tool Path .................................................................................... 34
3.2.4 Process Parameters............................................................................................. 34
3.2.5 Post-Processing .................................................................................................. 37
3.3 Surface Deposit Coverage and Colour Scales ........................................................... 37
3.4 Characterisation Techniques ..................................................................................... 40
3.4.1 Optical Microscopy ............................................................................................ 40
3.4.2 Scanning Electron Microscopy .......................................................................... 40
3.4.3 X-ray Photoelectron Spectroscopy .................................................................... 40
3.4.4 X-ray Diffraction ............................................................................................... 41

vii
3.4.5 Focused Ion Beam.............................................................................................. 41
3.4.6 Raman Spectroscopy .......................................................................................... 41
3.5 Summary ................................................................................................................... 41
Chapter 4 The Nature of the Surface Deposit ..................................................................... 42
4.1 Introduction ............................................................................................................... 42
4.2 Experimental Methods .............................................................................................. 43
4.3 Experimental Results................................................................................................. 46
4.3.1 Scanning Electron Microscopy .......................................................................... 46
4.3.2 Plasma Focused Ion Beam Milling .................................................................... 54
4.3.3 X-Ray Photoelectron Spectroscopy ................................................................... 54
4.3.4 X-Ray Diffraction .............................................................................................. 59
4.3.5 Raman Spectroscopy .......................................................................................... 60
4.4 Discussion ................................................................................................................. 61
4.5 Summary ................................................................................................................... 65
Chapter 5 Influence of Wire Batch and Process Parameters on Surface Deposit Coverage
and Porosity ............................................................................................................................ 67
5.1 Introduction ............................................................................................................... 67
5.2 Experimental Methods .............................................................................................. 67
5.3 Experimental Results................................................................................................. 68
5.3.1 Surface Deposit Coverage and Colour ............................................................... 68
5.3.2 Porosity .............................................................................................................. 72
5.3.3 Relationship between Surface Deposit Coverage and Porosity ......................... 80
5.4 Discussion ................................................................................................................. 81
5.4.1 Surface Deposit Coverage .................................................................................. 81
5.4.2 Porosity .............................................................................................................. 82
5.4.3 Relationship between Surface Deposit Coverage and Porosity ......................... 86
5.5 Summary ................................................................................................................... 88
Chapter 6 Characterisation of Batch-to-Batch Variation of Aluminium Alloy Wire......... 89
6.1 Introduction ............................................................................................................... 89
6.2 Experimental Methods .............................................................................................. 89
6.3 Experimental Results................................................................................................. 90
6.3.1 Surface Finish .................................................................................................... 90
6.3.2 Geometry............................................................................................................ 96

viii
6.3.3 Bulk Composition .............................................................................................. 97
6.3.4 Surface Composition .......................................................................................... 97
6.4 Discussion ............................................................................................................... 101
6.5 Summary ................................................................................................................. 106
Chapter 7 Discussion ........................................................................................................ 108
7.1 Introduction ............................................................................................................. 108
7.2 Summary ................................................................................................................. 108
7.2.1 The Nature of the Surface Deposit ................................................................... 108
7.2.2 Influence of the Wire Batch and Process Parameters on Surface Deposit
Coverage and Porosity .................................................................................................... 108
7.2.3 Characterisation of Batch-to-Batch Variation of Aluminium Alloy Wire....... 109
7.3 Implications for the Commercial Viability of WAAM ........................................... 109
7.4 Concluding Remarks ............................................................................................... 116
Chapter 8 Conclusions and Future Work ......................................................................... 117
8.1 Conclusions ............................................................................................................. 117
8.2 Future Work ............................................................................................................ 118
References .............................................................................................................................. 119
Appendix A: Published Work and Conference Presentations ............................................... 138
Publications ........................................................................................................................ 138
Presentations....................................................................................................................... 138
Appendix B: Published and Submitted Journal Papers ......................................................... 140

1
Chapter 1
Introduction
1.1 Background
This thesis describes the work undertaken to improve commercial viability of wire and arc
additive manufacture (WAAM) of aluminium. WAAM refers to a process in which an arc is
used to melt feedstock wire and deposit it in layers to create components. A diagram of
WAAM can be seen in Figure 1.1. WAAM has the potential to reduce costs and material
waste, in addition to shortening lead times compared to conventional manufacturing
techniques. This is achieved through its ability to create near-net shapes, and high deposition
rates: 1 – 10 kilograms per hour. Aluminium alloys are of particular interest for many of the
applications of Lockheed Martin because of their good strength to mass ratio, cost and anti-
corrosive properties.
Figure 1.1: Diagram of WAAM, based on a metal inert gas (MIG) welding process. Modified
from McAndrew et al., 2018.
Welding torch
Arc
Feedstock wire
Substrate
Component Weld pool
New layer

2
To date, WAAM is not commercially viable for aluminium, however, and there are many
issues including: no commercially available complete WAAM systems, high residual
stresses, limited material that can be processed as it has to be available as welding wire,
significant amounts of porosity and lack of published statistically valid material data (Ding,
D. et al., 2014; Cong et al., 2015; Ding, D. et al., 2015b; Williams et al., 2015). One of the
largest barriers to commercial viability of WAAM of aluminium is lack of reproducibility.
This causes problems with standardising and qualifying process and parts. Lack of
reproducibility in the process and the resulting properties of components has been observed
including: arc stability, uniformity of deposition, external appearance, geometry, mechanical
properties, microstructure and porosity (Wang et al., 2011; Kazanas et al., 2012; Martina et
al., 2012; Ayarkwa et al., 2015; Cong et al., 2015; Gu et al., 2015; Cong et al., 2017a; Xiong
et al., 2018; Zhang, C. et al., 2018).
It has been observed that wire batch can influence reproducibility of aluminium WAAM,
including arc stability (Gu et al., 2015), external appearance (Gu et al., 2015; Ding, J., 2015)
and porosity (Ayarkwa et al., 2015). There have been no attempts reported in the open
literature that seek to understand the effect wire batch has on the process and components or
which feature of the wire may be the cause. In order for WAAM to become commercially
viable, the effect of wire batch on process and components must be understood.
1.2 Preliminary Aim and Objectives
The main aim of the project is to improve the commercial viability of WAAM. In order to
achieve this aim, a set of objectives was formulated and is summarised below:
Identification of non-reproducible factors of aluminium WAAM and components
through a review of literature resulting in a refinement of the objectives.
Study of non-reproducible factors of aluminium WAAM that are not reported in the
open literature.
Analysis of the influence of wire batch on the reproducibility of aluminium WAAM.
Characterisation of wire to determine which features influence reproducibility.

3
Chapter 2
Commercial Viability of Wire and Arc Additive Manufacture
2.1 Introduction
Commercial viability of WAAM of high-strength aluminium components will be explored
through a comparison with other additive manufacture (AM) techniques, an overview of
aluminium alloys and a review of the aspects that may limit viability. The influence of
process parameters and batch-to-batch variation of wire on the WAAM process and
components is explored. There is also particular focus on the external appearance and
porosity of WAAM components.
2.2 Wire and Arc Additive Manufacture
Lockheed Martin UK is currently researching the use of AM, and WAAM in particular, to
address the issues surrounding the use of conventional manufacturing technologies,
particularly for low volume runs. AM refers to techniques that join material, typically in
layers, to create near-net shape components (British Standards Institution, 2017). Types of
conventional manufacturing technologies include casting, forging and machining (Kalpakjian
and Schmid, 2017). Casting involves producing components by pouring liquid material into a
mould of the desired shape. Forging refers to using a compressive force to shape the material,
using instruments such as dies or hammers. During machining, the desired shape is achieved
through removal of material; this is considered a subtractive technique.
One of the key issues of conventional, subtractive manufacturing technologies is the high
‘buy-to-fly’ ratio, a measure of the initial material bought compared to the material found in
the finished component, which results in high cost and high material waste. Buy-to-fly ratios
of 33:1 have been reported for conventional manufacture of titanium aerospace brackets
(Dehoff et al., 2013) and 20:1 for titanium duct flanges for aero engine components (Allen,
2006). Case studies on AM have shown that buy-to-fly ratios of 1.2:1 can be achieved and
material waste can be reduced by over 80 % (Williams et al., 2015).
Other issues with conventional manufacture include lack of geometrical freedom, the
inability to individualise components quickly, cheaply and easily, and a long lead time
compared to AM (Petrovic et al., 2011). Numerous examples exist of components that have
been designed and manufactured to exploit the benefits of AM. Conformal cooling channels
in moulds were manufactured using AM that were not possible using conventional

4
manufacture (Gebhardt, 2011). Optimisation of shapes for the loading and interface
conditions imposed can also be achieved through the flexibility of AM as lightweight but
robust lattice-like structures can be built that are not feasible with conventional manufacture
(Leary et al., 2014). AM components are produced from computer aided design (CAD)
models as opposed to moulds or other tooling and thus can be easily modified. This is of
particular interest to the medical industry as components can be patient-specific and are used
frequently in dentistry; over 17 million patient-specific orthodontic aligners are manufactured
every year (Wohlers, 2017). AM has the potential to reduce both production and delivery
lead time as no specialised tooling is required, components can be manufactured closer to the
point of delivery as and when needed, rather than being stored, and the risk of obsolescence is
reduced (Holmstrom et al., 2010). One case study demonstrated a reduction in lead time from
9 weeks to 4 weeks using AM compared to conventional manufacture (Huang et al., 2017).
One of the key reasons for reduction was that the AM component did not need be transported.
The benefits of AM compared to conventional manufacture are covered extensively in review
papers including Wohlers Report (Wohlers, 2017) and others (Horn and Harryson, 2012;
Frazier, 2014; Thomas and Gilbert, 2014).
There are a number of different AM techniques that can be used to address the issues
surrounding the use of conventional manufacturing techniques. AM techniques consist of
three parts: the feedstock material and the technical principles for deposition and for joining.
They have been divided into seven different categories, depending on the material and
deposition and joining techniques, as described in Table 2.1. Powder and wire are commonly
used as feedstock material, joining techniques include heat sources and binder material, and
material can be deposited using a robot arm, a powder bed or a nozzle. A wide range of
materials have been deposited using AM including metals, polymers, ceramics and
composites. There are many different applications for AM spanning the aerospace, defence,
health, sport and fashion industries (Wohlers, 2017).

5
Table 2.1: Different categories for AM processes. (British Standards Institution, 2017)
AM Process Category Definition
Binder Jetting A liquid bonding agent is selectively deposited to join
powder materials.
Directed Energy Deposition Focused thermal energy is used to fuse materials by
melting as they are being deposited.
Material Extrusion Material is selectively dispensed through a nozzle or
orifice.
Material Jetting Droplets of build material are selectively deposited.
Powder Bed Fusion Thermal energy selectively fuses regions of a powder bed.
Sheet Lamination Sheets of material are bonded to each other to form an
object.
Vat Photopolymerization Liquid photopolymer in a vat is selectively cured by light-
activated polymerization.
AM techniques commonly used for the manufacture of metal structural components, the
focus of Lockheed Martin UK, include: selective laser melting, electron beam melting and
WAAM (Frazier, 2014). The former lies in the powder bed fusion category, the latter two are
both directed energy deposition. Selective laser melting (SLM) is also known as Selective
Laser Sintering (SLS®, patented by 3D Systems Corporation), and Direct Metal Laser
Sintering (DMLS®, patented by EOS GmbH). The process utilises lasers to selectively melt
a layer of powder in required locations on a platform, the platform then lowers, a new layer
of powder is deposited and the process repeats until the component is completed. It is
completely encased in unmelted powder that then has to be removed. For electron beam
melting (EBM), an electron beam is used as a heat source in a vacuum to melt powder or
wire; wire EBM is used by Lockheed Martin in the USA. WAAM typically uses an electric
arc to deposit beads of feedstock wire onto a substrate and then subsequent layers. Figure 2.1
shows examples of components made with the different processes. A comparison of the
different techniques can be seen in Table 2.2.

6
(a) (b)
(c)
Figure 2.1: (a) Titanium landing gear bracket, conventional manufacture and by SLM.
Credit: Airbus SAS, (b) titanium propulsion tank manufactured using EBM. Credit:
Lockheed Martin Space Systems and (c) mild steel tooling manufactured using WAAM.
Credit: Lockheed Martin UK.

7
Table 2.2: Comparison of a selection of process properties for different metal AM techniques (Frazier, 2014; Thomas and Gilbert, 2014; Ding,
D. et al., 2015b; Williams et al., 2016; Wohlers et al., 2017)
Process Feedstock
Type
Cost per kg of
material (£)
Machine
Cost (£)
Deposition
rate
(kg per
hour)
Build Volume
Scale (mm per
axis)
Layer Height
(μm)
Post-Processing
SLM Metal Powder 10s – 100s* 150k – 2M 0.06 – 0.120 100 20 – 60 Powder and support removal.
Machine if necessary.
EBM Metal Powder 10s – 100s* 500k – 1M 0.01 – 0.1 100 50 – 200 Powder and support removal.
Machine if necessary.
Wire 10s 1M – 3M
10 – 20 1000 1000 – 2000 Remove substrate and
machine if necessary.
WAAM Metal
welding wire
10s 50k – 100k 1 – 3 1000 + 1000 – 2000 Remove substrate and
machine if necessary.
*Up to 50 % of powder can be wasted during manufacture although methods to recycle powder are being developed.

8
There are benefits to WAAM compared to other AM techniques that are of particular
interest to Lockheed Martin UK. WAAM has a much larger build volume, typically an order
of magnitude higher than other AM techniques, as it is not limited by the feasibility or cost of
a large powder bed or vacuum. The deposition rate of WAAM is relatively high, particularly
compared to SLM. Capital costs are significantly lower, the equipment for WAAM costs
around an order of magnitude less. Although resolution of the WAAM technique is not as
high, this is of little concern because of the required applications: large components without
intricate features.
Figure 2.2 shows a schematic of the WAAM process. A CAD model is produced of the
required geometry, sliced and a build path for the robot is created. There have been studies on
determining the optimal build paths for stable deposition and desired properties of
components (Ding, D. et al., 2014; Ding, J. et al., 2015b). This is because differences in
geometrical features, layer height, cooling time between layers, direction of build and other
aspects of the build path can affect thermal history of the process in addition to geometry of
the weld pool which may influence deposition and solidification of material and resulting
microstructure and properties of components.
Aluminium alloys, steel, titanium and refractory metals have all been used as wire
feedstock (Williams et al., 2016; Asala et al., 2017). It is possible to achieve functionally
graded materials (Shen et al., 2015) and in situ alloying (Ma et al., 2014) as well as
controlling the microstructure through modification of the feedstock wire (Bermingham et al.,
2016). The influence of wire batch on the WAAM process and resulting components is
discussed in further detail in Section 2.4.
Different power sources can be used for WAAM, including gas tungsten arc welding
(Cong et al., 2017b), gas metal arc welding (Xiong et al., 2018), cold metal transfer (Cong et
al., 2015) and plasma (Martina et al., 2012). Gas tungsten arc welding (GTAW) involves a
non-consumable tungsten electrode. In the case of WAAM, wire is fed separately to the arc.
During gas metal arc welding (GMAW), an arc is formed between the consumable wire
electrode and the work piece. MIG is a type of GMAW that uses an inert gas. Cold metal
transfer (CMT) is a controlled dip metal transfer technique that utilises short circuit welding
to detach a single droplet onto the weld. It is a modification of MIG welding. Plasma is
similar to GTAW but the electrode does not have to be tungsten and the plasma and arc is
more constricted, and thus higher power. The choice of power source will affect voltage and
current characteristics. These will influence thermal history of the process, geometry and
behaviour of the weld pool, and resulting properties of components.

9
The choice of power source will also affect metal transfer and deposition of material.
Metal transfer during GTAW include free and bridging. In free, the weld bead detaches from
the wire before touching the weld pool. In bridging, the material is deposited after the wire
touches the weld pool. There are different types of metal transfer that occur during MIG
welding: short circuit, globular, spray and explosive. A short circuit is caused by contact
between the wire and the weld pool, which results in the arc extinguishing. The weld droplet
then detaches from the end of the wire due to surface tension from the weld pool and the arc
reignites, repeating the process. Globular metal transfer refers to when the weld droplet
grows at the end of the wire, often larger than the diameter of the wire itself, and detaches
due to gravity or short circuiting. Spray metal transfer requires high current and voltage to
deposit vapour or spray from the wire and material is projected to the weld pool by
electromagnetic forces. Explosive metal transfer as when the weld droplet shatters or
disintegrates and detachment of the bead from the wire is irregular and ragged. Again, metal
transfer can affect thermal history of the process, geometry and behaviour of the weld pool
and resulting properties of components.
The environment and the equipment, such as the shielding gas, will also influence the
WAAM process and properties of resulting components (Mathers, 2002). Humidity of the
environment could influence hydrogen in the weld pool (Lancaster, 1999) which may have
adverse effects, as discussed in Section 2.7. The type and composition of shielding gas affects
the process. Types of shielding include localised or in a tent; localised shielding is not
generally considered sufficient for WAAM of titanium due to oxidation of the material (Ding,
J. et al., 2015). The composition of shielding gas has been observed to affect deposition for
steel (Kazanas et al., 2012). Helium and argon are common shielding gases as they are both
inert and cost effective for use in welding. A mixture of the two is often used to increase arc
stability and arc voltages as helium has a higher thermal conductivity and ionization potential
than argon. Kazanas et al. observed that using a helium and argon mixture as a shielding gas
compared to using 100% argon shielding gas resulted in thicker deposited layers. The
composition of shielding gas has also been observed to have affected microstructure of
Ti6Al4V (Almeida and Williams, 2010). The influence of other critical process parameters
on the WAAM process and resulting components is explored in Section 2.5.
WAAM has been used to build a number of different demonstrator components including
armour plates, satellite fuel tanks, turbine blades, wing spars and bulkheads. Examples of
these are displayed in Figure 2.3. Properties of components have been achieved that are better
than the wrought material (Martina et al., 2013; Gu et al., 2016a).

10
Commercial viability of WAAM is currently limited, however. There are issues with tool
path design, residual stresses and reproducibility. Currently for WAAM, there is no standard
commercially available system: the equipment is all commercially available but there is no
complete system designed for purpose (Ding, D. et al., 2014). Instead, tool paths have to be
generated by the operator. This is time consuming and may not result in optimum settings.
Models have been developed to try and overcome this problem (Ding, D. et al., 2014; Ding,
D. et al., 2015a). Residual stresses are commonly recognised as an issue for WAAM (Ding,
D. et al., 2015b; Williams et al., 2016) and again, studies have been undertaken to try and
overcome this issue (Colegrove et al., 2013; Hönnige et al., 2018).
Figure 2.2: Schematic of the WAAM process.
11
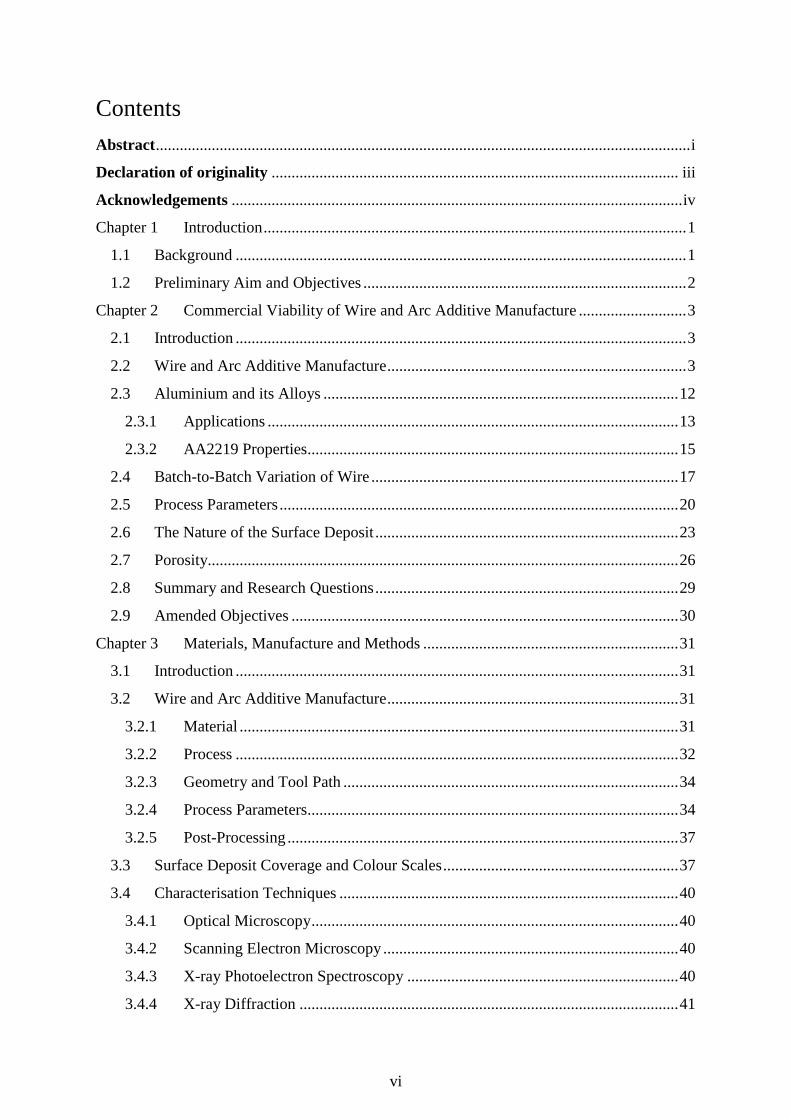
Figure 2.3: Examples of components manufactured using WAAM: (a) steel armour plating.
Credit: Lockheed Martin UK, (b) steel landing gear. Credit: Cranfield University, (c)
aluminium fuel tank dome. Credit: Lockheed Martin UK, and (d) titanium wing spar.
Credit: Cranfield University.
Reproducibility is one of the largest barriers for commercial viability of WAAM as it is
for all AM processes (Frazier, 2014; Seifi et al., 2016; Seifi et al., 2017). The use of A-, B-
and S-basis design allowables is standard practice for the aerospace industry to statistically
substantiate reproducibility of a material in a specific condition and form. It has been
proposed that this should be standard practice for AM too (Frazier, 2014). A-basis
allowables, also known as T99 values, are the values of properties such as strength for which
99 % of the population are expected to equal or exceed the value with a confidence level of
95 %, B-basis allowables or T90 values are the values of properties such as strength for which
90 % of the population are expected to equal or exceed the value with a confidence level of
95 % and S-basis allowables are values that are based on limited datasets with limited
(a)
(b)
(d) (c)

12
statistical significance or can be specification minima with no statistical significance (Battelle
Memorial Institute, 2014). The minimum number of samples required for A-basis is 100, for
B-basis is 50 and for S-basis is typically 30, all over a number of different material and
component batches. In addition, for A- and B-basis allowables, a minimum of 10 batches of
samples covering the full product range are required and it must be possible to treat the
samples as a single population for valid statistical analysis. A-, B- and S-basis allowables
have not, as yet, been published for WAAM for any material.
Variation in process and components are commonly observed for AM and WAAM but
the causes have not been fully identified (O’Regan et al., 2016; Saint John et al., 2016; Gu et
al., 2015 Cong et al., 2015). It is important that the effect of these are fully understood and
they are controlled to ensure reproducibility. If the behaviour of the process and properties of
the components cannot be accurately predicted, there will be no confidence in the technology.
Also, variation results in an inability to optimise designs and difficulties in regards to
standardisation and qualification of process and components. It has been observed for
WAAM that many characteristics including surface deposit coverage, porosity, arc stability,
deposition behaviour, surface appearance, geometry, microstructure and mechanical
properties can vary (Wang et al., 2011; Kazanas et al., 2012; Martina et al., 2012; Ayarkwa et
al., 2015; Cong et al., 2015; Gu et al., 2015; Cong et al., 2017a; Xiong et al., 2018; Zhang, C.
et al., 2018). These studies suggest that wire batch and process parameters are sources of
variation and the effect of these on the WAAM process and resulting components are
explored in §2.4 and §2.5 respectively.
2.3 Aluminium and its Alloys
Aluminium is the third most prevalent element in the Earth’s crust and is the most widely
used non-ferrous metal (Polmear, 2006). It was not commonly used however until industrial
scale production. This was achieved through the Bayer process, refining bauxite to produce
alumina, and the Hall-Héroult process, to produce aluminium from alumina via electrolytic
smelting, in the 19th century (Polmear, 2006).
Since the mass production of aluminium, many alloys have been developed to obtain
desirable properties for many different applications. There are eight series of wrought alloys
according the International Alloy Designation System (The Aluminium Association, 2015).
Each series denotes a different major alloying element, as detailed in Table 2.3.

13
Table 2.3: Wrought aluminium alloy designation system.
Alloy Series Principal Alloying Element
1000 Commercially pure aluminium: > 99 wt % aluminium.
2000 Copper
3000 Manganese
4000 Silicon
5000 Magnesium
6000 Magnesium and silicon
7000 Zinc
8000 Other.
2.3.1 Applications
Aluminium and its alloys are light weight, pure aluminium has a density of 2.7 g cm-3, and
can achieve high strengths. The strength can be improved by different alloying elements and
strengthening methods, as seen in Table 2.4 (Davis, 2001). Different alloying elements can
also affect other properties such as ductility and resistance to stress corrosion cracking, as
they may alter the microstructure.
Table 2.4: Strength ranges of various wrought aluminium alloys. From Davis, 2001.
Alloy Series Principal Alloying Element Strengthening
Method
Tensile strength
range (MPa)
1000 > 99 wt % aluminium. Cold work 70 – 175
2000 Copper Heat treat 170 – 520
3000 Manganese Cold work 140 – 280
4000 Silicon Cold work 105 – 350
5000 Magnesium Cold work 140 – 380
6000 Magnesium and silicon Heat treat 150 – 380
7000 Zinc Heat treat 380 – 620
8000 Other. Heat treat 280 – 560
Other typical properties of aluminium and its alloys include:
1. Corrosion resistance due to a naturally forming protective oxide layer.
2. High ductility and thus good formability, enabling manufacture of complex
geometries.
3. Good thermal and electrical conductivity
4. Non-toxic and non-magnetic.
Some alloys also have good weldability and can be used as filler material for fusion welding.
14
These properties are desirable for many different applications. Designers will choose the
alloy and the subsequent post-processing, such as heat treatment, to optimise the balance of
properties for condition of use. For example, it may be necessary to use a lower strength alloy
to minimise susceptibility to a corrosive environment.
Aluminium and its alloys are most commonly used for food containers and packaging as
they are non-toxic (Kalpakjian and Schmid, 2016). Other applications include construction,
due to a high strength to weight ratio and good corrosion resistant properties, electrical
products, because of good electrical conductivity and being non-magnetic, and transportation
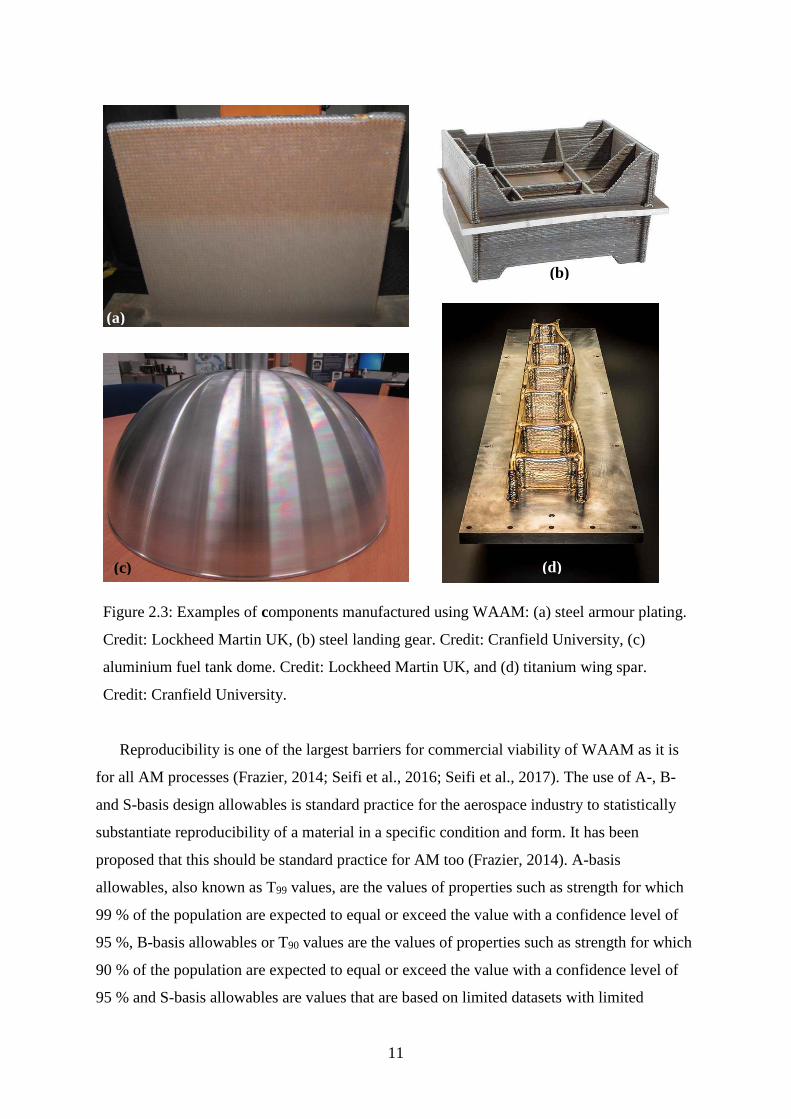
such as cars and aeroplanes. Figure 2.4 and Table 2.5 show an example of a typical passenger
aircraft from the early 1990s and the different aluminium alloys required to build it. There
has been an increase in the use of composites for modern airplanes but high strength
aluminium alloys, such as the 2000 and 7000 alloys, are still used for the wings, fuselage and
other parts (Lequeu et al., 2007). Aluminium alloys are desirable for aerospace because of
their high strength to weight ratio, particularly compared to steel, and low cost, compared to
titanium (Gregon, P.J., 1995; Kalpakjian and Schmid, 2016).
Figure 2.4: Property requirements for structural components of a typical passenger aircraft.
From Staley and Lege, 1993.

15
Table 2.5: Aluminium alloy used for structural components of a typical passenger aircraft.
From Polmear, 2006.
Aircraft Component Alloy used
Fuselage skin 2024–T3, 7075–T6, 7475–T6, 6013–T78
Fuselage stringers 7075–T6, 7075–T73, 7475–T76, 7150–T77
Fuselage frames/bulkheads 2024–T3, 7075–T6, 7050–T6
Wing upper skin 7075–T6, 7150–T6, 7055–T77
Wing upper stringers 7075–T6, 7150–T6, 7055–T77, 7150–T77
Wing lower skin 2024–T3, 7475–T73
Wing lower stringers 2024–T3, 7075–T6, 2224–T39
Wing lower panels 2024–T3, 7075–T6, 7175–T73.
Ribs and spars 2024–T3, 7010–T76, 7150–T77, 7085–T7651
Empennage (tail) 2024–T73, 7075–T6, 7050–T76
The alloys in Table 2.5 have undergone different tempers to obtain suitable properties; T
denotes solution heat treatment. T3 refers to solution heat treated, cold worked, and naturally
aged. T6 refers to solution head treated and artificially aged. T7x is solution heat treated then
artificially overaged.
Lockheed Martin UK has focused its interest on using WAAM for aerospace and space
applications as these are typically low-volume products that require a high strength to weight
ratio. Suitable aluminium alloys are limited however. There are difficulties welding 7000
series alloys due to high cracking sensitivity (Polmear, 2006; Fukuda, 2010) and currently
7000 series alloy welding wire is not commercially available. 2000 series alloys have similar
issues (Polmear, 2006) but there is a commercially available 2000 series alloy welding wire:
aluminium alloy 2319 (AA2319), which was developed to weld AA2219. It has similar
composition and properties to wrought AA2219 following T6 heat treatment (British
Standards Institution, 2004b; Gu et al., 2016a), thus making it desirable for aerospace
application, and is weldable, thus suitable for WAAM.
2.3.2 AA2219 Properties
The nominal composition of AA2219 is shown in Table 2.6.
Table 2.6: Nominal composition of AA2219 in wt % (The Aluminium Association, 2015).
Cu Mg Mn Ti Zr V Zn Si Fe Al
Min 5.8 0.2 0.02 0.1 0.05 Rem.
Max 6.8 0.02 0.4 0.1 0.25 0.15 0.1 0.2 0.3 Rem.

16
AA2219 undergoes heat treatment to improve its properties, via precipitation hardening.
There are typically three stages:
Solution treatment. The alloy is heated to relatively high temperature to dissolve
alloying elements into solid solution to form a single phase.
Quenching. The alloy is rapidly cooled to obtain a supersaturated solid solution
(SSSS).
Aging. Aging can occur at elevated temperature, known as artificial aging, or
room temperature, called natural aging. During this stage, the SSSS decomposes
to form precipitates.
There can be an additional stage: the alloy is cold worked between quenching and aging.
The equilibrium microstructure seen in castings is predominantly Al-rich grains which
solidify first with Al2Cu eutectic at copper-rich grain boundaries. During aging, Al2Cu
precipitates out from SSSS to form precipitates within the grains which are typically evenly
distributed in the matrix. The precipitates can inhibit the movement of dislocations due to
lattice distortions, thus strengthening the material. Examples of AA2219 cast and wrought
microstructure can be seen in Figure 2.5, following (a) heat treatment and (b) heat treatment
and cold working. Al2Cu precipitates within grains and copper-rich grain boundaries are
observed in Figure 2.5a. Al2Cu precipitates are also visible within grains for Figure 2.5b, in
addition to slightly elongated grains in the direction of rolling.
Figure 2.5: (a) Back scattered electron image of cast AA2219-T62 plate. From Raju et al.,
2007. (b) Optical photomicrograph of wrought AA2219-T87 plate. Bright particles in the
microstructure are Al2Cu precipitates. From Murty et al., 2016.

17
The properties of AA2219 depend on the heat treatment used. Relevant properties of
wrought AA2219 that has undergone different heat treatments are presented in Table 2.7. O is
without heat treatment, T62 involves artificial aging by the user rather than the supplier of the
alloy and T8x includes cold work between quenching and artificial aging.
Table 2.7: Relevant properties of wrought AA2219 (ASM Handbook Committee, 1990;
Polmear, 2006; Dungore and Agnihotri, 2008).
AA2219-O AA2219-T81 AA2219-T62 AA2219-T87
Melting Temperature 543 °c - - -
Density 2.84 g cm-3 - - -
Tensile strength (MPa) 170 455 415 475
0.2 % proof stress (MPa) 70 350 290 395
Elongation (% in 50 mm) 18 10 10 10
Similar properties have been observed for WAAM AA2319-T6 (Gu et al., 2016a). It is
therefore possible that WAAM AA2319 could replace AA2219 where applicable, if
reproducible and repeatable properties are achieved.
2.4 Batch-to-Batch Variation of Wire
It has been observed that the WAAM process and resulting properties of components are
affected by wire batch used (Gu et al., 2015; Ding, J., 2015). Gu et al. (2015) observed
significant differences in deposition and appearance of single pass bead for five different
batches of AA4043 wire using the same process parameters. The differences in appearance
can be seen in Figure 2.6. Arcs of Wire 1 and 2 were stable and spatter free and the
corresponding bead profiles were uniform. Arcs of Wire 3, 4 and 5 were unstable and there
were high levels of spatter and vapour. There were also high levels of deposit on the surface
and a consistent deposition could not be achieved with Wire 5.

18
Differences in geometry and appearance were observed for two AA2319 conics using the
same process parameters but different batches of wire from the same manufacturer (Ding, J.,
2015). The conics are shown in Figure 2.7. The manufacture of one cone could not be
completed due to instability in the arc and rough surface finish. The differences between the
two cones also included waviness at the top of the cones, uniformity of the layers, surface
roughness and surface deposit coverage.
Figure 2.6: Single bead deposited by five different AA4043 wires. Top to bottom: Wire 1
to 5. From Gu et al., 2015.

19
Features of wire could affect arc stability, geometry of the components, appearance of the
components and material and mechanical properties of the components. Gu et al. observed a
correlation between wire surface finish and arc stability during WAAM of AA2319 (Gu et
al., 2015). Rough, dull surface finishes with defects resulted in unstable arcs with high levels
of spatter and vapour. Smooth, brighter surface finishes resulted in stable arcs. Defects such
as scratches and notches can cause feeding issues in addition to being sites of contamination,
both of which influence arc stability due to the adverse effect on conductivity. Zinke and
Shröder (2004) observed the converse during welding of steel alloys. Unstable arcs were
observed more frequently with wire that had a bright, smooth surface compared to wire that
had a dull, rough surface. The authors attributed this to contamination on the surface of
smooth wire accumulating at the end of the contact tube and disturbing current transmission.
It was suggested that accumulation of contamination was more likely for smooth wire than
rough wire as for rough wire, contamination is trapped in recesses and notches rather than
directly on the surface.
Geometry of wire can affect arc stability during welding. Limits are put on the cast, the
diameter of a loop of wire removed from the spool, and helix, the distance between loops of
wire (British Standards Institution, 2011). This is to ensure that friction during feeding is
limited but electrical conductivity is not inhibited. The effect of diameter, cast and helix on
process stability during welding of steel has been studied (Modenesi and de Avlar, 1999). It
Figure 2.7: AA2319 conics produced by WAAM with the same build conditions but
different batches of wire. A is smaller than B (the build had to be stopped as the arc was
unstable) with a rougher surface finish, non-uniform layers and higher surface deposit
coverage.
(a) (b)

20
was found that diameter was the dominant factor and significantly affected current and metal
transfer behaviour. The authors suggested this was due to differences in volume of material; a
larger diameter would require a higher current to melt the wire.
2.5 Process Parameters
There are many different parameters for WAAM that could affect the process and the
resulting properties of components, as discussed in Section 2.2. Details of some can be found
in Table 2.8. Only the CMT arc type has been considered as this was the capability available
at Lockheed Martin UK for this work. During CMT, the average current is kept low (and
therefore the heat to the weld) but the current amplitude of the pulse is high. It is favourable
as the arc is apparently stable and spatter free (Fronius, 2014). CMT is the preference for
Lockheed Martin UK due to lower heat input compared to other arc types.
Table 2.8: Details of some process parameters for WAAM.
Process Parameter Details
Wire feed speed (WFS) Rate at which the wire is fed through the torch. Affects the
size and shape of the weld bead and weld pool. Also see
current and voltage.
Travel speed (TS) Speed of the bead relative to the surface and typically it is
controlled by the speed of the torch. If it is too slow, the
heat build‐up may be excessive, too fast and the weld pool
will have gaps, a defect known as humping.
Current, Voltage Automatically adjusted depending on the WFS to produce
a suitable arc of the correct energy and length for welding.
Affects heat input to the weld pool and the component, in
addition to uniformity of deposition.
CMT mode CMT, CMT-P CMT-ADV, CMT-PADV.
There are four different CMT modes. CMT is standard CMT as described above. ‘P’
refers to pulsing the current to control the detachment of single droplets from the wire.
‘ADV’ comprises of a reversal of polarity of the welding current in the short circuit phase of
the CMT cycle, leading to higher control of the heat input and a higher deposition rate.
‘PADV’ describes the polarity difference of the pulse cycle (positively poled) and the CMT
cycle (negatively poled), resulting in a more stable arc and higher levels of control and

21
precision. The differences between the various CMT modes can be seen in their arc current
and voltage waveforms as shown in Figure 2.8. To achieve stable arcs during CMT, the arc
burning time and short-circuit time must be the same and during CMT-P and CMT-PADV,
there should be one drop transferred per pulse (Suban and Tušek, 2003).
Figure 2.8: Waveform of the current, in blue, and voltage, in black, of different CMT modes. (a)
CMT. (b) CMT-P. (c) CMT-ADV. (d) CMT-PADV. From Cong et al., 2015.
The effect of WFS, TS and pulse characteristics, including CMT mode, on the WAAM
process and properties of WAAM components has been studied. Kazanas et al. (2012)
analysed the influence of TS and WFS on geometry of WAAM components made from
aluminium and steel alloys using CMT. Figure 2.9 shows the results of their study. High
WFS resulted in thicker walls, as more material was deposited. High TS resulted in thinner
walls as material was deposited over a larger area at a faster rate. Surface waviness was
significantly affected by TS. High levels of surface waviness were observed at high and low
TS. At high TS this was due to humping, a welding defect, that can be seen in Figure 2.10.
The authors suggested high levels of surface waviness were observed at low TS because there
was a reduction in fusion due to low current.

22
Figure 2.9: The effect of WFS and TS for mild steel components on (a) effective wall thickness,
which is defined as the maximum constant wall thickness after machining, and (b) surface waviness,
the average maximum peak-to-valley distances measured from a profile of a component. From
Kazanas et al., 2012.
Figure 2.10: Photograph of steel single pass depositions for different TS. From Kazanas et
al., 2012.

23
Martina et al. (2012) studied the effect of WFS, TS and current on the geometry of
Ti6Al4V components using plasma wire deposition. Layer height depended on WFS and
current, wall thickness depended on WFS to TS ratio and, similar to CMT, a high TS resulted
in humping. This behaviour has been linked to the rate of volume deposited per unit distance,
which is controlled by WFS and TS, and the rate of solidification, which is affected by WFS,
TS and current for steady state conditions of thermal loss. Xiong et al. (2018) found that WFS
and TS affected surface roughness of WAAM steel components. A high TS resulted in low
surface roughness and the converse was true for WFS. The authors suggested two factors that
cause this. One factor was a high TS and a low WFS, which decreases the layer height and
reduces the ‘stair stepping effect’. The stair stepping effect refers to prominent boundaries
between adjacent layers, resembling stair steps, which cause a rough surface. The other factor
was arc force and droplet pressure, which increases with WFS, and produces an unstable
molten pool again causing a rough surface.
Wang et al. (2011) found that there was no correlation between pulse characteristics and
the morphology of Ti6Al4V: peak/base current ratio and pulse frequency did not affect prior
beta grain size. The authors observed that TS did not affect prior beta grain refinement but
WFS did; uniaxial prior beta grains grew at higher WFS. The authors suggested that an
increase in wire volume resulted in an increase in heterogeneous nucleation sites and a
negative temperature gradient in front of the liquidus which both can inhibit columnar
growth.
2.6 The Nature of the Surface Deposit
Surface deposits are sometimes observed on aluminium components produced using WAAM
(Gu et al., 2015; Ding, J., 2015). They can be black, brown or grey in colour and cover the
whole surface of the component or inhomogenously. They appear similar to surface deposits
that are observed during welding of aluminium alloys (Woods, 1980; Sugiyama et al., 1993;
Jyogan et al., 1998; Committee of Welding Procedure, 1999; The Aluminium Association,
2002; Armao, 2003; Lee et al., 2015a; Lee et al., 2015b). Figure 2.11 shows examples of
surface deposits on an aluminium WAAM component and a MIG weld.

24
(a) (b)
Figure 2.11: Examples of surface deposits on (a) an aluminium WAAM component and (b) an
aluminium MIG weld. From The Aluminium Association, 2002.
There have been few attempts to analyse surface deposits found on WAAM aluminium
components. Gu et al. refer to them as black ash or carbide for AA4043 WAAM but there is
no data available to support this claim (Gu et al., 2015). Gu et al. observed that the formation
of surface deposits varied with batch of wire used and occurred when there was an unstable,
wandering arc.
The nature of surface deposits formed during welding of aluminium alloys has been
reported (Sugiyama et al., 1993; Lee et al., 2015a; Lee et al., 2015b). The composition of
surface deposits formed during MIG welding and plasma MIG hybrid welding (PMHW) of
5000 series aluminium alloy have been characterised using electron probe micro-analysis
(EPMA) and it was found that there were high concentrations of magnesium and oxygen
(Sugiyama et al., 1993; Lee et al., 2015a; Lee et al., 2015b). Complementary EPMA and
transmission electron microscopy analysis showed magnesium oxide nanoparticles in an
amorphous aluminium-magnesium-oxygen layer (Lee et al., 2015b). Surface deposits formed
during the welding of 1000 series aluminium alloys have also been characterised using
EPMA and high concentrations of aluminium and oxygen were observed with very low
amounts of magnesium compared to 5000 series alloys (Sugiyama et al., 1993). The results
from the work of Sugiyama et al. suggests that the composition of the surface deposit
depends on the feedstock wire used. Few papers address the nature of surface deposits
formed during welding of 2000 series of aluminium alloys but their appearance has been
commented upon (Woods, 1980; Sugiyama et al., 1993). AA2319 is of interest to LM, as
discussed in §2.3, but the composition of the surface deposit formed during the welding of
AA2319 has not been reported.
25
The cause of surface deposit formation during welding has been attributed to condensed
vapour from the feedstock wire (Woods, 1980; Sugiyama et al., 1995; Lee et al., 2015a).
Woods found more extensive quantities of surface deposit (called “smut” in the paper) for
aluminium magnesium alloys (5000 series) compared to 1100, 3003, 2319 and 4043 alloys
(Woods, 1980). Woods suggested that the relatively large proportion of surface deposit was
caused by higher amounts of condensed and oxidised vaporised metal during welding due to
the low boiling point of magnesium, thus high vapour pressure, compared to other alloying
elements. The results of Sugiyama et al. (Sugiyama et al., 1995) support the suggestion in the
work of Woods. Less surface deposit was observed with tandem welding of AA1070 filler
wire with AA5356 and AA4043 filler wires compared to welding with only AA5356 filler
wire. Like Woods, Sugiyama et al. ascribed the differences in surface deposit coverage to the
differences in boiling points of the alloying elements in the wires. Images taken with a high-
speed camera from the work of Lee et al. support this suggestion as they show the creation of
metal vapour during MIG welding of AA5183 for samples that resulted in surface deposit
(Lee et al., 2015a).
The creation of metal vapour during welding has been linked to explosive metal transfer
(Woods, 1980). High levels of vapour and molten metal droplets from the wire, known as
spatter, were observed in images taken by high-speed cameras during explosive metal
transfer. Woods observed explosive metal transfer occurred with aluminium alloys with a low
boiling point, such as 5000 series, and suggested that it was caused by vapour bubbles
bursting (Woods, 1980). Lee et al. observed two different mechanisms for the production of
vapour during high-speed filming of MIG welding (Lee et al., 2015a). At low wire feed speed
(WFS), and thus low current which corresponds to low temperature of the weld droplet, the
metal vapour was produced by the arc generated by short circuit metal transfer. At high WFS,
and thus high current which corresponds to high temperature, the metal vapour was produced
by explosive metal transfer. PMHW demonstrated different behaviour: at low MIG current,
the metal transfer was explosive and at high MIG current, it was stable and globular. The
difference in behaviour compared to MIG welding was due to the plasma current: at low MIG
current, the plasma current was high and vice versa. The temperature of the weld droplet has
a higher dependency on the plasma current than the MIG current during PMHW thus high
plasma current leads to explosive metal transfer. The results showed that the formation of the
surface deposit depends on the type of welding used and the temperature of the weld droplet.
26
2.7 Porosity
Porosity is the measure of pores in a material: regions of entrapped gas or empty space. It has
been identified as a problem for commercial viability of aluminium WAAM (Cong et al.,
2015). Aluminium is more susceptible to porosity than other metals because of the significant
difference between hydrogen solubility in the liquid form and the solid form (Boeira et al.,
2009). Significant levels of porosity have been observed in aluminium WAAM components,
2.6 % has been reported in some cases (Fang et al., 2018). Large pores have been observed,
over 100 µm in diameter (Cong et al., 2015; Cong et al., 2017a). Studies have also shown
variation in porosity depending on wire batch or process parameters used (Ayarkwa et al.,
2015; Cong et al., 2015; Cong et al., 2017a).
High levels of porosity can result in lower values for key material properties such as
strength, ductility and fatigue (Rudy and Rupert, 1970; Shore and McCauley, 1970; Reddy et
al., 2000). Porosity results in a loss of material which affects strength. Large or irregularly-
shaped pores are detrimental to fatigue properties because they are sites of fatigue crack
initiation. This is due to stress concentrations arising from geometrical discontinuities.
There are different mechanisms for porosity formation in WAAM of aluminium alloys.
The dominant cause of porosity formation during aluminium WAAM and welding is widely
recognised as hydrogen entrapment (Harris, 1988; Gu et al., 2016b). Hydrogen gas evolves as
the weld pool solidifies and is then trapped as bubbles in the solid metal, typically resulting in
spherical pores. Another mechanism is shrinkage porosity which results in irregularly shaped
pores. Shrinkage porosity results from hydrogen migration into the voids caused by
volumetric differences between the liquid and solid solution. Shrinkage porosity in AA2319
primarily arises from the Al2Cu eutectic. Al2Cu is the last phase to solidify and has a
significantly higher density as a solid than liquid, about 3400 kg m-3 compared to 3200 kg m-3
(Ganesan and Poirier, 1987). Also, pores can form as hydrogen migrates into vacancies
induced by dissolution of primary eutectic phases during heat treatment (Gu et al., 2016b).
Wire properties could affect porosity of WAAM components but there have been few
attempts to analyse this. It has been suggested that moisture in the oxide layer and
contamination on the surface of the wire are sources of hydrogen and thus porosity during
WAAM (Cong et al., 2015; Bai et al., 2017; Cong et al., 2017a) which may vary from batch
to batch. In these studies, a reduction in porosity of aluminium WAAM components was
observed when the oxide layer on the surface of wire had been removed. It is commonly
acknowledged that a primary source of the hydrogen during welding is the feedstock wire
content, particularly contamination and a hydrated oxide layer on the surface of the wire
27
(Devletian and Wood, 1983; Harris, 1988; Mazur; 1992; Gingell and Gooch, 1998;
Ryazantsev and Fedoseev, 2002). WAAM is essentially multi-layer welding so it is likely that
the sources of hydrogen are the same.
The composition of the wire could also affect porosity. Copper content of the wire could
affect porosity of AA2319 WAAM components as shrinkage porosity in AA2319 arises from
the Al2Cu eutectic and hydrogen migration into the vacancies induced by dissolution of
copper-bearing eutectic during heat treatment (Gu et al., 2016b). Slight differences in
alloying elements could change the solidification characteristics of the material and hydrogen
solubility. The amount of copper, iron, magnesium, zinc and manganese in Al-Si-Cu-Mg-Fe
380 alloy affected the behaviour during solidification and the resulting microstructure (Gowri
and Samuel, 1994). The addition of magnesium, lithium and zinc to commercial purity 1100
alloy welding wire has been shown to increase the solid solubility of hydrogen and adding
copper has been shown to reduce it: the solid solubility of hydrogen in non-equilibrium rapid
cooling conditions has been reported as 0.45 ml per 100 g in AA2219 compared to 0.7 ml per
100 g in AA1100 (Woods, 1974). However, it has been previously reported that welds
produced with wire of the same nominal alloy with differences in the amount of alloying
elements showed no significant differences in porosity (Masubuchi, 1972). Work on porosity
in aluminium castings has shown the volume fraction of porosity was far lower in 99.999 %
pure aluminium than Al-Mg alloys containing the same amount of hydrogen, which was
attributed to a lack of precipitates in pure aluminium that act as hydrogen nucleation sites
(Toda et al., 2009).
It has been reported that there is a correlation between WFS to TS ratio and porosity: the
higher the ratio, the higher the pore count for AA2319 WAAM components (Ayarkwa et al.,
2015). A higher WFS to TS ratio results in a higher amount of deposited material per unit
length which increases the weld bead size. It was suggested that a larger weld bead size
would limit the ability of hydrogen bubbles to escape to the surface. For a very high WFS to
TS ratio of 25, it was observed that the pore count decreased which was attributed to the high
heat input which caused slow cooling, allowing more time for the hydrogen bubbles to
escape. Similar suggestions have been made about welding, a process that WAAM is based
on. Low WFS would cause less wire fed to the weld pool and thus result in less hydrogen and
reduce the distance hydrogen bubbles travel to escape to the surface (Harris, 1988).

28
It has been observed that AA2319 panels manufactured using CMT-PADV result in little
or no porosity compared to panels manufactured using CMT-P and CMT-ADV (Cong et al.,
2015). The reduction in porosity was attributed to a combination of lower heat input and
more effective removal of oxide from the wire surface using CMT-PADV compared to the
other CMT modes. Lower heat input resulted in a higher number of fine equiaxed grains and
fewer dendrites, of which the latter act as nucleation sites for hydrogen pores. It has also been
observed that AA2319 panels manufactured using CMT-ADV had a reduced number of pores
and area percentage of porosity compared to CMT-P (Cong et al., 2017a). The authors also
attributed this reduction to lower heat input, resulting in a refined grain structure, and
effective oxide cleaning of the wire surface of CMT-ADV compared to CMT-P. Zhang, C. et
al. (2018) observed that the microstructure and mechanical properties were improved using
CMT-PADV compared to CMT and CMT-P. The authors suggested that this was caused by a
stronger oscillation stirring effect, which increased grain refinement.
Porosity and unstable arcs have been linked during welding (Reichelt et al., 1980; Harris,
1988). A stable arc refers to when there is uniform metal transfer, including no spatter, and
constant arc length (Suban and Tušek, 2003). An unstable arc refers to the opposite and is
associated with fluctuations in current and voltage (Modenesi and Nixon, 1994). Non-
uniform metal transfer may affect porosity because it can disrupt the shielding gas which
increases contamination into the arc and weld pool (Woods, 1974), and cause turbulence in
the weld pool (Kumar et al., 2009). An increase in arc length can cause contamination of the
shielding gas (Ghosh, 2017) and increases hydrogen absorption to the arc (Woods, 1974).
Fluctuations in current and voltage can influence porosity as they affect shielding gas
coverage (Barborak et al., 1999) and weld bead convection (Kou and Wang, 1986). Arc
stability also influences heat input to the weld pool, which can affect solidification rates and
mechanics which affects microstructure of the weld and also affects porosity (Pal and Pal,
2011).
Arc wander is also linked with porosity (Reis et al., 2011). Arc wander, also known as arc
blow, is deflection or erratic movement of the arc (Department of the Army, 1976; Reis et al.,
2011). Arc wander can be caused by various factors: magnetic effects, low electron emission,
cathode spot formation, contamination or air draughts. Magnetic arc wander refers to an
unbalanced magnetic field around the arc, causing a force in one direction (Reis et al., 2011).
This is unlikely during welding of aluminium, as it is considered non-magnetic, although the
magnetic field induced by the current through the arc could interact with magnetised steel
clamps (Armao, F., 2011). Arc wander caused by an asymmetric current path is known as

29
thermal arc wander. It is due to so called ‘hot spots’ on the work piece where thermionic
emission of electrons is higher, providing a path of least resistance for the current (Lancaster,
1986). Arc wander can be caused by turbulence in the shielding gas and contamination
(Department of the Army, 1976; Mohler, 1983) and may affect weld pool convection, thus
the association with porosity formation.
2.8 Summary and Research Questions
The suitability of WAAM of aluminium for the desired applications of Lockheed Martin UK,
particularly aerospace, is supported by results found in literature as properties similar to
wrought high-strength aluminium alloys have been achieved. Commercial viability of the
process is limited, however, by the reported lack of reproducibility in arc stability, surface
deposit coverage, porosity, microstructure and mechanical properties. There is limited open
literature on reproducibility of the surface deposit formed during WAAM of AA2319 and on
porosity of WAAM 2319 components.
Previous work has suggested that wire composition, wire surface finish and process
parameters, such as WFS and power source, could affect surface deposit formation. Various
factors have been identified that influence porosity including the environment, properties of
wire, including composition, geometry and surface condition, and process parameters, such
as WFS and CMT mode.
A review of literature has given rise to various questions; the answers are sought through
the research and discussed in this thesis. The questions are the following:
What is the surface deposit, and does it affect commercial viability of WAAM?
Do process parameters or wire batch affect the external appearance and porosity of
WAAM AA2319 components?
Can porosity be reproducibly reduced to an acceptable level or eliminated to improve
commercial viability of WAAM?

30
2.9 Amended Objectives
Following a review of literature, the objectives to achieve the main aim, improvement of the
commercial viability of WAAM, have been refined and are summarised below:
Study of the nature of the surface deposit formed on aluminium WAAM components.
Analysis of the influence of wire batch and process parameters on reproducibility of
surface deposit formation and porosity of AA2319 WAAM parts.
Characterisation of the surface finish, geometry and composition of wire to determine
which feature may influence reproducibility.

31
Chapter 3
Materials, Manufacture and Methods
3.1 Introduction
Panels and box sections were manufactured using different wire batches and process
parameters. The resulting surface deposit and porosity of the components were studied in
order to analyse the influence of wire batch and process parameters on reproducibility of
WAAM. The purpose of manufacturing the components was also partly to provide
foundation for A- and B-basis allowables as they are required for product design and
material/part qualification in aerospace and other fields of engineering. The manufacturing
details of the components are found in §3.2. §3.3 contains the scales used to describe the
coverage and colour of the surface deposit. The nature of the surface deposit and batch-to-
batch variation of wire were also analysed, and an overview of the characterisation
techniques used follows in §3.4.
3.2 Wire and Arc Additive Manufacture
3.2.1 Material
1.2 mm nominal diameter AA2319 wire was used to manufacture the WAAM panels and
boxes. AA2319 was chosen for its desirable properties, as discussed in §2.3. The components
were built on 25 mm thick AA5083 and AA6082 – T651 substrate. The substrates were
cleaned with acetone before use. The nominal compositions of all three alloys are shown in
Table 3.1.
Table 3.1. Nominal composition of AA2319, AA5083 and AA6082 (wt %). The remainder is
aluminium.
Alloys
Chemical composition (wt %)
Cr Cu Mg Mn Ti Zr V Zn Si Fe
AA2319 - 5.8–6.8 ≤ 0.02 0.2–0.4 0.1–0.2 0.1–0.25 0.05–0.15 ≤ 0.1 ≤ 0.2 ≤ 0.3
AA5083 0.05–0.25 ≤ 0.1 4.0-4.9 0.4-1.0 0.05–0.25 - - ≤ 0.1 ≤ 0.4 ≤ 0.4
AA6082 ≤ 0.25 ≤ 0.1 0.6–1.2 0.4–1.0 ≤ 0.1 - - ≤ 0.2 0.7–1.1 ≤ 0.5

32
A total of eleven batches of wire were used from three different manufactures: A, B and
C and are labelled by the manufacturer and a designated number: A1, A2, A3, B1, B2, B3,
C1, C2, C3, C4 and C5. B1 was produced as low lubricant wire. C1 and C2 were
manufactured from the same ingot of material as other batches from Manufacturer C but
using a different process including the use of different dies and different wire and spooling
cleaning processes. The bulk composition of most batches of wire was analysed using ICP-
OES and the results are shown in Table 3.2. This is discussed further in Chapter 6.
Table 3.2. ICP-OES results for 25 g samples of wire from A1, A2, B2 and Manufacturer
C (wt %). The error was based on counting statistics. Less than 0.01 wt % of Mg and Zn
were detected.
Cu Mn Ti Zr V Si Fe
A1 6.26 0.31 0.12 0.12 0.08 0.05 0.16
A2 6.18 0.31 0.13 0.10 0.08 0.04 0.13
B2 5.98 0.30 0.11 0.11 0.07 0.13 0.16
C 5.62 0.27 0.12 0.11 0.10 0.07 0.22
Error 0.12 0.03 0.02 0.02 0.02 0.02 0.02
All of the spools of wires, when not in use, were stored in the plastic bags and cardboard
boxes that they were supplied in inside a cupboard in a temperature controlled and humidity
monitored room, as discussed further in Section 3.2.2. All of the substrates were stored in the
same cupboard. Nitrile gloves were used whenever handling material.
3.2.2 Process
The components were manufactured in the WAAM cell at the Lockheed Martin UK Ampthill
site which comprises of a Fronius CMT power source and Robacta CMT welding torches on
an ABB 6-axis robot. The WAAM cell is shown in Figure 3.1.
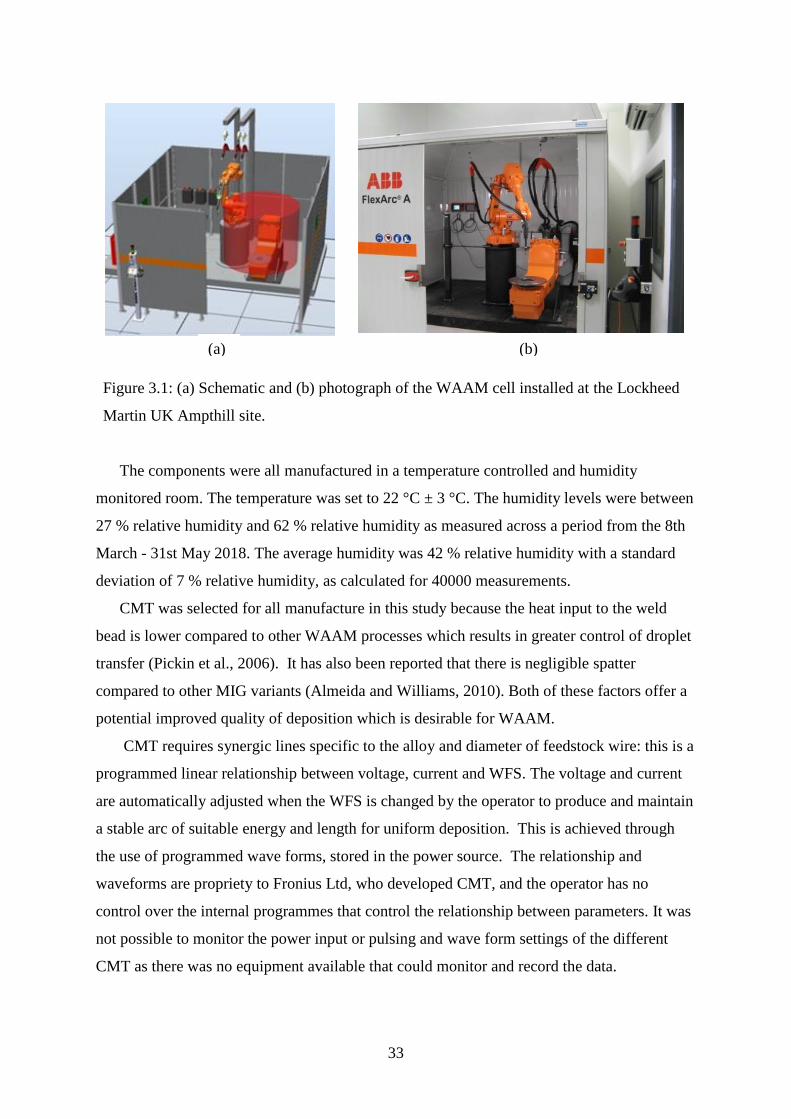
33
Figure 3.1: (a) Schematic and (b) photograph of the WAAM cell installed at the Lockheed
Martin UK Ampthill site.
The components were all manufactured in a temperature controlled and humidity
monitored room. The temperature was set to 22 °C ± 3 °C. The humidity levels were between
27 % relative humidity and 62 % relative humidity as measured across a period from the 8th
March - 31st May 2018. The average humidity was 42 % relative humidity with a standard
deviation of 7 % relative humidity, as calculated for 40000 measurements.
CMT was selected for all manufacture in this study because the heat input to the weld
bead is lower compared to other WAAM processes which results in greater control of droplet
transfer (Pickin et al., 2006). It has also been reported that there is negligible spatter
compared to other MIG variants (Almeida and Williams, 2010). Both of these factors offer a
potential improved quality of deposition which is desirable for WAAM.
CMT requires synergic lines specific to the alloy and diameter of feedstock wire: this is a
programmed linear relationship between voltage, current and WFS. The voltage and current
are automatically adjusted when the WFS is changed by the operator to produce and maintain
a stable arc of suitable energy and length for uniform deposition. This is achieved through
the use of programmed wave forms, stored in the power source. The relationship and
waveforms are propriety to Fronius Ltd, who developed CMT, and the operator has no
control over the internal programmes that control the relationship between parameters. It was
not possible to monitor the power input or pulsing and wave form settings of the different
CMT as there was no equipment available that could monitor and record the data.
(a) (b)

34
The components were all manufactured using 99.998 % pure argon shielding gas at a
flow rate of 20 L min-1. The shielding gas was of the same grade from the same supplier for
all of the builds. The same type of copper torch tips was used for all the builds. The internal
liners and shrouds were cleaned between builds and the internal liners and tips were replaced
when necessary, including between builds with different alloys.
3.2.3 Geometry and Tool Path
The panels were 200 mm in length, 120 mm in height and as-deposited thickness for a single
weld bead. The single pass layers were deposited in alternating directions and there was a
cooling time of 20 s between layers. The box sections were 250 mm in length and width, 120
mm in height and as-deposited thickness. The corner radius of the box sections was 25 mm.
Single pass layers were deposited continuously in a helix type movement. The contact tip to
work distance was set to 10 mm for both types of component.
3.2.4 Process Parameters
Manufacturing trials was designed to examine the significance of different process
parameters on surface deposit coverage and porosity of aluminium WAAM components for
all available batches of wire. The parameters are detailed in Table 3.3.
Table 3.3. Details of the parameters for the manufacture of panels and box sections: values
for the synergic line, CMT mode, WFS and TS
Set of
parameters
Synergic Line CMT mode WFS
(m min-1)
TS
(mm s-1)
A 2319 PADV 6.0 10
B 2319 PADV 3.5 5
C 2319 ADV 3.5 5
D 4043 P 6.0 10
E 4043 P 4.5 10
These values were selected based on previous work. It has been previously observed that
the most significant difference in porosity was between CMT-P and CMT-PADV (Cong et
al., 2015; Cong et al., 2017a). It has been suggested that the optimal WFS to TS ratio is 10
(Ayarkwa et al., 2015) and it is commonly used for WAAM of AA2319: typically, a WFS of
6.0 m min-1 and a TS of 10 mm s-1 (Ding, J., 2015; Gu et al., 2016a; Gu et al., 2016b). Limits
for WFS and TS values were identified from literature (Adebayo et al., 2013; Cognolato,
2015) and the lower values were chosen according to this working envelope.

35
The experiments were constrained by the quantity of wire available in each batch,
equipment limitations and developments in technology. At the start of the research
programme, the only suitable synergic line available was in fact developed for AA4043.
During the programme, the supplier developed ADV and PADV synergic lines for AA2319
and trials demonstrated improvements in deposition, including reduction in spatter and
improved weld bead uniformity, compared to other CMT modes. These were therefore
introduced into the trials for comparison.
Components were manufactured from different wire batches, using different sets of
parameters. Table 3.4 summarises these details. Parameter set A was used to compare
different batches of wire. Parameter sets D and E were used to compare different WFS. A and
D, and B and C were used to compare different CMT modes. D had a different synergic line
to A as CMT-P was not available for 2319 synergic line. The difference in synergic line is
unlikely to dominate over the CMT mode as pulse characteristics are significantly different
for each CMT mode. Examples of components can be seen in Figure 3.2.

36
Table 3.4. The details of component manufacture including the different batches of wire, sets
of parameters used and the corresponding ID numbers. Italics signify box sections.
Wire batch Sample ID Synergic line CMT mode WFS
(m min-1)
TS
(mm s-1)
A1 032 2319 PADV 6.0 10
A1 001 2319 PADV 3.5 5
A1 026 2319 PADV 3.5 5
A1 023 4043 P 6.0 10
A1 024 4043 P 4.5 10
A2 030 2319 PADV 6.0 10
A2 031 2319 PADV 6.0 10
A3 051 2319 PADV 6.0 10
A3 052 2319 ADV 3.5 5
B1 045 2319 PADV 6.0 10
B1 002 2319 PADV 3.5 5
B1 077 2319 ADV 3.5 5
B1 004 4043 P 6.0 10
B1 003 4043 P 4.5 10
B2 044 2319 PADV 6.0 10
B2 021 4043 P 4.5 10
C1 043 2319 PADV 6.0 10
C1 036 2319 ADV 3.5 5
C2 073 2319 PADV 6.0 10
C2 064 2319 ADV 3.5 5
C3 075 2319 PADV 6.0 10
C4 074 2319 PADV 6.0 10
C5 046 2319 PADV 6.0 10
C5 050 2319 PADV 6.0 10
C5 076 2319 PADV 3.5 5
C5 018 4043 P 6.0 10
C5 049 4043 P 6.0 10
C5 019 4043 P 4.5 10

37
3.2.5 Post-Processing
A T6 heat treatment was used to obtain properties suitable for the applications of Lockheed
Martin, as described in Table 2.7. A T8x heat treatment would result in higher strength but
the cold work stage may distort geometry of near-net shape components. Samples were
extracted from components after solution treatment at 535 °C for 1 hour, water quenching
and artificially aging at 190 °C for 26 hours. Porosity was measured for heat treated samples.
3.3 Surface Deposit Coverage and Colour Scales
Scales to categorise the coverage and colour of surface deposits was developed for this study.
Qualitative and descriptive scales were adopted to circumvent the issues posed by the use of
an automated method: complex shapes of components and the surface waviness would make
uniform illumination and thus consistent detection of the surface deposit difficult. Qualitative
scales are readily recognised by the human eye when components are built and act as a
standard means of description for the surface deposit when comparing the appearance of
components since the surface deposit has been noted to vary in appearance. The surface
deposit coverage and colour scales were developed based on observations and can be seen in
Table 3.5 and Table 3.6. For each component manufactured by WAAM, the coverage and
colour were judged independently by three different operators and the median value was
taken. A library of images for the scales has been included to offset this issue and aid
objectivity.

38
Table 3.5. Surface Deposit Coverage Scale
*refers to the surface of the part and not the substrate or near substrate.
Scale Bar Description* Examples
1 No coverage
2 There are a few regions of
coverage and coverage is
inconsistent (there are not large
regions of coverage).
3 Minority of the surface is
covered (< 50 % as determined
by observer) but is still readily
seen and coverage is
inconsistent.
4 Majority covered (> 50 % as
determined by observer) and
coverage is relatively
consistent (large regions of
coverage)
5 Complete coverage

39
Table 3.6. Surface Deposit Colour Scale
Colour Description Example
Black N/A
Grey N/A
Brown N/A
Other If the surface deposit does
not match any of the other
colours specified, it will be
assigned a colour by the
observer who will provide a
description and
photographic evidence.
N/A

40
3.4 Characterisation Techniques
3.4.1 Optical Microscopy
Optical microscopy was used for measuring porosity and characterising the surface finish and
cross-section of wire samples. It was performed on a Nikon Eclipse LV150 light microscope
with a Leica DFC295 digital microscope colour camera and Leica Application Suite analysis
software.
3.4.2 Scanning Electron Microscopy
Scanning electron microscopy (SEM) was used to analyse surface deposits, porosity and wire
because it can provide imaging at high magnification, with good depth of field, and elemental
information. SEM was performed on a JEOL JSM 7100F with a Thermo Scientific triple
analysis system of energy dispersive X-ray spectroscopy (EDX), wavelength dispersive X-
ray spectroscopy (WDX) and electron backscatter diffraction (EBSD). SEM was not
performed to a standard.
Non-conductive samples were sputtered with carbon or gold prior to examination by
SEM. 10 nm of carbon was deposited onto the surface of samples using an Edwards E306
Vacuum Evaporator and 2 – 5 nm of gold was deposited using an Emitech K575 Vacuum
Sputter Coater.
3.4.3 X-ray Photoelectron Spectroscopy
X-ray photoelectron spectroscopy (XPS) was selected because it provides high surface
specific chemical-state information, which is of particular interest for analysing the
composition of the surface deposit and wire surface. XPS spectra were obtained using a
Thermo Scientific K-Alpha X-ray photoelectron spectrometer with a monochromatic Al Kα
X-ray source and spot size of 400 µm. The binding energy scale was calibrated using the C 1s
C-C peak at 284.8 eV. Background subtraction was performed using a Shirley background.
An electron flood gun was used to compensate for charging effects where required. Charge
compensation settings were determined by using the full width half maximum of the C 1s
peak as a datum.
Survey spectra of 0 – 1350 eV were recorded at a pass energy of 200 eV, a step size of
0.4 eV and a dwell time of 10 ms for 3 ‒ 5 scans. High-resolution spectra were recorded at a
pass energy of 50 eV, a step size of 0.1 eV and a dwell time of 50 ms for 5 ‒ 20 scans,
depending on intensity of the peak.

41
3.4.4 X-ray Diffraction
X-ray diffraction (XRD) was selected to provide crystallographic information and clear phase
identification of samples from surface deposits. A PANalytical X’Pert X-ray diffractometer
in Bragg-Brentano configuration was used with Cu Kα radiation, a tube voltage of 40 kV and
current of 30 mA.
3.4.5 Focused Ion Beam
A Tescan Fera 3 plasma focused ion beam (PFIB) with Xe plasma and a 30 nA beam current
was used to mill cross-sections of surface deposits. The surface was platinum coated to
protect it during milling. Images of FIB samples were captured with secondary electrons and
in-lens backscattered electrons.
3.4.6 Raman Spectroscopy
Raman spectroscopy was used to analyse carbon speciation in surface deposits. Raman
spectroscopy was performed on multiple regions on samples with a ThermoFisher Scientific
InVia Reflex Raman Microscope using excitation wavelengths of 457 nm, 532 nm, 633 nm
and 785 nm.
3.5 Summary
This chapter has outlined the details of manufacture, including wire batch and process
parameters, in order to determine the influence of these input variables on WAAM 2319
components. The choice of techniques used to characterise the nature of the surface deposit,
porosity and wire have been described and justified. In Chapter 4, 5 and 6, study of the nature
of the surface deposit, analysis of the influence of input variables on porosity and wire
characterisation results are presented and discussed.
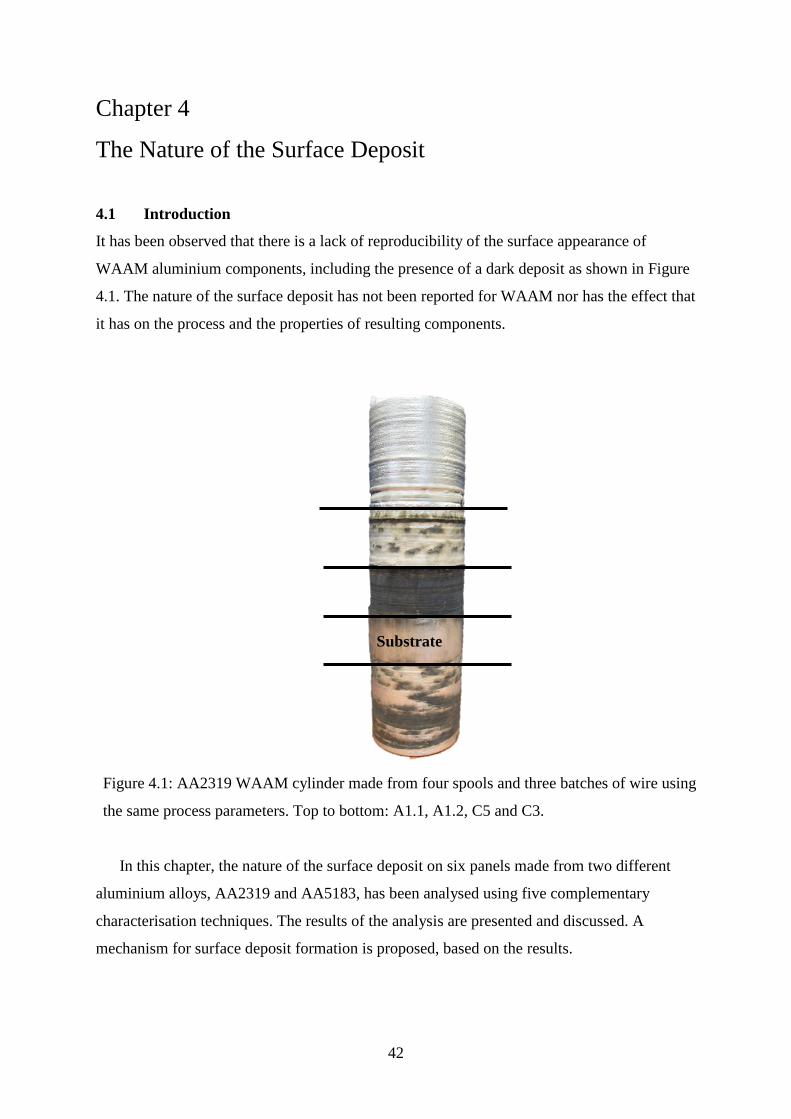
42
Chapter 4
The Nature of the Surface Deposit
4.1 Introduction
It has been observed that there is a lack of reproducibility of the surface appearance of
WAAM aluminium components, including the presence of a dark deposit as shown in Figure
4.1. The nature of the surface deposit has not been reported for WAAM nor has the effect that
it has on the process and the properties of resulting components.
In this chapter, the nature of the surface deposit on six panels made from two different
aluminium alloys, AA2319 and AA5183, has been analysed using five complementary
characterisation techniques. The results of the analysis are presented and discussed. A
mechanism for surface deposit formation is proposed, based on the results.
Figure 4.1: AA2319 WAAM cylinder made from four spools and three batches of wire using
the same process parameters. Top to bottom: A1.1, A1.2, C5 and C3.
Substrate

43
4.2 Experimental Methods
The surface deposits on six panels were analysed. Four panels were manufactured using
AA2319 wire and two panels were manufactured using AA5183 wire. Table 4.1 gives details
of some of the process parameters involved with manufacture of the panels. The geometry of
the panels, process, conditions and other parameters were as described in Section 3.2.
Table 4.1: Details of some process parameters that were used for manufacture of the panels.
Sample
ID
Wire Synergic Line CMT mode WFS
(m min-1)
TS
(mm s-1)
023 AA2319 A1 4043 P 6.0 10
030 AA2319 A2 2319 PADV 6.0 10
020 AA2319 B2 4043 P 6.0 10
018 AA2319 C5 4043 P 6.0 10
005 AA5183 B4 5183 P 6.0 10
028 AA5183 B5 5183 P 6.0 6.5
AA5183 was used for the purpose of comparison with literature which focussed on the
surface deposit formed during welding of 5000 series aluminium, as discussed in §2.6. The
nominal composition of AA5183 is presented in Table 4.2.
Table 4.2: Nominal composition of AA5183 (wt %). The remainder is aluminium.
The coverage and colour of the surface deposit were different for the panels, as seen in
the photographs in Figure 4.2. Values for the coverage and colour of the surface deposit were
determined by three operators using the scales in §3.3.1, and the values are detailed in Table
4.3.
Chemical composition (wt %)
Cr Cu Mg Mn Ti Zn Si Fe
0.05-0.25 ≤ 0.1 4.0-4.9 0.4-1.0 0.05-0.25 ≤ 0.1 ≤ 0.4 ≤ 0.4

44
ID023 ID030
ID020
ID018
ID005 ID028
Figure 4.2: Photographs of the panels studied in this chapter.

45
Table 4.3: Coverage and colour of the surface deposit for four AA2319 and two AA5183
WAAM panels.
ID Coverage Colour
023 3.5 Brown
030 3 Brown
020 3 Black
018 5 Black
005 5 Black
028 5 Dark grey
Five complementary characterisation techniques were used to study the nature of the
surface deposit: SEM, PFIB, XPS, XRD and Raman spectroscopy. Chapter 3 explains the
choice of techniques and describes the instruments used. The composition of the surface
deposit was determined using SEM, XPS, XRD and Raman spectroscopy. The morphology
of the surface deposit was investigated using SEM and PFIB.
Samples were removed from a region 20 mm from the edge of the panels, as shown in the
diagram in Figure 4.3, before T6 heat treatment. The edge was not analysed as the thermal
history was different compared to the rest of the component due to contact with air and thus it
was not representative of the whole panel. Sample 2 from each panel was cold mounted
perpendicular to the surface deposit and polished using standard procedure in accordance
with ASTM E3 - 11 (American Society for Testing and Materials, 2017) to study the
thickness of the surface deposit. Sample 1, 3 and 4 from each panel were not mounted so that
the surface deposit could be analysed as deposited. Sample 5 was discarded as it was
typically a region with no surface deposit. Surface deposit was removed for XRD samples
from one side of ID018 and ID005 using a scalpel to obtain enough powder to cover a 25 mm
× 25 mm holder.
5
4
3
2
1
Figure 4.3: Diagram of the sampling method used.
2 cm 2 cm

46
4.3 Experimental Results
4.3.1 Scanning Electron Microscopy
EDX was performed on five random regions of the surface deposit on AA2319 and AA5183
WAAM panels, plan view using an acceleration voltage of 15 kV for a field of view of
128 µm × 96 µm. Examples of the EDX spectra can be seen in Figure 4.4 and a summary of
the quantification is shown in Table 4.4. The surface deposit on AA2319 panels contained
high concentrations of aluminium and on AA5183 panels contained high concentrations of
magnesium.
Table 4.4: Concentration of the main constituents of the surface deposit on AA2319 and
AA5183 WAAM panels, averaged across five regions. Other constituents include barium,
calcium, chlorine, fluorine, iron, manganese, potassium and silicon.
ID EDX Elemental Concentration (wt %)
Al C Cu Mg O Other
023 78 – 83 1 6 – 13 N/A 7 – 10 1 – 2
030 65 – 82 1 – 8 4 – 9 N/A 5 – 29 1 – 3
020 75 – 80 2 – 4 7 – 10 N/A 6 – 11 1 – 4
018 61 – 70 1 – 3 6 – 12 N/A 14 – 30 1
005 19 – 42 1 – 3 N/A 36 – 43 18 – 38 1 ‒ 4
028 56 – 69 1 – 2 N/A 17 – 24 9 – 17 2 ‒ 7

47
Assessment of the surface deposit using SEM at different magnifications showed
recurrent features: aggregates of nanospheres (diameter ~ 100 nm), microspheres (diameter ~
10 µm) and irregularly shaped microparticles (length ~ 10 µm). Examples of the features can
be seen in Figure 4.5. EDX analyses of the features, in Figure 4.6 and Figure 4.7showed that
the nanospheres contained metal oxide, the microspheres contained metal and metal oxide
and the irregularly shaped particles were carbon-rich. The microspheres were most likely
microspatter: droplets of molten feedstock wire that are produced during welding.
(a)
(b)
Figure 4.4: EDX spectra for (a) ID018 and (b) ID005. * denotes C Kα peak. Some peaks
have been scaled for clarity.
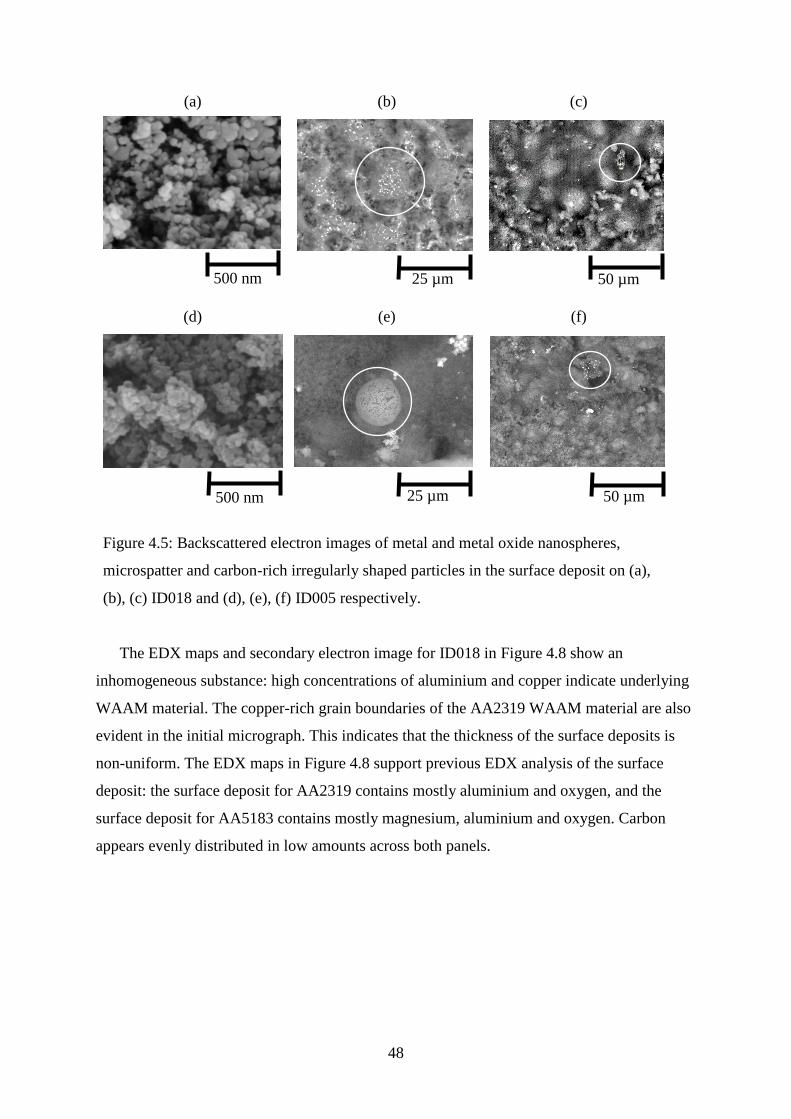
48
The EDX maps and secondary electron image for ID018 in Figure 4.8 show an
inhomogeneous substance: high concentrations of aluminium and copper indicate underlying
WAAM material. The copper-rich grain boundaries of the AA2319 WAAM material are also
evident in the initial micrograph. This indicates that the thickness of the surface deposits is
non-uniform. The EDX maps in Figure 4.8 support previous EDX analysis of the surface
deposit: the surface deposit for AA2319 contains mostly aluminium and oxygen, and the
surface deposit for AA5183 contains mostly magnesium, aluminium and oxygen. Carbon
appears evenly distributed in low amounts across both panels.
(a) (b) (c)
(d)
(e) (f)
Figure 4.5: Backscattered electron images of metal and metal oxide nanospheres,
microspatter and carbon-rich irregularly shaped particles in the surface deposit on (a),
(b), (c) ID018 and (d), (e), (f) ID005 respectively.
25 µm 50 µm
50 µm 25 µm
500 nm
500 nm

49
(a)
(b)
(c)
Figure 4.6: EDX spectra of (a) a region of nanospheres (b) microspatter and (c) a carbon-
rich particle in the surface deposit on AA2319 panels. * denotes C Kα peak, + denotes Fe
Lα peak and # denotes Mg Kα peak. Some peaks have been scaled for clarity.

50
(a)
(b)
(c)
Figure 4.7: EDX spectra of (a) a region of nanospheres (b) microspatter and (c) a carbon-
rich particle in the surface deposit on AA5183 panels. * denotes C Kα peak.

51
Figure 4.8: EDX maps of a region of the surface deposit on (a) ID018, an AA2319 panel and (b) ID005, an AA5183 panel.
a
b
10 µm 10 µm 10 µm 10 µm 10 µm
10 µm 10 µm 10 µm 10 µm 10 µm

52
Figure 4.9 shows backscattered electron images and EDX line scans of cross-sections
from ID018 and ID005. SEM analysis was not successful in determining the thickness of the
surface deposit due to resin infiltration. Local regions of high carbon concentrations can be
observed in the line scan, designated by an ‘x’, indicating the presence of resin. The surface
deposit shown in Figure 4.5 appears porous and micrographs in Figure 4.10 support this.
PFIB milling was used to circumvent the issue of resin infiltration as mounting of samples is
not required for such cross-sections.
(a)
10 µm
X
X
Surface deposit { WAAM component
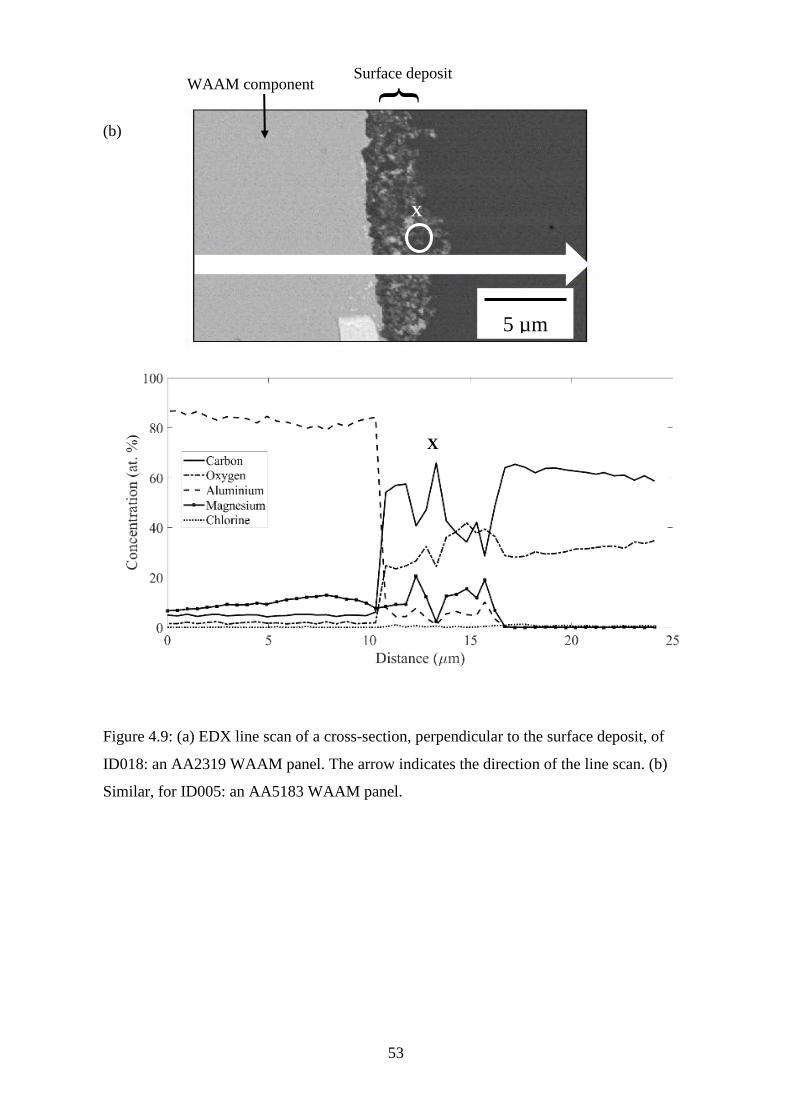
53
(b)
Figure 4.9: (a) EDX line scan of a cross-section, perpendicular to the surface deposit, of
ID018: an AA2319 WAAM panel. The arrow indicates the direction of the line scan. (b)
Similar, for ID005: an AA5183 WAAM panel.
X
5 µm
X
Surface deposit { WAAM component

54
4.3.2 Plasma Focused Ion Beam Milling
Surface deposit thickness was analysed using PFIB milled cross-sections of ID018. A section
was milled through the thickness of the panel from the top surface covered in surface deposit,
parallel to the direction of the layer deposition. SEM images of PFIB milled cross-sections
showed a porous surface layer, approximately 3 – 20 µm as seen in Figure 4.10. Figure 4.10
also shows that the surface deposit separated from the WAAM material during milling,
suggesting that it was weakly adhered to the surface.
Figure 4.10: SEM image of FIB milled sample from ID018 using an acceleration voltage of
10 kV.
4.3.3 X-Ray Photoelectron Spectroscopy
Examples of XPS survey spectra are shown in Figure 4.11. Table 4.5 shows the average
concentration of the main constituents of the surface deposit for five random regions on each
panel, as determined by XPS.
CuAl2 rich
grain
boundaries
Surface
deposit
WAAM
AA2319
material
20 µm

55
(a)
(b)
Figure 4.11: XPS survey spectra for (a) ID018 and (b) ID005. The rectangle, ellipsis and star
designate Al 2s, Al 2p and O 2s respectively.
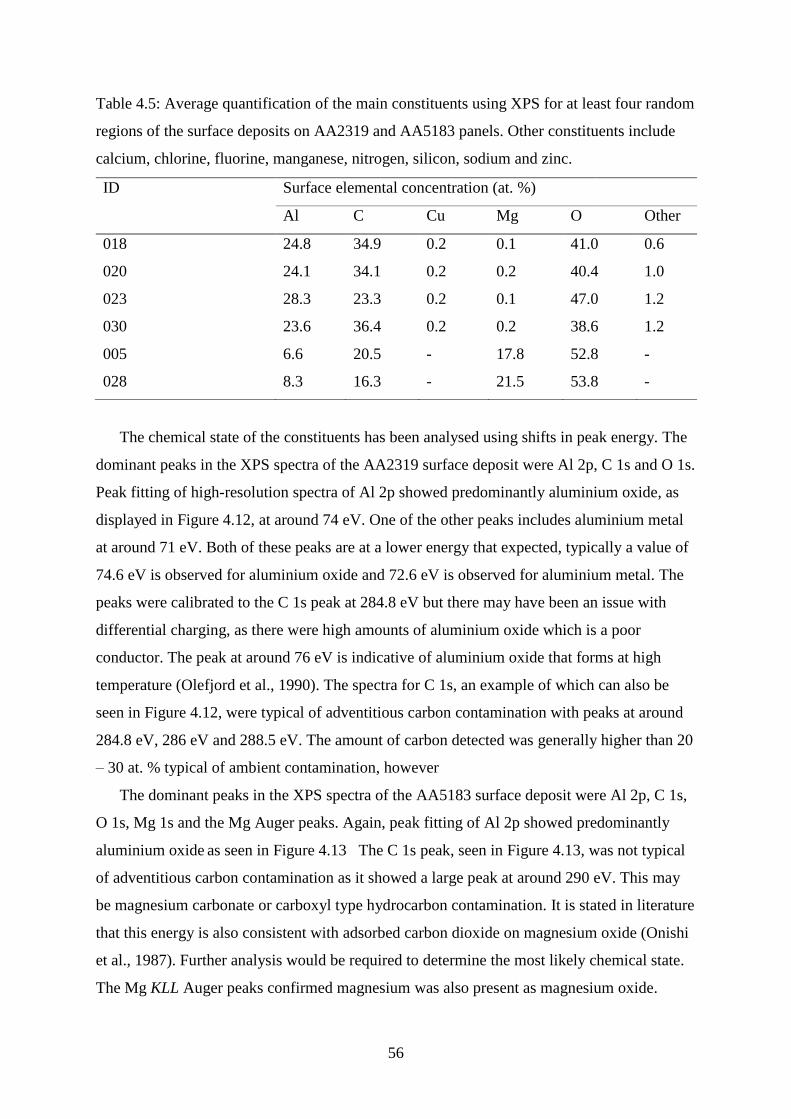
56
Table 4.5: Average quantification of the main constituents using XPS for at least four random
regions of the surface deposits on AA2319 and AA5183 panels. Other constituents include
calcium, chlorine, fluorine, manganese, nitrogen, silicon, sodium and zinc.
The chemical state of the constituents has been analysed using shifts in peak energy. The
dominant peaks in the XPS spectra of the AA2319 surface deposit were Al 2p, C 1s and O 1s.
Peak fitting of high-resolution spectra of Al 2p showed predominantly aluminium oxide, as
displayed in Figure 4.12, at around 74 eV. One of the other peaks includes aluminium metal
at around 71 eV. Both of these peaks are at a lower energy that expected, typically a value of
74.6 eV is observed for aluminium oxide and 72.6 eV is observed for aluminium metal. The
peaks were calibrated to the C 1s peak at 284.8 eV but there may have been an issue with
differential charging, as there were high amounts of aluminium oxide which is a poor
conductor. The peak at around 76 eV is indicative of aluminium oxide that forms at high
temperature (Olefjord et al., 1990). The spectra for C 1s, an example of which can also be
seen in Figure 4.12, were typical of adventitious carbon contamination with peaks at around
284.8 eV, 286 eV and 288.5 eV. The amount of carbon detected was generally higher than 20
‒ 30 at. % typical of ambient contamination, however
The dominant peaks in the XPS spectra of the AA5183 surface deposit were Al 2p, C 1s,
O 1s, Mg 1s and the Mg Auger peaks. Again, peak fitting of Al 2p showed predominantly
aluminium oxide as seen in Figure 4.13 The C 1s peak, seen in Figure 4.13, was not typical
of adventitious carbon contamination as it showed a large peak at around 290 eV. This may
be magnesium carbonate or carboxyl type hydrocarbon contamination. It is stated in literature
that this energy is also consistent with adsorbed carbon dioxide on magnesium oxide (Onishi
et al., 1987). Further analysis would be required to determine the most likely chemical state.
The Mg KLL Auger peaks confirmed magnesium was also present as magnesium oxide.
ID Surface elemental concentration (at. %)
Al C Cu Mg O Other
018 24.8 34.9 0.2 0.1 41.0 0.6
020 24.1 34.1 0.2 0.2 40.4 1.0
023 28.3 23.3 0.2 0.1 47.0 1.2
030 23.6 36.4 0.2 0.2 38.6 1.2
005 6.6 20.5 - 17.8 52.8 -
028 8.3 16.3 - 21.5 53.8 -
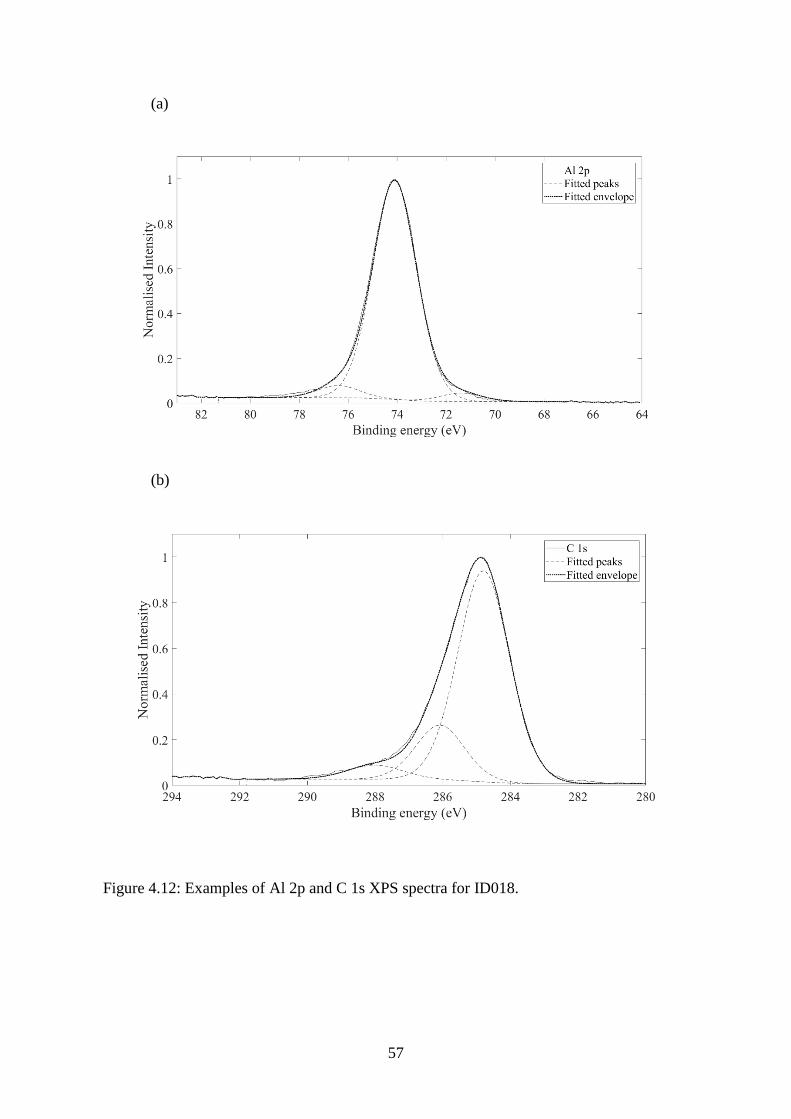
57
(a)
(b)
Figure 4.12: Examples of Al 2p and C 1s XPS spectra for ID018.
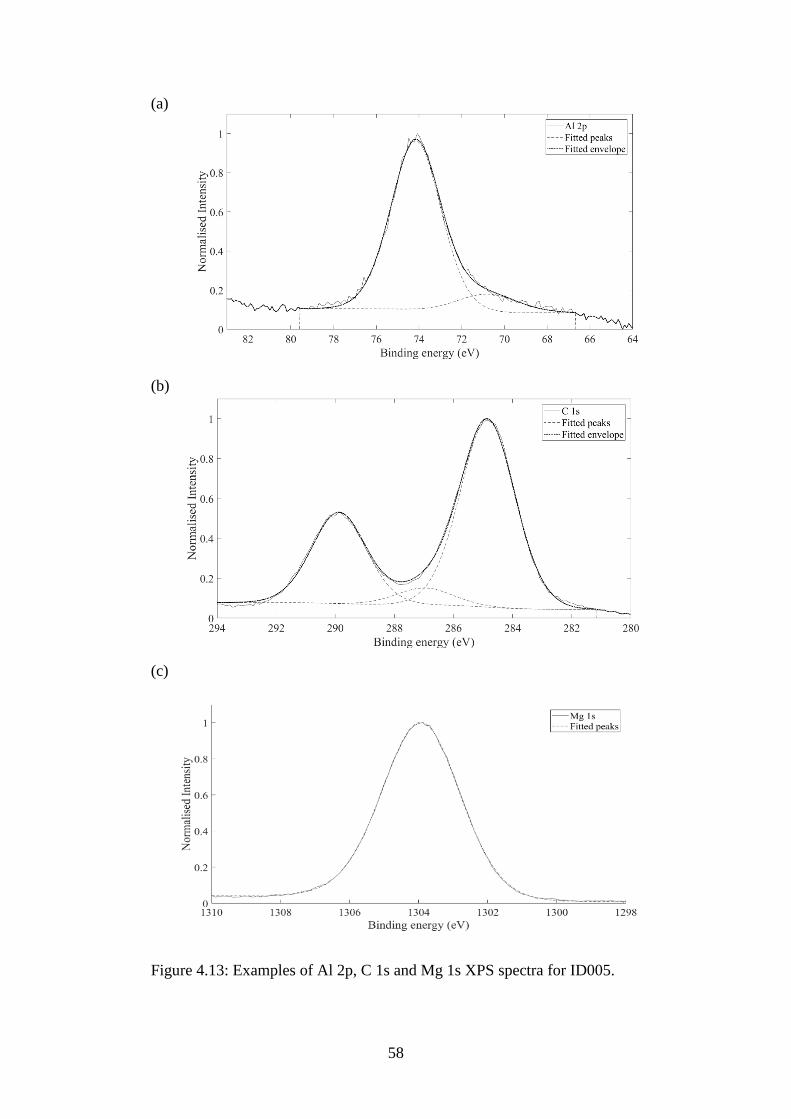
58
(a)
(b)
(c)
Figure 4.13: Examples of Al 2p, C 1s and Mg 1s XPS spectra for ID005.

59
Information about the thickness of the surface deposit was obtained through analysis of
the Al 2p, Mg 2p and Mg 1s peaks. The mean free path can be approximated as Ekinetic0.77
(Wagner et al., 1980). Mg 2p is at much lower binding energy compared to Mg 1s and
therefore a much higher kinetic energy: Ekinetic of Mg 2p is around 1436 eV and of Mg 1s is
around 183 eV. The ratio of the mean free path of Mg 2p to Mg 1s is approximately 4.9
therefore the Mg 1s signal is far more surface specific than Mg 2p. The ratio of Al and Mg 2p
peaks intensity, which have similar cross-sections, was compared with the ratio of Al 2p and
Mg 1s quantification. The ratios for ID005 can be seen in Table 4.6 and were similar,
suggesting the surface deposit was thick and uniform. The ratios were not similar for ID028:
the ratio of 2p peaks was higher than the ratio of Al 2p to Mg 1s. This may mean that less
magnesium was detected from a lower depth, suggesting that the surface deposit on ID028
was less thick and less uniform compared to ID005.
4.3.4 X-Ray Diffraction
Figure 4.14 shows diffractograms obtained from XRD analysis of the surface deposit from
ID018 and ID005. The constituents of surface deposit as identified by XRD and reference to
JCPDS for ID018 were Al, Al2O3 and CuAl2 and for ID005 were Al, Al2O3, MgO and
MgAl2O4. The details of the relevant JCPDS are in Table 4.7.
Table 4.6: Ratio of the concentration of aluminium oxide and magnesium oxide, following
peak fitting of Al 2p and Mg 1s, compared to the ratio of the intensity of the 2p Al and Mg
peaks.
Sample Ratio of Al2O3 to MgO IAl 2p/IMg 2p
ID005, Region 1 0.39 0.37
ID005, Region 2 0.31 0.28
ID005, Region 3 0.24 0.25
ID005, Region 4 0.31 0.33
ID028, Region 1 0.36 0.33
ID028, Region 2 0.30 0.62
ID028, Region 3 0.47 0.65
ID028, Region 4 0.34 0.41

60
Figure 4.14: XRD diffractograms of surface deposit powder from ID018 and ID005.
Table 4.7: Reference Table for JCPDS.
4.3.5 Raman Spectroscopy
The study of carbon speciation was attempted using Raman spectroscopy. An example of the
Raman spectra can be seen in Figure 4.15. Raman spectroscopy was unsuccessful due to high
levels of fluorescence; a known issue for aluminium oxide (Aminzadeh, 1997; Tuschel, 2016).
Constituent JCPDS
Al 01-089-2769
γ-Al2O3 00-047-1770
δ-Al2O3 00-046-1131
CuAl2 01-089-1981
MgAl2O4 01-084-0377
MgO 01-087-0653

61
Figure 4.15: Raman spectra of ID018, using λ = 785 nm.
4.4 Discussion
The results showed that the surface deposit on the AA2319 WAAM panels was
predominantly aluminium, aluminium oxide and carbon, and on the AA5183 WAAM panels
was predominantly magnesium oxide, aluminium, aluminium oxide and carbon. EDX
analysis found that the main constituents of the surface deposit for AA2319 were aluminium,
oxygen and carbon and for AA5183 were aluminium, magnesium, oxygen and carbon. The
same constituents were identified through analysis of the XPS and XRD results which also
provided additional information about the chemical and crystalline states of the constituents.
Analysis of XPS spectra demonstrated that the top 3 - 10 nm of the surface deposit contained
high concentrations of metal oxides: aluminium oxide on AA2319 WAAM panels, and
magnesium and aluminium oxide on AA5183 WAAM panels. The presence of metal oxides
in the surface deposit was supported by the XRD results: peaks corresponding to Al2O3 were
observed in the AA2319 diffractogram, and Al2O3, MgO and MgAl2O4 in the AA5183
diffractogram. High levels of oxygen were detected in the agglomerates of nanospheres
through EDX point analysis, suggesting that the nanospheres were aluminium oxide or
magnesium oxide. EDX, XPS and XRD results also demonstrated the presence of aluminium
metal in the surface deposit. Aluminium metal was often found in the form of nanospheres or
microspatter, as determined by EDX point analysis. Carbon was observed in the surface

62
deposits using EDX and XPS but not XRD: it is likely that carbon is present as hydrocarbon
molecules not crystalline carbon so would not be observed in XRD.
The surface deposit on the aluminium WAAM panels was inhomogeneous; variation in
composition and thickness was observed. EDX results showed varied concentrations of the
main constituents for different regions of the surface deposit. Microspatter and carbon-rich
microparticles were randomly distributed. Comparison of the Mg 1s and Mg 2p XPS peaks
showed differences in magnesium concentration through the thickness of the surface deposit
for ID005, again suggesting inhomogeneity of the composition for the top layers of the
deposit. The thickness of the surface deposit varied too. There were regions of high and low
coverage, as shown in Figure 4.2. SEM results demonstrated similar behaviour, underlying
material was observed in EDX maps. It was not possible to analyse the thickness of the
surface deposits from micrographs of mounted cross-sections due to resin infiltration but
micrographs of PFIB milled cross-sections showed variation in the thickness of the surface
deposit on ID018.
The EDX results show that the colour of the surface deposit did not depend on the
composition of the surface deposit. The evidence suggests that the differences in colour
depended on the amount of surface deposit. For example, ID005 which was black in colour
contained higher concentrations of magnesium and oxygen compared to ID028, which was
grey in colour. This behaviour was not observed for AA2319 panels but analysis may be
limited by the non-uniform coverage of surface deposit observed on ID020, 023 and 030.
The results of the AA2319 surface deposit were not in agreement with the suggestion
from Gu et al. that the surface deposit on aluminium WAAM parts was black ash or carbide
(Gu et al., 2015). The nature of the surface deposit on AA5183 WAAM panels was similar to
those observed on AA5183 welds (Sugiyama et al., 1993; Lee et al., 2015a; Lee et al.,
2015b). Figure 4.16 shows a proposed form of the surface deposit, based on the SEM, XPS
and XRD results. Backscattered electron imaging of the surface deposit showed agglomerates
of nanospheres, microspheres and irregularly-shaped microparticles. EDX analysis of the
surface deposit revealed the nanospheres were metal and metal oxide, the microspheres were
microspatter and the irregularly-shaped microparticles were carbon rich. The use of SEM and
PFIB revealed non-uniform thickness.

63
Figure 4.16: Diagram of the form of the surface deposit on aluminium WAAM components.
The constituents of the surface deposit can originate from the wire itself or from
volatilisation and reactions with atmosphere or contamination in the shielding gas. Many of
the constituents were present in the alloys, as described in §3.2.2. Carbon, calcium, chlorine,
silicon, sodium and other elements detected in small quantities are likely to be derived from
contaminants on the surface of welding wire, from either the wire manufacturing process or
handling. The likely source of fluorine is the PTFE liner in the wire feeder of the welding
equipment. The formation of aluminium or magnesium oxides could occur from a low level
of residual oxygen within the shielding gas as the partial pressure of oxygen, PO2, required to
bring about oxidation of these metals at their melting point is extremely low: PO2 << 10-25
atms. The presence of nitrogen also suggests that the vapour and spatter escaped the shielding
gas, as the gas was not able to completely protect them from the atmosphere.
The results support the theory that the deposit is mostly caused by vapour from the
feedstock wire condensing on cold surfaces, formed when the temperature of the arc is higher
than the temperature of the boiling point of the constituents in the wire alloy (Sugiyama et al.,
1993; Lee et al., 2015; Woods, 1980). The main constituents of the surface deposit were the
alloying elements with the lowest boiling point: for AA2319, this is aluminium, which has a
boiling point of 2750 K and for AA5183, this is magnesium, which has a boiling point of
1376 K (Sugiyama et al., 1993). Microspatter was observed in the surface deposit, in this
work and others (Sugiyama et al., 1993; Lee et al., 2015; Woods, 1980). A diagram of the
proposed formation of surface deposit can be seen in Figure 4.17.
WAAM material
Surface deposit

64
It is not known what causes the variation in coverage of the surface deposit for AA2319
components. There is evidence that formation of the surface deposit depends on temperature
(Woods, 1980; Jyogan et al., 1998; Lee et al., 2015). It is therefore likely that build
parameters, such as WFS and TS, affect the formation of the surface deposit as they control
the arc temperature. It has also been observed that wire batch affects surface deposit in this
work and in that of Gu et al. (Gu et al., 2015). Gu et al. found that wire surface finish affects
arc stability during WAAM of aluminium, which is associated with surface deposit
(a)
(b)
(c) (d)
Figure 4.17: Schematic showing the proposed formation of the surface deposit. (a) Vapour
and microspatter are produced during deposition of feedstock wire. Some is emitted
outside the shielding gas and reacts with atmosphere. (b) Vapour and microspatter
condenses on cold, solidified WAAM material. (c) and (d) a surface deposit is formed of
condensed vapour and microspatter over many layers of deposited wire.

65
formation. Variation in wire surface finish between batches may have resulted in different
amounts of surface deposit. Further experiments are required to understand formation of the
surface deposit including analysis of the effect of different build parameters and wire batch
on surface deposit coverage during WAAM of aluminium alloys.
It appears that the surface deposit does not affect commercial viability of WAAM and is a
purely aesthetic feature. Its presence may indicate a loss of alloying material in the WAAM
material as it is formed from the wire, particularly with AA5183. The EDX results showed
high concentration of magnesium in the surface deposit, around 20 ‒ 40 wt %, which is far
higher than 4.0 ‒ 4.9 wt % in the alloy used for the wire. However, assuming that the surface
deposit is on average 5 µm thick across the entire surface of a component, the surface deposit
is less than 0.1 % of the material used and is unlikely to result in significant loss of alloying
elements.
The surface deposit may be a visual indication that there are issues with the build. The
formation of vapour and microspatter can be caused by unstable arcs (Woods, 1980; Hutt and
Lucas, 1982; Melton, 2011; Wagner et al., 2013). Porosity during welding is also associated
with unstable arcs (Woods, 1974; Harris, 1988; Gingell and Gooch, 1998). An established
correlation between surface deposit and porosity would offer valuable insight into WAAM
products and enable early intervention in quality control or process monitoring based on
visual examination. Initial observations show that surface deposit coverage is affected by
wire batch and literature suggests poor surface finish of wire may influence surface deposit
formation. It may be possible therefore to use surface deposit coverage as a method to
determine if there are issues with the feedstock wire. Further investigation is required
however to determine a relationship between surface deposit formation and wire quality.
4.5 Summary
The surface deposit on AA2319 WAAM components contained predominantly aluminium
and aluminium oxide and on AA5183 WAAM components contained predominantly
magnesium oxide, aluminium and aluminium oxide, as determined using SEM, XPS and
XRD. The surface deposits on both AA2319 and AA5183 WAAM components were similar
in morphology and consisted of aggregates of nanospheres, microspatter and carbon-rich
microparticles. A mechanism for the formation has been proposed based on the results and
literature for surface deposit formation during welding: condensed vapour and microspatter
from the feedstock material.

66
The cause of variation in surface deposit formation is not fully understood. Initial results
appear to show that process parameters and wire batch influence surface deposit coverage. In
order to improve understanding of this, the effect of process parameters and wire batch on
surface deposit formation has been analysed and is covered in Chapter 5.
It is unlikely the presence of the surface deposit affects commercial viability of WAAM
but it may be an indication of variation in feedstock material and high levels of porosity. In
order to determine if visual examination of the surface deposit is a suitable method for quality
control and process monitoring of the WAAM process, the relationship between surface
deposit coverage and porosity has been studied and is also covered in Chapter 5.

67
Chapter 5
Influence of Wire Batch and Process Parameters on Surface
Deposit Coverage and Porosity
5.1 Introduction
Both the surface deposit coverage and porosity of WAAM AA2319 components vary. It has
been suggested that wire batch and process parameters affect surface deposit coverage and
porosity (Ayarkwa et al., 2015; Cong et al., 2015; Gu et al., 2015). A rigorous study of the
effect of wire batch and process parameters on surface deposit coverage and porosity has not
been reported in the open literature, however. In order to address the lack of data, a set of
components was manufactured using different wire batches and different process parameters,
and the resulting surface deposit coverage and porosity were measured.
It has also been suggested the formation of the surface deposit and porosity are linked to
unstable arcs and/or hydrocarbon lubricant (Devletian and Wood, 1983; Harris, 1988; Gingell
and Gooch, 1998; Gu et al., 2015). An established correlation between surface deposit and
porosity would offer valuable insight into WAAM components and enable early interventions
in quality control or process monitoring based on visual examination.
In this chapter, surface deposit coverage scores and porosity measurements are presented
and the influences of wire batch and process parameters on surface deposit coverage and
porosity are discussed. The potential relationship between surface deposit coverage and
porosity is also explored.
5.2 Experimental Methods
Components with simple geometries were manufactured to analyse the influence of wire
batch and process parameters on surface deposit coverage and porosity. Details of the wire
batch and process parameters used to manufacture the components are given in Table 3.5.
Surface deposit coverage and colour were scored by three independent operators according to
the scales in §3.3.
The porosity of the components was measured using an optical microscope, as described
in §3.5.1. All samples for porosity measurements were extracted after the components had
been given a T6 heat treatment. Samples from the panels were removed from a region 40 mm
from the edge at half height. Samples from the box sections were removed from a region 40

68
mm from the corner at half height. Again, samples from the edge of the components were not
analysed as the thermal history was different compared to the rest of the component due to
contact with air and thus are not representative of the whole panel. Samples were mounted
perpendicular to the WAAM layers through the thickness of the components and polished for
metallographic examination. Two different operators each measured the porosity over an area
of 84 mm2, covering approximately 20 layers in height, on two independent polished planes.
A macro was created to automate the measurement process: each image was converted to
binary black and white image, consistent thresholds were set for colour and size, and different
features were measured including area % of porosity and size of pore. 40 measurements were
taken for each sample and the error was calculated as the standard deviation of the mean
across these measurements.
Single factor analysis of variance (Anova) was used to analyse the influence of wire batch
and process parameters on surface deposit coverage and porosity. Single factor Anova is used
to determine if the differences in populations are statistically significant (Turner and Thayer,
2001). This is achieved by testing the null hypothesis that the means of different populations
are equal by calculating the p-value, the probability that the means of a population are equal
for a given significance level. A significance level of 0.05 was used in this study as this is
typical of A and B-basis allowables.
5.3 Experimental Results
5.3.1 Surface Deposit Coverage and Colour
The coverage and colour of the surface deposit were different for the various manufactured
components, as shown in Figure 5.1. One of the key findings from Chapter 4 was that the
composition of AA2319 surface deposit appeared similar for different coverages and colours:
it consisted predominantly of aluminium oxide, aluminium metal nanospheres, microspatter
and carbon-rich microparticles. Error! Reference source not found.Table 5.1 summarises
the surface deposit cover and colour scores.

69
Table 5.1: The surface deposit coverage and colour scores for components. Details of the set of
parameters are found in Table 3.5. Italics denote box sections.
Wire
batch
Sample
ID
Synergic
line
CMT
mode
WFS (m min-1)
TS (mm s-1)
Surface
deposit
coverage
Surface
deposit
colour
A1 032 2319 PADV 6.0 10 1 N/A
A1 001 2319 PADV 3.5 5 1 N/A
A1 026 2319 PADV 3.5 5 2 Brown
A1 023 4043 P 6.0 10 3.5 Brown/black
A1 024 4043 P 4.5 10 3 Brown
A2 030 2319 PADV 6.0 10 3 Brown/black
A2 031 2319 PADV 6.0 10 3 Brown
A3 051 2319 PADV 6.0 10 2 Brown
A3 052 2319 ADV 3.5 5 1 N/A
B1 045 2319 PADV 6.0 10 5 Dark grey
B1 002 2319 PADV 3.5 5 2 Black
B1 077 2319 ADV 3.5 5 1 N/A
B1 004 4043 P 6.0 10 2 Black
B1 003 4043 P 4.5 10 1 N/A
B2 044 2319 PADV 6.0 10 2.5 Black
B2 021 4043 P 4.5 10 3 Black
C1 043 2319 PADV 6.0 10 2 Brown
C1 036 2319 ADV 3.5 5 1 N/A
C2 073 2319 PADV 6.0 10 1 N/A
C2 064 2319 ADV 3.5 5 1 N/A
C3 075 2319 PADV 6.0 10 2.5 Brown
C4 074 2319 PADV 6.0 10 2 Brown
C5 046 2319 PADV 6.0 10 4 Black
C5 050 2319 PADV 6.0 10 5 Dark grey
C5 076 2319 PADV 3.5 5 1 N/A
C5 018 4043 P 6.0 10 4.5 Black
C5 049 4043 P 6.0 10 5 Black
C5 019 4043 P 4.5 10 4 Black
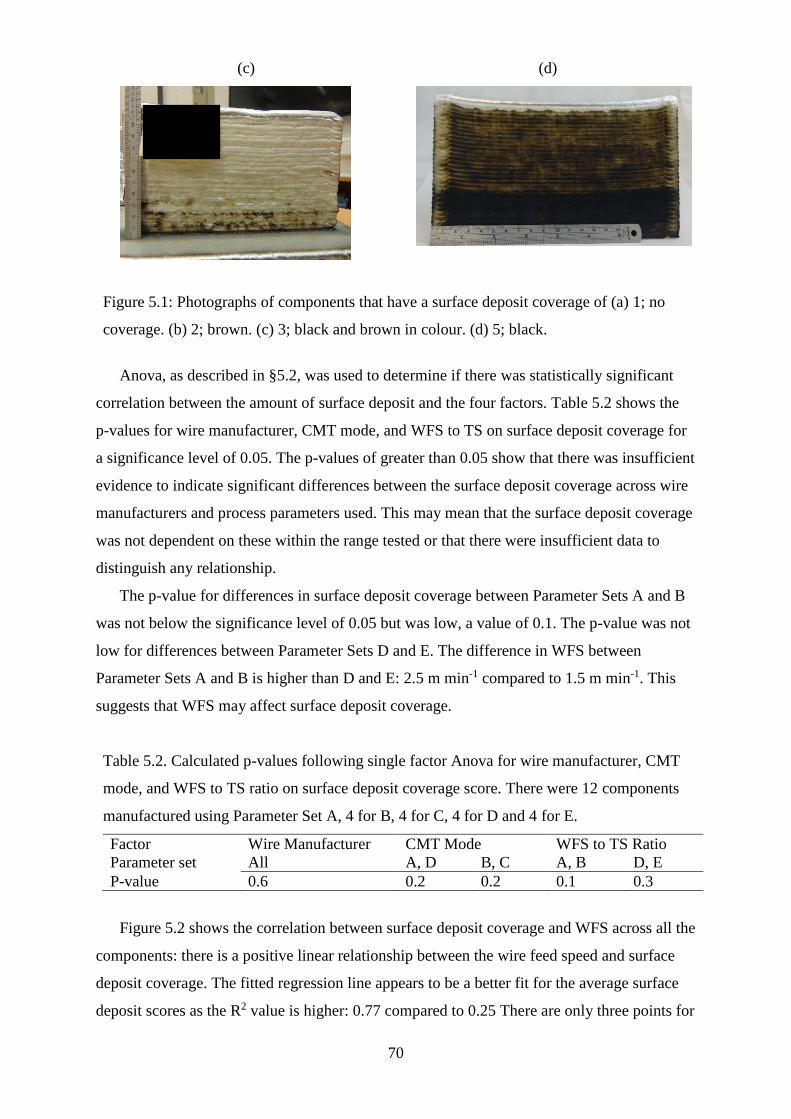
70
Anova, as described in §5.2, was used to determine if there was statistically significant
correlation between the amount of surface deposit and the four factors. Table 5.2 shows the
p-values for wire manufacturer, CMT mode, and WFS to TS on surface deposit coverage for
a significance level of 0.05. The p-values of greater than 0.05 show that there was insufficient
evidence to indicate significant differences between the surface deposit coverage across wire
manufacturers and process parameters used. This may mean that the surface deposit coverage
was not dependent on these within the range tested or that there were insufficient data to
distinguish any relationship.
The p-value for differences in surface deposit coverage between Parameter Sets A and B
was not below the significance level of 0.05 but was low, a value of 0.1. The p-value was not
low for differences between Parameter Sets D and E. The difference in WFS between
Parameter Sets A and B is higher than D and E: 2.5 m min-1 compared to 1.5 m min-1. This
suggests that WFS may affect surface deposit coverage.
Table 5.2. Calculated p-values following single factor Anova for wire manufacturer, CMT
mode, and WFS to TS ratio on surface deposit coverage score. There were 12 components
manufactured using Parameter Set A, 4 for B, 4 for C, 4 for D and 4 for E.
Factor Wire Manufacturer CMT Mode WFS to TS Ratio
Parameter set All A, D B, C A, B D, E
P-value 0.6 0.2 0.2 0.1 0.3
Figure 5.2 shows the correlation between surface deposit coverage and WFS across all the
components: there is a positive linear relationship between the wire feed speed and surface
deposit coverage. The fitted regression line appears to be a better fit for the average surface
deposit scores as the R2 value is higher: 0.77 compared to 0.25 There are only three points for
(c)
(d)
Figure 5.1: Photographs of components that have a surface deposit coverage of (a) 1; no
coverage. (b) 2; brown. (c) 3; black and brown in colour. (d) 5; black.

71
the average surface deposit score for each WFS however which is not sufficient for robust
analysis. The standard deviation of the surface deposit scores for different WFS were also
relatively high, as seen by the error bars in Figure 5.2. There was a large spread of results,
surface deposit coverage ranged from 1 – 5 for a WFS of 6.0 m min-1 and 1 – 4 for a WFS of
4.5 m min-1.
Figure 5.2: Variation of surface deposit coverage with WFS. Error bars indicate standard
deviation.
There did not appear to be any relationships between process parameters and surface
deposit colour. There did appear to be a relationship between wire batch and surface deposit
colour: most of the components manufactured using Manufacturer A wire had a brown
surface deposit and from Manufacturer B wire had a black surface deposit. There was not a
clear pattern for components manufactured with Manufacturer C wire: the surface deposit
was brown, black or grey in colour. There was a pattern for different batches: most of the
components manufactured using C5 wire had a black surface deposit and all the components
manufactured using the other batches had a brown surface deposit.
72
5.3.2 Porosity
A summary of the porosity measurements for all the components can be seen in Table 5.3 and
the results are displayed in Figure 5.3. The porosity measurements of most components
manufactured with the same wire batch and process parameters were in agreement. There was
a difference in porosity measurements of two panels manufactured using C5 wire and
Parameter Set D but the measurements were close to within a standard deviation of each
other. The porosity measurements for the panel manufactured using B1 wire and Parameter
Set C were high as was the standard deviation. This was caused by the presence of some very
large pores, over 1 mm in diameter. It is also of note that porosity measurements of box
sections were in agreement with panels manufactured with the same parameters and wire
manufacturer such as the two components manufactured using C5 wire and Parameter Set A.

73
Table 5.3. The average area % of porosity for the components, taken across 40 fields of
measurement over two independent planes, totalling an area of 84 mm² by two different
operators. The error indicates the standard deviation; this has not been included for some of
the samples as it was larger than the result. Italics denote box sections.
Wire
batch
Sample ID Synergic
line
CMT
mode
WFS (m min-1)
TS (mm s-1)
Area % of
porosity
A1 032 2319 PADV 6.0 10 0.4 ± 0.1
A1 001 2319 PADV 3.5 5 0.3 ± 0.2
A1 026 2319 PADV 3.5 5 0.2
A1 023 4043 P 6.0 10 0.5 ± 0.3
A1 024 4043 P 4.5 10 0.5 ± 0.2
A2 030 2319 PADV 6.0 10 0. 2 ± 0.1
A2 031 2319 PADV 6.0 10 0. 2 ± 0.1
A3 051 2319 PADV 6.0 10 0. 10 ± 0.07
A3 052 2319 ADV 3.5 5 0.02
B1 045 2319 PADV 6.0 10 2.3 ± 0.6
B1 002 2319 PADV 3.5 5 2.9 ± 0.7
B1 077 2319 ADV 3.5 5 6
B1 004 4043 P 6.0 10 2.3 ± 0.6
B1 003 4043 P 4.5 10 2.4 ± 0.5
B2 044 2319 PADV 6.0 10 2.6 ± 0.6
B2 021 4043 P 4.5 10 2.8 ± 0.7
C1 043 2319 PADV 6.0 10 0.3 ± 0.1
C1 036 2319 ADV 3.5 5 0.3
C2 073 2319 PADV 6.0 10 0.3 ± 0.1
C2 064 2319 ADV 3.5 5 0.2 ± 0.1
C3 075 2319 PADV 6.0 10 0.9 ± 0.3
C4 074 2319 PADV 6.0 10 0.6 ± 0.2
C5 046 2319 PADV 6.0 10 1.2 ± 0.4
C5 050 2319 PADV 6.0 10 1.0 ± 0.4
C5 076 2319 PADV 3.5 5 0.9 ± 0.4
C5 018 4043 P 6.0 10 2.2 ± 0.4
C5 049 4043 P 6.0 10 3.4 ± 0.7
C5 019 4043 P 4.5 10 2.0 ± 0.7

74
Figure 5.3: Average area % of porosity across 84 mm² of two independent planes for (a) all
the components, (b) panels manufactured using Parameter Set A and (c) panels manufactured
using wire batches from three different manufacturers using four parameter sets. Error bars
indicate the standard deviation.
(a)
(b)
(c)

75
It is evident that wire batch influences porosity regardless of build parameters used. The
average porosity for Manufacturers A, B and C components was 0.3 ± 0.2 %, 3 ± 1 % (2.5 ±
0.3 % if ID077 is omitted), and 0.6 ± 0.4 % respectively. Some of the components
manufactured using wire from Manufacturer C consistently contained low porosity, around
0.3 %, more similar to Manufacturer A components. These components were manufactured
using C1 and C2 batch wire. These batches were made using a different process to the other
batches from Manufacturer C which involved different dies, cleaning process and spooling
process.
It appears that CMT mode may affect porosity: components manufactured using CMT-
PADV had lower porosity than components manufacturing using CMT-P for Manufacturers
A and C. A similar relationship has not been observed for Manufacturer B wire, however, and
most of the results for components manufactured using wire from the same wire
manufacturer but different CMT modes were within a standard deviation of each other. There
did not appear to be any clear correlation between WFS and porosity, and between TS and
porosity for the parameters used in this work. Anova was used to determine if the differences
in porosity were statistically significant for the four factors. Table 5.4 shows the p-values for
wire manufacturer, CMT mode, WFS to TS ratio, WFS and TS on porosity calculated across
all the components for a significance level of 0.05.
Table 5.4. Calculated p-values following single factor Anova for wire manufacturer, CMT
mode, and WFS to TS ratio on average porosity.
Wire Manufacturer CMT Mode WFS to TS ratio WFS TS
0.00002 0.2 0.6 0.6 0.9
The p-value for wire manufacturer is less than 0.05 and shows that the differences in
porosity between Manufacturers A, B and C components were statistically significant. The p-
values of greater than 0.05 show that there was insufficient evidence to indicate significant
differences between the porosities generated across the ranges of different manufacturing
parameters used. This may mean that the porosity was not dependent on the input parameter
within the range tested or that there were insufficient data to distinguish any relationship. It
was not possible to study the influence of process parameters on porosity independent of the
dominant effect of the wire manufacturer; the results from different wire manufacturers could
not be treated as separate populations due to a limited number of results.

76
Anova was also performed to analyse differences between Manufacturer A components
and components produced using the new Manufacturer C wire. The p-value was very high,
0.88, which shows that there was insufficient evidence to indicate significant differences.
There were a limited number of results for Manufacturer C and they were all very similar in
value, resulting in a low variance and thus a high p-value. The averages of the two
populations were the same however, 0.3 %, and the Manufacturer C values were within range
of the minimum and maximum of the Manufacturer A measurements suggesting that the
populations can be treated as one. The testing of more batches and parts could be expected to
show that they can be treated as one population.
Figure 5.4 shows examples of micrographs from panels manufactured using the same
build parameters but different wire batches. Spherical pores are typical of hydrogen gas
entrapment; irregularly-shaped pores found at grain boundaries are associated with shrinkage
during solidification. Both can be observed in Figure 5.4 but it is clear that the formation of
pores due to gas porosity was far greater contributor to total area of porosity than shrinkage
porosity. Significant differences in pore size between the different batches can be observed.
A B C
Figure 5.4: Optical micrographs for three panels manufactured using the same build parameters,
Parameter Set A, with wire from different manufacturers: A, B and C.
The size distributions of the pores in the panels shown in Figure 5.4 are displayed in
Figure 5.5. Spherical pores of 20 µm2 to over 10,000 µm2, fine pores that were less than
20 µm2 and irregularly shaped pores with a range of sizes were observed in the components in
different quantities. Components manufactured with Manufacturer A wire contained mostly
fine pores, and very few pores over 1,000 µm2, less than 1 % of the total number of pores.
The size distribution of porosity in components manufactured with Manufacturers B and C
500 µm 500 µm 500 µm

77
wire was similar: they contained a mixture of pore sizes including less than 20 µm2 in size to
pores over 10,000 µm2 in size. Pore size is sometimes described using diameter (Cong et al.,
2015; Cong et al., 2017). Assuming perfect spheres, a pore size of 10 µm2 corresponds to a
diameter of around 3.6 µm, 100 µm2 corresponds to a diameter of around 11.2 µm, 1,000 µm2
corresponds to a diameter of around 36 µm and 10,000 µm2 corresponds to a diameter of
around 112 µm.
Figure 5.5: Cumulative frequency graph of the pore size distribution for 84 mm2 across two
independent planes for three panels manufactured using the same build parameters, Set D,
with wire from different manufacturers.
Figure 5.6 shows the size distribution of pores in panels from the different wire
manufacturers for Parameter Set A, B, D and E. There did not appear to be a clear
relationship between different WFS and TS, and size distribution. The size distribution was
similar for panels manufactured using Manufacturer A wire for all parameter sets. There
were clear differences in size distribution between different parameter sets for panels
manufactured using Manufacturers B and C wire: panels manufactured using CMT-PADV
contained more large pores than panels made using CMT-P. Around 50 % of the pores were
over 200 µm2 in size for panels manufactured using CMT-PADV compared to 20 % for CMT
P. Also, under 20 % of the pores were under 20 µm2 for CMT-PADV compared to 50 % of
the pores for CMT-P. This may account for the lower amount of porosity observed in panels
manufactured using CMT-PADV compared to CMT-P for Manufacturer C. A similar
relationship was not observed for Manufacturers A or B, however.

78
Figure 5.6: Cumulative frequency graphs of the pore size distribution for 84 mm2 across
two independent planes for panels manufactured using different sets of process parameters
from the same wire batch from Manufacturers A, B and C.
B
A
C

79
Differences in porosity were observed in panels manufactured using the same process
parameters with wire from different Manufacturer C batches: 0.3 % for C1, 0.2 % for C2,
0.9 % for C3, 0.6 % for C4 and 1.8 % for C5. Figure 5.7 shows the size distribution of pores
in panels manufactured using Parameter Set A using four different batches from
Manufacturer C. The size distribution pattern appears to be relatively similar for all batches
although porosity in panels manufactured using C1 and C2 contained a higher % of smaller
pores than the other batches, less than 100 µm2 in size. Panels manufactured using C1, C2
and C4 all contained a lower % of large pores, over 1000 µm2 in size, compared to the other
batches. This may account for the lower amount of porosity observed in these panels.
Figure 5.7: Cumulative frequency graph of the pore size distribution for 84 mm2 across two
independent planes for five panels manufactured using the same build parameters, Set A,
with different wire batches from Manufacturer C.

80
5.3.3 Relationship between Surface Deposit Coverage and Porosity
Figure 5.8 illustrates the variation of porosity with surface deposit coverage.
The calculations from least squares fitting of porosity against surface deposit coverage for
the different wire manufacturers are shown in Table 5.5.
Table 5.5. Least squares fitting of porosity against surface deposit coverage
Wire Manufacturer Gradient Y intercept R2
Manufacturer A 0.02 0.2 0.07
Manufacturer B -0.05 4 0.2
Manufacturer C 0.4 -0.006 0.5
Least squares fitting showed no statistically significant correlation for Manufacturers A
and B. There did appear to be a correlation between porosity and surface deposit coverage for
Manufacturer C although the R2 value suggests that this trend line only accounts for 50 % of
the variation. Also, this correlation was not consistent for all three wire manufacturers
therefore it can be assumed there was not a universal relationship. This apparent correlation
may have been caused by using different batches: significantly lower levels of porosity were
observed with certain batches of Manufacturer C compared to others, i.e. C1 and C2
compared to C5, which could have created bias when fitting a trend line. There were not
sufficient data to perform single factor Anova to determine if there were statistically
Figure 5.8: Variation of porosity with surface deposit coverage of the components for each
wire manufacturer. Best fit lines have been included.

81
significant differences in porosity between different surface deposit coverage scores for
different wire batches.
5.4 Discussion
5.4.1 Surface Deposit Coverage
Evidence has been found in this work to support a correlation between surface deposit
coverage and WFS: the higher the WFS, the higher the surface deposit coverage. This aligns
with the suggestion in Chapter 4 that the surface deposit is condensed feedstock wire vapour
and microspatter as WFS influences temperature of the weld droplet: a higher WFS results in
a higher current which results in a higher temperature of the weld droplet (Mamat et al.,
2018). The extent of vaporisation depends on the temperature of the weld droplet and is more
likely at higher temperature (Woods, 1980). It is possible to study the influence of droplet
temperature on surface deposit formation through measuring the intensity of infrared
radiation using a high-speed camera and a spectrograph, known as optical pyrometry
(Yamazaki et al., 2010; Mamat et al., 2017), or measuring the heat content of the droplet
using a calorimeter (Soderstrom et al., 2011). This was not achieved during this work as
suitable equipment was not available but it should be the focus of future research to further
understand surface deposit formation.
There appeared to be a relationship between wire batch and surface deposit colour. The
use of Manufacturer B wire resulted in black surface deposit, Manufacturer A wire resulted in
brown surface deposit. It has been suggested that the dark colour of surface deposits on welds
is due to nanoparticles acting as a light trap (Armao, 2003). This is supported by the findings
in Chapter 4 as the surface deposit on WAAM AA2319 components was predominantly
aluminium oxide and aluminium nanoparticles, the former typically white in colour, but the
surface deposit appeared black, brown or dark grey. Differences in particle size could affect
the optical behaviour of the deposit, resulting in different colours. Larger particles may
reflect more light which would appear lighter in colour compared to small particles. Particle
size could be affected by vapour production, how violent the metal transfer was and cooling
rate. The amount of microspatter and carbon-rich irregularly shaped microparticles may
affect the colour. The thickness of the surface deposit might also influence the appearance: a
thicker surface deposit may trap more light. Differences in morphology between surface
deposits of different colours was not fully investigated as it was difficult to obtain
micrographs at high magnifications of the nanoparticles, the distribution of microspatter and
carbon-rich particles was inhomogeneous and the thickness on all components was non-

82
uniform. It was not possible to ensure that samples were representative. Studying sufficient
areas to ensure statistical reliability would have been resource and labour intensive and in
addition measuring the thickness is very difficult.
There are features of the wire that could have affected the thickness of surface deposit,
the size of particles and the distribution of microspatter and carbon-rich particles. A smaller
diameter wire would have resulted in a smaller weld droplet and a higher surface
temperature, possibly resulting in more wire vapour and more violent metal transfer thus
producing more surface deposit with finer particles. Surface finish of the wire could also
affect arc stability and metal transfer, as previously discussed in §2.4. Higher levels of
hydrocarbon contamination on the surface of the wire would be expected to increase the
formation of carbon-rich microparticles. Composition of the bulk feedstock wire could affect
metal transfer behaviour, as previously observed (Woods, 1974), because the presence of
volatile elements would result in a higher level of explosive metal transfer, thus more surface
deposit. Further investigation of the relationship between surface deposit colour and wire
batch has not been identified as critical work. The relationship between surface deposit colour
and wire batch has not been statistically established. It was not possible to quantify the
relationship, the scale for surface deposit colour is subjective and wire from manufacturers do
not consistently result in components with a surface deposit of a certain colour. Also, there is
no evidence of, and little basis for, differences in the colour of the surface deposit affecting
the WAAM process or the resulting properties of components.
5.4.2 Porosity
It is evident from the results that wire batch was the primary influence on porosity for
AA2319 WAAM components. There were significant differences in porosity and pore size
distribution in components manufactured with wire from different manufacturers. The
average area fraction of porosity was an order of magnitude different between Manufacturers
A and B: 0.3 % and 3.0 % respectively. Differences in porosity were also observed in
components manufactured using the same process parameters with wire from different
batches from Manufacturer C: ranging from 0.2 % for C2 to 1.8 % for C5. The influence of
wire batch on porosity appears to have dominated over the influence of WFS, TS and CMT
mode that were observed to have been more significant in other work (Cong et al., 2015;
Ayarkwa et al., 2015; Cong et al., 2017). The details of wire batch used were not included in
these studies however, and the reported relationships may have been caused by batch-to-
batch wire variation, not process parameters.

83
There were notable differences in pore size distribution between different manufacturers
too. Manufacturer A components contained mostly small pores, under 20 µm2 in size, and
very few large pores, over 1000 µm2 in size, unlike Manufacturers B and C components. Pore
size distribution of Manufacturer C components with low porosity, around 0.3 %, was similar
to Manufacturer A components: dominated by small pores and very few large pores. Pore
size distribution in components manufactured using Manufacturers B and C wire appeared to
be influenced by the CMT mode. Large pores were more common for components
manufactured using CMT-PADV compared to CMT-P. This is not in agreement with
previous findings that samples manufactured using CMT-PADV contained no large pores
over 50 µm in diameter but using CMT-P did (Cong et al., 2015). Assuming spherical pores,
50 µm diameter corresponds to around 2000 µm2. Other process parameters, such as WFS
and TS, in the work of Cong et al. were similar to the work described in this chapter but
details of wire batches used were not included. Therefore, the differences in pore size may
have been caused by the use of different wire batches and not different CMT modes. This has
been previously suggested in a study where large pores, over 50 µm in diameter, were
observed in components manufactured using CMT-PADV (Ayarkwa et al., 2015).
There were some irregularly shaped pores along grain boundaries, associated with
shrinkage porosity but most of the pores in all the components appeared to be spherical in
shape, typical of gas porosity. Thus, hydrogen entrapment appears to be the primary
mechanism for porosity formation in the components. A lower amount of porosity and
smaller pores in components manufactured using Manufacturer A batches and Manufacturer
C batches C1 and C2 compared to Manufacturer B batches and other batches from
Manufacturer C suggest that there were lower amounts of hydrogen in the weld pool.
There are various features of the wire that could influence hydrogen to the weld pool and
subsequent porosity formation. These include surface finish, geometry and composition, as
discussed in §2.4. These may vary from manufacturer to manufacturer and batch to batch,
resulting in the variation in porosity that has been observed between components that were
manufactured with wire from different manufacturers and batches.
Surface finish can affect porosity formation because notches and scratches may be sites of
contamination and surface roughness can cause feeding issues, both of which can influence
arc stability and conductivity in addition to contamination being a source of hydrogen. It is
likely that different manufacturers used different drawing processes. During a meeting, a
representative from Manufacturer C reported improvements in Manufacturer C wire
following the use of diamond dies which produce a smoother surface compared to typically

84
used carbide dies. Diamond is more wear resistant and a higher degree of polish can be
obtained compared to other types of dies, resulting in wire with a smoother surface finish
(Padowicz, 1942; Peters et al., 1947; Davis, 1995). The surface finish of different wire
batches has been qualitatively examined to analyse its influence on porosity: this is discussed
in Chapter 6.
Wire diameter, cast and helix can affect arc stability which may influence porosity. It has
been observed that wire diameter was the dominant factor affecting arc stability (Modenesi
and de Avlar, 1999). Wire diameter could vary between wire manufacturers and, for
Manufacturer C, between batches due to the use of different dies. Details of the wire drawing
process of Manufacturers A and B are not known but Manufacturer C wire that was
manufactured using diamond dies resulted in less porosity than Manufacturer C wire that was
manufactured using conventional dies. Diamond dies are often used as more uniform
diameter can be achieved (Peters et al., 1947).
Composition can affect the formation of porosity because alloying elements can affect
solidification behaviour and hydrogen solubility (Woods, 1974), precipitates can act as pore
nucleation sites (Toda et al., 2009) and shrinkage porosity arises from the eutectic phase. It is
possible that different wire manufacturers use different suppliers of the raw material which
may vary in composition. It has been previously observed, however, that the allowed range in
alloy specifications does not change behaviour significantly (Masubuchi, 1972). C1 and C2
were drawn from the same ingot of material as other Manufacturer C batches but resulted in
components with lower amounts of porosity. Variation of the microstructure and localised
composition in ingots is possible (Stefanescu, 2002): composition of wire samples from
different regions of each batch has been investigated using ICP-OES and XPS and is
discussed in Chapter 6. It may also be of use to analyse distribution of precipitates to
determine any significant differences that may influence solidification behaviour and porosity
formation. The microstructure of the wire was not studied in this work as a review of
literature determined other features of the wire more critical but this should be the focus of
further investigation of batch-to-batch variation of wire.
As discussed in §2.4, it is commonly recognised that a principal source of hydrogen is the
wire (Devletian and Wood, 1983; Harris, 1988; Gingell and Gooch, 1998; Cong et al., 2015;
Bai et al., 2017). It is possible that hydrogen was contained as part of a compound in the bulk
of the wire or present on the surface of the wire, either in lubricant or a hydrated oxide layer.
There is evidence to support the suggestion that the primary source of the hydrogen was the
surface of the wire. Components manufactured using C2 and C1 wire resulted in lower
85
amounts of porosity than using other batches from the same manufacturer. These batches
were produced from the same ingot of material using different dies and an improved cleaning
process during manufacture. It is therefore possible that C1 and C2 had lower amounts of
contamination on the surface and thus lower amounts of hydrogen. The porosity
measurements from components manufactured using low lubricant wire, B1, are not in
agreement with this suggestion. These components did not contain lower amounts of porosity
compared to standard lubricant wire from the same manufacturer and other manufacturers.
The claim that B1 is low lubricant is investigated independently of the manufacturer in
Chapter 6. Also, the lubricant applied after drawing to ensure good feedability through
welding equipment is not the only lubricant applied to the wire. Lubricant is also applied to
the wire before drawing to ensure it can be drawn effectively and then cleaned off (Makhnev
et al., 2010). It is possible that although B1 may have low amounts of lubricant for
feedability, it may still have drawing lubricant on the surface that was not removed
effectively. Analysis of the source of hydrogen is included in Chapter 6, through
characterisation of the bulk and surface composition of the wire.
It was observed that wire batch and CMT mode affected the size of pores. Components
manufactured using Manufacturer A wire and C1 and C2 from Manufacturer C contained
fewer large pores than from Manufacturer B wire and other Manufacturer C batches. When
using wire from Manufacturers B and C, components manufactured using CMT-PADV
contained far more large pores, over 200 µm2 in size, than components manufactured using
CMT-P. CMT-PADV has previously been observed to reduce the size of pores (Cong et al.,
2015; Cong et al., 2016). It is possible that these studies used other batches of wire, such as
Manufacturer A, where this relationship was not observed, but the wire batch used was not
reported.
Pore growth is caused by hydrogen diffusion and pore coalescence (Gingell and Gooch,
1997) which are affected by weld pool stirring and weld pool convection (Shtrikman et al.,
2011). Weld pool stirring is caused by the electromagnetic force due to the interaction of the
welding current and a magnetic field, resulting in rotation of the liquid metal in the weld pool
(Villafuerte and Kerr, 1990). Weld pool convection is also influenced by electromagnetic
force in addition to buoyancy and surface tension (Kou and Wang, 1986). Both buoyancy and
surface tension are affected by the temperature gradient.
It is possible that features of the wire could affect weld pool convection. Contamination
on the surface of the wire can inhibit conductivity (Zinke and Shröder, 2004) and thus
influence the weld current and electromagnetic force. Differences in bulk composition may

86
also affect conductivity of wire (Mujahid et al., 1979). Surface finish influences feedability
(Gu et al., 2015) and poor feeding could result in fluctuations in current and metal transfer to
the weld pool, affecting weld pool convection. Diameter of the wire would affect
electromagnetic, buoyancy and surface tension forces due to the volume of material being
deposited. The volume of deposited material may also affect pore growth as the distance
hydrogen has to travel to escape and the time it takes for the weld bead to solidify are
affected.
Different CMT modes affect electromagnetic effects, buoyancy and surface tension
forces, as the current supplied to the arc and heat input are different depending on the modes
(Cong et al., 2015). It has been observed that CMT-PADV causes higher levels of weld pool
convection and it is therefore likely to cause more pore coalescence, resulting in larger pores
(Cong et al., 2015; Wang and Xue, 2017). It may also facilitate hydrogen bubble escape
although this was not observed in this work, as total porosity was similar for other CMT
modes. It may be of use to further investigate the effect of CMT mode on weld pool
convection and pore growth in order to better understand porosity formation so that process
parameters can be optimised to eliminate or reduce porosity to an acceptable level. This is
beyond the scope of this research project however which is focused on batch-to-batch
variation of wire. Batch-to-batch variation was shown to be the dominant factor on porosity
in WAAM AA2319 components, and therefore the most significant obstacle to the
commercial production of WAAM aluminum components.
5.4.3 Relationship between Surface Deposit Coverage and Porosity
There did not appear to be a correlation between surface deposit coverage and porosity. This
relationship was analysed because of suggestions in literature that hydrocarbon lubricant on
the surface of the wire and unstable arcs were sources of both surface deposit and porosity
formation. The results are not consistent with the proposal that lubricant on the surface of the
wire is a cause of surface deposit formation: components manufactured using low lubricant
wire did not score consistently low for surface deposit coverage.
The results do not support the suggestion that hydrocarbon lubricant is the primary source
of porosity: components manufactured with low lubricant wire had high porosity, between
2 % and 6 %. These measurements were comparable to components manufactured with
standard lubricant wire from the same manufacturer. Again, claims that B1 had lower
lubricant on the surface is analysed independently of the wire manufacturer in Chapter 6.
Also, different wire manufacturers may use different lubricant so it is possible that

87
Manufacturer A use silicone-based lubricant, for example, rather than a hydrocarbon-based
lubricant. Hydrogen can also be found in the oxide layer on the surface of the wire or within
the bulk of the wire (Gingell and Gooch, 1998). A rough surface finish would lead to an
increase in the amount of aluminium oxide per length of wire due to the greater surface per
unit area length. Also, hydration of the oxide layer may depend on storage conditions of the
wire which could vary batch-to-batch. Characterisation of the wire to determine the most
likely source of the hydrogen is explored in Chapter 6.
It has not been possible to establish a relationship between arc stability and surface
deposit formation or porosity formation. In addition to wire characterisation, the WAAM
process should be monitored to determine likely mechanisms for surface deposit and porosity
formation. The monitoring process should include a high-speed camera for capturing metal
transfer behaviour and measuring the current and voltage to determine the effect of metal
transfer and arc stability on surface deposit and porosity formation. Equipment was not
available during this project to achieve this but should be considered for the future.
Arc wander was observed with wire that resulted in components that contained low
porosity, and vice versa. This relationship between arc wander and low porosity was
unexpected because, as discussed in §2.7, arc wander and porosity formation have been
associated in other work (Reis et al., 2011). There are different features of wire which could
influence electron emission and cathodic spot formation, such as contamination or wire
diameter. It would be expected that contamination would have an adverse effect on porosity
and arc wander, however. Characterisation of the wire has been undertaken to further
understand this relationship. There was no apparent relationship between arc wander and
surface deposit formation. The surface deposit is formed by condensation of wire vapour,
often produced during violent metal transfer (Woods, 1980) which could disrupt the shielding
gas and create air draughts which causes arc wander. This suggests that the cause of arc
wander observed during WAAM was not air draughts.

88
5.5 Summary
The key findings from the work described in this chapter are:
WFS affects surface deposit coverage: the higher the WFS, the higher the surface
deposit coverage. This may be related to temperature of the arc. The results support
the suggestion that the surface deposit is condensed wire vapour.
Wire batch affects porosity. Porosity ranged from 0.02 % to 6 % depending on wire
batch used. Chapter 6 explores characterisation of the wire, in order to understand
which features of the wire are critical to porosity formation.
Process parameters, within the range tested, do not affect porosity. The influence of
process parameters could not be tested independently of the dominant effect of wire
due to limited number of results.
There is no relationship between surface deposit coverage and porosity. This was
unexpected as they are both associated with unstable arcs and hydrocarbon lubricant.
There did appear to be a relationship between wire batch, arc wander and porosity.
Some wire batches were associated with arc wander and low porosity and vice versa.
This relationship was unexpected, as arc wander and porosity are typically associated,
and is investigated further in Chapter 6, through characterisation of the wire.

89
Chapter 6
Characterisation of Batch-to-Batch Variation of Aluminium
Alloy Wire
6.1 Introduction
The work presented in Chapter 5 showed that porosity significantly varied with wire batch
used for WAAM AA2319 components. Components manufactured using wire from
Manufacturer B contained the highest amounts of porosity. Components manufactured using
wire from Manufacturer A and two batches from Manufacturer C, C2 and C1, contained the
least amount of porosity. The results from Chapter 5 also provided evidence for a relationship
between wire batch and arc wander.
It has been observed that surface finish, geometry, bulk composition and surface
composition of the wire can affect WAAM and welding and properties of the resulting
components, as discussed in §2.4. In this chapter, all of the wire batches used to manufacture
components have been characterised to determine which feature of the wire is the source of
batch-to-batch variation and has the most significant effect on porosity and arc wander. The
surface finish, geometry, bulk composition and surface composition of wire from every batch
were analysed and the results are presented and discussed in this chapter, in the context of
their effect on porosity of aluminium WAAM components, and arc wander during aluminium
WAAM.
6.2 Experimental Methods
The surface finish was examined using optical microscopy and SEM using the microscopes
specified in §3.5. Samples of wire from different regions of a spool from each batch were
analysed. Cross-sections of the wire were also examined, to determine the depth of notches
and other defects at the surface. Thirty 20 – 30 mm sections of wire were mounted in resin
and polished for longitudinal metallographic examination.
The diameter of wire in each batch was measured using a micrometer. Measurements
were made at thirty different locations on a 1 m length sample of wire 20 mm apart, 100 mm
from the end of sample. The diameter at each location was measured in two perpendicular
orientations.

90
The bulk composition was analysed by an external test house using ICP-OES. 25 g of
wire was tested for each batch: 5 g samples were taken from five random regions of each
batch. The surface composition was investigated using XPS, as described in §3.5.3. Four 20
mm length wire samples were taken from different sections of each wire batch and at least
four regions were analysed in total.
6.3 Experimental Results
6.3.1 Surface Finish
Figure 6.1 shows examples of the typical surface finish of each batch using optical
microscopy. Figure 6.2 shows SEM micrographs of the typical surface finish at a higher
magnification. Two of the batches from Manufacturer A, A1 and A2, had a smooth surface
with scratches in the longitudinal direction, as expected from the wire drawing process, but
very few in the transverse direction. Notches and crevices were infrequently observed and did
not appear deep. A3, however, had a poor surface finish: there were scratches in the
transverse directions and cracks around copper-rich intermetallic particles, as identified using
EDX. A layer of black residue was identified on the surface of A3 wire and streaks of black
residue were observed on the surface of A1 and A2 wire.
Manufacturer B wire had poor surface finish. There was cracking visible along the entire
wire surface of the length taken from each batch. Also, deep notches and crevices were
frequently observed. Similar to A3, B1 had cracks around copper-rich intermetallic particles.
A significant distribution of pits was seen on the surface of B2. There was severe cracking
along the length of wire for 12 different spools of B3 and the surface finish appeared worse
than the other Manufacturer B wire batches. Black residue was present on the surface of B2
and B3 but not B1.
Manufacturer C wire also consistently had a poor surface finish. Defects were observed in
the longitudinal and transverse direction. Pits and notches were observed frequently on the
surface of C3, C4 and C5 wire. The SEM micrographs in Figure 6.2 appear to show a rougher
surface for these batches compared to C1 and C2, with larger, deeper, more frequent crevices
and cracking. There was black residue on the surface of all Manufacturer C wire batches.

91
A1 A2 A3
B1 B2 B3
C1 C2
C3
C4 C5
Figure 6.1: Images of the surface finish of each wire batch, using optical microscopy.
200 µm 200 µm 200 µm
200 µm 200 µm 200 µm
200 µm 200 µm 200 µm
200 µm 200 µm
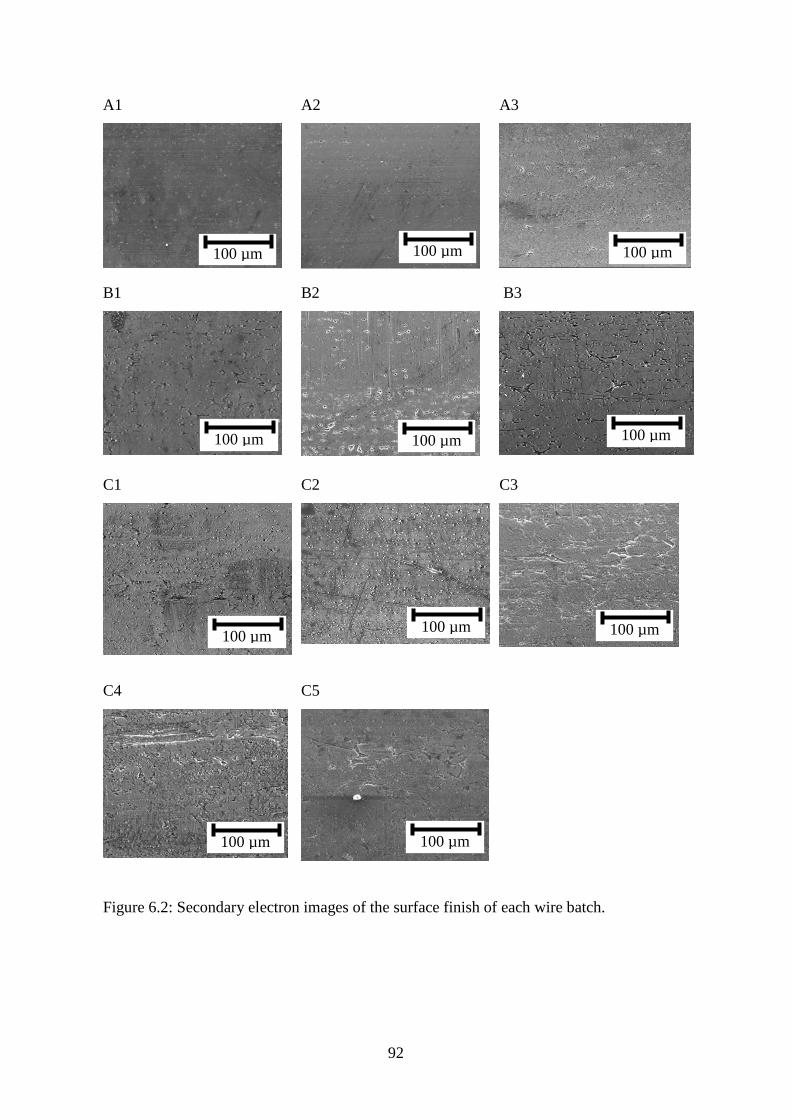
92
A1
A2
A3
B1
B2
B3
C1
C2
C3
C4
C5
Figure 6.2: Secondary electron images of the surface finish of each wire batch.
100 µm 100 µm 100 µm
100 µm 100 µm
100 µm 100 µm
100 µm 100 µm
100 µm
100 µm

93
Cross-sections of each wire batch were examined using optical microscopy and SEM.
Examples of the cross-sections can be seen in Figure 6.3.
A1 A2
A3
B1
B2
B3
\C1 C2
C3
C4
C5
Figure 6.3: Images of the cross-section of each wire batch, using optical microscopy.
500 µm 500 µm 500 µm
500 µm 500 µm 500 µm
500 µm 500 µm 500 µm
500 µm 500 µm

94
Some samples contained large voids at the centre. These are typical of chevron cracking,
an internal defect formed along the centre axis of the wire during the wire drawing process
(Aravas, 1986; Komori, 1999; Choi et al., 2010). Chevron cracking is caused by internal
stresses in the wire, as there are higher amounts of plastic deformation and material
displacement at the edge of the wire than at the centre. Chevron cracking occurs in the ‘rigid
zone’ at the centre, where no plastic deformation has occurred (NIR Board of Consultants &
Engineers, 2011). The presence of these voids depended on sampling: for C3 and C4 they
were only observed after re-polishing but were much smaller than those observed for
Manufacturer B wire thus making them more difficult to detect. At least 30 sections of wire
were mounted from different regions of spools from each batch to ensure representative
samples. Figure 6.4 shows cross-sections of B3 from a different spool of wire to Figure 6.3
and voids can be observed, suggesting that the presence of voids depending on the spool
analysed.
The presence of voids in the wire was investigated further using X-ray-computed
tomography (XRCT) on 15 mm samples from four batches of wire used in this work: A1, B2,
B3 and C5. Figure 6.5 shows the XRCT results for B2. The results were not in agreement
with the optical microscopy results for the cross-section: voids were only observed in B2
using XRCT. This may have been caused by non-representative samples or because the
resolution of XRCT, 6 µm, was too low. The voids in B3 were larger than 6 µm thus it is
more likely that there were difficulties obtaining representative samples. It may be necessary
to use a combination of optical microscopy and XRCT to investigate the presence of voids in
the wire.
Figure 6.4: Optical microscopy images of cross-sections of B3.
200 µm

95
Notches and other defects were not easily observable on the surface of the wire in optical
microscopy images of cross-sections but were visible in SEM micrographs at higher
magnification. Figure 6.6 shows an example of an SEM micrograph. The notches were small,
less than 10 µm in depth and most were less than 1 µm. Also, they did not appear that
frequently. It was not possible to quantify notches and other surface defects in this manner as
it would have been resource intensive: many images would have to be collected for analysis
and there was no available automated method to determine the depth and frequency of
notches.
Figure 6.5: XRCT results for B2.
Figure 6.6: SEM micrograph of longitudinal cross-sections of B3. Notches are highlighted
by white rings.
0.45 mm 0.80 mm
200 µm

96
6.3.2 Geometry
The diameter measurements for each batch of wire, as measured using a micrometer, are
displayed in Table 6.1. There are differences between the wire diameter of different
manufacturers and for Manufacturer C wire, between different batches. These differences are
within tolerance specified for welding wire, between 1.16 mm and 1.21 mm. (British
Standards Institution, 2011). The difference in cross-sectional area between A1 and B1 was
around 3 %. The difference in cross-sectional area between C1 and C5 was around 2 %.
These differences may not be significant as diameter measurements for wire batches are
within tolerance. These are tolerances for welding wire, however, and it is possible that
tolerances for WAAM wire have to be more stringent as the amount of wire required for the
manufacture of a WAAM component is far higher than a weld and the process may be more
sensitive to differences in diameter.
Table 6.1: Diameter measurements for all wire batches. The standard deviation was
across 60 measurements.
Wire Batch Diameter
(mm)
Standard
Deviation (mm)
Min. (mm) Max.(mm)
A1 1.192 0.004 1.177 1.201
A2 1.190 0.004 1.180 1.198
A3 1.191 0.003 1.184 1.197
B1 1.172 0.005 1.162 1.182
B2 1.178 0.003 1.168 1.185
B3 1.179 0.003 1.172 1.185
C1 1.187 0.004 1.180 1.196
C2 1.187 0.006 1.177 1.205
C3 1.180 0.003 1.171 1.185
C4 1.185 0.004 1.175 1.193
C5 1.175 0.004 1.168 1.183

97
6.3.3 Bulk Composition
Table 6.2 shows the ICP-OES results for different batches of wire. There were noticeable
differences: Manufacturer A wire contained more copper and less silicon than the other two
batches. Manufacturer C wire contained the least amount of copper, below the allowed
minimum for AA2319 (British Standards Institution, 2004b), and the most amount of iron.
Table 6.2. ICP-OES results for 25 g samples of wire from A1, A2, B2 and Manufacturer
C (wt %). The error was based on counting statistics. Less than 0.01 wt % of Mg and Zn
were detected.
Cu Mn Ti Zr V Si Fe
A1 6.26 0.31 0.12 0.12 0.08 0.05 0.16
A2 6.18 0.31 0.13 0.10 0.08 0.04 0.13
B2 5.98 0.30 0.11 0.11 0.07 0.13 0.16
C 5.62 0.27 0.12 0.11 0.10 0.07 0.22
Error 0.12 0.03 0.02 0.02 0.02 0.02 0.02
6.3.4 Surface Composition
Examples of XPS spectra for samples from the different wire batches can be seen in Figure
6.7. Mean quantification of the surface composition of at least four different locations on four
samples from the different samples is displayed in Table 6.3. Typical values of error for
quantitative XPS results would be 5 ‒ 10 % of the value, depending on the intensity of the
energy loss background. For low background peaks, such as C 1s, Al 2p and O 1s, the
standard deviation is expected to be around 5 %. The calculated standard deviations for the
quantitative results are higher than this, suggesting that the surface composition of wire is
inhomogeneous. Inhomogeneity of the wire has also been observed for the surface finish and
microstructure, as distributions of notches, cracks and internal voids were not uniform.

98
The main constituents at the surface detected using XPS were carbon, aluminium and
oxygen. Calcium, silicon and nitrogen were also detected for all wire batches. Some
constituents were only detected for particular wire batches:
Chlorine: A1, B2
Fluorine: C2
Sodium: A2, A3, C1, C4
Sulphur: A1, A3, B1, B3, C3
Figure 6.7: Examples of XPS spectra of (a) A1, (b) B1 and (c) C5

99
Table 6.3: Average quantification of the XPS results. Less than 0.1 at. % of Cu was detected.
The error indicates the standard deviation across the different regions analysed.
Manufacturer B wire had lower amounts of carbon on the surface compared to most
batches of Manufacturers A and C wire: 60 – 65 at. % compared to 75 – 80 at. %. A1 and C1
had lower amounts of carbon compared to other batches of wire from the same
manufacturers. Both C1 and C2 were manufactured using a new process compared to C3, C4
and C5 but there were no significant differences between the new batches and the old
batches.
Examples of high-resolution spectra of the Al 2p, C 1s and O 1s peaks are displayed in
Figure 6.8. The peaks for all batches of wire were relatively similar. The energies of the Al
2p and C 1s peaks corresponded to aluminium oxide, aluminium and hydrocarbons. The
spectra for C 1s for all the batches were typical of adventitious carbon contamination but the
amount was higher than the 20 – 30 at. % that expected of ambient contamination (Smith,
2005). The O 1s peaks for all batches were similar in energy and appeared similar in shape
including the width of the peak, suggesting there was no difference in chemical states of
oxygen. It is recognised that the O 1s peaks of aluminium oxide compounds are difficult to fit
due to small peak shifts (Lopez et al., 1991). The O 1s high resolution spectra were not
symmetrical and it is likely they were comprised of a mixture of peaks: aluminium hydroxide
at 531.9 eV or 533 eV (Kloprogge et al., 2006), aluminium oxide at around 531.1 eV and
hydrocarbons from 531 eV to 533 eV. It has been previously shown that there are difficulties
fitting aluminium hydroxide peaks for Al 2p spectra (Zähr et al., 2012) but the latter two
suggestions are supported by the energies of the Al 2p peak, at around 74.6 eV for aluminium
oxide, and C 1s peaks, from 531 eV to 533 eV for hydrocarbons with oxygen functionality.
Wire Batch Surface elemental concentration (at. %)
C Al O Other
A1 60 ± 8 11 ± 4 25 ± 5 4.0 ± 0.4
A2 75 ± 4 5 ± 1 16 ± 2 4.4 ± 0.4
A3 80 ± 1 3.3 ± 0.6 14 ± 1 3.4 ± 0.4
B1 65 ± 4 10 ± 2 23 ± 2 3 ± 0.3
B2 59 ± 8 12 ± 4 27 ± 5 2.2 ± 0.4
B3 63 ± 5 10 ± 3 24 ± 3 3 ± 1
C1 68 ± 3 4 ± 2 21 ± 2 2.7 ± 0.8
C2 80 ± 2 4 ± 2 13 ± 2 3 ± 1
C3 80 ± 4 4 ± 2 14 ± 3 2.4 ± 0.7
C4 76 ± 3 3.7 ± 0.9 16 ± 2 4.7 ± 0.8
C5 75 ± 5 5 ± 3 16 ± 3 4 ± 1
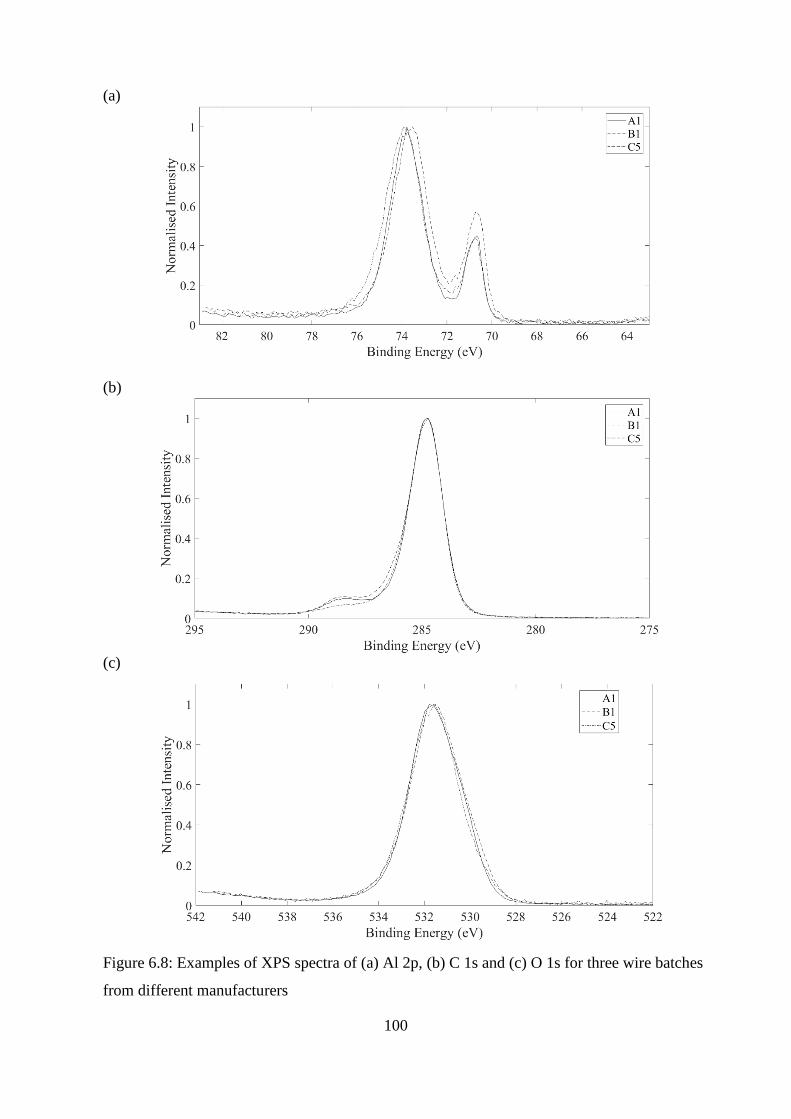
100
(a)
(b)
(c)
Figure 6.8: Examples of XPS spectra of (a) Al 2p, (b) C 1s and (c) O 1s for three wire batches
from different manufacturers

101
6.4 Discussion
There are two factors that appear to influence porosity in WAAM components: internal voids
in the wire and wire diameter. Visual observations of the surface roughness suggest that a
rougher surface results in higher porosity, but the surface roughness has not been quantified.
There does not appear to be a correlation between the other factors, that is bulk composition
and surface composition, and the porosity in the resulting WAAM components.
There is evidence to suggest a relationship between internal voids in the wire and
porosity. Large internal voids were observed in the centre of B1 and B2 wire, which both
resulted in components that contained high amounts of porosity: 2 ‒ 6 %. No internal voids
were observed in the centre of any Manufacturer A batches, C1 and C2, which consistently
resulted in low porosity components, all less than 0.6 %. There were small internal voids in
the centre of some Manufacturer C batches: C3 and C4. Components manufactured from
these batches contained 0.6 –0.9 % porosity, higher than components manufactured from C1
and C2 wire which did not contain any internal voids. No internals voids were visible in the
centre of C5, however, which resulted in the highest porosity of any of the Manufacturer C
batches: around 1 ‒ 2 %. C5 appears to be an anomaly. Given the variability observed in the
wire, internally and externally, it was not possible to determine how much wire should be
examined to ensure representative sampling.
The voids were typical of chevron cracking, which can be caused by a high angle die, a
small reduction area or inclusions within the material (Aravas, 1986; Komori, 1999): the
former two factors influence the size of plastic zones in the wire and the latter increases
internal stresses in the wire. Chevron cracking may be indicative of issues with the
manufacturing process, such as unsuitable equipment or non-optimised process parameters,
or issues with the ingot of material, such as large inclusions, precipitates or voids.
Chevron cracking in the wire may have a detrimental effect on the WAAM process and
influence porosity. Voids in the wire, particularly the size observed in Manufacturer B wire,
may affect deposition behaviour. Loss in material would affect conductivity of the wire,
change current and voltage to the wire and the size of the weld droplet and weld pool.
Fluctuations in current, voltage and volume of material all affect arc stability, metal transfer
behaviour (Modenesi and de Avlar, 1999; Wu et al., 2008; Sterjovski et al., 2010) and weld
pool convection (Kou and Wang, 1986), which in turn affect porosity (Harris, 1988; Gingell
and Gooch, 1997; Shtrikman et al., 2011). Differences in the size of the weld droplet and
weld pool will influence hydrogen absorption (Woods, 1974), solidification rate (Gingell and
102
Gooch, 1997), weld pool convection and hydrogen diffusion (Harris, 1988). Reduction of
material in the centre of the wire would increase the surface area to volume ratio, which may
affect porosity as the surface of the wire is considered a source of hydrogen (Harris, 1988;
Gingell and Gooch, 1997). It is unlikely that chevron cracking caused a significant difference
in surface area to volume ratio; although some of the defects were relatively large, around 0.5
mm in diameter compared to 1.2mm wire diameter, they were not found frequently in the
wire. Voids such as these are unlikely to contain high amounts of hydrogen or other gases as
they form in the centre of solid material.
Chevron cracking may be indicative of an inhomogeneous microstructure, such as the
presence of large inclusions or precipitates, which could influence porosity. Oxide inclusions
act as sites for pore nucleation (Laslaz and Laty, 1991; Chen and Gruzleski, 1996). Inclusions
and precipitates may also influence the solidification kinetics of the weld pool (Dvornak et
al., 1991). This could affect porosity due to differences in the formation of pore nucleation
sites or dendritic microstructure favourable for porosity formation (Devletian and Wood,
1983). Localised differences in bulk composition could have an effect on the wire properties,
including hydrogen absorption (Woods, 1974) and conductivity (Davis, 2001), which affect
porosity formation in the weld pool. Chevron cracking may also be indicative of residual
stresses in the wire. Residual stresses cause wire to permanently deform affecting the cast, the
diameter of a loop of wire removed from the spool, and helix of the wire, the distance
between two loops which affect feedability (Wang et al., 2017). Feedability of the wire may
affect arc stability and thus porosity as discussed in Chapter 2.
Components manufactured with wire that had a larger diameter contained lower amounts
of porosity than wire with a smaller diameter. The effect of diameter on loss of material is
likely to be more significant than chevron cracking, as it is consistent over the whole length
of the wire. Differences in diameter between different batches were less than 2 %, in cross-
sectional area were less than 3 % and in the surface area to volume ratio were less than 2 %.
These differences were far smaller than the variation in porosity observed between
components manufactured using different batches of wire. It is unlikely that these differences
had a significant effect on hydrogen content but they may have affected other factors such as
arc stability and weld pool convection as discussed above. It has been previously observed
that differences in wire diameter of 0.06 mm, around 7 %, had a significant effect on arc
stability (Modenesi and de Avlar, 1999). A study of the effect of wire diameter on these
factors would aid understanding of the influence of batch-to-batch wire variation on the

103
WAAM process and porosity formation and could improve commercial viability of WAAM.
There were limitations to how the wire diameter was measured. The use of a micrometer
can be prone to operator error. Multiple operators were used to reduce or eliminate possible
error. Standard deviation across the measurements was low, suggesting that this was
achieved. There are other suitable techniques capable of measuring large samples quickly
such as laser scanning, which is commonly used as quality control during the wire drawing
process.
There did not appear to be a relationship between porosity and wire surface finish. Two
Manufacturer A batches had good surface finish and resulted in low porosity and three
Manufacturer B batches had poor surface finish and resulted in high porosity but this
correlation was not consistent across all batches of wire. A3 also had poor surface finish,
particularly compared to the other Manufacturer A batches, but resulted in components that
contained the lowest amount of porosity. C1 and C2 did not appear to have significantly
improved surface finish compared to other Manufacturer C batches, there were still scratches
and notches in the transverse direction but resulted in components with lower amounts of
porosity. There was also no evident relationship between black residue and porosity.
The network of cracks seen on the surface of Manufacturer B wire was not observed for
wire from other manufacturers. A connection between chevron cracking and surface cracking
has been previously established and was attributed to high stresses in the wire (Aravas, 1986;
Baek et al., 2011). Inclusions also cause cracks to form on the wire surface (Vykydal et al.,
2011). The SEM images suggest that inclusions on the surface were crack initiation sites.
There does not appear to be differences in inclusion frequency or size between different
batches of wire, however, but it would be of use to quantify this using image analysis
software before stating it for certain. This suggests that the cracking was caused by high
levels of stress on the surface due to the wire drawing process, as opposed to geometrical
discontinuities due to large inclusions. The influence of high stresses at the wire surface on
porosity has not been reported in the open literature. It is likely that it will affect feedability
of the wire and thus porosity.
There did appear to be differences in roughness between wire that resulted in low porosity
and high porosity. Although A3, C1 and C2 had poor surface finish, the surface did not
appear as rough compared to Manufacturer B and other Manufacturer C batches. Roughness
was not quantified and was based on visual inspection. A rougher surface would create a
larger surface area which could result in a higher amount of hydrated oxide and
104
contamination and thus more porosity. Also, a rough surface could cause wire feed issues
during WAAM and affect conductivity of the wire which will influence porosity, as discussed
in Chapter 2.
Surface finish was analysed qualitatively, using SEM and optical microscopy
micrographs. It was not possible to quantify the surface finish or measure the roughness with
the collected data. Attempts were made to find a suitable technique to analyse the surface
finish. The use of laser scanning was unsuccessful as it was found that the resolution of the
technique was not high enough and could not analyse small features, i.e. notches micrometres
in depth and/or length. There were also issues with uniform illumination across the wire due
to its cylindrical geometry. Other techniques, such as atomic force microscopy to analyse the
topography, were deemed unsuitable due to limitations of sample size.
Bulk composition of the wire did not appear to affect porosity. Components manufactured
using Manufacturer A wire contained the least amount of porosity and Manufacturer A wire
contained the highest amount of copper. The converse was not true, however. Components
manufactured using Manufacturer B wire contained the highest amount of porosity but
Manufacturer B wire did not contain the least amount of copper. All of the Manufacturer C
batches were drawn from the same ingot of material yet there was variation in porosity for
components manufactured from different batches. Distribution of inclusions may have an
effect on porosity, as discussed previously. It may be of interest to investigate the
microstructure of wire from different batches to understand this effect. There were
differences in trace elements: B1 contained higher silicon than the other batches of wire and
wire from Manufacturer C contained higher iron. Silicon and iron are considered impurities
in AA2319 welding wire and can alter the behaviour and solidification of the weld pool, even
at trace amounts (Shankar et al., 2004; Zhang, W. et al., 2017). In the work of Zhang, W. et
al. (2017), it was observed that the addition of silicon increased porosity in the casting of an
Al-Cu alloy and it is possible that a similar effect occurs during the solidification of the weld
pool. The authors suggested that silicon promotes the formation of iron rich intermetallics,
particular α-Fe, which can act as nucleation sites for pores. The authors also suggested that
silicon has other effects, such as reducing the liquidus temperature, and increasing formation
of θ. Both of which could affect solidification and the microstructure of the material and thus
may affect porosity formation. Silicon was varied significantly in this study, from 0.03 wt. %
to 1.09 wt % and the morphology change was only noticeable above 0.15 wt %. This is
higher than the variation observed in the different wire batches. It would be of further use to

105
characterise the microstructure of panels manufactured from wire with different amounts of
silicon in to determine if there are any differences in morphology.
There does not appear to be a relationship between porosity and surface composition. The
surface composition was not similar for wire batches that resulted in low porosity. For
example, there was 60 at. % of carbon on the surface of A1 wire and 80 at. % on the surface
of C2 wire. Wire from Manufacturer B had low amounts of carbon on the surface and
resulted in high porosity but A1 and C1 also had low amounts of carbon on the surface and
resulted in low porosity. There were no clear differences in chemical states of the constituents
of the wire surface for different wire batches. High resolution peaks were relatively similar in
shape. There were no shifts to higher energy for the O 1s peaks that would be expected for
aluminium hydroxide. The C 1s peaks did not show any significant differences in
hydrocarbon content between different batches of wire.
There were limitations to XPS including spatial resolution of the technique: the
composition was analysed and averaged over an 800 µm diameter spot, 3 – 10 nm in depth. It
is possible to use a smaller diameter spot, e.g. 50 µm, but spot size is concomitant with
quality of spectroscopic data. A smaller spot size would decrease the signal to noise ratio.
Also, many of the notches and scratches were smaller than 50 µm. Thus it would not be
possible to use XPS to discern the composition within defects on the surface. C1 and C2 were
manufactured using technique with different wire and spool cleaning methods. It is possible
that this resulted in less contamination in the notches and scratches on the surface compared
to other batches of Manufacturer C wire and Manufacturer B wire. Sputtering the wire
samples would remove contamination on the top surface which could allow signal from
notches and scratches to be detected although other techniques may be more suitable. Various
spectroscopic methods have concluded following the use of a solvent on the wire to strip it of
any contamination but there were issues: details of the lubricant the wire manufacturers used
was propriety information and unavailable, thus the correct solvent to use could not be
determined.
Arc wander was observed with wire that had a smoother surface, no internal voids and a
larger diameter. There did not appear to be a relationship between surface composition of the
wire and arc wander which was unexpected as contamination can inhibit conductivity (Zinke
and Shröder, 2004). A larger diameter may reduce current density to the wire resulting in
lower electron emission thus causing arc wander (Gordon, 1967; Correy, 1982). Typically for
MIG welding, the cathode spots, the point at which electron emission occurs, are on the work

106
piece or the weld pool, not the wire (Tong et al., 2005; Saraffi and Kovacevic, 2010). Also,
no differences in the occurrence of arc wander were observed between different WFS which
would also result in different current densities.
The relationship between batch-to-batch variation of the wire and arc wander may be
caused by differences in surface finish, which could affect the oxygen content of the wire. A
thick oxide layer on the wire or work piece surface restricts movement of the cathode spot,
and thus confines movement of the arc preventing arc wander (Lancaster, 1984; Matz and
Wilhelm, 2011). A thicker oxide layer was not observed on wire with no arc wander: the
ratio of the intensity of the aluminium oxide peak to aluminium peak was similar for all wire
batches for the Al 2p XPS peaks. A rougher surface would increase the amount of aluminium
oxide on the wire surface and weld pool due to an increase in surface area, which may have a
similar effect on arc wander. The influence of batch-to-batch variation of wire on
reproducibility of the WAAM process could be further investigated by monitoring the
WAAM process with the use of a high-speed camera to quantify the relationship between
wire batch and arc wander.
6.5 Summary
There is evidence to suggest that internal voids in the wire and the wire diameter
affect porosity. Wire that contained large internal voids resulted in WAAM
components with high porosity, as did wire with smaller diameter. The results show
that bulk composition and surface composition did not affect significantly porosity.
Internal voids and smaller wire diameter indicate an increase in surface area to
volume ratio, which may increase the amount of hydrogen in the weld pool and also
influence arc stability, cooling rates, geometry of the weld pool and weld pool
convection which can all affect porosity.
There were limitations to techniques used, however, as there were difficulties
obtaining representative samples, due to the inhomogeneous nature of wire, and
defining a quantitative system of description for wire quality, i.e. poor and good wire
surface finish. Also no techniques were available during the project that were capable
of quantifying surface roughness, due to the geometry of the wire and size of the
notches, or analysing surface composition within notches and scratches, although the
work carried out suggests that these may be important in identifying principal causes
of porosity in WAAM parts

107
The results showed a link between cracks on the surface of the wire and inclusions at
the surface. It has also been shown in literature that there is a link between inclusion
distribution and chevron cracking. Oxide inclusions are known to be sites of pore
nucleation and thus to further understand the influence of batch-to-batch variation of
wire, analysis of the microstructure of wire, including the distribution of inclusions
and precipitates, should be performed.
Quantification of the relationship between wire batch and arc wander could be
achieved through the use of a high-speed camera to monitor the WAAM process.

108
Chapter 7
Discussion
7.1 Introduction
Within the broad scope of improving commercial viability of aluminium WAAM through
understanding the lack of reproducibility of components, three objectives were set. These
objectives were: analyse the nature of the surface deposit, study the influence of wire batch
and process parameters on surface deposit formation and porosity, and characterise batch-to-
batch variation of the precursor wire. The key findings and the implications for commercial
viability of WAAM are summarised below.
7.2 Summary
7.2.1 The Nature of the Surface Deposit
The surface deposit was found to contain metal and metal oxide nanospheres, microspatter
and irregularly shaped carbon-rich microparticles, following analysis using SEM, XPS and
XRD. For AA2319, the surface deposit contained predominantly aluminium and aluminium
oxide. For AA5183, it contained predominantly magnesium oxide, aluminium and aluminium
oxide. The surface deposit varied in thickness, typically between 0 – 20 µm, and in
composition. A mechanism was proposed for the formation of the surface deposit:
condensation of vapour and microspatter from feedstock wire.
7.2.2 Influence of the Wire Batch and Process Parameters on Surface Deposit
Coverage and Porosity
Surface deposit coverage of AA2319 components was affected by WFS: the higher the WFS,
the higher the coverage. This supports the suggestion that surface deposit formation by
condensation of vapour from feedstock wire as WFS affects temperature of the arc and weld
droplet.
Porosity in WAAM AA2319 components was influenced by wire batch. Porosity varied
from 0.02 % to 6 % depending on the wire batch used. The most significant variation was
between different wire manufacturers, but variation was also observed between batches of
wire produced by Manufacturer C using the same ingot of material but different processes.
Process parameters, within the range tested, did not appear to affect porosity. This apparent

109
lack of effect may have been masked, to an extent, by the dominant influence of wire batch.
7.2.3 Characterisation of Batch-to-Batch Variation of Aluminium Alloy Wire
Wire diameter and internal voids, typical of chevron cracking, varied between wire batches
that resulted in components that contained significant differences in porosity. Some batches
contained no internal voids and some contained voids over 400 µm in diameter. Wire
diameter ranged from 1.175 to 1.192 mm, which was within tolerance for welding wire
specifications. Components manufactured using wire with, no internal voids and larger wire
diameter contained low porosity and vice versa. Internal voids and wire diameter could
influence hydrogen content, arc stability and weld pool convection which all affect porosity.
Visual observations of the wire surface suggested that a rougher surface resulted in higher
levels of porosity. For porosity formation to be better understood, surface roughness should
be quantified, and the influence of wire batch on arc stability and weld pool convection
should also be analysed.
No relationship was observed between bulk composition and porosity, or between surface
composition and porosity. This was unexpected as wire is recognised as a primary source of
hydrogen in literature, the cause of gas porosity in aluminium. This apparent lack of
relationship between hydrogen content of the wire and porosity is further discussed in §7.3.
A similar relationship between wire batch and arc wander was observed: arc wander was
observed with wire that had a lower surface finish, no internal voids and a larger diameter.
There was also no relationship between bulk composition and arc wander, or between surface
composition and arc wander. Again, this was unexpected as composition can affect electron
emission which influences movement of the arc. This suggests that there is a relationship
between wire batch, porosity and arc wander: this relationship is explored in §7.3.
7.3 Implications for the Commercial Viability of WAAM
In this section, the commercial viability of WAAM is considered in light of the findings of
this project. This includes discussion on how the different factors investigated are interlinked,
compare with observations reported in other works in literature and relate to commercial
viability of WAAM.
One factor expected to limit commercial viability of WAAM is the occurrence of arc
instability, as this implies non-repeatability and may necessitate operator intervention or lead
to failure in the desired geometry. It was suggested in literature that surface deposit formation

110
was linked to arc instability and contamination of the surface of the wire (Woods, 1980; Lee
et al., 2015a). It was hypothesised that the surface deposit may be a visual indication of a
non-optimised process and also may be correlated to porosity. There did not appear to be a
relationship between surface deposit formation and arc stability. The manufacture of
components with high surface deposit coverage was completed without disruption of the
WAAM process or the requirement for operator interference. Arc wander was observed with
components that had high and low amounts of surface deposit.
XPS results showed no relationship between adventitious carbon on the surface of the
wire and surface deposit formation. For example, C2 had relatively high amounts of carbon
on the surface but consistently resulted in parts with no surface deposit. B1 had little carbon
on the surface but sometimes resulted in parts with high surface deposit. It is also of note that
the composition and morphology of the surface deposit were apparently independent of wire
batch used and process parameters.
The results showed no correlation between surface deposit coverage and porosity. This
was unexpected as it was thought that the production of wire vapour would disrupt the
shielding gas flow and cause contamination from atmosphere, thus increasing hydrogen in the
weld pool. It is recognised that the wire surface is the primary source of hydrogen (Devletian
and Wood, 1983; Harris, 1988; Gingell and Gooch, 1998). The results of this study
demonstrated that wire batch had the most significant influence on porosity thus it is likely
that hydrogen on the wire surface dominated over atmospheric contamination.
It was proposed that the surface deposit was formed from condensed metal vapour, a
suggestion also made in literature (Woods, 1980; Sugiyama et al., 1995; Lee et al., 2015a).
This was supported by the correlation between WFS and surface deposit coverage: the higher
the WFS, the higher the surface deposit coverage. This suggests that the formation of the
surface deposit is temperature dependent, as during CMT there is a synergic relationship
between WFS and current. A higher current results in a higher temperature to the arc and
weld droplet and thus it is likely more wire vapour will be produced.
It is unlikely that the surface deposit affects commercial viability of WAAM. It appears
that the surface deposit is an aesthetic artefact and is easily removed, with tissue or by wire
brushing or machining. The lack of relationship between surface deposit coverage and
porosity, and surface deposit coverage and arc stability demonstrate that it is not suitable for a
visual examination method for quality control and process monitoring of the WAAM process.
Formation may signify material loss from the wire but it is unlikely to be significant enough

111
to affect the composition of the deposited material. Estimated material loss was less than 0.1
% of total deposited material assuming the surface deposit was consistently 5 µm thick across
the entire component. It is likely that the composition of the deposited material will still be
within specification for the nominal composition of AA2319. It may be possible to prevent
formation of the surface deposit through careful control of temperature to the weld droplet,
such as optimising WFS, but further investigation is not considered critical for improving
commercial viability of WAAM.
There was significant variation in porosity of WAAM AA2319 components depending on
wire batch used, which inhibits commercial viability of the process. Previous work has shown
that wire batch affects deposition during WAAM. Gu et al. observed differences in arc
stability, arc wander, spatter, weld fume generation and uniformity of metal transfer and weld
bead geometry depending on wire batch used (Gu et al., 2014). The relationship between
porosity and wire batch has not previously been reported however. Process parameters did
not appear to affect porosity which is not in agreement with literature: it has been previously
observed that WFS to TS ratio (Ayarkwa et al., 2015) and CMT mode (Cong et al., 2015;
Cong et al., 2017a) affect porosity in AA2319 WAAM components. Their effect may not
have been observed due to the dominant influence of wire batch. It is also possible in
previous work that the apparent relationship between porosity and process parameters may
have been caused by wire batch: details of the wire batches used were not included in any of
these studies (Ayarkwa et al., 2015; Cong et al., 2015; Cong et al., 2017a). It would be of
interest to study the effect of process parameters within one batch of wire.
Hydrogen entrapment was thought to be the principal mechanism of porosity formation in
WAAM AA2319 as most of the pores were spherical in shape, typical of gas porosity. The
results suggest there was no correlation between bulk hydrogen content and porosity,
however. Different batches of wire from Manufacturer C were manufactured from the same
ingot of material using different processes. Two batches manufactured using a new process
resulted in much lower porosity than three batches manufactured using the old process. It is
unlikely that there was significant variation in hydrogen content of the same ingot of material
between the new and old batches. This supports the suggestion that the primary source of the
hydrogen was the wire surface.
Hydrogen content of wire surface was not explicitly measured; there is difficulties with
accurately detecting hydrogen as it is light in mass and interacts weakly with electrons and X-
rays. Also there are limitations to many of the techniques available such as low sensitivity

112
(Anyalebechi, 1991; Evers et al., 2013) and susceptibility to contamination (Anyalebechi,
1991). The presence of hydrocarbons and aluminium hydroxide on the wire surface was
analysed using XPS, through determining energy shifts of C 1s and O 1s peaks. There was no
apparent relationship between hydrocarbon content on the wire surface and porosity. There
was also no apparent relationship between aluminium hydroxide content and porosity. There
were limitations to XPS as discussed in Chapter 6: small sample size and averaging over a
spot size. It was not possible to determine the composition of specific features such as
notches and crevices, and the surface composition of large samples could not be quantified.
Other techniques to analyse hydrogen on the wire surface were considered including: hot
extraction, vacuum fusion, inert gas fusion, thermal desorption spectroscopy (TDS) and
nuclear reaction analysis (NRA). All except NRA can only be used to analyse the hydrogen
content in the wire, not on the wire (von Zeppelin et al., 2003; British Standards Institute,
2006; American Society for Testing and Materials, 2013). It is possible to use nuclear
reaction analysis to analyse hydrogen on the surface of samples (Wilde and Fukutani, 2014).
NRA was not suitable, however, for this work: analysing large samples would be extremely
resource intensive due to limited spot size and thus unfeasible, there was a lack of availability
and it was cost prohibitive. None of the techniques could be used to overcome the issues of
XPS. Determining the source of hydrogen is critical for understanding and controlling
porosity in WAAM components. To date, a technique has not been found that can quantify
hydrogen on the surface of wire for a representative sample. It may be possible to analyse the
influence of hydrogen on the wire surface on porosity through other means such as
deliberately varying hydrogen on the wire surface through cleaning the surface or hydration
in a humid atmosphere.
Hydrogen content of the wire is affected by other factors such as the surface area to
volume ratio. Characterisation of the wire used in this work showed differences in internal
voids and wire diameter which affect the surface area to volume ratio. Components
manufactured from wire that contained internal voids and had a smaller diameter, thus a
higher wire surface area to volume ratio, contained higher amounts of porosity. A higher ratio
could cause a higher amount of hydrogen in the weld pool and therefore a higher amount of
porosity. It would be of use to investigate the relationship between surface area to volume
ratio of the wire and porosity of components. Although it has not been possible to quantify
hydrogen on the surface of the wire, it is possible to quantify the surface area to volume ratio
of the wire. Visual observations also suggested that surface roughness, which would increase
113
wire surface area to volume ratio, affected porosity; the rougher the surface, the more
porosity. Surface roughness of the wire can be measured using a suitable technique, such as
Michelson interferometry, the frequency of internal voids can be characterised using XRCT
on multiple samples and laser scanning can continuously measure wire diameter of a large
sample more efficiently.
Hydrogen content of the wire is not the only factor that could affect porosity formation.
Porosity formation in WAAM is a complicated process and depends on many different
factors including: microstructure, weld pool convection, solidification rate and hydrogen
absorption (Wood, 1974; Harris, 1988; Mazur, 1992; Gingell and Gooch, 1997), as discussed
in §2.7. These factors can be interdependent and also are influenced by temperature of the
arc, weld droplet and weld pool, stability of arc, metal transfer and volume and geometry of
the weld droplet and weld pool. Differences in wire diameter and internal voids could affect
the factors specified above, as discussed in Chapter 6. A relationship between wire batch and
porosity has been established and it would be of interest to further investigate this through
monitoring the process with a high-speed camera for observing deposition, a thermal camera
to determine the thermal history and an AMV 5000 to measure fluctuations in current and
voltage.
There appeared to be a relationship between wire batch, arc wander and porosity. Arc
wander occurred with wire that resulted in components that contained low porosity, and vice
versa. This does not support claims in literature that arc wander is associated with porosity
formation (Reis et al., 2011; Department of the Army, 1976; Mohler, 1983). As previously
discussed in §6.4, it is possible that differences in surface finish and wire diameter between
wire batches could affect arc wander due to their influence on the formation of an oxide layer
on the weld pool and thus cathode spot formation. Surface finish, wire diameter and a
hydrated oxide layer could also influence porosity, again discussed in §6.4, thus causing the
relationship between wire batch, arc wander and porosity observed. In order to further
understand this relationship, arc wander should be further investigated with the use of a high-
speed camera and attempts should be made to quantify it.
A major finding of this study is that it is possible for porosity to be reproducibly reduced
to an acceptable level, improving commercial viability, through control of the feedstock
material. Wire from Manufacturer A consistently resulted in parts that contained porosity less
than 1.0 % and no pores were over 50 µm in diameter. These values were in line with the
requirements of Lockheed Martin UK. Porosity of less than 1.5 % has been recommended for

114
castings (International Organization for Standardization, 1992). 1.0 % porosity is commonly
achieved by another additive manufacturing technique with comparable deposition rates:
high-speed SLM (Buchbinder et al., 2011; Kempen, 2015). A maximum value for porosity of
1.0 % has been set for the requirements of Lockheed Martin UK. Pore size was also
considered a critical factor due to its effect on fatigue properties (Reddy et al., 2000). In
Wang et al.’s work, it was shown that a pore size of 50 µm causes a severe reduction in
fatigue properties for A356-T6 cast material of a grain size between 20 – 25 µm (Wang et al.,
2001). This fatigue testing was performed using a stress ratio of 0.1 and a stress amplitude of
100 MPa, the latter typical of the pressure an aeroplane cabin would experience (Peel and
Gregson, 1995). Similar work found that fatigue cracks initiated on pores that were the same
size as grains for W319 cast material for a stress ratio of -1 and a stress amplitude of 95.8
MPa (Boileau and Allison, 2003). Another study on fatigue testing of AA5183 welds using a
range of different stress ratios and amplitudes found that pores that were comparable in size
to grains were sites of crack initiation and most cracks initiated on pores 50 µm ‒ 140 µm in
size (Guar et al., 2018). Average grain size of WAAM AA2319 T6 material was found to be
39 µm using a linear intercept method (Perea, L., 2015). It was decided that a maximum pore
diameter of 50 µm was an appropriate limitation.
Improvement and control of Manufacturer C wire quality was a key result of the work as
the improvements to the wire were made after collaboration with the wire manufacturer and
changes to the wire drawing process. Following the new wire drawing process with diamond
dies and different wire and spool cleaning methods, porosity was reduced from over 1 % to
0.2 % and there were fewer pores with a diameter over 50 µm. Characterisation of the wire
showed a larger diameter and closer to the nominal 1.2 mm, no internal voids and there was
an apparent reduction in surface roughness. All of these features can be affected by dies. It is
also possible that using different cleaning methods reduced the amount of contamination
present in notches and scratches, which would also improve wire quality. Thus it is
recommended that to improve wire quality, the optimal die should be used including suitable
geometry and a high level of polish, and the cleaning methods should be optimised.
This work showed issues with Manufacturer B wire: it was either not possible to
manufacture components with the wire or the components contained high amounts of
porosity. Chevron cracking was present in all Manufacturer B wire and suggests issues with
the wire manufacturing process, specifically poor die design and too small a reduction in area
during the wire drawing process (Aravas, 1986; Komori, 1999), and also the ingot of

115
material. The cracking was more severe on the surface and the surface was also rougher for
B3, which could not be deposited. Surface finish affects feedability of the wire and standards
for the condition of welding wire state that the surface finish may not adversely affect the
welding process (British Standards Institution, 2011). It has been observed to affect arc
stability and deposition during WAAM of aluminium (Gu et al., 2015). It would also be of
interest to analyse if similar changes to their wire manufacturing process, i.e. diamond dies
and optimised cleaning methods, improves the wire quality and reduces porosity in WAAM
AA2319 components.
This work has contributed towards efforts to qualify the WAAM process and components
for aluminium alloys. Repeatability of this technology was observed, provided that the
feedstock wire can be controlled. Porosity measurements from different components
manufactured using the same wire batch and process parameters were in agreement.
Therefore manufacturers with suitable feedstock supply will be able to apply qualification
methods and standard practice such as statistical process control as they do with established
manufacturing techniques. The results have also provided a foundation for A- and B-basis
allowables, required for product design and material/part qualification in aerospace and other
fields of engineering. Statistical analysis showed that porosity measurements from
components manufactured with wire from the same manufacturer can be treated as one
population. Also, following improvements to wire quality, the results show that it is likely
porosity measurements from components manufactured with wire from different
manufacturers can be treated as one population. In order to obtain the minimum number of
samples for A- and B-basis allowables, Lockheed Martin UK should ensure that all suppliers
fix their manufacturing process after any necessary improvements so that all their wires
converge on the same required standard. In order to achieve this, it will be necessary to
develop in-house WAAM wire specifications with focus on wire diameter and surface finish.
Work has been carried out by undergraduate students at the University of Surrey on
testing the mechanical properties of panels from this work (Al-Muqbel, 2018). No correlation
between tensile strength and porosity for the panels tested in this work. 6 panels were tested
in total: two panels manufactured using wire from the three different manufacturers, A1, B1
and C4, and parameter sets B and D. The panels manufactured using C4 wire resulted in the
highest ultimate tensile strength (UTS), averaged around 350 MPa across 9 different samples
in two different orientations, and A1 and B1 were relatively similar, around 325 MPa. There
was no clear correlation between wire batch and tensile properties and process parameters
116
and tensile properties for the panels analysed in this work, although results were limited. Also
of note is this is lower that the UTS typical for AA2219-T62: 450 MPa. Further investigation
is required to achieve suitable UTS for the applications of Lockheed Martin UK using
AA2319 WAAM.
7.4 Concluding Remarks
Surface deposit does not affect commercial viability
Control of feedstock material is critical to ensure commercial viability. Porosity varies
with wire batch used. Wire characterisation showed that internal voids and diameter
varied from batch-to-batch and the evidence suggests that these features were the
critical features that influenced porosity. Suitable techniques need to be found for
quantifying feedstock material quality, such as surface finish, surface roughness and
hydrogen content.
Monitoring and quantifying arc stability and arc wander is of interest to further
understand the influence of wire batch, and control of the process and resulting
properties to improve reproducibility and commercial viability.
It is possible to improve wire quality through the use of diamond dies and different
wire and spool cleaning methods. It is likely that the dies have the most significant
influence on improvement.
WAAM wire specifications may be required to ensure consistent, good quality wire
and to achieve A-basis allowables for WAAM AA2319 components.
117
Chapter 8
Conclusions and Future Work
8.1 Conclusions
The objectives set, and the research questions identified at the beginning of this work have
been addressed. The principal conclusions of this project are as follows:
The nature of the surface deposit was studied and was predominantly metal and metal
oxide nanospheres, formed from the feedstock wire. Surface deposit formation was
affected by WFS, likely to be due to differences in temperature to the arc and weld
droplet. A mechanism for formation of the surface deposit was proposed: vaporisation
and condensation of elements within the feedstock wire with solidified droplets of
molten aluminium microspatter.
The surface deposit was an aesthetic artefact and there was no correlation with
porosity nor did it appear to have an effect on manufacture. The appearance of the
surface deposit should not be considered to influence commercial viability.
Wire batch was the dominant influence on porosity for WAAM AA2319 components.
Evidence suggests that internal voids and wire diameter were the critical features
affecting porosity. Internal voids and smaller wire diameter resulted in panels with
high porosity and vice versa. These features could affect hydrogen content, arc
stability, weld pool convection and cooling rates thus influencing porosity formation.
A relationship between wire batch, porosity and arc wander was observed. Wire with
a visually smoother surface and a larger diameter were associated with arc wander
and low porosity and vice versa. It was suggested that these features could affect
cathode spot formation on the weld pool and porosity formation.

118
This work has showed that it is possible to improve commercial viability of WAAM
through control of the feedstock material, which reduces porosity to a reproducibly
acceptable level according to Lockheed Martin’s requirements. It was also found that it was
possible to improve wire quality and reduce porosity in WAAM components through changes
to the wire drawing process, including the use of diamond dies and different wire and spool
cleaning methods. There is evidence to suggest that specifications for welding wire are not
sufficient for WAAM and new specifications are required that are more stringent, including
tighter tolerances for wire diameter and quantification of surface finish quality.
8.2 Future Work
Future work to improve commercial viability of WAAM could include:
Analysis of the effect of arc stability and the thermal history of manufacture on the
WAAM process, surface deposit formation and porosity through the use of high-speed
and thermal cameras, and measuring fluctuations in voltage and current.
Quantification of the surface finish, including surface roughness and frequency and
depth of surface defects such as notches and scratches.
Determination of a suitable technique to analyse hydrogen content in and on the wire,
and analysing its effect of porosity.
Investigation of the influence of wire microstructure on porosity and arc stability.
Development of WAAM wire specifications.

119
References
Adebayo, A., Mehnen, J. and Tonnellier, X., 2013. Limiting Travel Speed in Additive Layer
Manufacturing. In: Trends in Welding Research: Proceedings of the 9th International
Conference 3, Chicago, USA, pp 1038 – 1044.
Al-Muqbel, M. S., 2018. An evaluation of the porosity and tensile properties of additively
manufactured aluminium using AA2319 wires from different vendors. BEng Final Project
Report. Guildford: University of Surrey.
Allen, J., 2006. An investigation into the comparative costs of additive manufacturing vs.
machine from solid for aero engine parts. In: Cost effective manufacturing via net-shape
processing, NATO AVT-139 Meeting Proceedings, Neuilly-sur-Seine, France, pp 17-1 – 17-
10.
Almeida, P.S. and Williams, S., 2010. Innovative process model of Ti-6Al-4V additive layer
manufacturing using Cold Metal Transfer (CMT). In: 21st International Solid Freeform
Fabrication Symposium, Austin, USA, pp 25 ‒ 36.
Aravas, N., 1986. The analysis of void growth that leads to central bursts during extrusion.
Journal of the Mechanics and Physics of Solids, 34, 55 – 79.
Armao, F., 2003. Aluminium Workshop: How to recognise, minimize weld smut. Practical
Welding Today, March/April Issue, 40 – 41.
Armao, F., 2011. Aluminium Workshop: Addressing arc blow. Practical Welding Today
July/August Issue, 24.
ASM Handbook Committee, 1990. Properties of Wrought Aluminium and Aluminum Alloys
in ASM Handbook, Volume 2: Properties and Selection: Nonferrous Alloys and Special-
Purpose Materials, Ohio: ASM International, pp 62 – 122.

120
American Society for Testing and Materials, 2013. ASTM E2792 - 13. Standard Test Method
for Determination of Hydrogen in Aluminum and Aluminum Alloys by Inert Gas Fusion.
West Conshohocken, PA: ASTM International.
American Society for Testing and Materials, 2017. ASTM E3 - 11: Standard Guide for
Preparation of Metallographic Specimens, West Conshohocken, PA: ASTM International.
Aminzadeh, A., 1997. Excitation frequency dependence and fluorescence in the Raman
spectra of Al2O3. Applied Spectroscopy, 51, 817 – 819.
Anyalebechi, P.N., 1991. Techniques for determination of the Hydrogen Content in
Aluminium and its Alloys—a Review. Cast Metals, 3(4), 182 – 201.
Ayarkwa, K.F., Williams, S. and Ding, J., 2015. Investigation of pulse advance cold metal
transfer on aluminium wire arc additive manufacturing. International Journal of Rapid
Manufacturing, 5, 44 – 57.
Baek, H.M., Jin, Y.G., Hwang, S.K., Im, Y.-T., Son, I.-H. and Lee, D.-L., 2012. Numerical
study on the evolution of surface defects in wire drawing. Journal of Materials Processing
Technology, 212, 776–785
Bai, J., Ding, H., Gu, J., Wang, X. and Qiu, H., 2017. Porosity evolution in additively
manufactured aluminium alloy during high temperature exposure. IOP Conference Series:
Material Science and Engineering, 167, 1 – 4.
Barborak, D., Conrardy, C., Madigan, B. and Paskell, T. Through-Arc Monitoring
Techniques for Control of Automated Gas Metal Arc Welding. Proceedings of 1999
International Conference on Robotics and Automation, Detroit, USA, pp 3053 – 3058.
Battelle Memorial Institute, 2014. Metallic Materials Properties Development and
Standardization MMPDS-09.

121
Bermingham, M.J., Kent, D., Zhan, H., St John, D.H. and Dargusch, M.S., 2015. Controlling
the microstructure and properties of wire arc additive manufactured Ti–6Al–4V with trace
boron additions, Acta Materialia, 91, 289 – 303.
Boeira, A. P., Ferreira, I. L., and Garcia, A., 2009. Alloy composition and metal/mold heat
transfer efficiency affecting inverse segregation and porosity of as-cast Al-Cu alloys.
Materials and Design, 3, 2090 – 2098.
Boileau, J.M. and Allison, J.E., The Effect of solidification Time and Heat Treatment on the
Fatigue Properties of a Cast 319 Aluminum Alloy. Metallurgical and Materials Transactions
A, 34A, 1807 – 1820.
British Standards Institution, 2004a. BS EN 14242:2004: Aluminium and aluminium alloys.
Chemical analysis. Inductively coupled plasma optical emission spectral analysis. London:
BSI.
British Standards Institution, 2004b, BS EN ISO 18273:2004. Welding consumables – Wire
electrodes, wires and rods for welding of aluminium and aluminium alloys – Classification.
London: BSI.
British Standards Institution, 2006. BS EN 3976:2006. Aerospace series -Titanium and
titanium alloys — Test method —Chemical analysis for the determination of hydrogen
content. London: BSI.
British Standards Institution, 2011. BS EN ISO 544:2011. Welding Consumables - Technical
delivery conditions for filler materials and fluxes - Type of product, dimensions, tolerances
and markings. London: BSI.
British Standards Institution, 2017. BS EN ISO 52900:2017. Additive manufacturing -
General Principles - Terminology. London: BSI.

122
Buchbinder, D., Schleifenbaum, H., Heidrich, S., Meiners, W. and Bültmann, J., 2011. High
Power Selective Laser Melting (HP SLM) of Aluminium Parts. Physics Procedia, 12(A), 271-
278.
Chen, X.G. and Gruzleski, J.E., 1996. Influence of Melt Cleanliness on Pore Formation in
Aluminium-Silicon Alloys. Journal of Cast Metals Research, 9, 17 – 26.
Choi, J., Lee, H. and Im, Y., 2010. A study on chevron crack formation and evolution in a
cold extrusion. Journal of Mechanical Science and Technology, 24(9), 1885 – 1890.
Cognolato, D., 2015. Examination of Initial Industrialisation Requirements for Wire Plus Arc
Additive Manufacturing. MSc Thesis. Cranfield: Cranfield University.
Committee of Welding Procedure, 1999. Investigation of the Smut Generation during
Welding Aluminium Alloy with GMAW – part 2. Journal of Light Metal Welding and
Construction, 37(3), 10 – 14.
Cong, B., Ding, J. and Williams, S., 2015. Effect of arc mode in cold metal transfer process
on porosity of additively manufactured Al-6.3%Cu alloy. International Journal of Advanced
Manufacturing Technology, 76, 1593 – 1606.
Cong, B., Ouyang, R., Qi, B. and Ding, J., 2016. Influence of Cold Metal Transfer Process
and Its Heat Input on Weld Bead Geometry and Porosity of Aluminum-Copper Alloy Welds.
Rare Metal Materials and Engineering, 45, 606–611.
Cong, B., Qi, Z., Qi, B., Sun, H., Zhao, G. and Ding, J., 2017. A Comparative Study of
Additively Manufactured Thin Wall and Block Structure with Al-6.3%Cu Alloy Using Cold
Metal Transfer Process. Applied Sciences, 7, 275 – 285.
Correy, T. B., 1982. What Makes an Electric Welding Arc Perform Its Required Functions.
Washington: Battelle Memorial Institute.

123
Davis, J. R., (ed.), 1995. Materials for Networking Applications In: ASM Materials
Handbook, Ohio: ASM International, pp 117 – 290.
Davis, J.R. (ed.), 2001. Aluminium and Aluminium Alloys In: Alloying: Understanding the
Basics, Ohio: ASM International, pp 351 – 416.
Dehoff, R., Duty, C., Peter, W., Yamamoto, Y., Chen, W., Blue, C. and Tallman, C., 2013.
Case study: Additive manufacturing of aerospace brackets. Advanced Materials and
Processes, 171, 19 – 22.
Department of the Army, 1990. Electric Arc Welding and Cutting In: Operator’s manual:
welding theory and application. Department of the Army technical manual, TM 9-237.
Washignton DC: Headquarters, Department of the Army. pp 7-1 – 7-50.
Devletian, J.H. and Wood, W.E. (1983). Factors Affecting Porosity in Aluminum Welds - A
Review. Welding Research Council Bulletin, 290, 1 – 18.
Ding, D., Pan, Z., Cuiuri, D. and Li, H., 2014. A tool-path generation strategy for wire and
arc additive manufacturing. International Journal of Advanced Manufacturing Technology,
73, 173–183.
Ding, D., Zengxi, P., Cuiuri, D. and Huijin, L., 2015a. A multi-bead overlapping model for
robotic wire and arc additive manufacturing (WAAM). Robotics and Computer-Integrated
Manufacturing, 31, 101-110.
Ding, D., Pan, Z., Cuiuri, D. and Li, H., 2015b. Wire-Feed Manufacturing of Metal
Components: Technologies, Developments and Future Interest. The International Journal of
Advanced Manufacturing Technology, 81, 465 – 481.
Ding, D., Pan, Z., Cuiuri, D., Li, H., Van Duin, S. and Larkin, N., 2016. Bead modelling and
implementation of adaptive MAT path in wire and arc additive manufacturing. Robotics and
Computer-Integrated Manufacturing, 39, 32 – 42.

124
Ding, J., 2015. WAAM of complex cone structure with Al2319 alloy. Report Number
R/JD/18102015/v1 – LMUK . Cranfield: Welding Engineering and Laser Processing Centre,
Cranfield University.
Ding, J., Colegrove, P., Martina, F., Williams, S., Wiktorowicz, R. and Palt, M.R., 2015a.
Development of a laminar flow local shielding device for wire + arc additive manufacture.
Journal of Materials Processing Technology, 226, pp 99–105.
Ding, J., Martina, F. and Williams, S., 2015b. Production of large metallic components by
additive manufacture – Issues and Achievements In: 1st Metallic Materials and Processes:
Industrial Challenges. Deauville, France.
Dungore, P. and Agnihotri, A., 2008. Special Heat Treatment Practices for Aerospace
Aluminium Alloys. Heat Treatment Progress, 8(3), 35 – 38.
Dvornak, M.J., Frost, R.H., and Olson, D.L., 1991. Influence of Solidification Kinetics on
Aluminium Weld Grain Refinement. Welding Journal, 70, 271-s – 276-s.
Evers, S., Senöz, C. and Rohwerder, M., 2013. Hydrogen detection in metals: a review and
introduction of a Kelvin probe approach. Science and Technology of Advanced Materials, 14,
1 – 12.
Fang, X., Zhang, L., Li, H., Li, C., Huang, K., and Lu, B., 2018. Microstructure evolution and
mechanical behavior of 2219 aluminum alloys additively fabricated by the cold metal transfer
process. Materials, 11(5), 812 - 825.
Frazier, W.E., 2014. Metal Additive Manufacture: A Review. Journal of Materials
Engineering and Performance, 23(6), 1917 –1928.
Fronius International Gmb H., 2014. Cold Metal Transfer. Milton Keynes: Fronius.
Fukuda, T., 2012. Weldability of 7000 series aluminium alloy materials, Welding
International, 26(4), 256 – 269.

125
Ganesan, S. and Poirier, D.R., 1987. Densities of aluminum-rich aluminum-copper alloys
during solidification. Metallurgical Material Transactions A, 18 A(4), 721 – 723.
Gebhardt, A. 2001. Applications in: Understanding Additive Manufacturing - Rapid
Prototyping, Rapid Tooling, Rapid Manufacturing. 1st edn, München: Carl Hanser. pp 65 –
101.
Ghosh, 2017. Introduction to Gas Metal Arc Welding Process In: Pulse Current Gas Metal
Arc Welding: Characteristics, Control and Applications, Singapore: Springer, pp 1 – 30.
Gingell, A.B.D. and Gooch, T.G., 1998. Review of factors influencing porosity in aluminium
arc welds. TWI: Industrial Member Report, 625.
Gordon, W. A., 1967. STABILIZATION OF DC ARCS IN STATIC ARGON
ATMOSPHERES FOR USE IN SPECTROCHEMICAL ANALYSIS. Cleveland: Lewis
Research Centre.
Gowri, S. and Samuel, F., 1994. Effect of alloying elements on the solidification
characteristics and microstructure of Al- Si- Cu- Mg- Fe 380 alloy. Metallurgical and
Materials Transactions A, 25(2), 437 – 448.
Gregson, P.J., 1995. Aluminium alloys: physical metallurgy, processing and properties In:
Flower, H.M. (ed.) High Performance Materials in Aerospace, Netherlands: Springer
Netherlands, pp 1 – 48.
Gu, J., Ding, J.L., Cong, B., Bai, J., Gu, H., Williams, S.W. and Zhai, Y., 2015. The
Influence of Wire Properties on the Quality and Performance of Wire+Arc Additive
Manufactured Aluminium Parts. Advanced Materials Research 1081, 210 – 214.
Gu, J., Ding, J., Williams, S.W., Gu, H., Zhai, Y. and Ma, P., 2016a. The strengthening effect
of inter-layer cold working and post deposition heat treatment on the additively manufactured
Al-6.3Cu alloy. Material and Science Engineering A, 651, 18 – 26.

126
Gu, J., Ding, J., Williams, S.W., Gu, H., Ma, P. and Zhai, Y., 2016b. The effect of inter-layer
cold working and post deposition heat treatment on porosity in additively manufactured
aluminium alloys. Journal of Materials Processing Technology, 230, 26 – 34.
Guar, V., Enoki, M., Okado, T. and Yomogido, S., 2018. Fatigue life and crack growth
behaviour of post welded Aluminium AA5183 alloy. MATEC Web of Conferences, 165,
21013.
Harris, I.D., 1988. A review of literature on porosity formation and recommendations on the
avoidance of porosity in MIG welding. TWI: Industrial Member Report. 388.
Holmström, J., Partanen, J., Tuomi, J. and Walter, M., 2010. Rapid manufacturing in the
spare parts supply chain: Alternative approaches to capacity deployment. Journal of
Manufacturing Technology Management, 21(6), 687 – 697.
Hönnige, J.R., Colegrove, P.A., Ahmad, B., Fitzpatrick, M.E., Ganguly, S., Lee, T.L. and
Williams, S.W., 2018. Residual stress and texture control in Ti-6Al-4V wire + arc additively
manufactured intersections by stress relief and rolling. Materials and Design, 150, 193 – 205.
Horn, T.F. and Harrysson, O.L.A., 2012. Overview of current additive manufacturing
technologies and selected applications. Science Progress. 95(3), 255 – 282.
Huang, R., Riddle, M.E., Graziano, D., Das, S., Nimbalkar, S., Cresko, J. and Masanet, E.,
2017. Environmental and Economic Implications of Distributed Additive Manufacturing.
Journal of Industrial Ecology, 21, 130 – 142.
Hutt, G.A. and Lucas, W., 1982. Arc Disturbances in Consumable Electrode Welding – A
Review of the Literature. TWI Research Report 173/1982.
International Organization for Standardization, 1992. ISO 10049:1992(E): Aluminium alloy
castings -- Visual method for assessing the porosity. Geneva: ISO.

127
Jyogan, S., Kogane, K., Sasaba, S., Hirano, H., Ochiai, T. and Okita, T., 1998. Investigation
of the smut generation during welding aluminium with GMAW In: Joints in Aluminium –
Inalco ’98, Abington: Abington Publishing, pp 17 – 25.
Kalpakjian, S. and Schmid, S.R., 2016. Manufacturing Processes for Engineering Materials,
6th edn, London: Pearson, pp 86 – 138.
Kazanas, P., Deherkar, P., Almeida, P., Lockett, H. and Williams, S., 2012. Fabrication of
geometrical features using wire and arc additive manufacture. Journal of Engineering
Manufacture, 226(6), 1042 – 1051.
Kempen K., Thijs L., Van Humbeeck J. and Kruth J.P, 2015. Processing AlSi10Mg by
selective laser melting: Parameter optimisation and material characterisation. Materials
Science and Technology, 31, 917 – 923.
Kloprogge, J.T., Duong, L.V., Wood, B.J. and Frost, R.L., 2006. XPS study of the major
minerals in bauxite: Gibbsite, bayerite and (pseudo-)boehmite. Journal of Colloid and
Interface Science, 296(2), 572 – 576.
Komori, K., 1999. Simulation of chevron crack formation and evolution in drawing.
International Journal of Mechanical Sciences. 41. 1499 – 1513.
Kou, S. and Wang, Y.H., 1986. Weld Pool Convection and Its Effect, Welding Journal, 65,
63–70.
Kumar, R., Dilthey, U., Dwivedi, D.K. and Ghosh, P.K., 2009. Thin Sheet Welding of Al
6082 Alloy by AC Pulse-GMA and AC Wave Pulse-GMA Welding. Materials & Design,
30(2), 306 – 313.
Lancaster, J. F., 1984. The physics of welding. Physics in Technology, 15, 73 – 79.
Lancaster, J. F. (ed.), 1986. The Electric Arc in Welding In: The Physics of Welding, 2nd edn.
Oxford: Pergamon Press. pp 146 – 227.

128
Lancaster, J.F., 1999. Metallurgy of Welding, 6th edn, Cambridge: Woodhead Publishing/
Laslaz, G. and Laty, P., 1991. Gas Porosity and Metal Cleanliness in Aluminium Castings
Alloys. AFS Transactions, 1991, 40, 83 – 90.
Leary, M., Merli, L., Torti, F., Mazur, M. and Brandt, M., 2014. Optimal topology for
additive manufacture: A method for enabling additive manufacture of support-free optimal
structures. Materials and Design, 63, 678 – 690.
Lee, H.K., Park, S.H. and Kang, C.Y., 2015. Effect of plasma current on surface defects of
plasma-MIG welding in cryogenic aluminum alloys. Journal of Materials Processing
Technology, 223, 203 – 215.
Lee, H.K., Yoon, T.J. and Kang C.Y., 2015. Analysis of Smut Formation Phenomena on
MIG and Plasma-MIG Hybrid Weld of Cryogenic Al-Mg Alloy. Korean Journal of Metal
Materials, 54(2), 79 – 99.
Lequeu, P., Lassince, P. and Warner, T., 2007. Aluminium alloy development for the Airbus
380 – Part 2. Advanced Materials and Processing, 165(7), 41 – 44.
López, G.P., Castner, D.G., Ratner, B.D., 1991. XPS O 1s binding energies for polymers
containing hydroxyl, ether, ketone and ester groups. Surface and Interface Analysis, 17, 267–
272.
Losapio, D. and Martina, F., 2015. Design and topology optimisation of an air spring member
for Wire+Arc Additive Manufacturing. Report Number C70R1. Cranfield: Welding
Engineering and Laser Processing Centre, Cranfield University.
Ma, Y., Cuiuri, D., Hoye, N., Li, H. and Pan, Z., 2014. Effects of wire feed conditions on in
situ alloying and additive layer manufacturing of titanium aluminides using gas tungsten arc
welding. Journal of Materials Research, 29, 2066 – 2071.

129
Ma, Y., Cuiuri, D., Li, H., Pan, Z. and Shen, C., 2016. The effect of postproduction heat
treatment on γ-TiAl alloys produced by the GTAW-based additive manufacturing process.
Materials Science and Engineering A, 657, 86 – 95.
Mamat, S.B., Tashiro, S., Tanaka, M. and Yusoff, M., 2018. Study on factors affecting the
droplet temperature in plasma MIG welding process, Journal of Physics D: Applied
Physics, 51, 135206.
Mamat, S.B., Methong, T., Tashiro, S. and Tanaka, M., 2017. Droplet Temperature
Measurement in Metal Inert Gas Welding Process by Using Two Color Temperature
Measurement Method. Journal of the Japan Welding Society, 35(2), 160s – 164s.
Martina, F., Mehnen, J., Williams, S.W., Colegrove, P., and Wang, F., 2012. Investigation of
the benefits of plasma deposition for the additive layer manufacture of Ti-6Al-4V. Journal of
Materials Processing Technology, 212(6), 1377 – 1386.
Martina, F., Williams, S.W. and Colegrove, P., 2013. Improved Microstructure and Increased
Mechanical Properties of Additive Manufacture Produced Ti-6Al-4V by Interpass Cold
Rolling. Proceedings of the 24th International Solid Freeform Fabrication Symposium,
Austin, USA, pp 490 – 496.
Makhnev, M.I., Zharov, L.F., Lebedev, N.M. and Zhironva, T.I., 2010. Production of
Welding Wire with Ultrasonic Removal of Surface Lubricant Residues. Steel in Translation,
40(7), 667 – 668.
Masubuchi, K., 1972. Integration of NASA-sponsored studies on aluminium welding. NASA
Technical Report, NASA CR-2064.
Mathers, G., 2002. Welding of Aluminium and Its Alloys. Cambridge: Woodhead Publishing.
Matz, C. and Wilhelm, G., 2012. Improved arc stability in aluminium welding by oxygen
doping of inert shielding gas. Welding International, 26(5), 335 – 338.

130
Mazur, M., 1992. Porosity in Aluminium Welds. Welding International, 6(12), 929 – 931.
McAndrew, A. R., Alvarez Rosales, M., Colegrove, P. A., Hönnige, J. R., Ho, A., Fayolle,
R., Eyitayo, K., Stan, I., Sukrongpang, P., Crochemore, A. and Pinter, Z., 2018. Interpass
rolling of Ti-6Al-4V wire + arc additively manufactured features for microstructural
refinement. Additive Manufacturing, 21, 340–349.
Melton, G., 2011. A Preliminary Investigation into Welding Fume Formation for MIG/MAG
Welding. TWI Research Report 980/2011.
Modenesi, P.J and de Avelar, R.C., 1999. The influence of small variations of wire
characteristics on gas metal arc welding process stability. Journal of Materials Processing
Technology, 86, 226 – 232.
Modenesi, P.J., and Nixon, J.H., 1994. Arc Instability Phenomena in GMA welding. Welding
Journal, 73, 219-s – 224-s.
Mohler, R. 1983. Technology of Welding Arc Behaviour In: Practical Welding Technology.
New York: Industrial Process Inc. pp 1 – 17.
Mujahid, M., Engel, N. N. and Chia, E. H., 1979. Effect of alloying elements on the
conductivity of aluminum alloys. Scripta Metallurgica, 13(9), 887 – 893.
Murty, S.V.S.N., Sarkar, A., Narayanan, P.R., Venkitakrishnan, P.V. and Mukhopadhyay, J.,
2016. Microstructure and micro-texture evolution during large strain deformation of
aluminium alloy AA 2219. Materials Science and Engineering A, 677, 41–49.
NIR Board of Consultants & Engineers, 2011. Extrusion and Drawing In: The Complete
Book of Ferrous, Non-Ferrous Metals with Casting and Forging Technology. Delhi: NIR
Project Consultancy Services, pp 420 – 486.
131
O’Regan, P., Prickett, P., Setchi, R., Hankins, G. and Jones, N., 2016. Metal Based Additive
Layer Manufacturing: Variations, Correlations and Process Control, In: Procedia Computer
Science, 96, 216–224.
Olefjord, I., Mathieu, H.J. and Marcus, P., 1990. Intercomparison of surface analysis of thin
aluminium oxide films. Surface and Interface Analysis, 15(11), 681 – 692.
Onishi, H., Egawa, C., Aruga, T. and Iwasawa, Y., 1987. Adsorption of Na atoms and
oxygen-containing molecules on MgO (100) and (111) surfaces. Surface Science, 191(3), 479
– 491.
Padowicz, H. N., 1942. Diamond Dies for the High-Speed Drawing of Copper Wire. The Bell
System Technical Journal, 21, 20 – 36.
Pal, K. and Pal, S.K., 2011. Effect of Pulse Parameters on Weld Quality in Pulsed Gas Metal
Arc Welding: A Review. Journal of Materials Engineering and Performance, 20(6), 918 –
931.
Peel, C.J. and Gregson, P.J., 1995. Design Requirements for aerospace structural materials In:
Flower, H.M. (ed.) High Performance Materials in Aerospace, Netherlands: Springer
Netherlands, pp 1 ‒ 48.
Perea, L., 2015. An Evaluation of the Microstructure of a Wire and Arc Additive
Manufactured Aluminium Alloy. MEng Thesis. Guildford: University of Surrey.
Peters, C.G., Emerson, W.B., Nefflen, K.F., Harris, F.K. and Cooter, I.L., 1947. Electrical
Methods for Diamond-Die Production. Journal of Research of the National Bureau of
Standards, 38, 449 – 464.
Petrovic, V., Vicente Haro Gonzalez, J., Jordá Ferrando, O., Delgado Gordillo, J., Ramon
Blasco Puchades, J. and Portoles Grinan, L., 2011. Additive layered manufacturing: Sectors
of industrial application shown through case studies. International Journal of Production
Research, 49(4), 1061 – 1079.
132
Pickin, C.G., Williams, S.W. and Lunt, M., 2011. Characterisation of the cold metal transfer
(CMT) process and its application for low dilution cladding. Journal of Materials Processing
Technology, 211, 496 – 502.
Polmear, I.P., 2006. Light Alloys: From traditional alloys to nanocrystals, 4th edn, Oxford:
Butterworth Heinemann.
Raju, P.N., Rao, K.S., Reddy, G.M. Kamaraj, M. and Rao, K.P., 2009. Microstructure and
high temperature strength of age hardenable 2219 aluminium alloy modified by Sc, Mg and
Zr additions. Materials Science and Technology, 25, 92 – 101.
Reddy, G.M., Gokhale, A., Saxena, V.K. and Rao, K. P., 2000. Effect of welding techniques
on microstructure and mechanical properties of aluminium-lithium alloy welds. Materials
Science Forum, 3131, 1751 – 1756.
Reichelt, W.R., Evancho, J.W. and Hoy, M.G., 1980. Effects of Shielding Gas on Gas Metal
Arc Welding Aluminium. Welding Journal, 59(5), 147-s – 155s.
Reis, R.P., Souza, D. and Scotti, A., 2011. Models to describe plasma jet, arc trajectory and
arc blow formation in arc welding. Welding in the World, 55(3), 24 – 32.
Rudy, J.F. and Rupert, E.J., 1970. Effect of Porosity on Mechanical Properties of Aluminium
Welds. Welding Journal, 49, 332-s – 337-s.
Ryazantsev, I. and Fedoseev, V.A., 2002. Metallurgical and technological porosity of
aluminium alloys in arc welding. Welding International, 16(4), 320 – 324.
Saint John, D.B., Joshi, S. B., Simpson, T. W., Qu, M., Rowatt, J. D. and Lou, Y., 2016. A
Preliminary Examination of Variability Due to Build Location and Powder Feedstock in
Additive Manufacture of Inconel 718 using Laser-Based Powder Bed Fusion. Proceedings of
the 27th Annual International Solid Freeform Fabrication Symposium, Austin, USA, pp 542
– 557.

133
Sarrafi, R. and Kovacevic, R., 2010. Cathodic Cleaning ox Oxides from Aluminium Surface
by Variable-Polarity Arc, 89, 1-s – 10-s.
Seifi, M., Salem, A., Beuth, J., Harrysson, O. and Lewandowski, J.J., 2016. Overview of
Materials Qualification Needs for Metal Additive Manufacturing. JOM, 68(3), 747 – 763.
Seifi, M., Gorelik, M., Waller, J., Hrabe, N., Shamsaei, N., Daniewicz, S. and Lewandowski,
J.J., 2017. Progress Towards Metal Additive Manufacturing Standardization to Support
Qualification and Certification. JOM, 69(3), 439 – 455.
Shankar, S., Riddle, Y. W. and Makhlouf, M.M., 2004. Eutectic Solidification of Aluminium-
Silicon Alloys. Metallurgical and Materials Transactions A: Physical Metallurgy and
Materials Science, 35A(9), 3038-3043.
Shen, C., Pan, Z., Cuiuri, D., Roberts, J. and Li, H., 2015. Fabrication of Fe-FeAl
Functionally Graded Material Using the Wire-Arc Additive Manufacturing Process.
Metallurgical and Materials Transactions B, 47, 763 – 772
Shore, R.J. and McCaulay, R.B., 1970. Effects of porosity on high strength aluminium 7039.
Welding Journal, 49, 311-s – 321-s.
Shtrikman, M.M., Pinskii, A.V., Filatov, A.A., Koshkin, V.V., Mezentseva, E.A. and Guk,
N.V., 2011. Methods for reducing weld porosity in argon-shielded arc welding of aluminium
alloys. Welding International, 25, 457–462.
Smith G.C., 2005. Evaluation of a simple correction for the hydrocarbon contamination layer
in quantitative surface analysis by XPS. Journal of Electron Spectroscopy and Related
Phenomena, 148, 21 – 28.
Soderstrom, E. J., Scott, K. M. and Mendez, P. F., 2011. Calorimetric Measurement of
Droplet Temperature in GMAW. Welding Journal, 90, 77-s – 83-s.
Staley, J. and Lege, D., 1993. Advances in aluminium alloy products for structural
applications in transportation. Journal de Physique IV Colloque, 03(C7), C7-179 – C7-190.

134
Stefanescu, D.M., 2002. Macro-mass transport In: Science and engineering of casting
solidification, London: Klewer Academics and Plenum Publishers, pp 31 – 71.
Sterjovski, Z., Norrish, J. and Monaghan, B. J., 2010. The Effect of Voltage and Metal
Transfer Mode on Particulate Fume Size During the GMAW of Plain Carbon Steel, 9, 249 ‒
246.
Suban, M. and Tušek, J., 2003. Methods for the determination of arc stability. Journal of
Materials Processing Technology, 143, 430 – 437.
Sugiyama, Y., Nakata, J. and Miyauchi, H., 1993. Reducing smut in aluminium alloy welds
using double wire MIG (DVM) welding. Welding International, 7(3), 177 – 182.
The Aluminium Association, 2002. Additional Operations In: Welding Aluminium, Theory
and Practice, 4th edn, Miami: The Aluminium Association, 5.1 – 5.4.
The Aluminium Association, 2005. International Alloy Designations and Chemical
Composition Limits for Wrought Aluminium and Aluminium Alloys.
Thomas, D.S. and Gilbert, S.W., 2014. Costs and Cost Effectiveness of Additive
Manufacturing. NIST Special Publication 1176.
Toda, H., Hidaka, T., Kobayashi, M., Uesugi, K., Takeuchi, A. and Horikawa, K., 2009.
Growth behaviour in hydrogen micropores in aluminium-temperature exposure. Acta
Materialia, 57, 2277 – 2290.
Tong, J., Ueyama, T., Tanaka, M. and Ushio, M., 2005. Observations of the phenomenon of
abnormal arc voltage occurring in pulsed metal inert gas welding of aluminium alloy. Science
and Technology of Welding, 10(6), 695 – 700.
Tuschel, D., 2016. Photoluminescence Spectroscopy Using a Raman Spectrometer.
Spectroscopy, 31(8), 14 – 21.

135
Turner, J. R. and Thayer, J. F., 2001. Introduction to analysis of variance design, analysis &
interpretation. London: Sage Publications Inc.
Villafuerte, J.C. and Kerr, H.W., 1990. Electromagnetic Stirring and Grain Refinement in
Stainless Steel GTA Welds. Welding Journal, 69, s1 – s13.
Vykydal, D., Fabik, R. and Kelblerova, M., 2011. Cost-Orientated FMEA of Hot Rolled Wire
Production. METAL 2011: 20th Anniversary International Conference on Metallurgy and
Materials, Brno Czech Republic, Tanger, pp 1310-1317.
von Zeppelin, F., Haluška, M. and Hirscher, M., 2003. Thermal desorption spectroscopy as a
quantitative tool to determine the hydrogen content in solids. Thermochimica Acta, 404, 251
– 258.
Wagner, C.D., Davis, L.E. and Riggs, W.M., 1980. The energy dependence of the electron
mean free path. Surface and Interface Analysis, 2(2), 53 – 55.
Wagner, D.C., Kang, Y.K. and Kou, S., 2013. Spatter and Porosity in Gas-Metal Arc
Welding of Magnesium Alloys: Mechanisms and Elimination. Welding Journal, 92, 347-s –
362-s.
Wang, F., Williams, S. and Rush, M., 2011. Morphology investigation on direct current
pulsed gas tungsten arc welded additive layer manufactured Ti6Al4V alloy. International
Journal of Advanced Manufacturing Technology, 57(5), 597 – 603
Wang, B., Xue, S., Ma, C., Wang, J. and Lin, Z., 2017. Study in Wire Feedability-Related
Properties of Al-5Mg Solid Wire Electrodes Bearing Zr for High Speed Train. Metals, 7, 520
– 534.
Wang, L. and Xue, J., 2017. Perspective on Double Pulsed Gas Metal Arc Welding, Applied
Sciences, 7, 894 – 912.

136
Wang, Q.C., Apelian, D. and Lados, D.A., 2001. Fatigue behavior of A356-T6 aluminum cast
alloys. Part I. Effect of casting defects. Journal of Light Metals, 1, 73 – 84.
Wilde, M. and Fukutani, K., 2014. Hydrogen detection near surfaces and shallow interfaces
with resonant nuclear reaction analysis. Surface Science Reports, 69(4), 196 – 295.
Williams, S.W., Martina, F., Addison, A.C., Ding, J., Pardal, G. and Colegrove, P., 2015.
Wire + arc additive manufacturing. Materials Science and Technology, 32(7), 641 – 647.
Williams, S.W., Martina, F., Addison, A. C., Ding, J., Pardal, G. and Colegrove, P., 2015.
Wire + arc additive manufacturing. Materials Science and Technology, 32(7), 641 – 647.
Wohlers, T., Campbell, I., Diegel, O., Kowen, J. and Caffrey, T., 2017. Wohlers Report 2017.
3D Printing and Additive Manufacturing State of the Industry. Fort Collins: Wohlers
Associates.
Woods, R. A., 1974. Porosity and Hydrogen Absorption in Aluminium Welds. Welding
Journal, 53(3), 97s – 108s.
Woods, R. A., 1980. Metal transfer in aluminium alloys. Welding Journal, 59(2), 59-s – 66-s.
Wu, C., Zou, D. and Gao, J., 2008. Determining the critical transition current for metal
transfer in gas metal arc welding (GMAW). Frontiers of Materials Science in China, 4, 397 ‒
401.
Xiong, J., Yin, Z. and Zhang, W., 2016. Closed-loop control of variable layer width for thin-
walled parts in wire and arc additive manufacturing. Journal of Materials Processing
Technology, 233, 100 – 106.
Xiong, J., Li, Y., Li, R. and Yin, Z., 2018. Influences of process parameters on surface
roughness of multi-layer single-pass thin-walled parts in GMAW-based additive
manufacturing. Journal of Materials Processing Technology, 252, 128 – 136.
137
Yamazaki, K., Yamamoto, E., Suzuki, K, Koshiishi, F., Waki, K., Tashio, S., Tanaka, M. and
Nakata, K., 2010. The measurement of metal droplet temperature in GMA welding by
infrared two-colour pyrometry, Welding International, 24(2), 81 – 87.
Yilmaz, O. and Ugla, A.A., 2016. Shaped metal deposition technique in additive
manufacturing: A review. Proceedings of the Institution of Mechanical Engineers, Part B:
Journal of Engineering Manufacture, 230(10), 1781 – 1798.
Zähr, J., Oswald, S., Türpe, M., Ullrich, H. J. and Füssel, U., 2012. Characterisation of oxide
and hydroxide layers on technical aluminum materials using XPS. Vacuum, 86, 1216 – 1219.
Zhang, C., Li, Y., Gao, M. and Zeng, X., 2018. Wire arc additive manufacturing of Al-6Mg
alloy using variable polarity cold metal transfer arc as power source. Materials Science and
Engineering A, 711, 415 – 423.
Zhang, W., Zhao, Y., Zhang, D., Luo, Z., Yang, C and Li, Y., 2017. The effect of Si addition
on the microstructure and tensile properties of casting Al-5.0Cu-0.6Mn-1.2Fe alloys.
Transactions of Nonferrous Metals Society of China, 28(6), 1061 – 1072.
Zielinski, A., 1998. Hydrogen-enhanced stress-corrosion cracking of aluminium alloys.
Material Science, 34(4), 469 – 475.
Zinke, M. and Schröder, J., 2004. Effects of different surface finishes of high-alloy solid-wire
electrodes in gas-shielded metal-arc welding. Welding and Cutting, 3(6), 347 – 350.

138
Appendix A: Published Work and Conference Presentations
The following lists contains published work and conference presentations that are related to
this thesis. Published and submitted journal papers can be found in Appendix B of this thesis.
Publications
Ryan, E.M., Sabin, T.S., Watts, J.F. and Whiting, M.J., 2018. The influence of build
parameters and wire batch on porosity of wire and arc additive manufactured aluminium
alloy 2319. Journal of Materials Processing Technology, 262, 577 – 584.
Ryan, E.M., Sabin, T.S., Watts, J.F. and Whiting, M.J., 2018. The relationship between
surface deposit coverage and porosity in wire and arc additive manufactured aluminium alloy
2319. Proceedings of the 16th International Conference of Aluminium Alloys, Montreal,
Canada.
Ryan, E.M., Crean, C., Cox, D., Sabin, T.S., Watts, J.F. and Whiting, M.J., 2018. On the
nature of the surface deposit on wire and arc additive manufactured aluminium alloys.
Journal of Materials Science (submitted).
Presentations
Ryan, E. M., Sabin, T S., Watts, J.F. and Whiting, M.J., 2018. The relationship between
surface deposit coverage and porosity in wire and arc additive manufactured aluminium alloy
2319. 16th International Conference of Aluminium Alloys, Montreal, Canada.
Ryan, E. M., 2016. Space Applications for Wire and Arc Additive Manufacturing. Reinventing
Space 2016, London, U.K.
(INVITED) Ryan, E. M., 2016. Wire Arc Additive Manufacture: The Future of Medium-
Large Component Production in Aerospace. Additive Manufacturing for Aerospace. Defence
and Space Summit 2016, London, U.K.

139
Ryan, E. M., Burnage, S., Watts, J. F. and Whiting, M. J., 2015. The Effect of Input
Parameters on Wire and Arc Additive Manufacturing. Defence and Security Doctoral
Symposium 2015, Shrivenham, U.K.
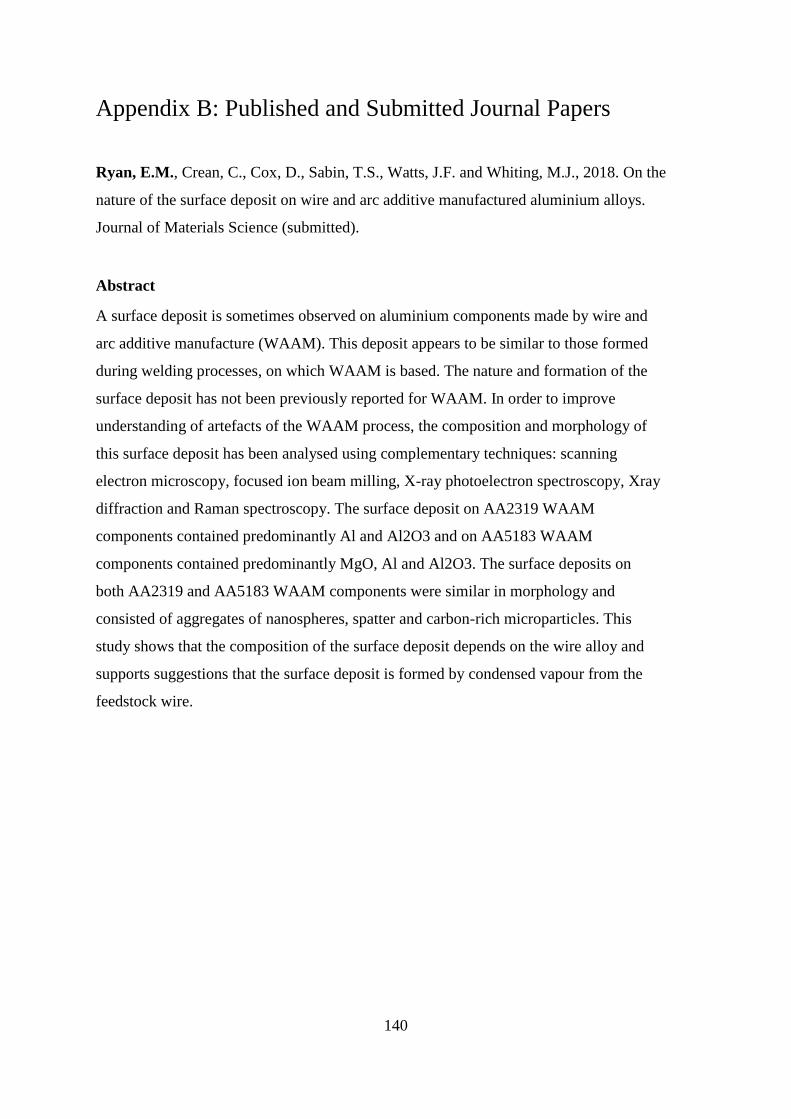
140
Appendix B: Published and Submitted Journal Papers
Ryan, E.M., Crean, C., Cox, D., Sabin, T.S., Watts, J.F. and Whiting, M.J., 2018. On the
nature of the surface deposit on wire and arc additive manufactured aluminium alloys.
Journal of Materials Science (submitted).
Abstract
A surface deposit is sometimes observed on aluminium components made by wire and
arc additive manufacture (WAAM). This deposit appears to be similar to those formed
during welding processes, on which WAAM is based. The nature and formation of the
surface deposit has not been previously reported for WAAM. In order to improve
understanding of artefacts of the WAAM process, the composition and morphology of
this surface deposit has been analysed using complementary techniques: scanning
electron microscopy, focused ion beam milling, X-ray photoelectron spectroscopy, Xray
diffraction and Raman spectroscopy. The surface deposit on AA2319 WAAM
components contained predominantly Al and Al2O3 and on AA5183 WAAM
components contained predominantly MgO, Al and Al2O3. The surface deposits on
both AA2319 and AA5183 WAAM components were similar in morphology and
consisted of aggregates of nanospheres, spatter and carbon-rich microparticles. This
study shows that the composition of the surface deposit depends on the wire alloy and
supports suggestions that the surface deposit is formed by condensed vapour from the
feedstock wire.
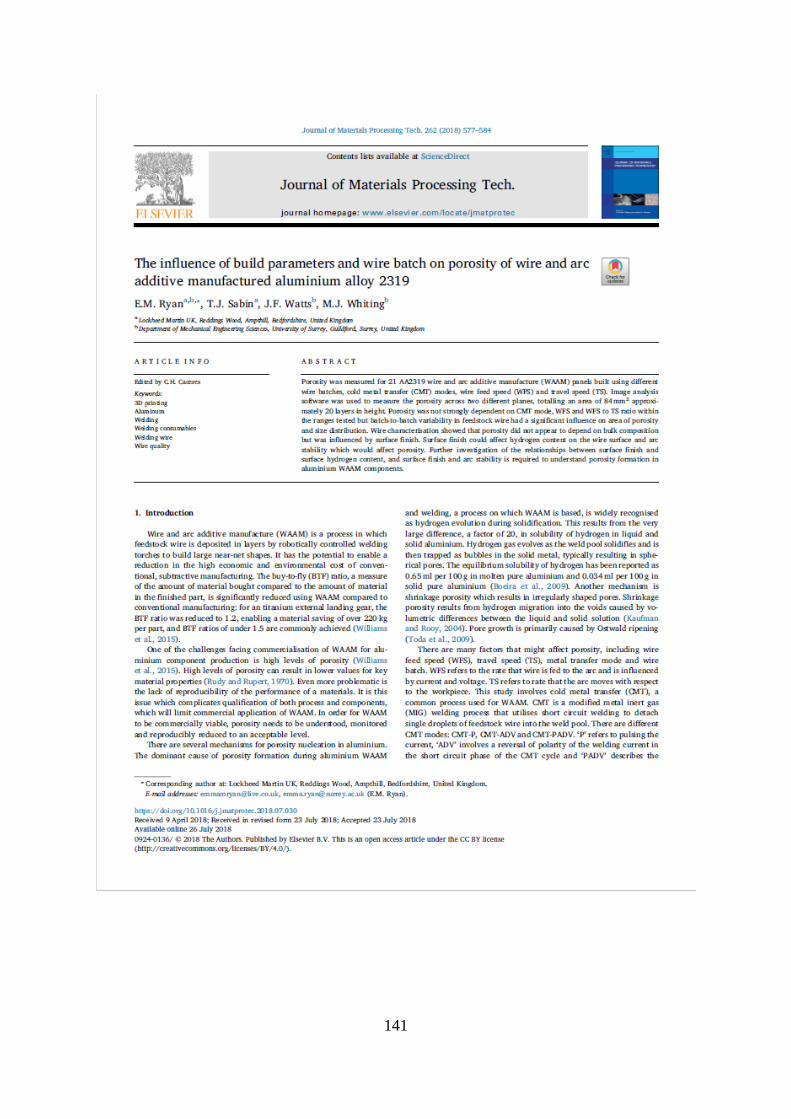
141

142

143

144

145

146
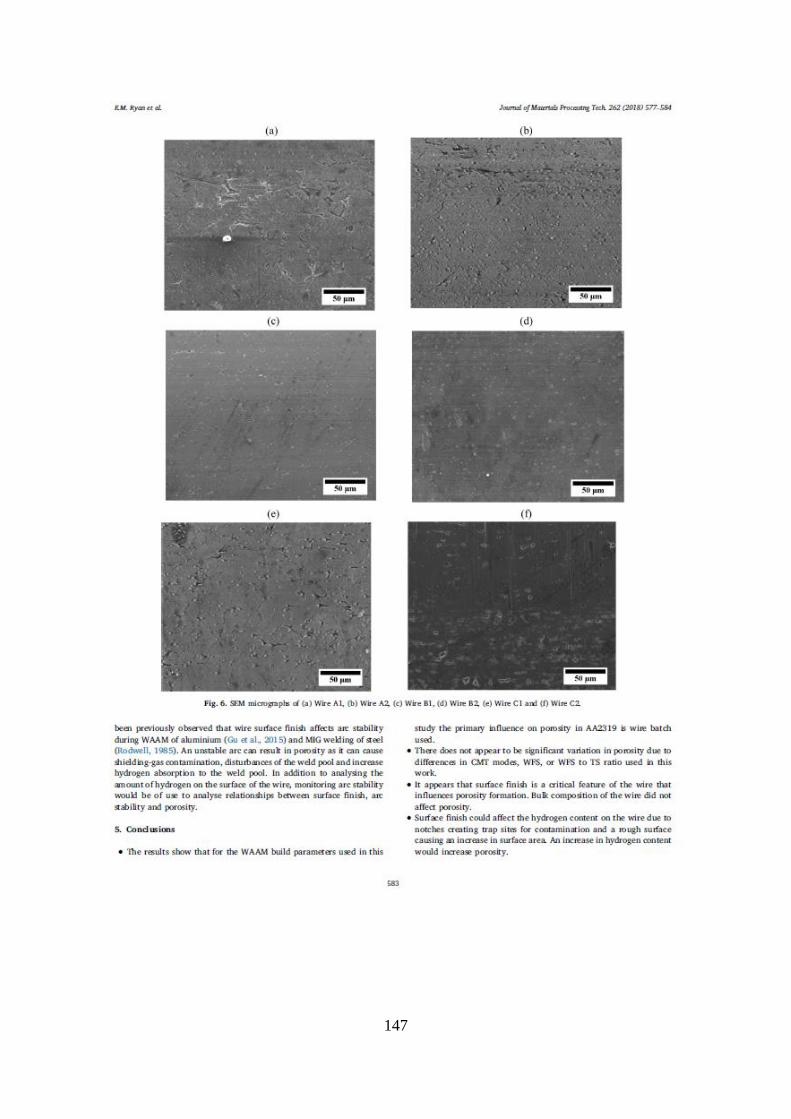
147

148