one · 2020-03-22 · chapter one • the definition and measurement of concepts . 3. mean...
TRANSCRIPT

1
Get the edge on your studies. edge.sagepub.com/pollock
• Take a quiz to find out what you’ve learned.
• Review key terms with eFlashcards.
• Watch videos that enhance chapter content.
Think for a moment about the variety of political deci-sions that people make. Perhaps most obviously, we vote
in elections. But before we vote, we can show our support for a candidate by attending a campaign event, putting up a yard sign, or encouraging friends to vote for our preferred candidate. Those elected decide which bills they’ll sponsor and support. The effects of bills that become laws depend on how they’re funded and enforced, whether judges decide to strike them down, whether legislators decide to amend them, not to mention decisions made by presidents, gover-nors, bureaucrats, and special interest groups. All these deci-sions require people to evaluate different options (including the possibility of not deciding) and determine which option they prefer. Politics, after all, is all about making choices.
Our preferences help us discuss and describe the world. It is virtually impossible to think about people, places, or things without mentally sorting them according to whether we like them or not and how strongly we like or dislike them. You use your preferences to vote for your preferred candidate on a ballot, decide what to order on a menu, or pick a show to watch on Netflix. Your feelings about things, however, are not tangible and concrete the way the people and things you evaluate are. You cannot see or hear a “preference” the same way you can a pro-gun candidate or a gun permit. Preference is a concept, an idea or mental construct that organizes, maps, and helps us understand phenomena in the real world and make choices. You can sort and organize objects according to your pref-erences, mentally separating things you like from things you dislike, then perhaps further separating the things you really like from the things you just like, and so on. Of course, personal preference is not the only criterion for a mental map of the world; for example, you could sort and organize things according to their weight, commer-cial value, or how politically controversial they are. Some political concepts are quite complicated: “globalization,” “power,” “democratization.” Others, such as “political par-ticipation” or “social status,” are somewhat simpler.
CHAPTER ONE
THE DEFINITION AND MEASUREMENT OF CONCEPTS
Learning Objectives
In this chapter you will learn:
• How to clarify the meaning of concepts
• How to identify multidimensional concepts
• How to write a definition for a concept
• How systematic error affects the measurement of a concept
• How random error affects the measurement of a concept
• How to recognize problems of reliability and validity
Copyright ©2020 by SAGE Publications, Inc. This work may not be reproduced or distributed in any form or by any means without express written permission of the publisher.
Do not
copy
, pos
t, or d
istrib
ute

2 The essenTials of PoliTical analysis
Whether simple or complicated, concepts are everywhere in political debate, in journalistic analysis, in ordinary discussion, and, of course, in political research. How are concepts used? In partisan or ideological debate—debates about values—concepts can evoke powerful symbols with which people easily identify. A political candidate, for example, might claim that his or her agenda will ensure “freedom,” create “equality,” or foster “self-determination” around the globe. These are evoca-tive ideas, and they are meant to be. In political research, concepts are not used to stir up primitive emotional responses. Quite the opposite. In empirical political science, concepts refer to facts, not values. When political researchers discuss ideas like “free-dom,” “equality,” or “self-determination,” they are using these ideas to summarize, label, and understand observable phenomena and tangible things in the real world.
The primary goals of political research are to describe concepts and to analyze the relationships between them. A researcher may want to know, for example, if social trust is declining or increasing in the United States, whether political elites are more tolerant of dissent than are ordinary citizens, or whether economic develop-ment causes democracy. A conceptual question, a question expressed using ideas, is frequently unclear and thus is difficult to answer empirically. A concrete question, a question expressed using tangible properties, can be answered empirically. To take a scientific approach to politics, one should try to turn conceptual questions into con-crete questions. We don’t work on concrete questions because we’re not interested in concepts. Nothing could be further from the truth. Because concepts are important, we want to study them productively to better understand the world.
The tasks of describing and analyzing concepts—social trust, political elites, tolerance of dissent, economic development, democracy, and any other concepts that interest us—present formidable obstacles. In her path-breaking book, The Concept of Representation, Hanna Pitkin describes the challenge of defining concepts such as “representation,” “power,” or “interest.” She writes that instances “of representation (or of power, or of interest) . . . can be observed, but the observation always presup-poses at least a rudimentary conception of what representation (or power, or inter-est) is, what counts as representation, where it leaves off and some other phenomenon begins.”1 We need to somehow transform concepts into concrete terms, to express vague ideas in such a way that they can be described and analyzed.
Conceptual definitions are covered in depth in the first part of this chapter. A conceptual definition clearly describes the concept’s measurable properties and specifies the units of analysis (e.g., people, nations, states, and so on) to which the concept applies. Having clarified and defined a concept, we must then describe an instrument for measuring the concept in the real world. An operational definition describes the instrument to be used in measuring the concept and putting a concep-tual definition “into operation.”
Yet in describing a measurement strategy, we keep an eye trained on the con-ceptual world: Does this operational definition accurately reflect the meaning of the concept? In this chapter we consider problems that can emerge when researchers decide on an operational definition. In Chapter 2 we take a closer look at variables, the concrete measurements of concepts.
CONCEPTUAL DEFINITIONS
As we stated in the chapter introduction, a conceptual definition clearly describes the concept’s measurable properties and specifies the units of analysis to which the concept applies. It is important to clearly define concepts because the same con-cept can, and often does, mean something different in one context than another or
Copyright ©2020 by SAGE Publications, Inc. This work may not be reproduced or distributed in any form or by any means without express written permission of the publisher.
Do not
copy
, pos
t, or d
istrib
ute

chaPTer one • The DefiniTion anD MeasureMenT of concePTs 3
mean different things to different people. Researchers define concepts to make their intended meaning clear to others. If a word or concept means different things to different people, research is likely to be misunderstood.
For example, we could ask you, “Are women more liberal than men? Yes or no?” You might reply, “It depends on what you mean by liberal.” This is a conceptual question because it uses the intangible term liberal and thus does not readily admit to an empirical answer. Are we asking if women are more likely than men to support abortion rights, gun control, government support of education, spending to assist poor people, environmental protection, affirmative action, gay and lesbian rights, funding for drug rehabilitation, or what? Do we mean all these things, some of these things, none of these things, or something else entirely? For some, “liberal” may mean support for gun control. For others, the concept might refer to support for environmental protection. Still others might think the real meaning of liberalism is support for government spending to assist the poor.
Consider, then, the following conceptual definition of liberalism: Liberalism is the extent to which individuals express support for increased government spend-ing for social programs. We might be able to improve this definition, but it’s a good start. This statement clarifies an abstract political preference, liberalism, by making reference to a measurable attribute—expressing support for government spending on social programs. Someone’s preference for liberal policies is abstract and not directly observable, so we focus on what we can observe, like someone’s expressing support for government social programs in response to a survey. Notice the words, “the extent to which.” This phrase suggests that the concept’s measurable attribute—expressing support for government spending—varies across people. Someone who expresses support for government spending is more “liberal” than someone who does not support government spending. It is clear, as well, that this particular defini-tion is meant to apply to individuals.2
The conceptual definition of liberalism we have proposed clarifies what liberal-ism means to us and suggests a way of measuring it. Without a conceptual definition, we cannot hope to answer the question “Are women more liberal than men?”; having defined the concept of liberalism, the question is now answerable. As you can see, in thinking about concepts and defining them, we keep an eye trained on the empirical world: What are the concrete, measurable characteristics of this concept? The first step in defining a concept is to clarify its empirical meaning.
Clarifying a Concept
To clarify a concept, it is often useful to make an inventory of the concept’s concrete properties. After settling on a set of properties that best represent the concept, we write down a definition of the concept. This written definition com-municates the subjects to which the concept applies and suggests a measurement strategy. Let’s illustrate these steps by working through the example introduced earlier: liberalism.
The properties of a concept must have two characteristics. They must be con-crete, and they must vary. The abstract term liberal must represent some measurable characteristics of people. After all, when we say that a person or group of people is “liberal,” we must have some attributes or characteristics in mind. Someone’s liberal preferences may be revealed by the choices they make or other characteristics we can observe about them. Moreover, liberalism varies among people. That is, some people have more (or less) of the measurable attributes or characteristics of liberals than other people do. In clarifying a concept, then, we want to describe characteristics that are concrete and variable. What, exactly, are these characteristics?
Copyright ©2020 by SAGE Publications, Inc. This work may not be reproduced or distributed in any form or by any means without express written permission of the publisher.
Do not
copy
, pos
t, or d
istrib
ute

4 The essenTials of PoliTical analysis
The mental exercise of making an inventory of a concept’s properties can help you to identify characteristics that are concrete and variable. Think of two cases that are polar opposites with respect to the concept of interest. In this example, we are interested in defining liberalism among individuals, so at one pole we imagine the stereotypical liberal who has all the tell-tale characteristics of liberalism. At the other pole, we imagine the archetype of conservativism who is the antithesis of the liberalism. What images of a perfectly liberal person do you see in your mind’s eye? What images of a perfect opposite, an antiliberal or conservative, do you see?3
For each case, the liberal and the conservative, we make a list of observable characteristics. In constructing these lists, be open and inclusive. This a creative, idea-generating exercise so allow yourself to brainstorm even if it means some coloring outside the lines. Here is an example of an inventory of measurable proper-ties you might come up with:
A liberal:
• Has low income
• Is a young person
• Lives in a city
• Favors economic regulations
• Expresses support for government-funded health care and public education
• Attends demonstrations in support of women and immigrants
• Believes free market capitalism is unfair and causes inequality
• Donates money to liberal causes
• Votes for Democrats
• Watches Modern Family, MSNBC
• Is vegetarian, drives a hybrid car
• Listens to urban music
A conservative:
• Has high income
• Is an older person
• Lives in the suburbs or a rural area
• Favors free market enterprise
• Expresses opposition to government-funded health care, support for school vouchers
• Attends demonstrations in support of the Tea Party and conservative causes
• Believes free market capitalism is fair and reduces inequality
• Donates money to conservative causes
• Votes for Republicans
• Watches Duck Dynasty, Fox News
• Plays golf, drives an SUV
• Listens to country music
Brainstorming the measurable properties of a concept is an open-ended pro-cess, and it always produces the raw materials from which a conceptual definition can be built. Once the inventory is made, however, we need to become more critical and discerning. Three problems often arise during the inventory-building process. First, we might think of empirical attributes that are only loosely related to the con-cept of interest. Second, the inventory may include concepts rather than measurable properties. Third, the empirical properties may represent different dimensions of the concept.
Copyright ©2020 by SAGE Publications, Inc. This work may not be reproduced or distributed in any form or by any means without express written permission of the publisher.
Do not
copy
, pos
t, or d
istrib
ute

chaPTer one • The DefiniTion anD MeasureMenT of concePTs 5
Consider the first three characteristics. According to the list, a liberal “has low income,” “is a young person,” and “lives in a city,” whereas a conservative “has high income,” “is an older person,” and “lives in the suburbs or a rural area.” Think about this for a moment. Are people’s income, age, and residence really a part of the concept of liberalism? Put another way: Can we think about what it means to be liberal or conservative without thinking about income, age, and residence? You would probably agree that we could. To be sure, liberalism may be related to demographic factors, such as income, age, and residence, but the concept is itself distinct from these char-acteristics. This is the first problem to look for when clarifying a concept. Some traits seem to fit with the portraits of the polar-opposite subjects, but they are not essential to the concept. We could say the same thing about what liberals and conservatives tend to watch on television, eat, drive, and do for fun. It’s possible we could identify liberals and conservatives based on demographic characteristics and some nonpolitical behaviors, but these things aren’t what make someone a liberal or conservative. Let’s drop the nonessential traits and reconsider our newly abbreviated inventory:
A liberal:
• Favors economic regulations
• Expresses support for government-funded health care and public education
• Attends demonstrations in support of women and immigrants
• Believes free market capitalism is unfair and causes inequality
• Donates money to liberal causes
• Votes for Democrats
A conservative:
• Favors free enterprise
• Expresses opposition to government-funded health care, support for school vouchers
• Attends demonstrations in support of the Tea Party and conservative causes
• Believes free market capitalism is fair and reduces inequality
• Donates money to conservative causes
• Votes for Republicans
According to the list, a liberal “favors economic regulations” and “believes free market capitalism is unfair and causes inequality.” A conservative “favors free enter-prise” and “believes free market capitalism is fair and reduces inequality.” Neither of these items should be on the list. Why not? Because neither one is measurable. Both terms are themselves abstract concepts, and we cannot use one concept to define another. What someone favors or believes cannot be directly observed and measured.
After you’ve brainstormed an inventory of characteristics, imagine that a skepti-cal observer is looking over your shoulder, pressing you to specify concrete, mea-surable traits. How, exactly, would you determine whether someone supports free enterprise and believes free market capitalism is fair and can reduce inequality? You can’t read their mind or spot these beliefs on a brain scan image. If you respond, “I can’t tell you how I know, but I know it when I see it”—to paraphrase an infamous remark about pornography—then you need to dig deeper for concrete elements.4 This is the second problem to look for when clarifying a concept. Some descriptions seem to fit the portraits of the polar-opposite subjects, but these descriptions are themselves vague, conceptual terms that cannot be measured. Let’s drop the con-ceptual terms from the inventory.
Copyright ©2020 by SAGE Publications, Inc. This work may not be reproduced or distributed in any form or by any means without express written permission of the publisher.
Do not
copy
, pos
t, or d
istrib
ute

6 The essenTials of PoliTical analysis
A liberal:
• Expresses support for government-funded health care and public education
• Attends demonstrations in support of women and immigrants
• Donates money to liberal causes
• Votes for Democrats
A conservative:
• Expresses opposition to government-funded health care, support for school vouchers
• Attends demonstrations in support of the Tea Party and conservative causes
• Donates money to conservative causes
• Votes for Republicans
One could reasonably argue that all these traits belong on an empirical inven-tory of liberalism. Some observable phenomena that would offer tangible evidence of someone’s liberalism, including monetary contributions to issue groups, attend-ing demonstrations, the display of bumper stickers or yard signs, a record of votes cast, or other overt behaviors may be difficult, if not possible, to measure in practice. People have the right to freely associate, vote in secret, and make private contri-butions to some political organizations, so it may be impossible to know whether someone attended a demonstration, voted for the Democrat or Republican, or gave money to liberal or conservative causes. Depending on the nature of our research and access to data, we may need to focus on characteristics that are readily observed and exclude those that we can’t measure.
Examine the remaining inventory items carefully. Can the attributes be grouped into different types? Are some items similar to each other and, as a group, different from other items? A conceptual dimension is defined by a set of concrete traits of similar type. You may have already noticed that expressing support for or opposition to government-funded health care and support for public education versus support for school vouchers refer to traditional differences between those who favor a larger public sector and more social services (liberals) and those who favor a more limited governmental role (conservatives). The other items, expressing support for or opposition to gender equality and immigration, refer to more recent disputes between those who favor socially progressive policies (liberals) and those who support traditional social policies (conservatives). This example illustrates the third problem to look for when clarifying a concept. All the traits fit with the por-traits of the polar-opposite subjects, but they may describe different dimensions of the concept.
Some concepts, such as liberalism, are multidimensional. A multidimensional concept has two or more distinct conceptual dimensions. In a multidimensional concept, each conceptual dimension encompasses empirical properties that are similar to each other. Furthermore, each group of traits is qualitatively distinct from other groups of traits. To avoid confusion, the different dimensions need to be identified, labeled, and measured separately. Thus, the traditional dimension of liberalism, often labeled economic liberalism, subsumes an array of similar attributes: support for government-funded health care, aid to poor people, funding for educa-tion, spending for infrastructure, and so on. The moral dimension, often labeled social liberalism, includes policies dealing with gay and lesbian rights, abortion, the legalization of marijuana, the teaching of evolution, and prayer in schools. By group-ing similar properties together, the two dimensions can be labeled separately— economic liberalism and social liberalism—and measured separately.5
Copyright ©2020 by SAGE Publications, Inc. This work may not be reproduced or distributed in any form or by any means without express written permission of the publisher.
Do not
copy
, pos
t, or d
istrib
ute

chaPTer one • The DefiniTion anD MeasureMenT of concePTs 7
Many ideas in political science are multidimensional concepts. For example, in his seminal work, Polyarchy, Robert A. Dahl points to two dimensions of democ-racy: contestation and inclusiveness.6 Contestation refers to attributes that describe the competitiveness of political systems—for example, the presence or absence of frequent elections or whether a country has legal guarantees of free speech. Inclusiveness refers to characteristics that measure how many people are allowed to participate, such as the presence or absence of restrictions on the right to vote or conditions on eligibility for public office. Dahl’s conceptual analysis has proven to be an influential guide for the empirical study of democracy.7
Many political concepts have a single dimension. The venerable social science concept of social status or socioeconomic status (SES), for example, has three con-crete attributes that vary across people: income, occupation, and education. Yet it seems reasonable to say that all three are empirical manifestations of one dimension of SES.8 Similarly, if you sought to clarify the concept of cultural fragmentation, you might end up with a polar-opposite list of varied but dimensionally similar charac-teristics of polities: many/few major religions practiced, one/several languages spo-ken, one/many racial groups, and so on. For each of these concepts, SES and cultural fragmentation, you can arrive at a single measure by determining whether people or polities have a great deal of the concept’s characteristics.
As much as possible, you should define concepts in clear, unidimensional terms. Artists and poets may relish linguistic ambiguity, but social scientists do not. If there are really two separate dimensions of liberalism, we can define and analyze both. Of course, some important political concepts, like power and democracy, are inherently multidimensional and we should not distort their meaning by attempting to define them in simple, unidimensional terms.
A Template for Writing a Conceptual Definition
After identifying the essential, measurable properties of a concept, we define the con-cept as clearly as possible. A conceptual definition must communicate three things:
1. The variation within a measurable characteristic or set of characteristics,
2. The subjects or groups to which the concept applies, and
3. How the characteristic is to be measured.
The following is a workable template for stating a conceptual definition that meets all three requirements:
The concept of ________________ is defined as the extent to which _________ exhibit the characteristic of ___________________________________________.
For a conceptual definition of economic liberalism, we could write the following:
The concept of economic liberalism is defined as the extent to which individuals exhibit the characteristic of expressing support for government spending for social programs.
Let’s consider the template example of a conceptual definition in more detail. The first term, economic liberalism, identifies the concept of interest and when combined with the words “the extent to which” communicates the
Copyright ©2020 by SAGE Publications, Inc. This work may not be reproduced or distributed in any form or by any means without express written permission of the publisher.
Do not
copy
, pos
t, or d
istrib
ute

8 The essenTials of PoliTical analysis
variation at the heart of the concept. Notice that we’re focusing on economic liberal-ism, as opposing to social liberalism, to avoid conflating two potentially distinct concepts. The second term, individuals, states the subjects to whom the concept applies. The third term, expressing support for government spending for social pro-grams, suggests how the concept should be measured. Having worked through an inventory of properties of liberalism and thought carefully about what it means, we’ve identified a concrete and variable characteristic of liberalism that’s measur-able. This definition of economic liberalism conveys all the essential elements of a conceptual definition.
Why It’s Important to Identify the Unit of Analysis
By referring to a subject or group of subjects, a conceptual definition conveys the units of analysis. A unit of analysis is the entity (person, city, country, county, university, state, bureaucratic agency, etc.) we want to describe and analyze. It is the entity to which the concept applies. Students learning the essentials of political analysis may find the difference between the topic they’re analyzing and the entity they’re studying to shed light on that topic a bit confusing, but it’s important to clearly identify the unit of analysis and understand why the level of analysis is important.
Units of analysis can be either individual level or aggregate level. When a concept describes a phenomenon at its lowest possible level, it is using an individual-level unit of analysis. Most polling or survey research deals with concepts that apply to individual persons, which are the most common individual-level units of analysis you will encounter. Individual-level units are not always persons, however. If you were conducting research on the political themes con-tained in the Democratic and Republican Party platforms over the past several elections, the units of analysis would be the individual platforms from each year. Similarly, if you were interested in finding out whether environmental legislation was a high priority in Congress, you might examine each bill that is introduced as an individual unit of analysis.
Much political science research deals with the aggregate-level unit of analysis, which is a collection of individual entities. Neighborhoods or census tracts are aggregate-level units, as are congressional districts, states, and coun-tries. A university administrator who wonders if student satisfaction is affected by class size would gather information on each class, an aggregation of individual students. Someone wanting to know whether states with lenient voter registra-tion laws have higher voter turnout than states with stricter laws could use voter registration laws and voting data from fifty aggregate-level units of analysis, the states. Notice that collections of individual entities, and thus overall aggre-gate levels, can vary in size. For example, both congressional districts and states are aggregate-level units of analysis—both are collections of individuals within politically defined geographic areas—but states usually represent a higher level of aggregation because they are composed of more individual entities.
There are two general types of aggregate-level data. Some aggregate-level data are really a summary of individual-level units calculated by combining or averaging individual-level characteristics or behaviors, such as an average of stu-dent evaluations, the proportion of adults who voted, or some other average char-acteristic of those in a city, county, or legislative district. Aggregate-level data may also measure the group’s characteristics when acting as a group. For example, one could identify which states have lenient voter registration policies and which have strict policies.
Copyright ©2020 by SAGE Publications, Inc. This work may not be reproduced or distributed in any form or by any means without express written permission of the publisher.
Do not
copy
, pos
t, or d
istrib
ute

chaPTer one • The DefiniTion anD MeasureMenT of concePTs 9
The same concept often can be defined at both the individual and aggregate levels. Dwell on this point for a moment. Just as economic liberalism can be defined for individual persons, economic liberalism can be defined for states by aggregating the numbers of state residents who support or oppose government spending: The concept of economic liberalism is defined as the extent to which states exhibit the characteristic of having residents who support government spending for social pro-grams. This conceptual definition makes perfect sense. One can imagine comparing states that have a large percentage of pro-spending residents with states having a lower percentage of pro-spending residents. For statistical reasons, however, the relationship between two aggregate-level concepts usually cannot be used to make inferences about the relationship at the individual level. Suppose we find that states with larger percentages of college-educated people have higher levels of economic liberalism than states with fewer college graduates. Based on this finding, we could not conclude that college-educated individuals are more likely to be economic liber-als than are individuals without a college degree.
Sometimes researchers want to use data collected at one level of analysis to better understand what’s happening at another level of analysis. This is called cross-level analysis. Cross-level analysis may be necessary where data on certain outcomes are not available at the individual level. For example, a researcher cannot obtain individual-level voting records but may obtain election results by election precinct. Someone interested in juror behavior could compile data on decisions by six- or twelve-member juries but could not observe jury deliberations because they are secret. Researchers interested in health and education outcomes would face similar challenges because of the privacy of medical and educational records.
A classic problem, known as the ecological fallacy, may arise when an aggregate-level phenomenon is used to make inferences at the individual level. W. S. Robinson, who coined the term more than 60 years ago, illustrated the ecolog-ical fallacy by pointing to a counterintuitive fact: States with higher percentages of foreign-born residents had higher rates of English-language literacy than states with lower percentages of foreign-born residents. At the individual level, Robinson found the opposite pattern, with foreign-born individuals having lower English literacy than native-born individuals.9 The ecological fallacy is not new, but it continues to create problems and cause confusion.10 The issue is not that generalizing from one level of analysis to another is always wrong, but sometimes it is and it’s difficult to know when it is wrong.11
Consider, for example, an aggregate-level analysis of the relationship between income and partisanship in national elections. Compare the relationship between income and the percentage voting for 2012 Republican candidate Mitt Romney at the state level and the individual level in Figure 1-1. If one analyzes the relationship between state per capita income and the percentage vote for Romney in the 2012 election (the left side of Figure 1-1), it appears that poor states are “red states” and rich states are “blue states.” It’s tempting to infer from this aggregate-level relation-ship that poor people are more likely to vote Republican than people with higher incomes. Many political pundits read the national electoral map this way, but it’s an ecological fallacy. An aggregate-level relationship may not be reflected at the indi-vidual level. In fact, an individual-level analysis of the relationship between income and partisanship in national elections shows the opposite pattern: as individual income increases, so does the percentage of self-reported Romney voters (the right side of Figure 1-1).
A proper conceptual definition needs to specify the units of analysis. Researchers must be careful when drawing conclusions based on the study of aggregate-level units of analysis.
Copyright ©2020 by SAGE Publications, Inc. This work may not be reproduced or distributed in any form or by any means without express written permission of the publisher.
Do not
copy
, pos
t, or d
istrib
ute

10 The essenTials of PoliTical analysis
OPERATIONAL DEFINITIONS
By suggesting how the concept is to be measured, a conceptual definition points the way to a clear operational definition.12 An operational definition describes explic-itly how the concept is to be measured empirically. How could we determine the extent to which people hold opinions that are consistent with economic liberalism? What procedure would produce the truest measure of social liberalism? Suppose we wanted to quantify Dahl’s inclusiveness dimension of democracy. We would need to devise a metric that combines the different concrete attributes of inclusiveness. Exactly what form would this metric take? Would it faithfully reflect the concep-tual dimension of inclusiveness, or might our measure be flawed in some way? This phase of the measurement process, the step between conceptual definition and oper-ational definition, is often the most difficult to traverse. To help you understand how researchers operationalize abstract concepts, let’s consider how researchers might measure preferences and support for liberalism.
The concept of preference is essential to public opinion research, but how can we operationalize this concept? Sometimes people are asked to compare two or more options and identify their favorite one or rank them in preference order. You can ask people about their past choices. If something is sold in the marketplace, we can discover how much people are willing to pay, or accept as payment, in a transac-tion. There is usually more than one way to operationalize a concept, but they aren’t all equally useful. We often put prices on things to quantify how much they’re worth, but many important things aren’t bought and sold in fairs or markets.
Let’s consider a popular method of operationalizing the concept of preference in political science research. Researchers developed a novel method of measuring preferences for the American National Election Study (ANES): the feeling ther-mometer. A feeling thermometer is a visual aid that helps people quantify their feelings about people, ideas, and institutions. It works like this: the researcher shows
Figure 1-1 Illustration of Ecological Fallacy in Vote Choice
Aggregate—Level Analysis
UT
WY
70
60
50
40
30
20
70
60
50
40
30
20U
nder
$5
k$
5k
$1
0k
$1
2.5
k$
15
k$
17
.5k
$2
0k
$2
2.5
k$
25
k$
27
.5k
$3
0k
$3
5k
$4
5k
$5
0k
$5
5k
$6
0k
$6
5k
$7
0k
$2
50
k &
up
$7
5k
$8
0k
$9
0k
$1
00
k$
11
0k
$1
50
k$
17
5k
$1
25
k$25K $30K $35K $40K $45K
MS
NJ CT
NY
Individual—Level Analysis
State Income Level
Perc
enta
ge R
omne
y Vo
tes
Respondent Income Level
Copyright ©2020 by SAGE Publications, Inc. This work may not be reproduced or distributed in any form or by any means without express written permission of the publisher.
Do not
copy
, pos
t, or d
istrib
ute

chaPTer one • The DefiniTion anD MeasureMenT of concePTs 11
the respondent a visual aid that calibrates thermometer readings to feelings and asks the following question:
I’d like to get your feelings toward some of our political leaders and other people who are in the news these days. I’ll read the name of a person and I’d like you to rate that person using something we call the feeling thermometer. Ratings between 50 degrees and 100 degrees mean that you feel favorable and warm toward the person. Ratings between 0 degrees and 50 degrees mean that you don’t feel favorable toward the person and that you don’t care too much for that person. You would rate the person at the 50-degree mark if you don’t feel particularly warm or cold toward the person. If we come to a person whose name you don’t recognize, you don’t need to rate that person. Just tell me and we’ll move on to the next one.
Figure 1-2 shows the card used by ANES interviewers in 1964.13 As you can see, the feeling thermometer goes from 0 to 100 degrees. Higher numbers correspond to warmer, more favorable feelings and lower numbers correspond to colder, less favor-able feelings. In 1964, this device was used to measure the general public’s feelings about presidential candidates, but it’s since been broadly deployed to measure the general public’s feelings about politicians, groups of people, ideas, and institutions.
Researchers have used feeling thermometers to measure personal preferences for more than 50 years now. Why is the feeling thermometer a good way to opera-tionalize the concept of preference? It’s simple and intuitive. People already know how the weather feels. If the temperature is 100 degrees outside, it’s a very hot day; if it is 0 degrees, it’s a very cold day. Preferences are abstract, but they’re frequently associated with our sense of temperature as in getting “cold feet” or having “warm feelings.” The feeling thermometer allows people to express their preferences on a scale that seems familiar. (It also makes sense as the percentage you like something from 0 to 100 percent.) Rather than take our word for it, try putting yourself in the
Figure 1-2 Feeling Thermometer Used in 1964
CARD #5
“FEELING” THERMOMETER
WARM 100o _____ Very warm or favorable feeling for candidate
85o _____ Good warm or favorable feeling for candidate
70o _____ Fairly warm or favorable feeling for candidate
60o _____ A bit more warm or favorable than cold feeling
50o _____ No feeling at all for candidate
40o _____ A bit more cold or unfavorable feeling
30o _____ Fairly cold or unfavorable feeling
15o _____ Quite cold or unfavorable feeling
COLD 0o _____ Very cold or unfavorable feeling
Copyright ©2020 by SAGE Publications, Inc. This work may not be reproduced or distributed in any form or by any means without express written permission of the publisher.
Do not
copy
, pos
t, or d
istrib
ute

12 The essenTials of PoliTical analysis
If you followed the ANES instructions properly, all your ratings should be between 0 and 100. If you don’t have positive or negative feelings about an item, you should have scored it 50. Did the feeling thermometer help you quantify your likes and dislikes? (In the next chapter, you’ll have an opportunity to compare your responses to national averages.)
Recently, physicians have started using a visual aid like the feeling thermometer to help people express how much pain they’re experiencing. Pain can’t be measured directly, but we can picture what it feels like when we’re in pain. Figure 1-3 shows us how we might operationalize the subjective feeling of pain using a visual aid. If you were asked to quantify the pain you feel from 0 to 10, the faces are really helpful, right?
shoes of an ANES respondent. Reread the block-quoted question prompted above and, using Figure 1-2 as a visual aid, rate the following items from the 2016 ANES on a feeling thermometer:
Figure 1-3 Sample Pain Scale
No pain
Verydistressing
Veryintense
Excruciatingunbearable
TolerableVery mild
0 1 2 3 4 5 6 7 8 9 10
Discomforting Distressing IntenseUtterlyhorrible
Unimaginableunspeakable
asian americansGay men and lesbians Poor people
Bill clinton hillary clinton republican Party
Blacks hispanics rich people
Black lives Matter illegal immigrants scientists
Big business Jews u.s. supreme court
christians Tim Kane Tea Party
congress liberals Transgender people
conservatives Muslims Donald Trump
Democratic Party Barack obama unions
feminists Mike Pence Whites
christian fundamentalists Police
Source: Robert Weis. CC BY-SA 4.0 (https://creativecommons.org/licenses/by-sa/4.0).
Copyright ©2020 by SAGE Publications, Inc. This work may not be reproduced or distributed in any form or by any means without express written permission of the publisher.
Do not
copy
, pos
t, or d
istrib
ute

chaPTer one • The DefiniTion anD MeasureMenT of concePTs 13
The feeling thermometer was developed to help people quantify their likes and dislikes in face-to-face interviews. It can be used to quantify how much someone likes or dislikes a wide variety of subjects. Of course, no measurement strategy is perfect and, as we’ll see, it’s always important to evaluate how well we operationalize a concept.
How might we go about implementing the conceptual definition of liberalism? Imagine crafting a series of ten or twelve survey questions and administering them to many people. Each question would name a specific social program: funding for educa-tion, assistance to the poor, spending on medical care, support for childcare subsidies, and so on. For each program, individuals would be asked whether government spending should be decreased, kept the same, or increased. Liberalism could then be operation-ally defined as the number of times a respondent said “increased.” Higher scores would denote more liberal attitudes and lower scores would denote less liberal attitudes.
As the foregoing examples suggest, an operational definition provides a proce-dural blueprint for analyzing a concept. An effective measurement strategy unites qualitative and quantitative analysis by allowing researchers to measure abstract concepts. Rather than devalue important concepts like democracy, fairness, and jus-tice, good operational definitions give us the opportunity to better understand and promote these values.
MEASUREMENT ERROR
Let’s use the term intended characteristic to refer to the conceptual property we want to measure. The term unintended characteristic will refer to any other property or attribute that we do not want our instrument to measure. Given an operational defi-nition, the researcher should ask, “Does this operational instrument measure the intended characteristic? If so, does it measure only that characteristic? Or might it also be gauging an unintended characteristic?” Our goal is to devise operational instruments that maximize the congruence or fit between the definition of the con-cept and the empirical measure of that concept.
Two sorts of error can distort the linkage between a concept and its empirical measure. Serious problems arise when systematic measurement error is at work. Systematic error introduces consistent, chronic distortion into an empirical mea-surement. Often called measurement bias, systematic error produces operational readings that consistently mismeasure the characteristic the researcher is after. Less serious, but still troublesome, problems occur when random measurement error is present. Random error introduces haphazard, chaotic distortion into the measure-ment process, producing inconsistent operational readings of a concept. To appre-ciate the difference between these two kinds of error, and to see how each affects measurement, we will consider both systematic and random measurement errors in detail. An effective measurement strategy minimizes both systematic and random error, but as we’ll see, this ideal is often unachievable and there may be trade-offs between these two types of measurement error.
Systematic Measurement Error
Suppose that an instructor wants to test the civics knowledge of a group of stu-dents. This measurement is operationalized by asking ten questions about the basic features of American government. First let’s ask, “Does this operational instrument measure the intended characteristic, civics knowledge?” It seems clear that some part of the operational measure will capture the intended characteristic, students’
Copyright ©2020 by SAGE Publications, Inc. This work may not be reproduced or distributed in any form or by any means without express written permission of the publisher.
Do not
copy
, pos
t, or d
istrib
ute

14 The essenTials of PoliTical analysis
actual civics knowledge. But let’s press the measurement question a bit further: “Does the instructor’s operational instrument measure only the intended char-acteristic, civics knowledge? Or might it also be gauging a characteristic that the instructor did not intend for it to measure?” We know that, quite apart from civics knowledge, students vary in their verbal skills. Some students can read and under-stand test questions more quickly than others can. Thus, the operational instru-ment is picking up an unintended characteristic, an attribute it is not supposed to measure—verbal ability.
You can probably think of other characteristics that would “hitch a ride” on the instructor’s test measure. In fact, a large class of unintended characteristics is often at work when human subjects are the units of analysis. This phenomenon, dubbed the Hawthorne effect, inadvertently measures a subject’s response to the knowledge that he or she is being studied. Test anxiety is a well-known example of the Hawthorne effect. Despite their actual grasp of a subject, some students become overly nervous simply by being tested, and their exam scores will be systematically depressed by the presence of test anxiety.14
The unintended characteristics we have been discussing, verbal ability and test anxiety, are sources of systematic measurement error. Systematic measurement error refers to factors that produce consistently inaccurate measures of a concept. Notice two aspects of systematic measurement error. First, unintended characteristics such as verbal ability and test anxiety are durable, not likely to change very much over time. If the tests were administered again the next day or the following week, the test scores of the same students—those with fewer verbal skills or more test anxiety—would yield consistently poor measures of their true civics knowledge. Think of two students, both having the same level of civics knowledge but one having less verbal ability than the other. The instructor’s operational instrument will report a persistent difference in civics knowledge between these students when, in fact, no difference exists. Second, this consistent bias is inherent in the measurement instrument. When the instructor constructed a test using word problems, a measure of the unintended characteristic, verbal ability, was built directly into the operational definition. The source of systematic error resides—often unseen by the researcher—in the measure-ment strategy itself.
Political scientists doing research on political tolerance have had to confront systematic measurement error. Political tolerance is important to many students of democracy because, arguably, democratic health can be maintained only if people remain open to different ways of thinking and solving problems. If tolerance is low, then democratic procedures will be weakly supported, and the free exchange of ideas might be threatened. Political tolerance is a rather complex concept, and a large body of research and commentary is devoted to it.15 Beginning in the 1950s, the earliest research “operationalized” political tolerance by asking large numbers of individuals if certain procedural freedoms (for example, giving a speech or pub-lishing a book) should be extended to members of specific groups: atheists, commu-nists, and socialists. This seemed like a reasonable operational definition because, at the time at least, these groups represented ideas outside the conformist mainstream and were generally considered unpopular. The main finding was somewhat unset-tling: Whereas those in positions of political leadership expressed high levels of tolerance, the public-at-large appeared much less willing to allow basic freedoms for these groups.
Later research, however, pointed to important slippage between the concep-tual definition, which clarified and defined the important properties of political tolerance, and the operational definition, the procedure used to measure politi-cal tolerance. The original investigators had themselves chosen which unpopular
Copyright ©2020 by SAGE Publications, Inc. This work may not be reproduced or distributed in any form or by any means without express written permission of the publisher.
Do not
copy
, pos
t, or d
istrib
ute

chaPTer one • The DefiniTion anD MeasureMenT of concePTs 15
groups were outside the mainstream, and these groups tended to have a left-wing or left-leaning ideological bent. The researchers were therefore gauging tolerance only toward leftist groups. Think about this measurement problem. Consider a scenario in which a large number of people are asked to “suppose that an admitted communist wanted to make a speech in your community. Should he be allowed to speak or not?” For the question’s designers, the key words are “wanted to make a speech.” Thus, people who respond “allowed to speak” are measured as having a larger amount of political tolerance than are those who say “not allowed to speak.” But it could be that for some respondents—it is impossible to know how many—the key word is “com-munist.” These respondents might base their answers on how they feel about com-munists, not on how willing they are to apply the principle of free speech. Ideological liberals, who may regard communists as less threatening than other groups, would be measured as more tolerant than ideological conservatives, who regard communists as more threatening than other groups.
An effective measurement of political tolerance should accurately gauge indi-viduals’ willingness to extend freedoms to unpopular groups. The first measure-ment of tolerance did not accurately measure this intended characteristic. Why not? Because it was measuring a characteristic that it was not supposed to measure: indi-viduals’ attitudes toward left-wing groups. To be sure, the original measurement procedure was tapping an intended characteristic of tolerance. After all, a thoroughly tolerant person would not be willing to restrict the freedoms of any unpopular group, regardless of the group’s ideological leanings, whereas a completely intoler-ant person would express a willingness to do so. When the conceptual definition was operationalized, however, an unintended characteristic, individuals’ feelings toward leftist groups, also was being measured. The initial measurement strategy also mea-sured respondents’ ideological sympathies. Thus, the measurement strategy created a poor fit, an inaccurate link, between the concept of tolerance and the empirical measurement of the concept.
A better measurement strategy, one more faithful to the concept, allows respon-dents themselves to name the groups they most strongly oppose—that is, the groups most unpopular with or disliked by each person being surveyed. Individuals would then be asked about extending civil liberties to the groups they had identified, not those picked beforehand by the researchers. Think about why this is a superior approach. Consider a scenario in which a large number of people are presented with a list of groups: racists, communists, socialists, homosexuals, white separatists, and so on. Respondents are asked to name the group they “like the least.” Now recast the earlier survey instrument: “Suppose that [a member of the least-liked group] wanted to make a speech in your community. Should he be allowed to speak or not?” Because the respondents themselves have selected the least-liked group, the investi-gators can be confident that those who say “allowed to speak” have a larger amount of tolerance than those who say “not allowed to speak.” Interestingly, this superior measurement strategy led to equally unsettling findings: Just about everyone, elites and nonelites alike, expressed rather anemic levels of political tolerance toward the groups they liked the least.16
Random Measurement Error
Now consider some temporary or haphazard factors that might come into play dur-ing the instructor’s civics knowledge test. Some students may be ill or tired; others may be well rested. Students sitting near the door may be distracted by commo-tion outside the classroom, whereas those sitting farther away may be unaffected. Commuting students may have been delayed by traffic congestion caused by a fender
Copyright ©2020 by SAGE Publications, Inc. This work may not be reproduced or distributed in any form or by any means without express written permission of the publisher.
Do not
copy
, pos
t, or d
istrib
ute

16 The essenTials of PoliTical analysis
bender near campus, and so, arriving late, they may be pressed for time. The instruc-tor may make errors in grading the tests, accidentally increasing the scores of some students and decreasing the scores of others.
These sorts of factors—fatigue, commotion, unavoidable distractions—are sources of random measurement error. Random measurement error refers to factors that produce inconsistently inaccurate measures of a concept. Notice two aspects of random measurement error. First, unintended characteristics such as commo-tion and grading errors are not durable, and they are not consistent across students. They may or may not be present in the same student if the test were administered again the next day or the following week. A student may be ill or delayed by traffic one week, well and on time the next. Second, chance events certainly can affect the operational readings of a concept, but they are not built into the operational defini-tion itself. When the instructor constructed the exam, he did not build traffic acci-dents into the measure. Rather, these factors intrude from outside the instrument. Chance occurrences introduce haphazard, external “noise” that may temporarily and inconsistently affect the measurement of a concept.
Political scientists who use feeling thermometers to measure public sentiments about political candidates, controversial groups, and ideas also encounter random measurement errors. People taking these surveys have the same issues with fatigue, commotion, and unavoidable distractions that students taking tests do. In addition to these random factors, people will usually round off their reported feeling thermom-eter scores to a multiple of 5 or 10. So rather than rate their feeling at 73 degrees, they’ll say 70 or 75 degrees. The same respondent may round some responses up and other responses down without a clear or consistent pattern of mental accounting, making it a source of random measurement error.
RELIABILITY AND VALIDITY
We can effectively use the language of measurement error to evaluate the pros and cons of a particular measurement strategy. For example, we could say that the earli-est measure of political tolerance, though perhaps having a small amount of random error, contained a large amount of systematic error. The hypothetical instruc-tor’s measurement of civics knowledge sounds like it had a dose of both kinds of error—systematic error introduced by durable differences between students in verbal ability and test anxiety, and random error that intruded via an array of haphazard occurrences.
Typically, researchers do not evaluate a measure by making direct reference to the amount of systematic error or random error it may contain. Instead, they discuss two criteria of measurement: reliability and validity. However, reliability and validity can be understood in terms of measurement error.
The reliability of a measurement is the extent to which it is a consistent mea-sure of a concept. Assuming that the property being measured does not change between measurements, a reliable measure gives the same reading every time it is taken. If multiple researchers are coding information for a study, they’re doing it the same way. Applying the ideas we just discussed, a completely reliable measure is one that contains no random error. As random measurement noise increases—repeated measurements jump around haphazardly—a measure becomes less reliable. A mea-sure need not be free of systematic error to be reliable. It just needs to be consistent. If the center of the targets in Figure 1-4 represents the intended characteristic we want to measure and the points on the targets are our measurement of the charac-teristic, we assess reliability by the closeness of the marks to one another (regardless of how close they are to the bull’s-eye).
Copyright ©2020 by SAGE Publications, Inc. This work may not be reproduced or distributed in any form or by any means without express written permission of the publisher.
Do not
copy
, pos
t, or d
istrib
ute

chaPTer one • The DefiniTion anD MeasureMenT of concePTs 17
Figure 1-4 Illustrations of Reliability and Validity
Not reliable or valid Valid, but not reliable
Reliable, but not valid Reliable and valid
Consider a nonsensical example that nonetheless illustrates the point. Suppose a researcher gauges the degree to which people favor increased government spending on social programs by measuring their body weight on a scale, with higher weights denoting stronger approval for spending. This researcher’s measure would be fairly reliable. People would weigh roughly the same each time the researcher measured, with some random fluctuation in weight from one day to the next and over the course of the day. But it would clearly be gauging a concept completely different from opinions about government spending. This poor measurement strategy is rep-resented by the lower-left panel of Figure 1-4. Measuring support for spending in pounds on a scale would be consistent—consistently wrong, that is.
In a more realistic vein, suppose the civics instructor recognized the problems caused by random occurrences and took steps to greatly reduce these sources of random error. Certainly, his measurement of civics knowledge would now be more consistent, more reliable. However, it would not reflect the true civics knowledge of students because it would still contain systematic error. More generally, although reliability is a desirable criterion of measurement—any successful effort to purge a measure of random error is a good thing—it is a weaker criterion than validity.
The validity of a measurement is the extent to which it records the true value of the intended characteristic and does not measure any unintended characteristics. A valid measure provides a clear, unobstructed link between a concept and the empiri-cal reading of the concept. Framed in terms of measurement error, the defining fea-ture of a valid measure is that it contains no systematic error, no bias that consistently pulls the measurement off the true value.
To illustrate measurement validity, suppose a researcher gauges opinions toward government spending by asking each respondent to indicate his or her position on a
Copyright ©2020 by SAGE Publications, Inc. This work may not be reproduced or distributed in any form or by any means without express written permission of the publisher.
Do not
copy
, pos
t, or d
istrib
ute
18 The essenTials of PoliTical analysis
7-point scale, from “spending should be increased” on the left to “spending should be decreased” on the right. Is this a valid measure? A measure’s validity is harder to establish than is its reliability. But it seems reasonable to say that this measurement instrument is free from systematic error and thus would closely reflect respondents’ true opinions on the issue. Or suppose the civics instructor tries to alleviate the sources of systematic error inherent in his test instrument—switching from word problems to an oral examination with visual aids, and perhaps easing anxiety by shortening the test or lengthening the allotted time. These reforms would reduce systematic error, strengthen the connection between true civics knowledge and the measurement of civics knowledge, and thus enhance the validity of the test.
Suppose we have a measurement that contains no systematic error but con-tains some random error. This situation is represented by the upper-left panel of Figure 1.4. Would this be a valid measure? Can a measurement be valid but not reliable? Although we find conflicting scholarly answers to this question, let’s settle on a qualified yes.17 Instead of considering a measurement as either not valid or valid, think of validity as a continuum, with “not valid” at one end and “valid” at the other. An operational instrument that has serious measurement bias, lots of systematic error, would reside at the “not valid” pole, regardless of the amount of random error it contains. The early measure of political tolerance is an example. An instrument with no systematic error and no random error would be at the “valid” end. Such a measure would return an accurate reading of the char-acteristic that the researcher intends to measure, and it would do so with perfect consistency. The math instructor’s reformed measurement process—changing the instrument to remove systematic error, taking pains to reduce random error—would be close to this pole. Now consider two measures of the same concept, neither of which contains systematic error, but one of which contains less random error. Because both measures vanquish measurement bias, both would fall on the “valid” side of the continuum. But the more consistent measure would be closer to the “valid” pole.
Evaluating Reliability
Methods for evaluating reliability are designed around this assumption: If a measure-ment strategy is reliable, it will yield consistent results. In everyday language, “con-sistent” generally means “stays the same over time.” Accordingly, some approaches to reliability apply this measure-now-measure-again-later intuition. Other methods used to assess the internal consistency of an instrument do not require readings taken at different points in time.
There are several methods of evaluating whether a measurement system is con-sistent over time. In the test-retest method, the investigator applies the measure once and then applies it again at a later time to the same units of analysis. If the measurement is reliable, then the two results should be the same or very similar. If a great deal of random measurement error is present, then the two results will be very different. For example, suppose we construct a 10-item instrument to measure indi-viduals’ levels of economic liberalism. We create the scale by asking each respondent whether spending should or should not be increased on ten government programs. We then add up the number of programs on which the respondent says “increase spending.” We administer the questionnaire and then readminister it at a later date to the same people. If the scale is reliable, then each person’s score should change very little over time.
The alternative-form method is similar to the test-retest approach. In the alternative-form method, the investigator administers two different but equivalent
Copyright ©2020 by SAGE Publications, Inc. This work may not be reproduced or distributed in any form or by any means without express written permission of the publisher.
Do not
copy
, pos
t, or d
istrib
ute

chaPTer one • The DefiniTion anD MeasureMenT of concePTs 19
versions of the instrument. The researcher measures the characteristic using one form of the instrument at time point 1 and then measures it again with an equivalent form of the instrument at time point 2. For our economic liberalism example, we would construct two 10-item scales, each of which elicits respondents’ opinions on ten government programs. Why go to the trouble of devising two different scales? The alternative-form method remedies a key weakness of the test-retest method: In the second administration of the same questionnaire, respondents may remem-ber their earlier responses and make sure that they give the same opinions again. Obviously, we want to measure economic liberalism, not memory retention.
Methods for evaluating reliability based on consistency over time have two main drawbacks. First, these approaches make it hard to distinguish random error from true change. Suppose that between the first and second administrations of the survey, a respondent becomes more economically liberal, perhaps scoring a 4 the first time and a 7 the second time. Methods of evaluating reliability over time assume that the attribute of interest—in this case, economic liberalism—does not change over time. Thus, the observed change, from 4 to 7, is assumed to be random error. The longer the time period between questionnaires, the bigger this problem becomes.18 A second drawback is more practical: Surveys are expensive projects, especially when the researcher wants to administer an instrument to a large number of people.
As a practical matter, most political researchers face the challenge of evaluating the reliability of a measurement that was made at a single point in time. Internal consistency methods are designed for these situations. One internal consistency approach, the split-half method, is based on the idea that an operational measure-ment obtained from half of a scale’s items should be the same as the measurement obtained from the other half. In the split-half method, the investigator divides the scale items into two groups, calculates separate scores, and then analyzes the cor-relation between measurements. If the items are reliably measuring the same con-cept, then the two sets of scores should be the same. Following this technique, we would break our ten government spending questions into two groups of five items each, calculate two scores for each respondent, and then compare the scores. Plainly enough, if we have devised a reliable instrument, then the respondents’ scores on one 5-item scale should match closely their scores on the other 5-item scale.
A more sophisticated internal consistency approach, Cronbach’s alpha, is a natural methodological extension of the split-half technique. Instead of evaluat-ing consistency between separate halves of a scale, Cronbach’s alpha compares consistency between pairs of individual items and provides an overall reading of inter-item correlation and a measure’s reliability.19 Imagine a perfectly consistent measure of economic liberalism. Every respondent who says “increase spending” on one item also says “increase spending” on all the other items, and every respon-dent who says “do not increase spending” on one item also says “do not increase spending” on every other item. In this scenario, Cronbach’s alpha would report a value of 1, denoting perfect reliability. If responses to the items betray no consis-tency at all—opinions about one government program are not related to opinions about other programs—then Cronbach’s alpha would be 0, telling us that the scale is completely unreliable. Of course, most measurements’ reliability readings fall between these extremes.
It is easy to see how the methods of evaluating reliability help us to develop and improve our measures of concepts. Let’s say we wish to measure the concept of social liberalism, the extent to which individuals accept new moral values and personal freedoms. After building an inventory of this concept’s empirical proper-ties, we construct a scale based on support for five policies: same-sex marriage,
Copyright ©2020 by SAGE Publications, Inc. This work may not be reproduced or distributed in any form or by any means without express written permission of the publisher.
Do not
copy
, pos
t, or d
istrib
ute

20 The essenTials of PoliTical analysis
marijuana legalization, abortion rights, stem cell research, and physician-assisted suicide. Our hope is that by summing respondents’ five issue positions, we can arrive at a reliable operational reading of social liberalism. With all five items included, the scale has a Cronbach’s alpha equal to .6. Some tinkering reveals that, by dropping the physician-assisted suicide item, we can increase alpha to .7, an encouraging improvement that puts the reliability of our measure near the thresh-old of acceptability.20 The larger point to remember is that the work you do at the operational definition stage often helps you to refine the work you did at the concept clarification stage.
Evaluating Validity
The challenge of assessing validity is to identify durable, unintended characteristics that are distorting an operational measure—that is, to identify the sources of system-atic measurement error. To be sure, some sources of systematic error, such as verbal skills or test anxiety, are widely recognized, and steps can be taken to ameliorate their effects.21 In most situations, however, less well-known factors might be affecting validity. In most situations, the true value of the characteristic the researcher wants to measure, represented by the bull’s-eye on the targets in Figure 1.4, is unknown (hence, the reason the researcher is attempting to measure it). If you don’t know where the intended target is, how do you know how close you came to it?
Consider a measure that surely is familiar to you: standardized academic tests. The SAT, the Law School Admission Test (LSAT), and the Graduate Record Examination (GRE), among others, tend to return consistent results from one administration to the next and are generally correlated with one another. But the debate about such tests does not center on their reliability. It centers, instead, on their validity: Do these exams measure what they are supposed to measure and only what they are supposed to measure? Critics argue that because many of these tests’ questions assume a familiarity with white, middle-class culture, they do not produce valid measurements of aptitudes and skills. Recall again the earliest measurements of political tolerance, which gauged the concept by asking respondents whether basic freedoms should be extended to specific groups: atheists, communists, and socialists. Because several different studies used this operationalization and produced similar findings, the measure was a reliable one. The problem was that a durable unintended characteristic, the respondents’ attitudes toward left-wing groups, was “on board” as well, giving a consistent if inaccurate measurement of the concept.
How can researchers identify systematic measurement errors? Researchers tend to evaluate validity using two different criteria: face validity and construct validity. In the face validity approach, the investigator uses informed judgment to determine whether an operational procedure is measuring what it is supposed to measure. “On the face of it,” the researcher asks, “are there good reasons to think that this measure accurately gauges the intended characteristic?”
Consider, for example, the face validity of feeling thermometer scores recorded in the 2016 American National Election Study. As you can see in Figure 1-5, the national means on these items vary tremendously, with “Scientists” receiving a warm 76.5 mean score and Donald Trump, in a pre-2016 election survey, rounding out the ranking with a 36.4 mean feeling thermometer score. On the face of it, do these feeling thermometer scores appear to accurately gauge how the public feels about different people, ideas, and political institutions?
The informed judgment may come from the researcher’s own experience as well as careful review of published literature. Do the rankings shown in Figure 1.5 accord with your own experience and whatever research you’ve conducted on public
Copyright ©2020 by SAGE Publications, Inc. This work may not be reproduced or distributed in any form or by any means without express written permission of the publisher.
Do not
copy
, pos
t, or d
istrib
ute

chaPTer one • The DefiniTion anD MeasureMenT of concePTs 21
opinion? Perhaps seeing Donald Trump’s pre-election mean feeling thermometer score at the bottom of the list gives you pause and makes you wonder about partisan bias. It’s somewhat surprising to see Trump rated so unfavorably; however, Hillary Clinton’s pre-election score is also very low, so there doesn’t appear to be clear par-tisan bias.
To assess face validity, the researcher might also compare the inventory of the concept’s properties to the operations definition to make sure all of the essential, measurable properties of the concept are included in the measurement technique. Face validity cannot be empirically demonstrated, but a widely accepted measure-ment strategy is more valid on its face than one with no proven track record. (This is a good reason to conduct a thorough literature review, discussed in Chapter 10.)
Let’s consider the face validity of a survey question that’s been used to measure the concept of political efficacy, the extent to which individuals believe that they can affect government. Feel free to answer this question yourself.
Voting is the only way that people like me can have any say about how the government runs things.
agree
Disagree
According to the question’s operational design, a person with a low level of political efficacy would see few opportunities for influencing government beyond voting and thus would give an “agree” response. A more efficacious person would feel that other avenues exist for “people like me” and so would tend to “disagree.” But examine the survey instrument closely. Using informed judgment, address the
Figure 1-5 National Mean Feeling Thermometer Scores, Highest to Lowest
010
Sci
enti
sts
Chr
isti
ans
Pol
ice
Poo
r P
eopl
eW
hite
sJe
ws
Bla
cks
Asi
ans
His
pani
csG
ays
US
Sup
rem
e C
ourt
Uni
ons
Con
serv
ativ
esFe
min
ists
Tran
sgen
ders
Mus
lims
Bar
ack
Oba
ma
Ric
h P
eopl
eC
hris
tian
Fun
dam
enta
lists
Libe
rals
Big
Bus
ines
sB
ill C
linto
nB
lack
Liv
es M
atte
rD
emoc
rats
Mik
e P
ence
Tim
Kan
eTe
a P
arty
Hill
ary
Clin
ton
(pos
t)C
ongr
ess
Rep
ublic
ans
Hill
ary
Clin
ton
(pre
)D
onal
d Tr
ump
(pos
t)Il
lega
l Alie
nsD
onal
d Tr
ump
(pre
)
2030405060708090
100
0102030405060708090100
Copyright ©2020 by SAGE Publications, Inc. This work may not be reproduced or distributed in any form or by any means without express written permission of the publisher.
Do not
copy
, pos
t, or d
istrib
ute

22 The essenTials of PoliTical analysis
face validity question: Are there good reasons to think that this instrument would not produce an accurate measurement of the intended characteristic, political effi-cacy? Think of an individual or group of individuals whose sense of efficacy is so weak that they think there is no way to have a say in government; to them, voting is not a way for them to have a say about how the government runs things. At the conceptual level, one would certainly consider such people to have a low amount of the intended characteristic. But how might they respond to the survey question? Quite reasonably, they could say “disagree,” a response that would measure them as having a large amount of the intended characteristic. Taken at face value, then, this survey question is not a valid measure.22 This example underscores a general problem posed by factors that affect validity. We sometimes can identify potential sources of systematic error and suggest how this error is affecting the operational measure. Thus, people with low and durable levels of efficacy might be measured, instead, as being politically efficacious. However, it is difficult to know the size of this effect. How many people are being measured inaccurately? A few? Many? It is impossible to know.
On a more hopeful note, survey methodologists have developed effective ways of weakening the chronic distortion of measurement bias, even when the reasons for the bias, or its precise size, remain unknown. For example, consider the systematic error that can be introduced by the order in which respondents answer a pollster’s questions. Consider the following two questions about abortion. Again, feel free to answer them yourself.
(1) Do you think it should be possible for a pregnant woman to obtain a legal abortion if there is a strong chance of serious defect in the baby?
Yes
No
(2) Do you think it should be possible for a pregnant woman to obtain a legal abortion if she is married and does not want any more children?
Yes
No
Did the first question cause you to read more into the married woman not wanting any more children than is stated in the question? It turns out that when the questions are asked in this order, the second question receives a substantially higher percentage of “No” responses than it does otherwise.23 A palliative is available for such question-order effects: Randomize the order in which the questions appear in a survey. In this way, systematic measurement error is transformed into random measurement error. Random measurement error may not be cause for celebration among survey designers but, as we have seen, random error is easier to deal with than systematic error.24
In the construct validity approach, the researcher examines the empirical relationships between a measurement and other concepts to which it should be related. Here the researcher asks, “Does this measurement have relationships with other concepts that one would expect it to have?” For example, if the SAT is a valid measure of high school students’ readiness for college, then SAT scores should be strongly related to subsequent grade point averages earned by college students. If the SAT is an inaccurate measure of readiness, then this relationship will be weak. Evaluating the SAT’s construct validity in this manner requires measuring students’ academic performance for years after they take the SAT.25
Copyright ©2020 by SAGE Publications, Inc. This work may not be reproduced or distributed in any form or by any means without express written permission of the publisher.
Do not
copy
, pos
t, or d
istrib
ute

chaPTer one • The DefiniTion anD MeasureMenT of concePTs 23
Here is an example of evaluating construct validity in political science research. For many years, the American National Election Study has provided a measurement of the concept of party identification, the extent to which individuals feel a sense of loyalty or attachment to one of the major political parties. This concept is measured by a 7-point scale. Each person self-classifies as a Strong Democrat, Weak Democrat, Independent-leaning Democrat, Independent–no partisan leanings, Independent-leaning Republican, Weak Republican, or Strong Republican. If we apply the face validity approach, this measure is difficult to fault. Following an initial gauge of direc-tion (Democrat, Independent, Republican), interviewers meticulously lead respon-dents through a series of probes, recording gradations in the strength of their partisan attachments: strongly partisan, weakly partisan, independent-but-leaning partisan, and purely independent.26 Durable unintended characteristics are not readily appar-ent in this measurement strategy. But let’s apply the construct validity approach.
If the 7-point scale of self-reported party identification accurately measures strength of individuals’ party identification, then the reported values should bear predictable relationships to other concepts. For example, we would expect people who strongly identify with a political party, whether Democrats or Republicans, to be more likely to vote in their party’s primary or caucus elections and in general elections, presumably for their party’s candidate. By the same token, we would expect weak par-tisans to vote less frequently, Independent leaners less still, and Independents, who don’t identify with either party, least of all. That is the logic of construct validity. If the 7-point scale is a valid measure of partisan strength, then it should relate to clearly partisan behaviors (voting in partisan elections) in an expected way. How does the concept of party identification fare in this test of its validity?
Figure 1-6 shows the empirical relationship between the 7-point party identi-fication measurement and voting in 2016 elections. The values of party identifica-tion appear on the horizontal axis. The vertical axis records the percentage voting in primary/caucus elections and the general election in 2016. This particular graphic form is an error bar chart, because it also displays 95 percent confidence intervals for each percentage as vertical segments to indicate the amount of random measurement
Figure 1-6 Relationship between Party Identification and Voting in 2016
Perc
enta
ge V
otin
g
Primary or Caucus
Stron
g Dem
ocrat
Stron
g Rep
ublic
an
Weak D
emoc
rat
Weak R
epub
lican
Inde
p. D
emoc
rat
Inde
p. R
epub
lican
Inde
pend
ent
General Election
0
20
40
60
80
100
Source: 2016 American National Election Study.
Copyright ©2020 by SAGE Publications, Inc. This work may not be reproduced or distributed in any form or by any means without express written permission of the publisher.
Do not
copy
, pos
t, or d
istrib
ute

24 The essenTials of PoliTical analysis
error contained in each estimate. If one percentage’s error bar overlaps with another percentage’s error bar, the two means are equivalent, statistically speaking. (Error bar charts are covered in Chapter 7.)
Notice that, as expected, people at the strongly partisan poles, Strong Democrats and Strong Republicans, were the most likely to vote in both types of elections. And, again as expected, pure Independents were the least likely to vote in these elections. Beyond these expectations, is anything amiss here? Notice that Weak Republicans, measured as having stronger party ties than Independent-leaning Republicans, were slightly less likely to report voting in the 2016 elections than were Independent-leaning Republicans. A similar comparison on the Democrat side of the scale—Weak Democrats compared with Independent-leaning Democrats—shows the same thing: Weak par-tisans and people measured as Independents with partisan leanings demonstrated no meaningful difference in an explicitly partisan behavior, voting in partisan elections.
Scholars who have examined the relationships between the 7-point scale and other concepts also have found patterns similar to that shown in Figure 1-6.27 In applying the construct validity approach, we can use empirical relationships such as that displayed in Figure 1-6 to evaluate an operational measure. What would we conclude from this example about the validity of this measurement of partisanship? Clearly the measure is tapping some aspect of the intended characteristic. After all, the scale “behaves as it should” among strong partisans and pure Independents. But how would one account for the unexpected behavior of weak partisans and inde-pendent leaners? What durable unintended characteristic might the scale also be measuring? Some scholars have suggested that the scale is tapping two durable char-acteristics—one’s degree of partisanship (the intended characteristic) and one’s degree of independence (an unintended characteristic)—and that the two concepts, partisan-ship and independence, should be measured separately.28 Others have argued that a fundamental mismatch exists between the concept of party identification and the questions used to measure it, and that a new survey protocol is needed.29 There is, to put it mildly, spirited debate on this and other questions about the measurement of party identification.
Rest assured that debates about validity in political science are not academic games of “gotcha,” with one researcher proposing an operational measure and another researcher marshaling empirical evidence to shoot it down. Rather, the debate is productive. It is centered on identifying potential sources of systematic error, and it is aimed at improving the quality of widely used operational measures. It bears emphasizing, as well, that although the problem of validity is a concern for the entire enterprise of political analysis, some research is more prone to it than others. A student of state politics could obtain a valid measure of the concept of state-supported education fairly directly, by calculating a state’s per capita spending on education. A congressional scholar would validly measure the concept of party cohesion by figuring out, across a series of votes, the percentage of times a majority of Democrats opposed a majority of Republicans. In these examples, the connection between the concept and its operational definition is direct and easy to recognize. By contrast, researchers interested in individual-level surveys of mass opinion, as the above examples illustrate, often face tougher questions of validity.
WORKING WITH DATASETS, CODEBOOKS, AND SOFTWARE
We have already discussed how political science concepts are defined and measured. Conceptual definitions emphasize measurable properties that vary. Operational
Copyright ©2020 by SAGE Publications, Inc. This work may not be reproduced or distributed in any form or by any means without express written permission of the publisher.
Do not
copy
, pos
t, or d
istrib
ute
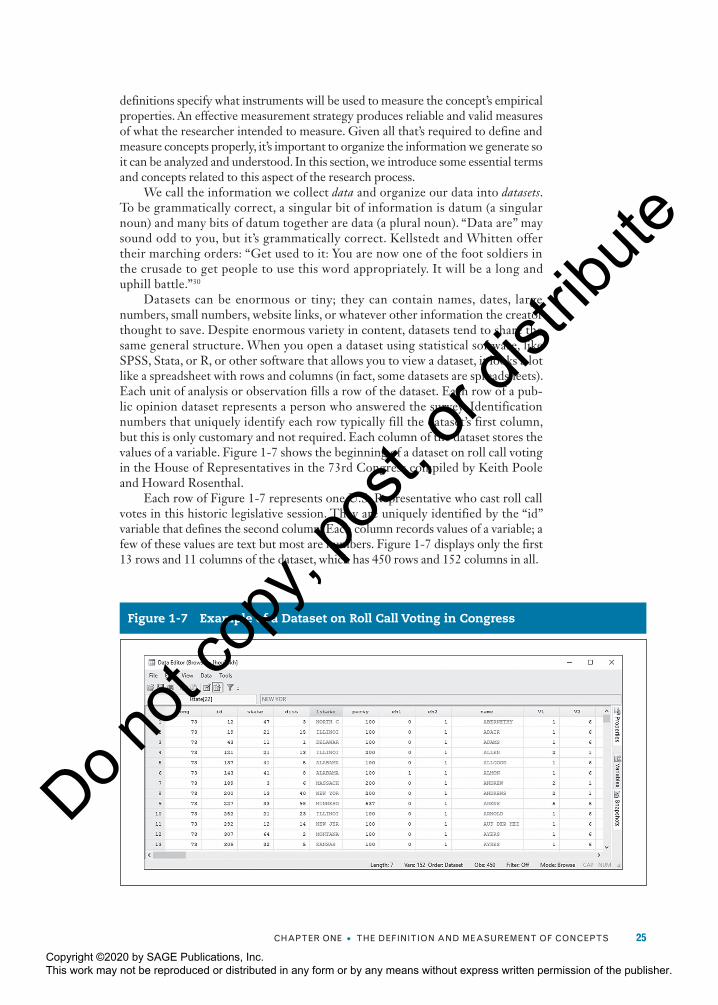
chaPTer one • The DefiniTion anD MeasureMenT of concePTs 25
definitions specify what instruments will be used to measure the concept’s empirical properties. An effective measurement strategy produces reliable and valid measures of what the researcher intended to measure. Given all that’s required to define and measure concepts properly, it’s important to organize the information we generate so it can be analyzed and understood. In this section, we introduce some essential terms and concepts related to this aspect of the research process.
We call the information we collect data and organize our data into datasets. To be grammatically correct, a singular bit of information is datum (a singular noun) and many bits of datum together are data (a plural noun). “Data are” may sound odd to you, but it’s grammatically correct. Kellstedt and Whitten offer their marching orders: “Get used to it: You are now one of the foot soldiers in the crusade to get people to use this word appropriately. It will be a long and uphill battle.”30
Datasets can be enormous or tiny; they can contain names, dates, large numbers, small numbers, website links, or whatever other information the creator thought to save. Despite enormous variety in content, datasets tend to share the same general structure. When you open a dataset using statistical software, like SPSS, Stata, or R, or other software that allows you to view a dataset, it looks a lot like a spreadsheet with rows and columns (in fact, some datasets are spreadsheets). Each unit of analysis or observation fills a row of the dataset. Each row of a pub-lic opinion dataset represents a person who answered the survey. Identification numbers that uniquely identify each row typically fill the dataset’s first column, but this is only customary and not required. Each column of the dataset stores the values of a variable. Figure 1-7 shows the beginning of a dataset on roll call voting in the House of Representatives in the 73rd Congress compiled by Keith Poole and Howard Rosenthal.
Each row of Figure 1-7 represents one U.S. Representative who cast roll call votes in this historic legislative session. They are uniquely identified by the “id” variable that defines the second column. Each column records values of a variable; a few of these values are text but most are numbers. Figure 1-7 displays only the first 13 rows and 11 columns of the dataset, which has 450 rows and 152 columns in all.
Figure 1-7 Example of a Dataset on Roll Call Voting in Congress
Copyright ©2020 by SAGE Publications, Inc. This work may not be reproduced or distributed in any form or by any means without express written permission of the publisher.
Do not
copy
, pos
t, or d
istrib
ute

26 The essenTials of PoliTical analysis
It’s easy to tell what some of the entries shown in Figure 1-7 mean; “cong” is the term for Congress and “name” is the member’s last name. But the meaning of some of these variables isn’t self-evident. If you’re using a dataset, it’s important to know how the authors measured concepts of interest. You can look up variable names, descrip-tions, and other important information about a dataset in a codebook. The codebook for this dataset, for example, informs us that the values in column 3 (“state”) refer to two-digit Inter-university Consortium for Political and Social Research (ICPSR) state codes and provides a key to the numeric party codes in the sixth column (100 is the code for Democrats who controlled the House in 1932).31 We can also find more information about the roll call votes taken in this Congress (you can see V1 and V2 on the far right of Figure 1-7). The first vote recorded in this Congress, “V1,” elected Rep. Henry Rainey, D-IL, to Speaker of the House on March 9, 1933.
If you compile a dataset through original research or create new variables by transforming variables in an existing dataset, document your work carefully so it’s clear what you have done. If your dataset is for personal use, you don’t need to create a publication-quality codebook, but you should take notes that you can refer to later.
Researchers clearly define concepts and measurement strategies so others can evaluate, replicate, and improve upon their work. Scientific knowledge is transmis-sible; the knowledge we produce contributes to an ongoing conversation among academic researchers. This is how we build upon prior research and make scientific progress. The data you see recorded in Figure 1-7, for example, have been made available to generations of American politics scholars. Researchers can use this data-set along with datasets on other terms of Congress (from the first term of Congress to the present day). Researchers can also use the identification codes to merge this dataset with additional data on members of Congress and the states they represent.32
As you’ve learned, there are different ways to measure a conceptual property that varies. The property or characteristic that interests us may vary across units of analysis at a given time and it also may vary within the units of analysis over time. A dataset that compiles information collected at one time to study properties that vary across the units of analysis is a cross-sectional dataset. Data from cross-sectional studies are the norm in social science research. Most public opinion studies are cross-sections of the population. A cross-sectional study contains information on units of analysis measured at one point in time. Respondents a, b, and c are interviewed—that’s it.
A dataset that compiles information collected at different time intervals to study properties that vary over time is a time-series dataset. Time-series datasets typically record an aggregate-level variable’s values at regular time intervals. For example, the president’s public approval ratings vary over time and can be measured at regular intervals.
Another type of dataset, called pooled datasets or time-series cross-sectional datasets, incorporates cross-sectional and longitudinal variation. A pooled dataset on public opinion on issues 1, 2, and 3, for example, might ask Respondents a, b, and c questions 1, 2, and 3 one year and ask Respondents x, y, and z questions 1, 2, and 3 the next year. Notice that the pooled dataset asked the same questions to different respondents in years one and two. A special subset of pooled data, panel dataset or panel studies, feature both cross-section and temporal variation by using the same subjects over time. The test-retest and alternative-form approaches to evaluating reliability, discussed above, require data obtained from panel studies. A panel study contains information on the same units of analysis measured at two or more points in time. Respondents a, b, and c are interviewed at time 1; Respondents a, b, and c are interviewed again at time 2. Panel studies allow researchers to observe variation within each unit, but they’re rare gems because researchers must invest significant time and resources to produce them.
Copyright ©2020 by SAGE Publications, Inc. This work may not be reproduced or distributed in any form or by any means without express written permission of the publisher.
Do not
copy
, pos
t, or d
istrib
ute

chaPTer one • The DefiniTion anD MeasureMenT of concePTs 27
SUMMARY
In this chapter we introduced the essential features of concepts and measurement. A concept is an idea, an abstract mental image that cannot be analyzed until its concrete properties are measured. A main goal of social research is to express concepts in con-crete language, to identify the empirical properties of concepts so that they can be analyzed and under-stood. This chapter described a heuristic that may help you to clarify the concrete properties of a con-cept: Think of polar-opposite subjects, one of whom has a great deal of the concept’s properties and the other of whom has none of the properties. The prop-erties you specify should not themselves be concepts, and they should not describe the characteristics of a different concept. It may be, as well, that the concept you are interested in has more than one dimension.
This chapter described how to write a conceptual definition, a statement that communicates variation
within a characteristic, the units of analysis to which the concept applies, and how the concept is to be measured. Important problems can arise when we measure a concept’s empirical properties—when we put the conceptual definition into operation. Our measurement strategy may be accompanied by a large amount of random measurement error, error that produces inconsistently incorrect measures of a con-cept. Random error undermines the reliability of the measurements we make. Our measurement strategy may contain systematic measurement error, which produces consistently incorrect measures of a con-cept. Systematic error undermines the validity of our measurements. Although measurement problems are a persistent worry for social scientists, all is not lost. Researchers have devised productive approaches to enhancing the reliability and validity of their measures.
Take a closer look. edge.sagepub.com/pollock
KEY TERMS
aggregate-level unit of analysis (p. 8)
alternative-form method (p. 18)
codebook (p. 26)concept (p. 1)conceptual definition (p. 2)conceptual dimension (p. 6)conceptual question (p. 2)concrete question (p. 2)construct validity (p. 22)Cronbach’s alpha (p. 19)cross-level analysis (p. 9)cross-sectional dataset (p. 26)
cross-sectional study (p. 26)ecological fallacy (p. 9)face validity (p. 20)feeling thermometer (p. 10)Hawthorne effect (p. 14)individual-level unit of
analysis (p. 8)multidimensional
concept (p. 6)operational definition (p. 2)panel study (p. 26)random measurement
error (p. 13)
reliability (p. 16)split-half method
(p. 19)systematic
measurement error (p. 13)
test-retest method (p. 18)
time-series dataset (p. 26)unit of analysis
(p. 8)
validity (p. 17)
EXERCISES
1. Suppose you wanted to study the role of religious belief, or religiosity, in politics and society. You would begin by setting up an
inventory of empirical properties, contrasting the mental images of a religious person and a nonreligious person.
a religious person: a nonreligious person:
a. regularly prays a. never prays
b. b.
c. c.
Screencasts
Chapter 1, Pt. 1
Chapter 1, Pt. 2
Copyright ©2020 by SAGE Publications, Inc. This work may not be reproduced or distributed in any form or by any means without express written permission of the publisher.
Do not
copy
, pos
t, or d
istrib
ute

28 The essenTials of PoliTical analysis
A. Item a, “regularly prays/never prays,” provides a good beginning for the inventory. Think up and write down two additional items, b and c.
B. As discussed in this chapter, a common problem in developing an empirical inventory is that we often come up with items that measure a completely different concept. For example, in constructing the liberal-conservative inventory, we saw that “has low income”/”has high income” did not belong on the list because income and ideology are different concepts. For each item you chose in part A, explain why you think each property is a measure of religiosity and does not measure any other concept.
C. Using one of your items, b or c, write a conceptual definition of religiosity. In writing the conceptual definition, be sure to use the template presented in this chapter.
2. Finding 1: An examination of state-level data on electoral turnout reveals that as states’ percentages of low-income citizens increase, turnout increases. Conclusion: Low-income citizens are more likely to vote than are high-income citizens.
A. For the purposes of this exercise, assume that Finding 1 is correct—that is, assume that Finding 1 describes the data accurately. Is the conclusion supported? Making specific reference to a problem discussed in this chapter, explain your answer.
B. Suppose that, using individual-level data, you compared the voting behavior of low-income citizens and high-income citizens. Finding 2: Low-income citizens are less likely to vote than high-income citizens. Explain how Finding 1 and Finding 2 can both be correct.
3. This chapter discussed the Hawthorne effect, a measurement problem that can arise when people are aware they are being studied. In public opinion surveys, similar measurement issues, social desirability effects, can distort expressed levels of support for controversial social policies, such as affirmative action
programs that give hiring preferences to blacks. As you can imagine, this problem is often heightened when respondents are aware of the demographic characteristics of the interviewer, such as the interviewer’s race or sex. Consider an example, using respondents’ knowledge of the interviewer’s sex. The 2012 General Social Survey asked respondents the following question:
“Do you happen to have in your home (or garage) any guns or revolvers?”
Yes
No
Refused
A. Perform a mental experiment. Visualize a group of respondents, all of whom do, in fact, have guns in their homes. (i) Do you think that a sizeable number of these respondents would be less willing to answer truthfully “yes” if the interviewer were female than if the interviewer were male? (ii) Explain the reasoning behind your answer in (i). (There is no correct or incorrect answer. Just think about it and explain your logic.)
B. Now think about the two types of measurement error we discussed in this chapter: systematic measurement error and random measurement error. With that difference in mind, suppose you discovered that respondents in the 2012 GSS were substantially less likely to answer “yes” to female interviewers than to male interviewers. (i) Would this be a problem of systematic measurement error or random measurement error? (ii) Explain your answer in (i) in part B, making reference to the difference between the two types of error.33
4. Four researchers, Warren, Xavier, Yolanda, and Zelda, have devised different operational measures for gauging individuals’ levels of political knowledge. Each researcher’s operational measure is a scale ranging from 0 (low knowledge) to 100 (high knowledge). For the purposes of this exercise, assume that you know—but the researchers do not know—that the “true” level of knowledge of a test respondent is equal to 50. The researchers
Copyright ©2020 by SAGE Publications, Inc. This work may not be reproduced or distributed in any form or by any means without express written permission of the publisher.
Do not
copy
, pos
t, or d
istrib
ute

chaPTer one • The DefiniTion anD MeasureMenT of concePTs 29
measure the respondent four times. Here are the measurements obtained by each of the four researchers:
Warren: 40, 60, 70, 45Xavier: 48, 48, 50, 54Yolanda: 49, 50, 51, 50Zelda: 45, 44, 44, 46
A. Which researcher’s operational measure has high validity and high reliability? Explain.
B. Which researcher’s operational measure has high validity and low reliability? Explain.
C. Which researcher’s measure has low validity and high reliability? Explain.
D. Which researcher’s measure has low validity and low reliability? Explain.
5. Two candidates are running against each other for a seat on the city commission. You would like to obtain a valid measurement of which candidate has more pre-election support among the residents of your neighborhood. Your operational measure: Obtain a precise count of yard signs supporting each candidate. The candidate with a greater number of yard signs will be measured as having greater pre-election support than the candidate having fewer yard signs.
Recall this chapter’s discussion of face validity. In assessing face validity, the researcher asks, “Are there good reasons to think that this measure is not an accurate gauge of the intended characteristic?” Clearly the yard-sign measurement strategy has low face validity, because it clearly measures unintended characteristics—characteristics other than pre-election support for the two candidates. For example, because yard signs cost money, a yard-sign count may be measuring the size of candidates’ campaign budgets, not necessarily potential support among the voting public. Describe two additional unintended characteristics that, plausibly, are being measured by a count of the number of yard signs.
6. Mutt Jeffley wants to weigh his dog. He proceeds as follows: While holding the dog, he steps onto a bathroom scale and records the weight. Just to make sure he got it right, he
repeats the procedure: While holding the dog, he steps onto the scale a second time and again records the weight. Obviously, Mutt’s strategy will produce a faulty measurement of the intended characteristic, the weight of his dog. Review this chapter’s discussion of reliability and validity. Again examine Figure 1-4, which uses a target analogy to illustrate combinations of the criteria of measurement.
A. Which of these scenarios best fits Mutt’s measurement of his dog’s weight?
Not reliable or valid
Valid but not reliable
Reliable but not valid
B. Making reference to the characteristics of reliability and validity, explain your answer in A.
C. Describe how Mutt could change his measurement procedure to produce a measurement of his dog’s weight that is both valid and reliable.
7. Conflicts that arise in environmental policy are often framed as trade-offs between protecting the environment and creating jobs. The ongoing debate over the Keystone XL Pipeline, which pits environmental groups against the fossil fuels industry, is one example. The spotted owl controversy of the 1990s, which arrayed animal rights activists and environmentalists against logging interests, is another. Survey researchers have sought to measure individuals’ opinions on trade-offs such as these. In the traditional measure of the trade-off, respondents are shown a 7-point scale and asked to place themselves at one of the seven positions, from “protect environment, even if it costs jobs and standard of living” at point 1, to “jobs and standard of living more important than environment” at point 7.
Env
iron
men
t
Jobs2 3 4 5 6
A. Think about the face validity of this survey instrument. Recall that, in evaluating face validity, the researcher asks, “Are there good reasons to think that this measure
Copyright ©2020 by SAGE Publications, Inc. This work may not be reproduced or distributed in any form or by any means without express written permission of the publisher.
Do not
copy
, pos
t, or d
istrib
ute

30 The essenTials of PoliTical analysis
is not an accurate gauge of the intended characteristic?” In considering its face validity, you may even wish to assess whether this scale would validly measure your own position on the environment versus jobs trade-off. (i) Do you think that this scale has high face validity or low face validity? (ii) Explain your answer in (i).
B. Suppose you use this measure in your own survey, obtaining data on a large number of individuals. Suppose further that you decide to test the construct validity of the scale. Recall that, in evaluating construct validity, the researcher asks, “Does this measurement have relationships with other concepts that one would expect it to have?” For example, researchers have evaluated the construct validity of the party identification scale by seeing how well it relates to voting turnout in primary and general elections: stronger partisans should have higher turnouts than weaker partisans. Consider three possible ways to test the constructive validity of the environment-jobs trade-off scale. One could examine the relationship between the scale and respondents’ opinions on (i) abortion, (ii) climate change, or (iii) business regulation. Which one of these three relationships would provide the best test of construct validity? Explain your answer. If the scale had high construct validity, what would the relationship “look like”?
8. This chapter discussed the different ways that data are collected and organized for analysis. Of particular importance is the difference between cross-sectional data and longitudinal data. For each of the situations described in parts A and B, answer the following: (i) State whether the researcher’s dataset will be cross-sectional or longitudinal. (ii) Explain how you know.
A. Using data obtained from Freedom House on the 100 largest countries of the world, a researcher plans to analyze the spread of the Internet between 1990 and the present day.
B. Another researcher, using data on the 100 largest countries for the most current year, seeks to analyze the relationship between countries’ gross domestic product (GDP) per capita and level of civil unrest.
9. Over the past several years, the term “polarization” has been receiving a lot of attention from political journalists and academics, particularly with regard to American politics. Democratic and Republican voters are said to be “polarized,” as are members of the House and Senate. Think for a moment about the concept of polarization. To say that the electorate, for example, is polarized, one must also have an idea of what shape a nonpolarized electorate would take. Political scientists have, of course, addressed the measurement issues associated with this concept.
A. Using available Internet resources, such as your library’s access to online journals, search for one of the following: American Journal of Political Science, Journal of Politics, or American Political Science Review. Having located one of these journals, type “polarization” in the search bar and find a scholarly article on the topic. Write down the article’s reference: author(s), title, journal, and date. (Note: you will need to gain access to the full article, not simply the article’s abstract.)
B. Browse the article you cited in part A. Write a paragraph that describes the operational definition of polarization. That is, how is the concept operationally measured in the research article?
NOTES
1. Hanna Fenichel Pitkin, The Concept of Representation (Berkeley: University of California Press, 1972), 1–2 (emphasis in original).
2. Of course, you might want to use a concept to study different units of analysis. This is discussed below.
3. Many interesting and frequently discussed concepts have commonly accepted labels for these opposites. For example, we refer to political systems as “demo-cratic” or “authoritarian,” or individuals as “reli-gious” or “secular.” In this example, we will contrast “liberal” with “conservative.”
Copyright ©2020 by SAGE Publications, Inc. This work may not be reproduced or distributed in any form or by any means without express written permission of the publisher.
Do not
copy
, pos
t, or d
istrib
ute

chaPTer one • The DefiniTion anD MeasureMenT of concePTs 31
4. Supreme Court Justice Potter Stewart, in Jacobellis v. Ohio (1964): “I have reached the conclusion . . . that under the First and Fourteenth Amendments crimi-nal laws in this area are constitutionally limited to hard-core pornography. . . . I shall not today attempt further to define the kinds of material I understand to be embraced within that shorthand description; and perhaps I could never succeed in intelligibly doing so. But I know it when I see it, and the motion picture involved in this case is not that.”
5. Liberalism may have additional dimensions. Racial issues, such as affirmative action, might form a sepa-rate dimension, and attitudes toward military force versus diplomacy in foreign policy may be separate, as well. For a good introduction to this multidimen-sional concept, see William S. Maddox and Stuart A. Lilie, Beyond Liberal and Conservative: Reassessing the Political Spectrum (Washington, D.C.: Cato Institute, 1984).
6. Robert A. Dahl, Polyarchy: Participation and Opposition (New Haven, Conn.: Yale University Press, 1971).
7. For example, see Michael Coppedge, Angel Alvarez, and Claudia Maldonado, “Two Persistent Dimensions of Democracy: Contestation and Inclusiveness,” Journal of Politics 70, no. 3 (July 2008): 632–647.
8. Among social scientists, cross-disciplinary debate exists concerning the measurement and dimension-ality of social status. Political scientists generally prefer objective measures based on income, educa-tion, and (less frequently used) occupational status. See Sidney Verba and Norman Nie’s classic, Participation in America: Political Democracy and Social Equality (New York: Harper and Row, 1972). Sociologists and social psychologists favor subjective measures, attributes gauged by asking individuals which social class they belong to. Furthermore, social status may have a separate dimension based on status within one’s community, as distinct from sta-tus in society as a whole. See research using the MacArthur Scale of Subjective Social Status, John D. and Catherine T. MacArthur Research Network on Socioeconomic Status and Health, https:// macses.ucsf.edu.
9. What accounted for these paradoxical findings? The aggregate-level pattern was produced by the ten-dency for immigrants to settle in states whose native-born residents had comparatively high levels of language proficiency. W. S. Robinson, “Ecological
Correlations and the Behavior of Individuals,” American Sociological Review 15, no. 3 (June 1950): 351–357. See also William Claggett and John Van Wingen, “An Application of Linear Programming to Ecological Inf luence: An Extension of an Old Procedure,” American Journal of Political Science 37 (May 1993): 633–661.
10. Indeed, Emile Durkheim’s towering study of reli-gion and suicide, published in 1897, may have suf-fered from it. Emile Durkheim, Suicide [1897], English translation (New York: Free Press, 1951). Durkheim found that populations with higher pro-portions of Protestants had higher suicide rates than Catholic populations. However, see Frans van Poppel and Lincoln H. Day, “A Test of Durkheim’s Theory of Suicide—Without Committing the ‘Ecological Fallacy,’” American Sociological Review 61, no. 3 (June 1996): 500–507.
11. There are some results that do apply across levels of aggregation. For example, smoking rate is related to cancer rate at both aggregate and individual levels. The point is, one should not assume a relationship that exists at the aggregate level also exists at the individual level.
12. The term operational definition, used universally in social research, is something of a misnomer. An operational definition does not take the same form as a conceptual definition, in which a conceptual term is defined in empirical language. Rather, an opera-tional definition describes a procedure for measur-ing the concept. Measurement strategy is probably a more descriptive term than operational definition.
13. This was the first use of the device in the ANES time-series studies. See “1964 Time Series Study,” https://electionstudies.org/project/1964-time-series-study/.
14. The term Hawthorne effect gets its name from a series of studies of worker productivity conducted in the late 1920s at the Western Electric Hawthorne Works in Chicago. Sometimes called reactive measurement effects, Hawthorne effects can be fairly durable, changing little over time. Test anxiety is an example of a durable reactive measurement effect. Other measurement effects are less durable. Some human subjects may initially respond to the novelty of being studied, and this effect may decrease if the subjects are tested again. The original Hawthorne effect was such a response to novelty. See Neil M. Agnew and Sandra W. Pyke, The Science Game, An Introduction to
Copyright ©2020 by SAGE Publications, Inc. This work may not be reproduced or distributed in any form or by any means without express written permission of the publisher.
Do not
copy
, pos
t, or d
istrib
ute

32 The essenTials of PoliTical analysis
Research in the Social Sciences (Englewood Cliffs, N.J.: Prentice Hall, 1994), 159–160.
15. The research on political tolerance is voluminous. This discussion is based mostly on the work of Samuel A. Stouffer, Communism, Conformity and Civil Liberties (New York: Wiley, 1966), and the con-ceptualization offered by John L. Sullivan, James Piereson, and George E. Marcus, “An Alternative Conceptualization of Tolerance: Illusory Increases, 1950s–1970s,” American Political Science Review 73, no. 3 (September 1979): 781–794. For further read-ing, see George E. Marcus, John L. Sullivan, Elizabeth Theiss-Morse, and Sandra L. Wood, With Malice toward Some: How People Make Civil Liberties Judgments (New York: Cambridge University Press, 1995). For an excellent review of conceptual and measurement issues, see James L. Gibson, “Enigmas of Intolerance: Fifty Years after Stouffer’s Communism, Conformity, and Civil Liberties,” Perspectives on Politics 4, no. 1 (March 2006): 21–34.
16. The least-liked approach was pioneered by Sullivan, Piereson, and Marcus , “A n A lternat ive Conceptualization of Tolerance.” This measurement technology is more faithful to the concept of toler-ance because it satisfies what Gibson terms “the objection precondition,” the idea that “one cannot tolerate (i.e., the word does not apply) ideas of which one approves. Political tolerance is forbearance; it is the restraint of the urge to repress one’s political enemies. Democrats cannot tolerate Democrats, but they may or may not tolerate Communists. Political tolerance, then, refers to allowing political activity . . . by one’s political enemies.” Gibson, “Enigmas of Intolerance,” 22.
17. W. Phillips Shively argues that reliability is a neces-sary (but not sufficient) condition of validity. According to Shively, only a consistent and accurate mark (lower-right panel of Figure 1-4) represents a valid measurement. Earl Babbie, however, argues that reliability and validity are separate criteria of mea-surement. Using the same target-shooting metaphor, Babbie characterizes the lower-left pattern as “valid but not reliable” and the lower-right panel as “valid and reliable.” See W. Phillips Shively, The Craft of Political Research, 6th ed. (Upper Saddle River, N.J.: Pearson Prentice Hall, 2005), 48–49; and Earl Babbie, The Practice of Social Research, 10th ed. (Belmont, Calif.: Thomson Wadsworth, 2004), 143–146.
18. On this and related points, see Edward G. Carmines and Richard A. Zeller, Reliability and Validity
Assessment (Thousand Oaks, Calif.: SAGE Publications, 1979).
19. Lee J. Cronbach, “Coefficient Alpha and the Internal Structure of Tests,” Psychometrika 16, no. 3 (September 1951): 297–334.
20. Most methodologists recommend minimum alpha coefficients of between .7 and .8. See Jum C. Nunnally and Ira H. Bernstein, Psychometric Theory, 3rd ed. (New York: McGraw-Hill, 1994); and Carmines and Zeller, Reliability and Validity Assessment, 51.
21. If the extent and direction of mismeasurement is known, it is easy to correct systematic errors. You’ve probably had an instructor grade a test on a curve; curving scores up or down corrects for the test being too hard or too easy relative to the target distribution of grades. As long as relative differences in test scores reflect differences in the variable being measured, the test is an effective measurement.
22. This example is from Herbert Asher, Polling and the Public: What Every Citizen Should Know, 8th ed. (Washington, D.C.: CQ Press, 2012), 123–124. Asher notes that this question has been dropped from the American National Election Study.
23. Howard Schuman, Stanley Presser, and Jacob Ludwig, “Context Effects on Survey Responses to Questions about Abortion,” Public Opinion Quarterly 45, no. 2 (Summer 1981): 216–223. Schuman, Presser, and Ludwig find the question-order effect on the “does not want any more children” item to be “both large and highly reliable,” although “[t]he exact inter-pretation of the effect is less clear than its reliability” (p. 219). Responses to the question citing a “serious defect in the baby” were the same, regardless of where it was placed. For an excellent review and anal-ysis of the abortion question-wording problem, see Carolyn S. Carlson, “Giving Conflicting Answers to Abortion Questions: What Respondents Say,” paper presented at the annual meeting of the Southern Political Science Association, New Orleans, January 6–8, 2005.
24. An individual’s susceptibility to question-order effects can be thought of as a durable unintended characteristic. Some people are more susceptible, others less so. If the questions are left in the same order for all respondents, then the answers of the susceptible respondents will be measured consis-tently, introducing bias into an overall measure of support for abortion rights. By randomizing the
Copyright ©2020 by SAGE Publications, Inc. This work may not be reproduced or distributed in any form or by any means without express written permission of the publisher.
Do not
copy
, pos
t, or d
istrib
ute

chaPTer one • The DefiniTion anD MeasureMenT of concePTs 33
question order, question-order susceptibility will be measured inconsistently—some respondents will see the “serious defect” question first, others will see the “does not want any more children” question first—introducing random noise into the measure of abor-tion rights.
25. For a discussion of how the construct validity approach has been applied to the Graduate Record Examination, see Janet Buttolph Johnson and H. T. Reynolds, Political Science Research Methods, 6th ed. (Washington, D.C.: CQ Press, 2008), 99.
26. The interviewer asks, “Generally speaking, do you think of yourself as a Republican, a Democrat, an Independent, or what?” Respondents are given six choices: Democrat, Republican, Independent, Other Party, No Preference, and Don’t Know. Those who choose Democrat or Republican are asked, “Would you call yourself a strong Democrat [Republican] or a not very strong Democrat [Republican]?” Those who choose Independent, Other Party, No Preference, or Don’t Know are asked, “Do you think of yourself as closer to the Republican Party or to the Democratic Party?” Interviewers record these responses: Closer to Republican Party, Neither, or Closer to Democratic Party. Of the 2,323 people who were asked these questions in the 2008 American National Election Study, 2,299 were classified along the 7-point scale, 8 identified with another party, 2 were apolitical, 8 refused to answer, and 6 said “Don’t know.”
27. Bruce E. Keith, David B. Magleby, Candice J. Nelson, Elizabeth A. Orr, Mark C. Westlye, and Raymond E. Wolfinger, The Myth of the Independent Voter (Berkeley: University of California Press, 1992).
28. Herbert F. Weisberg, “A Mult idimensional Conceptualization of Party Identification,” Political Behavior 2, no. 1 (1980): 33–60. The measurement problem illustrated by Figure 1-6 is known as the intransitivity problem. For a concise review of the
scholarly debate about intransitivity and other measurement issues, see Richard G. Niemi and Herbert F. Weisberg, Controversies in Voting Behavior, 4th ed. (Washington, D.C.: CQ Press, 2001), ch. 17.
29. See Barry C. Burden and Casey A. Klofstad, “Affect and Cognition in Party Identification,” Political Psychology 26, no. 6 (2005): 869–886. Burden and Klofstad point out that party identification has been conceptually defined as an affective attachment, one based on feeling—much like individuals’ religious affiliations or sense of belonging to social groups. The survey questions that measure party identifica-tion, by contrast, use cognitive cues, based on think-ing: “Generally speaking, do you think of yourself as a Republican, a Democrat, an Independent, or what?” When they compare a group of respondents who were asked the traditional thinking-based ques-tions with a group who were asked new feeling-based questions, Burden and Klofstad find dramatic differ-ences between the two groups in the distribution of party identification.
30. Paul M. Kellstedt and Guy D. Whitten, The Fundamentals of Political Science Research (New York: Cambridge Univ. Press 2009), p. 79.
31. See https://legacy.voteview.com/house73.htm.
32. See, for example, the visualization of the vote to elect Speaker Rainey, which has evolved from Poole and Rosenthal’s work on roll call voting in Congress. See https://voteview.com/rollcall/RH0730001.
33. Here are the data from the 2012 GSS question “Do you happen to have in your home (or garage) any guns or revolvers?” When a male interviewer asked this question, 41.5 percent of respondents said yes, 56.2 percent said no, and 2.3 percent refused. When a female interviewer asked this question, 33.2 per-cent of respondents said yes, 64.8 percent said no, and 1.9 percent refused. Thus, there was about a 8-point difference in “yes” responses, depending on the interviewer’s sex.
Copyright ©2020 by SAGE Publications, Inc. This work may not be reproduced or distributed in any form or by any means without express written permission of the publisher.
Do not
copy
, pos
t, or d
istrib
ute