one-axis trackers -- improved reliability, durability, performance
TRANSCRIPT

A national laboratory of the U.S. Department of EnergyOffice of Energy Efficiency & Renewable Energy
National Renewable Energy Laboratory Innovation for Our Energy Future
One-Axis Trackers – Improved Reliability, Durability, Performance, and Cost Reduction Final Subcontract Technical Status Report 2 May 2006 – 31 August 2007 J. Shingleton Shingleton Design, LLC Auburn, New York
Subcontract Report NREL/SR-520-42769 February 2008
NREL is operated by Midwest Research Institute ● Battelle Contract No. DE-AC36-99-GO10337

National Renewable Energy Laboratory1617 Cole Boulevard, Golden, Colorado 80401-3393 303-275-3000 • www.nrel.gov
Operated for the U.S. Department of Energy Office of Energy Efficiency and Renewable Energy by Midwest Research Institute • Battelle
Contract No. DE-AC36-99-GO10337
Subcontract Report NREL/SR-520-42769 February 2008
One-Axis Trackers – Improved Reliability, Durability, Performance, and Cost Reduction Final Subcontract Technical Status Report 2 May 2006 – 31 August 2007 J. Shingleton Shingleton Design, LLC Auburn, New York Prepared under Subcontract No. ZAX-4-33628-09

This publication was reproduced from the best available copy submitted by the subcontractor and received no editorial review at NREL
NOTICE This report was prepared as an account of work sponsored by an agency of the United States government. Neither the United States government nor any agency thereof, nor any of their employees, makes any warranty, express or implied, or assumes any legal liability or responsibility for the accuracy, completeness, or usefulness of any information, apparatus, product, or process disclosed, or represents that its use would not infringe privately owned rights. Reference herein to any specific commercial product, process, or service by trade name, trademark, manufacturer, or otherwise does not necessarily constitute or imply its endorsement, recommendation, or favoring by the United States government or any agency thereof. The views and opinions of authors expressed herein do not necessarily state or reflect those of the United States government or any agency thereof.
Available electronically at http://www.osti.gov/bridge
Available for a processing fee to U.S. Department of Energy and its contractors, in paper, from:
U.S. Department of Energy Office of Scientific and Technical Information P.O. Box 62 Oak Ridge, TN 37831-0062 phone: 865.576.8401 fax: 865.576.5728 email: mailto:[email protected]
Available for sale to the public, in paper, from: U.S. Department of Commerce National Technical Information Service 5285 Port Royal Road Springfield, VA 22161 phone: 800.553.6847 fax: 703.605.6900 email: [email protected] online ordering: http://www.ntis.gov/ordering.htm
Printed on paper containing at least 50% wastepaper, including 20% postconsumer waste

Table of Contents
Abstract ..........................................................................................................v Executive Summary......................................................................................vi 1 Introduction............................................................................................1 1.1 Objective.................................................................................................. 1 1.2 Background.............................................................................................. 1
2 Results & Recommendations ...............................................................2 2.1 Expanded Controller and Drive Capabilities ............................................. 2
2.1.1 Controller Improvements................................................................ 2 2.1.2 Drive Improvements ....................................................................... 5
2.2 Expanded Structural Design Studies...................................................... 10 2.2.1 T20 Design Effort ......................................................................... 10 2.2.2 Load Assessment......................................................................... 19 2.2.3 T20 Demonstration....................................................................... 24
2.3 Specification Development..................................................................... 31 2.3.1 Installation Manual ....................................................................... 31 2.3.2 Environmental Impact .................................................................. 38
2.4 System Design Tools ............................................................................. 38 2.4.1 Cost Evaluation............................................................................ 38 2.4.1 Performance Evaluation ............................................................... 42
3 Acknowledgements .............................................................................48
iii

List of Figures Figure 1: T0 ground system installation, including two drive units ........................... 6 Figure 2: Prototype T20 tracker installation in San Jose, California......................... 9 Figure 3: T20 pre-cast foundations in field installation........................................... 13 Figure 4: Drive strut connecting multiple T20 units................................................ 14 Figure 5: Telescoping legs allow for efficient stacking for transportation and
quick installation .................................................................................... 14 Figure 6: PV mounting hardware and clips............................................................ 15 Figure 7: One of two struts to protect PV from collision with drive strut ................. 16 Figure 8: T20 cassette loaded at delivery site ....................................................... 16 Figure 9: Scale model of T20 tracker system ........................................................ 20 Figure 10: T20 scale-model array in wind tunnel. Array is mounted on rotating
table to facilitate testing of wind in multiple directions ............................ 20 Figure 11. Mockup System ..................................................................................... 25 Figure 12: Prototype system with PV attached........................................................ 26 Figure 13: Prototype Shipping Cassette.................................................................. 27 Figure 14: Installed Prototype System ................................................................... 28\ Figure 15: Array layout for 10-unit demonstration system ....................................... 29 Figure 16: Installed Foundations............................................................................. 30 Figure 17: 10-unit demonstration installation........................................................... 31 Figure 18: Relative BOS Cost Comparison ............................................................. 42 Figure 19: Shading analysis example without backtracking .................................... 43 Figure 20: Shading Analysis Example with backtracking......................................... 43 Figure 21: T20 product performance in three locations ........................................... 44 Figure 22: Measured and TMY2 plane of array irradiance for September 1-26
in San Jose, CA ..................................................................................... 45 Figure 23: Measured and TMY2 ambient temperature for September 1-26 in
San Jose, CA......................................................................................... 46 Figure 24: Measured power and PVGrid-calculated power using typical
TMY2 weather data................................................................................47 List of Tables Table 1: Load Effects Evaluated for Tracker Structure ................................21
iv

Abstract
During this PV Manufacturing R&D subcontract, Shingleton Design LLC has made significant progress toward the improvement of tracker technologies through the development of a new modular tilted tracker. In partnership with SunPower Corporation, Shingleton Design built on the existing MaxTracker technology platform (T0) to develop a next-generation tracker technology with increased energy capture, improved reliability, and expanded deployment capabilities. The project team focused efforts on the development of the new structural design with emphasis on factory-based assembly, modular design, and rapid deployment. Improvements to the controller and drive subassemblies further improved tracker performance. Additional development of design and cost analysis tools enabled the commercialization of this product. This first-generation T20 platform offers the potential for 5-10% increased energy production at 5-6% cost reduction when evaluated on a performance basis, relative to the T0 technology. The T20 technology developed through this subcontract represents a significant evolution in PV systems technologies geared for utility-scale commercial installations.
v

Executive Summary
In 2006, Shingleton Design LLC initiated the development of a next-generation tracker technology in the PV Manufacturing R&D program under NREL Subcontract No. ZAX-6-33628-09. Working in partnership with SunPower Corporation, Shingleton Design developed a single-axis, tilted tracker, using a modular unit platform. This design represents the next step in the evolution of PV tracking systems, providing higher energy production at competitive balance-of-system costs.
The work effort focused on reducing the total cost of electricity generated by single-axis tracking solar energy systems for utility and other large-scale commercial applications. Developing a factory-assembled, modular tracker, while building on the strengths of the existing technology, resulted in improved performance and reliability and reduced installation time, cost, and environmental impact.
The next-generation structural design is based on modular units with a rotation axis tilted 20 degrees from horizontal. By incorporating a tilted axis, the system experiences higher direct solar insolation and thus generates more output when compared to a horizontal system. In addition, new design features allow the system to be more tolerant to variable terrain. These improvements lead to higher market penetration potential due to the potential for 5-10% increased energy production and reduced site preparation requirements.
Through SunPower Corporation, Systems, the new T20 tracker was deployed through small prototype installations and then at a commercial scale installation. Based on an initial evaluation of this installation, the annual $/kWh cost for T20 is projected to be 5-6% lower than T0. Given future potential for cost reduction in this first generation technology, these results demonstrate clear progress toward the goal of reaching grid parity, while enabling the expansion of the domestic PV infrastructure.
vi

1 Introduction
1.1 Objective
The overall objective of this subcontract is to reduce the total cost of electricity generated by single-axis tracking solar energy systems for utility and other large-scale commercial applications by improving performance and reliability and by reducing installation time, cost, and environmental impact.
1.2 Background
In 1999, Shingleton Design, LLC developed and introduced the MaxTracker PV tracking system (T0) – a single-axis tracker with the potential for low cost and high reliability. Compared to earlier tracking technologies, this platform represented a significant evolution in tracking technologies. While single-axis trackers entered the PV market in the early 1980s, these technologies enjoyed relatively little market penetration due to cost and reliability issues.
The T0 platform uses a simple mechanical linkage to track more than 250 kW of PV with a single motor/driver/controller assembly. This simplified design results in higher energy capture at a similar cost to a fixed array. With the potential for 15% to 35% improvement in energy production, the introduction of a cost-effective tracking technology facilitated the development of utility-scale PV systems. Since its introduction to the market, over 110 MW of T0 trackers have been installed worldwide.
Although the T0 product is the leading single-axis tracker technology, significant improvement opportunities with respect to design, installation, and cost led to the development of a new tilted tracker. This next-generation technology capitalizes on the strengths of the T0 technology, while improving energy production, facilitating rapid deployment, and enabling reliability improvements through factory-controlled QA/QC. The development of a next-generation tracker was carried out through the performance of the following tasks:
• Expanded Controller and Drive Capabilities
• Expanded Structural Design Studies
• Specification Development
• System Design Tools
Successful execution of these tasks has resulted in the development and initial deployment of the next-generation tracker technology with increased energy production at competitive costs, relative to existing technology at the start of the subcontract.
1

2 Results & Recommendations
2.1 Expanded Controller and Drive Capabilities
The objective of this task is to optimize the controller board, drive hardware, and the software interface with the goal of streamlining factory-integration, calibration, and field-installation activities.
2.1.1 Controller Improvements
Background
Task 1 under this subcontract was originally scoped to provide for the development of an improved controller for single axis tracking systems. Due to the lag between proposal and award for this subcontract, the originally proposed controller was substantially developed under separate funding. Under the NREL subcontract, the project team identified several improvements targeted at both improved performance and reliability. Consistent with the overall goals of this subcontract, these improvements have been undertaken as part of this subcontract.
The following sections describe the improvement undertaken so far under this subcontract with respect to the single axis controller. To provide a proper context for this work, a brief description of the overall controller design is also included.
Existing Controller Platform
The control system includes a control computer and support circuitry, as well as a drive unit comprised of a motor and linear actuator. These components, along with position and time feedback sensors, work in concert to set the angle of the PV array to maximize the solar energy collected at any particular time and date. Because the position of the sun is solely a function of time, date and location, an open loop system can be used to calculate tracking angles rather than relying on sensors to track the sun.
The following were the overall design goal for the improved controller: • Off-the-shelf components: Unlike prior systems, the controller developed under this
project is comprised exclusively of industrial off-the-shelf components. This approach enables the design team to leverage the cost structure, reliability, and performance of existing technology while reducing design time and resource usage. A custom solution is also not likely to generate enough volume to generate economies of scale needed to reduce cost significantly. Examples of off-the-shelf controller components that were used in the improved controller include an industrial Programmable Logic Controller (PLC), Variable Frequency Drive (VFD), accelerometer, and Global Positioning System (GPS) receiver.
• GPS technology: Commercially available GPS capability was incorporated into the controller primarily for access to the real time clock signal embedded in the GPS system. A second and equally important advantage to including a GPS receiver is that the system location, which is typically configured as part of system commissioning, is automatically captured by the system, thus reducing configuration time and eliminating the possibility of configuration errors.
2

• Configuration Software Interface: As part of the effort to improve the system commissioning process, an improved controller user interface was developed. The system can run on any Windows computer, but typically is used on a laptop computer by field technicians.
The improved controller was originally proposed to include a network interface that would allow remote access to the system in the case where a network connection was available. After a detailed cost/benefit analysis, it was determined that the cost of including a network interface on each controller was too high given the functionality it provided. The required components for such an interface included a network interface card, fiber optic transceiver, and cabling that would increase the cost of the controller by at least 30%. In return, each controller would be available on-line for remote diagnostics. Given that the system was also being designed for high-reliability, stand alone operation, the added cost was deemed unjustified.
Existing Control System Components
Mitsubishi Programmable Logic Controller
Based on the features required for the control system, there were several options for the type of processing unit to be employed. These range from an industrial PC to a custom embedded controller. Considering the goals to use high reliability, off the shelf components, the choice was made to use an industrial Programmable Logic Controller. PLCs offer the advantages of industrial lifetime and reliability, deterministic software design, and a wide range of I/O options.
Variable Frequency Drive
For more reliable and precise motor control, an industrial Variable Frequency Drive (VFD) from Mitsubishi was included as part of the control system. With the VFD in the system, there are many possibilities for motor control. We are currently running the VFD only at a single frequency, 60 Hz, during normal operation. A simple bang-bang control with a deadband of +/- 0.17 degrees is used to determine when the motor should run, with the goal of keeping the duty cycle low for long term reliability. With a roughly 0.09-degree measurement resolution from the inclinometer, this results in 2 bits of resolution inside the +/- 0.17 degree deadband.
Running at the automatic operation speed, the feedback signal from the inclinometer should change every 5 to 6 seconds. This suggests that the control loop needs to run on no more than a 5-second interval.
Tilt Angle Feedback / Inclinometer
Prior control systems measured tilt angle using a potentiometer. The resolution of this sensing is no more than 8 bits resulting in a resolution of about 0.35. Despite the relatively low resolution available with the potentiometer, the system tracking accuracy was deemed sufficient. However, the potentiometer had many other drawbacks, not the least of which was long-term reliability.
As a higher reliability alternative, the controller developed as part of this project uses a solid-state inclinometer. Compared to the potentiometer feedback mechanism, this approach has three major advantages:
3

• Inherently higher reliability • Higher resolution 0.09 degrees • Direct measurement of angle.
The inclinometer input is measured with an analog input module with a 0-10 V range. This module is capable of 0-5 V input as well, but we chose not to use this range because it requires calibration. This means we are using about 2.84 V total of the 10 V range of the sensor, so the fundamental resolution is slightly better than 10 bits. This is about 1 part in 1000, or about 90 degrees/1000 or 0.09 degree.
GPS
Global Positioning System hardware is becoming ubiquitous in a wide range of applications from cell phones to car navigation systems. As such, commercial components have become relatively inexpensive. A commercial GPS unit targeted at marine applications was chosen for integration into the controller. The unit connects to the PLC via a standard serial link and supports a proprietary command set.
This GPS unit performs two functions, timekeeping and system location determination.
Timekeeping
Although not a well understood problem, it is actually relatively difficult to build a clock that can track time extremely accurately over very long time periods (i.e. years). While small time errors would generally only result in very small tracking errors, the controller requires a much more accurate measure of time. The primary reason for this is the company’s backtracking technology, which prevents shadowing between rows of panels at low sun angles. The backtracking algorithms are very sensitive to the exact time and date, and thus clock drift of only a few minutes will result in less than optimal energy output.
Since the real time clock present in the controller is reasonably accurate over short periods (days and weeks), it is only necessary to calibrate it periodically. As such, the GPS clock signal is used to periodically update the controller’s internal time and thus eliminate the effects of long term errors.
System Location
Typically, part of commissioning a solar tracking system requires setting up the system specific controller parameters. These parameters include the system location, which is defined by its longitude and latitude. Without accurate location information, the controller will not be able to accurately determine the exact location of the sun at a given time.
With the GPS system installed, determination of the system location becomes trivial to the technician performing the configuration. The GPS unit communicates the exact location directly to the controller, which then displays the result to the operator for verification. As this is the primary function provided by GPS, there is very little reason to expect any errors from this operation. Overall, the GPS functionality reduces the chance of configuration errors and shortens the configuration time.
4

Configuration Interface Software
As part of the effort to improve the system commissioning process, an improved controller user interface was developed. The software runs on a PC that is directly connected to the controller. The software includes multiple screens that display current system information and allow for changes to be made to configuration variables. Figure 1 is an example of one of the screens available to users configuring the controller through a PC interface.
Component Additions and Improvements
Under this subcontract, several modifications to the existing controller are being investigated in an effort to improve reliability, reduce cost, and improve performance. These improvements include the following:
VFD Reliability
The VFD used in the existing controller has reset in the field on several occasions. While the reason for the failures is not yet clear, both software and hardware changes are being considered to address the problem. These could include a change to the way the VFD is configured, as well as diagnostic and control software to detect and correct the problem in real time.
Controller Cost Reduction
Two efforts are under way to reduce the cost of the controller assembly. First, a comprehensive review of the design is being conducted to optimize any component choices that may unnecessarily add to the system cost. Examples of these types of improvement include evaluating wire sizes and capacities, fuses, switches, etc. In addition, a search is underway to reduce the cost of the controller assembly operation, which is currently outsourced to a single manufacturing partner. A competitive bidding process is expected to result in significant cost savings, and should also help to shorten lead times and improve quality. Other manufacturing process improvements, including shipping considerations and location of assembly are being investigated as well. Overall, the expectation is that the total cost reduction for the controller and drive unit from these activities could be in excess of 20%.
Reference Cell
As part of the effort to improve controller reliability and better understand performance, a reference cell is being added to each controller. This cell allows the data acquisition system to precisely measure the irradiance witnessed by the PV modules on that particular tracker, and thus better monitor the impact of the tracking algorithm on the energy output of the system.
2.1.2 Drive Improvements
Background The current drive unit used on T0 tracker system currently consists of a ½ hp 3 phase AC motor driving a 15 ton screwjack linear actuator. The actuator rotates the PV through pushrod and multiple lever arms attached to multiple rows of PV modules (see
5

Figure 25). This all electric configuration is capable of actuating more than 250 kWp ofPV modules when mounted on a horizontal axis tracker. Prior versions of the drive system suffered from reliability problems, primarily related to the position feedback mechanism and end of travel limits. While most of these issues have been solved through improvements in the control system, alternative drive configurations are still being considered in an attempt to lower total system cost.
Figure 25: T0 ground system installation, including two drive units.
Other than cost and reliability, a second motivation for investigating alternative drive systems is to allow the use of smaller tracking systems. While the existing drive system works well for large trackers, in many the maximum tracker size cannot be deployed in the field – either due to site layout limitations, high wind conditions, or other considerations. This problem becomes increasingly important with the introduction of T20, which is built of very short rows and is thus practically limited to roughly 100 kWp per tracker. As a result, on a dollar per Watt basis, the same drive system is more than twice as expensive for T20 as would be the case for T0 platform.
Actuator Type Investigation While the electric gear motor and pushrod mechanism has demonstrated excellent performance in single axis tracking systems, the project team felt that a comprehensive review of alternative actuation methods was appropriate. As such, several drive systems and configurations have been considered. Note that the discussion of actuators has been separated from the discussion of ganging methods, as this helped to simplify the analysis. There was a particularly in depth discussion of the use of hydraulic actuators. Many aspects of hydraulic actuators are ideal for solar tracking applications. Hydraulic actuators can apply very high forces at very low speeds, which are exactly the conditions experienced while tracking the sun in high winds. Further, hydraulic power can be distributed over long distances through high pressure hoses, and the actuators
6

themselves are relatively simple and inexpensive. Finally, hydraulic actuators are extremely rugged as evidenced by their use in earthmoving and farming equipment. However, hydraulics also has some major drawbacks. The systems rely on seals to keep hydraulic fluids contained. As a general rule, all seals eventually leak, especially when the system is expected to operate continuously for 25 years or more. This problem can be mitigated by the use of environmentally friendly hydraulic vegetable oils, but the maintenance requirements for leak prone hydraulic actuators are still problematic. Other electrical actuators were also considered coupled with different drive mechanisms. Of these, the most promising was the use of direct drive from a worm drive speed reducer. This configuration has the advantages of unlimited range of motion and a very simple mechanism. However, the speed reducers with appropriate load ratings to support the anticipated wind loads were deemed too expensive. The following sections provide some detail about each actuation method considered, followed by a table summarizing the positives and negatives of each.
Electric Gear Motor with Linear Actuator
Positives • Well understood, simple mechanism • Easy control interface (VFD)
Negatives • Limited range of motion • Non-linear torque profile
T0 Gear Motor with Linear Actuator
Hydraulic Cylinder
Positives • Inexpensive actuator • High force, low speed actuation • Inherently damped
Negatives • Maintenance issues (leakage potential) • Hydraulic power pack required • Specialized installation labor • High total cost
Hydraulic Power Pack (pump)
Hydraulic Cylinder
7

Electric Gear Motor with Direct Drive
Positives • Very simple design • Potentially eliminates one bearing • Easy control interface (VFD)
Negatives • Speed reducers in required load range and
exposure rating are expensive • Potential for gear backlash problems
Worm Drive Speed Reducer
Electric Gear Motor with Belt or Chain Drive
Positives • Allows large effective gear ratios • Lower motor torque requirement
Negatives • Custom actuation design • Maintenance issues, esp. belt life or chain
lubrication • Safety concerns with belt or chain breakage
Captive Belt Drive in Tracking Application
Ganging Method Investigation Probably the most important question to be considered when designing the control and actuation system for solar tracking systems is how large the array to be actuated will be. In more general terms, the central design question is how much PV module area a single controller and actuator will be connected to in the product design. This question is important because the total cost of the controller and actuator is insensitive to array size, leading to the conclusion that a single controller and actuator should be used to control as much PV as possible in order to reduce the cost of the components on a per watt basis. In general, there are two ways to mount more PV on a given tracking system. The most obvious is to make the tracker larger. A single axis could be made longer or the PV could be stacked in double rows to make each row contain more PV. Alternatively, the trackers can be ganged, or mechanically linked together to a single actuator and controller. This is the mechanism used in the T0 single axis system architecture. For a polar axis tracker, or more generally a tilted axis tracker like T20, making the rows longer or increasing the width of the PV on a row becomes impractical rather quickly. This is because one end of the tilted axis is sloped up into the air, and the longer the row gets the higher one end becomes. The impacts of longer rows not only complicates the
8

support structure required to elevate the row, but also increases the wind loads, which increase exponentially with height above the ground.
Figure 26: Prototype T20 tracker installation in San Jose, California.
As a result, increasing row length as a way to increase array size is not an option for T20. On the other hand, linking short rows together at first seems feasible, but the cost of the linking mechanism must be considered. The objective is to determine the best method of using controllers, actuators, and mechanical linkages together to minimize cost at the system level. Several approaches to this problem are described in the following sections, followed by a justification of the design direction taken. As part of the design process, the project team investigated four methods of ganging together multiple trackers to the same actuator. While each method had its own unique advantages, no particular method investigated stood out as the ideal choice. In the end, the project team determined that the most appropriate method for use with T20 an electric gear motor and pushrod method similar to the one currently used on T0 platform. However, the pushrod design was updated to include articulated joints at each tracker row to improve the ability to follow rough terrain and eliminate at least some of the site work that is currently required to accommodate the rigid pushrod. The following table provides some detail about each ganging method considered, followed by a table summarizing the positives and negatives of each.
9
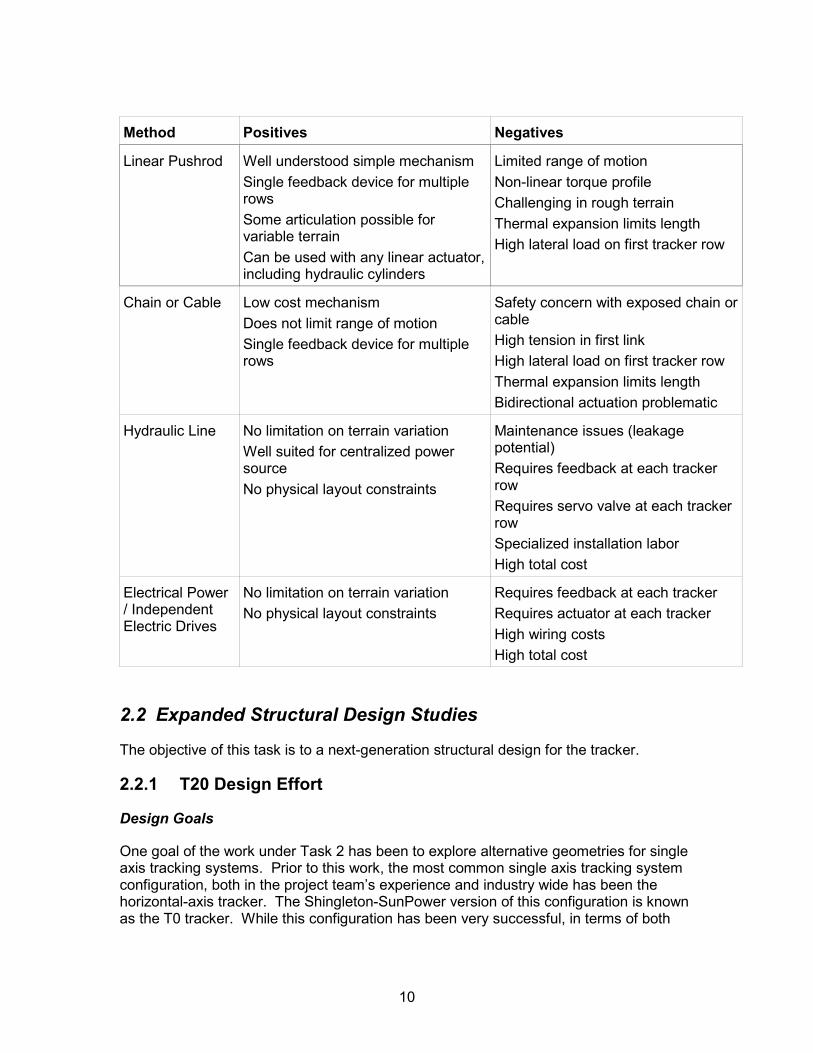
Method Positives Negatives
Linear Pushrod Well understood simple mechanism Single feedback device for multiple rows Some articulation possible for variable terrain Can be used with any linear actuator, including hydraulic cylinders
Limited range of motion Non-linear torque profile Challenging in rough terrain Thermal expansion limits length High lateral load on first tracker row
Chain or Cable Low cost mechanism Does not limit range of motion Single feedback device for multiple rows
Safety concern with exposed chain or cable High tension in first link High lateral load on first tracker row Thermal expansion limits length Bidirectional actuation problematic
Hydraulic Line No limitation on terrain variation Well suited for centralized power source No physical layout constraints
Maintenance issues (leakage potential) Requires feedback at each tracker row Requires servo valve at each tracker row Specialized installation labor High total cost
Electrical Power / Independent Electric Drives
No limitation on terrain variation No physical layout constraints
Requires feedback at each tracker Requires actuator at each tracker High wiring costs High total cost
2.2 Expanded Structural Design Studies
The objective of this task is to a next-generation structural design for the tracker.
2.2.1 T20 Design Effort
Design Goals
One goal of the work under Task 2 has been to explore alternative geometries for single axis tracking systems. Prior to this work, the most common single axis tracking system configuration, both in the project team’s experience and industry wide has been the horizontal-axis tracker. The Shingleton-SunPower version of this configuration is known as the T0 tracker. While this configuration has been very successful, in terms of both
10

commercial acceptance and long term performance, there is a belief that a more cost effective alternative might be possible.
As a result of this work, the project team has developed a new single axis tracking system called T20. This configuration extends many of the design elements found in T0 platform to a tilted axis configuration. In the process, several other design needs were identified, with the primary goals of these to lower installed cost, increase performance, and improve quality and reliability. The details of the design goals for the development are listed below.
Design Goals Results
Improve energy collection performance The tilted axis design of T20 allows for a 6-7% increase in performance over horizontal axis trackers, and approaches the performance of dual axis trackers.
Minimize on site labor T20 is factory assembled to reduce the amount of onsite labor required. Precast foundations and an adjustable mounting system also limit the amount of grading and excavating.
Minimize impact of terrain variation T20 includes telescoping legs and articulated drive mechanisms, which allow for the system to be installed on uneven or undulation terrain with minimal site work.
Reduce deployment time The pre-assembled tracker and pre-cast foundations allow for much faster installation times than was previously possible.
Improve reliability Factory assembly provides for the use of modern assembly line techniques and structured quality control, resulting in better product quality and improved reliability.
Configuration Overview
T20 is similar in many ways to its predecessor T0 tracker, which is a horizontal axis tracking system marketed by SunPower. The similarities include a square torque tube, ganged lever arm rotation mechanism, split plastic bearings in a tubular housing, and a linear screwjack actuator.
There are several differences as well. Primary among those is that the rotation axis is tilted 20 degrees from horizontal. The benefit of a tilted axis is that, if tilted to the south, the system will experience higher direct solar insolation and thus generate more output when compared to a horizontal system. Most other differences between the two configurations are related to the tilted axis. However, there are also a few design
11

features in T20 intended to allow the system to be more tolerant to variable, terrain. These include an articulated drive strut (compared to a rigid drive strut for T0 platform) and telescoping mounting legs (compared to a fixed
Detailed Design Improvements
Overall Dimensions
There are several constraints that limit the size of T20 trackers. For individual tracker units, the requirement for factory assembly necessitates that the dimensions of each tracker not exceed highway shipping limits. In this case, the constraint was set at 10 feet wide and 53 feet long. The 10 foot width limit is higher than the typical highway width limit of 8.5 feet, but is allowable with over the counter shipping permits.
While 53 feet is the maximum length based on shipping considerations, the practical length limit for an individual tracker is much lower. Because the tracker is tilted at 20 degrees, the longer the tracker is, the higher the back end will extend into the air. Although somewhat arbitrary, the project team set the range of acceptable lengths between 20 feet and 34 feet. Because of other considerations discussed below, most configurations are around 25 feet long.
One important requirement for T20 is to support PV modules from multiple vendors. It is desired to also keep as many of the system components the same regardless of PV modules being used. This is accomplished by varying the position of support struts for the PV as necessary depending on the module dimensions, but by leaving the torque tube assembly the same. At this time, the structure is capable of supporting a range of PV modules, with 4 specific modules supported in the current design.
Another factor that must be considered for each PV module supported is the impact of string length. String length is the maximum number of modules that can be wired in series without exceeding the maximum voltage of the system. In the US, this maximum voltage is 600 V, and typical string lengths are between 8 and 20 modules. String length is important in to the design of T20 because using an integral number of strings per tracker unit significantly simplifies field wiring, which is a major cost in traditional systems. For the currently supported PV modules, 1 string per tracker unit is the norm. One exception is for Sanyo HIT modules, which have a nominal string length of 8 modules. In an attempt to optimize the tracker unit design, one and a half strings were used for the Sanyo tracker unit design. The drawbacks of this approach are that only an even number of tracker units can be included in a single system, and every other tracker unit requires a jumper wire to combine the half string with the adjacent tracker unit.
Pre-cast Foundations
One of the key design improvements incorporated into the T20 design is the use of pre-cast foundations. In prior single axis tracker designs, the foundations were buried in the ground to help support the system. While this can reduce the amount of concrete required, it also substantially increases the amount of site work required to install the system.
Pre-cast foundations, on the other hand, are formed and cast in a factory environment, where labor is inexpensive and conditions are well controlled. This dramatically reduces
12

the labor cost associated with the foundations. Further, because the pre-cast foundations are placed directly on the ground, there is very little site specific foundation design work required. For example, only a minimal soils report is necessary when using the pre-cast foundation, whereas a cast in place foundation requires information for deeper soil layers.
Figure 27: T20 pre-cast foundations in field installation
It is important to note that the pre-cast foundation solution does incur higher material costs that would otherwise be required. As a general rule, the material cost of the pre-cast foundations is roughly twice that of a cast in drilled-hole solution. However, the labor savings, as well as the elimination of other related costs (e.g. geotechnical reports) more than offsets the higher material cost.
Articulated Drive Strut
One drawback of existing single axis tracker designs is the use of a rigid drive strut. This mechanism links the otherwise independent tracker units (or rows) together to be actuated by a single drive unit. In T20, many units are linked together, resulting in a system that is many hundreds of feet long. With a rigid drive strut, the units would all have to lie within the same plane – a requirement that would almost always result in grading of the site.
As a solution to this problem, an articulated drive strut was developed for T20. The design allows for single rigid members to span the gap between adjacent tracker units, with the joints at each tracker pinned to allow for relative angular motion. Some lateral motion is possible as well, allowing for some misalignment between tracker units within a row.
13

Figure 28: Drive strut connecting multiple T20 units
The drive strut also includes an array of pin holes on one end allowing for any spacing error between adjacent tracker units. This helps keep installation costs low, as the tolerance on foundation placement can be looser than would otherwise be possible.
Telescoping Legs
Another design element of T20 is the use of telescoping legs. This feature allows the axis to be tilted at any angle in the range of 15-25 degrees relative to the foundations. This flexibility is required to account for any site slope that results in the rear foundations being placed higher or lower than the front foundation. With rigid legs, any site slope would affect the slope of the tilt axis, thus requiring a level site for proper tracker orientation.
Figure 29: Telescoping legs allow for efficient stacking for transportation and quick installation.
14

To set the length of each leg, a series of holes must be aligned and then pinned with a bolt. Each leg can be adjusted separately, thus accounting for any height differences between the leg attachment points on the rear foundation.
PV Attachment
The PV modules are attached to the tracker unit using a unique top mounted clip. This clip is UL approved for this application, and makes sufficient electrical contact with the PV frame to qualify as a safety ground connection. The clips are bolted through to a series of PV mounting struts, which are welded to the torque tube. The same PV mounting struts are used regardless of the PV modules type, with the only difference being the weld location on the drive strut is changed to account for PV module dimensions. The bolt holes for the mounting clips are also different depending on the PV modules, but each mounting strut has been pre-drilled with holes for each configuration, thus eliminating the need to stock additional parts. Attachment of all tracker unit components, including the PV modules, is performed in the factory.
Figure 30: PV mounting hardware and clips
Safety Features
While viewed as highly unlikely, it is possible that a drive strut might become disconnected at the pinned joint somewhere within a tracker row. If this were to happen, possibly due to wind speeds above the design capability, then the tracker units that are no longer connected to the drive unit will no longer be held in place and can rotate freely. In this event, the mass of the drive strut will rotate the tracker units to the horizontal position. However, in very high winds, it is possible that the tracker units could rotate past the typical range of motion. To protect the array from this situation, each tracker
15

unit includes two additional struts to protect the PV from colliding with the drive strut in the case of over-range motion.
Figure 31: One of two struts to protect PV from collision with drive strut
Shipping
Because T20 is factory assembled, the systems are likely to ship in a less dense configuration than would be the case if all components were bulk shipped to the installation site. To address this problem, T20 was designed to ship in a modular, densely packed configuration. The primary feature that allows this is the ability of the rear legs to fold up underneath the PV modules. This feature is integrated with the adjustability of the rear legs described previously, and therefore did not add any additional complexity or cost.
Figure 32: T20 cassette loaded at delivery site
The tracker units also include stacking features that allow the folded-up configuration to stack securely on top of each other. For shipping and storage purposes, up to 10 units can be stacked and handled in a discrete unit, called a cassette. Each cassette is designed to load onto a flat-bed truck for highway shipping. As indicated previously, the
16

maximum width of the tracker units is 10 feet, which allows for highway shipping with an inexpensive a routine permit.
Currently Available Models
As stated previously, there are currently four different models of T20 that have been fully designed, procured, and constructed. All four are designed for the US market, and thus utilize string lengths to appropriate for the 600 VDC limit. The following table shows each configuration and some detailed design information.
Tracker Model SunPower SunTech Sanyo Sanyo Bifacial
Modules SPR-210 STP175 HIP-190
HIP-195
HIP-200
HIP-190DA
HIP-195DA
HIP-200DA
Modules per Tracker Unit
12 12 12 12
Peak Rating 2520 Wp 2100 Wp 2280 Wp 2280 Wp
Strings per Tracker Unit
1 1 1.5 1.5
Tracker Module Area
160.7 ft2 164.9 ft2 152.3 ft2 152.3 ft2
Torque Tube Length
26’ 2“ 26’ 2“ 26’ 2“ 26’ 2“
Torque Tube Slope
20° 20° 20° 20°
Bearings
Bearing Type Split Bushing Split Bushing Split Bushing Split Bushing
Bearing UHMW PE w/ UV UHMW PE w/ UV UHMW PE w/ UHMW PE w/
17

Material inhibitors inhibitors UV inhibitors UV inhibitors
Weights
Front Foundation Weight
1580 lb 1580 lb 1580 lb 1580 lb
Rear Foundation Weight
5000 lb 5000 lb 5000 lb 5000 lb
Tracker Unit Weight
1025 lb 1025 lb 900 lb 1140 lb
Layout
E/W Tracker Spacing
16 ft 16 ft 16 ft 16 ft
N/S Tracker Spacing
58 ft , 0.2 GCR 48 ft , 0.25 GCR 45 ft , 0.2 GCR 45 ft , 0.2 GCR
Rotation Angle ±45 ±45 ±45 ±45
Rows
Tracker Units (max)
50 50 50 50
Peak Rating (Max)
126 kWp 105 kWp 114 kWp 114 kWp
Row Length (Max)
792 ft 792 ft 792 ft 792 ft
Drive Capacity 15 ton 15 ton 15 ton 15 ton
Drive Power ½ Horsepower ½ Horsepower ½ Horsepower ½ Horsepower
Motor Type 480 VAC, 3Ø 480 VAC, 3Ø 480 VAC, 3Ø 480 VAC, 3Ø
18

2.2.2 Load Assessment
Background The main purpose of the wind tunnel testing is to provide designers with accurate wind loading predictions that represent the specific aerodynamic properties of the trackers. Current methods, prescribed in codes, do not provide specific guidance to determine loads on mechanical systems, such as the T20 tracker arrays. The current code standards, notably ASCE/SEI 7-05, Minimum Design Loads for Buildings and Other Structures, are generic and are expected to produce overly conservative results for the tracker systems for certain conditions. To minimize the cost of the tracker system, it is preferred to base the structural design on product specific wind loads for given a set of site conditions, and the best way to determine these loads is to conduct wind tunnel tests. To accomplish this effectively, the wind tunnel analysis was designed to investigate the effects of the wind on certain tracker layout configurations. The investigated parameters include the spacing of the trackers and staggered verses aligned tracker layouts. Furthermore, to account for the function of the system, the wind tunnel analysis was accomplished using various tilt angles as the tilt angle of the tracker varies throughout the day, as it tracks the sun. In addition, to ensure the wind tunnel tests can be relied upon to produce “worst-case” results, the incident angle of the wind (wind direction) is varied within the test regimen. The T20 trackers themselves do not vary significantly due to site conditions. However, significant variations in the trackers will occur depending on the manufacturer of the PV panels and the electrical voltage allowed per tracker. These variations include the length of the tracker, and the total length and width of installed PV panels on each tracker. In addition, other parameters may also vary, such as local wind speeds, surrounding terrain, number of trackers in a row length, system size, and the shape of the array. Fortuitously, the aforementioned conditions do not need to be studied independently in the wind tunnel. The impact on wind loads due to variations in these parameters can be evaluated analytically using widely accepted principles of fluid dynamic combined with accepted wind design standards, such as ASCE/SEI 7-05.
Wind Tunnel Analysis To evaluate the wind loads on the T20 trackers, 1:60 scale models of the trackers are arranged in an array as shown in Figure 33 and Figure 34. Small-scale models are oftenused in wind tunnel testing so that large objects such as a tracker system can be tested. The wind tunnel typically accommodates models that fit onto a 6-8’ diameter platform. An array of trackers must be studied because the surrounding trackers affect the wind loads on each individual tracker. Trackers located in interior regions of the array are more shielded from the wind, while trackers around the edges of the array are more exposed and, therefore, have higher design wind loads.
19

Figure 33: Scale model of T20 tracker system
Figure 34: T20 scale-model array in wind tunnel. Array is mounted on rotating table to facilitate testing of wind in multiple directions. Obstructions in background simulate
exposure category.
Millions of instantaneous pressure measurements were made on the models in various configurations. The pressure measurements were then analyzed and combined with information derived from the structural analysis of the trackers to determine worst-case load effects. In addition, coefficients describing wind pressures on each PV module that produce each of the worst-case load effects were determined, as described in the Results section of this report. The model shown in Figure 34 was mounted on a rotating platform in the wind tunnel to facilitate simulations of multiple wind directions. The angle tilt of each tracker can be adjusted from -45 degrees (facing east) to 45 degrees (facing west). The distance between the trackers in the east-west direction and in the north-south direction could be modified. A simulated fence could be added. In addition, the trackers can be positioned in an aligned configuration as well as a staggered configuration. Pressure taps were placed on representative sampling of modeled trackers throughout the array and connected to pressure transducers and a data acquisition system so that instantaneous pressures could be measured.
20

The modeled trackers were fixed at a single tracker tilt angle, at a given spacing in the east-west direction, at a given spacing in the north-south direction, with a given configuration of trackers (aligned or staggered), and with or without a simulated wind fence. The wind tunnel was then turned on, and pressure data from all of the sensors was collected at a very high sampling rate for several minutes. The table that the model was mounted on was then rotated so that a new wind angle could be studied. This test was repeated for each wind direction. Then, the tracker tilt angles, tracker spacing in both directions, along with tracker configurations were changed, and, possibly, a fence added. The entire testing sequence was repeated for each permutation until the test program was completed.
Results
Computation and Format of Load Effect Factors An extensive analysis was conducted on the data collected in the wind tunnel. Factors that are used to calculate specific worst-case load effects are derived from wind tunnel data. Load effects can be any quantifiable effect of loading on the tracker structure, e.g. the vertical reaction at a given support or the bending moment at a particular location along the torque tube. See Table 1 for a list of load effects calculated from the wind tunnel results.
Table 2: Load effects evaluated for tracker structure.
Load Effect
Description
Fz1 Vertical reaction at Node 1 [lb]
Fz2 Vertical reaction at Node 2 [lb]
Fz3 Vertical reaction at Node 3 [lb]
Fx1 Horizontal reaction in the x direction at Node 1 [lb]
Fy1 Horizontal reaction in the y direction at Node 1 [lb]
Fx2 Horizontal reaction in the x direction at Node 2 [lb]
Fy2 Horizontal reaction in the y direction at Node 2 [lb]
Fx3 Horizontal reaction in the x direction at Node 3 [lb]
Fy3 Horizontal reaction in the Y Direction at Node 3 [lb]
Fx Horizontal force imposed on the Drive Strut [lb]
Mx
Principle bending moment in the Torque Tube (Vertical Deflection) [lb-ft]
Mz Minor Bending Moment in the Torque Tube (Horizontal Deflection) [lb-ft]
Fa1 Axial Load in Leg 1 [lb]
Fa2 Axial Load in Leg 2 [lb]
21

Note that unlike previous wind tunnel results that report coefficients, these results are reported as factors. Unit-less coefficients are multiplied by standardized wind pressures and dimensional values to produce numerical load effects. Factors are used in a similar manner, except that they already include dimensional information and need only be multiplied by standardized wind pressures to produce numerical load effects. Unlike coefficients, factors are not unit-less as they were derived using the specific dimensions of the tracker. The worst-case load factors (minimum and maximum) are determined for each instrumented tracker for each load effect, and are calculated independently for each tested tracker spacing, each tested alignment, and with or without the presence of a wind fence. There are two tested spacing distances, maximum and minimum and two tested alignments, aligned and staggered. In addition, tests are accomplished using a simulated wind fence for a single spacing (minimum), and a single alignment (staggered). This results in six separate sets of factors describing the worst-case load effects from the various tilt angles and wind directions. Each worst-case factor is recorded with the tilt angle and wind direction that produced the worst-case effect. To determine the worst-case factors, it is necessary to calculate a factor for each load effect for each instance of data collected during the wind tunnel tests. The factors that describe the worst-case values for each load effect have the greatest positive value and the lowest negative value of all the calculated factors. This computationally intensive process makes use of influence factors, which essentially represents the structural analysis of the tracker, in addition to pressures derived from wind tunnel data. As an analysis tool, each of the eight separate sets of factors describing the worst-case load effects can be presented in “map” form. Each of these maps represents a different tracker spacing and tracker configuration combination. The benefit of this presentation is that the effect of the location of the tracker within the array becomes apparent. The trackers at the edge of the array experience higher loads than interior trackers. These load factors are used in the following equation to calculate the associated load effects acting on components of the actual trackers:
LE = .00256*K’z*Kzt*(V/1.52)2*I*Cle where, LE is the desired load effect expressed in the applicable units; K’z is the pressure exposure coefficient related to the Kz factor from ASCE-7 except that an adjustment for height is not required. Use .82, 1.0, or 1.21 for wind exposure categories B, C, and D respectfully; Kzt is the topographic factor derived from ASCE-7, typically taken as 1.0; V is the basic wind speed per ASCE-7; this corresponds to a 3-s gust speed at 33 ft above ground in Exposure Category C. The factor 1.52 in the above equation converts the 3-s gust speed to the hourly mean speed implied in the wind tunnel tests; I is the importance factor derived from ASCE-7, taken as 0.87 or less depending on performance objectives of the specific failure mechanism to be checked;
22

Cle is the specific load effect coefficient derived using influence matrices. The units are those of the specific load effect per lb/ft2.
The wind directionality factor, Kd, and the gust factor, G, given in ASCE-7 are not applicable to coefficients derived from wind tunnel analysis.
Additional Results In order to verify our computational method and to facilitate the application of this wind tunnel data to future tracker configurations that may not be of similar dimensions, coefficients, used to calculate the varying wind pressures over the PV panels, are determined for each of the worst-case load effects. These pressures, developed specifically for trackers, can be used in same way as code derived wind pressures. They are applied to the PV panels of a variety of tracker configurations to facilitate structural analysis. In addition, as part of the wind tunnel analysis, a study was undertaken to determine applicable design loads for the drive struts. Although the force on the drive strut can be determined as a load effect this determination does not take into account the effect of multiple trackers connected to the same drive strut nor does it take into account probabilistic effects associated with large influence areas. Note that the influence area for a drive strut is the area of all trackers attached to that strut. When the tributary area is large, the wind load coefficients are smaller because worst-case loading does not occur at the same time over the full influence area. A report furnished by the wind tunnel company includes the values for all of the above referenced load coefficients. The load coefficients are being applied in the structural design of tracker projects. Because the numerical data is considered proprietary, it is not explicitly provided in this report.
Wind Tunnel Results vs. Code Prescribed Loading A comparison between code-based wind loads and wind tunnel-based wind loads indicates that, for certain tracker sizes and configurations, the code-based approach yields lower forces. When evaluating other tracker configurations, especially those involving a wind fence, the wind tunnel data suggests that wind loads are likely lower than loads predicted by the code. Variation between the generalized code-prescribe loads and loads derived from configuration specific wind tunnel testing is expected. For a variety of structural configurations, wind tunnel testing provides the basis for coefficients tabulated in the code. In fact, a large portion of the coefficients provided in the American Society of Civil Engineers Minimum Design loads for Buildings and Other Structures (ASCE-7) were derived from wind tunnel tests performed at the same wind tunnel that conducted the tests on T20 trackers. An analysis was performed on the T20 trackers using the wind loading criteria of ASCE-7. Specifically, wind loads were derived using ASCE-7’s coefficients for open buildings with monoslope roofs. The tracker geometry is similar to this type of structure and this code-based approach is typically accepted by professional engineers and building officials. However, the wind engineering community generally accepts wind tunnel testing on specific geometries as more accurate than the generic code-based procedure, which uses generalized pressure coefficients. Therefore, the wind tunnel results are used to design T20 tracker systems, even in cases where code predicted forces are lower.
23

By comparing the code and wind tunnel results, a more complete understanding of the anticipated wind forces on the system is formed.
There are two distinct application methods for the data derived from these wind tunnel tests. The first method can be used when the trackers are of the same or nearly the same dimensions as those trackers tested in the wind tunnel. The factors (Cle) corresponding to each load effect, calculated as described above, are multiplied by the local full-scale hourly mean wind pressure to determine the desired load effect (LE). This is represented by the equation for LE above. The results are the worst-case load effects (reactions, moments, etc.) for a given wind load. These load effects can then be compared by a structural engineer to code-determined allowable values to size footings and design connections, etc.
The second method requires the calculation of design wind pressures using the pressure coefficients defined above. These coefficients may be modified depending on the geometry of the tracker being investigated. Once design wind pressures are determined, a structural engineer can analyze the tracker to calculate the desired load effects and compare them to code-allowable values. In general, there is a set of design wind pressures (a different pressure for each panel) for each of the desired load effects. However, in practical application it is anticipated that one or two sets of design wind pressures will be sufficient to calculate accurate values for all of the load effects.
Note that in the first method, the structural analysis of the tracker is implicit in the load effect factors (Cle), and in the second method, the structural analysis of the tracker must be accomplished independently of design wind pressures.
Typically, it is undesirable to vary the size or configuration of the tracker or its foundation within a given project or project type. However, the wind tunnel results provide a distinction between edge trackers and interior trackers. These results indicate that interior trackers require lower wind loading. It follows that on some projects the optimal application of wind tunnel results will require a modified design to take advantage of the lower wind loading at the interior of the tracker arrays.
The wind tunnel studies completed under this task have improved our understanding of wind loading on tracker structures. This information has already been applied to tracker projects, facilitating an appropriate design not only for the local wind conditions, but also for the trackers location within the array. Costs are minimized while structural integrity is ensured. With the size of tracker systems growing exponentially—tens of megawatts are now common—the ability to apply product specific wind loads will increase safety and ensure cost optimized designs.
2.2.3 T20 Demonstration
Background
To validate the T20 design, in terms of both performance and ease of installation, several prototype and demonstration systems have been developed over the subcontract. This report summarizes these activities, the lessons learned, and any results. Note that a full commercial demonstration system with a capacity of over 10 MWp is currently being constructed in Nevada.
24

Mockup
Early in the T20 development cycle, the design team determined that because of the scale of the device and the focus on ease of handling and assembly, a mockup system should be constructed. This system was hand build by the design team, an activity through which much was learned about the design. A picture of the initial mockup frame is shown in , and a fully constructed version is shown in Figure 36. Figure 11
In particular, the development of the mockup system helped to validate several design concepts, including that pre-cast foundations were reasonably easy to handle, that the system could be assembled relatively quickly, and that it was feasible to use bearings similar to those used on T0 tracker. Some issues were also identified, including problems with the way the rear legs were adjusted and the excessive weight of some components.
Figure 35. Mockup System
25

Figure 36: Prototype system with PV attached.
26

First Prototypes
Following the development of the mockup system, a set of 6 prototype systems were designed and constructed. Many of the design issues identified on the initial mockup were corrected during this development. Further, the construction of 6 systems allowed some of the shipping concepts to be tested, including stacking the units in cassettes for dense shipping.
In addition to the creation of the 6 prototype units, all units were shipped to a remote site, where 3 of the units were erected. As with the mockup, the installation was performed by the design team, allowing more feedback on the assumptions made, especially with respect to shipping and installation procedures.
In general the prototype development and installation validated the mockup design changes and the shipping method. The installation of multiple units allowed the design team to further exercise the installation procedure. Several issues with site layout were identified, as well as some issues with alignment between tracker units. The most significant issue identified as part of this installation was that the use of unframed PV modules, as had been originally planned, was currently impractical. As a result, the next round of design updates was changed to accommodate framed PV.
Images of the shipping cassette and the final prototype installation are shown in Figure 37 and Figure 38.
Figure 37: Prototype Shipping Cassette.
27

Figure 38: Installed Prototype System
Small Demonstration System
The first commercial installation of the final T20 design consists of a 10 tracker unit system in San Jose, California. This system was constructed with factory assembled tracker units using 11 SunPower 210 Wp modules each, for a total installed capacity of 27.7 kWp. The array is oriented as a single row of 10 tracker units, with a single drive system. The array is oriented aligned with the East/West direction, with each tracker units’ rotation axis tilted at 20 degrees to the south. Figure 38 shows the array layout for this system.
28

Figure 39: Array layout for 10-unit demonstration system
The system was installed by a general contractor with experience installing other single axis trackers, so they were familiar with the basic system components. However, the contractor was more familiar with a field assembled system and less so with placement of pre-assembled components, so there was some learning required to get the operation running smoothly. Further, the layout tolerances for T20, which are intentionally loose, were difficult for the contractor to understand. In general, the contractor was inclined to spend more time placing components more precisely than needed.
Despite the inefficiencies, the complete system was installed over the course of 2 days. Day one was spent on system layout and staking, followed by foundation unloading and placement. The total time spend to complete these tasks for the 10 tracker system was approximately 6 working hours with a crew of 3. Besides the tendency of the contractor to spend more time than necessary placing the foundations precisely, there were few issues with the foundation placement portion of the installation. An image of the installed foundations is shown in Figure 40.
29

Figure 40: Installed Foundations.
On day two, the tracker units were unloaded, placed and linked together. Further, the drive unit was installed and connected. The total working time required to complete these tasks was approximately 8 working hours, again with a crew of 3. While the installation was reasonably smooth, there were several issues with the way that the contractor wanted to install the system. In particular, the way that the tracker units were lifted from the cassette was less than optimal, and some direction was required from the project team to correct this. Further, setting the length of the rear legs to achieve the correct tilt on the torque tube and aligning the axis with the North/South axis proved to be difficult. The project team believes that if the proper procedure were followed, this operation would have been much easier.
Overall, the installation times were longer than the project team expected, but given the unfamiliarity of the contractor with the configuration, this seems reasonable. On average, the entire installation took 14 hours, or just over 1 hour per tracker unit. Since much of this time was related to the drive unit, the time per tracker would actually have been much lower for a more typical configuration where the number of tracker units per drive unit is much higher. Of note was the fact that the final few tracker units were installed at a much more rapid pace. In fact, the final 4 tracker units were erected in one hour. Including foundations, this is equivalent to less than half an hour each, which is in line with expectations. An image of the completed installation is shown in Figure 41.
30

Figure 41: 10-unit demonstration installation
2.3 Specification Development
The objective of this task is to develop site-specification documentation in order to improve installation quality control and to decrease system lifetime costs, while updating tracker operation and maintenance manuals as needed
2.3.1 Installation Manual
The project team developed content for the T20 installation manual. The content was developed from three separate prototype system installs and was updated as a result of the first commercial demonstration installation.
31

Foundation Types
Drive Pad – One located at the start of each row.
Combiner Pad – One located between first and second tracker in each row.
South Foundation (AKA Front) – One round foundation located at south end of each tracker unit.
North Foundation (AKA Rear) – One oblong foundation located at north end of each tracker unit.
Each tracker row is aligned along the east/west direction, with each Tracker Unit's axis aligned in the north/south direction.
Staking and Layout
Staking or marking for North and South foundations can be done with a stringline and tape measure or similar devices.
For South Foundations, stakes should be placed at the south edge.
For North Foundations, stakes should be centered at each end.
Layout of Drive Pad relative to first Tracker South Foundation is critical.
Center marks should be placed on each North Foundation such that they are aligned with the center of the South Foundation in the north/south direction.
Special care must be taken to keep layout square.
Foundation Placement
Location of First Tracker Unit (closest to Drive Pad) is critical.
For the First Tracker Unit, the South Foundation should be placed within ±1 inch
32

of target point in both directions
For the remainder of the row, placement tolerances are much looser.
North/South alignment is most critical at roughly ±3 inches.
In general, “If it looks good, it is good”
East/West alignment is less critical
± 6 inches is acceptable, although getting better alignment does not take much effort.
Foundation Placement Equipment
Foundation weights
North – 5000 lb
South – 2000 lb
Terrain might not be graded or carefully prepared before foundation placement, so all terrain capability is important.
A Construction Forklift (e.g. Gradall can be used for locating foundations, but it lacks the fine control of lateral placement.)
A Truck Crane would be a better choice
33

Drive Installation
The T20 Drive Unit is very similar to the unit used for T0 trackers.
Both motor and controller are identical.
The Drive Pedestal bolts directly to its foundation using 6, 3/4-10 anchors.
Leveling nuts are used to set height and to level Drive Pedestal for alignment with the Torque Arm on the first Tracker Unit.
Drive Foundation may be cast in place or pre-cast.
Tracker Cassette Handling
Tracker Units are shipped to site stacked in Cassettes
Cassette may include up to 10 Tracker Units.
The total weight of a full Cassette is approximately 10,000 lb.
Units in Cassette are bolted together at each end with a 3/4-10 threaded rod.
If handled as a unit, cassette must be lifted from top of threaded rods using eye nuts.
The Tracker Units can also be unstacked individually directly from the truck bed.
Blocks should be used to stabilize the full cassette stack if place on uneven ground.
34

35

Tracker Placement
Individual trackers for a row should all be placed first, then erected in a later step
• Lift individual units and bolt to front foundation
• Place Drive Strut or wood beam across North foundation to support the tracker
• Lower Tracker into horizontal position
• Release strap
Repeat for each tracker in the row.
36

Erecting First Tracker Unit
Start at unit closest to drive
• Connect lifting strap to North (rear) end of Tracker
• Lift to near 20 degrees (10 ft at end)
• Release and extend legs (remove telescoping bolts)
• Attach rear feet, finger tighten nuts
• Position hoist point such that it is plumb with rear alignment mark (N/S aligned)
• And set at 20 degree slope (digital level)
• Bolt telescoping rear legs at nearest matching holes
• Wrench tighten all bolts (feet and legs)
Note: Once the tracker unit is erected, it can rotate freely. It is recommended that a person be responsible for manually stabilizing the Tracker Unit until a torque arm and drive strut are attached.
• Position and bolt Torque Arm, 2 places
• Wrench tighten torque arm bolts
• Ultimately, the Screwjack will prevent rotation of the tracker units
• Level first Tracker Unit and stabilize
• Extend screwjack to align pin with clevis
• Align clevis end of Drive Strut as shown
• Drive in pin and secure with roll pins
Note: Opposite end of Drive Strut will be unattached and resting on ground under second tracker
37

Erecting Remaining Tracker Units
Repeat procedure successively for each next Tracker Unit as with first
Only difference is that pinned Drive Strut connection will include pipe end of prior Drive Strut and clevis end of next Drive Strut. (See Figure)
The pin for the Drive Strut on the final Tracker Unit in the row will attach only one Drive Strut.
2.3.2 Environmental Impact
During the proposal phase, a limited number of T0 PV arrays had been installed. At the time, the extent of wildlife impact was not well understood and considered an area of concern. As such, Shingleton Design planned to partner with the SunPower Operations and Maintenance team to monitor wildlife impact at existing sites during Phase I of the subcontracted work.
Over the course of Phase I, the O&M team has tracked evidence of wildlife impact and has reported no incidents at existing sites. As such, a comprehensive wildlife impact study was deemed unnecessary.
2.4 System Design Tools
The objective of this task is to enhance and upgrade existing tools to evaluate the economic and performance factors for tracker applications.
2.4.1 Cost Evaluation
The overall cost of electricity from single axis tracking systems is determined by the total cost of ownership and the solar performance of the system. Total cost of ownership
38

includes several cost components, including material costs, installation costs, and operating costs. Likewise, solar performance is generally correlated to the complexity of the system. Tracking systems provide more electrical output for a given solar resource compared to fixed systems, but tracking systems are also typically more expensive.
In practice, trade-offs are often made with respect to cost and performance in an attempt to optimize the cost of electricity. In the case of the system improvements developed under this subcontract, the belief is that single axis tracking systems strike the optimal balance between cost and performance, and thus provides the lowest cost of electricity. Even within the realm of single axis tracking, there are many things that affect both cost and performance. On the performance front, these include axis orientation, tracking range, tracking algorithm, and tracking accuracy. In terms of the cost trade-off, some performance enhancing features, such as better tracking algorithms, incur little incremental system cost, while others may increase cost substantially.
Cost Models
Comprehensive cost models for both T0 (horizontal axis) and T20 (tilted axis) have been developed. These tools serve several purposes. First, these tools serve as a guide for cost reduction activities by identifying those system components that have the largest impact on overall cost. For cost reduction, we are generally focused on cost as measured on dollar/Watt peak ($/Wp) basis.
Second, the cost models provide some guidance when considering the impact of changes that are intended to improve the product. Often, design ideas are conceived that will increase performance or improve reliability. However, these improvements may also increase component cost. The projected increase in output or reduction in operating costs can then be weighed against the increase in component and/or installation costs to determine if the overall effect is a lower total cost of electricity.
Another important use of cost models is to provide cost estimates for specific system installations. As a general rule, because energy output is a strong function of location, each project must be independently analyzed to determine if it will be cost effective. Further, system configuration, and in particular the size of individual tracker blocks, varies by project due to site area constraints, variation in site terrain, and the specific type of PV modules used.
As many of these variables as practical have been incorporated into the cost models for both T0 and T20 trackers. These models generally include all mechanical components (including PV modules) as well as some electrical and installation costs. Currently, some installation costs are not modeled in detail, as these costs are a strong function of site specific conditions.
TrackerCalc (Horizontal Axis)
TrackerCalc is an Excel-spreadsheet based design tool for T0 trackers, a horizontal single axis tracking system, that takes site information and system configuration selections as inputs and generates a project specific design. The inputs to the tool include soil conditions, wind load parameters, desired system dimensions (height, number of rows, row length, etc.), material properties, and PV module types. The
39

outputs include the pier design for either driven or concrete piers, pier spacing, row spacing, maximum block dimensions, and a bill of materials (BOM).
Prior to this subcontract, TrackerCalc was primarily used use as a design tool, with the focus on pier design and some basic BOM information. Incorporation of this functionality predates this subcontract. Since the start of this subcontract, TrackerCalc has been improved to include better BOM and cost information. Specifically, the tool now generates a complete BOM for the mechanical hardware for an entire T0 array, which can include multiple tracker blocks. In addition, the tool has the capability to look up component cost information and calculate cost on a total or normalized basis.
While the work done on TrackerCalc thus far is invaluable, there is a lot of additional functionality that could be included for low incremental effort. The two areas where improvement would be most beneficial from a cost modeling perspective are electrical BOM costs and installation costs. For instance, it would be relatively straightforward to calculate the total volume of concrete and the total number of linear feet of pier holes to be drilled for a system with concrete piers. This information could then be used to estimate some of the installation costs associated with the system.
T20 Cost Model
The cost modeling problem for T20 is significantly different from that addressed by TrackerCalc, and thus requires a completely new tool. In the case of TrackerCalc, the variables that affect cost are generally related to site specific design issues, such as soil and wind conditions and terrain variation. In contrast, T20 was designed as a modular system that is not sensitive to such conditions. As a result, the primary system building block (a single tracker unit) is always identical. The tracker units are arranged in rows, which can be up to 50 units long, each of which is then connected to a drive unit at one end. Based on this simplified system design paradigm, component cost estimation simply becomes an exercise in counting up the tracker units that can fit on a given site. The number of rows determines the number of drive units. The system BOM then flows directly from these two layout variables.
In addition to the simplified system configuration, the modular T20 design includes more components in the standard BOM than was the case with TrackerCalc. Most importantly, because the tracker unit foundations are precast, these are included as components in the BOM. In addition, the precast foundation design does not require any significant excavation or soil work on site, thus further lowering the need for difficult to estimate installation labor.
As another example, the amount of wire used for array wiring, or “home runs”, is automatically determined from the total number of trackers and the length of each tracker row. In addition, each tracker row includes an individual combiner box, which is the point at which the home runs are fused and bussed into larger conductors. In TrackerCalc, the number of combiner boxes was not predetermined and was dependent on the judgment of the project engineer.
In effect, the inclusion of a larger subset of system components in the modular product shifts more cost into the component category, while reducing the cost of installation. As a result, the BOM cost for T20 becomes more important, with the impact of installation costs reduced. This leads to a great deal of focus on the BOM and associated cost. One
40

benefit of this focus is that by moving more cost in the product BOM, cost reduction activities can be more structured. For instance, the tool includes multiple sources for manufactured materials, which can be more easily compared than would be the case when comparing quotes for product installation.
Similar to the TrackerCalc, the T20 configuration and cost tool is based on an Excel spreadsheet. shows the input section of the tool, where the user enters the basic system parameters needed to build a top level system BOM.
Figure 18: T20 Cost Tool InputsFigure 18
ConfigurationTracker Type SunPower 11Tracker Size 2860 WpTracker Area 13.7 m2Total Trackers 440Total Rows 11Average Trackers/Row 40System Size 1258.4 kWpN/S GCR 0.5N/S Spacing 46.8 ftDrive Strut Length 16 ftE/W GCR 0.49Overall GCR 0.25Array N/S Width 515 ftAverage Row Length 640 ftTotal Land Area 7.6 AcresElectrical ConfigInverter Size 225 kWNumber of Inverters 4.2Strings per Tracker 1.0Total Strings 440Shipping ConfigCassette Size 8 unitsCassettes/Truck 2Capacity/Truck 45.8 kWp
Cost Validation
Traditionally, the cost of PV systems have been evaluated relative to capacity, using $/Wp installed as the benchmark. While a useful economic indicator, performance-based metrics are more appropriate for tracking PV systems, given the improved energy gains achieved with the added BOS components.
In comparing products on a capacity basis for the first commercial-scale installation, the costs are within 12% on a $/Wp basis for this first-generation T20. However, the annual $/kWh cost for T20 is projected to be 5-6% lower than T0.
This savings is well correlated with the energy gains achieved with the tilted configuration. On a $/kWh basis, the T20 tracker is the clear choice due to increased
41

energy capture. As discussed below, the increased energy capture is in the range of 5-10%, depending on location and ground coverage ratio (GCR).
Figure 43 shows the relative cost contributions by cost category for the T0 and T20 product platforms. The T0 product is field assembled, requiring extensive labor in the field. As expected, the factory-assembled T20 product has higher material (including manufacturing) costs, while installation costs now contribute less to the overall system cost.
0%
10%
20%
30%
40%
50%
60%
70%
80%
90%
100%
T0 T20
Design
BOS Materials
Subs
Other
Figure 43: Relative BOS Cost Comparison
As this is the first-generation T20 product and first commercial-scale installation, there is potential for significant cost reductions to be realized on future T20 tracker generations. In addition, the T20 tracker can be deployed on a wider variety of terrain with limited site preparation. The advantage of carrying out QC/QA in a controlled factory setting also contributes greatly to the attractiveness of this product platform.
2.4.1 Performance Evaluation
Shading Visualization From a design perspective, it is often useful to see a visual representation of how geometry affects shading behavior, a key performance parameter in tracking PV installations. This was particularly true in the case of T20, where several module arrangements were proposed for individual tracker units. Solid modeling tools, such as SolidWorks, would appear to be a good choice for shadow visualization, since they are the same tools in which the geometry can be easily defined. However, these tools generally do not have high level geospacial capabilities. In particular, they do not support the ability to simulate shading behavior for an arbitrary global location at a given time and date. As the result of an investigation to find alternative, low cost tools for shading analysis, we found that Google Sketchup incorporated most of the required functionality. In particular, Sketchup allows the easy creation and manipulation of solid models appropriate for use in visualization studies. In addition, Sketchup is integrated with Google Earth, allowing models to be shaded at an arbitrary location, date, and time.
42

Figure 450 and Figure 451 show examples of a shading visualization study for one T2configuration being considered, both with and without our backtracking scheme activated.
0
Figure 44: Shading analysis example without backtracking
Figure 45: Shading Analysis Example with backtracking. Note: N-S shading; backtracking only prevents E-W shading
43

Numerical Performance Simulations PV Grid is a proprietary solar performance simulation tool developed and maintained by SunPower, a subcontractor for this project. PV Grid has been proven to be an accurate and effective tool for simulating long term performance for a variety of fixed and tracking configurations. While PV Grid includes a model for a tilted, single axis tracking system like T20, the model had not been validated on a working system. Under this subcontract, an effort has been made to validate the model output by cross checking against other simulation tools. The demonstration projects, both prototype and commercial scale, allow for better validation of model output. One of the compelling aspects of the T20 design is the increase in solar performance over horizontal axis tracking systems. Following the addition of a more general tracking model in PV Grid, results for performance from tilted N-S single axis trackers are promising. Figure 46 compares the output from a range of fixed-tilt and tracking systems to that of an ideal two-axis tracking system at three typical moderate latitudes. At the simulated system spacing (E-W GCR = 0.35, N-S GCR = 0.5) the GPT-0 tracking system can increase output by approximately 13-22% over a fixed horizontal array. The T20 may increase this performance improvement by an additional 6-7%. However, as this analysis does not include shading losses for the two-axis tracker reference, we anticipate 5-10% increase depending on GCR. This type of analysis allows us to optimize our product design by highlighting, for example, the tilt angle that results in maximum output for a given location and GCR.
60
65
70
75
80
85
90
95
100
Flat Panel
Fixed Tilt (30 Deg)
T0 Tracker
T5 Tracker
T10 Tracker
T15 Tracker
T20 Tracker
T25 Tracker
T30 Tracker
% of Ideal Energy Output
Product Performance in Three Locations (2-Axis Tracker = 100%)
Yeongwa, S. Korea
Olivenza, Spain
Las Vegas, NV
Figure 46: T20 product performance in three locations (ideal 2-Axis tracker = 100% output, E-W GCR = 0.35, N-S GCR = 0.5)
44

We developed a test facility at the SunPower Corporation headquarters in San Jose, CA for testing the performance of our single-axis tilted tracking systems and associated module technologies. This test site consists of a single row of ten trackers with adjustable center-to-center spacing and tilt angle. Each tracker is wired through a separate inverter for monitoring the stand-along performance of each tracker-module string. The facility is equipped with a weather station for monitoring local weather conditions: global horizontal irradiance, ambient temperature and wind speed. In addition to the stationary climate sensors, one plane of array (POA) pyranometer, one POA reference cell and one inverted POA reference cell (surface normal opposite that of the POA reference cell) are mounted to one tracker for monitoring POA irradiance levels. For the month of September, 2007, two of the ten trackers were monitored to compare actual system output with the predicted output from PVGrid. We simulated system output with both typical meteorological yearly data from NREL (TMY2 format) and measured irradiance data from the Cypress weather station. Figure 47 shows the similarity in total solar insolation for this month from September 1-26. The recently-measured daily irradiance data are consistent with the trends in the historical TMY2 weather data, and typical total monthly insolation is within 1.2% of the measured insolation. The only noticeable deviation from historical trend is the brief but sharp decrease in irradiance during an early-season storm from September 20-24.
0
20
40
60
80
100
120
140
160
180
200
0
2000
4000
6000
8000
10000
12000
1 2 3 4 5 6 7 8 9 10 11 12 13 14 15 16 17 18 19 20 21 22 23 24 25 26
Total Solar Insolation (kW/m
2)Dai
ly S
olar
Inso
latio
n (W
/m2 )
Day
Measured IrradianceTMY IrradianceTotal Measured InsolationTotal TMY Insolation
Figure 47: Measured and TMY2 plane of array irradiance for September 1-26 in San Jose, CA Measured and typical maximum daily ambient temperatures are shown in Figure 48. On average, measured maximum ambient temperature is approximately 4°C greater than TMY2 temperatures. We would expect these elevated temperatures to result in a slightly lower output than is predicted using the TMY2 data, assuming that the hourly irradiance for both data sources has a similar distribution throughout the day.
45

10
15
20
25
30
35
40
1 2 3 4 5 6 7 8 9 10 11 12 13 14 15 16 17 18 19 20 21 22 23 24 25 26
Max
imum
Dai
ly T
empe
ratu
re (C
)
Day
MeasuredTMYAve. MeasuredAve. TMY
Figure 48: Measured and TMY2 ambient temperature for September 1-26 in San Jose, CA
The graph of average daily power in Figure 49 demonstrates that PVGrid successfully predicts power production using the TMY2 weather file generated from NREL’s typical weather data. We are now preparing a weather file from data recorded at the Cypress test site for comparing the accuracy of PVGrid with measured power output.
46

0
200
400
600
800
1000
1200
1400
1600
1800
2000
1 2 3 4 5 6 7 8 9 10 11 12 13 14 15 16 17 18 19 20 21 22 23 24 25 26
Average Daily Power (W)
Ave. Measured
Ave. PVGrid (w/TMY2 Data)
Measured
PVGrid (w/TMY2 Data)
Figure 49: Measured power and PVGrid-calculated power using typical TMY2 weather data The accuracy of a PV simulation is dependent on the quality of the available weather data, on the accuracy of the loss factors and efficiencies provided by the user, and on the validity of the models used to calculate system geometry, plane-of-array irradiance and its three components (direct, diffuse, reflected) and PV power conversion. We are in the process of systematically validating each model in PVGrid to improve our ability to predict output on a T20 tracker. We will continue to use data from Cypress and other installed sites to validate the models within PVGrid, and to refine and increase confidence in our loss factor assumptions for system-level modeling.
Conclusion With the T20 product development cycle in its first year, additional cost tracking and performance monitoring will be required to fully optimize the design. Under this subcontract, the ground work was laid for future cost reduction efforts on subsequent tracker generations. This first-generation product marks a significant evolution in tracker technology, building on the innovative drive solution while gaining energy capture for the same cost.
47

3 Acknowledgements Shingleton Design would like to thank the Department of Energy – Energy Efficiency and Renewable Energy program, the National Renewable Energy Laboratory, and the PV Manufacturing R&D Project for co-funding this work effort under NREL Subcontract No. ZAX-6-33628-09.
In 2007, SunPower Corporation was awarded a cooperative agreement under the U.S. Department of Energy Solar America Initiative (SAI). Continued development of the T20 tracker technology will be carried out under the SAI program. As such, the second phase of this effort was not initiated in order to bring all research related to this technology under a single DOE program.
48

F1146-E(09/2007)
REPORT DOCUMENTATION PAGE Form Approved OMB No. 0704-0188
The public reporting burden for this collection of information is estimated to average 1 hour per response, including the time for reviewing instructions, searching existing data sources, gathering and maintaining the data needed, and completing and reviewing the collection of information. Send comments regarding this burden estimate or any other aspect of this collection of information, including suggestions for reducing the burden, to Department of Defense, Executive Services and Communications Directorate (0704-0188). Respondents should be aware that notwithstanding any other provision of law, no person shall be subject to any penalty for failing to comply with a collection of information if it does not display a currently valid OMB control number. PLEASE DO NOT RETURN YOUR FORM TO THE ABOVE ORGANIZATION. 1. REPORT DATE (DD-MM-YYYY)
February 2008 2. REPORT TYPE
Subcontract Report 3. DATES COVERED (From - To)
2 May 2006 – 31 August 2007 5a. CONTRACT NUMBER
DE-AC36-99-GO10337
5b. GRANT NUMBER
4. TITLE AND SUBTITLE One-Axis Trackers – Improved Reliability, Durability, Performance, and Cost Reduction; Final Subcontract Technical Status Report, 2 May 2006 – 31 August 2007
5c. PROGRAM ELEMENT NUMBER
5d. PROJECT NUMBER NREL/SR-520-42769
5e. TASK NUMBER PVB75301
6. AUTHOR(S) J. Shingleton
5f. WORK UNIT NUMBER
7. PERFORMING ORGANIZATION NAME(S) AND ADDRESS(ES) Shingleton Design, LLC 7322 Parcell Road Auburn, New York 13021
8. PERFORMING ORGANIZATION REPORT NUMBER ZAX-6-33628-09
10. SPONSOR/MONITOR'S ACRONYM(S) NREL
9. SPONSORING/MONITORING AGENCY NAME(S) AND ADDRESS(ES) National Renewable Energy Laboratory 1617 Cole Blvd. Golden, CO 80401-3393 11. SPONSORING/MONITORING
AGENCY REPORT NUMBER NREL/SR-520-42769
12. DISTRIBUTION AVAILABILITY STATEMENT National Technical Information Service U.S. Department of Commerce 5285 Port Royal Road Springfield, VA 22161
13. SUPPLEMENTARY NOTES NREL Technical Monitor: D. Friedman
14. ABSTRACT (Maximum 200 Words): Shingleton Design, LLC describes significant progress toward improving tracker technologies by developing a new modular tilted tracker. In partnership with SunPower Corporation, Shingleton Design built on the existing MaxTracker technology platform (T0) to develop a next-generation tracker technology with increased energy capture, improved reliability, and expanded deployment capabilities. The project team developed on the new structural design, emphasizing factory-based assembly, modular design, and rapid deployment. Improved controller and drive subassemblies further improved tracker performance. Additional development of design and cost-analysis tools enabled commercialization. This first-generation T20 platform offers the potential for 5%-10% increased energy production at 5%-6% cost reduction when evaluated on a performance basis, relative to the T0 technology. The T20 technology developed through this subcontract represents a significant evolution in PV systems technologies geared for utility-scale commercial installations.
15. SUBJECT TERMS PV; one-axis tracker; cost reduction; reliability; solar energy; large-scale; manufacturer; modular tracker; commercial-scale installation;
16. SECURITY CLASSIFICATION OF: 19a. NAME OF RESPONSIBLE PERSON a. REPORT
Unclassified b. ABSTRACT Unclassified
c. THIS PAGE Unclassified
17. LIMITATION OF ABSTRACT
UL
18. NUMBER OF PAGES
19b. TELEPHONE NUMBER (Include area code)
Standard Form 298 (Rev. 8/98) Prescribed by ANSI Std. Z39.18