onedek system comparison
TRANSCRIPT
INSULATED ROOF DECK
®
OneDek® System ComparisonLeveraging Product and Single Source Advantages
Versus Traditional Systems
Z-tech Consulting, LLCRobert A Zabcik, P.E., LEED AP
Prepared for:
Authored by:
OneDek® System Comparison
2
All Weather Insulated Panels
Page 1 of 20
OneDek System Comparison Leveraging Product and Single Source Advantages Versus Traditional Systems
Introduction
Background
All-Weather Insulated Panels (AWIP) has recently developed a roof system called OneDek, an Insulated Metal Panel (IMP) based roof deck and membrane assembly. This product uses foamed in-place, metal-skinned panelized building units to not only create a structural roof deck, but also to provide insulation, an air barrier, a vapor retarder, as well as provide a firm, level surface for application of single-membrane roofing. The engineered fastening system links all the various materials into a structural diaphragm, which transmits imparted loads into the respective resisting systems. The purpose of this study is to identify and evaluate the inherent advantages of this system as related to first cost, time to “dry-in”, and inherent mitigation of construction delay and cost overrun risks.
Problem Statement
It is widely accepted that site construction practices are slow to evolve. A quick literary search shows that productivity gains in manufacturing have out-paced productivity gains on construction sites by factors between 3 and 10. This trend has fueled the well-recognized shift to factory-assembled building cladding systems. Furthermore, research shows that construction projects are susceptible to delays and cost overruns more than ever before, not just because of increased cost but increased risk as well. An enumeration of the most common sources of delays and cost overruns are presented in this study. The burdens created by these factors are clear impediments to any construction project.
Proposed Solution
Z-tech Consulting, LLC has conducted this study which will compare OneDek to two more traditional approaches by evaluating relative first cost and time to dry-in metrics but also utilizing a performance rubric intended to represent the systems’ intrinsic ability to avoid construction cost overruns and delays. Some of the more subtle advantages of the system, such as waste reduction, site impact, reduced involved trades, etc., will also be considered.
Analysis
Site Selection
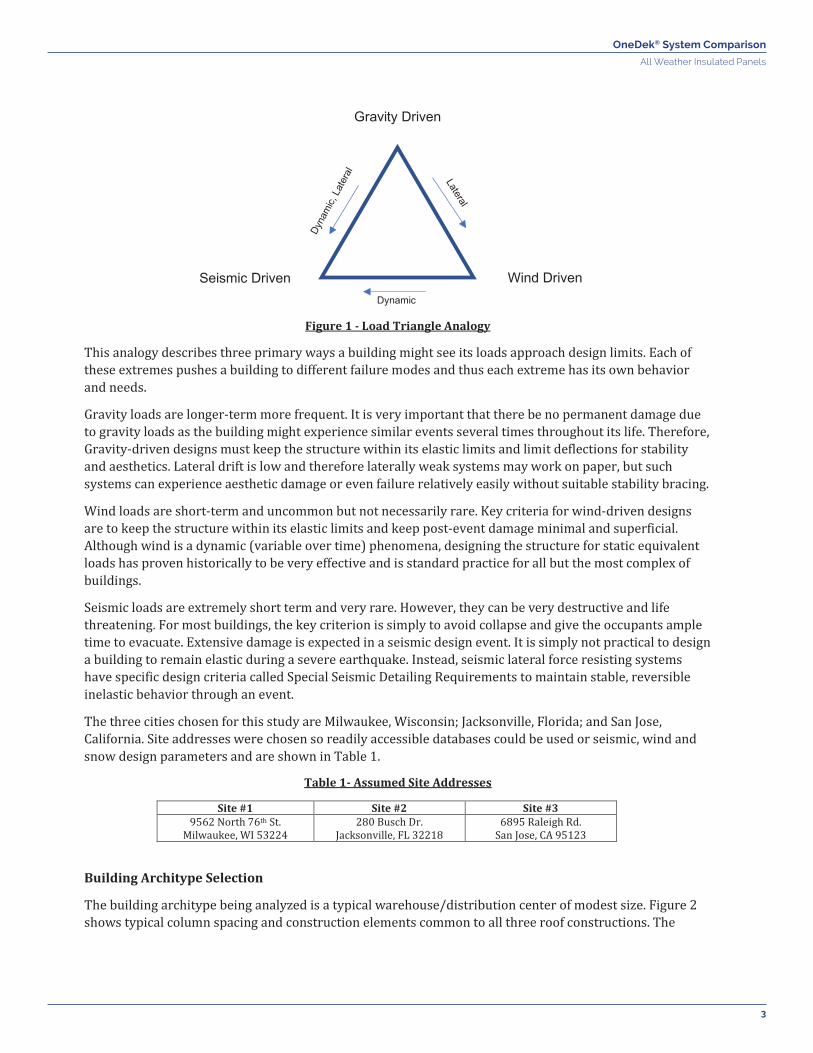
Three locations were selected as hypothetical sites for this study. The idea is to capture the three key drivers of roof and diaphragm deck design: snow loads, wind loads and seismic loads. This approach will investigate the extremes of the load triangle, an analogy for the main drivers of structural requirements, shown in Figure 1.
OneDek® System Comparison
3
All Weather Insulated Panels
Figure 1 - Load Triangle Analogy
This analogy describes three primary ways a building might see its loads approach design limits. Each of these extremes pushes a building to different failure modes and thus each extreme has its own behavior and needs.
Gravity loads are longer-term more frequent. It is very important that there be no permanent damage due to gravity loads as the building might experience similar events several times throughout its life. Therefore, Gravity-driven designs must keep the structure within its elastic limits and limit deflections for stability and aesthetics. Lateral drift is low and therefore laterally weak systems may work on paper, but such systems can experience aesthetic damage or even failure relatively easily without suitable stability bracing.
Wind loads are short-term and uncommon but not necessarily rare. Key criteria for wind-driven designs are to keep the structure within its elastic limits and keep post-event damage minimal and superficial. Although wind is a dynamic (variable over time) phenomena, designing the structure for static equivalent loads has proven historically to be very effective and is standard practice for all but the most complex of buildings.
Seismic loads are extremely short term and very rare. However, they can be very destructive and life threatening. For most buildings, the key criterion is simply to avoid collapse and give the occupants ample time to evacuate. Extensive damage is expected in a seismic design event. It is simply not practical to design a building to remain elastic during a severe earthquake. Instead, seismic lateral force resisting systems have specific design criteria called Special Seismic Detailing Requirements to maintain stable, reversible inelastic behavior through an event.
The three cities chosen for this study are Milwaukee, Wisconsin; Jacksonville, Florida; and San Jose, California. Site addresses were chosen so readily accessible databases could be used or seismic, wind and snow design parameters and are shown in Table 1.
Table 1- Assumed Site Addresses
Site #1 Site #2 Site #3 9562 North 76th St.
Milwaukee, WI 53224 280 Busch Dr.
Jacksonville, FL 32218 6895 Raleigh Rd.
San Jose, CA 95123
Building Architype Selection
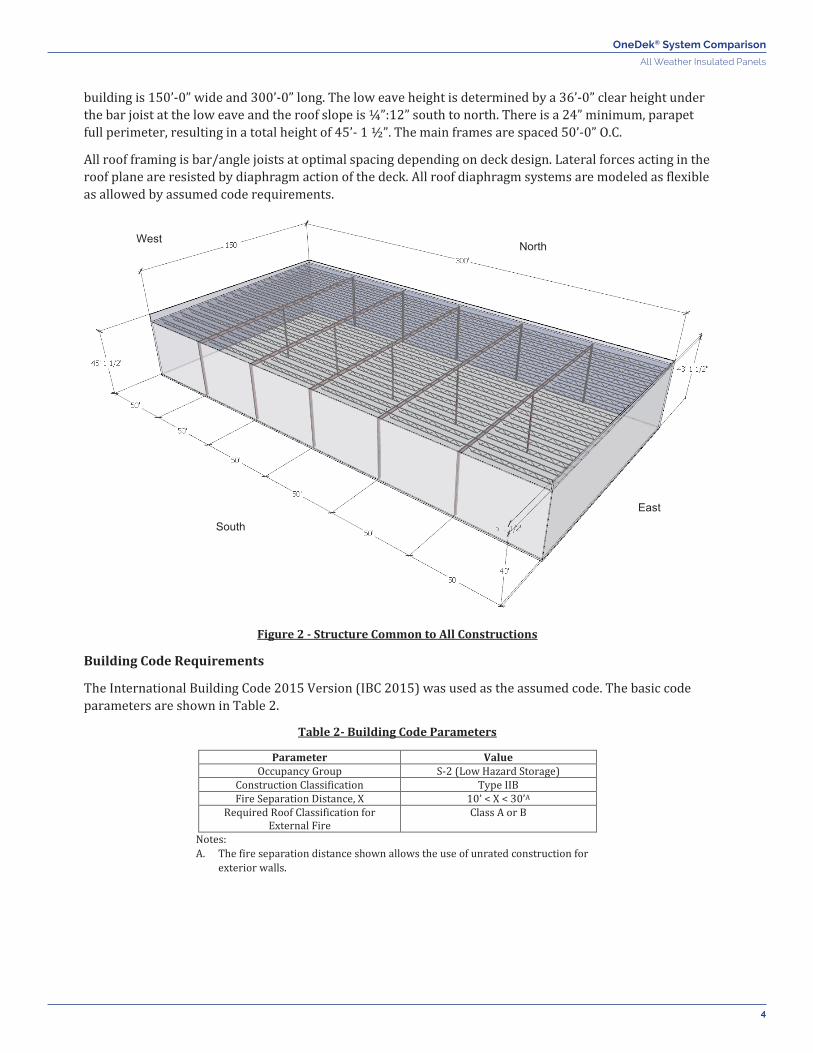
The building architype being analyzed is a typical warehouse/distribution center of modest size. Figure 2 shows typical column spacing and construction elements common to all three roof constructions. The
Gravity Driven
Seismic Driven Wind Driven Dynamic
OneDek® System Comparison
4
All Weather Insulated Panels
building is 150’-0” wide and 300’-0” long. The low eave height is determined by a 36’-0” clear height under the bar joist at the low eave and the roof slope is ¼”:12” south to north. There is a 24” minimum, parapet full perimeter, resulting in a total height of 45’- 1 ½”. The main frames are spaced 50’-0” O.C.
All roof framing is bar/angle joists at optimal spacing depending on deck design. Lateral forces acting in the roof plane are resisted by diaphragm action of the deck. All roof diaphragm systems are modeled as flexible as allowed by assumed code requirements.
Figure 2 - Structure Common to All Constructions
Building Code Requirements
The International Building Code 2015 Version (IBC 2015) was used as the assumed code. The basic code parameters are shown in Table 2.
Table 2- Building Code Parameters
Parameter Value Occupancy Group S-2 (Low Hazard Storage)
Construction Classification Type IIB Fire Separation Distance, X 10’ < X < 30’A
Required Roof Classification for External Fire
Class A or B
Notes: A. The fire separation distance shown allows the use of unrated construction for
exterior walls.
South East
North West

OneDek® System Comparison
5
All Weather Insulated Panels
Load Comparison
The load parameters used come from ASCE 7-2010 as required by IBC 2015 Chapter 16. Per ASCE 7, the loading parameters for the three sites are as shown in Table 3. General non-site-specific loading parameters are shown in Table 4, while the seismic non-site-specific parameters are shown in Table 5.
Table 3 - Structural Loading Parameters
Condition Parameter Milwaukee, WI Jacksonville, FL San Jose, CA
Snow Loads Ground Snow, pg 30 psf 0psf 0psf
Flat Roof Snow, pf 21psf 0psf 0psf Maximum Drift Snow 92psf 0psf 0psf
Wind Loads Basic Wind Speed, V 115 mph 135 mph 115 mph
Wind Exposure Category B C C
Seismic Loads
0.2 second Seismic Ground Acceleration, SS
8%g 10%g 150%g
1.0 second Seismic Ground Acceleration,
1.0s, S1
5%g 6%g 60%g
Seismic Site Class D D D SDS 0.085g 0.11g 1.0g SD1 0.08g 0.096g 0.6g
Seismic Design Category B B D
Table 4 - Non-Site-Specific Load Parameters
Parameter Value ASCE 7-10 Risk Category II – All others (Most Common)
Dead Load As determined by self-weight Collateral Dead Load 5 psf
Roof Live Load 20 psf, with tributary reduction Allowable Deflection L/240
Wall Weight (for seismic design)
20 psf
Table 5 - Non-Site-Specific Seismic Parameters
Parameter N-S Direction E-W Direction
Structural System Ordinary Moment Frames of Steel
Concentrically Braced Frames
Response Modification Factor, R 3.50 3.25 System Overstrength Factor, Ω0 3.00 2.00
Deflection Amplification Factor, Cd 3.00 3.25 Redundancy Factor, ρ 1.00 1.30
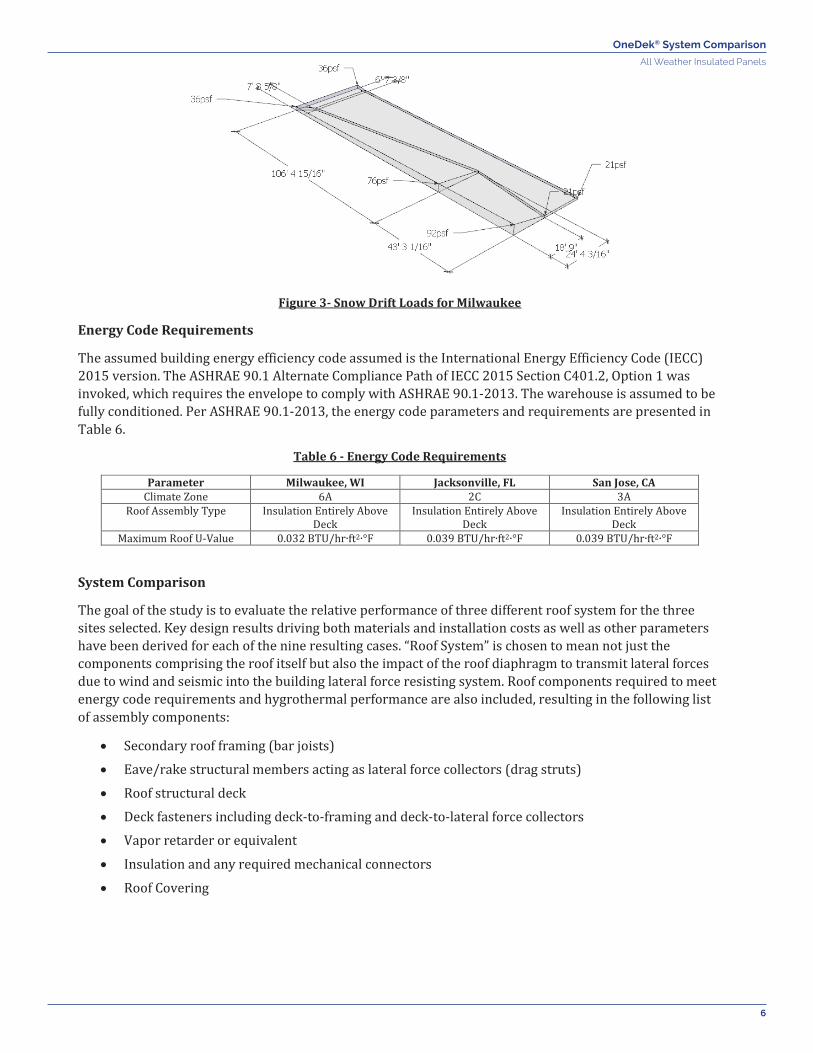
It should be noted that the presence of a parapet on three sides of the architype impacts the design significantly not only due the weight and area contributions to the seismic and wind loads respectively but it also induces a snow drift load up to 92 psf onto certain areas of the roof as shown in Figure 3.
OneDek® System Comparison
6
All Weather Insulated Panels
Figure 3- Snow Drift Loads for Milwaukee
Energy Code Requirements
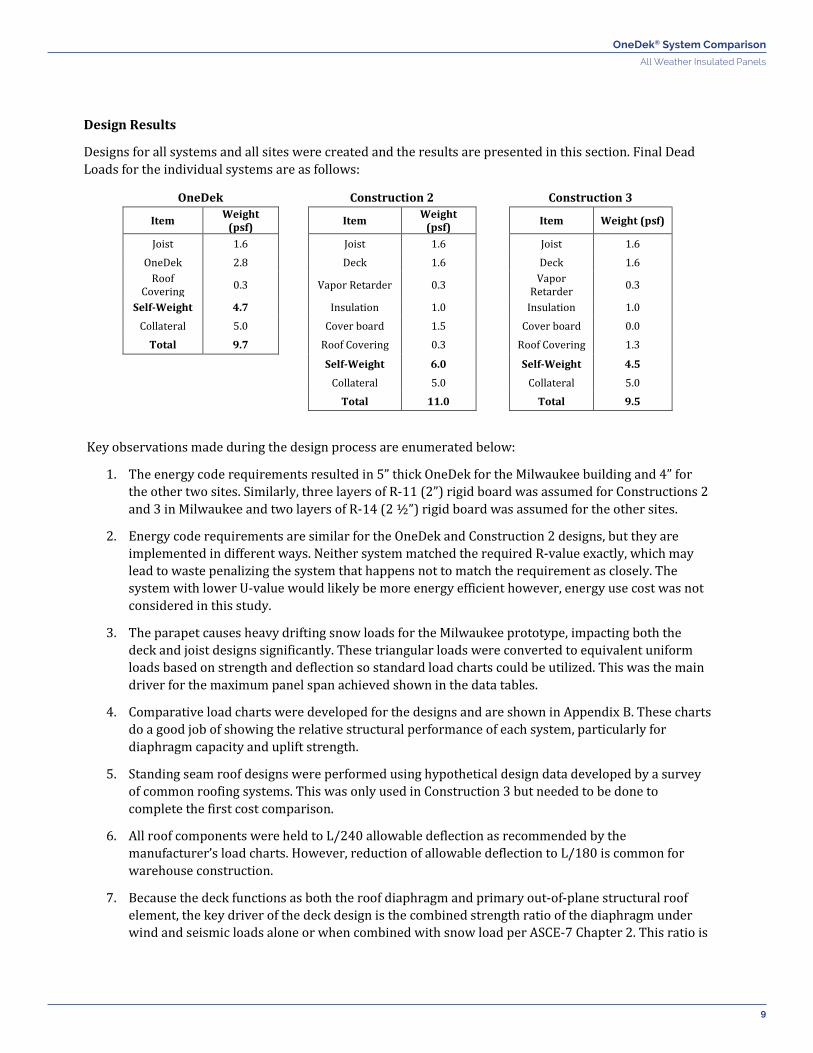
The assumed building energy efficiency code assumed is the International Energy Efficiency Code (IECC) 2015 version. The ASHRAE 90.1 Alternate Compliance Path of IECC 2015 Section C401.2, Option 1 was invoked, which requires the envelope to comply with ASHRAE 90.1-2013. The warehouse is assumed to be fully conditioned. Per ASHRAE 90.1-2013, the energy code parameters and requirements are presented in Table 6.
Table 6 - Energy Code Requirements
Parameter Milwaukee, WI Jacksonville, FL San Jose, CA Climate Zone 6A 2C 3A
Roof Assembly Type Insulation Entirely Above Deck
Insulation Entirely Above Deck
Insulation Entirely Above Deck
Maximum Roof U-Value 0.032 BTU/hr∙ft2∙°F 0.039 BTU/hr∙ft2∙°F 0.039 BTU/hr∙ft2∙°F
System Comparison
The goal of the study is to evaluate the relative performance of three different roof system for the three sites selected. Key design results driving both materials and installation costs as well as other parameters have been derived for each of the nine resulting cases. “Roof System” is chosen to mean not just the components comprising the roof itself but also the impact of the roof diaphragm to transmit lateral forces due to wind and seismic into the building lateral force resisting system. Roof components required to meet energy code requirements and hygrothermal performance are also included, resulting in the following list of assembly components:
• Secondary roof framing (bar joists)
• Eave/rake structural members acting as lateral force collectors (drag struts)
• Roof structural deck
• Deck fasteners including deck-to-framing and deck-to-lateral force collectors
• Vapor retarder or equivalent
• Insulation and any required mechanical connectors
• Roof Covering

OneDek® System Comparison
7
All Weather Insulated Panels
Not all components are required for all assemblies and this will be considered as part of the first cost component. Typical Details for the three systems are shown in Figure 4, Figure 5 and Figure 6.
Figure 4 - OneDek Construction
Figure 5 - Construction #2

OneDek® System Comparison
8
All Weather Insulated Panels
Figure 6 – Construction #3
Assembly Steps
It becomes apparent upon observing the illustrations that the number of assembly steps between the three constructions are quite different. Table 7 enumerates these steps as used in the scoring rubric.
Table 7 – Assembly Steps for Each Construction
OneDek System Construction 2 Construction 3 1. Lay down and secure OneDek. 2. Apply additional sealants for air
barrier continuity. 3. Apply and secure membrane. 4. Seam membrane.
1. Lay down and secure metal deck. 2. Apply additional sealants for air
barrier continuity. 3. Lay down and secure vapor
retarder. 4. Apply first layer of rigid board. 5. Apply second layer of rigid
board. 6. Apply third layer of rigid board.
(Milwaukee) 7. Secure rigid board. 8. Lay down and secure cover
board. 9. Apply secure membrane. 10. Seam membrane.
1. Lay down and secure metal deck. 2. Apply additional sealants for air
barrier continuity. 3. Lay down and secure vapor
retarder. 4. Apply first layer of rigid board. 5. Apply second layer of rigid
board. 6. Apply third layer of rigid board.
(Milwaukee) 7. Lay down standing seam roof. 8. Mechanically seam standing
seam roof.
Total Steps: 4 Total Steps: 10 Total Steps: 8
Furthermore, the installation skills required for Constructions 2 and 3 are also higher. It should be noted that documents reviewed in the literary research3,4 cited an increased likelihood of delays and cost overruns as the number of individual crews on the roof increases. Therefore, this parameter was also included in the scoring rubric.
OneDek® System Comparison
9
All Weather Insulated Panels
Design Results
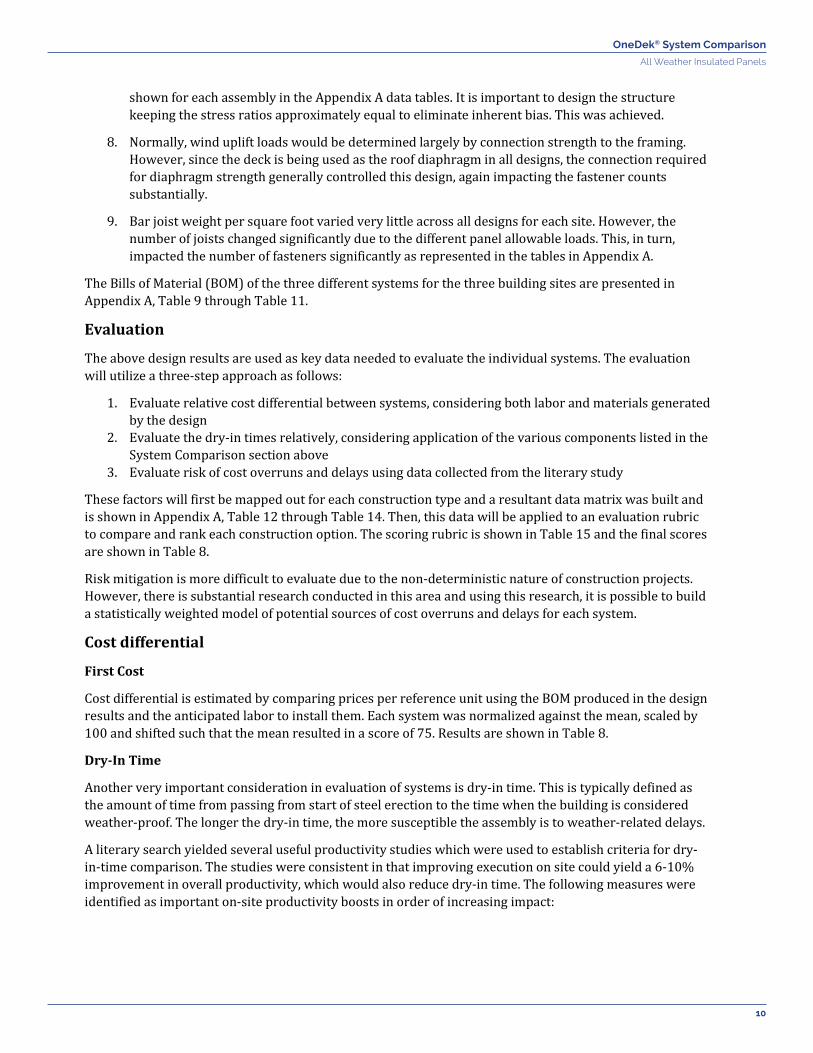
Designs for all systems and all sites were created and the results are presented in this section. Final Dead Loads for the individual systems are as follows:
OneDek Construction 2 Construction 3
Item Weight (psf)
Item Weight (psf)
Item Weight (psf)
Joist 1.6 Joist 1.6 Joist 1.6 OneDek 2.8 Deck 1.6 Deck 1.6
Roof Covering 0.3 Vapor Retarder 0.3 Vapor
Retarder 0.3
Self-Weight 4.7 Insulation 1.0 Insulation 1.0 Collateral 5.0 Cover board 1.5 Cover board 0.0
Total 9.7 Roof Covering 0.3 Roof Covering 1.3 Self-Weight 6.0 Self-Weight 4.5 Collateral 5.0 Collateral 5.0 Total 11.0 Total 9.5
Key observations made during the design process are enumerated below:
1. The energy code requirements resulted in 5” thick OneDek for the Milwaukee building and 4” for the other two sites. Similarly, three layers of R-11 (2”) rigid board was assumed for Constructions 2 and 3 in Milwaukee and two layers of R-14 (2 ½”) rigid board was assumed for the other sites.
2. Energy code requirements are similar for the OneDek and Construction 2 designs, but they are implemented in different ways. Neither system matched the required R-value exactly, which may lead to waste penalizing the system that happens not to match the requirement as closely. The system with lower U-value would likely be more energy efficient however, energy use cost was not considered in this study.
3. The parapet causes heavy drifting snow loads for the Milwaukee prototype, impacting both the deck and joist designs significantly. These triangular loads were converted to equivalent uniform loads based on strength and deflection so standard load charts could be utilized. This was the main driver for the maximum panel span achieved shown in the data tables.
4. Comparative load charts were developed for the designs and are shown in Appendix B. These charts do a good job of showing the relative structural performance of each system, particularly for diaphragm capacity and uplift strength.
5. Standing seam roof designs were performed using hypothetical design data developed by a survey of common roofing systems. This was only used in Construction 3 but needed to be done to complete the first cost comparison.
6. All roof components were held to L/240 allowable deflection as recommended by the manufacturer’s load charts. However, reduction of allowable deflection to L/180 is common for warehouse construction.
7. Because the deck functions as both the roof diaphragm and primary out-of-plane structural roof element, the key driver of the deck design is the combined strength ratio of the diaphragm under wind and seismic loads alone or when combined with snow load per ASCE-7 Chapter 2. This ratio is
OneDek® System Comparison
10
All Weather Insulated Panels
shown for each assembly in the Appendix A data tables. It is important to design the structure keeping the stress ratios approximately equal to eliminate inherent bias. This was achieved.
8. Normally, wind uplift loads would be determined largely by connection strength to the framing. However, since the deck is being used as the roof diaphragm in all designs, the connection required for diaphragm strength generally controlled this design, again impacting the fastener counts substantially.
9. Bar joist weight per square foot varied very little across all designs for each site. However, the number of joists changed significantly due to the different panel allowable loads. This, in turn, impacted the number of fasteners significantly as represented in the tables in Appendix A.
The Bills of Material (BOM) of the three different systems for the three building sites are presented in Appendix A, Table 9 through Table 11.
Evaluation
The above design results are used as key data needed to evaluate the individual systems. The evaluation will utilize a three-step approach as follows:
1. Evaluate relative cost differential between systems, considering both labor and materials generated by the design
2. Evaluate the dry-in times relatively, considering application of the various components listed in the System Comparison section above
3. Evaluate risk of cost overruns and delays using data collected from the literary study
These factors will first be mapped out for each construction type and a resultant data matrix was built and is shown in Appendix A, Table 12 through Table 14. Then, this data will be applied to an evaluation rubric to compare and rank each construction option. The scoring rubric is shown in Table 15 and the final scores are shown in Table 8.
Risk mitigation is more difficult to evaluate due to the non-deterministic nature of construction projects. However, there is substantial research conducted in this area and using this research, it is possible to build a statistically weighted model of potential sources of cost overruns and delays for each system.
Cost differential
First Cost
Cost differential is estimated by comparing prices per reference unit using the BOM produced in the design results and the anticipated labor to install them. Each system was normalized against the mean, scaled by 100 and shifted such that the mean resulted in a score of 75. Results are shown in Table 8.
Dry-In Time
Another very important consideration in evaluation of systems is dry-in time. This is typically defined as the amount of time from passing from start of steel erection to the time when the building is considered weather-proof. The longer the dry-in time, the more susceptible the assembly is to weather-related delays.
A literary search yielded several useful productivity studies which were used to establish criteria for dry-in-time comparison. The studies were consistent in that improving execution on site could yield a 6-10% improvement in overall productivity, which would also reduce dry-in time. The following measures were identified as important on-site productivity boosts in order of increasing impact:
OneDek® System Comparison
11
All Weather Insulated Panels
1. Minimize Site Activity – Don’t do it on the site if you can do it in the factory.
2. Reduce Fragmentation – Simply put, fragmentation is when the number of contractors (and thus individual contracts) is excessive. One study found installation installers to be among the most fragmented trades, along with drywall installation and painting.
3. Proper material access and staging – Key to proper staging is to have materials available to the installer through the shortest path available and to organize materials in proper order.
4. Minimize tie-off time – Redundant safety measures are required when working on an elevated location and it takes time to properly tie-off.
These factors were considered and built into a scoring rubric intended to identify the construction more likely to result in less dry-in time, primarily by looking at three metrics: 1) The number steps needed to complete the construction of the roof 2) the labor intensiveness of each step, and 3) the number of individual trades involved.
Evaluating Risk of Cost Overrun and Delays
First cost is obviously a primary factor in structural system selection. However, experience has shown that once a construction project has been completed, the financial impact of cost overruns and delays can very easily erode any first-cost savings of selecting one system over another, often by a large factor. It is therefore important to consider the susceptibility of each considered system to such undesired results.
A literary search has shown that much research has gone into this area in the last 10 years. This is not surprising, given the increasing financial pressure on building owners and contractors alike as competition increases and margins erode.
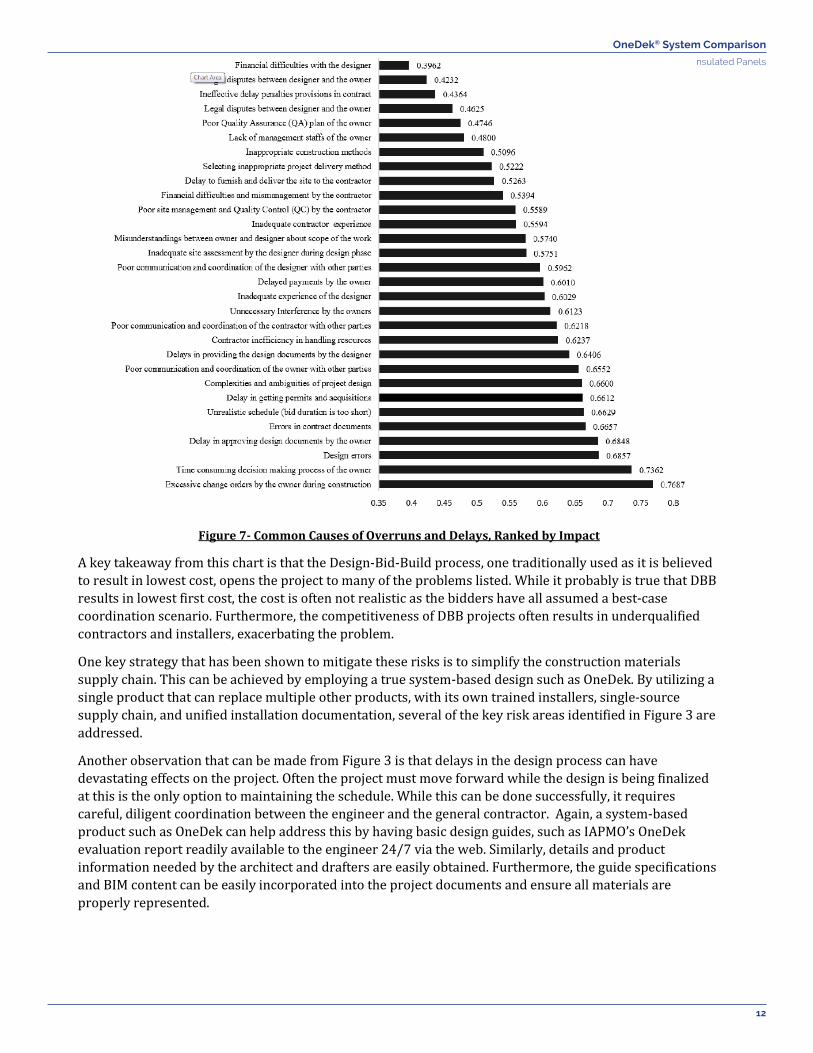
One reference found in this search provided an extensive analysis which grouped, listed and ranked various causes of overruns and delays. A summary chart is provided in Figure 7.
OneDek® System Comparison
12
All Weather Insulated Panels
Figure 7- Common Causes of Overruns and Delays, Ranked by Impact
A key takeaway from this chart is that the Design-Bid-Build process, one traditionally used as it is believed to result in lowest cost, opens the project to many of the problems listed. While it probably is true that DBB results in lowest first cost, the cost is often not realistic as the bidders have all assumed a best-case coordination scenario. Furthermore, the competitiveness of DBB projects often results in underqualified contractors and installers, exacerbating the problem.
One key strategy that has been shown to mitigate these risks is to simplify the construction materials supply chain. This can be achieved by employing a true system-based design such as OneDek. By utilizing a single product that can replace multiple other products, with its own trained installers, single-source supply chain, and unified installation documentation, several of the key risk areas identified in Figure 3 are addressed.
Another observation that can be made from Figure 3 is that delays in the design process can have devastating effects on the project. Often the project must move forward while the design is being finalized at this is the only option to maintaining the schedule. While this can be done successfully, it requires careful, diligent coordination between the engineer and the general contractor. Again, a system-based product such as OneDek can help address this by having basic design guides, such as IAPMO’s OneDek evaluation report readily available to the engineer 24/7 via the web. Similarly, details and product information needed by the architect and drafters are easily obtained. Furthermore, the guide specifications and BIM content can be easily incorporated into the project documents and ensure all materials are properly represented.

OneDek® System Comparison
13
All Weather Insulated Panels
Scoring
Considering these and other conclusions drawn from the literary study, a scoring rubric was developed to accurately evaluate the various system options and their susceptibility to cost overruns and delays. The rubric is presented in Table 15. Each parameter from the data table was weighted as shown in the rubric and multiplied times the variance from the mean. The results were scaled by factor of 100 and shifted such a mean score resulted in a value of 75 points. Results of the scoring is shown in Table 8.
Table 8 – Score Summary
System
Milwaukee Jacksonville San Jose
First Cost
Dry-In Time
Delay/Cost Overrun
Avoidance
First Cost
Dry-In Time
Delay/Cost Overrun
Avoidance
First Cost
Dry-in Time
Delay/Cost Overrun
Avoidance
OneDek 68.8 88.1 84.3 67.9 87.9 84.2 69.8 88.0 85.3 Construction
#2 80.8 71.4 70.4 81.4 71.5 70.4 79.8 71.8 70.1
Construction #3 75.5 71.6 70.3 75.7 71.8 70.3 75.5 71.3 69.6
Figure 8 - Score Summary Graphic
Conclusions
While the OneDek system was the most expensive first cost in materials, this somewhat offset by labor savings. However, for cost overrun and construction delay risk, OneDek was a clear winner over the other systems evaluated. This result is not surprising, given the risk mitigation afforded by single-source supply and minimization of installation trades on site.
As the literary study clearly shows, small first cost savings are often completely wiped out by construction cost overruns and delays. Although delays such as weather cannot be controlled, the reality is that the vast majority of cost overruns and delays are easily mitigated. All of the resources reviewed clearly showed that human error and poor communication and management were the largest source of delays along with unrealistic expectations. This is why simply limiting the number of different parties involved can have a significant reduction in the risks, and therefore the total in-place cost of any construction project. This
60.0
65.0
70.0
75.0
80.0
85.0
90.0
First Cost Dry-InTime
Delay/CostOverrun
Avoidance
First Cost Dry-InTime
Delay/CostOverrun
Avoidance
First Cost Dry-inTime
Delay/CostOverrun
Avoidance
Milwaukee Jacksonville San Jose
Com
posi
te S
core
OneDekConstruction #2Construction #3
OneDek® System Comparison
14
All Weather Insulated Panels
study clearly shows that a system which accomplishes all of these strategies, such as OneDek, pays massive dividends to this end.
References
1. Robert Epstein; The Art of Managing Construction Risks: A Breakdown of Four Problem Areas; Greenberg Traurig Construction Law Client Advisory; June 2015
2. Abdulelah Aljohani, Dominic Ahiaga-Dagbui, and David Moore; Construction Projects Cost Overrun: What Does the Literature Tell US?; International Journal of Innovation, Management and Technology, Vol. 8, No. 2, April 2017
3. Mohammadsoroush Tafazzoli Ph.D. Candidate, LEED AP, and Pramen P. Shrestha Ph.D., PE; Investigating Causes of Delay in U.S. Construction Projects; 53rd ASC Annual International Conference Proceedings; June 2017
4. Jonathan N. Millar, Stephen D. Oliner, Daniel E. Sichel; Time-to-Plan Lags for Commercial Construction Projects; Working Paper 19408; National Bureau of Economic Research; September, 2013
5. Colin Murphy, Darbi Sovay Krumpos, Abby Feinstein; Factors Impacting Low-Slope Roofing Costs, Trininty and Certainteed Corporation, June, 2018
6. Barbosa, Woetzel, Mischke, Ribeirinho, Sridhar, Parsons, Bertram, Brown; Reinventing Construction: A Route to Higher Productivity; McKinsey Global Institute; February, 2017

OneDek® System Comparison
15
All Weather Insulated Panels
Appendix A
BOM Tables
Table 9 - BOM for OneDek System
Item Material/Unit Milwaukee Jacksonville San Jose
Roof Secondary Framing (Bar
Joists)
Units 142 114 114 Carbon Structural Steel,
Tons 38.85 36.3 36.5
Eave/Rake Structural Members
Carbon Structural Steel, Tons 11.6 11.6 19.4
OneDek Panels, 50’ lengths
Units 270 270 270 pounds 126,773 117,782 117,782
OneDek Joist Fasteners Carbon Steel, units 9,450 9,450 9,450
OneDek Lap Fasteners Carbon Steel, units 6,300 13,741 13,741
Roof Covering TPO Roofing, 100 ft2 450 450 450
Table 10 - BOM for Construction #2
Item Material/Unit Milwaukee Jacksonville San Jose
Roof Secondary Framing (Bar
Joists)
Units 124 126 132 Carbon Structural Steel,
Tons 36.4 34.4 37.3
Eave/Rake Structural Members
Carbon Structural Steel, Tons 11.6 11.6 19.4
Steel Roof Deck (50' lengths)
Units 300 300 300 Coiled Carbon Steel,
tons 36 36 36
Deck Joist Fasteners Carbon Steel, units 11,180 10,350 12,000
Deck Lap Fasteners Carbon Steel, units 15,251 15,251 15,251
Vapor Retarder 100 ft2 450 450 450
Insulation 4'x12' Polyisocyanurate Foam boards 2850 2850 2850
Insulation Fasteners Carbon Steel, units 2,964 2,964 2,964
Roof Covering Cementitious Roof Cover Board, 100 ft2 450 450 450
Roof Covering TPO Roofing, 100 ft2 450 450 450

OneDek® System Comparison
16
All Weather Insulated Panels
Table 11 - BOM for Construction #3
Item Material/Unit Milwaukee Jacksonville San Jose
Roof Secondary Framing (Bar
Joists)
Units 124 126 132 Carbon Structural Steel,
Tons 36.4 34.4 37.3
Eave/Rake Structural Members
Carbon Structural Steel, Tons 11.6 11.6 19.4
Steel roof Deck (50' lengths)
Coiled Carbon Steel, tons 300 300 300
Coiled Carbon Steel, tons 36 36 36
Deck Joist Fasteners Carbon Steel, units 11,180 10,350 12,000
Deck Lap Fasteners Carbon Steel, units 15,251 15,251 15,251
Vapor Retarder 100 ft2 450 450 450
Insulation Polyisocyanurate Foam boards, ft2 2850 2850 2850
Insulation Fasteners Carbon Steel, units 2,964 2,964 2,964
Roof Covering (Standing Seam
Roof)
Carbon Steel, Lineal Feet 22,500 23,250 22,500
Carbon Steel, Tons 27.7 27.7 27.7
Roof Securement SSR Clips 4,349 8,655 4,846
SSR Clip screws 8,894 19,798 11,456
OneDek® System Comparison
17
All Weather Insulated Panels
Data Tables
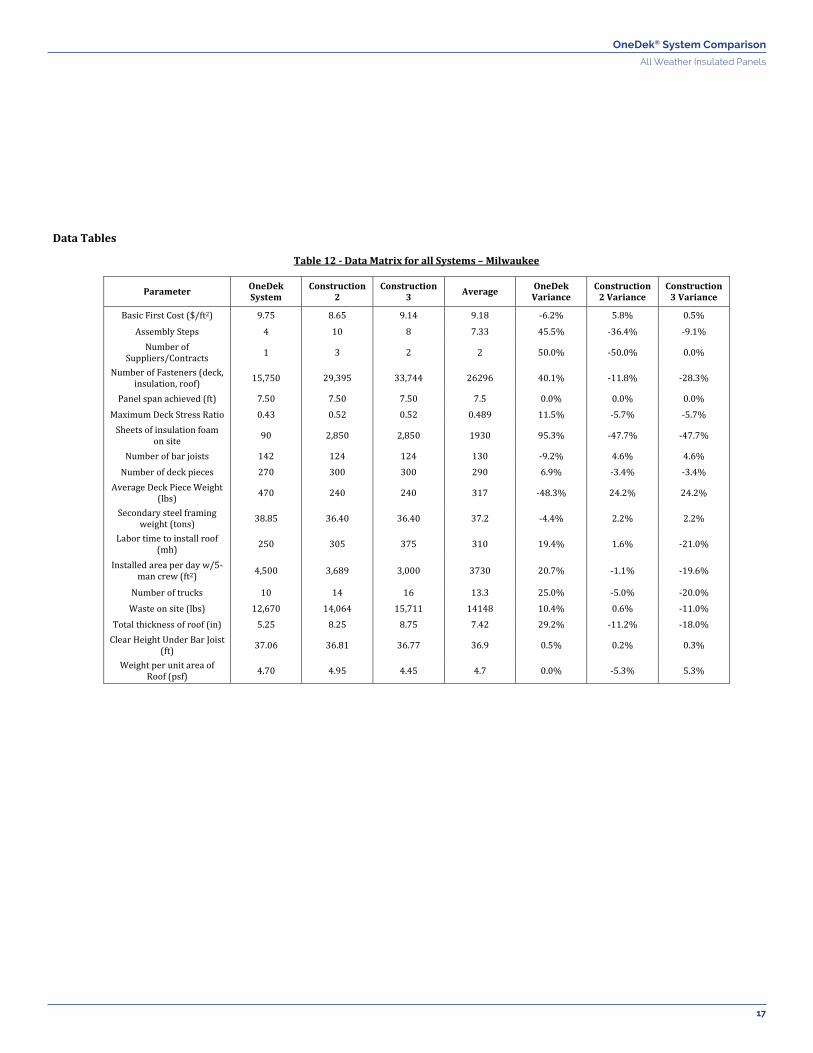
Table 12 - Data Matrix for all Systems – Milwaukee
Parameter OneDek System
Construction 2
Construction 3 Average OneDek
Variance Construction
2 Variance Construction
3 Variance
Basic First Cost ($/ft2) 9.75 8.65 9.14 9.18 -6.2% 5.8% 0.5%
Assembly Steps 4 10 8 7.33 45.5% -36.4% -9.1% Number of
Suppliers/Contracts 1 3 2 2 50.0% -50.0% 0.0%
Number of Fasteners (deck, insulation, roof) 15,750 29,395 33,744 26296 40.1% -11.8% -28.3%
Panel span achieved (ft) 7.50 7.50 7.50 7.5 0.0% 0.0% 0.0% Maximum Deck Stress Ratio 0.43 0.52 0.52 0.489 11.5% -5.7% -5.7%
Sheets of insulation foam on site 90 2,850 2,850 1930 95.3% -47.7% -47.7%
Number of bar joists 142 124 124 130 -9.2% 4.6% 4.6% Number of deck pieces 270 300 300 290 6.9% -3.4% -3.4%
Average Deck Piece Weight (lbs) 470 240 240 317 -48.3% 24.2% 24.2%
Secondary steel framing weight (tons) 38.85 36.40 36.40 37.2 -4.4% 2.2% 2.2%
Labor time to install roof (mh) 250 305 375 310 19.4% 1.6% -21.0%
Installed area per day w/5-man crew (ft2) 4,500 3,689 3,000 3730 20.7% -1.1% -19.6%
Number of trucks 10 14 16 13.3 25.0% -5.0% -20.0% Waste on site (lbs) 12,670 14,064 15,711 14148 10.4% 0.6% -11.0%
Total thickness of roof (in) 5.25 8.25 8.75 7.42 29.2% -11.2% -18.0% Clear Height Under Bar Joist
(ft) 37.06 36.81 36.77 36.9 0.5% 0.2% 0.3%
Weight per unit area of Roof (psf) 4.70 4.95 4.45 4.7 0.0% -5.3% 5.3%
OneDek® System Comparison
18
All Weather Insulated Panels
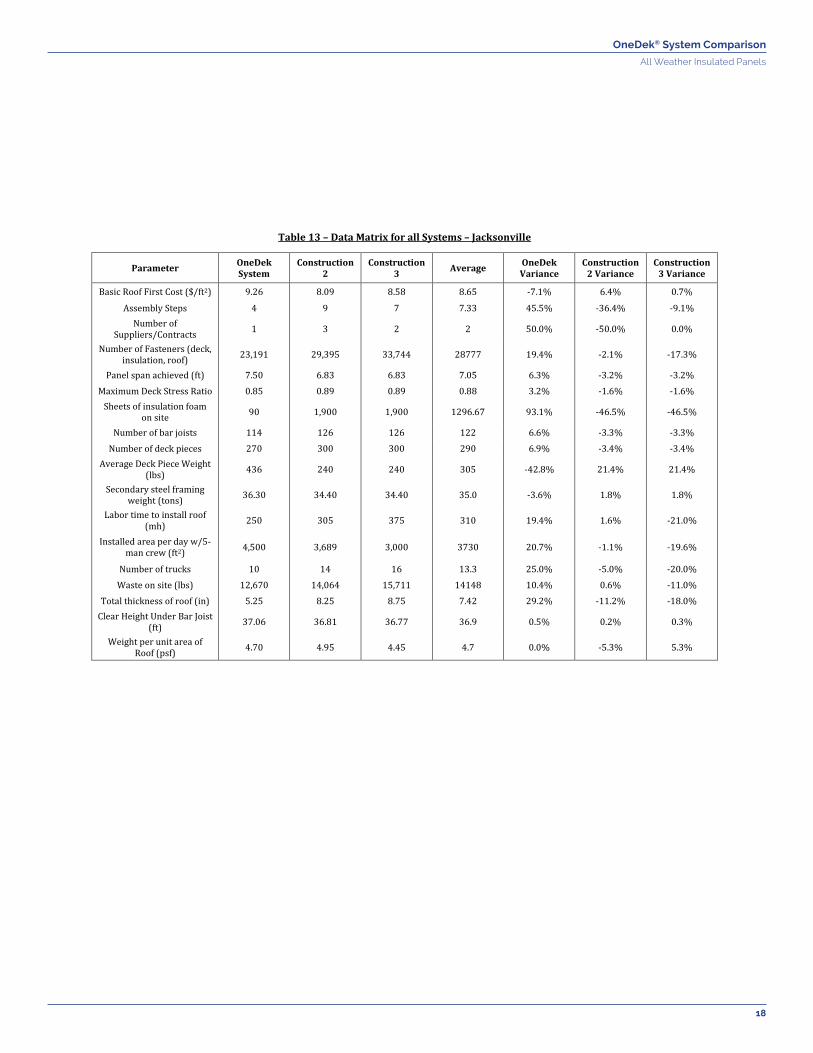
Table 13 – Data Matrix for all Systems – Jacksonville
Parameter OneDek System
Construction 2
Construction 3 Average OneDek
Variance Construction
2 Variance Construction
3 Variance
Basic Roof First Cost ($/ft2) 9.26 8.09 8.58 8.65 -7.1% 6.4% 0.7%
Assembly Steps 4 9 7 7.33 45.5% -36.4% -9.1% Number of
Suppliers/Contracts 1 3 2 2 50.0% -50.0% 0.0%
Number of Fasteners (deck, insulation, roof) 23,191 29,395 33,744 28777 19.4% -2.1% -17.3%
Panel span achieved (ft) 7.50 6.83 6.83 7.05 6.3% -3.2% -3.2% Maximum Deck Stress Ratio 0.85 0.89 0.89 0.88 3.2% -1.6% -1.6%
Sheets of insulation foam on site 90 1,900 1,900 1296.67 93.1% -46.5% -46.5%
Number of bar joists 114 126 126 122 6.6% -3.3% -3.3% Number of deck pieces 270 300 300 290 6.9% -3.4% -3.4%
Average Deck Piece Weight (lbs) 436 240 240 305 -42.8% 21.4% 21.4%
Secondary steel framing weight (tons) 36.30 34.40 34.40 35.0 -3.6% 1.8% 1.8%
Labor time to install roof (mh) 250 305 375 310 19.4% 1.6% -21.0%
Installed area per day w/5-man crew (ft2) 4,500 3,689 3,000 3730 20.7% -1.1% -19.6%
Number of trucks 10 14 16 13.3 25.0% -5.0% -20.0% Waste on site (lbs) 12,670 14,064 15,711 14148 10.4% 0.6% -11.0%
Total thickness of roof (in) 5.25 8.25 8.75 7.42 29.2% -11.2% -18.0% Clear Height Under Bar Joist
(ft) 37.06 36.81 36.77 36.9 0.5% 0.2% 0.3%
Weight per unit area of Roof (psf) 4.70 4.95 4.45 4.7 0.0% -5.3% 5.3%
OneDek® System Comparison
19
All Weather Insulated Panels
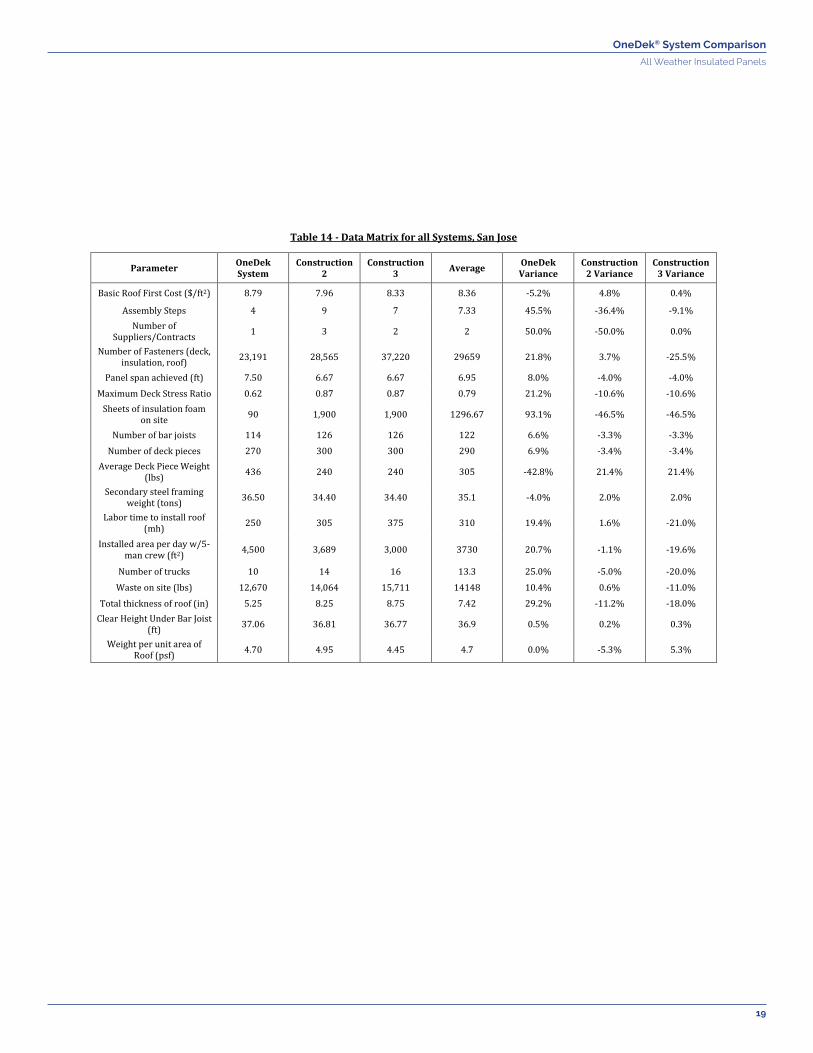
Table 14 - Data Matrix for all Systems, San Jose
Parameter OneDek System
Construction 2
Construction 3 Average OneDek
Variance Construction
2 Variance Construction
3 Variance
Basic Roof First Cost ($/ft2) 8.79 7.96 8.33 8.36 -5.2% 4.8% 0.4%
Assembly Steps 4 9 7 7.33 45.5% -36.4% -9.1% Number of
Suppliers/Contracts 1 3 2 2 50.0% -50.0% 0.0%
Number of Fasteners (deck, insulation, roof) 23,191 28,565 37,220 29659 21.8% 3.7% -25.5%
Panel span achieved (ft) 7.50 6.67 6.67 6.95 8.0% -4.0% -4.0% Maximum Deck Stress Ratio 0.62 0.87 0.87 0.79 21.2% -10.6% -10.6%
Sheets of insulation foam on site 90 1,900 1,900 1296.67 93.1% -46.5% -46.5%
Number of bar joists 114 126 126 122 6.6% -3.3% -3.3% Number of deck pieces 270 300 300 290 6.9% -3.4% -3.4%
Average Deck Piece Weight (lbs) 436 240 240 305 -42.8% 21.4% 21.4%
Secondary steel framing weight (tons) 36.50 34.40 34.40 35.1 -4.0% 2.0% 2.0%
Labor time to install roof (mh) 250 305 375 310 19.4% 1.6% -21.0%
Installed area per day w/5-man crew (ft2) 4,500 3,689 3,000 3730 20.7% -1.1% -19.6%
Number of trucks 10 14 16 13.3 25.0% -5.0% -20.0% Waste on site (lbs) 12,670 14,064 15,711 14148 10.4% 0.6% -11.0%
Total thickness of roof (in) 5.25 8.25 8.75 7.42 29.2% -11.2% -18.0% Clear Height Under Bar Joist
(ft) 37.06 36.81 36.77 36.9 0.5% 0.2% 0.3%
Weight per unit area of Roof (psf) 4.70 4.95 4.45 4.7 0.0% -5.3% 5.3%
OneDek® System Comparison
20
All Weather Insulated Panels
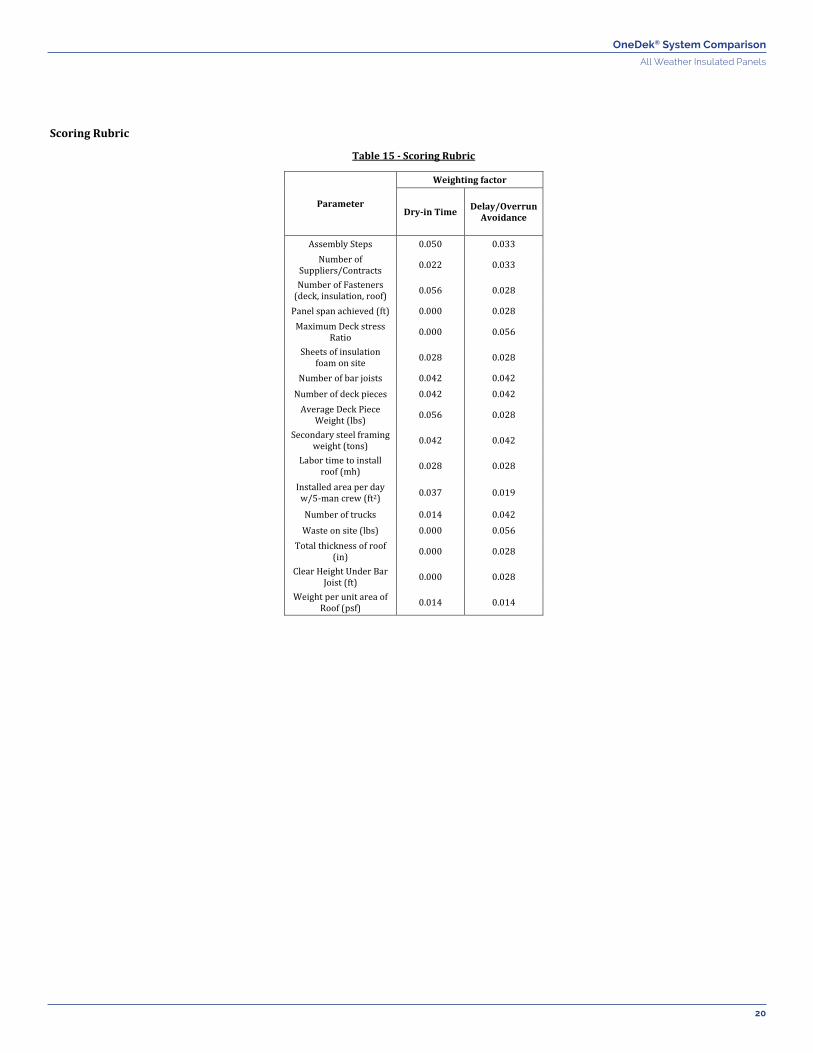
Scoring Rubric
Table 15 - Scoring Rubric
Parameter
Weighting factor
Dry-in Time Delay/Overrun Avoidance
Assembly Steps 0.050 0.033 Number of
Suppliers/Contracts 0.022 0.033
Number of Fasteners (deck, insulation, roof) 0.056 0.028
Panel span achieved (ft) 0.000 0.028 Maximum Deck stress
Ratio 0.000 0.056
Sheets of insulation foam on site 0.028 0.028
Number of bar joists 0.042 0.042 Number of deck pieces 0.042 0.042
Average Deck Piece Weight (lbs) 0.056 0.028
Secondary steel framing weight (tons) 0.042 0.042
Labor time to install roof (mh) 0.028 0.028
Installed area per day w/5-man crew (ft2) 0.037 0.019
Number of trucks 0.014 0.042 Waste on site (lbs) 0.000 0.056
Total thickness of roof (in) 0.000 0.028
Clear Height Under Bar Joist (ft) 0.000 0.028
Weight per unit area of Roof (psf) 0.014 0.014