onesource indirect tax q3’11 sales tax & vat rate report · for more assistance, use our...
TRANSCRIPT

- 1 -
Tax Data Updates
© 2011 Thomson Reuters. All rights reserved. For more assistance, use our online resources or contact Sabrix Technical Support by opening a support request through the Sabrix Support Network at https://customer.sabrix.com, or phone us at 1-866-472-2749. [email protected] http://onesource.thomsonreuters.com/solutions/indirect-tax/
ONESOURCE Indirect Tax Q3’11 Sales Tax & VAT Rate
Report
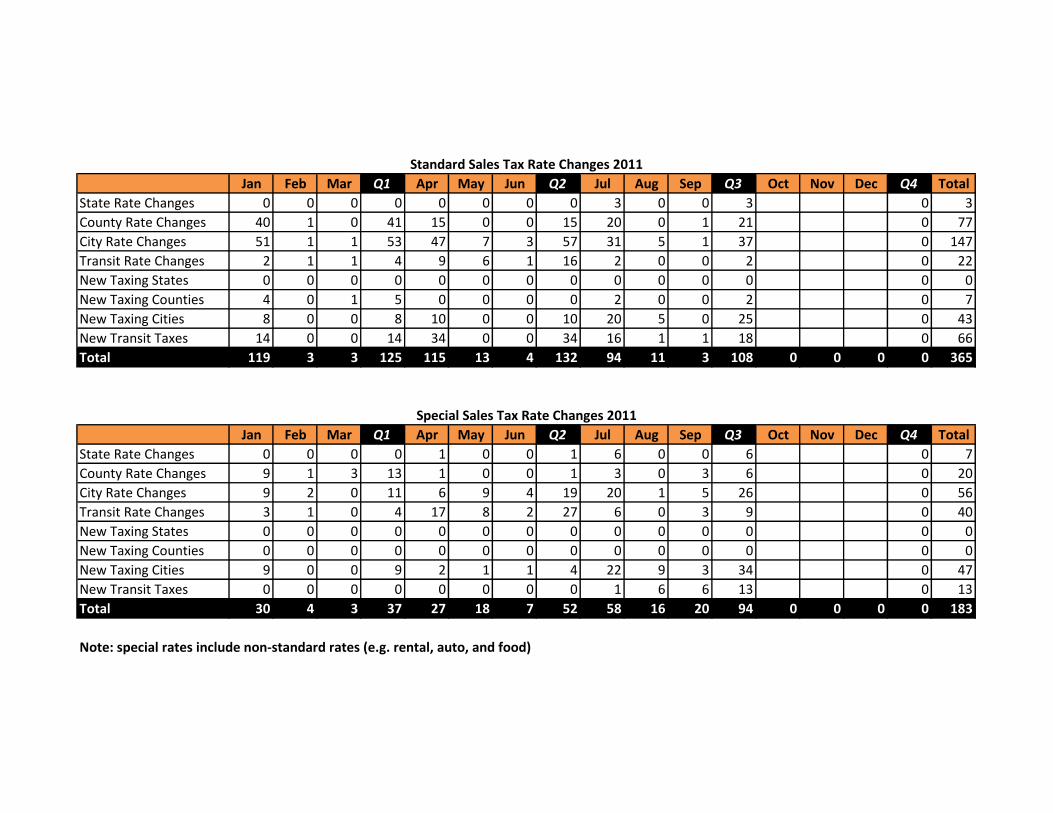
Standard Sales Tax Rate Changes 2011
Jan Feb Mar Q1 Apr May Jun Q2 Jul Aug Sep Q3 Oct Nov Dec Q4 Total
State Rate Changes 0 0 0 0 0 0 0 0 3 0 0 3 0 3
County Rate Changes 40 1 0 41 15 0 0 15 20 0 1 21 0 77
City Rate Changes 51 1 1 53 47 7 3 57 31 5 1 37 0 147
Transit Rate Changes 2 1 1 4 9 6 1 16 2 0 0 2 0 22
New Taxing States 0 0 0 0 0 0 0 0 0 0 0 0 0 0
New Taxing Counties 4 0 1 5 0 0 0 0 2 0 0 2 0 7
New Taxing Cities 8 0 0 8 10 0 0 10 20 5 0 25 0 43
New Transit Taxes 14 0 0 14 34 0 0 34 16 1 1 18 0 66
Total 119 3 3 125 115 13 4 132 94 11 3 108 0 0 0 0 365
Special Sales Tax Rate Changes 2011
Jan Feb Mar Q1 Apr May Jun Q2 Jul Aug Sep Q3 Oct Nov Dec Q4 Total
State Rate Changes 0 0 0 0 1 0 0 1 6 0 0 6 0 7
County Rate Changes 9 1 3 13 1 0 0 1 3 0 3 6 0 20
City Rate Changes 9 2 0 11 6 9 4 19 20 1 5 26 0 56
Transit Rate Changes 3 1 0 4 17 8 2 27 6 0 3 9 0 40
New Taxing States 0 0 0 0 0 0 0 0 0 0 0 0 0 0
New Taxing Counties 0 0 0 0 0 0 0 0 0 0 0 0 0 0
New Taxing Cities 9 0 0 9 2 1 1 4 22 9 3 34 0 47
New Transit Taxes 0 0 0 0 0 0 0 0 1 6 6 13 0 13
Total 30 4 3 37 27 18 7 52 58 16 20 94 0 0 0 0 183
Note: special rates include non-standard rates (e.g. rental, auto, and food)

2011 Regular Sales Tax Rate Changes
(total number of increases, decreases, and new rates)
Months State County City District Subtotals TotalIn
cre
ase
s
De
cre
ase
s
Ne
w
Incr
eas
es
De
cre
ase
s
Ne
w
Incr
eas
es
De
cre
ase
s
Ne
w
Incr
eas
es
De
cre
ase
s
Ne
w
Ch
ange
s
Ne
w
Jan 0 0 0 27 13 4 47 4 8 1 1 14 93 26 119
Feb 0 0 0 1 0 0 1 0 0 1 0 0 3 0 3
Mar 0 0 0 0 0 1 1 0 0 1 0 0 2 1 3
Q1 0 0 0 28 13 5 49 4 8 3 1 14 98 27 125
Apr 0 0 0 13 2 0 40 7 10 6 3 34 71 44 115
May 0 0 0 0 0 0 7 0 0 6 0 0 13 0 13
Jun 0 0 0 0 0 0 3 0 0 1 0 0 4 0 4
Q2 0 0 0 13 2 0 50 7 10 13 3 34 88 44 132
Jul 1 2 0 18 2 2 29 2 20 2 0 16 56 38 94
Aug 0 0 0 0 0 0 4 1 5 0 0 1 5 6 11
Sep 0 0 0 1 0 0 1 0 0 0 0 1 2 1 3
Q3 1 2 0 19 2 2 34 3 25 2 0 18 63 45 108
Oct 0 0 0
Nov 0 0 0
Dec 0 0 0
Q4 0 0 0 0 0 0 0 0 0 0 0 0 0 0 0
Total 1 2 0 60 17 7 133 14 43 18 4 66 249 116 365
2011 Special Sales Tax Rate Changes
(total number of increases, decreases, and new rates)
Months State County City District Subtotals Total
Incr
eas
es
De
cre
ase
s
Ne
w
Incr
eas
es
De
cre
ase
s
Ne
w
Incr
eas
es
De
cre
ase
s
Ne
w
Incr
eas
es
De
cre
ase
s
Ne
w
Ch
ange
s
Ne
w
Jan 0 0 0 8 4 0 5 1 9 3 0 0 21 9 30
Feb 0 0 0 1 0 0 2 0 0 1 0 0 4 0 4
Mar 0 0 0 0 3 0 0 0 0 0 0 0 3 0 3
Q1 0 0 0 9 7 0 7 1 9 4 0 0 28 9 37
Apr 1 0 0 0 1 0 6 0 2 5 12 0 25 2 27
May 0 0 0 0 0 0 9 0 1 8 0 0 17 1 18
Jun 0 0 0 0 0 0 4 0 1 2 0 0 6 1 7
Q2 1 0 0 0 1 0 19 0 4 15 12 0 48 4 52
Jul 1 1 4 3 0 0 19 1 22 6 0 1 31 27 58
Aug 0 0 0 0 0 0 1 0 9 0 0 6 1 15 16
Sep 0 0 0 3 0 0 5 0 3 3 0 6 11 9 20
Q3 1 1 4 6 0 0 25 1 34 9 0 13 43 51 94
Oct 0 0 0
Nov 0 0 0
Dec 0 0 0
Q4 0 0 0 0 0 0 0 0 0 0 0 0 0 0 0
Total 2 1 4 15 8 0 51 2 47 28 12 13 119 64 183
Note: special rates include non-standard rates (e.g. rental, auto, and food)

Summary of Average U.S. Sales Tax Rates 2011
Year
State Avg.
Rate
County Avg.
Rate
City Avg.
Rate
Combined
Avg. Rate
2011 5.48 1.15 1.67 8.3
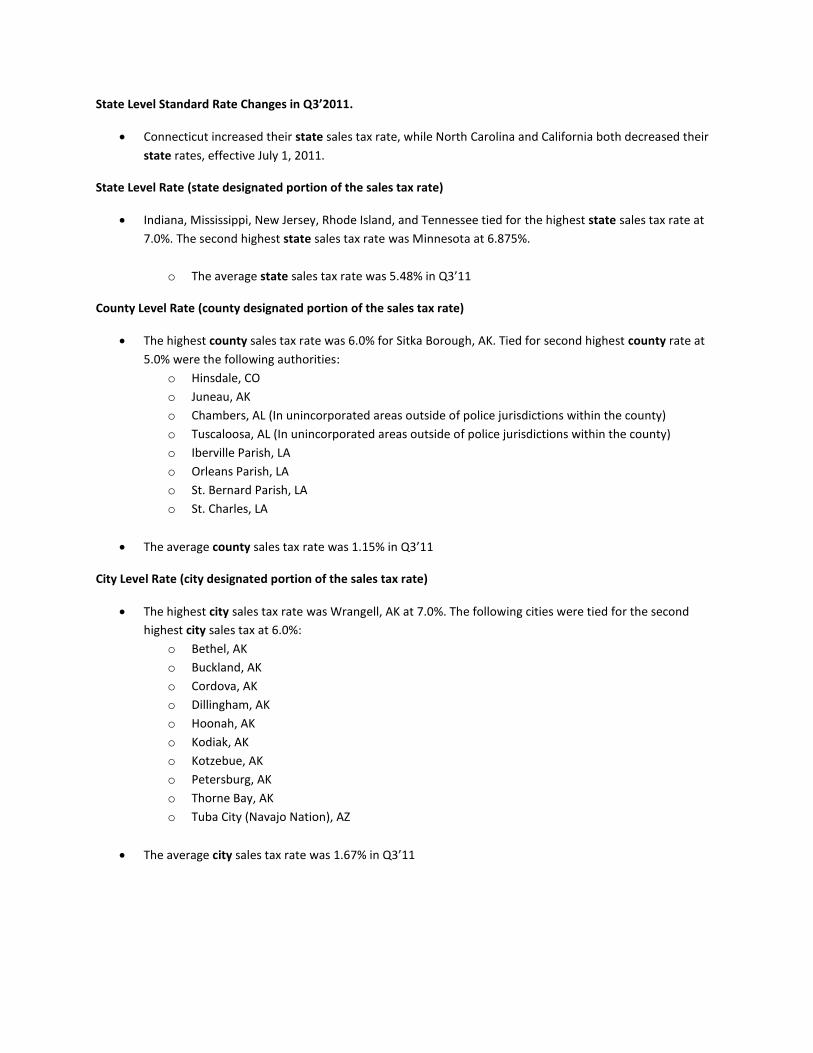
State Level Standard Rate Changes in Q3’2011.
Connecticut increased their state sales tax rate, while North Carolina and California both decreased their
state rates, effective July 1, 2011.
State Level Rate (state designated portion of the sales tax rate)
Indiana, Mississippi, New Jersey, Rhode Island, and Tennessee tied for the highest state sales tax rate at
7.0%. The second highest state sales tax rate was Minnesota at 6.875%.
o The average state sales tax rate was 5.48% in Q3’11
County Level Rate (county designated portion of the sales tax rate)
The highest county sales tax rate was 6.0% for Sitka Borough, AK. Tied for second highest county rate at
5.0% were the following authorities:
o Hinsdale, CO
o Juneau, AK
o Chambers, AL (In unincorporated areas outside of police jurisdictions within the county)
o Tuscaloosa, AL (In unincorporated areas outside of police jurisdictions within the county)
o Iberville Parish, LA
o Orleans Parish, LA
o St. Bernard Parish, LA
o St. Charles, LA
The average county sales tax rate was 1.15% in Q3’11
City Level Rate (city designated portion of the sales tax rate)
The highest city sales tax rate was Wrangell, AK at 7.0%. The following cities were tied for the second
highest city sales tax at 6.0%:
o Bethel, AK
o Buckland, AK
o Cordova, AK
o Dillingham, AK
o Hoonah, AK
o Kodiak, AK
o Kotzebue, AK
o Petersburg, AK
o Thorne Bay, AK
o Tuba City (Navajo Nation), AZ
The average city sales tax rate was 1.67% in Q3’11

Combined: State/County/City Rate
The jurisdictions with the highest combined sales tax rates are as follows:
o 13.725% Tuba City, AZ (Navajo Nation)
o 12.1% Kayenta, AZ (Navajo Nation)
o 11.725% Fredonia, AZ (Coconino County)
o 11.725% Coconino County, AZ (Navajo Nation)
o 11.7% San Luis, AZ (Yuma County)
o 11.5% Collinsville, AL (Cherokee County)
o 11.5% Piedmont, AL (Cherokee County)
o 11.3% Guadalupe, AZ (Maricopa County)
o 11.125% Mansfield, AR (Scott County)
o 11.1% Apache County, AZ (Navajo Nation)
o 11.1% Navajo County, AZ (Navajo Nation)
o 11.1% Winkelman, AZ (Gila County)
o 11.0% Fort Gibson, OK (Cherokee County)
o 11.0% Dermott, AR (Chicot County)
o 11.0% Eudora, AR (Chicot County)
o 11.0% Lake Village, AR (Chicot County)
o 11.0% Arab, AL (Cullman County)
o 11.0% Bellwood, IL (Inside districts)
o 11.0% Lake Providence, LA (East Carroll Parish)
o 11.0% Hallett, OK (Pawnee County)
The average combined rate was 8.3% in Q3’11
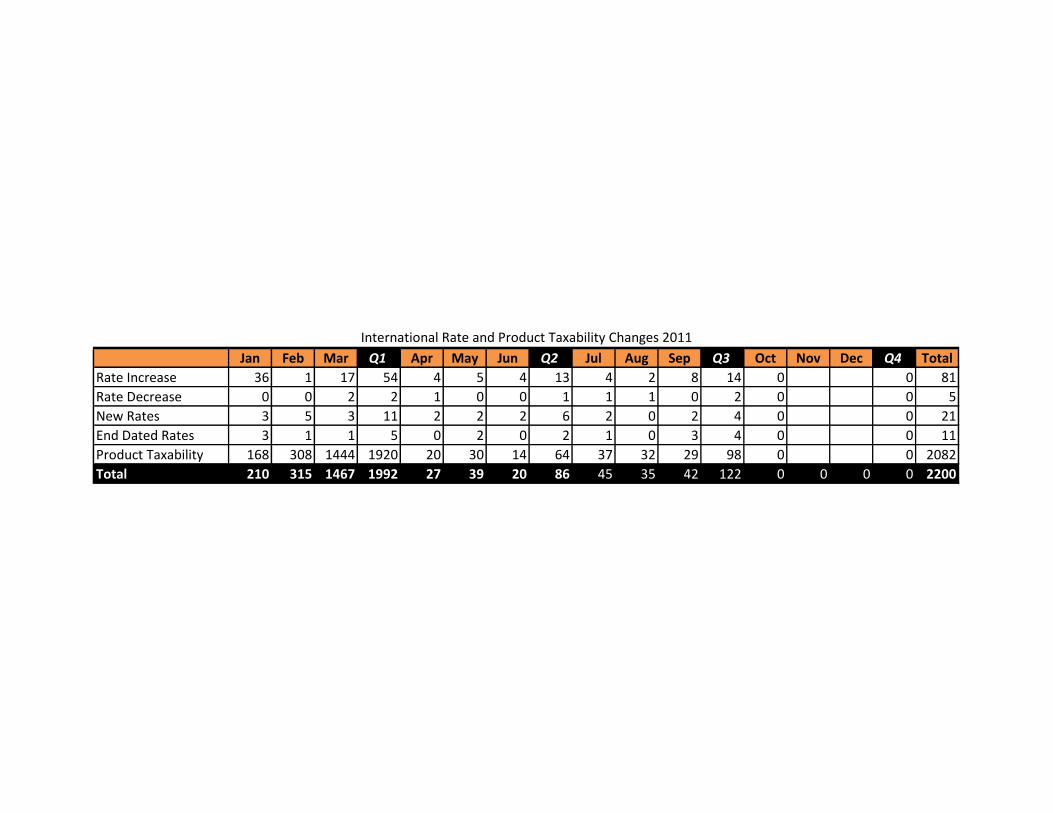
Jan Feb Mar Q1 Apr May Jun Q2 Jul Aug Sep Q3 Oct Nov Dec Q4 Total
Rate Increase 36 1 17 54 4 5 4 13 4 2 8 14 0 0 81
Rate Decrease 0 0 2 2 1 0 0 1 1 1 0 2 0 0 5
New Rates 3 5 3 11 2 2 2 6 2 0 2 4 0 0 21
End Dated Rates 3 1 1 5 0 2 0 2 1 0 3 4 0 0 11
Product Taxability 168 308 1444 1920 20 30 14 64 37 32 29 98 0 0 2082
Total 210 315 1467 1992 27 39 20 86 45 35 42 122 0 0 0 0 2200
International Rate and Product Taxability Changes 2011

Country Level Standard Rate Changes in Q3’ 2011.
Pakistan decreased standard rate from 17% to 16% effective July 1, 2011
Italy increased standard rate from 20% to 21% effective September 17, 2011
State/Authority Level Rate Change in Q3’ 2011
India Tamil Nadu had a standard rate increase effective 12 July 2011
Product Taxability Changes in Q3’ 2011
Ireland had product taxability changes in July 2011
Pakistan had product taxability changes in July 2011
Ukraine had product taxability changes in July 2011
India Tamil Nadu had product taxability changes in July 2011
Greece had product taxability changes in August 2011
Uruguay had product taxability changes in August 2011
Canada had product taxability changes in August 2011
Cape Verde had product taxability changes in September 2011
Costa Rica had product taxability changes in September 2011
Senegal had product taxability changes in September 2011