ongoing evolution of the electricity industry - new jersey evolution of... · ongoing evolution of...
TRANSCRIPT

Ongoing Evolution of the Electricity Industry:
Effects of Market Conditions and the Clean Power Plan
on States
Presenter: Martin T. Ross
8/16/16
Nicholas Institute for Environmental Policy SolutionsDuke University

2
• Current Paper: https://nicholasinstitute.duke.edu/climate/publications/ongoing-evolution-electricity-industry-effects-market-conditions-and-clean-power-plan
• Analyses of Original CPP Proposal: https://nicholasinstitute.duke.edu/climate/publications/clean-power-plan-implications-three-compliance-decisions-us-states; https://nicholasinstitute.duke.edu/climate/publications/assessing-impacts-clean-power-plan-southeast-states
• Energy Policy Paper: http://www.sciencedirect.com/science/article/pii/S0301421515001421

Overview
• Summary of the Analysis Highlights
• Brief description of the DIEM-Electricity Model– Important assumptions and sensitivities
• DIEM Model Results– Baseline trends in the industry without the CPP
– CPP policy results for coordinated national responses• Mass cap over existing, mass cap with NSC, dual rate
– CPP policy results for state “patchwork” approaches
• Thoughts on sensitivities and conclusions
3

Highlights of the Analysis• Gas prices are very important for both baseline emissions
and CPP policy costs and emissions– Renewable costs and energy efficiency availability are also important
• Costs of CPP are relatively low, nationally– Mass cap over existing units is the cheapest option– Mass with New Source Complement and Dual Rate have similar costs
• There is no single answer for most states– Some states are clearly better off under one approach– For most states, what your neighbors do will matter a lot– Use caution when interpreting results at the state level…
• Costs can vary significantly by state– Some states may benefit from selling ERCs/allowances or electricity– ERC/allowance values depend on the breadth of the markets– Mass-based options have a narrower range of cost outcomes than Rate
4

DIEM Model Summary“Dynamic Integrated Economy/Energy/Emissions Model”
5
• Electricity Dispatch Component– Linear programming model with foresight
Minimize costs of generation subject to meeting demand and policies
– U.S. regional markets (10-60 regions, 40 used in this analysis)– Historical data on existing units from IPM NEEDS v.5.15
• Added announced retirements and new additions
– Coal efficiency retrofits, redispatch of existing NGCC, energy efficiency, and construction of new renewables are choices
• Model Assumptions Affecting Findings:– Federal extension of renewables PTC/ITC– AEO 2015 – electricity demands, some capital costs, some fuel prices
• Adjustments to AEO assumptions shown on next slide
– EPA assumptions on cost and availability of energy efficiency (EE)– In the long term, assume a 2nd 20-year nuclear life extension– Banking of ERCs/allowances over 2022-2029 (annual goal after 2030)

DIEM Model Assumptions
6
• Natural Gas Prices– Midpoint of AEO 2015 Reference and AEO low gas price cases (similar to AEO 2016)
• Renewables Costs– EPA RIA for CPP Final Rule (standard assumption)– NREL Annual Technology Baseline – Low case
• Electricity Demand Growth– AEO 2015 Reference Case has ~0.7%/year for the U.S. as a whole (regional rates can vary)
• “Standard Assumption” – at this growth rate, including energy efficiency leaves demand growth at basically zero
– “Low Growth”: electricity growth of 0.4%/year (excluding EE measures)– “Medium-High Growth”: electricity growth of 1.2%/year (excluding EE measures)– “High Growth”: electricity growth of 1.7%/year (excluding EE measures)
$ per kW Source 2020 2025 2030 2035 2040
WindEPA $1,682 $1,672 $1,668 $1,668 $1,667
NREL ATB - Low $1,570 $1,550 $1,540 $1,536 $1,536
Solar PVEPA $1,552 $1,423 $1,294 $1,165 $1,035
NREL ATB - Low $1,069 $1,069 $1,069 $1,069 $1,069
U.S. Delivered Natural Gas Price ($/MMBtu) 2020 2025 2030 2035 20402016-2037
average
High Gas Price (AEO 2015 Reference Case) $5.07 $5.79 $5.67 $6.57 $7.82 $5.38
Medium Gas Price (standard assumption) $4.34 $4.78 $4.70 $5.36 $6.14 $4.57
Low Gas Price (AEO High Resource Case) $3.60 $3.76 $3.74 $4.14 $4.46 $3.76

North Central
West
Southeast
RGGI
SouthCentral
RGGI
Definitions of State Groupings for Reporting(only used as trading regions in a few policy runs)
California
East Central

Highlights: Baseline Trends in the Industry(without the CPP)
• CO2 emissions depend critically on future natural gas prices– Moderate gas prices leave future emissions near today’s levels– Lower gas prices can result in significant declines in emissions
• Low gas prices (below $4/MMBtu) will shift the generation mix– Compared with gas prices above $4, gas generation could be 30% higher
and coal generation 20% lower by 2030– High gas prices would reverse this and also lead to more renewables
• Clean Power Plan may not be binding in some regions initially– This effect does not extend beyond the first few years of the policy
(unless gas prices are lower than forecasted)
• Renewables penetration depends on future construction costs– Extension of federal PTC/ITC leads to extra 15-40 GW by early 2020s– Impacts of the PTC/ITC fade out without additional extensions– Wind generation increases as costs decline and effectiveness increases– Utility solar PV costs need to be close to $1/watt to be cost competitive
8

9
Baseline Emissions under Alternative Assumptions(compared to CPP)
1,400
1,500
1,600
1,700
1,800
1,900
2,000
2,100
2,200
2,300
2016 2020 2022 2025 2028 2030
MM
TCO
2
Standard Assumptions (w/o EE) Standard Assumptions (w/ EE)
High Gas Price Low Gas Price
High Electricity Demand
CPP Goals (Mass over existing units) CPP Goals (Mass with NSC)

10
2030 Baseline Fossil Generation under Alternative Assumptions
800
1,000
1,200
1,400
1,600
1,800
2,000
1,000 1,100 1,200 1,300 1,400 1,500 1,600 1,700 1,800
Nat
ura
l Gas
(TW
h)
Coal (TWh)
Standard Assumptions (w/o EE) High Gas Price Low Gas Price
Low Renewable Cost Low Gas Price & Low Renew Cost
High Electricity Demand Med-High Electricity Demand Low Electricity Demand
High EE (1.5%) Medium EE (1.0%) Low EE (0.5%)

Future CPP Policy Options• Focus on three policy options:
1) Rate-based with dual rates (subcategorized coal/natural gas targets)o ERCs from fossil-steam, gas-shift, renewables, EE, under-construction nuclear
2) Mass-based over existing unitso Mass states do not sell ERCs into Rate stateso Includes leakage provisions (output-based allocations, renewables set-asides)
3) Mass-based including new units (New Source Complement)o Mass states do not sell ERCs into Rate states
• Start with national coordinated approaches to the CPP– California always adopts NSC by itself, RGGI states adopt NSC as a group
• Examine patchwork outcomes of states’ CPP choices– States/regions are assumed to make different choices– Based on desire to export/import ERCs & allowances, overall policy costs
• Alternative assumptions about:– Natural gas prices, renewables costs, electricity demand growth, etc.
11

Highlights: National Approaches to CPP• CPP policy costs are relatively low for the United States*
– Regardless of the policy options chosen by states, costs are quite low (i.e., cost increases in the 0.1%–1.0% range, compared to industry costs in the baseline) across most assumptions about future trends in the industry
– The mass-based approach with the New Source Complement has policy costs roughly equivalent to those of the dual-rate approach
– Mass cap over existing units has the lowest policy costs– Prices for mass allowances and ERCs are quite low
• Mass-based options are less sensitive to future conditions
• Gas prices will affect policy costs– Low prices can reduce costs to almost zero– High prices could result in industry cost increases of 3.0%-3.5%
• Energy efficiency measures are important for containing costs
• Leakage of emissions through generation shifts is important– Mass cap over only existing sources has 7% higher emissions than mass w/NSC
(output-based allocations and renewables set-asides don’t affect leakage much)– Dual rate can also lead to emissions significantly higher (or lower) than NSC,
depending on future market conditions
12
* Note: any cost savings from energy efficiency measures are not counted as policy savings when calculating CPP costs

13
CPP Emissions under Alternative Assumptions
1,400
1,500
1,600
1,700
1,800
1,900
2,000
2,100
2,200
2,300
2016 2020 2022 2025 2028 2030 2035 2040
MM
TCO
2
Baseline Baseline with EE Mass (exist)
Mass (all) Rate (dual)
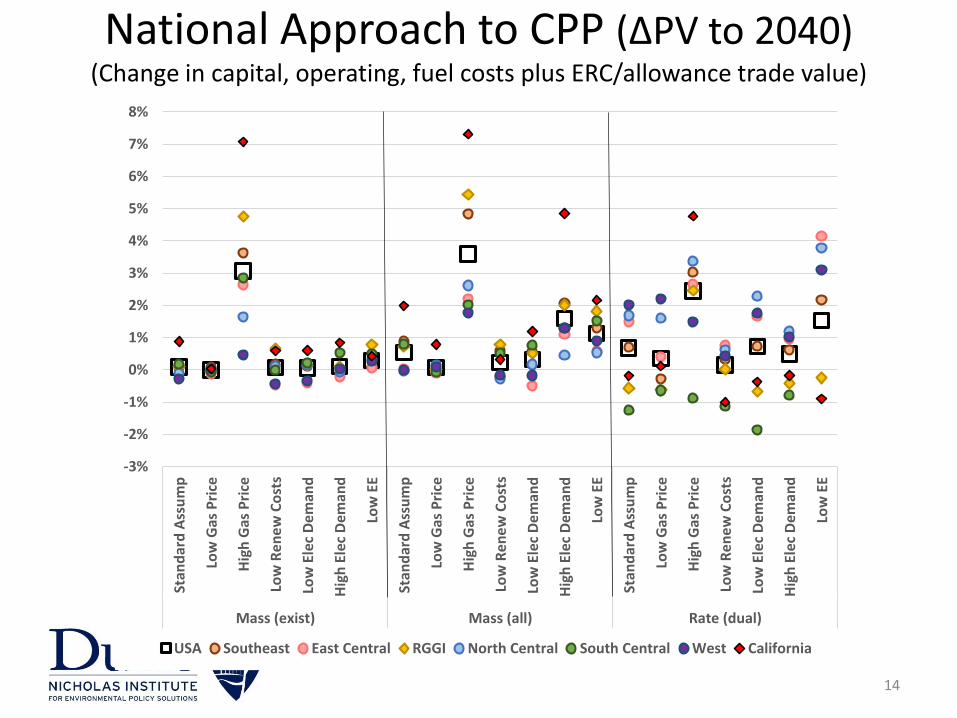
National Approach to CPP (∆PV to 2040)(Change in capital, operating, fuel costs plus ERC/allowance trade value)
14
-3%
-2%
-1%
0%
1%
2%
3%
4%
5%
6%
7%
8%
Stan
dar
d A
ssu
mp
Low
Gas
Pri
ce
Hig
h G
as P
rice
Low
Re
ne
w C
ost
s
Low
Ele
c D
em
and
Hig
h E
lec
Dem
and
Low
EE
Stan
dar
d A
ssu
mp
Low
Gas
Pri
ce
Hig
h G
as P
rice
Low
Re
ne
w C
ost
s
Low
Ele
c D
em
and
Hig
h E
lec
Dem
and
Low
EE
Stan
dar
d A
ssu
mp
Low
Gas
Pri
ce
Hig
h G
as P
rice
Low
Re
ne
w C
ost
s
Low
Ele
c D
em
and
Hig
h E
lec
Dem
and
Low
EE
Mass (exist) Mass (all) Rate (dual)
USA Southeast East Central RGGI North Central South Central West California

Leakage of National Mass Cap over Existing Units(emissions difference compared to Mass with NSC – in MMTCO2)
15
0
50
100
150
200
250
300
350
StandardAssump
HighElec
Demand
Med-HighElec
Demand
LowElec
Demand
HighGas
Price
LowGas
Price
LowRenew
Cost
LowEE
HighEE
MM
TCO
2
2022
2025
2028
2030
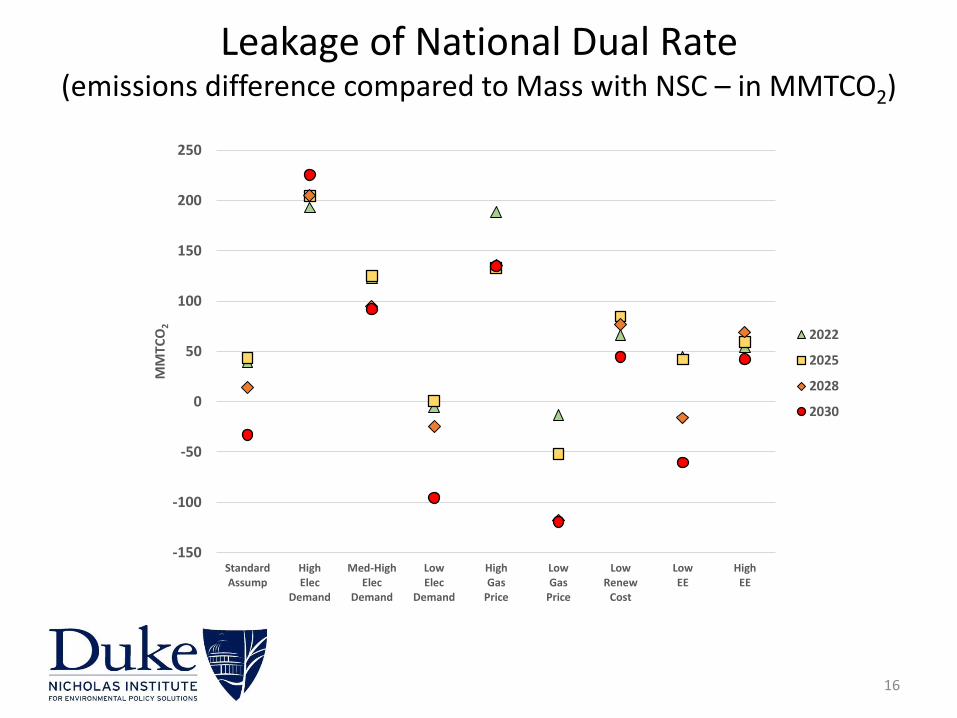
Leakage of National Dual Rate(emissions difference compared to Mass with NSC – in MMTCO2)
16
-150
-100
-50
0
50
100
150
200
250
StandardAssump
HighElec
Demand
Med-HighElec
Demand
LowElec
Demand
HighGas
Price
LowGas
Price
LowRenew
Cost
LowEE
HighEE
MM
TCO
2
2022
2025
2028
2030

Highlights: State-Level Impacts of CPP• State-level cost estimates depend on (among other things):
– Emissions goals– Existing generation fleet– Capacity to construct new renewables
• Caveats…– Use caution when interpreting state-level estimates of policy costs– To estimate impacts at the state level, the DIEM model:
• has the capability to reflect data on existing and new units within a state• assigns new generating units to a specific state, rather than broader utility region• forecasts electricity demand at the state level• estimates electricity flows between states and values it at wholesale prices• assigns ERCs to the state in which the ERC generating unit operates
– Note that dispatch models are trying to minimize overall costs over a long time horizon, not those to any specific state or region for a limited number of years
I do not have off-the-cuff answers for every state cost estimate and sensitivity…
• In general, policy costs can vary significantly across states– Some states are clearly better off with one approach over another– Some states can even be better off than they were without the CPP
(largely through exporting ERCs, allowances, or electricity)– For other states, answers are less clear and can depend on future conditions
17

18
Policy Costs – mass cap over existing (∆PV to 2040)
(Change in capital, operating, fuel costs plus ERC/allowance trade value)
States with RateStates with Mass (existing units)States with Mass (including new units) RGGI
-0.6%
-2.5%
-1.5%
0.4% 1.0%
0.8%
-1.0%
0.8%
-1.7%
0.1%
-1.0%
1.3%
2.1%
2.2%
5.2%
-3.1%
-0.8%
1.1%
1.2%
-1.5%
1.4%
3.0%
1.4%
0.0%
-1.1%
0.8%
-0.9%
0.0%
-2.7%
0.1%
0.9%
-1.0%
0.1%
-0.3%0.2%
-0.1%
0.6%-1.3%
0.4%
-1.1%
1.5%
1.4%
0.8%
-1.4%
-0.3% -1.7%
1.3%
0.9%

19
0.4%
-8.9%
-8.5%
0.1% 6.9%
4.7%
-8.0%
2.9%
1.5%
0.2%
1.0%
2.4%
0.9%
-6.4%
3.8%
-6.6%
-1.2%
2.3%
1.3%
-0.8%
1.3%
4.1%
0.3%
1.1%
-2.4%
1.2%
-1.0%
-0.2%
5.4%
0.5%
-0.7%
-0.1%
0.8%
-0.6%-1.0%
0.1%
0.7%-3.3%
0.3%
-0.8%
6.0%
1.1%
2.4%
-3.0%
-0.5% -1.7%
-0.5%
2.7%
States with RateStates with Mass (existing units)States with Mass (including new units) RGGI
Policy Costs – mass cap over all units (∆PV to 2040)
(Change in capital, operating, fuel costs plus ERC/allowance trade value)

20
0.9%
-11.6%
-9.0%
-3.8% 12.6%
22.3%
58.0%
2.9%
0.4%
-1.0%
-4.2%
1.0%
-0.8%
-22.1%
18.8%
-2.5%
2.3%
-1.7%
-0.2%
2.0%
4.1%
3.4%
0.7%
-2.1%
-4.1%
1.2%
0.0%
0.1%
18.8%
-2.2%
-0.2%
-3.5%
0.1%
0.2%0.1%
0.0%
0.1%-0.3%
-1.2%
-0.6%
-4.2%
6.9%
8.2%
0.0%
0.5% 1.8%
0.0%
-0.2%
States with RateStates with Mass (existing units)States with Mass (including new units) RGGI
Policy Costs – dual rate (∆PV to 2040)
(Change in capital, operating, fuel costs plus ERC/allowance trade value)
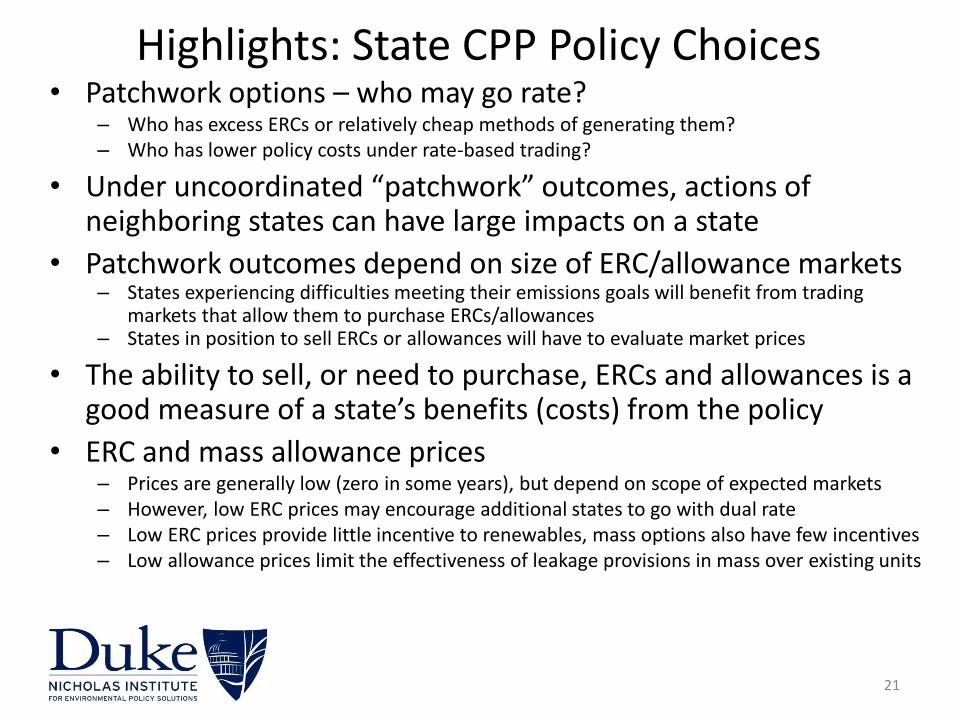
Highlights: State CPP Policy Choices• Patchwork options – who may go rate?
– Who has excess ERCs or relatively cheap methods of generating them?– Who has lower policy costs under rate-based trading?
• Under uncoordinated “patchwork” outcomes, actions of neighboring states can have large impacts on a state
• Patchwork outcomes depend on size of ERC/allowance markets– States experiencing difficulties meeting their emissions goals will benefit from trading
markets that allow them to purchase ERCs/allowances– States in position to sell ERCs or allowances will have to evaluate market prices
• The ability to sell, or need to purchase, ERCs and allowances is a good measure of a state’s benefits (costs) from the policy
• ERC and mass allowance prices– Prices are generally low (zero in some years), but depend on scope of expected markets– However, low ERC prices may encourage additional states to go with dual rate– Low ERC prices provide little incentive to renewables, mass options also have few incentives– Low allowance prices limit the effectiveness of leakage provisions in mass over existing units
21

22
ERC and Mass Allowance Trade (2030)Net Exports: ERCs in TWh, allowances in MMTCO2
-1.6
14.2
6.7
5.7 -16.4
-6.3
-24.1
-8.2
-1.9
69.9
20.5
17.5
7.1
14.6
11.4
-0.3
-10.7
-2.0
0.4
-17.0
-12.5
-19.6
-7.4
2.3
18.8
-2.9
19.8
-4.1
-39.7
-0.5
3.9
16.7
-0.4
1.51.6
5.9
0.01.6
8.8
1.8
2.9
-34.8
-27.6
-2.1
0.4 -10.5
-1.0
13.9
States with RateStates with Mass (existing units)States with Mass (including new units) RGGI
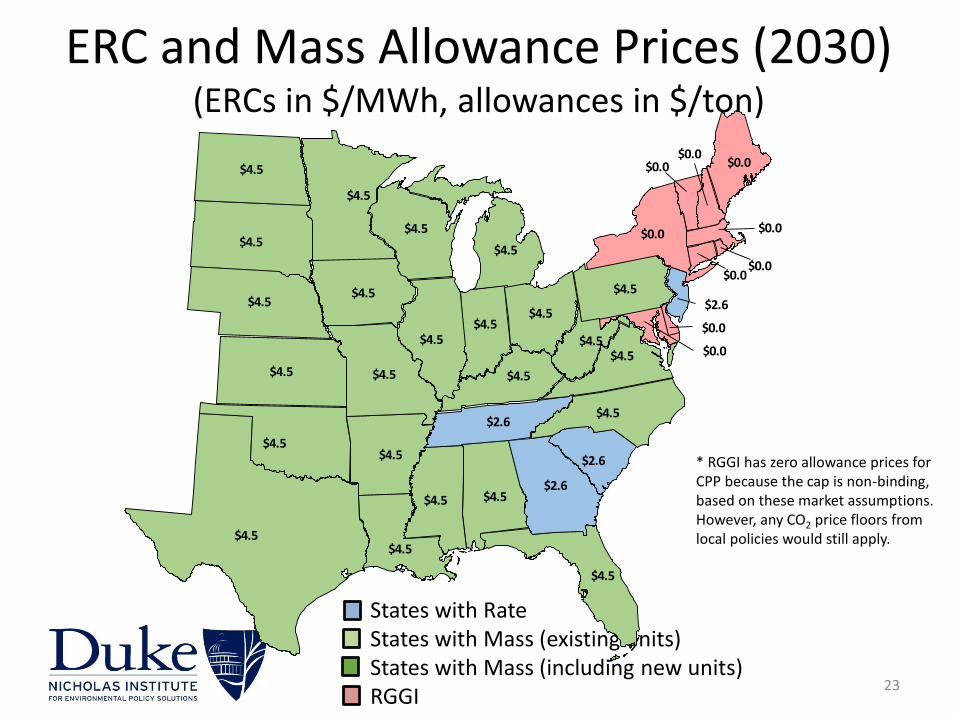
23
ERC and Mass Allowance Prices (2030)(ERCs in $/MWh, allowances in $/ton)
States with RateStates with Mass (existing units)States with Mass (including new units) RGGI
NV
$0.0
$0.0
$0.0
$0.0
$2.6
$0.0
$0.0$0.0
$4.5
$4.5
$4.5
$4.5
$4.5
$4.5
$4.5
$4.5
$4.5
$4.5
$4.5
$4.5
$4.5
$4.5
$4.5
$4.5
$4.5$4.5$2.6
$2.6
$2.6
$4.5
$4.5
$0.0
$4.5
$0.0
$4.5
$4.5
$4.5
* RGGI has zero allowance prices for CPP because the cap is non-binding, based on these market assumptions. However, any CO2 price floors from local policies would still apply.

24
ERC and Mass Allowance Prices (2030)(ERCs in $/MWh, allowances in $/ton)
States with RateStates with Mass (existing units)States with Mass (including new units) RGGI
NV
$0.0
$0.0
$0.0
$0.0
$4.6
$0.0
$0.0$0.0
$4.3
$4.3
$4.3
$4.6
$4.6
$4.6
$4.6
$4.6
$4.3
$4.3
$4.3
$4.3
$4.3
$4.3
$4.3
$4.3
$4.3$4.3$4.6
$4.6
$4.6
$4.3
$4.3
$0.0
$4.3
$0.0
$4.3
$4.3
$4.3
* RGGI has zero allowance prices for CPP because the cap is non-binding, based on these market assumptions. However, any CO2 price floors from local policies would still apply.

25
ERC and Mass Allowance Prices (2030)(ERCs in $/MWh, allowances in $/ton)
States with RateStates with Mass (existing units)States with Mass (including new units) RGGI
* RGGI has zero allowance prices for CPP because the cap is non-binding, based on these market assumptions. However, any CO2 price floors from local policies would still apply.
NV
$0.0
$0.0
$0.0
$0.0
$7.5
$0.0
$0.0$0.0
$4.4
$4.4
$7.5
$7.5
$7.5
$7.5
$7.5
$7.5
$4.4
$4.4
$4.4
$4.4
$4.4
$4.4
$4.4
$4.4
$7.5$7.5$7.5
$7.5
$7.5
$7.5
$4.4
$0.0
$4.4
$0.0
$7.5
$4.4
$4.4

26
ERC and Mass Allowance Prices (2030)(ERCs in $/MWh, allowances in $/ton)
States with RateStates with Mass (existing units)States with Mass (including new units) RGGI
NV
$0.0
$0.0
$0.0
$0.0
$6.9
$0.0
$0.0$0.0
$5.7
$5.7
$5.7
$6.9
$6.9
$6.9
$6.9
$6.9
$5.7
$5.7
$5.7
$5.7
$5.7
$5.7
$5.7
$6.9
$5.7$5.7$6.9
$6.9
$6.9
$5.7
$6.9
$0.0
$6.9
$0.0
$5.7
$6.9
$5.7
* RGGI has zero allowance prices for CPP because the cap is non-binding, based on these market assumptions. However, any CO2 price floors from local policies would still apply.
27
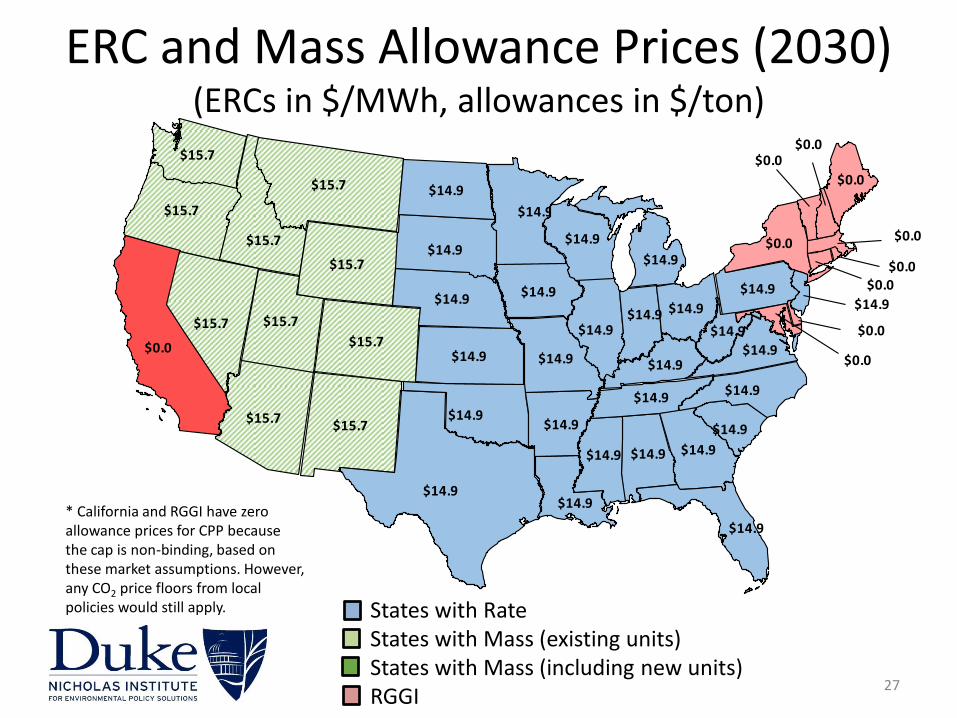
ERC and Mass Allowance Prices (2030)(ERCs in $/MWh, allowances in $/ton)
States with RateStates with Mass (existing units)States with Mass (including new units) RGGI
$15.7
$15.7
$15.7
$15.7 $15.7
$15.7
$15.7
$15.7
$15.7
$14.9
$14.9
$14.9
$14.9
$14.9
$14.9
$14.9
$14.9
$14.9
$14.9
$14.9
$14.9
$14.9
$14.9
$14.9
$14.9
$14.9
$14.9
$0.0
$14.9
$0.0
$0.0
$14.9
$0.0
$0.0$0.0
$14.9
$0.0$0.0
$14.9
$14.9
$15.7
$14.9
$14.9
$14.9
$14.9 $14.9
$0.0
$0.0
* California and RGGI have zero allowance prices for CPP because the cap is non-binding, based on these market assumptions. However, any CO2 price floors from local policies would still apply.

28
Policy Costs (∆PV to 2040)(Change in capital, operating, fuel costs plus ERC/allowance trade value)
States with RateStates with Mass (existing units)States with Mass (including new units) RGGI
NV
0.1%
0.0%
0.1%
0.8%
-1.8%
-0.2%
0.4%-0.5%
0.3
1.0%
1.1%
0.1%
0.2%
1.7%
2.4%
2.0%
6.4%
-2.2%
-0.4%
1.8%
1.1%
-1.1%
1.1%
1.9%
-1.0%-0.1%0.2%
0.1%
-1.7%
0.9%
0.0%
0.0%
-3.3%
0.5%
0.0%
-0.8%
-1.6%

29
Policy Costs (∆PV to 2040)(Change in capital, operating, fuel costs plus ERC/allowance trade value)
States with RateStates with Mass (existing units)States with Mass (including new units) RGGI
NV
-0.3%
-0.3%
0.0%
0.5%
-1.7%
1.8%
0.4%-0.6%
0.2
1.0%
1.0%
0.1%
0.7%
0.7%
3.5%
3.3%
4.3%
-2.0%
-0.5%
0.2%
0.6%
-0.8%
1.0%
2.1%
-0.7%-0.4%0.3%
-0.4%
-1.4%
0.9%
0.1%
0.1%
-2.8%
-0.2%
0.0%
-1.1%
-1.6%

30
Policy Costs (∆PV to 2040)(Change in capital, operating, fuel costs plus ERC/allowance trade value)
States with RateStates with Mass (existing units)States with Mass (including new units) RGGI
NV
-0.1%
0.0%
-0.5%
0.2%
-2.3%
0.8%
0.4%-0.3%
0.3
1.0%
3.6%
0.5%
-0.4%
1.5%
0.1%
-3.9%
4.1%
-1.7%
-0.7%
0.4%
0.8%
-0.9%
0.9%
2.7%
0.2%0.5%0.5%
-0.6%
-2.1%
0.9%
-0.2%
0.1%
-1.0%
-0.3%
0.4%
-1.6%
-2.2%

31
Policy Costs (∆PV to 2040)(Change in capital, operating, fuel costs plus ERC/allowance trade value)
States with RateStates with Mass (existing units)States with Mass (including new units) RGGI
NV
0.1%
0.1%
0.0%
0.3%
-0.5%
-0.1%
0.1%-0.2%
0.1
0.0%
1.4%
0.3%
-0.4%
2.8%
2.3%
-4.6%
4.4%
-2.6%
-1.1%
2.1%
1.2%
-0.7%
1.2%
2.2%
-1.0%-0.2%0.6%
-0.8%
-2.2%
0.9%
-0.3%
0.1%
5.8%
0.1%
0.0%
-0.2%
-1.3%

32
Policy Costs (∆PV to 2040)(Change in capital, operating, fuel costs plus ERC/allowance trade value)
States with RateStates with Mass (existing units)States with Mass (including new units) RGGI
-1.6%
-6.4%
-5.2%
0.8% 3.4%
4.1%
-2.5%
1.1%
-4.8%
-1.1%
-4.2%
-2.4%
-1.1%
-19.9%
20.0%
-2.9%
1.8%
3.1%
1.2%
1.9%
3.7%
3.0%
1.1%
-1.8%
-4.1%
1.4%
0.4%
0.1%
18.7%
-2.1%
-0.1%
-3.2%
0.1%
0.2%0.1%
-0.1%
0.2%-0.4%
-0.5%
-0.5%
4.0%
7.1%
7.7%
0.1%
0.0% 1.8%
0.0%
1.7%

Sensitivities & Final Thoughts• Natural gas
– Low prices encourage gas at the expense of coal, and also replaces renewables– Reduced demand from energy efficiency comes out of gas generation, not coal– A rate-based policy with low gas prices greatly encourages gas generation– High gas prices have the largest CPP costs, while low prices eliminate most costs
• Electricity demand– Higher than expected electricity demand growth is supplied by gas– High demand makes mass with New Source Complement more expensive
• Renewables and energy efficiency– Low renewable costs make dual rate cheaper but lead to higher emissions– Limited EE makes dual rate more expensive
• Policy Costs (assuming patchwork approach)– Even if policy costs for a region are close to zero, individual states may be
sensitive to variations in gas & renewables costs, or electricity demand– Things will not always move in the direction you expect, depending on what
happens with your neighbors
33

Thank You
34