online appendix - s3.amazonaws.com€¦ · online appendix 1 (de neve and ward, happiness at work)
TRANSCRIPT

ONLINE APPENDIX
1
(DE NEVE AND WARD, HAPPINESS AT WORK)
HTTP://WORLDHAPPINESS.REPORT/

W O R L D H A P P I N E S S R E P O R T 2 0 1 7
2
Table A6.1: Social Comparison Effects of Unemployment
Life Evaluation Positive Affect Negative Affect
(1) (2) (3) (4) (5) (6)
Unemployed -0.234*** -0.274*** -0.101*** -0.132*** 0.209*** 0.251***
(0.007) (0.011) (0.008) (0.011) (0.008) (0.011)
Unemployment Rate -0.074* -0.100** 0.027 0.007 -0.061 -0.033
(0.041) (0.041) (0.034) (0.035) (0.037) (0.038)
Unemployed * Unemployment Rate
0.233*** 0.181*** -0.247***
(0.055) (0.052) (0.051)
Country + Year FEs Yes Yes Yes Yes Yes Yes
Observations 847840 847840 816614 816614 805187 805187
R-squared 0.084 0.084 0.032 0.032 0.032 0.032
Countries 162 162 162 162 162 162
Standard errors in parentheses adjusted for clustering at the country level. Outcome variables are standardized to have mean=0 and SD=1. Further controls: log income, education level, marital status, household composition, gender, age and its square. Sample is 21-60 year olds. p < * 0.1 ** p < 0.05 *** p < 0.01.
3
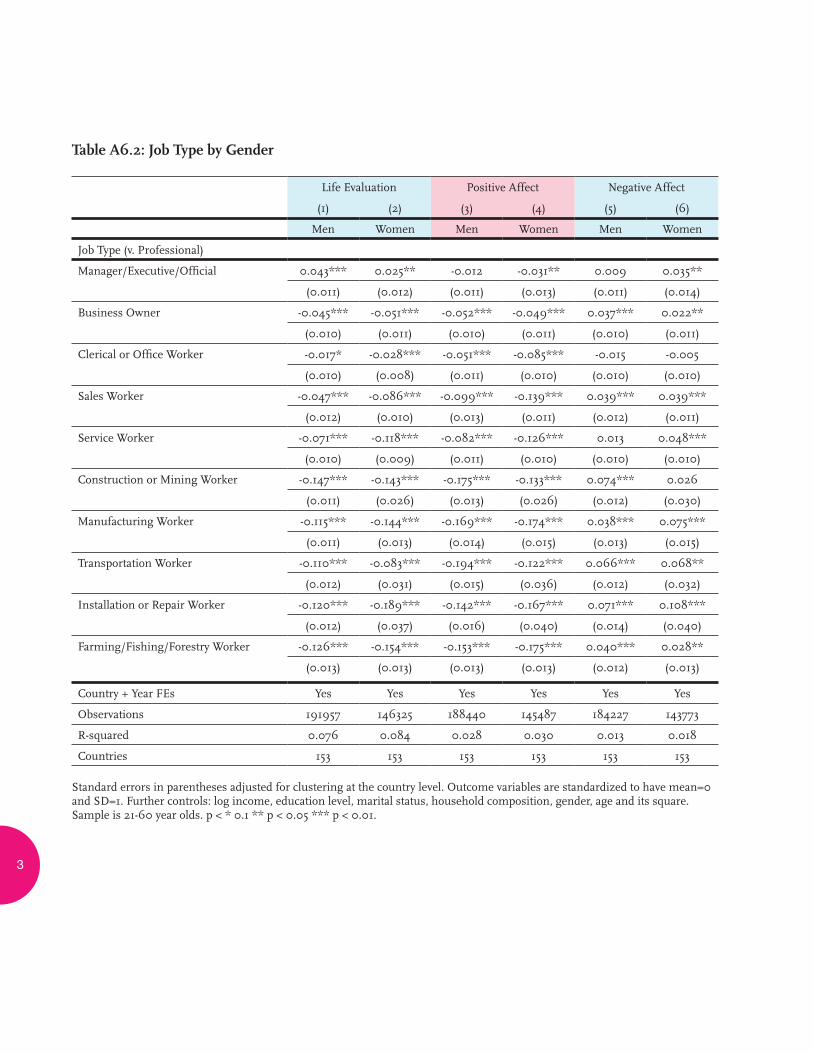
Table A6.2: Job Type by Gender
Life Evaluation Positive Affect Negative Affect
(1) (2) (3) (4) (5) (6)
Men Women Men Women Men Women
Job Type (v. Professional)
Manager/Executive/Official 0.043*** 0.025** -0.012 -0.031** 0.009 0.035**
(0.011) (0.012) (0.011) (0.013) (0.011) (0.014)
Business Owner -0.045*** -0.051*** -0.052*** -0.049*** 0.037*** 0.022**
(0.010) (0.011) (0.010) (0.011) (0.010) (0.011)
Clerical or Office Worker -0.017* -0.028*** -0.051*** -0.085*** -0.015 -0.005
(0.010) (0.008) (0.011) (0.010) (0.010) (0.010)
Sales Worker -0.047*** -0.086*** -0.099*** -0.139*** 0.039*** 0.039***
(0.012) (0.010) (0.013) (0.011) (0.012) (0.011)
Service Worker -0.071*** -0.118*** -0.082*** -0.126*** 0.013 0.048***
(0.010) (0.009) (0.011) (0.010) (0.010) (0.010)
Construction or Mining Worker -0.147*** -0.143*** -0.175*** -0.133*** 0.074*** 0.026
(0.011) (0.026) (0.013) (0.026) (0.012) (0.030)
Manufacturing Worker -0.115*** -0.144*** -0.169*** -0.174*** 0.038*** 0.075***
(0.011) (0.013) (0.014) (0.015) (0.013) (0.015)
Transportation Worker -0.110*** -0.083*** -0.194*** -0.122*** 0.066*** 0.068**
(0.012) (0.031) (0.015) (0.036) (0.012) (0.032)
Installation or Repair Worker -0.120*** -0.189*** -0.142*** -0.167*** 0.071*** 0.108***
(0.012) (0.037) (0.016) (0.040) (0.014) (0.040)
Farming/Fishing/Forestry Worker
-0.126*** -0.154*** -0.153*** -0.175*** 0.040*** 0.028**
(0.013) (0.013) (0.013) (0.013) (0.012) (0.013)
Country + Year FEs Yes Yes Yes Yes Yes Yes
Observations 191957 146325 188440 145487 184227 143773
R-squared 0.076 0.084 0.028 0.030 0.013 0.018
Countries 153 153 153 153 153 153
Standard errors in parentheses adjusted for clustering at the country level. Outcome variables are standardized to have mean=0 and SD=1. Further controls: log income, education level, marital status, household composition, gender, age and its square. Sample is 21-60 year olds. p < * 0.1 ** p < 0.05 *** p < 0.01.

W O R L D H A P P I N E S S R E P O R T 2 0 1 7
4
Table A6.3: Anticipation of and Adaption to Unemployment Spells in Germany
All Men Women (1) (2) (3)
Leads
3-4 Years Hence -0.096*** -0.083** -0.111**
(0.031) (0.041) (0.047)
2-3 Years -0.086*** -0.086** -0.086**
(0.031) (0.043) (0.044)
1-2 Years -0.140*** -0.145*** -0.134***
(0.030) (0.043) (0.044)
Within 1 Year -0.272*** -0.284*** -0.260***
(0.031) (0.043) (0.044)
Lags
Unemployed 0-1 Year -0.910*** -1.116*** -0.712***
(0.037) (0.054) (0.050)
1-2 Years -1.042*** -1.269*** -0.827***
(0.058) (0.087) (0.077)
2-3 Years -0.877*** -0.962*** -0.771***
(0.085) (0.124) (0.115)
3-4 Years -1.087*** -1.333*** -0.859***
(0.110) (0.186) (0.131)
4+ Years
-0.831*** -1.168*** -0.517***
(0.137) (0.229) (0.153)
Further Controls Yes Yes Yes
Individual FEs Yes Yes Yes
Observations 158996 86547 72449
Source: German Social-Economic Panel. Standard errors in parentheses, clustered at the level of the individual. All regressions include controls for age, age2, years of education, marital status, log income, number of children, region and wave dummies. Dependent variable is life satisfaction (0-10 scale). For more information on specification, which follows Clark and Georgelis (2013), please see text.* p < 0.10, ** p < 0.05, *** p < 0.01.

5
Table A6.4i: Job Type and Life Evaluation Around the World
W Europe C+E Europe CIS SE Asia S Asia E Asia LA + Carib NA + ANZ MENA SSA
(1) (2) (3) (4) (5) (6) (7) (8) (9) (10)
Job Type (v. Professional)
Manager/Executive/Official
0.026* 0.100*** 0.096** -0.024 -0.035 0.047 -0.013 0.016 0.068** -0.038
(0.013) (0.024) (0.036) (0.032) (0.066) (0.030) (0.034) (0.025) (0.027) (0.026)
Business Owner -0.005 0.087*** 0.103*** -0.115*** -0.059 -0.051 -0.111*** -0.032 -0.030 -0.096***
(0.017) (0.021) (0.034) (0.028) (0.055) (0.032) (0.022) (0.030) (0.023) (0.016)
Clerical or Office Worker
-0.028** -0.019 0.013 -0.041 -0.013 -0.024 -0.003 -0.071** -0.045** -0.020
(0.013) (0.021) (0.025) (0.033) (0.044) (0.015) (0.023) (0.030) (0.019) (0.019)
Sales Worker -0.072*** -0.120*** -0.036** -0.095*** -0.046 -0.100*** -0.063** -0.093*** -0.054* -0.093***
(0.016) (0.022) (0.015) (0.030) (0.042) (0.023) (0.026) (0.031) (0.030) (0.026)
Service Worker -0.086*** -0.127*** -0.119*** -0.121*** -0.074* -0.116*** -0.085*** -0.118*** -0.090*** -0.119***
(0.013) (0.021) (0.017) (0.028) (0.037) (0.024) (0.027) (0.024) (0.025) (0.016)
Construction or Mining Worker
-0.154*** -0.185*** -0.069*** -0.167*** -0.199*** -0.141*** -0.184*** -0.011 -0.173*** -0.167***
(0.020) (0.032) (0.022) (0.039) (0.052) (0.040) (0.035) (0.029) (0.027) (0.021)
Manufacturing Worker
-0.149*** -0.177*** -0.111*** -0.137*** -0.189*** -0.125*** -0.056** -0.142*** -0.128*** -0.094***
(0.019) (0.025) (0.024) (0.029) (0.057) (0.033) (0.028) (0.038) (0.031) (0.023)
Transportation Worker
-0.132*** -0.143*** -0.072*** -0.125*** -0.104* -0.119* -0.078** -0.167** -0.156*** -0.113***
(0.024) (0.031) (0.021) (0.038) (0.056) (0.063) (0.036) (0.058) (0.036) (0.024)
Installation or Repair Worker
-0.172*** -0.191*** -0.079** -0.135*** -0.043 -0.100* -0.099** -0.088 -0.167*** -0.155***
(0.024) (0.035) (0.030) (0.043) (0.039) (0.050) (0.042) (0.051) (0.032) (0.028)
Farming/Fishing/Forestry Worker
-0.135*** -0.188*** -0.063*** -0.149*** -0.119* -0.118*** -0.192*** 0.034 -0.114*** -0.189***
(0.028) (0.031) (0.019) (0.027) (0.059) (0.022) (0.038) (0.061) (0.036) (0.020)
Country + Year FEs Yes Yes Yes Yes Yes Yes Yes Yes Yes Yes
Observations 52607 31514 28912 22404 24393 22649 34805 8889 48212 63496
R-squared 0.075 0.130 0.086 0.083 0.130 0.145 0.064 0.065 0.080 0.083
Countries 21 17 12 9 7 6 21 4 19 36
Standard errors in parentheses adjusted for clustering at the country level. Outcome variables are standardized to have mean=0 and SD=1. Further controls: log income, education level, marital status, household composition, gender, age and its square. Sample is 21-60 year olds. p < * 0.1 ** p < 0.05 *** p < 0.01.

W O R L D H A P P I N E S S R E P O R T 2 0 1 7
6
Table A6.4ii: Job Type and Positive Affect Around the World
W Europe C+E Europe CIS SE Asia S Asia E Asia LA + Carib NA + ANZ MENA SSA
(1) (2) (3) (4) (5) (6) (7) (8) (9) (10)
Job Type (v. Professional)
Manager/Executive/Official
0.001 -0.012 0.042 -0.074** -0.064 -0.025 -0.052 -0.037 0.004 -0.079***
(0.011) (0.032) (0.028) (0.035) (0.050) (0.038) (0.039) (0.026) (0.029) (0.029)
Business Owner 0.018 -0.030 0.000 -0.145*** -0.048 -0.014 -0.069*** -0.021 -0.060** -0.097***
(0.019) (0.025) (0.041) (0.031) (0.032) (0.019) (0.019) (0.043) (0.024) (0.020)
Clerical or Office Worker
-0.059*** -0.090*** -0.054* -0.070 -0.039 -0.077** -0.045** -0.092*** -0.065** -0.086***
(0.014) (0.026) (0.032) (0.051) (0.039) (0.029) (0.020) (0.027) (0.024) (0.027)
Sales Worker -0.051** -0.233*** -0.164*** -0.216*** -0.136** -0.141*** -0.107*** -0.066* -0.078** -0.109***
(0.020) (0.026) (0.022) (0.048) (0.051) (0.033) (0.023) (0.035) (0.034) (0.025)
Service Worker -0.061*** -0.173*** -0.133*** -0.186*** -0.052 -0.086** -0.094*** -0.061*** -0.104*** -0.139***
(0.013) (0.023) (0.025) (0.041) (0.038) (0.031) (0.021) (0.017) (0.026) (0.024)
Construction or Mining Worker
-0.089*** -0.309*** -0.130*** -0.223*** -0.286*** -0.208*** -0.083*** 0.028 -0.247*** -0.160***
(0.025) (0.034) (0.033) (0.058) (0.044) (0.046) (0.028) (0.038) (0.032) (0.026)
Manufacturing Worker
-0.131*** -0.289*** -0.147*** -0.190*** -0.180*** -0.140*** -0.061** -0.159*** -0.261*** -0.163***
(0.016) (0.028) (0.029) (0.043) (0.048) (0.042) (0.025) (0.036) (0.041) (0.029)
Transportation Worker
-0.090*** -0.288*** -0.154*** -0.287*** -0.212*** -0.236*** -0.123*** -0.079 -0.246*** -0.216***
(0.028) (0.037) (0.033) (0.051) (0.074) (0.076) (0.031) (0.050) (0.039) (0.029)
Installation or Repair Worker
-0.036 -0.236*** -0.216*** -0.204*** -0.129*** -0.177*** -0.060* -0.093 -0.146*** -0.203***
(0.031) (0.041) (0.046) (0.046) (0.046) (0.058) (0.033) (0.089) (0.047) (0.034)
Farming/Fishing/Forestry Worker
-0.093*** -0.233*** -0.216*** -0.219*** -0.151*** -0.093*** -0.079*** 0.051 -0.207*** -0.199***
(0.024) (0.033) (0.027) (0.034) (0.038) (0.028) (0.029) (0.069) (0.032) (0.022)
Country + Year FEs Yes Yes Yes Yes Yes Yes Yes Yes Yes Yes
Observations 52744 31745 29327 22619 24568 22755 35051 8272 43514 62930
R-squared 0.015 0.068 0.052 0.025 0.060 0.030 0.020 0.016 0.037 0.031
Countries 21 17 12 9 7 6 21 4 19 36
Standard errors in parentheses adjusted for clustering at the country level. Outcome variables are standardized to have mean=0 and SD=1. Further controls: log income, education level, marital status, household composition, gender, age and its square. Sample is 21-60 year olds. p < * 0.1 ** p < 0.05 *** p < 0.01.

7
Table A6.4iii: Job Type and Negative Affect Around the World
W Europe C+E Europe CIS SE Asia S Asia E Asia LA + Carib NA + ANZ MENA SSA
(1) (2) (3) (4) (5) (6) (7) (8) (9) (10)
Job Type (v. Professional)
Manager/Executive/Official
0.019* 0.051* -0.022 0.053 0.020 -0.024 0.130*** -0.055 0.001 0.052*
(0.010) (0.026) (0.029) (0.047) (0.046) (0.033) (0.041) (0.039) (0.034) (0.030)
Business Owner 0.051*** 0.063*** 0.064** 0.007 -0.057 0.001 0.065** 0.078 0.086*** 0.045***
(0.016) (0.020) (0.032) (0.035) (0.042) (0.020) (0.026) (0.046) (0.023) (0.016)
Clerical or Office Worker
-0.024* 0.023 -0.027 -0.010 -0.048 -0.070*** 0.044* -0.013 -0.004 0.015
(0.012) (0.020) (0.025) (0.041) (0.052) (0.014) (0.025) (0.033) (0.022) (0.023)
Sales Worker 0.014 0.090*** 0.027 -0.016 0.039 0.018 0.063** 0.077 0.064* 0.055***
(0.018) (0.022) (0.018) (0.038) (0.057) (0.029) (0.029) (0.048) (0.037) (0.018)
Service Worker 0.021 0.052** 0.010 0.018 -0.039 -0.042** 0.068*** 0.038 0.052** 0.094***
(0.013) (0.021) (0.020) (0.033) (0.042) (0.016) (0.026) (0.028) (0.021) (0.018)
Construction or Mining Worker
0.036 0.131*** 0.009 0.046 0.117 -0.012 0.041 0.007 0.162*** 0.075***
(0.025) (0.032) (0.020) (0.040) (0.074) (0.037) (0.031) (0.043) (0.030) (0.024)
Manufacturing Worker
0.029 0.112*** -0.004 0.044 0.033 -0.032 0.042 -0.090** 0.134*** 0.145***
(0.029) (0.024) (0.022) (0.044) (0.052) (0.032) (0.031) (0.041) (0.039) (0.027)
Transportation Worker
-0.014 0.059** -0.006 0.075 0.050 -0.001 0.119*** 0.016 0.206*** 0.099***
(0.030) (0.026) (0.023) (0.049) (0.060) (0.030) (0.035) (0.061) (0.035) (0.021)
Installation or Repair Worker
0.043 0.152*** -0.007 0.036 0.014 0.031 0.073* -0.135 0.123*** 0.158***
(0.028) (0.035) (0.031) (0.058) (0.065) (0.054) (0.040) (0.084) (0.044) (0.028)
Farming/Fishing/Forestry Worker
0.064** 0.118*** 0.022 -0.021 -0.015 -0.030 0.017 -0.082 0.032 0.087***
(0.032) (0.026) (0.020) (0.035) (0.049) (0.025) (0.037) (0.048) (0.043) (0.017)
Country + Year FEs Yes Yes Yes Yes Yes Yes Yes Yes Yes Yes
Observations 52744 31745 29327 22619 24568 22755 35051 8272 39087 61430
R-squared 0.018 0.028 0.022 0.018 0.038 0.024 0.034 0.018 0.022 0.021
Countries 21 17 12 9 7 6 21 4 19 36
Standard errors in parentheses adjusted for clustering at the country level. Outcome variables are standardized to have mean=0 and SD=1. Further controls: log income, education level, marital status, household composition, gender, age and its square. Sample is 21-60 year olds. p < * 0.1 ** p < 0.05 *** p < 0.01.
Table A6.5: Correlation Matrix of Country-Year Averages of SWB Measures
Life Evaluation
Positive Affect
Negative Affect
Job Satisfaction
Engaged Disengaged
Life Evaluation 1
Positive Affect 0.51* 1
Negative Affect -0.17* -0.18* 1
Satisfied with Job 0.73* 0.42* -0.05 1
Actively Engaged with Job 0.09* 0.32* 0.08* 0.30* 1
Actively Disengaged with Job -0.32* -0.47* -0.01 -0.51* -0.51* 1
* p < 0.05

W O R L D H A P P I N E S S R E P O R T 2 0 1 7
8
Table A6.6: Job Satisfaction and Employment Status
W Europe C+E Europe CIS SE Asia S Asia E Asia LA + Carib NA + ANZ MENA SSA
(1) (2) (3) (4) (5) (6) (7) (8) (9) (10)
Employment (v. employed full-time for employer)
Employed Full-Time for Self
0.057*** 0.069 -0.091** 0.100*** 0.106** 0.058 0.005 0.119*** 0.089*** 0.067**
(0.014) (0.070) (0.042) (0.029) (0.038) (0.044) (0.014) (0.034) (0.031) (0.026)
Employed Part-Time (does not want more hours)
0.058*** 0.003 -0.049 0.075* -0.050 -0.063 0.019 0.095** 0.048 0.046
(0.013) (0.038) (0.032) (0.036) (0.038) (0.061) (0.030) (0.036) (0.034) (0.029)
Employed Part-Time (would like more hours)
-0.159*** -0.468*** -0.343*** -0.090 -0.253* -0.071 -0.329*** -0.215*** -0.280*** -0.282***
(0.027) (0.048) (0.052) (0.053) (0.143) (0.047) (0.026) (0.057) (0.048) (0.031)
Out of Labor Force 0.000 0.000 0.000 0.000 0.000 0.000 0.000 0.000 0.000 0.000
Country + Year FEs Yes Yes Yes Yes Yes Yes Yes Yes Yes Yes
Observations 42194 14899 18319 15446 18335 15637 22029 4810 32427 38413
R-squared 0.011 0.052 0.042 0.023 0.068 0.037 0.036 0.020 0.048 0.054
Countries 20 17 12 9 6 6 21 4 18 33
Standard errors in parentheses adjusted for clustering at the country level. Outcome variables are standardized to have mean=0 and SD=1. Further controls: log income, education level, marital status, household composition, gender, age and its square. Sample is 21-60 year olds. p < * 0.1 ** p < 0.05 *** p < 0.01.
Table A6.7: Employee Engagement and Employment Status
W Europe C+E Europe CIS SE Asia S Asia E Asia LA + Carib NA + ANZ MENA SSA
(1) (2) (3) (4) (5) (6) (7) (8) (9) (10)
Employment (v. employed full-time for employer)
Employed Full-Time for Self
0.060 0.077 0.177 0.158 -0.031 0.020 -0.035 0.251 0.067 -0.043
(0.056) (0.101) (0.148) (0.101) (0.133) (0.044) (0.059) (0.193) (0.067) (0.037)
Employed Part-Time (does not want more hours)
0.004 -0.017 0.027 0.022 -0.077* 0.044* -0.007 0.002 0.035 -0.017
(0.012) (0.026) (0.032) (0.055) (0.039) (0.024) (0.038) (0.062) (0.028) (0.026)
Employed Part-Time (would like more hours)
-0.028 -0.098*** -0.021 0.002 -0.042 0.011 -0.046* -0.097** -0.006 -0.045**
(0.017) (0.029) (0.034) (0.034) (0.033) (0.023) (0.023) (0.044) (0.030) (0.021)
Country + Year FEs Yes Yes Yes Yes Yes Yes Yes Yes Yes Yes
Observations 58191 32556 24010 11625 11766 17816 28669 7727 29247 28999
R-squared 0.006 0.023 0.026 0.017 0.026 0.010 0.008 0.011 0.008 0.015
Countries 21 17 12 9 7 6 22 4 18 40
Countries 20 17 12 9 6 6 21 4 18 33
Standard errors in parentheses adjusted for clustering at the country level. Outcome variables are standardized to have mean=0 and SD=1. Further controls: log income, education level, marital status, household composition, gender, age and its square. Sample is 21-60 year olds. p < * 0.1 ** p < 0.05 *** p < 0.01.

9
Table A6.8: Job Satisfaction, Employee Engagement, and Employment Status
Job Satisfaction Employee Engagement
(1) (2) (3) (4) (5) (6)
All Men Women All Men Women
Employment (v. employed full-time for employer)
Employed Full-Time for Self 0.057*** 0.061*** 0.051*** 0.031 0.015 0.047
(0.011) (0.012) (0.013) (0.024) (0.028) (0.037)
Employed Part-Time (does not want more hours)
0.032*** 0.021 0.035*** 0.018* 0.003 0.014
(0.011) (0.015) (0.012) (0.009) (0.015) (0.011)
Employed Part-Time (would like more hours)
-0.254*** -0.291*** -0.217*** -0.033*** -0.028** -0.042***
(0.018) (0.022) (0.019) (0.009) (0.012) (0.011)
Country + Year FEs Yes Yes Yes Yes Yes Yes
Observations 222509 125047 97462 251107 139111 111996
R-squared 0.034 0.040 0.028 0.006 0.007 0.006
Countries 146 146 146 158 158 158
Standard errors in parentheses adjusted for clustering at the country level. Outcome variables are standardized to have mean=0 and SD=1. Further controls: log income, education level, marital status, household composition, gender, age and its square. Sample is 21-60 year olds. p < * 0.1 ** p < 0.05 *** p < 0.01.
W O R L D H A P P I N E S S R E P O R T 2 0 1 7
10
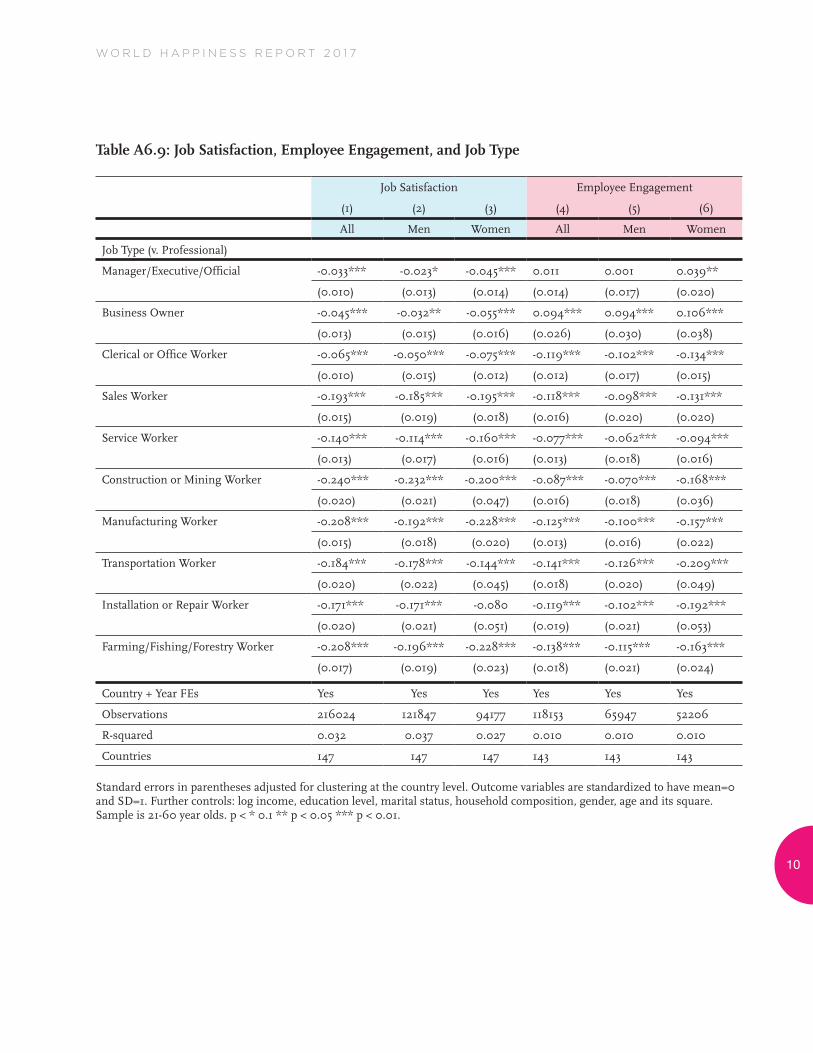
Table A6.9: Job Satisfaction, Employee Engagement, and Job Type
Job Satisfaction Employee Engagement
(1) (2) (3) (4) (5) (6)
All Men Women All Men Women
Job Type (v. Professional)
Manager/Executive/Official -0.033*** -0.023* -0.045*** 0.011 0.001 0.039**
(0.010) (0.013) (0.014) (0.014) (0.017) (0.020)
Business Owner -0.045*** -0.032** -0.055*** 0.094*** 0.094*** 0.106***
(0.013) (0.015) (0.016) (0.026) (0.030) (0.038)
Clerical or Office Worker -0.065*** -0.050*** -0.075*** -0.119*** -0.102*** -0.134***
(0.010) (0.015) (0.012) (0.012) (0.017) (0.015)
Sales Worker -0.193*** -0.185*** -0.195*** -0.118*** -0.098*** -0.131***
(0.015) (0.019) (0.018) (0.016) (0.020) (0.020)
Service Worker -0.140*** -0.114*** -0.160*** -0.077*** -0.062*** -0.094***
(0.013) (0.017) (0.016) (0.013) (0.018) (0.016)
Construction or Mining Worker -0.240*** -0.232*** -0.200*** -0.087*** -0.070*** -0.168***
(0.020) (0.021) (0.047) (0.016) (0.018) (0.036)
Manufacturing Worker -0.208*** -0.192*** -0.228*** -0.125*** -0.100*** -0.157***
(0.015) (0.018) (0.020) (0.013) (0.016) (0.022)
Transportation Worker -0.184*** -0.178*** -0.144*** -0.141*** -0.126*** -0.209***
(0.020) (0.022) (0.045) (0.018) (0.020) (0.049)
Installation or Repair Worker -0.171*** -0.171*** -0.080 -0.119*** -0.102*** -0.192***
(0.020) (0.021) (0.051) (0.019) (0.021) (0.053)
Farming/Fishing/Forestry Worker
-0.208*** -0.196*** -0.228*** -0.138*** -0.115*** -0.163***
(0.017) (0.019) (0.023) (0.018) (0.021) (0.024)
Country + Year FEs Yes Yes Yes Yes Yes Yes
Observations 216024 121847 94177 118153 65947 52206
R-squared 0.032 0.037 0.027 0.010 0.010 0.010
Countries 147 147 147 143 143 143
Standard errors in parentheses adjusted for clustering at the country level. Outcome variables are standardized to have mean=0 and SD=1. Further controls: log income, education level, marital status, household composition, gender, age and its square. Sample is 21-60 year olds. p < * 0.1 ** p < 0.05 *** p < 0.01.
11
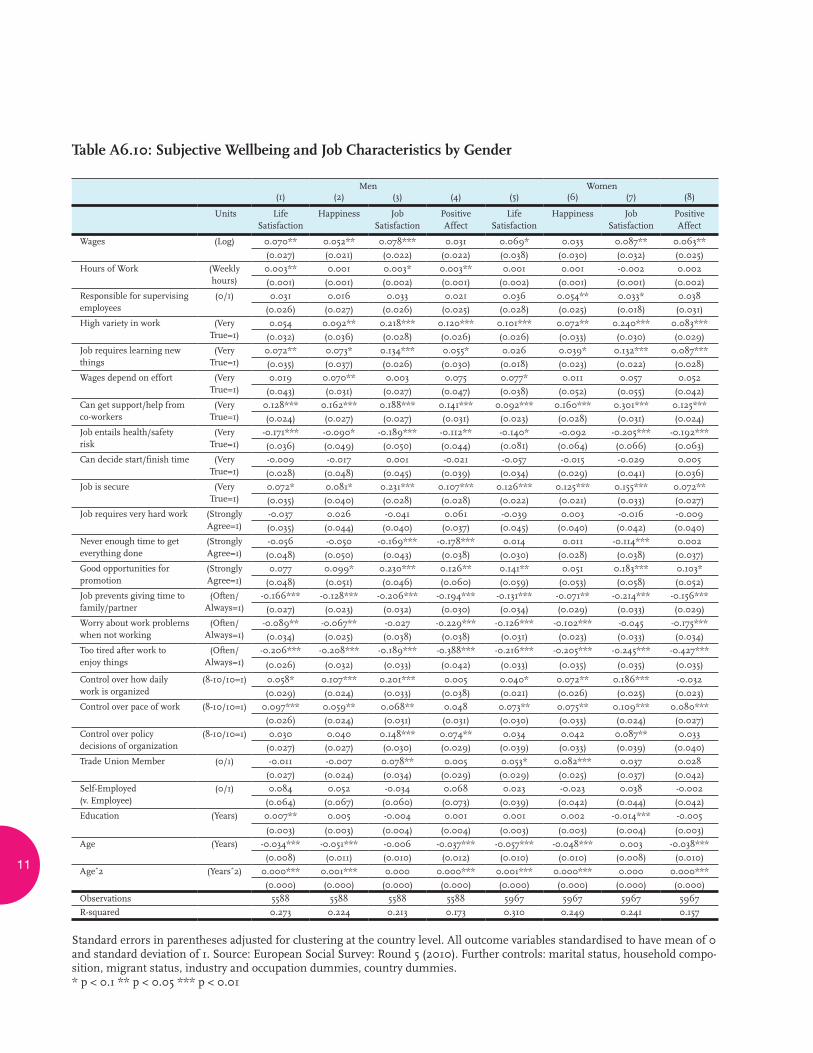
Table A6.10: Subjective Wellbeing and Job Characteristics by Gender
Men Women(1) (2) (3) (4) (5) (6) (7) (8)
Units Life Satisfaction
Happiness Job Satisfaction
Positive Affect
Life Satisfaction
Happiness Job Satisfaction
Positive Affect
Wages (Log) 0.070** 0.052** 0.078*** 0.031 0.069* 0.033 0.087** 0.063**
(0.027) (0.021) (0.022) (0.022) (0.038) (0.030) (0.032) (0.025)
Hours of Work (Weekly hours)
0.003** 0.001 0.003* 0.003** 0.001 0.001 -0.002 0.002
(0.001) (0.001) (0.002) (0.001) (0.002) (0.001) (0.001) (0.002)
Responsible for supervising employees
(0/1) 0.031 0.016 0.033 0.021 0.036 0.054** 0.033* 0.038
(0.026) (0.027) (0.026) (0.025) (0.028) (0.025) (0.018) (0.031)
High variety in work (Very True=1)
0.054 0.092** 0.218*** 0.120*** 0.101*** 0.072** 0.240*** 0.083***
(0.032) (0.036) (0.028) (0.026) (0.026) (0.033) (0.030) (0.029)
Job requires learning new things
(Very True=1)
0.072** 0.073* 0.134*** 0.055* 0.026 0.039* 0.132*** 0.087***
(0.035) (0.037) (0.026) (0.030) (0.018) (0.023) (0.022) (0.028)
Wages depend on effort (Very True=1)
0.019 0.070** 0.003 0.075 0.077* 0.011 0.057 0.052
(0.043) (0.031) (0.027) (0.047) (0.038) (0.052) (0.055) (0.042)
Can get support/help from co-workers
(Very True=1)
0.128*** 0.162*** 0.188*** 0.141*** 0.092*** 0.160*** 0.301*** 0.125***
(0.024) (0.027) (0.027) (0.031) (0.023) (0.028) (0.031) (0.024)
Job entails health/safety risk
(Very True=1)
-0.171*** -0.090* -0.189*** -0.112** -0.140* -0.092 -0.205*** -0.192***
(0.036) (0.049) (0.050) (0.044) (0.081) (0.064) (0.066) (0.063)
Can decide start/finish time (Very True=1)
-0.009 -0.017 0.001 -0.021 -0.057 -0.015 -0.029 0.005
(0.028) (0.048) (0.045) (0.039) (0.034) (0.029) (0.041) (0.036)
Job is secure (Very True=1)
0.072* 0.081* 0.231*** 0.107*** 0.126*** 0.125*** 0.155*** 0.072**
(0.035) (0.040) (0.028) (0.028) (0.022) (0.021) (0.033) (0.027)
Job requires very hard work (Strongly Agree=1)
-0.037 0.026 -0.041 0.061 -0.039 0.003 -0.016 -0.009
(0.035) (0.044) (0.040) (0.037) (0.045) (0.040) (0.042) (0.040)
Never enough time to get everything done
(Strongly Agree=1)
-0.056 -0.050 -0.169*** -0.178*** 0.014 0.011 -0.114*** 0.002
(0.048) (0.050) (0.043) (0.038) (0.030) (0.028) (0.038) (0.037)
Good opportunities for promotion
(Strongly Agree=1)
0.077 0.099* 0.230*** 0.126** 0.141** 0.051 0.183*** 0.103*
(0.048) (0.051) (0.046) (0.060) (0.059) (0.053) (0.058) (0.052)
Job prevents giving time to family/partner
(Often/Always=1)
-0.166*** -0.128*** -0.206*** -0.194*** -0.131*** -0.071** -0.214*** -0.156***
(0.027) (0.023) (0.032) (0.030) (0.034) (0.029) (0.033) (0.029)
Worry about work problems when not working
(Often/Always=1)
-0.089** -0.067** -0.027 -0.229*** -0.126*** -0.102*** -0.045 -0.175***
(0.034) (0.025) (0.038) (0.038) (0.031) (0.023) (0.033) (0.034)
Too tired after work to enjoy things
(Often/Always=1)
-0.206*** -0.208*** -0.189*** -0.388*** -0.216*** -0.205*** -0.245*** -0.427***
(0.026) (0.032) (0.033) (0.042) (0.033) (0.035) (0.035) (0.035)
Control over how daily work is organized
(8-10/10=1) 0.058* 0.107*** 0.201*** 0.005 0.040* 0.072** 0.186*** -0.032
(0.029) (0.024) (0.033) (0.038) (0.021) (0.026) (0.025) (0.023)
Control over pace of work (8-10/10=1) 0.097*** 0.059** 0.068** 0.048 0.073** 0.075** 0.109*** 0.080***
(0.026) (0.024) (0.031) (0.031) (0.030) (0.033) (0.024) (0.027)
Control over policy decisions of organization
(8-10/10=1) 0.030 0.040 0.148*** 0.074** 0.034 0.042 0.087** 0.033
(0.027) (0.027) (0.030) (0.029) (0.039) (0.033) (0.039) (0.040)
Trade Union Member (0/1) -0.011 -0.007 0.078** 0.005 0.053* 0.082*** 0.037 0.028
(0.027) (0.024) (0.034) (0.029) (0.029) (0.025) (0.037) (0.042)
Self-Employed (v. Employee)
(0/1) 0.084 0.052 -0.034 0.068 0.023 -0.023 0.038 -0.002
(0.064) (0.067) (0.060) (0.073) (0.039) (0.042) (0.044) (0.042)
Education (Years) 0.007** 0.005 -0.004 0.001 0.001 0.002 -0.014*** -0.005
(0.003) (0.003) (0.004) (0.004) (0.003) (0.003) (0.004) (0.003)
Age (Years) -0.034*** -0.051*** -0.006 -0.037*** -0.057*** -0.048*** 0.003 -0.038***
(0.008) (0.011) (0.010) (0.012) (0.010) (0.010) (0.008) (0.010)
Age^2 (Years^2) 0.000*** 0.001*** 0.000 0.000*** 0.001*** 0.000*** 0.000 0.000***
(0.000) (0.000) (0.000) (0.000) (0.000) (0.000) (0.000) (0.000)
Observations 5588 5588 5588 5588 5967 5967 5967 5967
R-squared 0.273 0.224 0.213 0.173 0.310 0.249 0.241 0.157
Standard errors in parentheses adjusted for clustering at the country level. All outcome variables standardised to have mean of 0 and standard deviation of 1. Source: European Social Survey: Round 5 (2010). Further controls: marital status, household compo-sition, migrant status, industry and occupation dummies, country dummies. * p < 0.1 ** p < 0.05 *** p < 0.01
W O R L D H A P P I N E S S R E P O R T 2 0 1 7
12
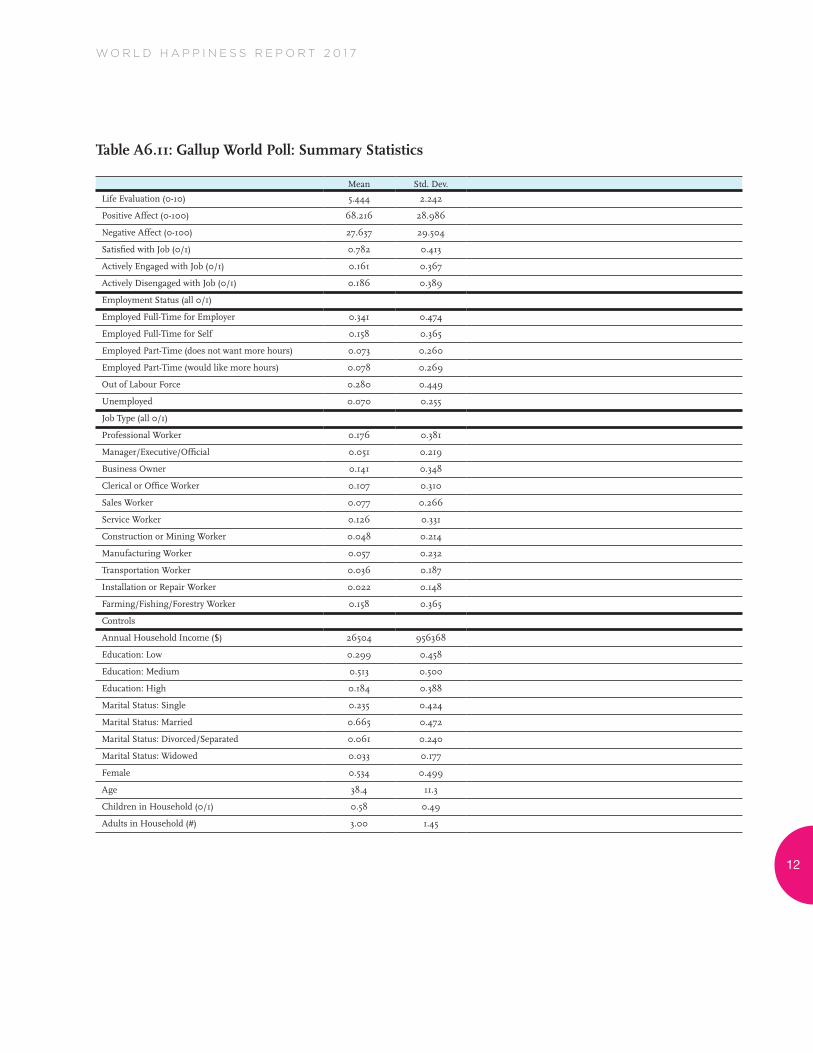
Table A6.11: Gallup World Poll: Summary Statistics
Mean Std. Dev.
Life Evaluation (0-10) 5.444 2.242
Positive Affect (0-100) 68.216 28.986
Negative Affect (0-100) 27.637 29.504
Satisfied with Job (0/1) 0.782 0.413
Actively Engaged with Job (0/1) 0.161 0.367
Actively Disengaged with Job (0/1) 0.186 0.389
Employment Status (all 0/1)
Employed Full-Time for Employer 0.341 0.474
Employed Full-Time for Self 0.158 0.365
Employed Part-Time (does not want more hours) 0.073 0.260
Employed Part-Time (would like more hours) 0.078 0.269
Out of Labour Force 0.280 0.449
Unemployed 0.070 0.255
Job Type (all 0/1)
Professional Worker 0.176 0.381
Manager/Executive/Official 0.051 0.219
Business Owner 0.141 0.348
Clerical or Office Worker 0.107 0.310
Sales Worker 0.077 0.266
Service Worker 0.126 0.331
Construction or Mining Worker 0.048 0.214
Manufacturing Worker 0.057 0.232
Transportation Worker 0.036 0.187
Installation or Repair Worker 0.022 0.148
Farming/Fishing/Forestry Worker 0.158 0.365
Controls
Annual Household Income ($) 26504 956368
Education: Low 0.299 0.458
Education: Medium 0.513 0.500
Education: High 0.184 0.388
Marital Status: Single 0.235 0.424
Marital Status: Married 0.665 0.472
Marital Status: Divorced/Separated 0.061 0.240
Marital Status: Widowed 0.033 0.177
Female 0.534 0.499
Age 38.4 11.3
Children in Household (0/1) 0.58 0.49
Adults in Household (#) 3.00 1.45

13
Table A6.13: Job Satisfaction Around the World
Country % Satisfied with Job
Lower 95% CI
Upper 95% CI
1 Austria 95.1 94.2 96.0
2 Norway 94.6 93.4 95.9
3 Iceland 94.5 92.5 96.6
4 Netherlands 93.8 92.8 94.8
5 Switzerland 93.7 92.3 95.1
6 Thailand 93.7 92.9 94.5
7 Denmark 93.5 92.5 94.4
8 Luxembourg 93.4 91.9 94.9
9 Sweden 92.7 91.7 93.7
10 Turkmenistan 91.7 90.3 93.2
11 Ireland 91.5 90.2 92.8
12 Finland 91.2 89.9 92.6
13 Belgium 91.1 89.8 92.5
14 Laos 90.7 89.3 92.1
15 Canada 90.5 89.4 91.7
16 Germany 90.4 89.8 91.0
17 Venezuela 90.1 88.8 91.4
18 Singapore 90.0 88.9 91.0
19 Costa Rica 89.9 88.7 91.2
20 Australia 89.2 87.9 90.5
21 Cyprus 88.7 86.9 90.4
22 New Zealand 88.6 87.2 90.0
23 Slovenia 88.5 86.8 90.3
24 Portugal 88.4 86.9 90.0
25 Panama 88.3 86.9 89.7
26 Spain 88.1 86.8 89.4
27 Guatemala 88.1 86.7 89.5
28 Qatar 87.8 86.4 89.2
29 Oman 87.7 85.0 90.4
30 Kuwait 87.4 86.3 88.5
31 United Kingdom 87.4 86.7 88.1
32 United Arab Emirates 87.1 86.0 88.3
33 Uzbekistan 87.0 85.6 88.5
34 Poland 86.9 85.2 88.7
35 France 86.0 84.5 87.5
36 Mauritius 86.0 82.3 89.6
37 Puerto Rico 85.7 79.2 92.3
38 Saudi Arabia 85.7 84.6 86.8
39 Brazil 85.6 84.3 86.9
40 Italy 85.5 83.9 87.1
41 Namibia 85.4 80.9 89.8
42 United States 85.3 83.7 87.0
43 Malta 85.2 82.8 87.6
Country % Satisfied with Job
Lower 95% CI
Upper 95% CI
44 Malaysia 85.0 83.6 86.5
45 Nepal 84.9 83.3 86.4
46 Kosovo 84.7 82.6 86.9
47 Bolivia 84.7 83.3 86.2
48 Paraguay 84.5 82.9 86.1
49 Sri Lanka 84.4 82.7 86.2
50 Belize 84.1 79.0 89.2
51 Guyana 84.1 78.7 89.5
52 Suriname 84.1 79.2 88.9
53 Czech Republic 83.1 81.6 84.7
54 Honduras 83.1 81.4 84.8
55 Ecuador 83.0 81.3 84.6
56 Colombia 82.7 81.1 84.4
57 Mexico 82.4 80.7 84.2
58 Hungary 82.4 80.4 84.3
59 Nicaragua 82.3 80.6 84.0
60 Argentina 82.2 80.6 83.8
61 Mongolia 82.2 80.3 84.0
62 Trinidad and Tobago 82.1 78.8 85.4
63 Latvia 82.1 80.4 83.7
64 Israel 82.1 80.7 83.4
65 Uruguay 82.0 80.4 83.6
66 Djibouti 81.9 79.6 84.2
67 Hong Kong 81.5 79.5 83.6
68 Philippines 81.4 79.8 83.0
69 Slovakia 81.4 79.5 83.4
70 Tajikistan 81.3 79.3 83.4
71 El Salvador 80.9 79.0 82.7
72 Jordan 80.7 79.1 82.2
73 Vietnam 80.0 78.7 81.4
74 Afghanistan 80.0 78.0 82.0
75 Bahrain 79.9 78.2 81.7
76 Somaliland 79.9 78.1 81.7
77 Chile 79.8 78.0 81.6
78 Kazakhstan 79.5 77.8 81.1
79 Lithuania 79.4 77.7 81.1
80 Greece 79.2 77.4 81.1
81 Cambodia 78.9 77.3 80.5
82 Pakistan 78.1 76.6 79.6
83 Jamaica 78.1 74.0 82.1
84 Estonia 77.8 76.1 79.5
85 Bangladesh 77.7 76.1 79.3
86 Peru 77.4 75.6 79.2
W O R L D H A P P I N E S S R E P O R T 2 0 1 7
14
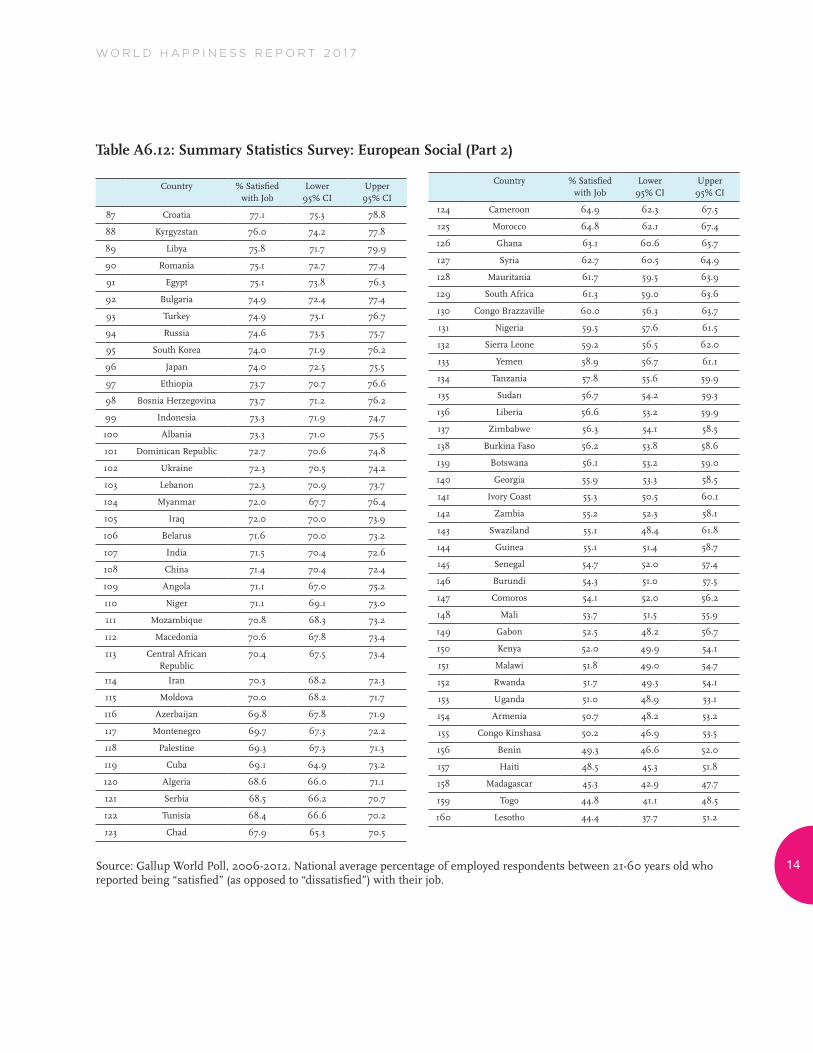
Table A6.12: Summary Statistics Survey: European Social (Part 2)
Country % Satisfied with Job
Lower 95% CI
Upper 95% CI
87 Croatia 77.1 75.3 78.8
88 Kyrgyzstan 76.0 74.2 77.8
89 Libya 75.8 71.7 79.9
90 Romania 75.1 72.7 77.4
91 Egypt 75.1 73.8 76.3
92 Bulgaria 74.9 72.4 77.4
93 Turkey 74.9 73.1 76.7
94 Russia 74.6 73.5 75.7
95 South Korea 74.0 71.9 76.2
96 Japan 74.0 72.5 75.5
97 Ethiopia 73.7 70.7 76.6
98 Bosnia Herzegovina 73.7 71.2 76.2
99 Indonesia 73.3 71.9 74.7
100 Albania 73.3 71.0 75.5
101 Dominican Republic 72.7 70.6 74.8
102 Ukraine 72.3 70.5 74.2
103 Lebanon 72.3 70.9 73.7
104 Myanmar 72.0 67.7 76.4
105 Iraq 72.0 70.0 73.9
106 Belarus 71.6 70.0 73.2
107 India 71.5 70.4 72.6
108 China 71.4 70.4 72.4
109 Angola 71.1 67.0 75.2
110 Niger 71.1 69.1 73.0
111 Mozambique 70.8 68.3 73.2
112 Macedonia 70.6 67.8 73.4
113 Central African Republic
70.4 67.5 73.4
114 Iran 70.3 68.2 72.3
115 Moldova 70.0 68.2 71.7
116 Azerbaijan 69.8 67.8 71.9
117 Montenegro 69.7 67.3 72.2
118 Palestine 69.3 67.3 71.3
119 Cuba 69.1 64.9 73.2
120 Algeria 68.6 66.0 71.1
121 Serbia 68.5 66.2 70.7
122 Tunisia 68.4 66.6 70.2
123 Chad 67.9 65.3 70.5
Country % Satisfied with Job
Lower 95% CI
Upper 95% CI
124 Cameroon 64.9 62.3 67.5
125 Morocco 64.8 62.1 67.4
126 Ghana 63.1 60.6 65.7
127 Syria 62.7 60.5 64.9
128 Mauritania 61.7 59.5 63.9
129 South Africa 61.3 59.0 63.6
130 Congo Brazzaville 60.0 56.3 63.7
131 Nigeria 59.5 57.6 61.5
132 Sierra Leone 59.2 56.5 62.0
133 Yemen 58.9 56.7 61.1
134 Tanzania 57.8 55.6 59.9
135 Sudan 56.7 54.2 59.3
136 Liberia 56.6 53.2 59.9
137 Zimbabwe 56.3 54.1 58.5
138 Burkina Faso 56.2 53.8 58.6
139 Botswana 56.1 53.2 59.0
140 Georgia 55.9 53.3 58.5
141 Ivory Coast 55.3 50.5 60.1
142 Zambia 55.2 52.3 58.1
143 Swaziland 55.1 48.4 61.8
144 Guinea 55.1 51.4 58.7
145 Senegal 54.7 52.0 57.4
146 Burundi 54.3 51.0 57.5
147 Comoros 54.1 52.0 56.2
148 Mali 53.7 51.5 55.9
149 Gabon 52.5 48.2 56.7
150 Kenya 52.0 49.9 54.1
151 Malawi 51.8 49.0 54.7
152 Rwanda 51.7 49.3 54.1
153 Uganda 51.0 48.9 53.1
154 Armenia 50.7 48.2 53.2
155 Congo Kinshasa 50.2 46.9 53.5
156 Benin 49.3 46.6 52.0
157 Haiti 48.5 45.3 51.8
158 Madagascar 45.3 42.9 47.7
159 Togo 44.8 41.1 48.5
160 Lesotho 44.4 37.7 51.2
Source: Gallup World Poll, 2006-2012. National average percentage of employed respondents between 21-60 years old who reported being “satisfied” (as opposed to “dissatisfied”) with their job.
15
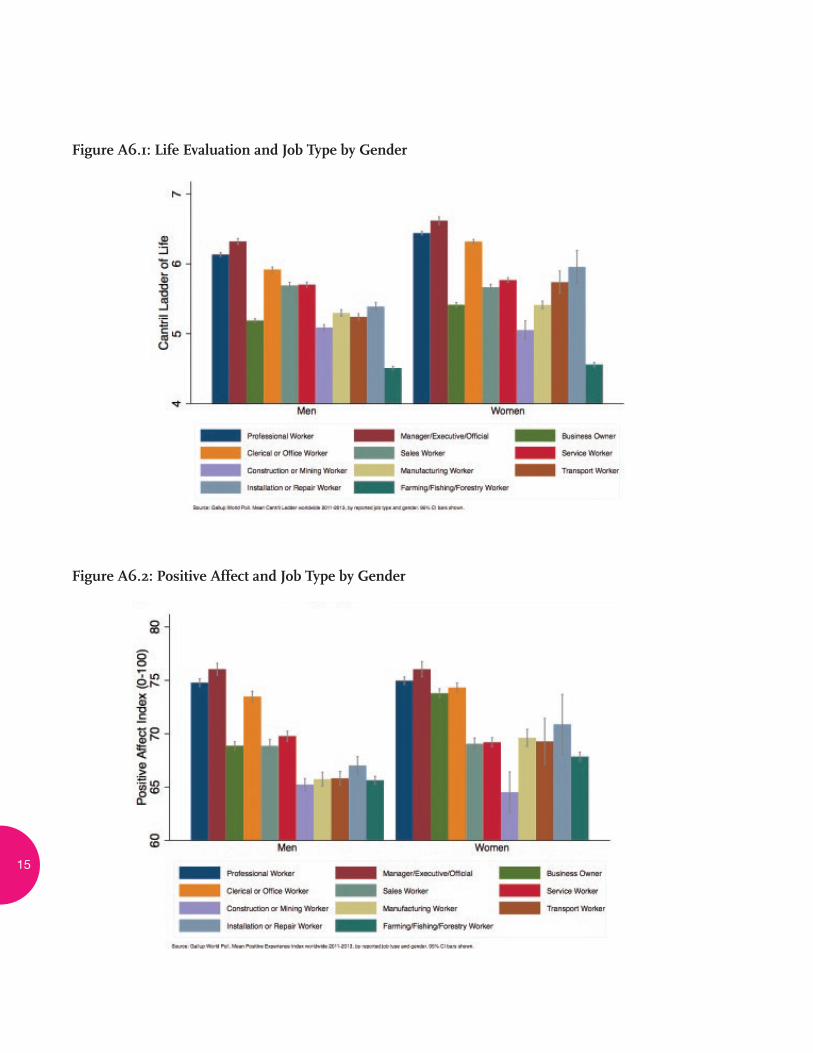
Figure A6.1: Life Evaluation and Job Type by Gender
Figure A6.2: Positive Affect and Job Type by Gender

W O R L D H A P P I N E S S R E P O R T 2 0 1 7
16
Figure A6.3: Negative Affect and Job Type by Gender
Figure A6.4: Job Satisfaction and Job Type by Gender

17
Figure A6.5: Employee Engagement and Job Type by Gender
Figure A6.6: Positive Affect and Job Type by Region
W O R L D H A P P I N E S S R E P O R T 2 0 1 7
18
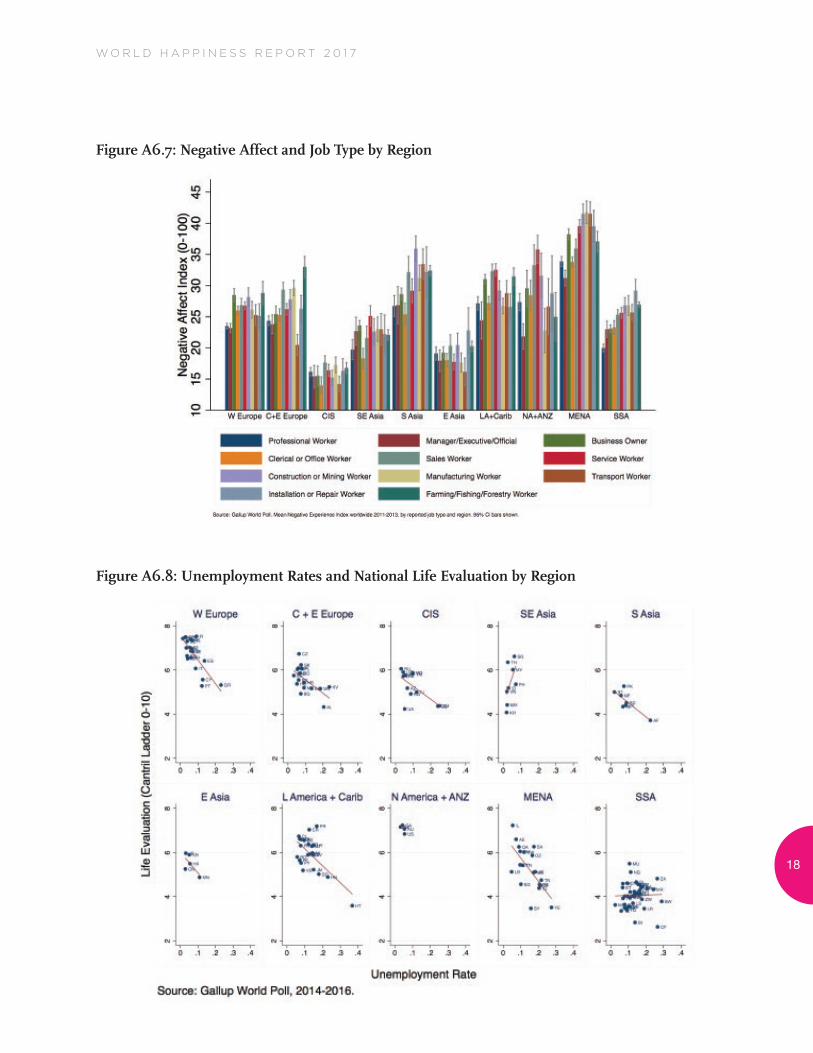
Figure A6.7: Negative Affect and Job Type by Region
Figure A6.8: Unemployment Rates and National Life Evaluation by Region