online assessment research - nap - home
TRANSCRIPT

2014
NATIONAL ASSESSMENT PROGRAM – LITERACY AND NUMERACY
Online Assessment Research
Development Study 2014: Student Motivation

Online Assessment Research Development Study 2014: Student Motivation
Project management ACARA’s online research program is directed by Dr Goran Lazendic. The National Assessment and Surveys Online Program is managed by Julie-Anne Justus, John Skehan, Dominik Swierk, Justine Tyrrell and Rosemary Vo. Item and test development is managed by Anna Cohen (reading), Stephen Phillip (numeracy) and Ross Bindon (conventions of language).
Report author(s) Lifelong Achievement Group (www.lifelongachievement.com) and Dr Andrew J. Martin, working with ACARA staff (Dr Goran Lazendic and Melissa McGilvray), developed the report entitled Online NAPLAN Testing and Student Motivation: Exploring Adaptive and Fixed Test Formats.
National Assessment and Surveys Online Program The National Assessment and Surveys Online Program, funded by the Australian Government, is designed to deliver national assessments and surveys online. ACARA is responsible for planning and implementing a clearly defined assessment and reporting research agenda that will allow reporting to the Education Council on issues and options for delivering NAPLAN online. A key aspect of the program is ACARA’s expanded assessment and reporting research agenda, incorporating a comprehensive investigation into assessment instruments and programs using online technology.
Acknowledgements © Australian Curriculum, Assessment and Reporting Authority 2015 This work is copyright. You may download, display, print and reproduce this material in unaltered form only (retaining this notice) for your personal, non-commercial use or use within your organisation.
All other rights are reserved. Requests and inquiries concerning reproduction and rights should be addressed to: ACARA Copyright Administration, ACARA Level 10, 255 Pitt Street Sydney, NSW 2000 Email: [email protected]
The appropriate citation for this report is: Lifelong Achievement Group & Martin, A.J. Online NAPLAN Testing and Student
Motivation: Exploring Adaptive and Fixed Test Formats. Sydney: Lifelong Achievement Group, July 2015. Prepared for the Australian Curriculum, Assessment and Reporting Authority.

Online NAPLAN and Student Motivation
© 2015 1
ONLINE NAPLAN TESTING AND STUDENT MOTIVATION: EXPLORING ADAPTIVE AND FIXED TEST FORMATS
FINAL REPORT
to
AUSTRALIAN CURRICULUM, ASSESSMENT AND REPORTING AUTHORITY (ACARA)
July 2015
Lifelong Achievement Group
with Dr Andrew J. Martin

Online NAPLAN and Student Motivation
© 2015 2
Project Online NAPLAN Testing and Student Motivation: Exploring Adaptive and Fixed Test Formats Client Australian Curriculum, Assessment and Reporting Authority (ACARA) Date July, 2015 Contact Lifelong Achievement Group PO Box 380, Summer Hill, NSW 2130, Australia Tel: 0423 147 806 (International: +61 423 147 806) Fax: (02) 9554 7445 (International: +612 9554 7445) Web: www.lifelongachievement.com Email: [email protected]
Online NAPLAN and Student Motivation
© 2015 3
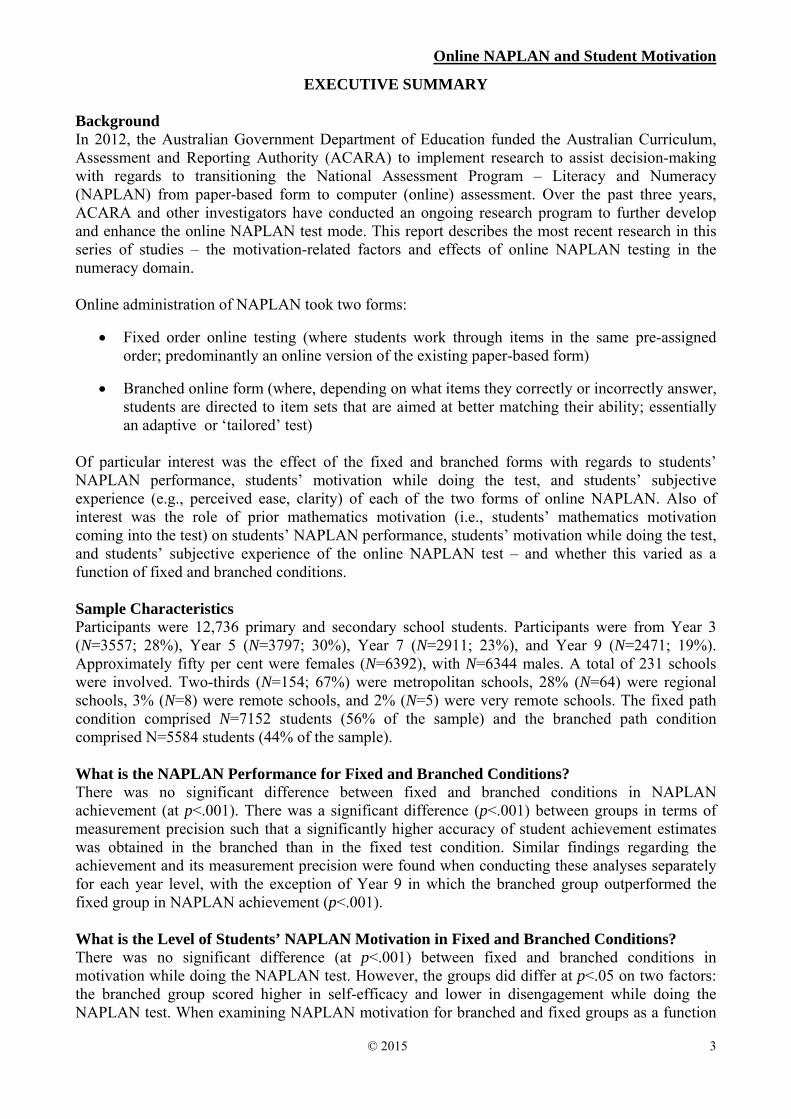
EXECUTIVE SUMMARY Background In 2012, the Australian Government Department of Education funded the Australian Curriculum, Assessment and Reporting Authority (ACARA) to implement research to assist decision-making with regards to transitioning the National Assessment Program – Literacy and Numeracy (NAPLAN) from paper-based form to computer (online) assessment. Over the past three years, ACARA and other investigators have conducted an ongoing research program to further develop and enhance the online NAPLAN test mode. This report describes the most recent research in this series of studies – the motivation-related factors and effects of online NAPLAN testing in the numeracy domain. Online administration of NAPLAN took two forms:
Fixed order online testing (where students work through items in the same pre-assigned order; predominantly an online version of the existing paper-based form)
Branched online form (where, depending on what items they correctly or incorrectly answer, students are directed to item sets that are aimed at better matching their ability; essentially an adaptive or ‘tailored’ test)
Of particular interest was the effect of the fixed and branched forms with regards to students’ NAPLAN performance, students’ motivation while doing the test, and students’ subjective experience (e.g., perceived ease, clarity) of each of the two forms of online NAPLAN. Also of interest was the role of prior mathematics motivation (i.e., students’ mathematics motivation coming into the test) on students’ NAPLAN performance, students’ motivation while doing the test, and students’ subjective experience of the online NAPLAN test – and whether this varied as a function of fixed and branched conditions. Sample Characteristics Participants were 12,736 primary and secondary school students. Participants were from Year 3 (N=3557; 28%), Year 5 (N=3797; 30%), Year 7 (N=2911; 23%), and Year 9 (N=2471; 19%). Approximately fifty per cent were females (N=6392), with N=6344 males. A total of 231 schools were involved. Two-thirds (N=154; 67%) were metropolitan schools, 28% (N=64) were regional schools, 3% (N=8) were remote schools, and 2% (N=5) were very remote schools. The fixed path condition comprised N=7152 students (56% of the sample) and the branched path condition comprised N=5584 students (44% of the sample). What is the NAPLAN Performance for Fixed and Branched Conditions? There was no significant difference between fixed and branched conditions in NAPLAN achievement (at p<.001). There was a significant difference (p<.001) between groups in terms of measurement precision such that a significantly higher accuracy of student achievement estimates was obtained in the branched than in the fixed test condition. Similar findings regarding the achievement and its measurement precision were found when conducting these analyses separately for each year level, with the exception of Year 9 in which the branched group outperformed the fixed group in NAPLAN achievement (p<.001). What is the Level of Students’ NAPLAN Motivation in Fixed and Branched Conditions? There was no significant difference (at p<.001) between fixed and branched conditions in motivation while doing the NAPLAN test. However, the groups did differ at p<.05 on two factors: the branched group scored higher in self-efficacy and lower in disengagement while doing the NAPLAN test. When examining NAPLAN motivation for branched and fixed groups as a function
Online NAPLAN and Student Motivation
© 2015 4
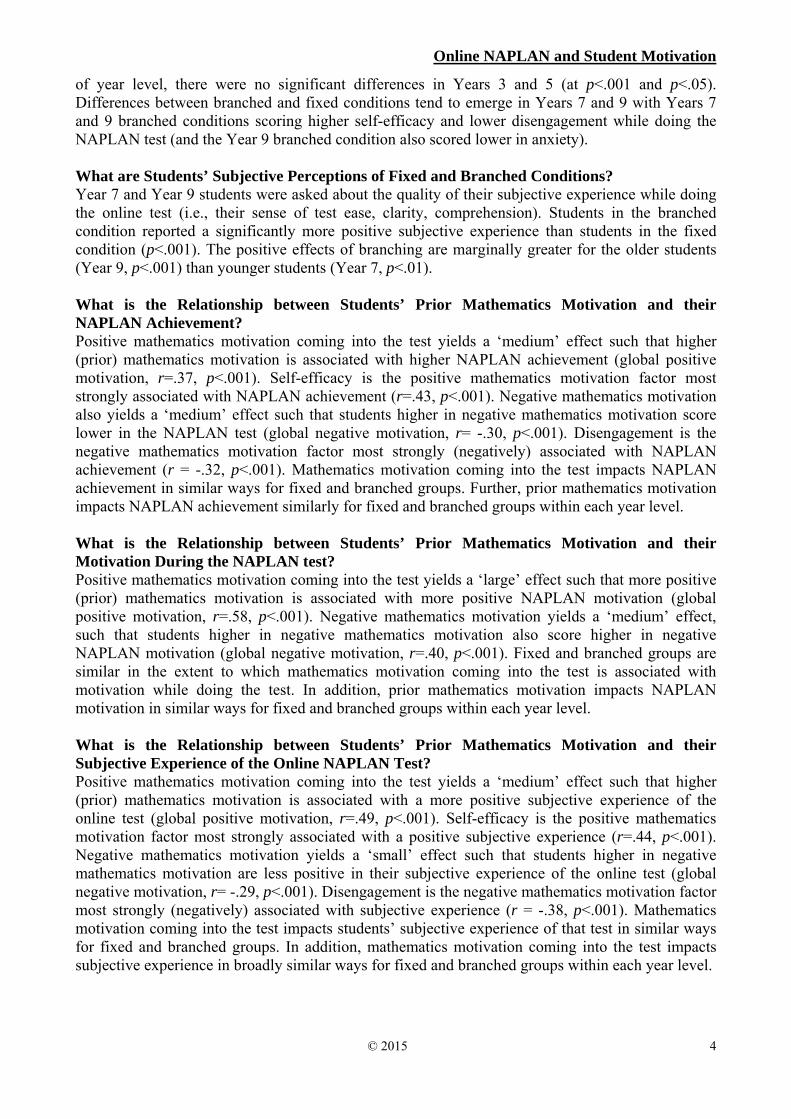
of year level, there were no significant differences in Years 3 and 5 (at p<.001 and p<.05). Differences between branched and fixed conditions tend to emerge in Years 7 and 9 with Years 7 and 9 branched conditions scoring higher self-efficacy and lower disengagement while doing the NAPLAN test (and the Year 9 branched condition also scored lower in anxiety). What are Students’ Subjective Perceptions of Fixed and Branched Conditions? Year 7 and Year 9 students were asked about the quality of their subjective experience while doing the online test (i.e., their sense of test ease, clarity, comprehension). Students in the branched condition reported a significantly more positive subjective experience than students in the fixed condition (p<.001). The positive effects of branching are marginally greater for the older students (Year 9, p<.001) than younger students (Year 7, p<.01). What is the Relationship between Students’ Prior Mathematics Motivation and their NAPLAN Achievement? Positive mathematics motivation coming into the test yields a ‘medium’ effect such that higher (prior) mathematics motivation is associated with higher NAPLAN achievement (global positive motivation, r=.37, p<.001). Self-efficacy is the positive mathematics motivation factor most strongly associated with NAPLAN achievement (r=.43, p<.001). Negative mathematics motivation also yields a ‘medium’ effect such that students higher in negative mathematics motivation score lower in the NAPLAN test (global negative motivation, r= -.30, p<.001). Disengagement is the negative mathematics motivation factor most strongly (negatively) associated with NAPLAN achievement (r = -.32, p<.001). Mathematics motivation coming into the test impacts NAPLAN achievement in similar ways for fixed and branched groups. Further, prior mathematics motivation impacts NAPLAN achievement similarly for fixed and branched groups within each year level. What is the Relationship between Students’ Prior Mathematics Motivation and their Motivation During the NAPLAN test? Positive mathematics motivation coming into the test yields a ‘large’ effect such that more positive (prior) mathematics motivation is associated with more positive NAPLAN motivation (global positive motivation, r=.58, p<.001). Negative mathematics motivation yields a ‘medium’ effect, such that students higher in negative mathematics motivation also score higher in negative NAPLAN motivation (global negative motivation, r=.40, p<.001). Fixed and branched groups are similar in the extent to which mathematics motivation coming into the test is associated with motivation while doing the test. In addition, prior mathematics motivation impacts NAPLAN motivation in similar ways for fixed and branched groups within each year level. What is the Relationship between Students’ Prior Mathematics Motivation and their Subjective Experience of the Online NAPLAN Test? Positive mathematics motivation coming into the test yields a ‘medium’ effect such that higher (prior) mathematics motivation is associated with a more positive subjective experience of the online test (global positive motivation, r=.49, p<.001). Self-efficacy is the positive mathematics motivation factor most strongly associated with a positive subjective experience (r=.44, p<.001). Negative mathematics motivation yields a ‘small’ effect such that students higher in negative mathematics motivation are less positive in their subjective experience of the online test (global negative motivation, r= -.29, p<.001). Disengagement is the negative mathematics motivation factor most strongly (negatively) associated with subjective experience (r = -.38, p<.001). Mathematics motivation coming into the test impacts students’ subjective experience of that test in similar ways for fixed and branched groups. In addition, mathematics motivation coming into the test impacts subjective experience in broadly similar ways for fixed and branched groups within each year level.

Online NAPLAN and Student Motivation
© 2015 5
Conclusion This research has shown that motivation is a relevant factor in students’ performance in NAPLAN, the effects of fixed and branched online NAPLAN approaches, and students’ subjective experience of the online NAPLAN test. The findings shed further light on the effects of adaptive online testing and extend current understanding beyond NAPLAN performance outcomes to the important area of student motivation.

Online NAPLAN and Student Motivation
© 2015 6
INTRODUCTION Background In 2012, the Australian Government Department of Education funded the Australian Curriculum, Assessment and Reporting Authority (ACARA) to implement research to assist decision-making with regards to transitioning the National Assessment Program – Literacy and Numeracy (NAPLAN) from paper-based form to computer (online) assessment (ACARA, 2014b). Over the past three years, ACARA and other investigators have conducted a research program to further develop and enhance the online NAPLAN test mode. This report summarises this prior research and then focuses on the most recent in this series of studies – the motivation-related factors and effects of online NAPLAN testing in the numeracy domain. Computer Adaptive Testing A major purpose of the online NAPLAN research has been to assess efficacy and appropriateness with regards to its adaptive (or, tailored) form. This adaptive form implements branching to different item sets, depending on the student’s ability. This is known as computer adaptive testing and involves adjusting the difficulty of a test to suit the ability of a respondent (Davey, 2011; Thompson & Weiss, 2011; Weiss, 2004). Most computer adaptive testing is based on item response theory (IRT). IRT places items and respondents on the same scale, assisting the direct matching of respondent to items (or item sets) that are most appropriate for him/her (Thompson & Weiss, 2011; van der Linden & Pashley, 2010; Weiss, 2004). There are two typical adaptive test approaches. One is where the test difficulty is adjusted after each item. The other is where the difficulty of the test is adjusted after a student completes a set of items (ACARA 2014c; Lord, 1971a, 1971b, 1971c). These item sets are called testlets, with each testlet typically reflecting the composition of the complete test in terms of skills assessed and content. This form of adaptive testing is referred to as multistage adaptive testing (Davey, 2011) and is the approach adopted with the online adaptive (tailored) NAPLAN tests. Findings from research investigating the effectiveness of computer adaptive testing tend to be positive (though, often also identifying points for further improvement). Along with the potential for reducing the number of items administered, adaptive testing tends not to impact psychometric properties of test scores, can better accommodate students at more extreme ends such as low- and high-achievers, can build in test accommodations such as for students with disabilities, and can more appropriately reflect and assess the hierarchical nature of knowledge in a given subject area (e.g., Kingsbury & Hauser, 1999; Mardberg & Carlstedt, 1998; Moreno & Segall, 1997; Stone & Davey, 2011; Thurlow, Lazarus, Albus, & Hodgson, 2010; Way, Twing, Camara, Sweeney, Lazer, & Mazzeo, 2010). In addition, multistage adaptive tests provide substantial improvement in measurement precision over static (paper-based or fixed-order online) tests (Davey, 2011; Stone & Davey, 2011). They also provide better control over administration, exposure of items, and capacity for students to review items and answers (ACARA, 2014c; Hendrickson, 2007; Van der Linden & Glas, 2010; Weiss, 2004). Online Adaptive NAPLAN Testing In the current form of the online adaptive NAPLAN test, after responding to an initial set of test items, students are then provided with item sets that best suit their achievement level (or ‘observed’ ability). Students progress through three stages, each containing item sets (testlets) of varying difficulty. Figure 1 shows details.

Online NAPLAN and Student Motivation
© 2015 7
Figure 1. Tailored test design: Testlets and six test pathways available (ACARA, 2014c) Each testlet comprises about a third of the items from the overall test. Each testlet is representative of the whole test with regards to skill and content coverage. Thus, every student is assessed at the same level of domain breadth irrespective of the test pathway taken. There are two branching points that determine the pathway a student takes. There are six possible pathways, including one for students who struggle with items in the first testlet (these students are forwarded to the testlet containing the least challenging items so as to assist progression through the remainder of the test; ACARA, 2014c). As reported in ACARA (2014c, p. 5), the goals of the adaptive multistage NAPLAN test are to achieve:
Comprehensive measurement of the main student cohort, by extending the curriculum and content coverage;
Better measurement of the proficiency of each student, including: o better targeting of higher performing students, by providing more challenging items
and test content o better targeting of underperforming students by tailoring tests to their ability and
thus increasing the opportunity to collect information about factors that prevent these students from reaching their full potential;
Assessment of a broader set of skills and a wider range of content, without increasing the number of items in the test taken by each student. The better-targeted test design can assess student ability with fewer items, leaving scope to expand on the content of the final testlets;
The ability to identify gaps that students might be carrying from previous years of schooling. This is achieved by the inclusion in the relevant testlet of a proportion of items targeting earlier year levels.
ACARA developed a comprehensive research program to investigate the factors influencing transition of NAPLAN to online assessments and the feasibility of the proposed multistage-test deign. Numerous research projects have been conducted to investigate and inform the online NAPLAN test mode. A first pilot study (in 2012) investigated how the test delivery mode (paper vs. computer) impacts student performance. This examined the influence of keyboard use to complete tests and also involved interviews to explore cognitive and behavioural engagement with the computer delivery mode. Findings showed that students were capable of engaging with the computerised delivery mode and that moving items to the online form would not significantly impact assessment properties of the NAPLAN tests (ACARA, 2013).

Online NAPLAN and Student Motivation
© 2015 8
A second research study (in 2013) was a field trial of an adaptive NAPLAN test delivered in over 250 schools (> 4000 students across Years 3 to 9) in all states and territories. The aim of the study was to investigate the performance of a multistage adaptive NAPLAN test. Findings revealed that the multistage test reflected sound and feasible measurement and assessment properties and that with the multistage adaptive test there was more precise measurement of achievement, particularly for low and high achieving students (ACARA, 2013; see also Lazendic & Adams, 2014). Also in 2013, another research project sought to examine cognitive and behavioural engagement with the multistage adaptive NAPLAN test. This found that the adaptive testing catered more fully to students’ assessment and learning needs (ACARA, 2013). Subsequent research found that the adaptive mode enabled socio-educationally disadvantaged and Indigenous students to be engaged through the test and to complete it with a sense of satisfaction – but also identified numerous areas for further test refinement to suit socio-educationally disadvantaged students (Lowrie & Logan, 2013). Computer Adaptive Testing and Motivation In other research into online testing, a small body of work has explored the potentially motivating properties of computer adaptive testing. For example, Way et al. (2010) suggest that because content is delivered to a more appropriate level of difficulty, students will be more motivated to persist and complete the test. Motivational yields have also been suggested due to the potential for shorter tests (Clark, 2004). There is also the option to include algorithms that allow for intermittent easier items and to include items that have a probability of correct responses greater than 0.50 to increase self-efficacy through the task (Hausler & Sommer, 2008; Parshall, Spray, Kalohn, & Davey, 2002). However, many claims around the potentially motivating properties of computer adaptive testing have yet to receive direct empirical attention. It is also unclear whether the level of motivation that students bring to the adaptive test impacts its outcomes. For example, is it the case that students already high in academic motivation are disproportionately advantaged in an adaptive testing – or, are students low in academic motivation better assisted by an adaptive online form? Addressing these and related questions is the purpose of the present investigation. Motivation Motivation is here defined as individuals’ energy and drive to learn, work effectively and achieve to their potential, and the behaviours aligned with this energy and drive (Martin, 2007, 2010). Students’ motivation plays a major role in their engagement and achievement at school and in specific subject areas (Martin, 2007, 2009; Schunk, Pintrich, & Meece, 2008). Motivation is significantly associated with effort and time invested in one’s application and this leads to greater mastery of skill and performance (Drenth, Thierry, & de Wolff, 1998; Duda, 2001; Liem & Martin, 2012). The present investigation utilises a recently proposed motivation model – the Motivation and Engagement Wheel (Figure 2), and its accompanying assessment tool, the Motivation and Engagement Scale (MES; Martin, 2007, 2009, 2010) – as a basis for examining the motivation-related dimensions of online NAPLAN testing.

Online NAPLAN and Student Motivation
© 2015 9
Figure 2. Motivation and Engagement Wheel (reproduced with permission from AJ Martin and
Lifelong Achievement Group; www.lifelongachievement.com). The Motivation and Engagement Wheel The Motivation and Engagement Wheel is a multidimensional framework representing salient cognition and behaviour pertinent to students’ motivation. At its most basic level, as Figure 1 shows, the Wheel comprises positive and negative motivation factors (though, four major factors are sometimes delineated: positive/adaptive cognition, positive/adaptive behaviour, negative/maladaptive cognition, negative/maladaptive behaviour). Positive motivation comprises:
Self-efficacy Valuing Mastery orientation Planning Task management Persistence
Negative motivation comprises:
Anxiety Failure avoidance Uncertain (low) control Self-handicapping Disengagement
These eleven motivation factors were selected to integrate seminal conceptualising such as self-efficacy, attribution and control, valuing, achievement goal orientation, need achievement, self-worth, self-determination, and self-regulation theories (Martin, 2007, 2009). Thus for positive
Self-efficacy
Mastery orientation
Valuing Persistence
Planning
Task management
Anxiety
Failure avoidance
Uncertaincontrol
Self-handicapping
Disengagement
POSITIVE MOTIVATION
NEGATIVE MOTIVATION

Online NAPLAN and Student Motivation
© 2015 10
motivation, the self-efficacy factor is informed by self-efficacy and agency perspectives (Bandura, 1997); the valuing factor is informed by expectancy-value theory (Wigfield & Eccles, 2000); the mastery orientation factor represents intrinsic motivation of self-determination theory (Ryan & Deci, 2000) and the mastery dimension of goal theory (Kaplan & Maehr, 2007); and, planning, task management, and persistence are informed by self-regulatory perspectives (Pintrich & Garcia, 1991; Zimmerman, 2008). For negative motivation, the uncertain control factor represents the controllability element of attribution theory (Connell, 1985; Weiner, 1994); the failure avoidance and anxiety factors follow from need achievement theory (Atkinson, 1957; Covington, 1992); and, the self-handicapping and disengagement factors emanate from self-worth motivation (Covington, 1992) and attribution (e.g., learned helplessness) theories (Weiner, 1994). Table 1 presents an operational definition for each of the eleven Wheel factors. Table 1. Definitions of factors from the Motivation and Engagement Wheel
. Operational Definition
Positive Motivation
Self-efficacy Students’ belief in their capacity to perform a learning task.
. Valuing Students’ belief in the use, value, relevance and importance of school and schoolwork.
Mastery orientation Students’ inclination to develop competence and knowledge in their learning (more than outperforming others).
Planning Students’ planning and monitoring of academic tasks.
Task management Students’ use of time, self-organisation, and management of study.
Persistence Students’ persistence in academic tasks.
Negative Motivation
Anxiety Students’ anxiety when thinking about or doing tests and assignments.
Failure avoidance Students doing schoolwork for fear and avoidance reasons (to avoid failure, or not disappoint others).
Uncertain (low) control Students’ uncertainty about how to do well or how to avoid poor performance.
Self-handicapping Students compromising their chances of success at school so as to have an excuse if they do not do well.
Disengagement Students’ inclination to abandon effort or give up in academic tasks.
The Motivation and Engagement Wheel represents motivation factors that apply in many performance domains. For example, it has been applied to the domains of school, university/college, work, sport, and music (Green, Martin, & Marsh, 2007; Martin, 2008a, 2008b, 2008c). Moreover, within school, it has been applied to mathematics, science, and English (Green et al., 2007; Martin, Anderson, Bobis, Way, & Vellar, 2012; Martin, Bobis, Anderson, Way, & Vellar, 2011; Martin, Way, Bobis, & Anderson, 2015). In all studies, researchers have shown that the eleven motivation factors have relevance and pertinence in the target performance domain. Thus, for example, self-efficacy and anxiety are salient in each of mathematics, science, and English subject areas.

Online NAPLAN and Student Motivation
© 2015 11
Given the capacity of the Wheel to apply across diverse domains, it was deemed a useful means by which to examine motivation in the present investigation. Specifically, it is adapted to the area of mathematics as a means to conceptualise students’ mathematics motivation (i.e., subject-specific motivation) coming into the online NAPLAN test. It is also adapted to the area of the NAPLAN test as a means to conceptualise students’ motivation during the NAPLAN numeracy test (i.e., NAPLAN-specific motivation). The Motivation and Engagement Scale Alongside the Wheel is its accompanying instrumentation, the Motivation and Engagement Scale (MES) (Martin, 2014). The MES assesses each of the eleven motivation factors in the Wheel (i.e., self-efficacy, valuing, mastery orientation, etc.). For the full (and normed) version of the MES, each of the eleven MES subscales comprises four items – hence the full MES is a 44-item instrument. To respond to the MES, a 7-point Likert-type scale, ranging from 1 (strongly disagree) to 7 (strongly agree), is provided (see Martin, 2007, 2009). Due to time constraints (and the fact young children are included in sampling; Year 3), for this investigation, the Short MES is used. For the Short MES, each of the eleven Wheel factors is represented by one item. As with the Motivation and Engagement Wheel, the MES has been applied in different domains. Indeed, the studies reported above that adapted the Wheel to school, university/college, work, sport, and music (Green et al., 2007; Martin, 2008a, 2008b, 2008c) and also to mathematics, science, and English (Green et al., 2007; Martin, Bobis et al., 2011), all did so using a domain-specific form of the MES adapted to the specific domain under focus. There is thus empirical support to use the MES in a domain-specific way, that in the case of the present investigation, involved adaptation to mathematics and NAPLAN numeracy domains. Hence, for example, self-efficacy in mathematics was represented by the item, “I do well in maths” and self-efficacy for the NAPLAN test was represented by, “I did well in this test”. Similarly, for example, anxiety in mathematics was represented by the item, “In maths I get quite anxious about my schoolwork and assessments” and anxiety for the NAPLAN test was represented by, “I was anxious in this test”. Aims of the Present Investigation This research investigates the motivation factors relevant to two formats of online NAPLAN: adaptive (branched) online and fixed order online. Two lines of motivation research are pursued. The first investigates the effect of each of the two formats on students’ NAPLAN numeracy performance, NAPLAN-specific motivation, and subjective experience of the NAPLAN test. The second investigates the school-specific (i.e., mathematics) motivation factors that are associated with students’ performance, motivation and subjective experience in each of the two NAPLAN formats. Study 1 investigates the effect of fixed and branched online NAPLAN formats on students’ NAPLAN performance, NAPLAN-specific motivation, and subjective experience while doing the test. It seeks to address the following questions:
What is the effect of fixed and branched online NAPLAN test formats on students’ achievement in the tests and what is the impact of branching on measurement precision of such a NAPLAN achievement estimate?
What is the effect of fixed and branched online NAPLAN test formats on students’ NAPLAN motivation (e.g., self-efficacy in the test) during the test?

Online NAPLAN and Student Motivation
© 2015 12
What is the effect of fixed and branched online NAPLAN test formats on students’ subjective experience (e.g., sense of clarity, confidence, comprehension) of the online test?
Study 2 investigates the school-specific (mathematics) motivation factors that are associated with students’ NAPLAN-specific motivation and performance for each of fixed and branched online test formats. It seeks to address the following questions:
What is the association between students’ mathematics motivation coming into the online NAPLAN test and students’ achievement in the test? Does this vary as a function of fixed and branched online formats?
What is the association between students’ mathematics motivation coming into the online NAPLAN test and students’ motivation while doing the test? Does this vary as a function of fixed and branched online formats?
What is the association between students’ mathematics motivation coming into the online NAPLAN test and students’ subjective experience (e.g., sense of clarity, confidence, comprehension) of the online test? Does this vary as a function of fixed and branched online formats?
Taken together, through an assessment of two online NAPLAN test formats, this research project aims to examine the effects of adaptive online testing and extend current understanding beyond NAPLAN performance outcomes to also consider the important area of student motivation.
METHOD Participants ACARA asked states and territories and school systems to nominate schools with a brief to ensure that schools participating in the study represented the broad range of Australian schools. Some jurisdiction and systems provided schools that volunteered to participate in the study, while others nominated and mandated participation of their schools. The final sample comprised 231 schools from all states and territories, from all sectors, and from metropolitan, regional, remote and very remote locations. Each school contributed at least one class of students in available NAPLAN years and some schools contributed more students. Participants were 12,736 primary and secondary school students. Participants were from Year 3 (N=3557; 28%), Year 5 (N=3797; 30%), Year 7 (N=2911; 23%), and Year 9 (N=2471; 19%). Approximately fifty per cent were females (N=6392), with N=6344 males. Just over 6% (N=813) were of Indigenous and/or Torres Strait Islander background. A total of 231 schools were involved. Two-thirds (N=154; 67%) were metropolitan schools, 28% (N=64) were regional schools, 3% (N=8) were remote schools, and 2% (N=5) were very remote schools. Just under sixty percent (N=136; 59%) were primary schools, 23% (N=53) were secondary schools, and 18% (N=42) were combined primary and secondary schools. The mean ICSEA score for schools was 1016 (SD=83). The average school size for primary schools was N=383 (SD=246) students, for secondary schools it was N=890 (SD=393) students, and for combined schools it was N=885 (SD=571) students.

Online NAPLAN and Student Motivation
© 2015 13
The fixed path condition comprised N=7152 students (56% of the sample) and the branched path condition comprised N=5584 students (44% of the sample). Table 2 presents details for each of the fixed and branched conditions.1 Table 2. Fixed and branched conditions: Sample statistics
Fixed Condition Branched Condition
Year Group Year 3: N=2048 (29%)
Year 5: N=2070 (29%)
Year 7: N=1624 (22%)
Year 9: N=1410 (20%)
Total: N=7152 (100%)
Year 3: N=1509 (27%)
Year 5: N=1727 (31%)
Year 7: N=1287 (23%)
Year 9: N=1061 (19%)
Total: N=5584 (100%)
Gender Male: N=3588 (50%)
Female: N=3564 (50%)
Total: N=7152 (100%)
Male: N=2756 (49%)
Female: N=2828 (51%)
Total: N=5584 (100%)
Indigenous status Non-Indigenous: N=6651 (93%)
Indigenous: N=501 (7%)
Total: N=7152 (100%)
Non-Indigenous: N=5272 (94%)
Indigenous: N=312 (6%)
Total: N=5584 (100%)
School type Primary: N=3870 (54%)
Secondary: N=1654 (23%)
Combined: N=1628 (23%)
Total: N=7152 (100%)
Primary: N=2986 (53%)
Secondary: N=1442 (26%)
Combined: N=1156 (21%)
Total: N=5584 (100%)
Location Metropolitan: N=4939 (69%)
Regional: N=1993 (28%)
Remote: N=127 (2%)
Very Remote: N=93 (1%)
Total: N=7152 (100%)
Metropolitan: N=3786 (68%)
Regional: N=1641 (29%)
Remote: N=119 (2%)
Very Remote: N=38 (1%)
Total: N=5584 (100%)
School ICSEA M=1024 (SD=77) M=1030 (SD=76)
School enrolment M=656 (SD=419) M=675 (SD=407)
Procedure Within each school, students were randomly allocated to either the fixed or to the branched test condition. This allocation was done by an algorithm at the point of allocation of the logging information to the students. In some schools this algorithm was not consistently applied, leading to selection favouring one condition over another – however, preliminary analyses (e.g., see Footnote 1) identified no pre-existing differences between fixed and branched conditions. In addition, in order to achieve the required number of responses for the purpose of trialling new testlets, only fixed conditions were administered in some schools. Consequently, the final sample had more
1 It was of interest to determine if fixed and branched groups differed on background characteristics relevant to NAPLAN performance, including access to mathematics computer programs and websites at home, participation in mathematics competitions in the past year, receiving mathematics tutoring (outside school hours), completion of any NAPLAN practice tests leading up to the test, and self-reported mathematics standing in year group (bottom, middle, top third of year group). There were no significant differences (at p < .001) on any of these measures: home access to computer programs, χ2(1)=1.20, p=.27; participation in competitions, χ2(1)=2.07, p=.15; mathematics tutoring, χ2(1)=5.03, p=.03; NAPLAN practice tests, χ2(1)=2.17, p=.14; and mathematics standing, χ2(2)=1.92, p=.38.
Online NAPLAN and Student Motivation
© 2015 14
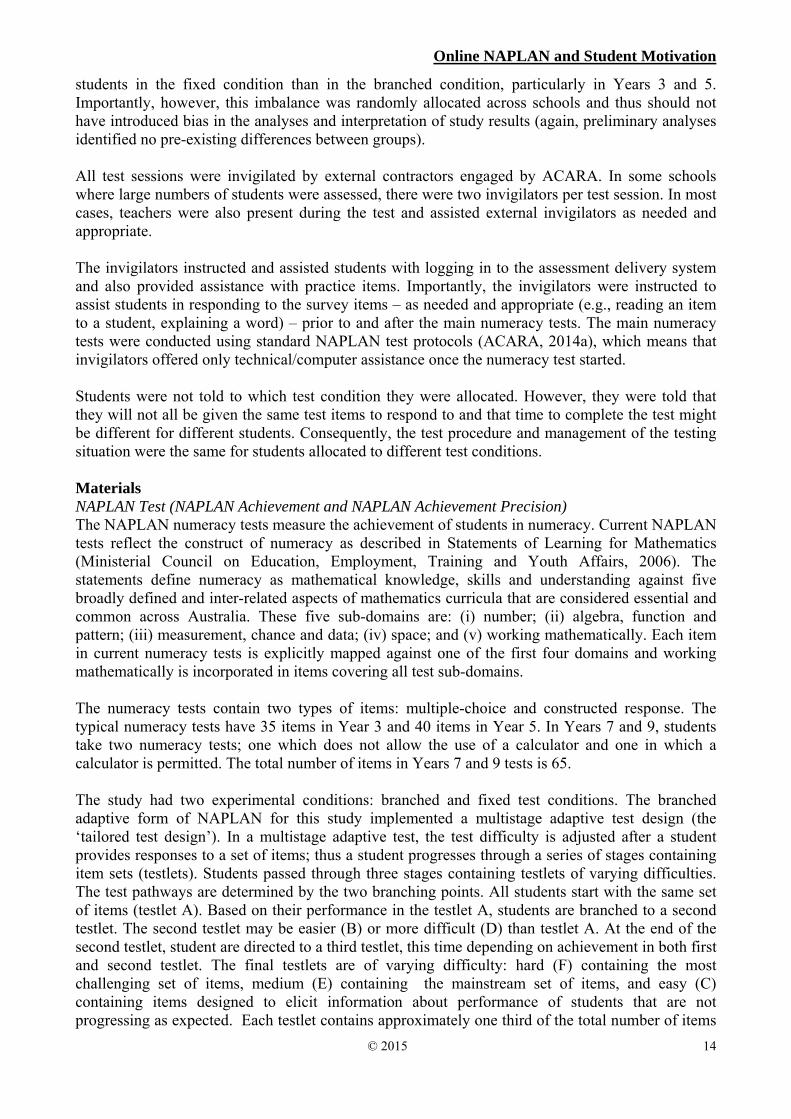
students in the fixed condition than in the branched condition, particularly in Years 3 and 5. Importantly, however, this imbalance was randomly allocated across schools and thus should not have introduced bias in the analyses and interpretation of study results (again, preliminary analyses identified no pre-existing differences between groups). All test sessions were invigilated by external contractors engaged by ACARA. In some schools where large numbers of students were assessed, there were two invigilators per test session. In most cases, teachers were also present during the test and assisted external invigilators as needed and appropriate. The invigilators instructed and assisted students with logging in to the assessment delivery system and also provided assistance with practice items. Importantly, the invigilators were instructed to assist students in responding to the survey items – as needed and appropriate (e.g., reading an item to a student, explaining a word) – prior to and after the main numeracy tests. The main numeracy tests were conducted using standard NAPLAN test protocols (ACARA, 2014a), which means that invigilators offered only technical/computer assistance once the numeracy test started. Students were not told to which test condition they were allocated. However, they were told that they will not all be given the same test items to respond to and that time to complete the test might be different for different students. Consequently, the test procedure and management of the testing situation were the same for students allocated to different test conditions. Materials NAPLAN Test (NAPLAN Achievement and NAPLAN Achievement Precision) The NAPLAN numeracy tests measure the achievement of students in numeracy. Current NAPLAN tests reflect the construct of numeracy as described in Statements of Learning for Mathematics (Ministerial Council on Education, Employment, Training and Youth Affairs, 2006). The statements define numeracy as mathematical knowledge, skills and understanding against five broadly defined and inter-related aspects of mathematics curricula that are considered essential and common across Australia. These five sub-domains are: (i) number; (ii) algebra, function and pattern; (iii) measurement, chance and data; (iv) space; and (v) working mathematically. Each item in current numeracy tests is explicitly mapped against one of the first four domains and working mathematically is incorporated in items covering all test sub-domains. The numeracy tests contain two types of items: multiple-choice and constructed response. The typical numeracy tests have 35 items in Year 3 and 40 items in Year 5. In Years 7 and 9, students take two numeracy tests; one which does not allow the use of a calculator and one in which a calculator is permitted. The total number of items in Years 7 and 9 tests is 65. The study had two experimental conditions: branched and fixed test conditions. The branched adaptive form of NAPLAN for this study implemented a multistage adaptive test design (the ‘tailored test design’). In a multistage adaptive test, the test difficulty is adjusted after a student provides responses to a set of items; thus a student progresses through a series of stages containing item sets (testlets). Students passed through three stages containing testlets of varying difficulties. The test pathways are determined by the two branching points. All students start with the same set of items (testlet A). Based on their performance in the testlet A, students are branched to a second testlet. The second testlet may be easier (B) or more difficult (D) than testlet A. At the end of the second testlet, student are directed to a third testlet, this time depending on achievement in both first and second testlet. The final testlets are of varying difficulty: hard (F) containing the most challenging set of items, medium (E) containing the mainstream set of items, and easy (C) containing items designed to elicit information about performance of students that are not progressing as expected. Each testlet contains approximately one third of the total number of items

Online NAPLAN and Student Motivation
© 2015 15
in the overall test and is additionally representative of the whole test in terms of skills and content coverage. In the fixed condition students were administered one of four linear, not adaptive, tests. The four linear tests corresponded to the main test pathways available to students in the branching test condition (A-D-F, A-D-E, A-B-E, A-B-C). The test pathways A-D-C and A-C-B were not translated into linear tests because they have a special purpose within the tailored test design and thus it is expected that very few students participating in this study would be directed toward these pathways. These pathways were constructed using testlets from the branching condition and some additional testlets. This overlap of testlets across the two conditions enabled joint scaling of tests and students regardless of the two test conditions. Testlets had 12 items in Year 3 and 14 items in Year 5, and 16 items in Years 7 and 9 testlets. Some of the Years 7 and 9 items required the use of calculator which was provided as an onscreen solution only for those items. NAPLAN achievement is a score based on measurement scales constructed using the Rasch Model (Rasch, 1960). For this report, student results were scaled separately at each year level and student ability was estimated using weighted likelihood estimation (WLE) procedure. To further ensure comparability across year levels for analyses in this report, students’ NAPLAN achievement score was standardised within each year level such that each of Years 3, 5, 7, and 9 had a mean of 0 and SD of 1. A standard error (WLE SE) of WLE estimate was also calculated for each student providing a variable that indicates the precision of achievement estimate. The lower the values of WLE SE the higher is the precision of student achievement estimate. Mathematics Motivation Prior to completing the NAPLAN test items, students reported on their mathematics motivation. Mathematics motivation was assessed using the Short Form of the Motivation and Engagement Scale (MES; Martin, 2014), adapted for mathematics. The MES comprises 11 factors that can be broadly grouped into positive and negative motivation. For information about the history and development of this scale, see Liem and Martin (2012; see also Martin, 2007, 2009). Positive (or, adaptive) motivation comprises self-efficacy (“I do well in maths”), mastery orientation (“In maths I am very focused on learning and understanding things”), valuing (“What I learn in maths is important and useful”), persistence (“I persist at maths even when it is challenging or difficult”), planning (“In maths I plan how I will do my schoolwork and assessment tasks”), and task management (“In maths I am well organised and use my time well”). Negative (or, maladaptive) motivation comprises anxiety (“In maths I get quite anxious about my schoolwork and assessments”), failure avoidance (sometimes referred to as performance avoidance; “In maths I am mainly focused on avoiding bad marks”), uncertain (low) control (“I don’t think I have much control over how well I do in maths”), self-handicapping (“In maths I often waste time, disrupt others, or get distracted”) and disengagement (“I often feel like giving up in maths”). These measures were rated on a 1 (‘Strongly Disagree’) to 7 (‘Strongly Agree’) scale. Alongside these 11 factors, two global factors were also included that were the mean of all six positive motivation factors (‘global positive mathematics motivation’) and the mean of all five negative motivation factors (‘global negative mathematics motivation’). In most tables, all 13 motivation variables are included, but for summary and discussion of main findings we often focus on the two global motivation factors. NAPLAN Motivation Upon completion of the NAPLAN test items, students completed a set of items assessing their motivation while doing the test. This NAPLAN motivation was assessed using the Short Form of

Online NAPLAN and Student Motivation
© 2015 16
the Motivation and Engagement Scale (MES; Martin, 2014), adapted for the online NAPLAN test. Positive (or, adaptive) NAPLAN motivation comprises self-efficacy (“I did well in this test”), mastery orientation (“In this test I was very focused on understanding the questions and tasks”), valuing (“This test was important”), persistence (“I persisted in this test even when it was challenging or difficult”), planning (“In this test, I planned my answers and monitored my progress”), and task management (“In this test I made good use of my time”). Negative (or, maladaptive) NAPLAN motivation comprises anxiety (“I was anxious in this test”), failure avoidance (sometimes referred to as performance avoidance; “In this test I did not want to get a bad mark”), uncertain (low) control (“I don’t think I had much control over how well I did in this test”), self-handicapping (“During this test I wasted time and was easily distracted”) and disengagement (“I often felt like giving up in this test”). These measures were rated on a 1 (‘Strongly Disagree’) to 7 (‘Strongly Agree’) scale. Alongside these 11 factors, two global factors were also included that were the mean of all six positive motivation factors (‘global positive NAPLAN motivation’) and the mean of all five negative motivation factors (‘global negative NAPLAN motivation’). In most tables, all 13 motivation variables are included, but for summary and discussion of main findings we often focus on the two global NAPLAN motivation factors. Subjective Experience of NAPLAN Test After completing all NAPLAN test items and NAPLAN motivation items, Year 7 and Year 9 students were asked a series of questions exploring their subjective experience of the online test (due to test length considerations, Years 3 and 5 were not asked these additional questions). Items addressed the ease of test items, the extent to which it matched their ability, the clarity of the test, their interest in test items, and test comprehensibility. In total, six such items were administered (with the stem: “Compared to maths tests I have done before …”, as follows: “This test was easy for me”, “This test was suited to my ability”, “The questions seemed to be random, or out of order” [reversed for final scaling], “I was interested in most of the questions in this test”; “I understood most of the questions in this test”, “This test was unclear and confusing” [reversed for final scaling], and “I did well in this test”). Collectively, these formed a reliable ‘subjective experience’ factor (Cronbach’s α = .74), with students scoring high on this factor reflecting greater ease and comfort in their subjective experience of the online test and students scoring low on this factor reflecting less ease and comfort. A ‘subjective experience’ variable was computed by finding the mean of the set of six items. Analyses Descriptive statistics are employed to assess means, standard deviations (SDs), frequencies, percentages, and reliability. Testing for mean-level differences between groups involved t-tests and multivariate analysis of variance (MANOVA). Testing for associations among rating scales and continuous variables such as NAPLAN achievement involved Pearson’s product moment correlations. All such analyses were performed with SPSS for Windows, version 22. The very large sample size in this study opens the risk of Type I error such that we incorrectly reject the null hypothesis (i.e., we declare a statistically significant effect when none is present). We deal with this in two ways. Firstly, in the case of mean-level difference tests, we set a conservative significance value of p<.001. Secondly, in the case of correlations we place greater emphasis on the correlation coefficient (r-value) and its associated effect size (Cohen’s d; Cohen, 1988) than we do on statistical significance. Response rates to motivation and engagement survey items were high, with the amount of missing responses not exceeding 5%, with many items yielding 1% or less of missing data. The percentage is slightly higher for items administered after the main tests to students in Year 3 where the
Online NAPLAN and Student Motivation
© 2015 17
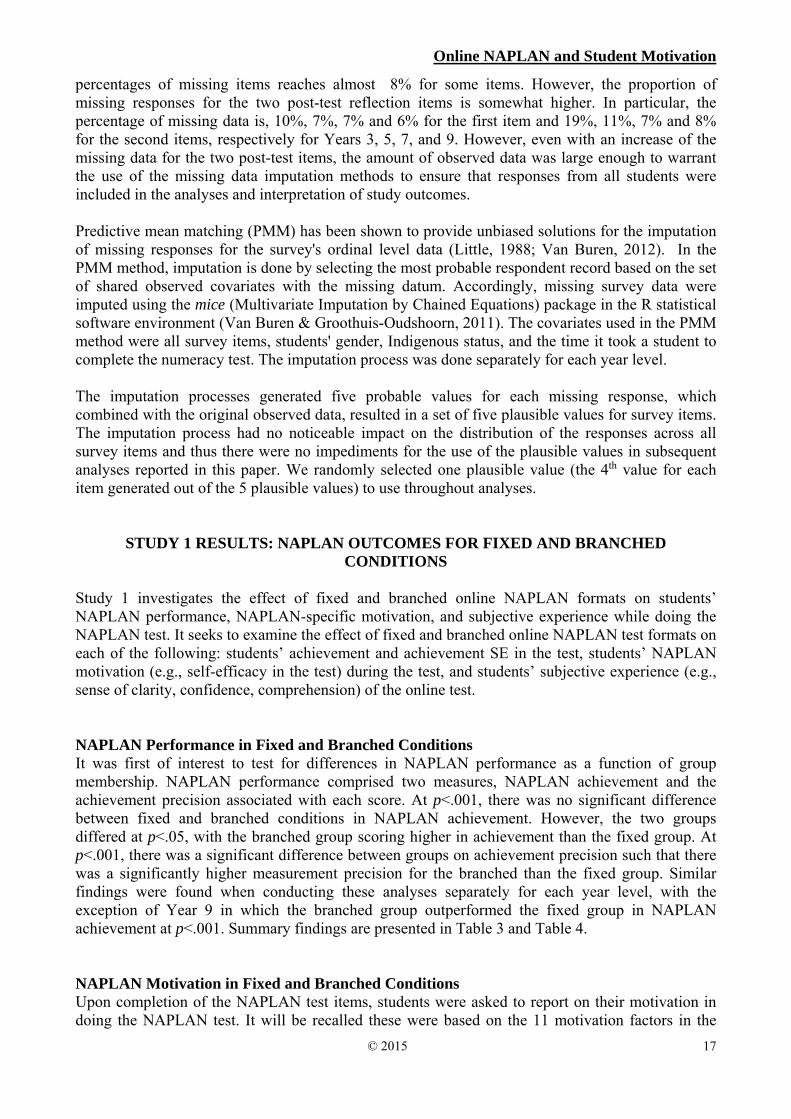
percentages of missing items reaches almost 8% for some items. However, the proportion of missing responses for the two post-test reflection items is somewhat higher. In particular, the percentage of missing data is, 10%, 7%, 7% and 6% for the first item and 19%, 11%, 7% and 8% for the second items, respectively for Years 3, 5, 7, and 9. However, even with an increase of the missing data for the two post-test items, the amount of observed data was large enough to warrant the use of the missing data imputation methods to ensure that responses from all students were included in the analyses and interpretation of study outcomes. Predictive mean matching (PMM) has been shown to provide unbiased solutions for the imputation of missing responses for the survey's ordinal level data (Little, 1988; Van Buren, 2012). In the PMM method, imputation is done by selecting the most probable respondent record based on the set of shared observed covariates with the missing datum. Accordingly, missing survey data were imputed using the mice (Multivariate Imputation by Chained Equations) package in the R statistical software environment (Van Buren & Groothuis-Oudshoorn, 2011). The covariates used in the PMM method were all survey items, students' gender, Indigenous status, and the time it took a student to complete the numeracy test. The imputation process was done separately for each year level. The imputation processes generated five probable values for each missing response, which combined with the original observed data, resulted in a set of five plausible values for survey items. The imputation process had no noticeable impact on the distribution of the responses across all survey items and thus there were no impediments for the use of the plausible values in subsequent analyses reported in this paper. We randomly selected one plausible value (the 4th value for each item generated out of the 5 plausible values) to use throughout analyses.
STUDY 1 RESULTS: NAPLAN OUTCOMES FOR FIXED AND BRANCHED
CONDITIONS Study 1 investigates the effect of fixed and branched online NAPLAN formats on students’ NAPLAN performance, NAPLAN-specific motivation, and subjective experience while doing the NAPLAN test. It seeks to examine the effect of fixed and branched online NAPLAN test formats on each of the following: students’ achievement and achievement SE in the test, students’ NAPLAN motivation (e.g., self-efficacy in the test) during the test, and students’ subjective experience (e.g., sense of clarity, confidence, comprehension) of the online test. NAPLAN Performance in Fixed and Branched Conditions It was first of interest to test for differences in NAPLAN performance as a function of group membership. NAPLAN performance comprised two measures, NAPLAN achievement and the achievement precision associated with each score. At p<.001, there was no significant difference between fixed and branched conditions in NAPLAN achievement. However, the two groups differed at p<.05, with the branched group scoring higher in achievement than the fixed group. At p<.001, there was a significant difference between groups on achievement precision such that there was a significantly higher measurement precision for the branched than the fixed group. Similar findings were found when conducting these analyses separately for each year level, with the exception of Year 9 in which the branched group outperformed the fixed group in NAPLAN achievement at p<.001. Summary findings are presented in Table 3 and Table 4. NAPLAN Motivation in Fixed and Branched Conditions Upon completion of the NAPLAN test items, students were asked to report on their motivation in doing the NAPLAN test. It will be recalled these were based on the 11 motivation factors in the

Online NAPLAN and Student Motivation
© 2015 18
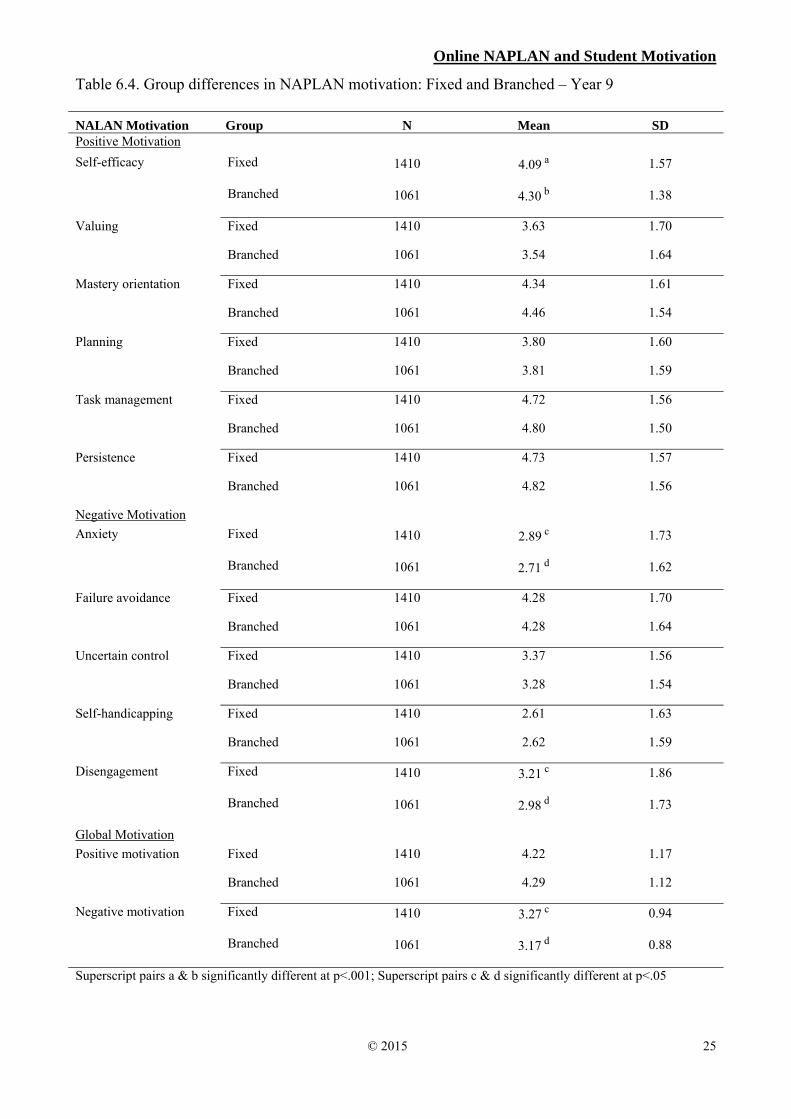
Motivation and Engagement Wheel (self-efficacy, valuing, mastery orientation etc.). Two additional global NAPLAN motivation factors were developed that were the mean of the 6 positive motivation factors and the mean of the 5 negative motivation factors. At p<.001, there was no significant difference between fixed and branched conditions in motivation while doing the NAPLAN test. However the groups did differ at p<.05 on two factors, with the branched group scoring higher self-efficacy and lower disengagement while doing the NAPLAN test. When examining NAPLAN motivation for fixed and branched groups as a function of year level, there are no significant differences in Years 3 and 5 (at p<.001 and p<.05), including on self-efficacy and disengagement. Differences between fixed and branched conditions tend to emerge in Years 7 and 9. In Year 7, the groups differ at p<.05 on two factors, with the branched group scoring higher self-efficacy and lower disengagement while doing the NAPLAN test. In Year 9, differences at p<.001 emerged, with the branched group significantly higher in self-efficacy while doing the NAPLAN test. Also in Year 9, at p<.01, the branched group reported lower anxiety, disengagement, and global negative motivation than the fixed group. Summary findings are presented in Tables 5 and 6. Subjective Experience of Online NAPLAN in Fixed and Branched Conditions After completing all NAPLAN mathematics items, Years 7 and 9 students were asked a series of questions exploring their subjective experience of the online test (due to test length considerations, Years 3 and 5 were not asked these additional questions). Questions addressed the ease of test items, the extent to which items matched their ability, the clarity of the test, their interest in test items, and test comprehensibility. As described in Method, collectively, these formed a ‘subjective experience’ factor, with students scoring high on this factor reflecting greater ease and comfort in their subjective experience of the online test and students scoring low on this factor reflecting less ease and comfort. As shown in Table 7, students in the branched condition reported a significantly more positive subjective experience than students in the fixed condition (p<.001). When assessing subjective experience as a function of year level (Table 8), we see that the branched condition (compared with the fixed condition) yields a more positive subjective experience for students in both Years 7 and 9; however, it again seems the positive effects of branching are marginally greater for the older students (Year 9, p<.001) than younger students (Year 7, p<.01).

Online NAPLAN and Student Motivation
© 2015 19
Table 3. Group differences in NAPLAN performance: Fixed and Branched
Mean SD
NAPLAN Achievement Fixed (N=7152) -.02 c .97
Branched (N=5584) .03 d 1.04
NAPLAN Achievement SE Fixed (N=7152) .43 a .11
Branched (N=5584) .38 b .05
Superscript pairs a & b significantly different at p<.001; Superscript pairs c & d significantly different at p<.05

Online NAPLAN and Student Motivation
© 2015 20
Table 4. Group differences in NAPLAN performance: Fixed and Branched, Years 3 to 9
Maths Motivation Group Mean SD
Year 3
NAPLAN Achievement Fixed (N=2048)
.01 .97
Branched (N=1509)
-.01 1.04
NAPLAN Achievement SE Fixed (N=2048) .44 a .11
Branched (N=1509) .40 b .05
Year 5
NAPLAN Achievement Fixed (N=2070)
-.01 .99
Branched (N=1727)
.01 1.01
NAPLAN Achievement SE Fixed (N=2070) .42 a .12
Branched (N=1727) .37 b .04
Year 7
NAPLAN Achievement Fixed (N=1624)
-.03 .93
Branched (N=1287)
.04 1.08
NAPLAN Achievement SE Fixed (N=1624) .46 a .08
Branched (N=1287) .38 b .06
Year 9
NAPLAN Achievement Fixed (N=1410) -.07 a .98
Branched (N=1061) .36 b .05
NAPLAN Achievement SE Fixed (N=1410) .41 a .11
Branched (N=1061) .36 b .05
Superscript pairs a & b significantly different at p<.001; Superscript pairs c & d significantly different at p<.05

Online NAPLAN and Student Motivation
© 2015 21
Table 5. Group differences in NAPLAN motivation: Fixed and Branched – Total Sample
NALAN Motivation Group N Mean SD Positive Motivation Self-efficacy Fixed 7152 4.89 c 1.56
Branched 5584 4.97 d 1.39 Valuing Fixed 7152 4.90 1.80
Branched 5584 4.85 1.79 Mastery orientation Fixed 7152 5.14 1.63
Branched 5584 5.16 1.57 Planning Fixed 7152 4.39 1.72
Branched 5584 4.39 1.69 Task management Fixed 7152 5.45 1.51
Branched 5584 5.47 1.46 Persistence Fixed 7152 5.24 1.64
Branched 5584 5.24 1.62 Negative Motivation Anxiety Fixed 7152 3.29 1.89
Branched 5584 3.34 1.86 Failure avoidance Fixed 7152 5.20 1.76
Branched 5584 5.20 1.75 Uncertain control Fixed 7152 3.22 1.77
Branched 5584 3.21 1.74 Self-handicapping Fixed 7152 2.21 1.58
Branched 5584 2.20 1.53 Disengagement Fixed 7152 2.62 c 1.85
Branched 5584 2.55 d 1.75 Global Motivation Positive motivation Fixed 7152 5.00 1.17
Branched 5584 5.01 1.12 Negative motivation Fixed 7152 3.31 0.98
Branched 5584 3.30 0.93 Superscript pairs a & b significantly different at p<.001; Superscript pairs c & d significantly different at p<.05

Online NAPLAN and Student Motivation
© 2015 22
Table 6.1. Group differences in NAPLAN motivation: Fixed and Branched – Year 3
NALAN Motivation Group N Mean SD Positive Motivation Self-efficacy Fixed 2048 5.43 1.53
Branched 1509 5.44 1.45
Valuing Fixed 2048 5.62 1.63
Branched 1509 5.57 1.65
Mastery orientation Fixed 2048 5.43 1.72
Branched 1509 5.40 1.72
Planning Fixed 2048 4.64 1.87
Branched 1509 4.60 1.86
Task management Fixed 2048 5.78 1.49
Branched 1509 5.76 1.47
Persistence Fixed 2048 5.29 1.83
Branched 1509 5.22 1.86
Negative Motivation Anxiety Fixed 2048 3.51 2.06
Branched 1509 3.61 2.05
Failure avoidance Fixed 2048 5.51 1.82
Branched 1509 5.45 1.86
Uncertain control Fixed 2048 3.24 2.00
Branched 1509 3.18 1.97
Self-handicapping Fixed 2048 2.21 1.71
Branched 1509 2.25 1.72
Disengagement Fixed 2048 2.36 1.84
Branched 1509 2.39 1.85
Global Motivation Positive motivation Fixed 2048 5.37 1.11
Branched 1509 5.33 1.11
Negative motivation Fixed 2048 3.36 1.08
Branched 1509 3.37 1.04
Superscript pairs a & b significantly different at p<.001; Superscript pairs c & d significantly different at p<.05
Online NAPLAN and Student Motivation
© 2015 23
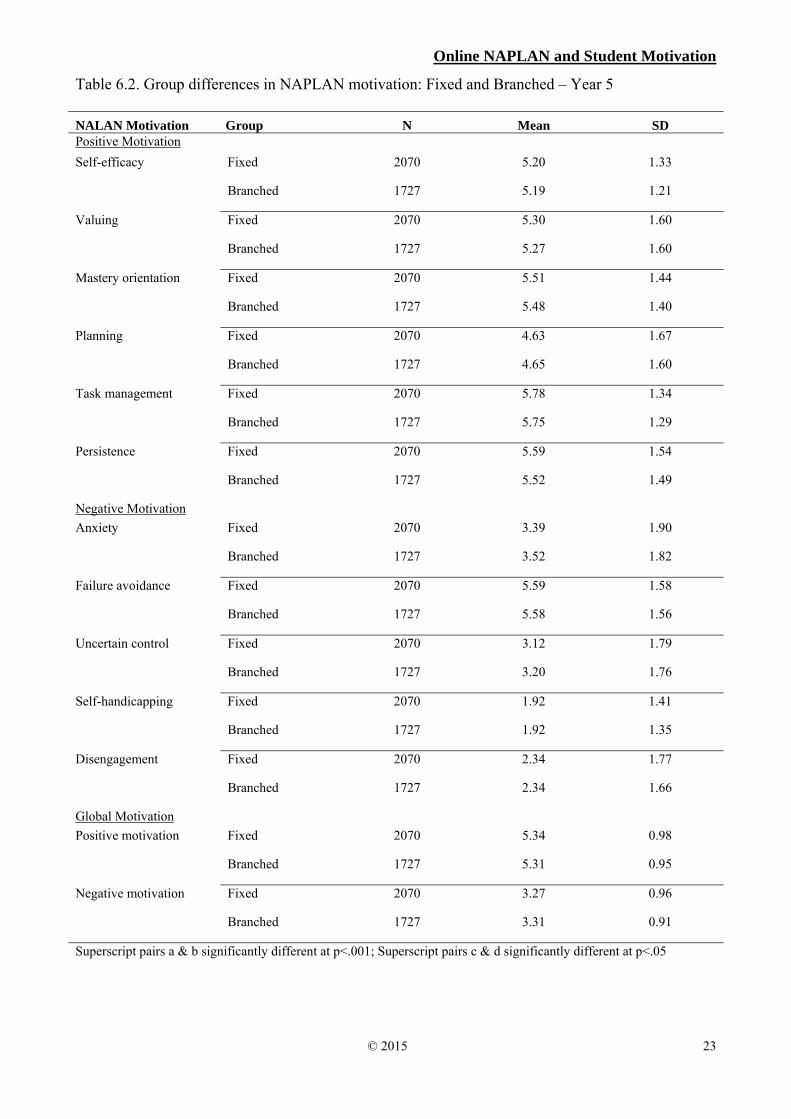
Table 6.2. Group differences in NAPLAN motivation: Fixed and Branched – Year 5
NALAN Motivation Group N Mean SD Positive Motivation Self-efficacy Fixed 2070 5.20 1.33
Branched 1727 5.19 1.21
Valuing Fixed 2070 5.30 1.60
Branched 1727 5.27 1.60
Mastery orientation Fixed 2070 5.51 1.44
Branched 1727 5.48 1.40
Planning Fixed 2070 4.63 1.67
Branched 1727 4.65 1.60
Task management Fixed 2070 5.78 1.34
Branched 1727 5.75 1.29
Persistence Fixed 2070 5.59 1.54
Branched 1727 5.52 1.49
Negative Motivation Anxiety Fixed 2070 3.39 1.90
Branched 1727 3.52 1.82
Failure avoidance Fixed 2070 5.59 1.58
Branched 1727 5.58 1.56
Uncertain control Fixed 2070 3.12 1.79
Branched 1727 3.20 1.76
Self-handicapping Fixed 2070 1.92 1.41
Branched 1727 1.92 1.35
Disengagement Fixed 2070 2.34 1.77
Branched 1727 2.34 1.66
Global Motivation Positive motivation Fixed 2070 5.34 0.98
Branched 1727 5.31 0.95
Negative motivation Fixed 2070 3.27 0.96
Branched 1727 3.31 0.91
Superscript pairs a & b significantly different at p<.001; Superscript pairs c & d significantly different at p<.05

Online NAPLAN and Student Motivation
© 2015 24
Table 6.3. Group differences in NAPLAN motivation: Fixed and Branched – Year 7
NALAN Motivation Group N Mean SD Positive Motivation Self-efficacy Fixed 1624 4.53 c 1.46
Branched 1287 4.68 d 1.25
Valuing Fixed 1624 4.57 1.64
Branched 1287 4.52 1.64
Mastery orientation Fixed 1624 4.97 1.50
Branched 1287 5.00 1.44
Planning Fixed 1624 4.28 1.56
Branched 1287 4.28 1.56
Task management Fixed 1624 5.26 1.43
Branched 1287 5.31 1.42
Persistence Fixed 1624 5.19 1.46
Branched 1287 5.25 1.42
Negative Motivation Anxiety Fixed 1624 3.23 1.74
Branched 1287 3.33 1.73
Failure avoidance Fixed 1624 5.11 1.64
Branched 1287 5.15 1.65
Uncertain control Fixed 1624 3.20 1.60
Branched 1287 3.19 1.59
Self-handicapping Fixed 1624 2.24 1.47
Branched 1287 2.15 1.39
Disengagement Fixed 1624 2.80 c 1.80
Branched 1287 2.65 d 1.69
Global Motivation Positive motivation Fixed 1624 4.80 1.11
Branched 1287 4.84 1.02
Negative motivation Fixed 1624 3.31 0.90
Branched 1287 3.29 0.86
Superscript pairs a & b significantly different at p<.001; Superscript pairs c & d significantly different at p<.05
Online NAPLAN and Student Motivation
© 2015 25
Table 6.4. Group differences in NAPLAN motivation: Fixed and Branched – Year 9
NALAN Motivation Group N Mean SD Positive Motivation Self-efficacy Fixed 1410 4.09 a 1.57
Branched 1061 4.30 b 1.38
Valuing Fixed 1410 3.63 1.70
Branched 1061 3.54 1.64
Mastery orientation Fixed 1410 4.34 1.61
Branched 1061 4.46 1.54
Planning Fixed 1410 3.80 1.60
Branched 1061 3.81 1.59
Task management Fixed 1410 4.72 1.56
Branched 1061 4.80 1.50
Persistence Fixed 1410 4.73 1.57
Branched 1061 4.82 1.56
Negative Motivation Anxiety Fixed 1410 2.89 c 1.73
Branched 1061 2.71 d 1.62
Failure avoidance Fixed 1410 4.28 1.70
Branched 1061 4.28 1.64
Uncertain control Fixed 1410 3.37 1.56
Branched 1061 3.28 1.54
Self-handicapping Fixed 1410 2.61 1.63
Branched 1061 2.62 1.59
Disengagement Fixed 1410 3.21 c 1.86
Branched 1061 2.98 d 1.73
Global Motivation Positive motivation Fixed 1410 4.22 1.17
Branched 1061 4.29 1.12
Negative motivation Fixed 1410 3.27 c 0.94
Branched 1061 3.17 d 0.88
Superscript pairs a & b significantly different at p<.001; Superscript pairs c & d significantly different at p<.05

Online NAPLAN and Student Motivation
© 2015 26
Table 7. Group differences in subjective NAPLAN experience: Fixed and Branched
Mean SD
Subjective NAPLAN Experience Fixed (N=3034) 4.34 a .99
Branched (N=2348) 4.48 b .86
Superscript pairs a & b significantly different at p<.001; Superscript pairs c & d significantly different at p<.05 Table 8. Group differences in subjective NAPLAN experience: Fixed and Branched, Years 7 and 9
Mean SD
Year 7 Fixed (N=1624) 4.50 c .97
Branched (N=1287) 4.59 d .86
Mean SD
Year 9
Fixed (N=1410) 4.14 a .97
Branched (N=1061) 4.35 b .84
Superscript pairs a & b significantly different at p<.001; Superscript pairs c & d significantly different at p<.05

Online NAPLAN and Student Motivation
© 2015 27
STUDY 2 RESULTS: STUDENTS’ MATHEMATICS MOTIVATION AND NAPLAN OUTCOMES
Study 2 investigates the school-specific (mathematics) motivation factors that are associated with students’ NAPLAN-specific motivation and performance for each of fixed and branched online test formats. As a function of fixed and branched conditions, it seeks to examine the association between students’ mathematics motivation coming into the online NAPLAN test and each of the following: students’ achievement in the test, students’ motivation while doing the test; and, students’ subjective experience (e.g., sense of clarity, confidence, comprehension) of the test. Pre-existing Differences in Mathematics Motivation It was first important to determine if there were pre-existing differences between fixed and branched groups in mathematics motivation. Average mathematics motivation scores for each group are presented in Table 9. Multivariate analysis of variance (MANOVA) was conducted to test whether a significant difference existed between groups. The multivariate effect was not significant, F(11, 12724)=1.49, p=.12, indicating no pre-existing differences between fixed and branched groups in mathematics motivation. The Relationship between Students’ Mathematics Motivation and NAPLAN Achievement We then examined the extent to which students’ mathematics motivation coming into the test was associated with their NAPLAN achievement. Pearson’s product moment correlations were used to assess these associations. Given the very large sample size (and the potential to erroneously conclude statistical significance), we emphasise the correlation coefficients (r) and the associated effect sizes (d) in these analyses (rather than the p-value). Here we focus on fixed and branched conditions for the total sample and for each year group. Correlations between mathematics motivation and NAPLAN achievement are presented in Table 10. As noted in Table 10 (and other correlation tables), correlations above |.50| can be considered ‘large’ effects, above |.30| are ‘medium’ effects, and above |.10| are ‘small’ effects (Cohen, 1988). For the sample as a whole (‘Total’ column), it is evident that positive mathematics motivation yields a ‘medium’ effect such that higher mathematics motivation is associated with higher NAPLAN achievement (global positive motivation, r=.37, p<.001). Self-efficacy is the positive mathematics motivation factor most strongly associated with NAPLAN achievement (r=.43, p<.001). Negative mathematics motivation also yields a ‘medium’ effect such that students higher in negative mathematics motivation score lower in the NAPLAN test (global negative motivation, r= -.30, p<.001). Disengagement is the negative mathematics motivation factor most strongly (negatively) associated with NAPLAN achievement (r = -.32, p<.001). Taken together, students’ mathematics motivation coming into the NAPLAN test is associated with their achievement in that test. Is mathematics motivation associated with NAPLAN achievement differently for fixed and branched groups? Table 10 also presents correlations between mathematics motivation and NAPLAN achievement separately for fixed and branched groups. There is predominant equivalence between the two groups, with positive (global) mathematics motivation correlated with NAPLAN achievement at r=.37, p<.001 for both groups; and, negative (global) mathematics motivation correlated with NAPLAN achievement at r= -.29, p<.001 and r= -.31, p<.001 for fixed and branched groups respectively. Thus, mathematics motivation coming into the test impacts NAPLAN achievement in similar ways for fixed and branched groups.

Online NAPLAN and Student Motivation
© 2015 28
Is mathematics motivation associated with NAPLAN achievement differently for different year groups? Table 11 presents correlations between mathematics motivation and NAPLAN achievement separately for fixed and branched conditions within each year group. Again, there is predominant equivalence between the two conditions as a function of year group. The correlation range across Years 3-9 for positive (global) mathematics motivation is r=.34, p<.001 to r=.39, p<.001 for the fixed group and r=.32, p<.001 to r=.42, p<.001 for the branched group. The correlation range across Years 3-9 for negative (global) mathematics motivation is r= -.24, p<.001 to r= -.32, p<.001 for the fixed group and r= -.27, p<.001 to r= -.35, p<.001 for the branched group. Thus, prior motivation impacts NAPLAN achievement similarly for fixed and branched groups within each year level. Interestingly, however, for both fixed and branched groups the role of positive mathematics motivation in NAPLAN achievement tends to be stronger for younger students (Years 3 and 5) while the role of negative mathematics motivation in students’ NAPLAN achievement tends to be stronger for older students (Years 5, 7, and 9). The Relationship between Students’ Mathematics Motivation and Motivation During the NAPLAN test We also explored the extent to which students’ mathematics motivation coming into the test was associated with their motivation while doing the test (NAPLAN motivation reported at the end of the test). Thus, for each dimension of mathematics motivation, we examined its correlation with the parallel NAPLAN motivation dimension. For example, we correlated mathematics self-efficacy with NAPLAN self-efficacy; mathematics valuing with NAPLAN valuing, and so on. Again, Pearson’s product moment correlations were employed and given the large sample size, we emphasise the correlation coefficients (r) and the associated effect sizes (d) in these analyses. Here we focus on fixed and branched conditions for the total sample and for each year group. Correlations between mathematics motivation and NAPLAN motivation are presented in Table 12. For the sample as a whole (‘Total’ column), it is evident that positive mathematics motivation yields a ‘large’ effect such that more positive mathematics motivation is associated with more positive NAPLAN motivation (global positive motivation, r=.58, p<.001). Negative mathematics motivation yields a ‘medium’ effect, such that students higher in negative mathematics motivation also score higher in negative NAPLAN motivation (global negative motivation, r=.40, p<.001). Taken together, students’ mathematics motivation coming into the NAPLAN test is associated with their motivation while doing that test. Is mathematics motivation associated with NAPLAN motivation differently for fixed and branched groups? Table 12 also presents correlations between mathematics motivation and NAPLAN motivation separately for fixed and branched groups. There is predominant equivalence between the two groups, with positive (global) mathematics motivation correlated with positive NAPLAN motivation at r=.59, p<.001 and r=.58, p<.001 for fixed and branched groups respectively; and, negative (global) mathematics motivation correlated with negative NAPLAN motivation at r=.41, p<.001 and r=.39, p<.001 for fixed and branched groups respectively. Thus, fixed and branched groups are similar in the extent to which mathematics motivation coming into the test is associated with motivation while doing the test. Is mathematics motivation associated with NAPLAN achievement differently for different year groups? Table 13 presents correlations between mathematics motivation and NAPLAN motivation separately for fixed and branched conditions within each year group. Again, there is predominant equivalence between the two conditions as a function of year group. The correlation range across Years 3-9 for positive (global) mathematics motivation is r=.48, p<.001 to r=.60, p<.001 for the fixed group and r=.48, p<.001 to r=.63, p<.001 for the branched group. The correlation range across Years 3-9 for negative (global) mathematics motivation is r=.32, p<.001 to r=.47, p<.001 for the

Online NAPLAN and Student Motivation
© 2015 29
fixed group and r=.32, p<.001 to r=.47, p<.001 for the branched group. Thus, mathematics motivation is associated with NAPLAN motivation in similar ways for fixed and branched groups within each year level. Interestingly, however, for both fixed and branched groups, the role of positive and negative mathematics motivation in NAPLAN motivation tends to be stronger for younger students (Years 3, 5, and 7). The Relationship between Students’ Mathematics Motivation and Subjective Experience of Online NAPLAN After completing all NAPLAN mathematics questions, Years 7 and 9 students were asked a series of questions exploring their subjective experience of the online test (items addressing ease of test items, the extent to which items matched their ability, the clarity of the test, their interest in test items, and test comprehensibility) that formed a ‘subjective experience’ factor, with students scoring high on this factor reflecting greater ease and comfort in their subjective experience of the online test and students scoring low on this factor reflecting less ease and comfort. We then examined the extent to which students’ mathematics motivation coming into the test was associated with their subjective experience. Again, we focus on fixed and branched conditions for the total sample and for each year group. Correlations between mathematics motivation and their subjective experience of the online test are presented in Table 14. For the sample as a whole (‘Total’ column), it is evident that positive mathematics motivation yields a ‘medium’ effect such that higher mathematics motivation is associated with a more positive subjective experience of the online test (global positive motivation, r=.49, p<.001). Self-efficacy is the positive mathematics motivation factor most strongly associated with a positive subjective experience (r=.44, p<.001). Negative mathematics motivation yields a ‘small’ effect such that students higher in negative mathematics motivation are less positive in their subjective experience of the online test (global negative motivation, r= -.29, p<.001). Disengagement is the negative mathematics motivation factor most strongly (negatively) associated with subjective experience (r = -.38, p<.001). Taken together, students’ mathematics motivation coming into the NAPLAN test is associated with their subjective experience of online NAPLAN; students higher in mathematics motivation report a more positive subjective experience of the online test. Is mathematics motivation associated with the subjective experience of online NAPLAN differently for fixed and branched groups? Table 14 also presents correlations between mathematics motivation and subjective experience separately for fixed and branched groups. There is predominant equivalence between the two groups, with positive (global) mathematics motivation correlated with subjective experience at r=.51, p<.001 and r=.47, p<.001 for fixed and branched groups respectively; and, negative (global) mathematics motivation correlated with NAPLAN achievement at r= -.28, p<.001 and r= -.30, p<.001 for fixed and branched groups respectively. Thus, mathematics motivation coming into the test impacts students’ subjective experience of that test in similar ways for fixed and branched groups. Is students’ mathematics motivation associated with their subjective experience of the online test differently for different year groups? Table 15 presents correlations between mathematics motivation and subjective NAPLAN experience separately for fixed and branched conditions within each year group. There is predominant equivalence between the two conditions as a function of year group (though, not as much here as there was for NAPLAN achievement and NAPLAN motivation, above). The respective correlations for Years 7 and 9 for positive (global) mathematics motivation are r=.55, p<.001 and r=.44, p<.001 for the fixed group and r=.48, p<.001 and r=.45, p<.001 for the branched group. The correlations for Years 7 and 9 for negative (global) mathematics motivation are r= -.34, p<.001 and r= -.21, p<.001 for the fixed group and r= -.27, p<.001 and r= -.31, p<.001

Online NAPLAN and Student Motivation
© 2015 30
for the branched group. Thus, mathematics motivation coming into the test impacts subjective experience in broadly similar ways for fixed and branched groups within each year level.

Online NAPLAN and Student Motivation
© 2015 31
Table 9. Average (pre-) mathematics motivation scores: Fixed and Branched Maths Motivation Group Mean SD
Positive Motivation
Self-efficacy Fixed 5.21 1.54 Branched 5.21 1.51
Valuing Fixed 5.79 1.38 Branched 5.73 1.43
Mastery orientation Fixed 5.32 1.45 Branched 5.34 1.44
Planning Fixed 4.52 1.67 Branched 4.51 1.67
Task management Fixed 5.19 1.47 Branched 5.18 1.48
Persistence Fixed 5.28 1.52 Branched 5.31 1.47
Negative Motivation
Anxiety Fixed 4.09 1.87 Branched 4.06 1.85
Failure avoidance Fixed 5.15 1.75 Branched 5.12 1.75
Uncertain control Fixed 3.39 1.81 Branched 3.35 1.81
Self-handicapping Fixed 2.80 1.75 Branched 2.82 1.75
Disengagement Fixed 3.01 1.92 Branched 2.98 1.90
Global Motivation
Positive motivation Fixed 5.22 1.06 Branched 5.21 1.05
Negative motivation Fixed 3.69 0.99 Branched 3.66 1.00
Superscript pairs a & b significantly different at p<.001; Superscript pairs c & d significantly different at p<.05

Online NAPLAN and Student Motivation
© 2015 32
Table 10. Correlation between mathematics motivation and NAPLAN achievement: Fixed and Branched
NAPLAN Achievement
Fixed (N=7152)
r Branched (N=5584)
r Total (N=12,736)
r
Positive Motivation
Self-efficacy .43 .43 .43
Valuing .24 .24 .24
Mastery orientation .29 .29 .29
Planning .08 .09 .08
Task management .23 .23 .23
Persistence .30 .32 .31
Negative Motivation
Anxiety -.17 -.16 -.16
Failure avoidance .21 .19 .20
Uncertain control -.24 -.27 -.25
Self-handicapping -.24 -.26 -.25
Disengagement -.32 -.32 -.32
Global Motivation
Positive motivation .37 .37 .37
Negative motivation -.29 -.31 -.30
Small effect size: r > |.10| Medium effect size: r > |.30| Large effect size: r > |.50|

Online NAPLAN and Student Motivation
© 2015 33
Table 11. Correlation between mathematics motivation and NAPLAN achievement: Fixed and Branched, Years 3 to 9
NAPLAN Achievement
Year 3 Fixed
(N=2048) r
Year 3 Branched (N=1509)
r
Year 5 Fixed
(N=2070) r
Year 5 Branched (N=1727)
r
Year 7 Fixed
(N=1624) r
Year 7 Branched (N=1287)
r
Year 9 Fixed
(N=1410) r
Year 9 Branched (N=1061)
r
Positive Motivation
Self-efficacy .36 .40 .45 .45 .45 .45 .47 .48
Valuing .30 .35 .27 .27 .19 .16 .19 .18 Mastery orientation
.28 .29 .29 .31 .30 .32 .30 .25
Planning .07 .11 .06 .09 .12 .09 .08 .06
Task management
.26 .28 .24 .26 .20 .24 .18 .16
Persistence .29 .30 .33 .35 .29 .31 .32 .33
Negative Motivation
Anxiety -.19 -.17 -.19 -.21 -.16 -.16 -.09 -.10
Failure avoidance
.21 .22 .23 .22 .27 .21 .14 .05
Uncertain control -.15 -.20 -.28 -.29 -.28 -.29 -.33 -.33
Self-sabotage -.27 -.28 -.29 -.34 -.22 -.24 -.14 -.18
Disengagement -.28 -.32 -.32 -.34 -.33 -.34 -.35 -.34
Global Motivation
Positive motivation
.38 .42 .39 .40 .34 .36 .35 .32
Negative motivation
-.24 -.27 -.32 -.35 -.29 -.32 -.31 -.34
Small effect size: r > |.10| Medium effect size: r > |.30| Large effect size: r > |.50|

Online NAPLAN and Student Motivation
© 2015 34
Table 12. Correlation between mathematics motivation and parallel dimensions of NAPLAN motivation: Fixed and Branched
Parallel Dimension of NAPLAN Motivation
(e.g., Maths self-efficacy correlated with NAPLAN self-efficacy)
Fixed (N=7152)
r Branched (N=5584)
r Total (N=12,736)
r
Positive Motivation
Self-efficacy 0.45 0.39 0.42
Valuing 0.34 0.37 0.35
Mastery orientation 0.37 0.35 0.36
Planning 0.34 0.36 0.34
Task management 0.40 0.36 0.39
Persistence 0.37 0.36 0.37
Negative Motivation
Anxiety 0.34 0.33 0.33
Failure avoidance 0.22 0.22 0.22
Uncertain control 0.32 0.32 0.32
Self-handicapping 0.32 0.30 0.31
Disengagement 0.42 0.40 0.41
Global Motivation
Positive motivation 0.59 0.58 0.58
Negative motivation 0.41 0.39 0.40
Small effect size: r > |.10| Medium effect size: r > |.30| Large effect size: r > |.50|

Online NAPLAN and Student Motivation
© 2015 35
Table 13. Correlation between mathematics motivation and parallel dimensions of NAPLAN motivation: Fixed and Branched, Years 3 to 9
Parallel Dimension of NAPLAN Motivation (e.g., Maths self-efficacy correlated with NAPLAN self-efficacy)
Year 3 Fixed
(N=2048) r
Year 3 Branched (N=1509)
r
Year 5 Fixed
(N=2070) r
Year 5 Branched (N=1727)
r
Year 7 Fixed
(N=1624) r
Year 7 Branched (N=1287)
r
Year 9 Fixed
(N=1410) r
Year 9 Branched (N=1061)
r
Positive Motivation
Self-efficacy 0.37 0.36 0.48 0.39 0.47 0.39 0.41 0.39
Valuing 0.29 0.36 0.26 0.29 0.33 0.32 0.29 0.35
Mastery orientation
0.35 0.37 0.38 0.31 0.38 0.36 0.34 0.31
Planning 0.30 0.36 0.34 0.40 0.35 0.32 0.32 0.29
Task management
0.42 0.36 0.36 0.33 0.39 0.31 0.31 0.33
Persistence 0.32 0.34 0.37 0.39 0.44 0.34 0.34 0.34
Negative Motivation
Anxiety 0.32 0.33 0.45 0.43 0.34 0.37 0.28 0.26
Failure avoidance
0.24 0.28 0.27 0.27 0.30 0.23 0.18 0.14
Uncertain control 0.26 0.28 0.37 0.38 0.40 0.35 0.30 0.28
Self-handicapping
0.32 0.30 0.31 0.33 0.31 0.26 0.26 0.27
Disengagement 0.39 0.41 0.44 0.43 0.42 0.34 0.35 0.31
Global Motivation
Positive motivation
0.60 0.63 0.60 0.59 0.58 0.54 0.48 0.48
Negative motivation
0.42 0.43 0.47 0.47 0.42 0.39 0.32 0.32
Small effect size: r > |.10| Medium effect size: r > |.30| Large effect size: r > |.50|
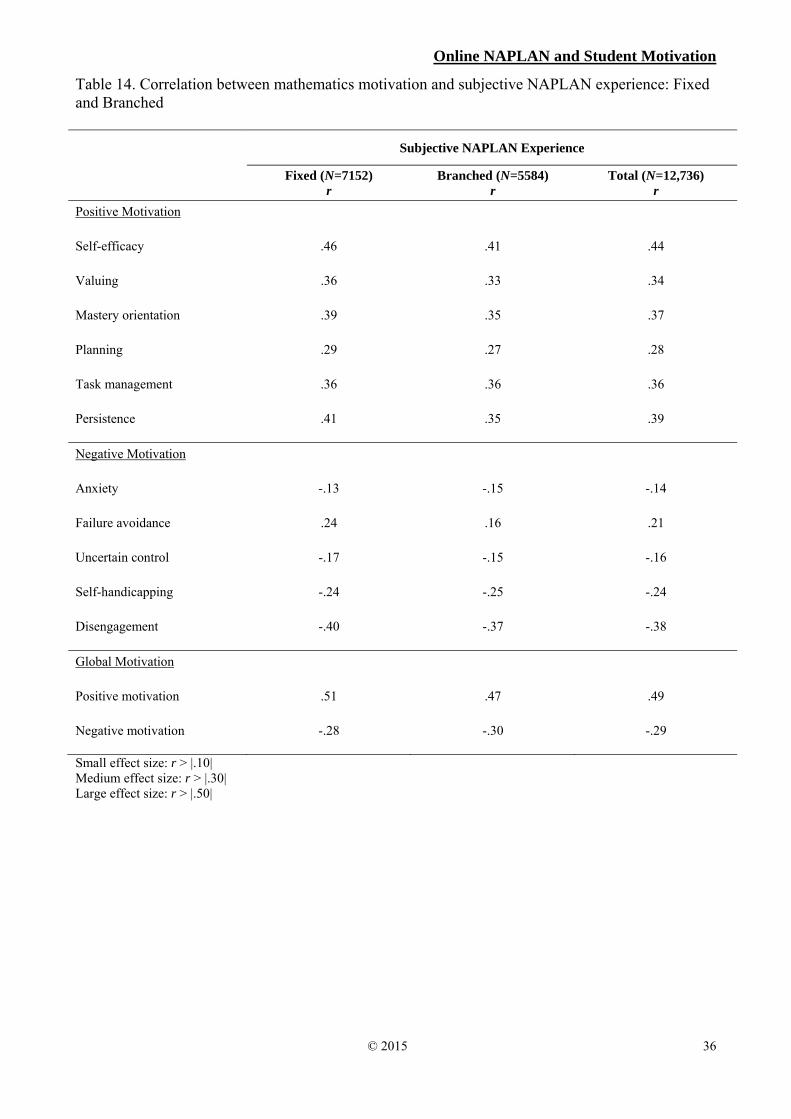
Online NAPLAN and Student Motivation
© 2015 36
Table 14. Correlation between mathematics motivation and subjective NAPLAN experience: Fixed and Branched
Subjective NAPLAN Experience
Fixed (N=7152)
r Branched (N=5584)
r Total (N=12,736)
r
Positive Motivation
Self-efficacy .46 .41 .44
Valuing .36 .33 .34
Mastery orientation .39 .35 .37
Planning .29 .27 .28
Task management .36 .36 .36
Persistence .41 .35 .39
Negative Motivation
Anxiety -.13 -.15 -.14
Failure avoidance .24 .16 .21
Uncertain control -.17 -.15 -.16
Self-handicapping -.24 -.25 -.24
Disengagement -.40 -.37 -.38
Global Motivation
Positive motivation .51 .47 .49
Negative motivation -.28 -.30 -.29
Small effect size: r > |.10| Medium effect size: r > |.30| Large effect size: r > |.50|

Online NAPLAN and Student Motivation
© 2015 37
Table 15. Correlation between mathematics motivation and subjective NAPLAN experience: Fixed and Branched, Years 7 and 9
Subjective NAPLAN Experience
Year 7 Fixed
(N=1624) r
Year 7 Branched (N=1287)
r
Year 9 Fixed
(N=1410) r
Year 9 Branched (N=1061)
r
Positive Motivation
Self-efficacy .49 .41 .43 .41
Valuing .39 .29 .29 .33
Mastery orientation .42 .36 .34 .35
Planning .30 .28 .26 .25
Task management .41 .36 .28 .33
Persistence .47 .35 .34 .35
Negative Motivation
Anxiety -.17 -.17 -.07 -.11
Failure avoidance .26 .19 .22 .11
Uncertain control -.21 -.13 -.15 -.20
Self-handicapping -.30 -.27 -.14 -.22
Disengagement -.44 -.32 -.33 -.40
Global Motivation
Positive motivation .55 .48 .44 .45
Negative motivation -.34 -.27 -.21 -.31
Small effect size: r > |.10| Medium effect size: r > |.30| Large effect size: r > |.50|
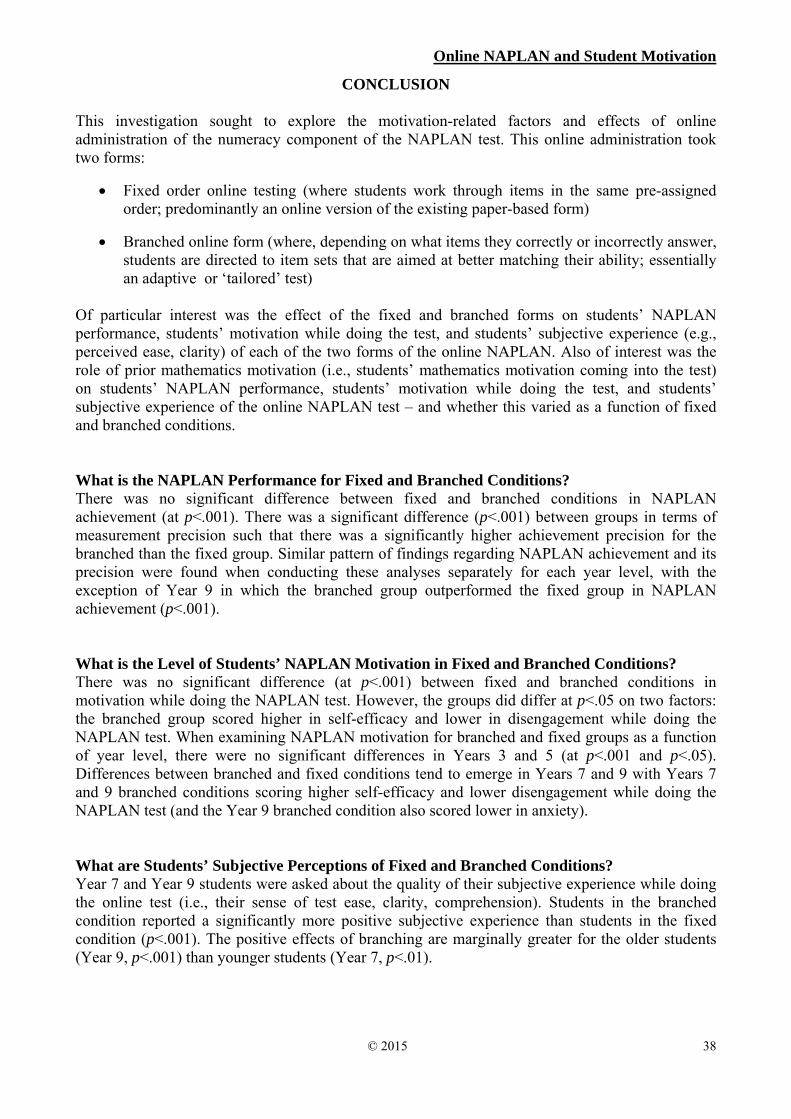
Online NAPLAN and Student Motivation
© 2015 38
CONCLUSION This investigation sought to explore the motivation-related factors and effects of online administration of the numeracy component of the NAPLAN test. This online administration took two forms:
Fixed order online testing (where students work through items in the same pre-assigned order; predominantly an online version of the existing paper-based form)
Branched online form (where, depending on what items they correctly or incorrectly answer, students are directed to item sets that are aimed at better matching their ability; essentially an adaptive or ‘tailored’ test)
Of particular interest was the effect of the fixed and branched forms on students’ NAPLAN performance, students’ motivation while doing the test, and students’ subjective experience (e.g., perceived ease, clarity) of each of the two forms of the online NAPLAN. Also of interest was the role of prior mathematics motivation (i.e., students’ mathematics motivation coming into the test) on students’ NAPLAN performance, students’ motivation while doing the test, and students’ subjective experience of the online NAPLAN test – and whether this varied as a function of fixed and branched conditions. What is the NAPLAN Performance for Fixed and Branched Conditions? There was no significant difference between fixed and branched conditions in NAPLAN achievement (at p<.001). There was a significant difference (p<.001) between groups in terms of measurement precision such that there was a significantly higher achievement precision for the branched than the fixed group. Similar pattern of findings regarding NAPLAN achievement and its precision were found when conducting these analyses separately for each year level, with the exception of Year 9 in which the branched group outperformed the fixed group in NAPLAN achievement (p<.001). What is the Level of Students’ NAPLAN Motivation in Fixed and Branched Conditions? There was no significant difference (at p<.001) between fixed and branched conditions in motivation while doing the NAPLAN test. However, the groups did differ at p<.05 on two factors: the branched group scored higher in self-efficacy and lower in disengagement while doing the NAPLAN test. When examining NAPLAN motivation for branched and fixed groups as a function of year level, there were no significant differences in Years 3 and 5 (at p<.001 and p<.05). Differences between branched and fixed conditions tend to emerge in Years 7 and 9 with Years 7 and 9 branched conditions scoring higher self-efficacy and lower disengagement while doing the NAPLAN test (and the Year 9 branched condition also scored lower in anxiety). What are Students’ Subjective Perceptions of Fixed and Branched Conditions? Year 7 and Year 9 students were asked about the quality of their subjective experience while doing the online test (i.e., their sense of test ease, clarity, comprehension). Students in the branched condition reported a significantly more positive subjective experience than students in the fixed condition (p<.001). The positive effects of branching are marginally greater for the older students (Year 9, p<.001) than younger students (Year 7, p<.01).

Online NAPLAN and Student Motivation
© 2015 39
What is the Relationship between Students’ Prior Mathematics Motivation and their NAPLAN Achievement? Positive mathematics motivation coming into the test yields a ‘medium’ effect such that higher (prior) mathematics motivation is associated with higher NAPLAN achievement (global positive motivation, r=.37, p<.001). Self-efficacy is the positive mathematics motivation factor most strongly associated with NAPLAN achievement (r=.43, p<.001). Negative mathematics motivation also yields a ‘medium’ effect such that students higher in negative mathematics motivation score lower in the NAPLAN test (global negative motivation, r= -.30, p<.001). Disengagement is the negative mathematics motivation factor most strongly (negatively) associated with NAPLAN achievement (r = -.32, p<.001). Mathematics motivation coming into the test impacts NAPLAN achievement in similar ways for fixed and branched groups. Further, prior mathematics motivation impacts NAPLAN achievement similarly for fixed and branched groups within each year level. What is the Relationship between Students’ Prior Mathematics Motivation and their Motivation During the NAPLAN test? Positive mathematics motivation coming into the test yields a ‘large’ effect such that more positive (prior) mathematics motivation is associated with more positive NAPLAN motivation (global positive motivation, r=.58, p<.001). Negative mathematics motivation yields a ‘medium’ effect, such that students higher in negative mathematics motivation also score higher in negative NAPLAN motivation (global negative motivation, r=.40, p<.001). Fixed and branched groups are similar in the extent to which mathematics motivation coming into the test is associated with motivation while doing the test. In addition, prior mathematics motivation impacts NAPLAN motivation in similar ways for fixed and branched groups within each year level. What is the Relationship between Students’ Prior Mathematics Motivation and their Subjective Experience of the Online NAPLAN Test? Positive mathematics motivation coming into the test yields a ‘medium’ effect such that higher (prior) mathematics motivation is associated with a more positive subjective experience of the online test (global positive motivation, r=.49, p<.001). Self-efficacy is the positive mathematics motivation factor most strongly associated with a positive subjective experience (r=.44, p<.001). Negative mathematics motivation yields a ‘small’ effect such that students higher in negative mathematics motivation are less positive in their subjective experience of the online test (global negative motivation, r= -.29, p<.001). Disengagement is the negative mathematics motivation factor most strongly (negatively) associated with subjective experience (r = -.38, p<.001). Mathematics motivation coming into the test impacts students’ subjective experience of that test in similar ways for fixed and branched groups. In addition, mathematics motivation coming into the test impacts subjective experience in broadly similar ways for fixed and branched groups within each year level. Summary This research has shown that motivation is a relevant factor in students’ performance in NAPLAN, the effects of fixed and branched online NAPLAN approaches, and students’ subjective experience of the online NAPLAN test. It is evident that fixed and branched online NAPLAN test formats yield generally similar achievement scores, but the branched approach yields significantly more accurate measurement of student achievement in NAPLAN online tests. It appears that the branched condition gives rise to greater self-efficacy and lower disengagement, particularly for older students (Years 7 and 9). The branched condition is also associated with more positive subjective experience of NAPLAN (greater sense of ease, clarity, and comfort). Students’ mathematics motivation coming into the NAPLAN test is associated with higher achievement in the test, but this does not vary as a function of fixed and branched conditions. Students’ mathematics motivation coming into the test is

Online NAPLAN and Student Motivation
© 2015 40
also associated with greater motivation and positive subjective experience while doing the test, but this does not vary as a function of fixed and branched conditions. Taken together, through an assessment of two online NAPLAN test formats (fixed and branched conditions), this research sheds further light on the effects of adaptive online testing and extends current understanding beyond NAPLAN performance outcomes to the important area of student motivation.

Online NAPLAN and Student Motivation
© 2015 41
REFERENCES Atkinson, J.W. (1957). Motivational determinants of risk-taking. Psychological Review, 64, 359-372.
http://dx.doi.org/10.1037/h0043445 Australian Curriculum, Assessment and Reporting Authority (ACARA) (2013). Fact sheet: Moving
NAPLAN online – ACARA research and findings. Sydney: ACARA Australian, Curriculum, Assessment and Reporting Authority (ACARA) (2014a). NAPLAN: National
Protocols for Test Administration 2014. Retrieved from http://www.nap.edu.au/verve/_resources/D14_658__UPDATED_FINAL_2014_National_Protocols_for_Test_Administration.pdf
Australian Curriculum, Assessment and Reporting Authority (ACARA) (2014b). National Assessment and Surveys Online Program: Tailored test design 2013 research study summary. Sydney: ACARA.
Australian Curriculum, Assessment and Reporting Authority (ACARA) (2014c). Tailored test design study 2013: Summary research report. Sydney: ACARA.
Bandura, A. (1997). Self-efficacy: The exercise of control. New York: Freeman & Co. Clark, L. (2004). Computerized adaptive testing: Effective measurement for all students.
Technological Horizons in Education Journal, 31, 14–16. Cohen, J. (1988). Statistical power analysis for the behavioral sciences (2nd ed.), New Jersey:
Lawrence Erlbaum Associates. Connell, J.P. (1985). A new multidimensional measure of children's perceptions of control. Child
Development, 56, 1018-1041. http://dx.doi.org/10.2307/1130113 Covington, M.V. (1992). Making the grade: A self-worth perspective on motivation and school
reform. Cambridge: Cambridge University Press. http://dx.doi.org/10.1017/CBO9781139173582
Davey, T. (2011). A guide to computer adaptive testing systems. Washington, DC: Council of Chief State School Officers.
Drenth, P.J.D., Thierry, H., & de Wolff, C.J. (Eds.). (1998). Handbook of work and organizational psychology. Vol 4. East Sussex, UK: Psychology Press
Duda, J.L. (2001). Achievement goal research in sport: Pushing the boundaries and clarifying some misunderstandings. In G.C. Roberts (Eds.), Advances in motivation in sport and exercise (pp. 129-182). Champaign, IL: Human Kinetics.
Green, J. Martin, A.J., & Marsh, H.W. (2007). Motivation and engagement in English, mathematics and science high school subjects: Towards an understanding of multidimensional domain specificity. Learning and Individual Differences, 17, 269-279. http://dx.doi.org/10.1016/j.lindif.2006.12.003
Hausler, J., & Sommer, M. (2008). The effect of success probability on test economy and self-confidence in computerized adaptive tests. Psychology Science Quarterly, 50, 75–87.
Hendrickson, A. (2007). An NCME instructional module on multistage testing. Educational Measurement: Issues and Practice, 26, 44–52. http://dx.doi.org/10.1111/j.1745-3992.2007.00093.x
Kaplan, A., & Maehr, M.L. (2007). The contribution and prospects of goal orientation theory. Educational Psychology Review, 19, 141-184. http://dx.doi.org/10.1007/s10648-006-9012-5
Kingsbury, G. G., & Houser, R. L. (1999). Developing computerized adaptive tests for school children. In F. Drasgow & J. B. Olson-Buchanan (Eds.), Innovations in computerized assessment (pp. 93–115). Mahwah, NJ: Erlbaum.
Lazendic, G., & Adams, JR (2014). Multistage test design incorporating vertical scale. Paper presented at the Annual Meeting of the National Council on Measurement in Education, Philadelphia, USA.
Liem, G.A., & Martin, A.J. (2012). The Motivation and Engagement Scale: Theoretical framework, psychometric properties, and applied yields. Australian Psychologist, 47, 3-13.
Online NAPLAN and Student Motivation
© 2015 42
http://dx.doi.org/10.1111/j.1742-9544.2011.00049.x Little, R. (1988). Missing-data adjustments in large surveys. Journal of Business and Economic
Statistics, 6, 287-296. http://dx.doi.org/10.2307/1391878
Lord, F.M. (1971a). A theoretical study of the measurement effectiveness of flexilevel tests. Educational and Psychological Measurement, 31, 805–813. http://dx.doi.org/10.1177/001316447103100401
Lord, F.M. (1971b). A theoretical study of two-stage testing. Psychometrika, 36, 227–242. http://dx.doi.org/10.1007/BF02297844
Lord, F.M. (1971c). Tailored testing, an approximation of stochastic approximation. Journal of the American Statistical Association, 66, 707–711. http://dx.doi.org/10.1080/01621459.1971.10482333
Lowrie, T., & Logan T. (2013). NAPLAN online: Trial of tailored test design – numeracy cognitive interviews. Research Institute for Professional Practice, Learning and Education, Charles Sturt University, Wagga Wagga.
Mardberg, B., & Carlstedt, B. (1998). Swedish Enlistment Battery: Construct validity and latent variable estimation of cognitive abilities by the CAT-SEB. International Journal of Selection and Assessment, 6, 107–114. http://dx.doi.org/10.1111/1468-2389.00079
Martin, A.J. (2007). Examining a multidimensional model of student motivation and engagement using a construct validation approach. British Journal of Educational Psychology, 77, 413-440. http://dx.doi.org/10.1348/000709906X118036
Martin, A.J. (2008a). How domain specific is motivation and engagement across school, sport, and music? A substantive-methodological synergy assessing young sportspeople and musicians. Contemporary Educational Psychology, 33, 785-813. http://dx.doi.org/10.1016/j.cedpsych.2008.01.002
Martin, A.J. (2008b). Motivation and engagement in diverse performance settings: Testing their generality across school, university/college, work, sport, music, and daily life. Journal of Research in Personality, 42, 1607-1612. http://dx.doi.org/10.1016/j.jrp.2008.05.003
Martin, A.J. (2008c). Motivation and engagement in music and sport: Testing a multidimensional framework in diverse performance settings. Journal of Personality, 76, 135-170. http://dx.doi.org/10.1111/j.1467-6494.2007.00482.x
Martin, A.J. (2009). Motivation and engagement across the academic lifespan: A developmental construct validity study of elementary school, high school, and university/college students. Educational and Psychological Measurement, 69, 794-824. http://dx.doi.org/10.1177/0013164409332214
Martin, A. J. (2010). Building classroom success: Eliminating academic fear and failure. London: Continuum.
Martin, A.J. (2014). The Motivation and Engagement Scale (14th Ed.). Sydney, NSW: Lifelong Achievement Group (www.lifelongachievement.com).
Martin, A.J., Anderson, J., Bobis, J., Way, J., & Vellar, R. (2012). Switching on and switching off in mathematics: An ecological study of future intent and disengagement amongst middle school students. Journal of Educational Psychology, 104, 1-18. http://dx.doi.org/10.1037/a0025988
Martin, A.J., Bobis, J., Anderson, J., Way, J., & Vellar, R. (2011). Patterns of multilevel variance in psycho-educational phenomena: Exploring motivation, engagement, climate, teacher, and achievement factors. German Journal of Educational Psychology / Zeitschrift für Pädagogische Psychologie, 25, 49-61. http://dx.doi.org/10.1024/1010-0652/a000029
Martin, A.J., Way, J., Bobis, J., & Anderson, J. (2015). Exploring the ups and downs of mathematics engagement in the middle years of school. Journal of Early Adolescence, 35, 199-244. http://dx.doi.org/10.1177/0272431614529365
Ministerial Council on Education, Employment, Training and Youth Affairs. (MCEETYA) (2006). Statements of Learning for Mathematics. Retrieved from:
Online NAPLAN and Student Motivation
© 2015 43
http://www.curriculum.edu.au/verve/_resources/SOL_Maths_Copyright_update200 8.pdf
Moreno, K. E., & Segall, O. D. (1997). Reliability and construct validity of CAT-ASVAB. In W. A. Sands, B. K. Waters, & J. R. McBride (Eds.), Computerized adaptive testing: From inquiry to operation (pp. 169–179). Washington, DC: American Psychological Association. http://dx.doi.org/10.1037/10244-018
Parshall, C. G., Spray, J. A., Kalohn, J. C., & Davey, T. C. (2002). Practical considerations in computer-based testing. New York, NY: Springer-Verlag. http://dx.doi.org/10.1007/978-1-4613-0083-0
Pintrich, P.R., & Garcia, T. (1991). Student goal orientation and self-regulation in the college classroom. In M. Maehr & P.R. Pintrich (Eds.). Advances in motivation and achievement: Goals and self-regulatory processes (Vol. 7 pp. 371-402). Greenwich, CT: JAI Press.
Rasch, G. (1960/1980). Probabilistic models for some intelligence and attainment tests. Chicago: University of Chicago Press.
Ryan, R.M., & Deci, E.L. (2000). Self-determination theory and the facilitation of intrinsic motivation, social development, and well-being. American Psychologist, 55, 68-78. http://dx.doi.org/10.1037/0003-066X.55.1.68
Schunk, D.H., Pintrich, P.R., & Meece, J.L. (2008). Motivation in education. Upper Saddle River, NJ: Pearson Education.
Stone, E., & Davey, T. (2011). Computer-adaptive testing for students with disabilities: A review of the literature. New Jersey: Educational Testing Service.
Thompson, N.A., & Weiss, D.J. (2011). A framework for the development of computerized adaptive tests. Practical Assessment, Research and Evaluation, 16, 1-9.
Thurlow, M., Lazarus, S. S., Albus, D., & Hodgson, J. (2010). Computer-based testing: Practices and considerations (Synthesis Report No. 78). Minneapolis: University of Minnesota, National Center on Educational Outcomes.
Van Buuren, S. (2012). Flexible imputation of missing data. Chapman & Hall/CRC. http://dx.doi.org/10.1201/b11826
Van Buuren, S., & Groothuis-Oudshoorn, C. (2011). MICE: Multivariate Imputation by Chained Equations in R. Journal of Statistical Software, 45, 1-67.
van der Linden, W. J., & Glas, C. A. W. (2010). Preface. In W. van der Linden & C. Glas (Eds.), Elements of adaptive testing (pp. v–vii). New York, NY: Springer. http://dx.doi.org/10.1007/978-0-387-85461-8
van der Linden, W. J., & Pashley, P. J. (2010). Item selection and ability estimation in adaptive testing. In W. van der Linden & C. Glas (Eds.), Elements of adaptive testing (pp. 3–30). New York, NY: Springer. http://dx.doi.org/10.1007/978-0-387-85461-8
Way, W.D., Twing, J.S., Camara, W., Sweeney, K., Lazer, S., & Mazzeo, J. (2010). Some considerations related to the use of adaptive testing for the common core assessments. New Jersey: Educational Testing Service.
Weiner, B. (1994). Integrating social and personal theories of achievement striving. Review of Educational Research, 64, 557-573. http://dx.doi.org/10.3102/00346543064004557
Weiss, D.J. (2004). Computerized adaptive testing for effective and efficient measurement in counseling and education. Measurement and Evaluation in Counseling and Development, 37, 70-84.
Wigfield, A., & Eccles, J.S. (2000). Expectancy-value theory of motivation. Contemporary Educational Psychology, 25, 68-81. http://dx.doi.org/10.1006/ceps.1999.1015
Zimmerman, B.J. (2008). Investigating self-regulation and motivation: Historical background, methodological developments, and future prospects. American Educational Research Journal, 45, 166-183. http://dx.doi.org/10.3102/0002831207312909