online edition (c)2009 cambridge up - stanford nlp group · depends very strongly on user interface...
TRANSCRIPT
Online edition (c)2009 Cambridge UP
DRAFT! © April 1, 2009 Cambridge University Press. Feedback welcome. 151
8 Evaluation in information
retrieval
We have seen in the preceding chapters many alternatives in designing an IRsystem. How do we know which of these techniques are effective in whichapplications? Should we use stop lists? Should we stem? Should we use in-verse document frequency weighting? Information retrieval has developedas a highly empirical discipline, requiring careful and thorough evaluation todemonstrate the superior performance of novel techniques on representativedocument collections.
In this chapter we begin with a discussion of measuring the effectivenessof IR systems (Section 8.1) and the test collections that are most often usedfor this purpose (Section 8.2). We then present the straightforward notion ofrelevant and nonrelevant documents and the formal evaluation methodol-ogy that has been developed for evaluating unranked retrieval results (Sec-tion 8.3). This includes explaining the kinds of evaluation measures thatare standardly used for document retrieval and related tasks like text clas-sification and why they are appropriate. We then extend these notions anddevelop further measures for evaluating ranked retrieval results (Section 8.4)and discuss developing reliable and informative test collections (Section 8.5).
We then step back to introduce the notion of user utility, and how it is ap-proximated by the use of document relevance (Section 8.6). The key utilitymeasure is user happiness. Speed of response and the size of the index arefactors in user happiness. It seems reasonable to assume that relevance ofresults is the most important factor: blindingly fast, useless answers do notmake a user happy. However, user perceptions do not always coincide withsystem designers’ notions of quality. For example, user happiness commonlydepends very strongly on user interface design issues, including the layout,clarity, and responsiveness of the user interface, which are independent ofthe quality of the results returned. We touch on other measures of the qual-ity of a system, in particular the generation of high-quality result summarysnippets, which strongly influence user utility, but are not measured in thebasic relevance ranking paradigm (Section 8.7).

Online edition (c)2009 Cambridge UP
152 8 Evaluation in information retrieval
8.1 Information retrieval system evaluation
To measure ad hoc information retrieval effectiveness in the standard way,we need a test collection consisting of three things:
1. A document collection
2. A test suite of information needs, expressible as queries
3. A set of relevance judgments, standardly a binary assessment of eitherrelevant or nonrelevant for each query-document pair.
The standard approach to information retrieval system evaluation revolvesaround the notion of relevant and nonrelevant documents. With respect to aRELEVANCE
user information need, a document in the test collection is given a binaryclassification as either relevant or nonrelevant. This decision is referred to asthe gold standard or ground truth judgment of relevance. The test documentGOLD STANDARD
GROUND TRUTH collection and suite of information needs have to be of a reasonable size:you need to average performance over fairly large test sets, as results arehighly variable over different documents and information needs. As a ruleof thumb, 50 information needs has usually been found to be a sufficientminimum.
Relevance is assessed relative to an information need, not a query. ForINFORMATION NEED
example, an information need might be:
Information on whether drinking red wine is more effective at reduc-ing your risk of heart attacks than white wine.
This might be translated into a query such as:
wine AND red AND white AND heart AND attack AND effective
A document is relevant if it addresses the stated information need, not be-cause it just happens to contain all the words in the query. This distinction isoften misunderstood in practice, because the information need is not overt.But, nevertheless, an information need is present. If a user types python into aweb search engine, they might be wanting to know where they can purchasea pet python. Or they might be wanting information on the programminglanguage Python. From a one word query, it is very difficult for a system toknow what the information need is. But, nevertheless, the user has one, andcan judge the returned results on the basis of their relevance to it. To evalu-ate a system, we require an overt expression of an information need, whichcan be used for judging returned documents as relevant or nonrelevant. Atthis point, we make a simplification: relevance can reasonably be thoughtof as a scale, with some documents highly relevant and others marginallyso. But for the moment, we will use just a binary decision of relevance. We
Online edition (c)2009 Cambridge UP
8.2 Standard test collections 153
discuss the reasons for using binary relevance judgments and alternatives inSection 8.5.1.
Many systems contain various weights (often known as parameters) thatcan be adjusted to tune system performance. It is wrong to report results ona test collection which were obtained by tuning these parameters to maxi-mize performance on that collection. That is because such tuning overstatesthe expected performance of the system, because the weights will be set tomaximize performance on one particular set of queries rather than for a ran-dom sample of queries. In such cases, the correct procedure is to have oneor more development test collections, and to tune the parameters on the devel-DEVELOPMENT TEST
COLLECTION opment test collection. The tester then runs the system with those weightson the test collection and reports the results on that collection as an unbiasedestimate of performance.
8.2 Standard test collections
Here is a list of the most standard test collections and evaluation series. Wefocus particularly on test collections for ad hoc information retrieval systemevaluation, but also mention a couple of similar test collections for text clas-sification.
The Cranfield collection. This was the pioneering test collection in allowingCRANFIELD
precise quantitative measures of information retrieval effectiveness, butis nowadays too small for anything but the most elementary pilot experi-ments. Collected in the United Kingdom starting in the late 1950s, it con-tains 1398 abstracts of aerodynamics journal articles, a set of 225 queries,and exhaustive relevance judgments of all (query, document) pairs.
Text Retrieval Conference (TREC). The U.S. National Institute of StandardsTREC
and Technology (NIST) has run a large IR test bed evaluation series since1992. Within this framework, there have been many tracks over a rangeof different test collections, but the best known test collections are theones used for the TREC Ad Hoc track during the first 8 TREC evaluationsbetween 1992 and 1999. In total, these test collections comprise 6 CDscontaining 1.89 million documents (mainly, but not exclusively, newswirearticles) and relevance judgments for 450 information needs, which arecalled topics and specified in detailed text passages. Individual test col-lections are defined over different subsets of this data. The early TRECseach consisted of 50 information needs, evaluated over different but over-lapping sets of documents. TRECs 6–8 provide 150 information needsover about 528,000 newswire and Foreign Broadcast Information Servicearticles. This is probably the best subcollection to use in future work, be-cause it is the largest and the topics are more consistent. Because the test

Online edition (c)2009 Cambridge UP
154 8 Evaluation in information retrieval
document collections are so large, there are no exhaustive relevance judg-ments. Rather, NIST assessors’ relevance judgments are available only forthe documents that were among the top k returned for some system whichwas entered in the TREC evaluation for which the information need wasdeveloped.
In more recent years, NIST has done evaluations on larger document col-lections, including the 25 million page GOV2 web page collection. FromGOV2
the beginning, the NIST test document collections were orders of magni-tude larger than anything available to researchers previously and GOV2is now the largest Web collection easily available for research purposes.Nevertheless, the size of GOV2 is still more than 2 orders of magnitudesmaller than the current size of the document collections indexed by thelarge web search companies.
NII Test Collections for IR Systems (NTCIR). The NTCIR project has builtNTCIR
various test collections of similar sizes to the TREC collections, focus-ing on East Asian language and cross-language information retrieval, whereCROSS-LANGUAGE
INFORMATION
RETRIEVALqueries are made in one language over a document collection containingdocuments in one or more other languages. See: http://research.nii.ac.jp/ntcir/data/data-en.html
Cross Language Evaluation Forum (CLEF). This evaluation series has con-CLEF
centrated on European languages and cross-language information retrieval.See: http://www.clef-campaign.org/
Reuters-21578 and Reuters-RCV1. For text classification, the most used testREUTERS
collection has been the Reuters-21578 collection of 21578 newswire arti-cles; see Chapter 13, page 279. More recently, Reuters released the muchlarger Reuters Corpus Volume 1 (RCV1), consisting of 806,791 documents;see Chapter 4, page 69. Its scale and rich annotation makes it a better basisfor future research.
20 Newsgroups. This is another widely used text classification collection,20 NEWSGROUPS
collected by Ken Lang. It consists of 1000 articles from each of 20 Usenetnewsgroups (the newsgroup name being regarded as the category). Afterthe removal of duplicate articles, as it is usually used, it contains 18941articles.
8.3 Evaluation of unranked retrieval sets
Given these ingredients, how is system effectiveness measured? The twomost frequent and basic measures for information retrieval effectiveness areprecision and recall. These are first defined for the simple case where an
Online edition (c)2009 Cambridge UP
8.3 Evaluation of unranked retrieval sets 155
IR system returns a set of documents for a query. We will see later how toextend these notions to ranked retrieval situations.
Precision (P) is the fraction of retrieved documents that are relevantPRECISION
Precision =#(relevant items retrieved)
#(retrieved items)= P(relevant|retrieved)(8.1)
Recall (R) is the fraction of relevant documents that are retrievedRECALL
Recall =#(relevant items retrieved)
#(relevant items)= P(retrieved|relevant)(8.2)
These notions can be made clear by examining the following contingencytable:
(8.3)Relevant Nonrelevant
Retrieved true positives (tp) false positives (fp)Not retrieved false negatives (fn) true negatives (tn)
Then:
P = tp/(tp + f p)(8.4)
R = tp/(tp + f n)
An obvious alternative that may occur to the reader is to judge an infor-mation retrieval system by its accuracy, that is, the fraction of its classifica-ACCURACY
tions that are correct. In terms of the contingency table above, accuracy =(tp + tn)/(tp + f p + f n + tn). This seems plausible, since there are two ac-tual classes, relevant and nonrelevant, and an information retrieval systemcan be thought of as a two-class classifier which attempts to label them assuch (it retrieves the subset of documents which it believes to be relevant).This is precisely the effectiveness measure often used for evaluating machinelearning classification problems.
There is a good reason why accuracy is not an appropriate measure forinformation retrieval problems. In almost all circumstances, the data is ex-tremely skewed: normally over 99.9% of the documents are in the nonrele-vant category. A system tuned to maximize accuracy can appear to performwell by simply deeming all documents nonrelevant to all queries. Even if thesystem is quite good, trying to label some documents as relevant will almostalways lead to a high rate of false positives. However, labeling all documentsas nonrelevant is completely unsatisfying to an information retrieval systemuser. Users are always going to want to see some documents, and can be

Online edition (c)2009 Cambridge UP
156 8 Evaluation in information retrieval
assumed to have a certain tolerance for seeing some false positives provid-ing that they get some useful information. The measures of precision andrecall concentrate the evaluation on the return of true positives, asking whatpercentage of the relevant documents have been found and how many falsepositives have also been returned.
The advantage of having the two numbers for precision and recall is thatone is more important than the other in many circumstances. Typical websurfers would like every result on the first page to be relevant (high preci-sion) but have not the slightest interest in knowing let alone looking at everydocument that is relevant. In contrast, various professional searchers such asparalegals and intelligence analysts are very concerned with trying to get ashigh recall as possible, and will tolerate fairly low precision results in order toget it. Individuals searching their hard disks are also often interested in highrecall searches. Nevertheless, the two quantities clearly trade off against oneanother: you can always get a recall of 1 (but very low precision) by retriev-ing all documents for all queries! Recall is a non-decreasing function of thenumber of documents retrieved. On the other hand, in a good system, preci-sion usually decreases as the number of documents retrieved is increased. Ingeneral we want to get some amount of recall while tolerating only a certainpercentage of false positives.
A single measure that trades off precision versus recall is the F measure,F MEASURE
which is the weighted harmonic mean of precision and recall:
F =1
α 1P + (1 − α) 1
R
=(β2 + 1)PR
β2P + Rwhere β2 =
1 − α
α(8.5)
where α ∈ [0, 1] and thus β2 ∈ [0, ∞]. The default balanced F measure equallyweights precision and recall, which means making α = 1/2 or β = 1. It iscommonly written as F1, which is short for Fβ=1, even though the formula-tion in terms of α more transparently exhibits the F measure as a weightedharmonic mean. When using β = 1, the formula on the right simplifies to:
Fβ=1 =2PR
P + R(8.6)
However, using an even weighting is not the only choice. Values of β < 1emphasize precision, while values of β > 1 emphasize recall. For example, avalue of β = 3 or β = 5 might be used if recall is to be emphasized. Recall,precision, and the F measure are inherently measures between 0 and 1, butthey are also very commonly written as percentages, on a scale between 0and 100.
Why do we use a harmonic mean rather than the simpler average (arith-metic mean)? Recall that we can always get 100% recall by just returning alldocuments, and therefore we can always get a 50% arithmetic mean by the
Online edition (c)2009 Cambridge UP
8.3 Evaluation of unranked retrieval sets 157
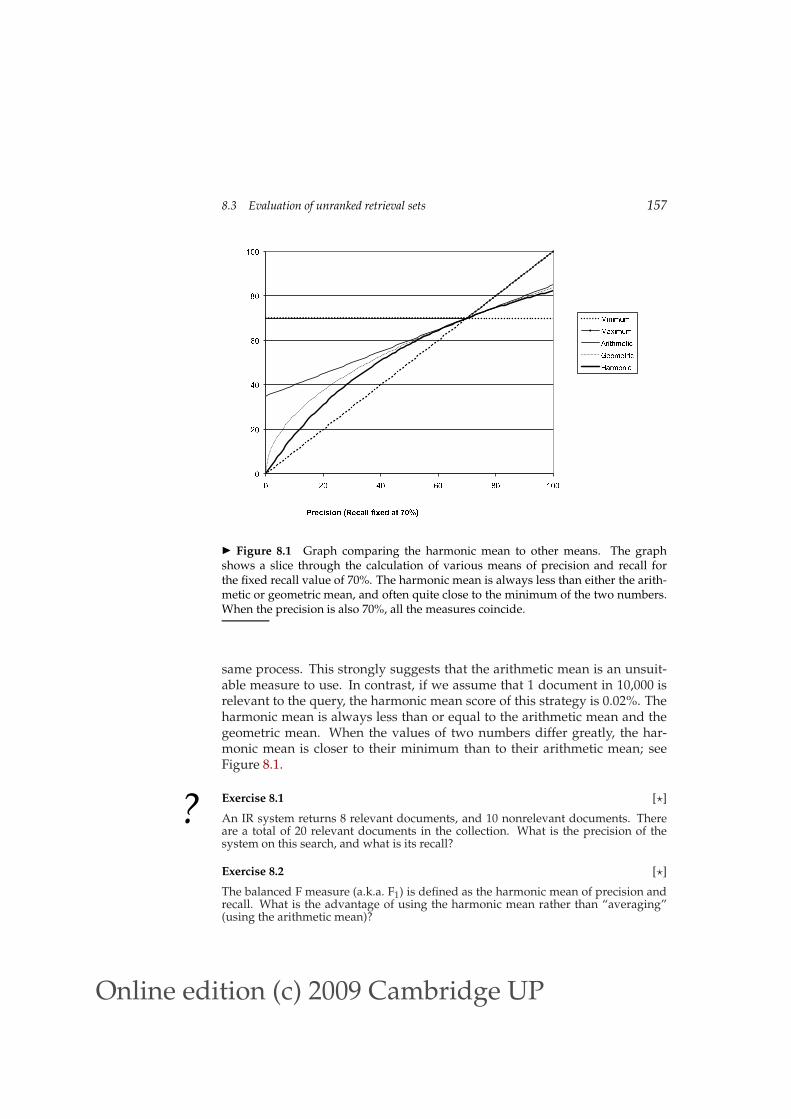
02 04 06 08 01 0 0
0 2 0 4 0 6 0 8 0 1 0 0P r e c i s i o n ( R e c a l l f i x e d a t 7 0 % )
M i n i m u mM a x i m u mA r i t h m e t i cG e o m e t r i cH a r m o n i c
◮ Figure 8.1 Graph comparing the harmonic mean to other means. The graphshows a slice through the calculation of various means of precision and recall forthe fixed recall value of 70%. The harmonic mean is always less than either the arith-metic or geometric mean, and often quite close to the minimum of the two numbers.When the precision is also 70%, all the measures coincide.
same process. This strongly suggests that the arithmetic mean is an unsuit-able measure to use. In contrast, if we assume that 1 document in 10,000 isrelevant to the query, the harmonic mean score of this strategy is 0.02%. Theharmonic mean is always less than or equal to the arithmetic mean and thegeometric mean. When the values of two numbers differ greatly, the har-monic mean is closer to their minimum than to their arithmetic mean; seeFigure 8.1.
? Exercise 8.1 [⋆]
An IR system returns 8 relevant documents, and 10 nonrelevant documents. Thereare a total of 20 relevant documents in the collection. What is the precision of thesystem on this search, and what is its recall?
Exercise 8.2 [⋆]
The balanced F measure (a.k.a. F1) is defined as the harmonic mean of precision andrecall. What is the advantage of using the harmonic mean rather than “averaging”(using the arithmetic mean)?
Online edition (c)2009 Cambridge UP
158 8 Evaluation in information retrieval
0.0
0.2
0.4
0.6
0.8
1.0
0.0 0.2 0.4 0.6 0.8 1.0Recall
Prec
ision
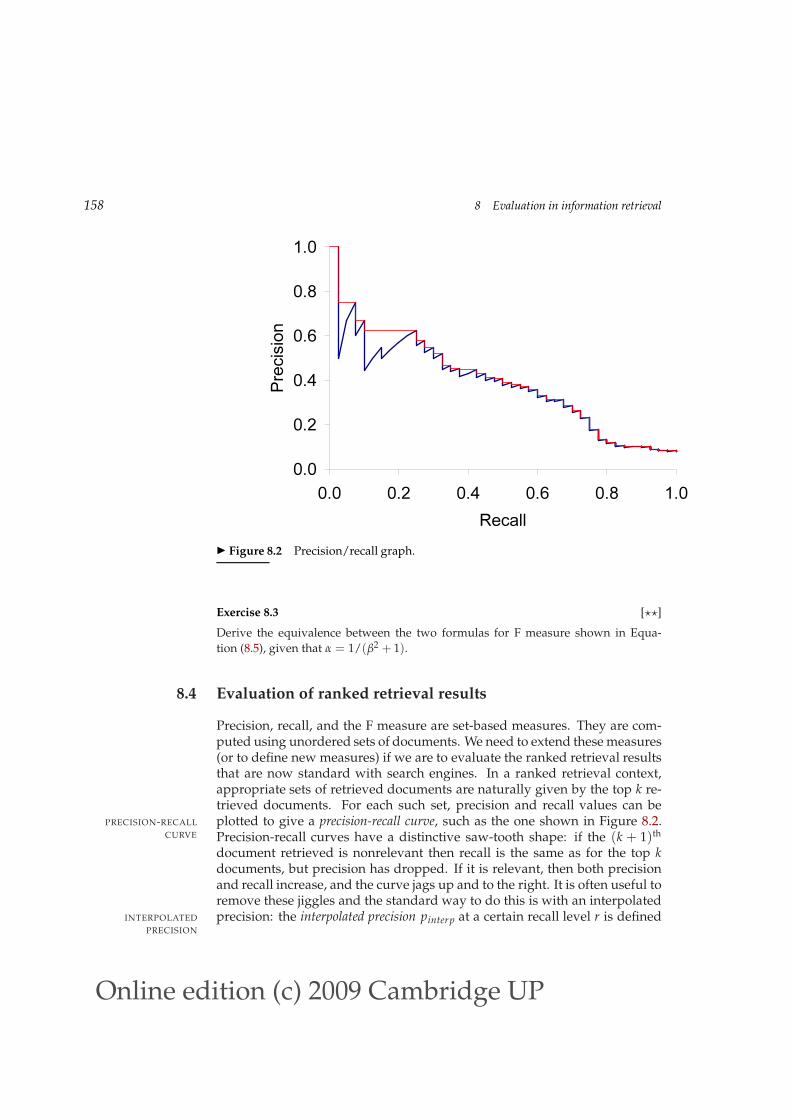
◮ Figure 8.2 Precision/recall graph.
Exercise 8.3 [⋆⋆]
Derive the equivalence between the two formulas for F measure shown in Equa-
tion (8.5), given that α = 1/(β2 + 1).
8.4 Evaluation of ranked retrieval results
Precision, recall, and the F measure are set-based measures. They are com-puted using unordered sets of documents. We need to extend these measures(or to define new measures) if we are to evaluate the ranked retrieval resultsthat are now standard with search engines. In a ranked retrieval context,appropriate sets of retrieved documents are naturally given by the top k re-trieved documents. For each such set, precision and recall values can beplotted to give a precision-recall curve, such as the one shown in Figure 8.2.PRECISION-RECALL
CURVE Precision-recall curves have a distinctive saw-tooth shape: if the (k + 1)th
document retrieved is nonrelevant then recall is the same as for the top kdocuments, but precision has dropped. If it is relevant, then both precisionand recall increase, and the curve jags up and to the right. It is often useful toremove these jiggles and the standard way to do this is with an interpolatedprecision: the interpolated precision pinterp at a certain recall level r is definedINTERPOLATED
PRECISION
Online edition (c)2009 Cambridge UP
8.4 Evaluation of ranked retrieval results 159
Recall Interp.Precision
0.0 1.000.1 0.670.2 0.630.3 0.550.4 0.450.5 0.410.6 0.360.7 0.290.8 0.130.9 0.101.0 0.08
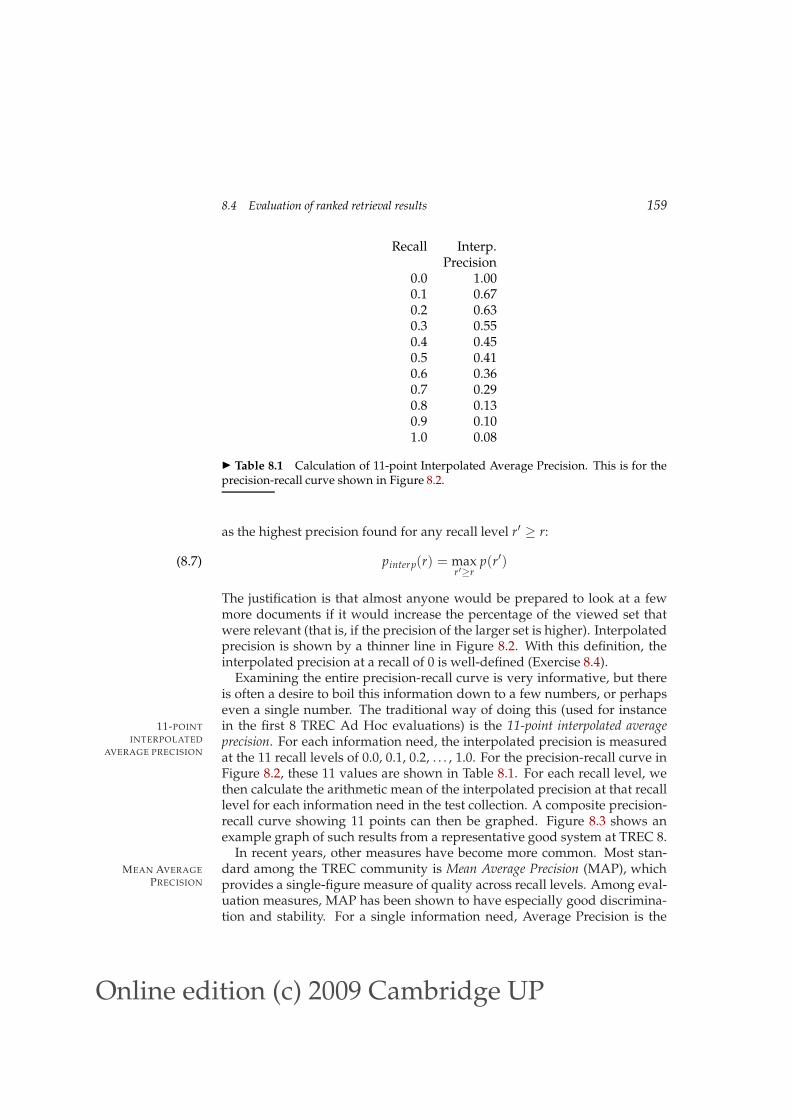
◮ Table 8.1 Calculation of 11-point Interpolated Average Precision. This is for theprecision-recall curve shown in Figure 8.2.
as the highest precision found for any recall level r′ ≥ r:
pinterp(r) = maxr′≥r
p(r′)(8.7)
The justification is that almost anyone would be prepared to look at a fewmore documents if it would increase the percentage of the viewed set thatwere relevant (that is, if the precision of the larger set is higher). Interpolatedprecision is shown by a thinner line in Figure 8.2. With this definition, theinterpolated precision at a recall of 0 is well-defined (Exercise 8.4).
Examining the entire precision-recall curve is very informative, but thereis often a desire to boil this information down to a few numbers, or perhapseven a single number. The traditional way of doing this (used for instancein the first 8 TREC Ad Hoc evaluations) is the 11-point interpolated average11-POINT
INTERPOLATED
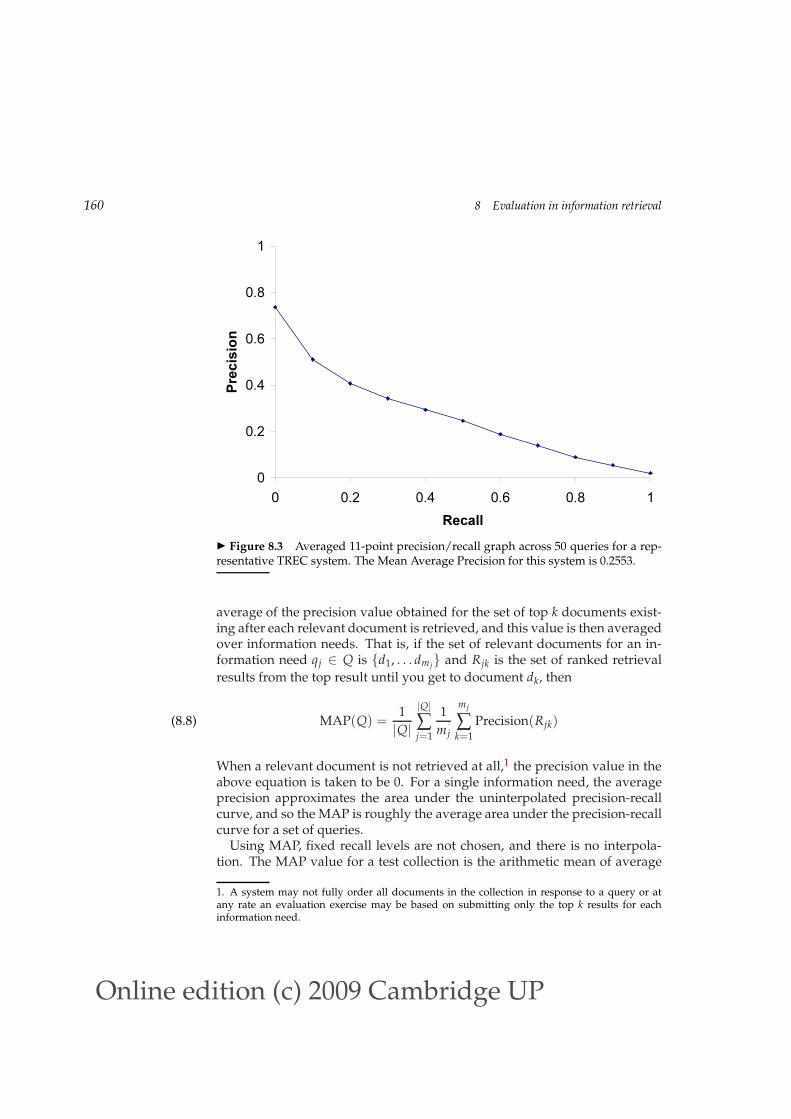
AVERAGE PRECISIONprecision. For each information need, the interpolated precision is measuredat the 11 recall levels of 0.0, 0.1, 0.2, . . . , 1.0. For the precision-recall curve inFigure 8.2, these 11 values are shown in Table 8.1. For each recall level, wethen calculate the arithmetic mean of the interpolated precision at that recalllevel for each information need in the test collection. A composite precision-recall curve showing 11 points can then be graphed. Figure 8.3 shows anexample graph of such results from a representative good system at TREC 8.
In recent years, other measures have become more common. Most stan-dard among the TREC community is Mean Average Precision (MAP), whichMEAN AVERAGE
PRECISION provides a single-figure measure of quality across recall levels. Among eval-uation measures, MAP has been shown to have especially good discrimina-tion and stability. For a single information need, Average Precision is the
Online edition (c)2009 Cambridge UP
160 8 Evaluation in information retrieval
0
0.2
0.4
0.6
0.8
1
0 0.2 0.4 0.6 0.8 1Recall
Prec
ision
◮ Figure 8.3 Averaged 11-point precision/recall graph across 50 queries for a rep-resentative TREC system. The Mean Average Precision for this system is 0.2553.
average of the precision value obtained for the set of top k documents exist-ing after each relevant document is retrieved, and this value is then averagedover information needs. That is, if the set of relevant documents for an in-formation need qj ∈ Q is {d1, . . . dmj
} and Rjk is the set of ranked retrieval
results from the top result until you get to document dk, then
MAP(Q) =1
|Q|
|Q|
∑j=1
1
mj
mj
∑k=1
Precision(Rjk)(8.8)
When a relevant document is not retrieved at all,1 the precision value in theabove equation is taken to be 0. For a single information need, the averageprecision approximates the area under the uninterpolated precision-recallcurve, and so the MAP is roughly the average area under the precision-recallcurve for a set of queries.
Using MAP, fixed recall levels are not chosen, and there is no interpola-tion. The MAP value for a test collection is the arithmetic mean of average
1. A system may not fully order all documents in the collection in response to a query or atany rate an evaluation exercise may be based on submitting only the top k results for eachinformation need.

Online edition (c)2009 Cambridge UP
8.4 Evaluation of ranked retrieval results 161
precision values for individual information needs. (This has the effect ofweighting each information need equally in the final reported number, evenif many documents are relevant to some queries whereas very few are rele-vant to other queries.) Calculated MAP scores normally vary widely acrossinformation needs when measured within a single system, for instance, be-tween 0.1 and 0.7. Indeed, there is normally more agreement in MAP foran individual information need across systems than for MAP scores for dif-ferent information needs for the same system. This means that a set of testinformation needs must be large and diverse enough to be representative ofsystem effectiveness across different queries.
The above measures factor in precision at all recall levels. For many promi-PRECISION AT k
nent applications, particularly web search, this may not be germane to users.What matters is rather how many good results there are on the first page orthe first three pages. This leads to measuring precision at fixed low levels ofretrieved results, such as 10 or 30 documents. This is referred to as “Precisionat k”, for example “Precision at 10”. It has the advantage of not requiring anyestimate of the size of the set of relevant documents but the disadvantagesthat it is the least stable of the commonly used evaluation measures and thatit does not average well, since the total number of relevant documents for aquery has a strong influence on precision at k.
An alternative, which alleviates this problem, is R-precision. It requiresR-PRECISION
having a set of known relevant documents Rel, from which we calculate theprecision of the top Rel documents returned. (The set Rel may be incomplete,such as when Rel is formed by creating relevance judgments for the pooledtop k results of particular systems in a set of experiments.) R-precision ad-justs for the size of the set of relevant documents: A perfect system couldscore 1 on this metric for each query, whereas, even a perfect system couldonly achieve a precision at 20 of 0.4 if there were only 8 documents in thecollection relevant to an information need. Averaging this measure acrossqueries thus makes more sense. This measure is harder to explain to naiveusers than Precision at k but easier to explain than MAP. If there are |Rel|relevant documents for a query, we examine the top |Rel| results of a sys-tem, and find that r are relevant, then by definition, not only is the precision(and hence R-precision) r/|Rel|, but the recall of this result set is also r/|Rel|.Thus, R-precision turns out to be identical to the break-even point, anotherBREAK-EVEN POINT
measure which is sometimes used, defined in terms of this equality relation-ship holding. Like Precision at k, R-precision describes only one point onthe precision-recall curve, rather than attempting to summarize effectivenessacross the curve, and it is somewhat unclear why you should be interestedin the break-even point rather than either the best point on the curve (thepoint with maximal F-measure) or a retrieval level of interest to a particularapplication (Precision at k). Nevertheless, R-precision turns out to be highlycorrelated with MAP empirically, despite measuring only a single point on
Online edition (c)2009 Cambridge UP
162 8 Evaluation in information retrieval
0.0
0.2
0.4
0.6
0.8
1.0
0 0.2 0.4 0.6 0.8 11 − specificity
sens
itivity
( = re
call)
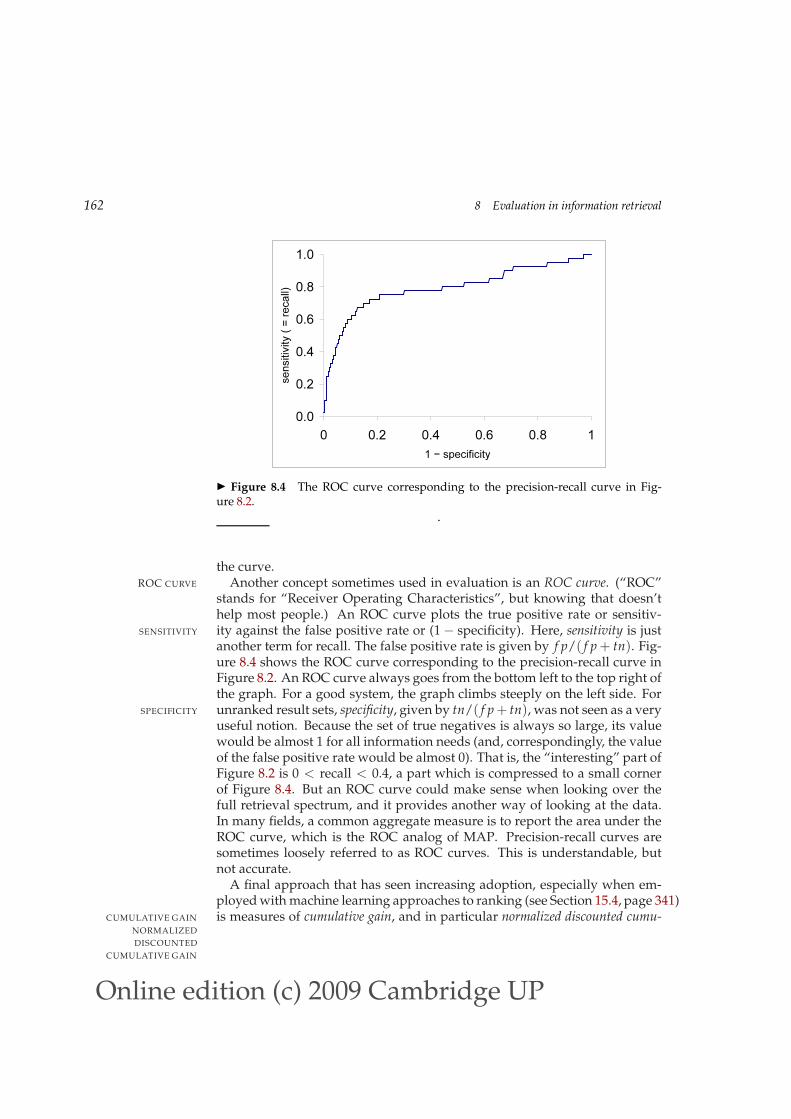
◮ Figure 8.4 The ROC curve corresponding to the precision-recall curve in Fig-ure 8.2.
.
the curve.Another concept sometimes used in evaluation is an ROC curve. (“ROC”ROC CURVE
stands for “Receiver Operating Characteristics”, but knowing that doesn’thelp most people.) An ROC curve plots the true positive rate or sensitiv-ity against the false positive rate or (1 − specificity). Here, sensitivity is justSENSITIVITY
another term for recall. The false positive rate is given by f p/( f p + tn). Fig-ure 8.4 shows the ROC curve corresponding to the precision-recall curve inFigure 8.2. An ROC curve always goes from the bottom left to the top right ofthe graph. For a good system, the graph climbs steeply on the left side. Forunranked result sets, specificity, given by tn/( f p + tn), was not seen as a verySPECIFICITY
useful notion. Because the set of true negatives is always so large, its valuewould be almost 1 for all information needs (and, correspondingly, the valueof the false positive rate would be almost 0). That is, the “interesting” part ofFigure 8.2 is 0 < recall < 0.4, a part which is compressed to a small cornerof Figure 8.4. But an ROC curve could make sense when looking over thefull retrieval spectrum, and it provides another way of looking at the data.In many fields, a common aggregate measure is to report the area under theROC curve, which is the ROC analog of MAP. Precision-recall curves aresometimes loosely referred to as ROC curves. This is understandable, butnot accurate.
A final approach that has seen increasing adoption, especially when em-ployed with machine learning approaches to ranking (see Section 15.4, page 341)is measures of cumulative gain, and in particular normalized discounted cumu-CUMULATIVE GAIN
NORMALIZED
DISCOUNTED
CUMULATIVE GAIN

Online edition (c)2009 Cambridge UP
8.4 Evaluation of ranked retrieval results 163
lative gain (NDCG). NDCG is designed for situations of non-binary notionsNDCG
of relevance (cf. Section 8.5.1). Like precision at k, it is evaluated over somenumber k of top search results. For a set of queries Q, let R(j, d) be the rele-vance score assessors gave to document d for query j. Then,
NDCG(Q, k) =1
|Q|
|Q|
∑j=1
Zkj
k
∑m=1
2R(j,m) − 1
log2(1 + m),(8.9)
where Zkj is a normalization factor calculated to make it so that a perfect
ranking’s NDCG at k for query j is 1. For queries for which k′ < k documentsare retrieved, the last summation is done up to k′.
? Exercise 8.4 [⋆]
What are the possible values for interpolated precision at a recall level of 0?
Exercise 8.5 [⋆⋆]
Must there always be a break-even point between precision and recall? Either showthere must be or give a counter-example.
Exercise 8.6 [⋆⋆]
What is the relationship between the value of F1 and the break-even point?
Exercise 8.7 [⋆⋆]
The Dice coefficient of two sets is a measure of their intersection scaled by their sizeDICE COEFFICIENT
(giving a value in the range 0 to 1):
Dice(X, Y) =2|X ∩ Y|
|X| + |Y|
Show that the balanced F-measure (F1) is equal to the Dice coefficient of the retrievedand relevant document sets.
Exercise 8.8 [⋆]
Consider an information need for which there are 4 relevant documents in the collec-tion. Contrast two systems run on this collection. Their top 10 results are judged forrelevance as follows (the leftmost item is the top ranked search result):
System 1 R N R N N N N N R R
System 2 N R N N R R R N N N
a. What is the MAP of each system? Which has a higher MAP?
b. Does this result intuitively make sense? What does it say about what is importantin getting a good MAP score?
c. What is the R-precision of each system? (Does it rank the systems the same asMAP?)
Online edition (c)2009 Cambridge UP
164 8 Evaluation in information retrieval
Exercise 8.9 [⋆⋆]
The following list of Rs and Ns represents relevant (R) and nonrelevant (N) returneddocuments in a ranked list of 20 documents retrieved in response to a query from acollection of 10,000 documents. The top of the ranked list (the document the systemthinks is most likely to be relevant) is on the left of the list. This list shows 6 relevantdocuments. Assume that there are 8 relevant documents in total in the collection.
R R N N N N N N R N R N N N R N N N N R
a. What is the precision of the system on the top 20?
b. What is the F1 on the top 20?
c. What is the uninterpolated precision of the system at 25% recall?
d. What is the interpolated precision at 33% recall?
e. Assume that these 20 documents are the complete result set of the system. Whatis the MAP for the query?
Assume, now, instead, that the system returned the entire 10,000 documents in aranked list, and these are the first 20 results returned.
f. What is the largest possible MAP that this system could have?
g. What is the smallest possible MAP that this system could have?
h. In a set of experiments, only the top 20 results are evaluated by hand. The resultin (e) is used to approximate the range (f)–(g). For this example, how large (inabsolute terms) can the error for the MAP be by calculating (e) instead of (f) and(g) for this query?
8.5 Assessing relevance
To properly evaluate a system, your test information needs must be germaneto the documents in the test document collection, and appropriate for pre-dicted usage of the system. These information needs are best designed bydomain experts. Using random combinations of query terms as an informa-tion need is generally not a good idea because typically they will not resem-ble the actual distribution of information needs.
Given information needs and documents, you need to collect relevanceassessments. This is a time-consuming and expensive process involving hu-man beings. For tiny collections like Cranfield, exhaustive judgments of rel-evance for each query and document pair were obtained. For large moderncollections, it is usual for relevance to be assessed only for a subset of thedocuments for each query. The most standard approach is pooling, where rel-POOLING
evance is assessed over a subset of the collection that is formed from the topk documents returned by a number of different IR systems (usually the onesto be evaluated), and perhaps other sources such as the results of Booleankeyword searches or documents found by expert searchers in an interactiveprocess.
Online edition (c)2009 Cambridge UP
8.5 Assessing relevance 165
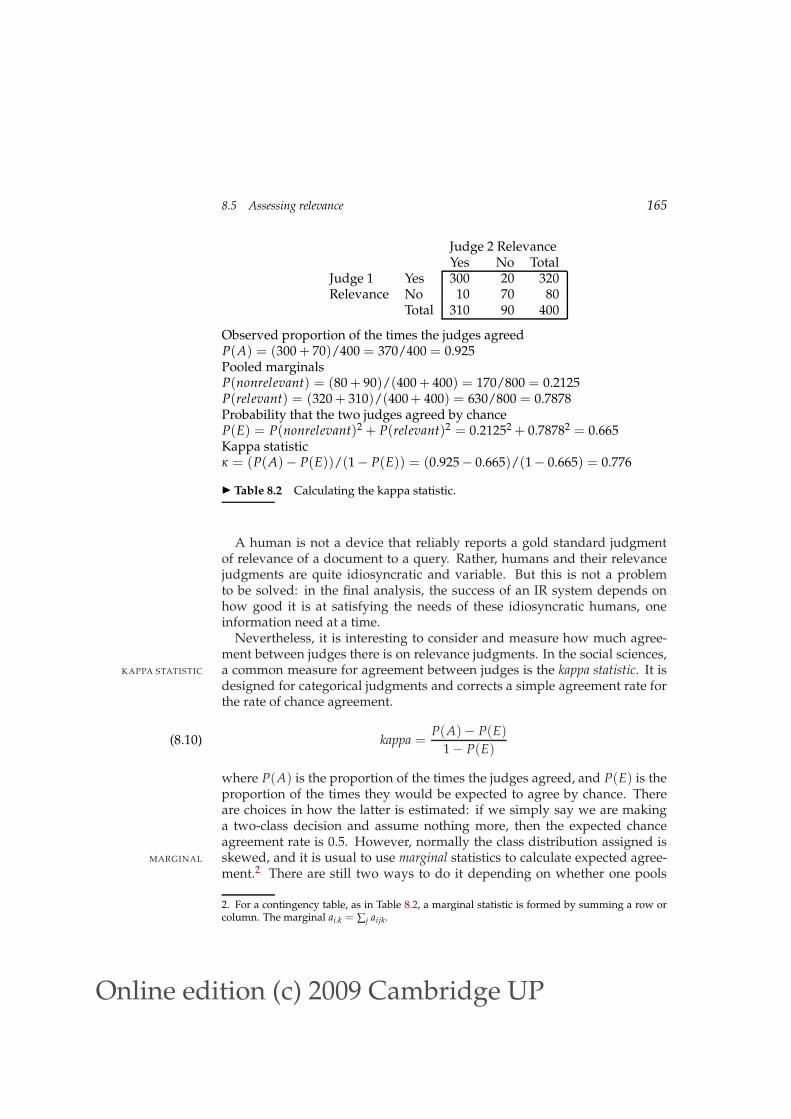
Judge 2 RelevanceYes No Total
Judge 1 Yes 300 20 320Relevance No 10 70 80
Total 310 90 400
Observed proportion of the times the judges agreedP(A) = (300 + 70)/400 = 370/400 = 0.925Pooled marginalsP(nonrelevant) = (80 + 90)/(400 + 400) = 170/800 = 0.2125P(relevant) = (320 + 310)/(400 + 400) = 630/800 = 0.7878Probability that the two judges agreed by chanceP(E) = P(nonrelevant)2 + P(relevant)2 = 0.21252 + 0.78782 = 0.665Kappa statisticκ = (P(A)− P(E))/(1− P(E)) = (0.925− 0.665)/(1− 0.665) = 0.776
◮ Table 8.2 Calculating the kappa statistic.
A human is not a device that reliably reports a gold standard judgmentof relevance of a document to a query. Rather, humans and their relevancejudgments are quite idiosyncratic and variable. But this is not a problemto be solved: in the final analysis, the success of an IR system depends onhow good it is at satisfying the needs of these idiosyncratic humans, oneinformation need at a time.
Nevertheless, it is interesting to consider and measure how much agree-ment between judges there is on relevance judgments. In the social sciences,a common measure for agreement between judges is the kappa statistic. It isKAPPA STATISTIC
designed for categorical judgments and corrects a simple agreement rate forthe rate of chance agreement.
kappa =P(A)− P(E)
1 − P(E)(8.10)
where P(A) is the proportion of the times the judges agreed, and P(E) is theproportion of the times they would be expected to agree by chance. Thereare choices in how the latter is estimated: if we simply say we are makinga two-class decision and assume nothing more, then the expected chanceagreement rate is 0.5. However, normally the class distribution assigned isskewed, and it is usual to use marginal statistics to calculate expected agree-MARGINAL
ment.2 There are still two ways to do it depending on whether one pools
2. For a contingency table, as in Table 8.2, a marginal statistic is formed by summing a row orcolumn. The marginal ai.k = ∑j aijk.

Online edition (c)2009 Cambridge UP
166 8 Evaluation in information retrieval
the marginal distribution across judges or uses the marginals for each judgeseparately; both forms have been used, but we present the pooled versionbecause it is more conservative in the presence of systematic differences in as-sessments across judges. The calculations are shown in Table 8.2. The kappavalue will be 1 if two judges always agree, 0 if they agree only at the rategiven by chance, and negative if they are worse than random. If there aremore than two judges, it is normal to calculate an average pairwise kappavalue. As a rule of thumb, a kappa value above 0.8 is taken as good agree-ment, a kappa value between 0.67 and 0.8 is taken as fair agreement, andagreement below 0.67 is seen as data providing a dubious basis for an evalu-ation, though the precise cutoffs depend on the purposes for which the datawill be used.
Interjudge agreement of relevance has been measured within the TRECevaluations and for medical IR collections. Using the above rules of thumb,the level of agreement normally falls in the range of “fair” (0.67–0.8). The factthat human agreement on a binary relevance judgment is quite modest is onereason for not requiring more fine-grained relevance labeling from the testset creator. To answer the question of whether IR evaluation results are validdespite the variation of individual assessors’ judgments, people have exper-imented with evaluations taking one or the other of two judges’ opinions asthe gold standard. The choice can make a considerable absolute difference toreported scores, but has in general been found to have little impact on the rel-ative effectiveness ranking of either different systems or variants of a singlesystem which are being compared for effectiveness.
8.5.1 Critiques and justifications of the concept of relevance
The advantage of system evaluation, as enabled by the standard model ofrelevant and nonrelevant documents, is that we have a fixed setting in whichwe can vary IR systems and system parameters to carry out comparative ex-periments. Such formal testing is much less expensive and allows clearerdiagnosis of the effect of changing system parameters than doing user stud-ies of retrieval effectiveness. Indeed, once we have a formal measure thatwe have confidence in, we can proceed to optimize effectiveness by machinelearning methods, rather than tuning parameters by hand. Of course, if theformal measure poorly describes what users actually want, doing this willnot be effective in improving user satisfaction. Our perspective is that, inpractice, the standard formal measures for IR evaluation, although a simpli-fication, are good enough, and recent work in optimizing formal evaluationmeasures in IR has succeeded brilliantly. There are numerous examples oftechniques developed in formal evaluation settings, which improve effec-tiveness in operational settings, such as the development of document lengthnormalization methods within the context of TREC (Sections 6.4.4 and 11.4.3)

Online edition (c)2009 Cambridge UP
8.5 Assessing relevance 167
and machine learning methods for adjusting parameter weights in scoring(Section 6.1.2).
That is not to say that there are not problems latent within the abstrac-tions used. The relevance of one document is treated as independent of therelevance of other documents in the collection. (This assumption is actuallybuilt into most retrieval systems – documents are scored against queries, notagainst each other – as well as being assumed in the evaluation methods.)Assessments are binary: there aren’t any nuanced assessments of relevance.Relevance of a document to an information need is treated as an absolute,objective decision. But judgments of relevance are subjective, varying acrosspeople, as we discussed above. In practice, human assessors are also imper-fect measuring instruments, susceptible to failures of understanding and at-tention. We also have to assume that users’ information needs do not changeas they start looking at retrieval results. Any results based on one collectionare heavily skewed by the choice of collection, queries, and relevance judg-ment set: the results may not translate from one domain to another or to adifferent user population.
Some of these problems may be fixable. A number of recent evaluations,including INEX, some TREC tracks, and NTCIR have adopted an ordinalnotion of relevance with documents divided into 3 or 4 classes, distinguish-ing slightly relevant documents from highly relevant documents. See Sec-tion 10.4 (page 210) for a detailed discussion of how this is implemented inthe INEX evaluations.
One clear problem with the relevance-based assessment that we have pre-sented is the distinction between relevance and marginal relevance: whetherMARGINAL RELEVANCE
a document still has distinctive usefulness after the user has looked at cer-tain other documents (Carbonell and Goldstein 1998). Even if a documentis highly relevant, its information can be completely redundant with otherdocuments which have already been examined. The most extreme case ofthis is documents that are duplicates – a phenomenon that is actually verycommon on the World Wide Web – but it can also easily occur when sev-eral documents provide a similar precis of an event. In such circumstances,marginal relevance is clearly a better measure of utility to the user. Maximiz-ing marginal relevance requires returning documents that exhibit diversityand novelty. One way to approach measuring this is by using distinct factsor entities as evaluation units. This perhaps more directly measures trueutility to the user but doing this makes it harder to create a test collection.
? Exercise 8.10 [⋆⋆]
Below is a table showing how two human judges rated the relevance of a set of 12documents to a particular information need (0 = nonrelevant, 1 = relevant). Let us as-sume that you’ve written an IR system that for this query returns the set of documents{4, 5, 6, 7, 8}.

Online edition (c)2009 Cambridge UP
168 8 Evaluation in information retrieval
docID Judge 1 Judge 21 0 02 0 03 1 14 1 15 1 06 1 07 1 08 1 09 0 1
10 0 111 0 112 0 1
a. Calculate the kappa measure between the two judges.
b. Calculate precision, recall, and F1 of your system if a document is considered rel-evant only if the two judges agree.
c. Calculate precision, recall, and F1 of your system if a document is considered rel-evant if either judge thinks it is relevant.
8.6 A broader perspective: System quality and user utility
Formal evaluation measures are at some distance from our ultimate interestin measures of human utility: how satisfied is each user with the results thesystem gives for each information need that they pose? The standard way tomeasure human satisfaction is by various kinds of user studies. These mightinclude quantitative measures, both objective, such as time to complete atask, as well as subjective, such as a score for satisfaction with the searchengine, and qualitative measures, such as user comments on the search in-terface. In this section we will touch on other system aspects that allow quan-titative evaluation and the issue of user utility.
8.6.1 System issues
There are many practical benchmarks on which to rate an information re-trieval system beyond its retrieval quality. These include:
• How fast does it index, that is, how many documents per hour does itindex for a certain distribution over document lengths? (cf. Chapter 4)
• How fast does it search, that is, what is its latency as a function of indexsize?
• How expressive is its query language? How fast is it on complex queries?
Online edition (c)2009 Cambridge UP
8.6 A broader perspective: System quality and user utility 169
• How large is its document collection, in terms of the number of doc-uments or the collection having information distributed across a broadrange of topics?
All these criteria apart from query language expressiveness are straightfor-wardly measurable: we can quantify the speed or size. Various kinds of fea-ture checklists can make query language expressiveness semi-precise.
8.6.2 User utility
What we would really like is a way of quantifying aggregate user happiness,based on the relevance, speed, and user interface of a system. One part ofthis is understanding the distribution of people we wish to make happy, andthis depends entirely on the setting. For a web search engine, happy searchusers are those who find what they want. One indirect measure of such usersis that they tend to return to the same engine. Measuring the rate of returnof users is thus an effective metric, which would of course be more effectiveif you could also measure how much these users used other search engines.But advertisers are also users of modern web search engines. They are happyif customers click through to their sites and then make purchases. On aneCommerce web site, a user is likely to be wanting to purchase something.Thus, we can measure the time to purchase, or the fraction of searchers whobecome buyers. On a shopfront web site, perhaps both the user’s and thestore owner’s needs are satisfied if a purchase is made. Nevertheless, ingeneral, we need to decide whether it is the end user’s or the eCommercesite owner’s happiness that we are trying to optimize. Usually, it is the storeowner who is paying us.
For an “enterprise” (company, government, or academic) intranet searchengine, the relevant metric is more likely to be user productivity: how muchtime do users spend looking for information that they need. There are alsomany other practical criteria concerning such matters as information secu-rity, which we mentioned in Section 4.6 (page 80).
User happiness is elusive to measure, and this is part of why the standardmethodology uses the proxy of relevance of search results. The standarddirect way to get at user satisfaction is to run user studies, where people en-gage in tasks, and usually various metrics are measured, the participants areobserved, and ethnographic interview techniques are used to get qualitativeinformation on satisfaction. User studies are very useful in system design,but they are time consuming and expensive to do. They are also difficult todo well, and expertise is required to design the studies and to interpret theresults. We will not discuss the details of human usability testing here.

Online edition (c)2009 Cambridge UP
170 8 Evaluation in information retrieval
8.6.3 Refining a deployed system
If an IR system has been built and is being used by a large number of users,the system’s builders can evaluate possible changes by deploying variantversions of the system and recording measures that are indicative of usersatisfaction with one variant vs. others as they are being used. This methodis frequently used by web search engines.
The most common version of this is A/B testing, a term borrowed from theA/B TEST
advertising industry. For such a test, precisely one thing is changed betweenthe current system and a proposed system, and a small proportion of traf-fic (say, 1–10% of users) is randomly directed to the variant system, whilemost users use the current system. For example, if we wish to investigate achange to the ranking algorithm, we redirect a random sample of users toa variant system and evaluate measures such as the frequency with whichpeople click on the top result, or any result on the first page. (This particularanalysis method is referred to as clickthrough log analysis or clickstream min-CLICKTHROUGH LOG
ANALYSIS
CLICKSTREAM MININGing. It is further discussed as a method of implicit feedback in Section 9.1.7(page 187).)
The basis of A/B testing is running a bunch of single variable tests (eitherin sequence or in parallel): for each test only one parameter is varied from thecontrol (the current live system). It is therefore easy to see whether varyingeach parameter has a positive or negative effect. Such testing of a live systemcan easily and cheaply gauge the effect of a change on users, and, with alarge enough user base, it is practical to measure even very small positiveand negative effects. In principle, more analytic power can be achieved byvarying multiple things at once in an uncorrelated (random) way, and doingstandard multivariate statistical analysis, such as multiple linear regression.In practice, though, A/B testing is widely used, because A/B tests are easyto deploy, easy to understand, and easy to explain to management.
8.7 Results snippets
Having chosen or ranked the documents matching a query, we wish to pre-sent a results list that will be informative to the user. In many cases theuser will not want to examine all the returned documents and so we wantto make the results list informative enough that the user can do a final rank-ing of the documents for themselves based on relevance to their informationneed.3 The standard way of doing this is to provide a snippet, a short sum-SNIPPET
mary of the document, which is designed so as to allow the user to decideits relevance. Typically, the snippet consists of the document title and a short
3. There are exceptions, in domains where recall is emphasized. For instance, in many legaldisclosure cases, a legal associate will review every document that matches a keyword search.

Online edition (c)2009 Cambridge UP
8.7 Results snippets 171
summary, which is automatically extracted. The question is how to designthe summary so as to maximize its usefulness to the user.
The two basic kinds of summaries are static, which are always the sameSTATIC SUMMARY
regardless of the query, and dynamic (or query-dependent), which are cus-DYNAMIC SUMMARY
tomized according to the user’s information need as deduced from a query.Dynamic summaries attempt to explain why a particular document was re-trieved for the query at hand.
A static summary is generally comprised of either or both a subset of thedocument and metadata associated with the document. The simplest formof summary takes the first two sentences or 50 words of a document, or ex-tracts particular zones of a document, such as the title and author. Instead ofzones of a document, the summary can instead use metadata associated withthe document. This may be an alternative way to provide an author or date,or may include elements which are designed to give a summary, such as thedescription metadata which can appear in the meta element of a webHTML page. This summary is typically extracted and cached at indexingtime, in such a way that it can be retrieved and presented quickly when dis-playing search results, whereas having to access the actual document contentmight be a relatively expensive operation.
There has been extensive work within natural language processing (NLP)on better ways to do text summarization. Most such work still aims only toTEXT SUMMARIZATION
choose sentences from the original document to present and concentrates onhow to select good sentences. The models typically combine positional fac-tors, favoring the first and last paragraphs of documents and the first and lastsentences of paragraphs, with content factors, emphasizing sentences withkey terms, which have low document frequency in the collection as a whole,but high frequency and good distribution across the particular documentbeing returned. In sophisticated NLP approaches, the system synthesizessentences for a summary, either by doing full text generation or by editingand perhaps combining sentences used in the document. For example, itmight delete a relative clause or replace a pronoun with the noun phrasethat it refers to. This last class of methods remains in the realm of researchand is seldom used for search results: it is easier, safer, and often even betterto just use sentences from the original document.
Dynamic summaries display one or more “windows” on the document,aiming to present the pieces that have the most utility to the user in evalu-ating the document with respect to their information need. Usually thesewindows contain one or several of the query terms, and so are often re-ferred to as keyword-in-context (KWIC) snippets, though sometimes they mayKEYWORD-IN-CONTEXT
still be pieces of the text such as the title that are selected for their query-independent information value just as in the case of static summarization.Dynamic summaries are generated in conjunction with scoring. If the queryis found as a phrase, occurrences of the phrase in the document will be

Online edition (c)2009 Cambridge UP
172 8 Evaluation in information retrieval
. . . In recent years, Papua New Guinea has faced severe economicdifficulties and economic growth has slowed, partly as a result of weakgovernance and civil war, and partly as a result of external factors such asthe Bougainville civil war which led to the closure in 1989 of the Pangunamine (at that time the most important foreign exchange earner andcontributor to Government finances), the Asian financial crisis, a decline inthe prices of gold and copper, and a fall in the production of oil. PNG’seconomic development record over the past few years is evidence thatgovernance issues underly many of the country’s problems. Goodgovernance, which may be defined as the transparent and accountablemanagement of human, natural, economic and financial resources for thepurposes of equitable and sustainable development, flows from properpublic sector management, efficient fiscal and accounting mechanisms, anda willingness to make service delivery a priority in practice. . . .
◮ Figure 8.5 An example of selecting text for a dynamic snippet. This snippet wasgenerated for a document in response to the query new guinea economic development.The figure shows in bold italic where the selected snippet text occurred in the originaldocument.
shown as the summary. If not, windows within the document that containmultiple query terms will be selected. Commonly these windows may juststretch some number of words to the left and right of the query terms. This isa place where NLP techniques can usefully be employed: users prefer snip-pets that read well because they contain complete phrases.
Dynamic summaries are generally regarded as greatly improving the us-ability of IR systems, but they present a complication for IR system design. Adynamic summary cannot be precomputed, but, on the other hand, if a sys-tem has only a positional index, then it cannot easily reconstruct the contextsurrounding search engine hits in order to generate such a dynamic sum-mary. This is one reason for using static summaries. The standard solutionto this in a world of large and cheap disk drives is to locally cache all thedocuments at index time (notwithstanding that this approach raises variouslegal, information security and control issues that are far from resolved) asshown in Figure 7.5 (page 147). Then, a system can simply scan a documentwhich is about to appear in a displayed results list to find snippets containingthe query words. Beyond simply access to the text, producing a good KWICsnippet requires some care. Given a variety of keyword occurrences in adocument, the goal is to choose fragments which are: (i) maximally informa-tive about the discussion of those terms in the document, (ii) self-containedenough to be easy to read, and (iii) short enough to fit within the normallystrict constraints on the space available for summaries.
Online edition (c)2009 Cambridge UP
8.8 References and further reading 173
Generating snippets must be fast since the system is typically generatingmany snippets for each query that it handles. Rather than caching an entiredocument, it is common to cache only a generous but fixed size prefix ofthe document, such as perhaps 10,000 characters. For most common, shortdocuments, the entire document is thus cached, but huge amounts of localstorage will not be wasted on potentially vast documents. Summaries ofdocuments whose length exceeds the prefix size will be based on materialin the prefix only, which is in general a useful zone in which to look for adocument summary anyway.
If a document has been updated since it was last processed by a crawlerand indexer, these changes will be neither in the cache nor in the index. Inthese circumstances, neither the index nor the summary will accurately re-flect the current contents of the document, but it is the differences betweenthe summary and the actual document content that will be more glaringlyobvious to the end user.
8.8 References and further reading
Definition and implementation of the notion of relevance to a query got offto a rocky start in 1953. Swanson (1988) reports that in an evaluation in thatyear between two teams, they agreed that 1390 documents were variouslyrelevant to a set of 98 questions, but disagreed on a further 1577 documents,and the disagreements were never resolved.
Rigorous formal testing of IR systems was first completed in the Cranfieldexperiments, beginning in the late 1950s. A retrospective discussion of theCranfield test collection and experimentation with it can be found in (Clever-don 1991). The other seminal series of early IR experiments were those on theSMART system by Gerard Salton and colleagues (Salton 1971b; 1991). TheTREC evaluations are described in detail by Voorhees and Harman (2005).Online information is available at http://trec.nist.gov/. Initially, few researcherscomputed the statistical significance of their experimental results, but the IRcommunity increasingly demands this (Hull 1993). User studies of IR systemeffectiveness began more recently (Saracevic and Kantor 1988; 1996).
The notions of recall and precision were first used by Kent et al. (1955),although the term precision did not appear until later. The F measure (or,F MEASURE
rather its complement E = 1 − F) was introduced by van Rijsbergen (1979).He provides an extensive theoretical discussion, which shows how adoptinga principle of decreasing marginal relevance (at some point a user will beunwilling to sacrifice a unit of precision for an added unit of recall) leads tothe harmonic mean being the appropriate method for combining precisionand recall (and hence to its adoption rather than the minimum or geometricmean).

Online edition (c)2009 Cambridge UP
174 8 Evaluation in information retrieval
Buckley and Voorhees (2000) compare several evaluation measures, in-cluding precision at k, MAP, and R-precision, and evaluate the error rate ofeach measure. R-precision was adopted as the official evaluation metric inR-PRECISION
the TREC HARD track (Allan 2005). Aslam and Yilmaz (2005) examine itssurprisingly close correlation to MAP, which had been noted in earlier stud-ies (Tague-Sutcliffe and Blustein 1995, Buckley and Voorhees 2000). A stan-dard program for evaluating IR systems which computes many measures ofranked retrieval effectiveness is Chris Buckley’s trec_eval program usedin the TREC evaluations. It can be downloaded from: http://trec.nist.gov/trec_eval/.
Kekäläinen and Järvelin (2002) argue for the superiority of graded rele-vance judgments when dealing with very large document collections, andJärvelin and Kekäläinen (2002) introduce cumulated gain-based methods forIR system evaluation in this context. Sakai (2007) does a study of the stabil-ity and sensitivity of evaluation measures based on graded relevance judg-ments from NTCIR tasks, and concludes that NDCG is best for evaluatingdocument ranking.
Schamber et al. (1990) examine the concept of relevance, stressing its multi-dimensional and context-specific nature, but also arguing that it can be mea-sured effectively. (Voorhees 2000) is the standard article for examining vari-ation in relevance judgments and their effects on retrieval system scores andranking for the TREC Ad Hoc task. Voorhees concludes that although thenumbers change, the rankings are quite stable. Hersh et al. (1994) presentsimilar analysis for a medical IR collection. In contrast, Kekäläinen (2005)analyze some of the later TRECs, exploring a 4-way relevance judgment andthe notion of cumulative gain, arguing that the relevance measure used doessubstantially affect system rankings. See also Harter (1998). Zobel (1998)studies whether the pooling method used by TREC to collect a subset of doc-uments that will be evaluated for relevance is reliable and fair, and concludesthat it is.
The kappa statistic and its use for language-related purposes is discussedKAPPA STATISTIC
by Carletta (1996). Many standard sources (e.g., Siegel and Castellan 1988)present pooled calculation of the expected agreement, but Di Eugenio andGlass (2004) argue for preferring the unpooled agreement (though perhapspresenting multiple measures). For further discussion of alternative mea-sures of agreement, which may in fact be better, see Lombard et al. (2002)and Krippendorff (2003).
Text summarization has been actively explored for many years. Modernwork on sentence selection was initiated by Kupiec et al. (1995). More recentwork includes (Barzilay and Elhadad 1997) and (Jing 2000), together witha broad selection of work appearing at the yearly DUC conferences and atother NLP venues. Tombros and Sanderson (1998) demonstrate the advan-tages of dynamic summaries in the IR context. Turpin et al. (2007) addresshow to generate snippets efficiently.

Online edition (c)2009 Cambridge UP
8.8 References and further reading 175
Clickthrough log analysis is studied in (Joachims 2002b, Joachims et al.2005).
In a series of papers, Hersh, Turpin and colleagues show how improve-ments in formal retrieval effectiveness, as evaluated in batch experiments, donot always translate into an improved system for users (Hersh et al. 2000a;b;2001, Turpin and Hersh 2001; 2002).
User interfaces for IR and human factors such as models of human infor-mation seeking and usability testing are outside the scope of what we coverin this book. More information on these topics can be found in other text-books, including (Baeza-Yates and Ribeiro-Neto 1999, ch. 10) and (Korfhage1997), and collections focused on cognitive aspects (Spink and Cole 2005).