online handwritten document
TRANSCRIPT
8/7/2019 Online HandWritten Document
http://slidepdf.com/reader/full/online-handwritten-document 1/191
ON-LINE HANDWRITTEN DOCUMENT UNDERSTANDING
By
Anoop M. Namboodiri
AN ABSTRACT OF A D ISSERTATION
Submitted to
Michigan State Universityin partial ful llment of the requirements
for the degree of
DOCTOR OF PHILOSOPHY
Department of Computer Science
2004
Professor Anil K. Jain
8/7/2019 Online HandWritten Document
http://slidepdf.com/reader/full/online-handwritten-document 2/191
ABSTRACT
ON-LINE HANDWRITTEN DOCUMENT UNDERSTANDING
By
Anoop M. Namboodiri
This thesis develops a mathematical basis for understanding the structure of on-line
handwritten documents and explores some of the related problems in detail. With the
increase in popularity of portable computing devices, such as PDAs and handheld com-
puters, non-keyboard based methods for data entry are receiving more attention in the re-
search communities and commercial sector. The most promising options are pen-based and
speech-based inputs. Pen-based input devices generate handwritten documents which have
on-line or dynamic (temporal) information encoded in them. Digitizing devices like Smart-
Boards and computing platforms, which use pen-based input such as the IBM Thinkpad
TransNote and Tablet PCs, create on-line documents. As these devices become available
and affordable, large volumes of digital handwritten data will be generated and the problem
of archiving and retrieving such data becomes an important concern. This thesis addresses
the problem of on-line document understanding, which is an essential component of an
effective retrieval algorithm.
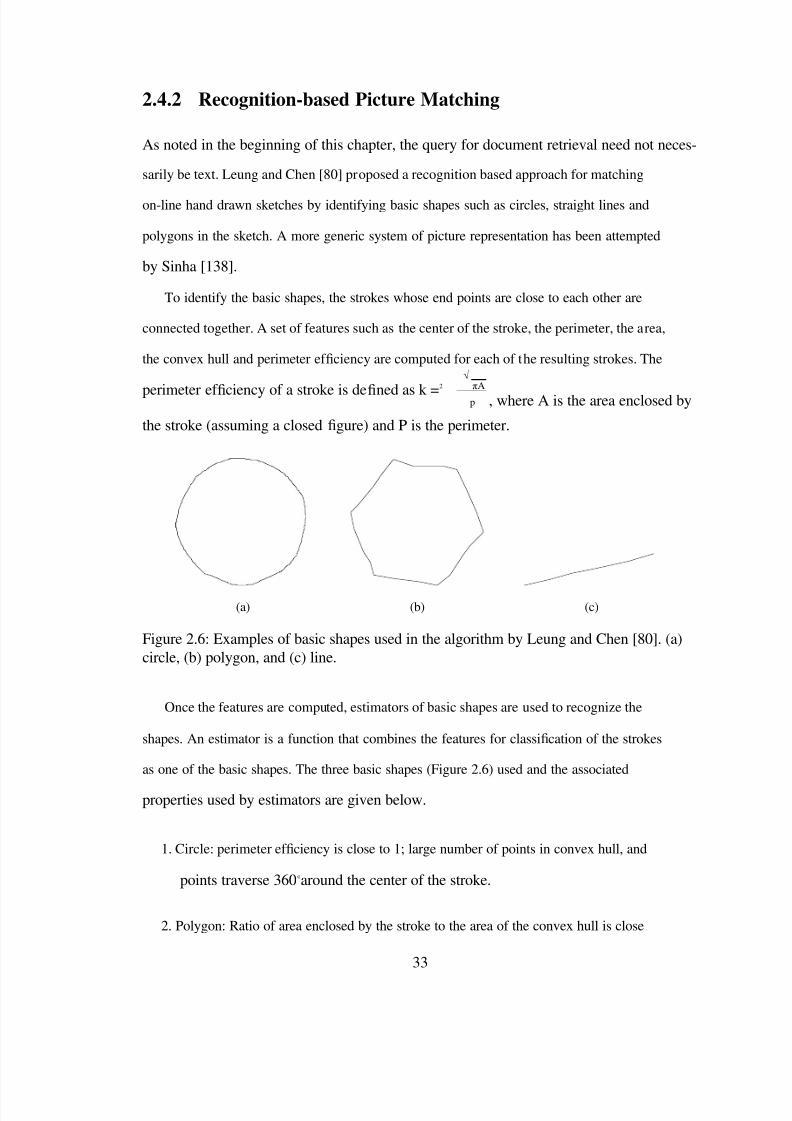
This thesis describes a mathematical model for representation of on-line handwritten
data based on the mechanics of the writing process. The representation is used for extract-
ing various properties of the handwritten data, which forms the basis for understanding
the higher level structure of a document. A principled approach to the problem of docu-
ment segmentation is presented using a parsing technique based on stochastic context free
grammar (SCFG). The parser generates a segmentation of the handwritten page, which is
optimal with respect to a proposed compactness criterion. Additional properties of a region
are identi ed based on the nature and layout of handwritten strokes in the region. An al-

8/7/2019 Online HandWritten Document
http://slidepdf.com/reader/full/online-handwritten-document 3/191
Anoop M. Namboodiri
gorithm to identify ruled and unruled tables is presented. The thesis also proposes a set of
features for identi cation of scripts within the text regions and develops an algorithm for
script classi cation.
The thesis presents a matching algorithm, which computes a similarity measure be-
tween the query and handwriting samples in a database. The query and database samples
could be either words or sketches, which are automatically identi ed by the document seg-
mentation algorithm. We also address the related problem of document security, where
on-line handwritten signatures are used to watermark on-line and off-line documents. The
use of a biometric trait, such as signature, for watermarking allows the recipient of a docu-ment to verify the identity of the author in addition to document integrity.

8/7/2019 Online HandWritten Document
http://slidepdf.com/reader/full/online-handwritten-document 4/191
8/7/2019 Online HandWritten Document
http://slidepdf.com/reader/full/online-handwritten-document 5/191
ABSTRACT
ON-LINE HANDWRITTEN DOCUMENT UNDERSTANDING
By
Anoop M. Namboodiri
This thesis develops a mathematical basis for understanding the structure of on-line
handwritten documents and explores some of the related problems in detail. With the
increase in popularity of portable computing devices, such as PDAs and handheld com-
puters, non-keyboard based methods for data entry are receiving more attention in the re-
search communities and commercial sector. The most promising options are pen-based and
speech-based inputs. Pen-based input devices generate handwritten documents which have
on-line or dynamic (temporal) information encoded in them. Digitizing devices like Smart-
Boards and computing platforms, which use pen-based input such as the IBM Thinkpad
TransNote and Tablet PCs, create on-line documents. As these devices become available
and affordable, large volumes of digital handwritten data will be generated and the problem
of archiving and retrieving such data becomes an important concern. This thesis addresses
the problem of on-line document understanding, which is an essential component of an
effective retrieval algorithm.
This thesis describes a mathematical model for representation of on-line handwritten
data based on the mechanics of the writing process. The representation is used for extract-
ing various properties of the handwritten data, which forms the basis for understanding
the higher level structure of a document. A principled approach to the problem of docu-
ment segmentation is presented using a parsing technique based on stochastic context free
grammar (SCFG). The parser generates a segmentation of the handwritten page, which is
optimal with respect to a proposed compactness criterion. Additional properties of a region
are identi ed based on the nature and layout of handwritten strokes in the region. An al-
8/7/2019 Online HandWritten Document
http://slidepdf.com/reader/full/online-handwritten-document 6/191
gorithm to identify ruled and unruled tables is presented. The thesis also proposes a set of
features for identi cation of scripts within the text regions and develops an algorithm for
script classi cation.
The thesis presents a matching algorithm, which computes a similarity measure be-
tween the query and handwriting samples in a database. The query and database samples
could be either words or sketches, which are automatically identi ed by the document seg-
mentation algorithm. We also address the related problem of document security, where
on-line handwritten signatures are used to watermark on-line and off-line documents. The
use of a biometric trait, such as signature, for watermarking allows the recipient of a docu-
ment to verify the identity of the author in addition to document integrity.
8/7/2019 Online HandWritten Document
http://slidepdf.com/reader/full/online-handwritten-document 7/191
c Copyright 2004 by Anoop M. Namboodiri
All Rights Reserved

8/7/2019 Online HandWritten Document
http://slidepdf.com/reader/full/online-handwritten-document 8/191
To My Family
v

8/7/2019 Online HandWritten Document
http://slidepdf.com/reader/full/online-handwritten-document 9/191
8/7/2019 Online HandWritten Document
http://slidepdf.com/reader/full/online-handwritten-document 10/191
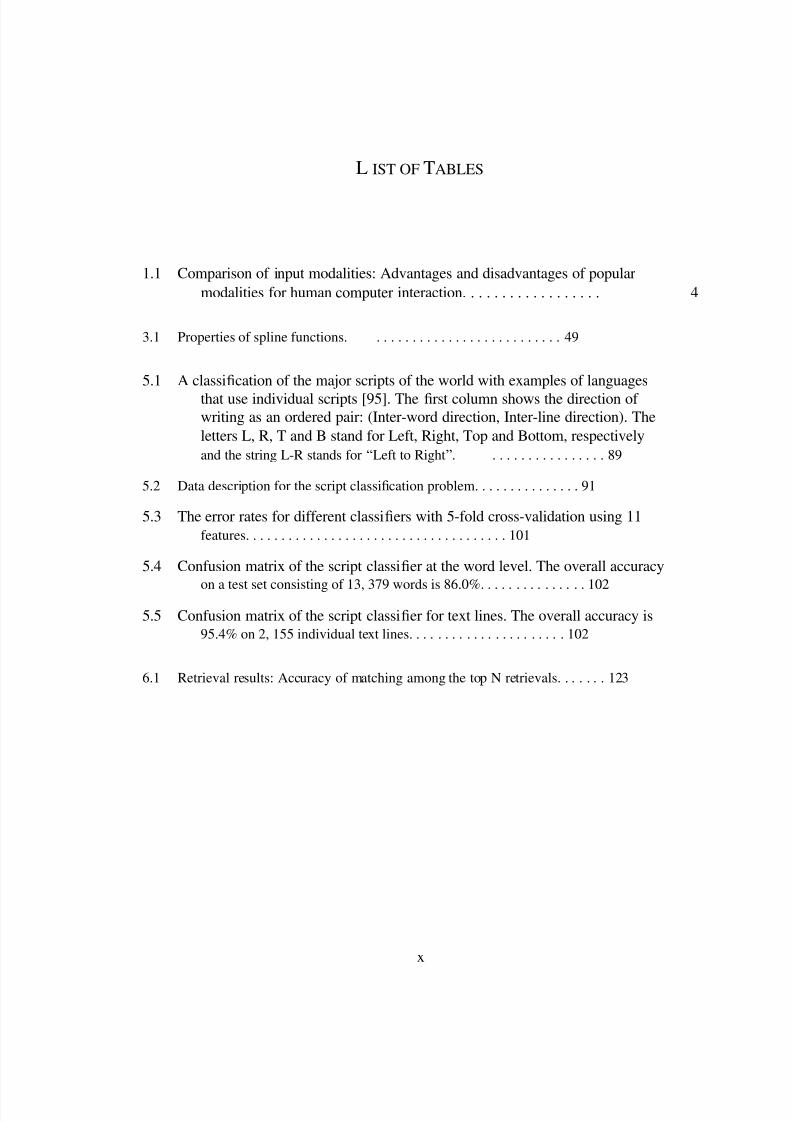
LIST OF TABLES
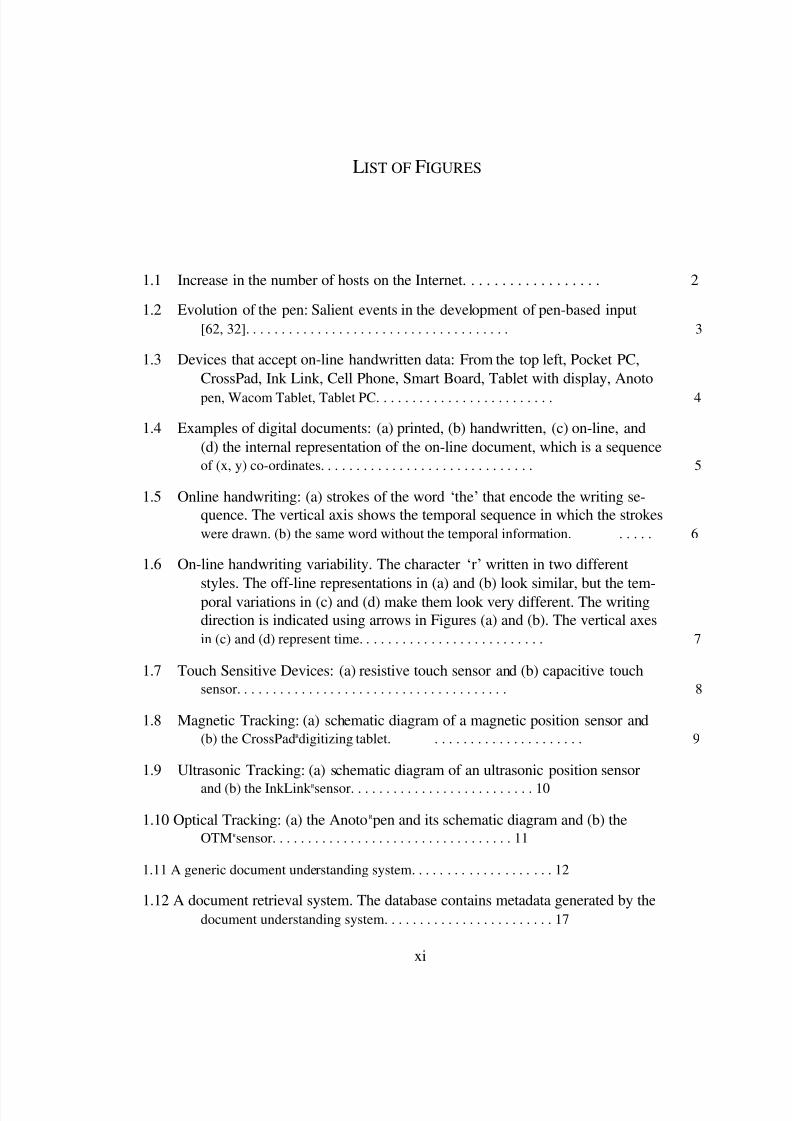
LIST OF FIGURES
1 Introduction
TABLE OF C ONTENTS
x
xi
1 1.1 Online Documents . . . . . . . . . . . . . . . . . . . . . . . . . . . . . . . . 21.2 On-line Data Capture . . . . . . . . . . . . . . . . . . . . . . . . . . . . . . . 71.3 A Document Understanding System . . . . . . . . . . . . . . . . . . . . . . . 10
1.3.1 Document Layout . . . . . . . . . . . . . . . . . . . . . . . . . . . . . . . . 121.4 Document Retrieval . . . . . . . . . . . . . . . . . . . . . . . . . . . . . . . . 131.4.1 Text and Sketch-based Retrieval . . . . . . . . . . . . . . . . . . . . . . . . 141.4.2 Structure-based Retrieval . . . . . . . . . . . . . . . . . . . . . . . . . . . . 141.5 Script Recognition . . . . . . . . . . . . . . . . . . . . . . . . . . . . . . . . 151.6 Security Issues in On-line Documents . . . . . . . . . . . . . . . . . . . . . . 161.7 Thesis Contribution and Outline . . . . . . . . . . . . . . . . . . . . . . . . . 18
2 Background in Document Understanding 22 2.1 Document Understanding . . . . . . . . . . . . . . . . . . . . . . . . . . . . . 222.2 Document Segmentation . . . . . . . . . . . . . . . . . . . . . . . . . . . . . 23
2.3 Document Indexing and Retrieval . . . . . . . . . . . . . . . . . . . . . . . . 252.4 Matching Queries . . . . . . . . . . . . . . . . . . . . . . . . . . . . . . . . . 312.4.1 Recognition-based Text Matching . . . . . . . . . . . . . . . . . . . . . . . 312.4.2 Recognition-based Picture Matching . . . . . . . . . . . . . . . . . . . . . . 332.4.3 Recognition-free Text Matching at the Stroke Level . . . . . . . . . . . . . . 342.4.4 Recognition-free Matching at Point Level . . . . . . . . . . . . . . . . . . . 372.4.5 Comparing the Matching Techniques . . . . . . . . . . . . . . . . . . . . . 382.5 Script Recognition . . . . . . . . . . . . . . . . . . . . . . . . . . . . . . . . 392.6 Document Security and Watermarking . . . . . . . . . . . . . . . . . . . . . . 402.7 Summary . . . . . . . . . . . . . . . . . . . . . . . . . . . . . . . . . . . . . 40
3 On-line Data Model 41 3.1 Handwriting Models . . . . . . . . . . . . . . . . . . . . . . . . . . . . . . . 433.1.1 Handwriting as a Point Sequence . . . . . . . . . . . . . . . . . . . . . . . . 453.1.2 The Oscillation Model . . . . . . . . . . . . . . . . . . . . . . . . . . . . . 453.1.3 The Delta Lognormal Model . . . . . . . . . . . . . . . . . . . . . . . . . . 463.1.4 Graphical Models . . . . . . . . . . . . . . . . . . . . . . . . . . . . . . . . 473.2 Splines for Handwriting . . . . . . . . . . . . . . . . . . . . . . . . . . . . . . 493.2.1 Spline Representation . . . . . . . . . . . . . . . . . . . . . . . . . . . . . 49
vii
8/7/2019 Online HandWritten Document
http://slidepdf.com/reader/full/online-handwritten-document 11/191
3.2.2 Computing the Spline Model . . . . . . . . . . . . . . . . . . . . . . . . . . 503.2.3 Properties of Splines . . . . . . . . . . . . . . . . . . . . . . . . . . . . . . 553.2.4 Approximation Error and Noise . . . . . . . . . . . . . . . . . . . . . . . . 563.3 Computing Stroke properties . . . . . . . . . . . . . . . . . . . . . . . . . . . 60
3.4 File Formats for On-line Data . . . . . . . . . . . . . . . . . . . . . . . . . . . 633.5 Document Database . . . . . . . . . . . . . . . . . . . . . . . . . . . . . . . . 653.6 Summary . . . . . . . . . . . . . . . . . . . . . . . . . . . . . . . . . . . . . 65
4 Structure Identi cation 67 4.0.1 Document Segmentation . . . . . . . . . . . . . . . . . . . . . . . . . . . . 694.1 Text versus Non-text Strokes . . . . . . . . . . . . . . . . . . . . . . . . . . . 70
4.2 Word and Region Segmentation . . . . . . . . . . . . . . . . . . . . . . . . . 734.2.1 Region Segmentation . . . . . . . . . . . . . . . . . . . . . . . . . . . . . . 75
4.3 Table Identi cation and Processing . . . . . . . . . . . . . . . . . . . . . . . . 77
4.3.1 Ruled Tables . . . . . . . . . . . . . . . . . . . . . . . . . . . . . . . . . . 784.3.2 Unruled Tables . . . . . . . . . . . . . . . . . . . . . . . . . . . . . . . . . 784.3.3 Table Processing . . . . . . . . . . . . . . . . . . . . . . . . . . . . . . . . 79
4.4 Experimental Results . . . . . . . . . . . . . . . . . . . . . . . . . . . . . . . 82
4.5 Summary . . . . . . . . . . . . . . . . . . . . . . . . . . . . . . . . . . . . . 85
5 Script Identi cation 87 5.1 Scripts and Languages . . . . . . . . . . . . . . . . . . . . . . . . . . . . . . 885.2 Multi-Script Data . . . . . . . . . . . . . . . . . . . . . . . . . . . . . . . . . 915.3 Feature Extraction . . . . . . . . . . . . . . . . . . . . . . . . . . . . . . . . . 91
5.4 Classi er Design . . . . . . . . . . . . . . . . . . . . . . . . . . . . . . . . . 985.4.1 Combining Multiple Classi ers . . . . . . . . . . . . . . . . . . . . . . . . 104
5.5 Feature Selection . . . . . . . . . . . . . . . . . . . . . . . . . . . . . . . . . 1045.6 Classi cation of Contiguous Words and Text Lines . . . . . . . . . . . . . . . 1055.7 Summary . . . . . . . . . . . . . . . . . . . . . . . . . . . . . . . . . . . . . 108
6 Matching and Retrieval 109 6.1 Indexing versus Retrieval . . . . . . . . . . . . . . . . . . . . . . . . . . . . . 1106.2 Word Matching . . . . . . . . . . . . . . . . . . . . . . . . . . . . . . . . . . 1126.3 Sketch Matching . . . . . . . . . . . . . . . . . . . . . . . . . . . . . . . . . 114
6.3.1 On-line Sketch Matching . . . . . . . . . . . . . . . . . . . . . . . . . . . . 1156.3.2 Proposed Algorithm . . . . . . . . . . . . . . . . . . . . . . . . . . . . . . 116
6.4 Experimental Results . . . . . . . . . . . . . . . . . . . . . . . . . . . . . . . 1196.4.1 Document Retrieval . . . . . . . . . . . . . . . . . . . . . . . . . . . . . . . 1206.4.2 Document Indexing . . . . . . . . . . . . . . . . . . . . . . . . . . . . . . . 120
6.4.3 Sketch Matching . . . . . . . . . . . . . . . . . . . . . . . . . . . . . . . . 1226.5 Summary . . . . . . . . . . . . . . . . . . . . . . . . . . . . . . . . . . . . . 124
viii
8/7/2019 Online HandWritten Document
http://slidepdf.com/reader/full/online-handwritten-document 12/191
8/7/2019 Online HandWritten Document
http://slidepdf.com/reader/full/online-handwritten-document 13/191
L IST OF TABLES
1.1 Comparison of input modalities: Advantages and disadvantages of popularmodalities for human computer interaction. . . . . . . . . . . . . . . . . . 4
3.1 Properties of spline functions. . . . . . . . . . . . . . . . . . . . . . . . . . . 49
5.1 A classi cation of the major scripts of the world with examples of languagesthat use individual scripts [95]. The rst column shows the direction of writing as an ordered pair: (Inter-word direction, Inter-line direction). Theletters L, R, T and B stand for Left, Right, Top and Bottom, respectivelyand the string L-R stands for “Left to Right ”. . . . . . . . . . . . . . . . . 89
5.2 Data description for the script classi cation problem. . . . . . . . . . . . . . . 91
5.3 The error rates for different classi ers with 5-fold cross-validation using 11features. . . . . . . . . . . . . . . . . . . . . . . . . . . . . . . . . . . . . 101
5.4 Confusion matrix of the script classi er at the word level. The overall accuracy
on a test set consisting of 13, 379 words is 86.0%. . . . . . . . . . . . . . . 102
5.5 Confusion matrix of the script classi er for text lines. The overall accuracy is95.4% on 2, 155 individual text lines. . . . . . . . . . . . . . . . . . . . . . 102
6.1 Retrieval results: Accuracy of matching among the top N retrievals. . . . . . . 123
x
8/7/2019 Online HandWritten Document
http://slidepdf.com/reader/full/online-handwritten-document 14/191
LIST OF FIGURES
1.1 Increase in the number of hosts on the Internet. . . . . . . . . . . . . . . . . . 2
1.2 Evolution of the pen: Salient events in the development of pen-based input[62, 32]. . . . . . . . . . . . . . . . . . . . . . . . . . . . . . . . . . . . . 3
1.3 Devices that accept on-line handwritten data: From the top left, Pocket PC,CrossPad, Ink Link, Cell Phone, Smart Board, Tablet with display, Anotopen, Wacom Tablet, Tablet PC. . . . . . . . . . . . . . . . . . . . . . . . . 4
1.4 Examples of digital documents: (a) printed, (b) handwritten, (c) on-line, and(d) the internal representation of the on-line document, which is a sequenceof (x, y) co-ordinates. . . . . . . . . . . . . . . . . . . . . . . . . . . . . . 5
1.5 Online handwriting: (a) strokes of the word „the‟that encode the writing se-quence. The vertical axis shows the temporal sequence in which the strokeswere drawn. (b) the same word without the temporal information. . . . . . 6
1.6 On-line handwriting variability. The character „r‟written in two different
styles. The off-line representations in (a) and (b) look similar, but the tem-poral variations in (c) and (d) make them look very different. The writingdirection is indicated using arrows in Figures (a) and (b). The vertical axesin (c) and (d) represent time. . . . . . . . . . . . . . . . . . . . . . . . . . 7
1.7 Touch Sensitive Devices: (a) resistive touch sensor and (b) capacitive touchsensor. . . . . . . . . . . . . . . . . . . . . . . . . . . . . . . . . . . . . . 8
1.8 Magnetic Tracking: (a) schematic diagram of a magnetic position sensor and(b) the CrossPad Rdigitizing tablet. . . . . . . . . . . . . . . . . . . . . . 9
1.9 Ultrasonic Tracking: (a) schematic diagram of an ultrasonic position sensorand (b) the InkLink Rsensor. . . . . . . . . . . . . . . . . . . . . . . . . . 10
1.10 Optical Tracking: (a) the Anoto Rpen and its schematic diagram and (b) theOTM Rsensor. . . . . . . . . . . . . . . . . . . . . . . . . . . . . . . . . . 11
1.11 A generic document understanding system. . . . . . . . . . . . . . . . . . . . 12
1.12 A document retrieval system. The database contains metadata generated by thedocument understanding system. . . . . . . . . . . . . . . . . . . . . . . . 17
xi
8/7/2019 Online HandWritten Document
http://slidepdf.com/reader/full/online-handwritten-document 15/191
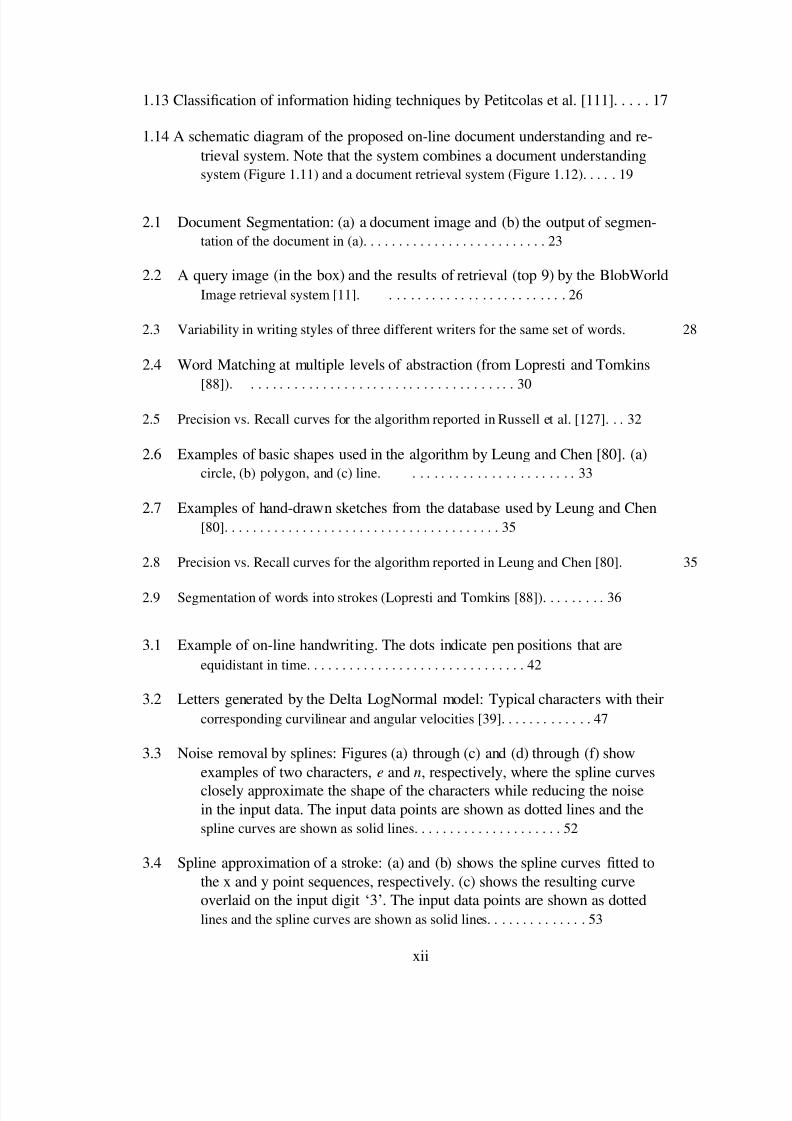
1.13 Classi cation of information hiding techniques by Petitcolas et al. [111]. . . . . 17
1.14 A schematic diagram of the proposed on-line document understanding and re-trieval system. Note that the system combines a document understandingsystem (Figure 1.11) and a document retrieval system (Figure 1.12). . . . . 19
2.1 Document Segmentation: (a) a document image and (b) the output of segmen-tation of the document in (a). . . . . . . . . . . . . . . . . . . . . . . . . . 23
2.2 A query image (in the box) and the results of retrieval (top 9) by the BlobWorldImage retrieval system [11]. . . . . . . . . . . . . . . . . . . . . . . . . . 26
2.3 Variability in writing styles of three different writers for the same set of words. 28
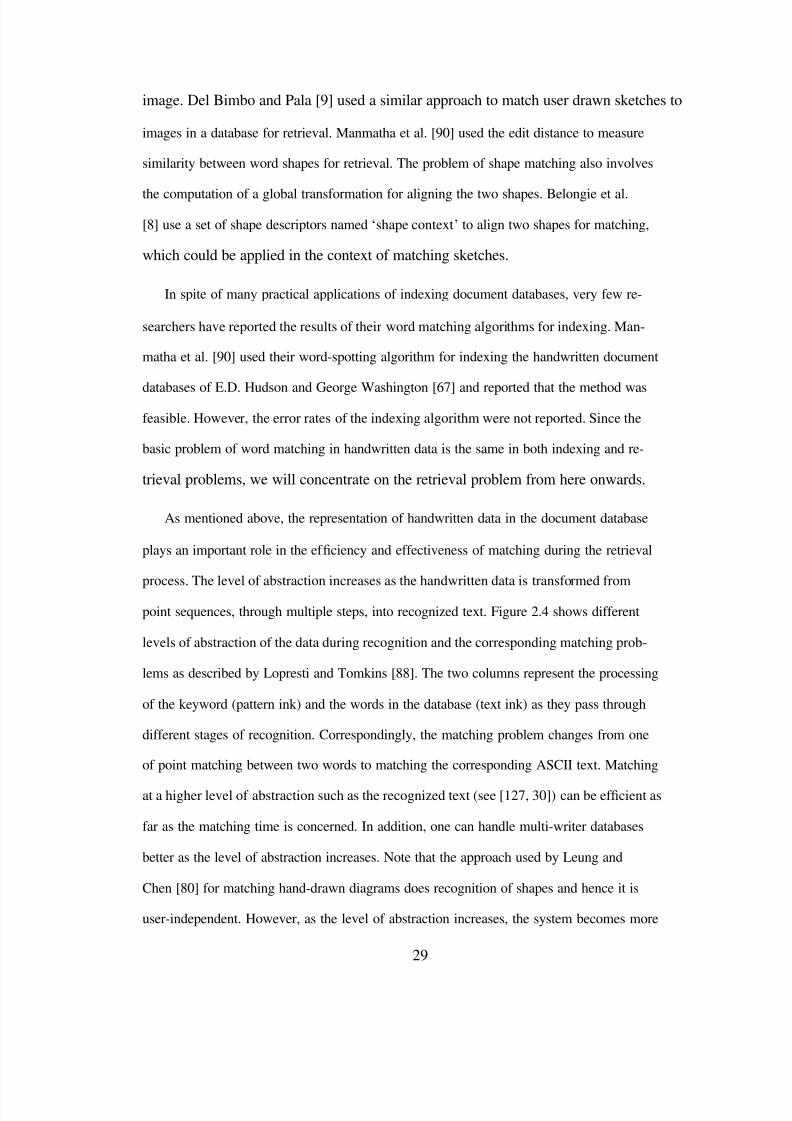
2.4 Word Matching at multiple levels of abstraction (from Lopresti and Tomkins[88]). . . . . . . . . . . . . . . . . . . . . . . . . . . . . . . . . . . . . . 30
2.5 Precision vs. Recall curves for the algorithm reported in Russell et al. [127]. . . 32
2.6 Examples of basic shapes used in the algorithm by Leung and Chen [80]. (a)circle, (b) polygon, and (c) line. . . . . . . . . . . . . . . . . . . . . . . . 33
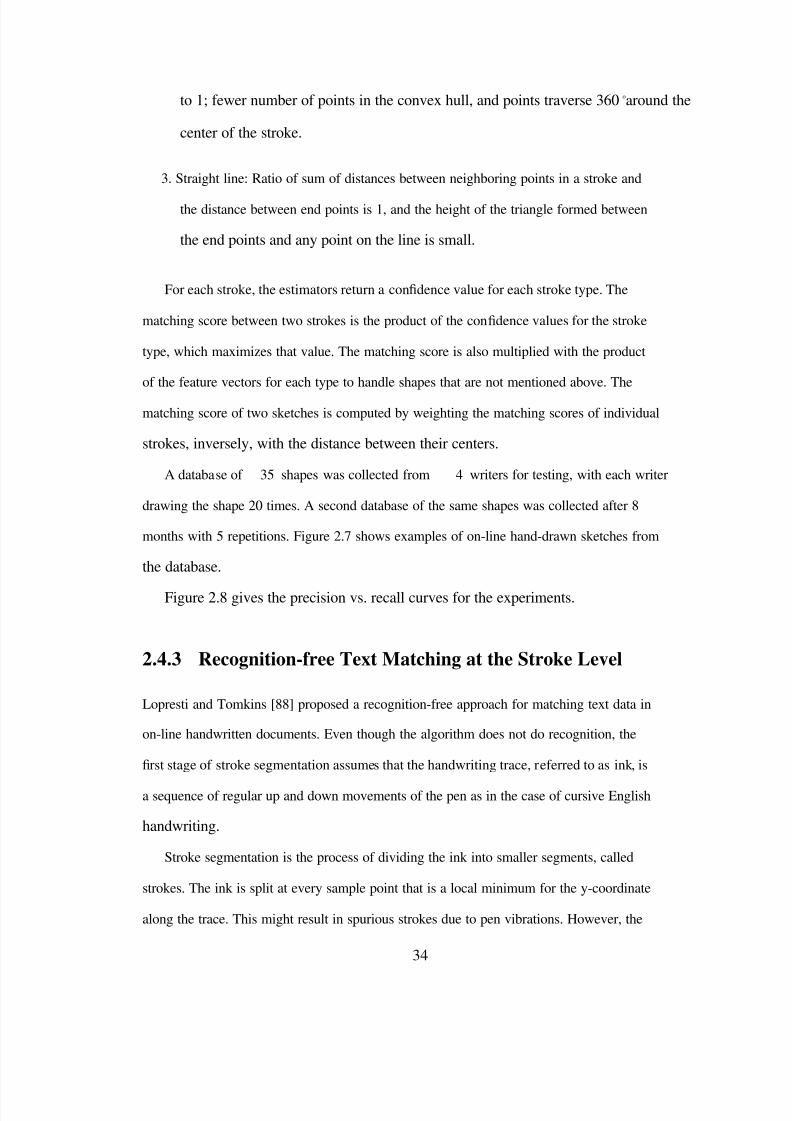
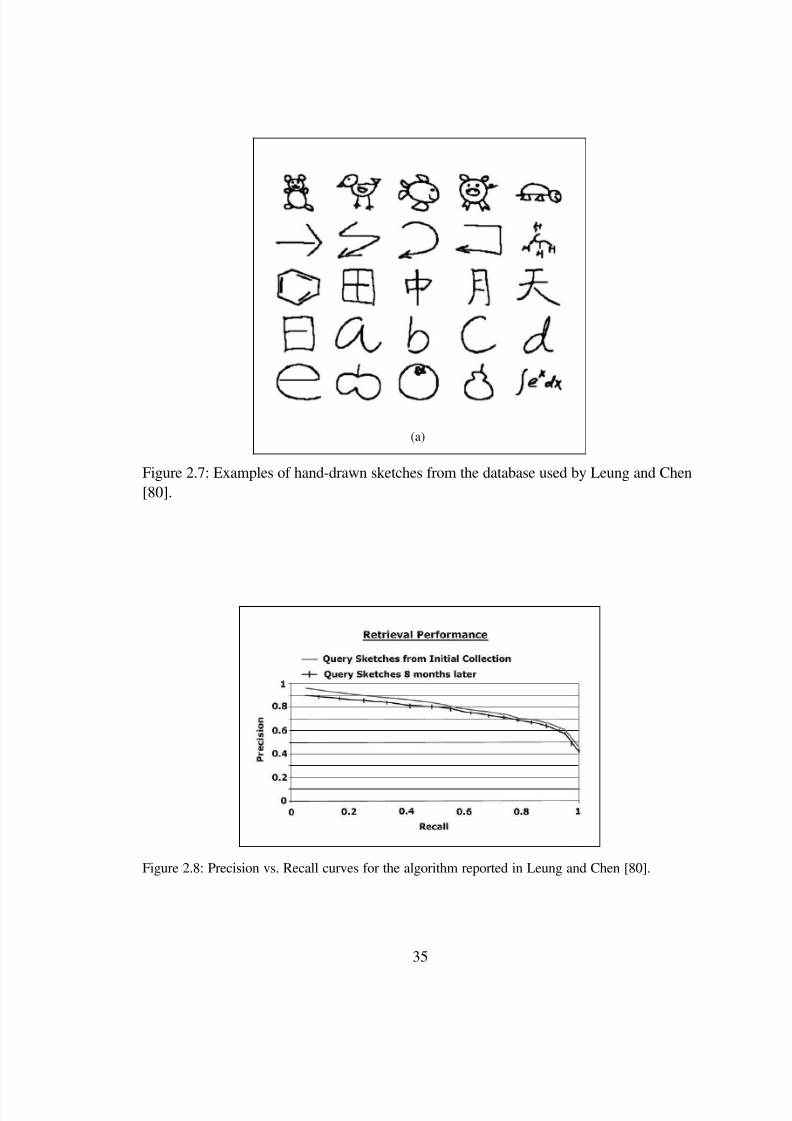
2.7 Examples of hand-drawn sketches from the database used by Leung and Chen[80]. . . . . . . . . . . . . . . . . . . . . . . . . . . . . . . . . . . . . . . 35
2.8 Precision vs. Recall curves for the algorithm reported in Leung and Chen [80]. 35
2.9 Segmentation of words into strokes (Lopresti and Tomkins [88]). . . . . . . . . 36
3.1 Example of on-line handwriting. The dots indicate pen positions that areequidistant in time. . . . . . . . . . . . . . . . . . . . . . . . . . . . . . . 42
3.2 Letters generated by the Delta LogNormal model: Typical characters with theircorresponding curvilinear and angular velocities [39]. . . . . . . . . . . . . 47
3.3 Noise removal by splines: Figures (a) through (c) and (d) through (f) showexamples of two characters, e and n, respectively, where the spline curvesclosely approximate the shape of the characters while reducing the noisein the input data. The input data points are shown as dotted lines and thespline curves are shown as solid lines. . . . . . . . . . . . . . . . . . . . . 52
3.4 Spline approximation of a stroke: (a) and (b) shows the spline curves tted tothe x and y point sequences, respectively. (c) shows the resulting curveoverlaid on the input digit „3‟. The input data points are shown as dottedlines and the spline curves are shown as solid lines. . . . . . . . . . . . . . 53
xii
8/7/2019 Online HandWritten Document
http://slidepdf.com/reader/full/online-handwritten-document 16/191
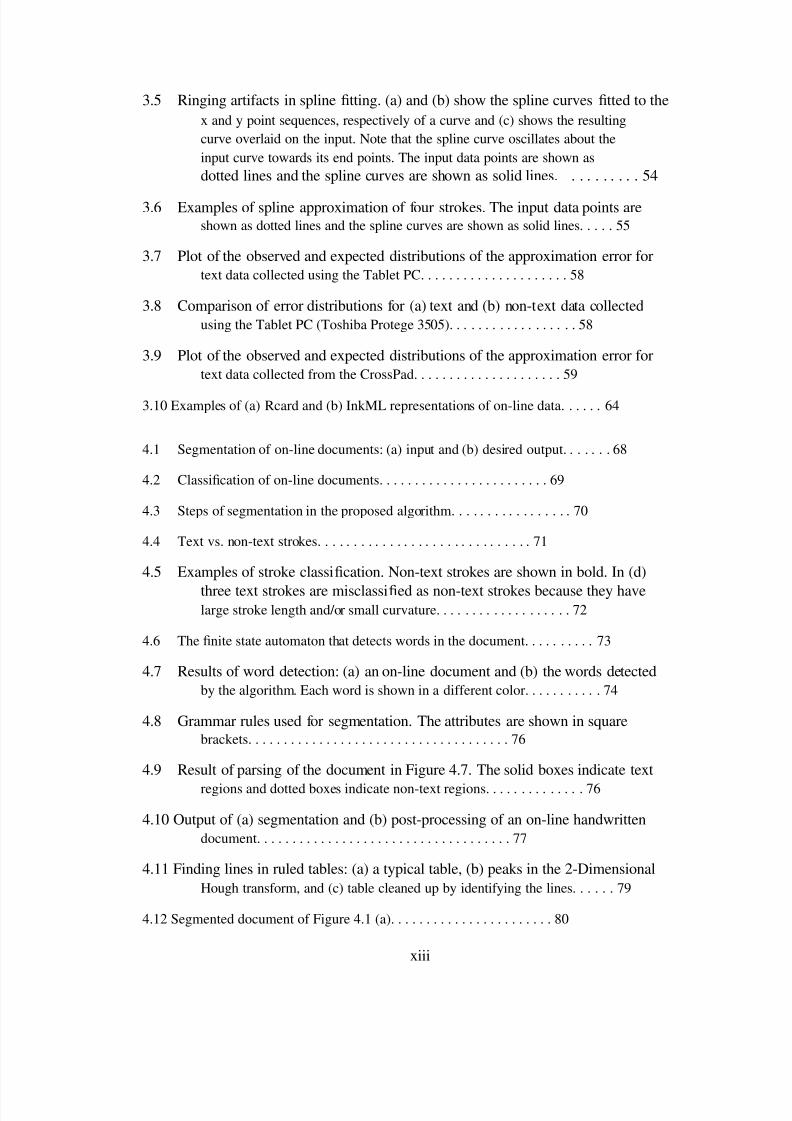
3.5 Ringing artifacts in spline tting. (a) and (b) show the spline curves tted to thex and y point sequences, respectively of a curve and (c) shows the resultingcurve overlaid on the input. Note that the spline curve oscillates about theinput curve towards its end points. The input data points are shown asdotted lines and the spline curves are shown as solid lines. . . . . . . . . . 54
3.6 Examples of spline approximation of four strokes. The input data points areshown as dotted lines and the spline curves are shown as solid lines. . . . . 55
3.7 Plot of the observed and expected distributions of the approximation error fortext data collected using the Tablet PC. . . . . . . . . . . . . . . . . . . . . 58
3.8 Comparison of error distributions for (a) text and (b) non-text data collectedusing the Tablet PC (Toshiba Protege 3505). . . . . . . . . . . . . . . . . . 58
3.9 Plot of the observed and expected distributions of the approximation error fortext data collected from the CrossPad. . . . . . . . . . . . . . . . . . . . . 59
3.10 Examples of (a) Rcard and (b) InkML representations of on-line data. . . . . . 64
4.1 Segmentation of on-line documents: (a) input and (b) desired output. . . . . . . 68
4.2 Classi cation of on-line documents. . . . . . . . . . . . . . . . . . . . . . . . 69
4.3 Steps of segmentation in the proposed algorithm. . . . . . . . . . . . . . . . . 70
4.4 Text vs. non-text strokes. . . . . . . . . . . . . . . . . . . . . . . . . . . . . . 71
4.5 Examples of stroke classi cation. Non-text strokes are shown in bold. In (d)
three text strokes are misclassi ed as non-text strokes because they havelarge stroke length and/or small curvature. . . . . . . . . . . . . . . . . . . 72
4.6 The nite state automaton that detects words in the document. . . . . . . . . . 73
4.7 Results of word detection: (a) an on-line document and (b) the words detectedby the algorithm. Each word is shown in a different color. . . . . . . . . . . 74
4.8 Grammar rules used for segmentation. The attributes are shown in squarebrackets. . . . . . . . . . . . . . . . . . . . . . . . . . . . . . . . . . . . . 76
4.9 Result of parsing of the document in Figure 4.7. The solid boxes indicate textregions and dotted boxes indicate non-text regions. . . . . . . . . . . . . . 76
4.10 Output of (a) segmentation and (b) post-processing of an on-line handwrittendocument. . . . . . . . . . . . . . . . . . . . . . . . . . . . . . . . . . . . 77
4.11 Finding lines in ruled tables: (a) a typical table, (b) peaks in the 2-DimensionalHough transform, and (c) table cleaned up by identifying the lines. . . . . . 79
4.12 Segmented document of Figure 4.1 (a). . . . . . . . . . . . . . . . . . . . . . . 80
xiii
8/7/2019 Online HandWritten Document
http://slidepdf.com/reader/full/online-handwritten-document 17/191
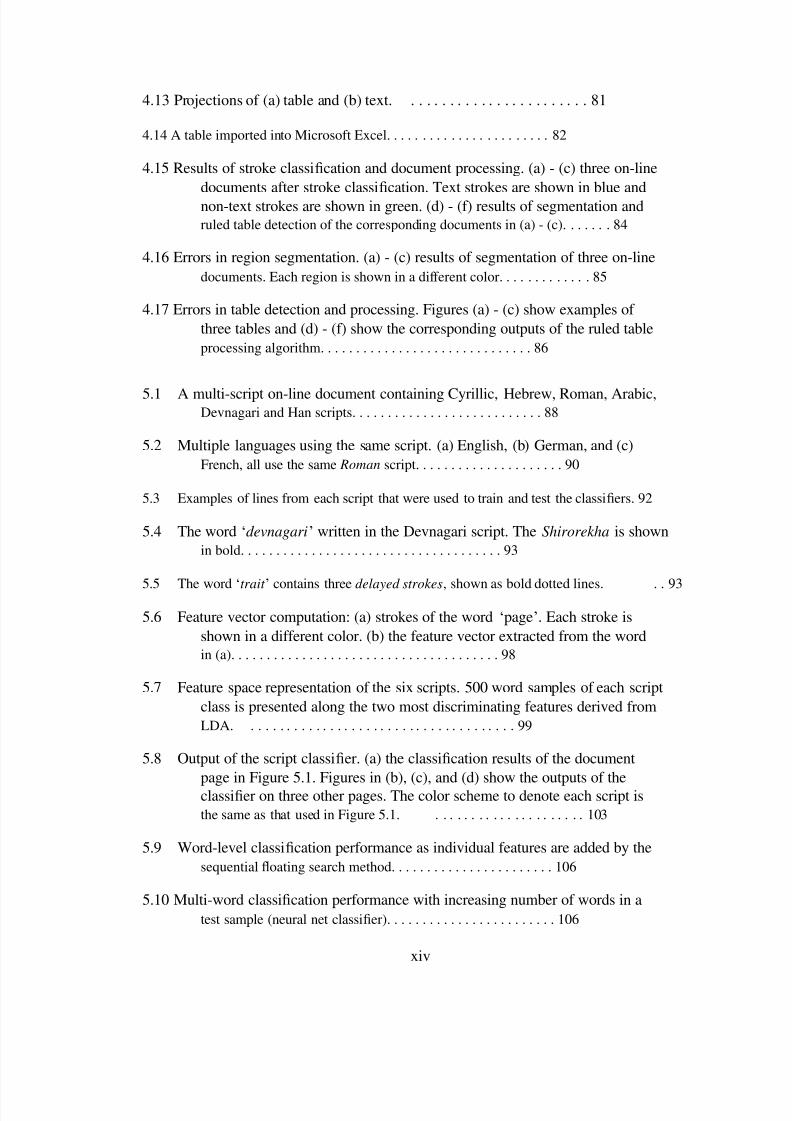
4.13 Projections of (a) table and (b) text. . . . . . . . . . . . . . . . . . . . . . . . 81
4.14 A table imported into Microsoft Excel. . . . . . . . . . . . . . . . . . . . . . . 82
4.15 Results of stroke classi cation and document processing. (a) - (c) three on-linedocuments after stroke classi cation. Text strokes are shown in blue andnon-text strokes are shown in green. (d) - (f) results of segmentation andruled table detection of the corresponding documents in (a) - (c). . . . . . . 84
4.16 Errors in region segmentation. (a) - (c) results of segmentation of three on-linedocuments. Each region is shown in a different color. . . . . . . . . . . . . 85
4.17 Errors in table detection and processing. Figures (a) - (c) show examples of three tables and (d) - (f) show the corresponding outputs of the ruled tableprocessing algorithm. . . . . . . . . . . . . . . . . . . . . . . . . . . . . . 86
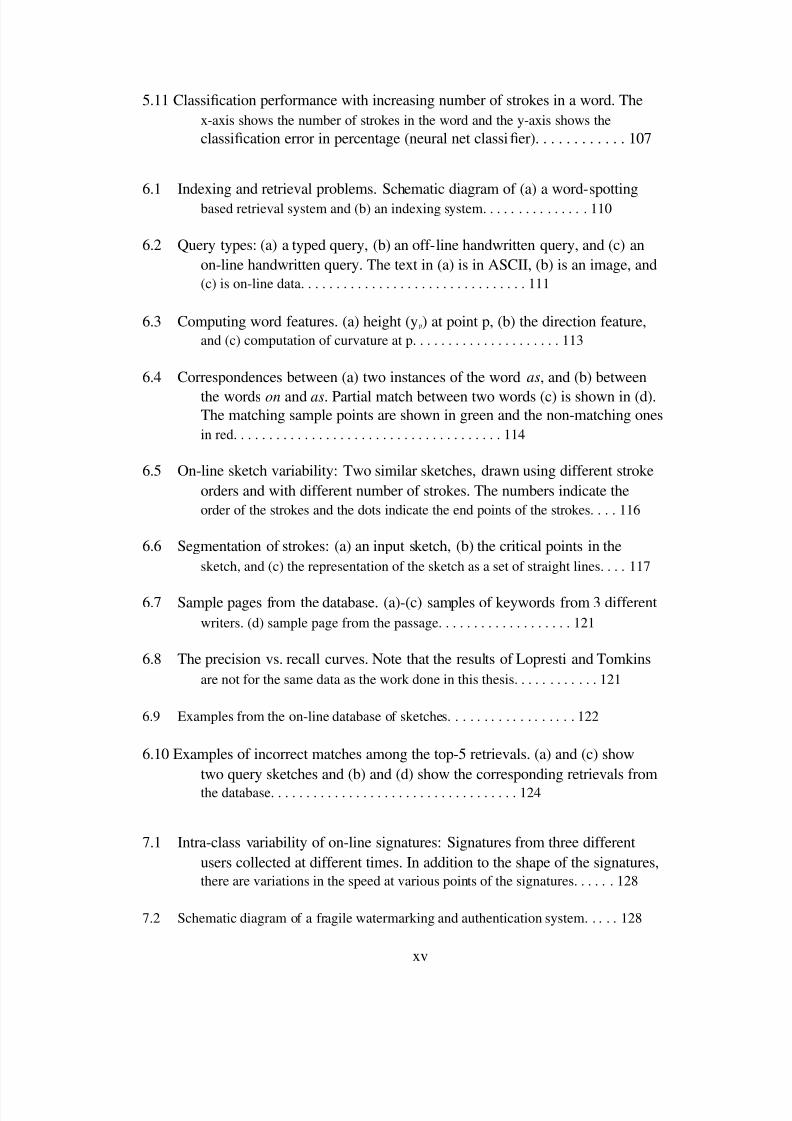
5.1 A multi-script on-line document containing Cyrillic, Hebrew, Roman, Arabic,Devnagari and Han scripts. . . . . . . . . . . . . . . . . . . . . . . . . . . 88
5.2 Multiple languages using the same script. (a) English, (b) German, and (c)French, all use the same Roman script. . . . . . . . . . . . . . . . . . . . . 90
5.3 Examples of lines from each script that were used to train and test the classi ers. 92
5.4 The word „devnagari ‟written in the Devnagari script. The Shirorekha is shownin bold. . . . . . . . . . . . . . . . . . . . . . . . . . . . . . . . . . . . . 93
5.5 The word „trait ‟contains three delayed strokes , shown as bold dotted lines. . . 93
5.6 Feature vector computation: (a) strokes of the word „page ‟. Each stroke isshown in a different color. (b) the feature vector extracted from the wordin (a). . . . . . . . . . . . . . . . . . . . . . . . . . . . . . . . . . . . . . 98
5.7 Feature space representation of the six scripts. 500 word samples of each scriptclass is presented along the two most discriminating features derived fromLDA. . . . . . . . . . . . . . . . . . . . . . . . . . . . . . . . . . . . . . 99
5.8 Output of the script classi er. (a) the classi cation results of the documentpage in Figure 5.1. Figures in (b), (c), and (d) show the outputs of theclassi er on three other pages. The color scheme to denote each script isthe same as that used in Figure 5.1. . . . . . . . . . . . . . . . . . . . . . 103
5.9 Word-level classi cation performance as individual features are added by thesequential oating search method. . . . . . . . . . . . . . . . . . . . . . . 106
5.10 Multi-word classi cation performance with increasing number of words in atest sample (neural net classi er). . . . . . . . . . . . . . . . . . . . . . . . 106
xiv
8/7/2019 Online HandWritten Document
http://slidepdf.com/reader/full/online-handwritten-document 18/191
8/7/2019 Online HandWritten Document
http://slidepdf.com/reader/full/online-handwritten-document 19/191
7.3 Generation of watermark image from an on-line signature: (a) on-line signatureof the author, (b) the signature, whose strokes are connected together toform a single stroke, and (c) the binary image obtained from (b). Thebinary image in (b) is shuf ed to get the watermark image in (d). . . . . . . 130
7.4 Detecting tampered locations in a document image: (a) a watermarked docu-ment image, (b) the image in (a) that has been modi ed at three locations,and (c) the result of watermark detection. Note that the pixels where achange is detected are shown in red. . . . . . . . . . . . . . . . . . . . . . 131
7.5 Recovering the embedded signature: (a) a watermarked document image, (b)the watermark image extracted from (a), (c) the binary image obtained bythe inverse shuf ing function, and (d) the on-line signature recovered from(c). . . . . . . . . . . . . . . . . . . . . . . . . . . . . . . . . . . . . . . . 132
7.6 Genuine and forged signatures: (a) on-line signature by genuine user, and (b)an attempt to forge (a) by copying from an off-line sample. The strokeswere drawn in the order blue, green, and red. The dots on the strokesrepresent sample points and arrows represent the writing direction. . . . . . 134
7.7 Schematic diagram of a signature veri cation system. . . . . . . . . . . . . . . 135
7.8 ROC curve of the signature veri cation system. . . . . . . . . . . . . . . . . . 135
7.9 Examples of document images used in the watermarking experiments. . . . . . 136
8.1 A schematic diagram of the on-line document understanding and retrieval sys-tem proposed in this thesis. . . . . . . . . . . . . . . . . . . . . . . . . . . 138
B.1 Examples of on-line documents used in the structure detection experiments. . . 148
B.2 Examples of on-line documents used in the script recognition experiments. (a)Arabic, (b) Hebrew, (c) Cyrillic, and (d) Han scripts. . . . . . . . . . . . . 149
B.3 Examples of on-line documents used in the script recognition experiments. (a)Devnagari, (b) Roman, (c,d) multilingual with both Roman and Han scripts. 150
B.4 Examples of on-line documents used for word-spotting based indexing andretrieval. . . . . . . . . . . . . . . . . . . . . . . . . . . . . . . . . . . . . 151
xvi
8/7/2019 Online HandWritten Document
http://slidepdf.com/reader/full/online-handwritten-document 20/191
8/7/2019 Online HandWritten Document
http://slidepdf.com/reader/full/online-handwritten-document 21/191
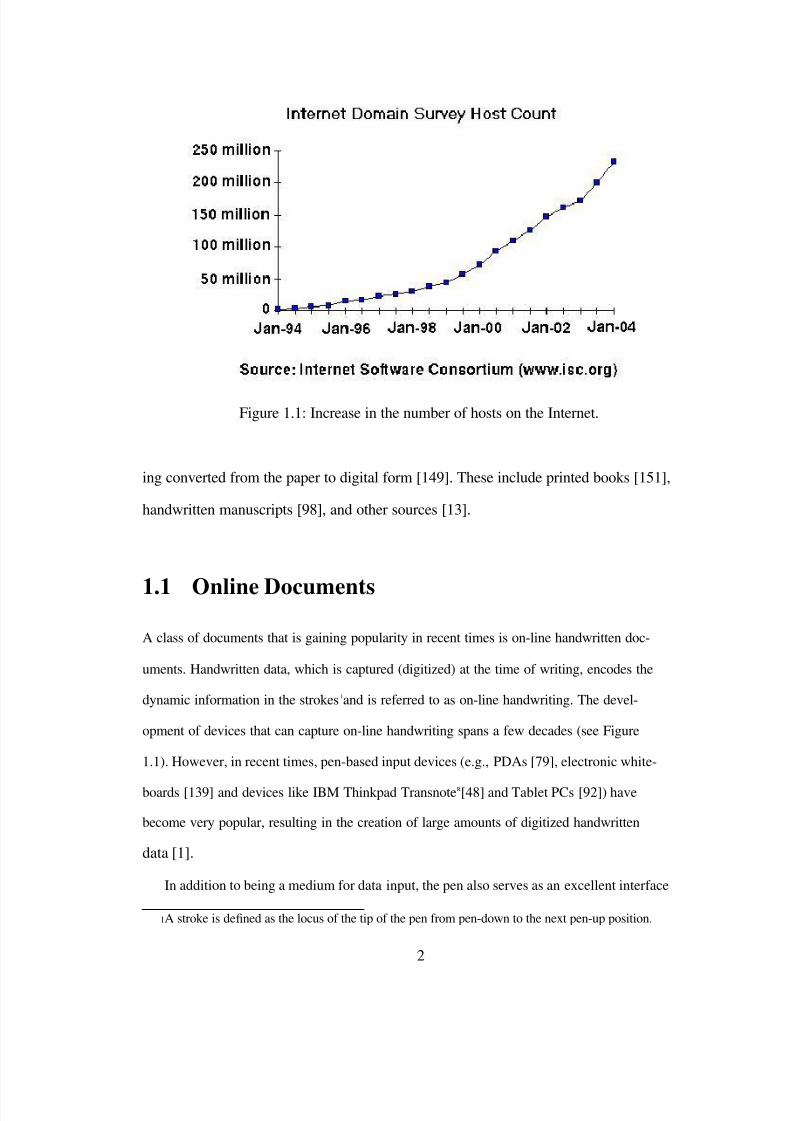
Figure 1.1: Increase in the number of hosts on the Internet.
ing converted from the paper to digital form [149]. These include printed books [151],
handwritten manuscripts [98], and other sources [13].
1.1 Online Documents
A class of documents that is gaining popularity in recent times is on-line handwritten doc-
uments. Handwritten data, which is captured (digitized) at the time of writing, encodes the
dynamic information in the strokes 1and is referred to as on-line handwriting. The devel-
opment of devices that can capture on-line handwriting spans a few decades (see Figure
1.1). However, in recent times, pen-based input devices (e.g., PDAs [79], electronic white-
boards [139] and devices like IBM Thinkpad Transnote R[48] and Tablet PCs [92]) have
become very popular, resulting in the creation of large amounts of digitized handwritten
data [1].
In addition to being a medium for data input, the pen also serves as an excellent interface
1A stroke is de ned as the locus of the tip of the pen from pen-down to the next pen-up position.
2
8/7/2019 Online HandWritten Document
http://slidepdf.com/reader/full/online-handwritten-document 22/191
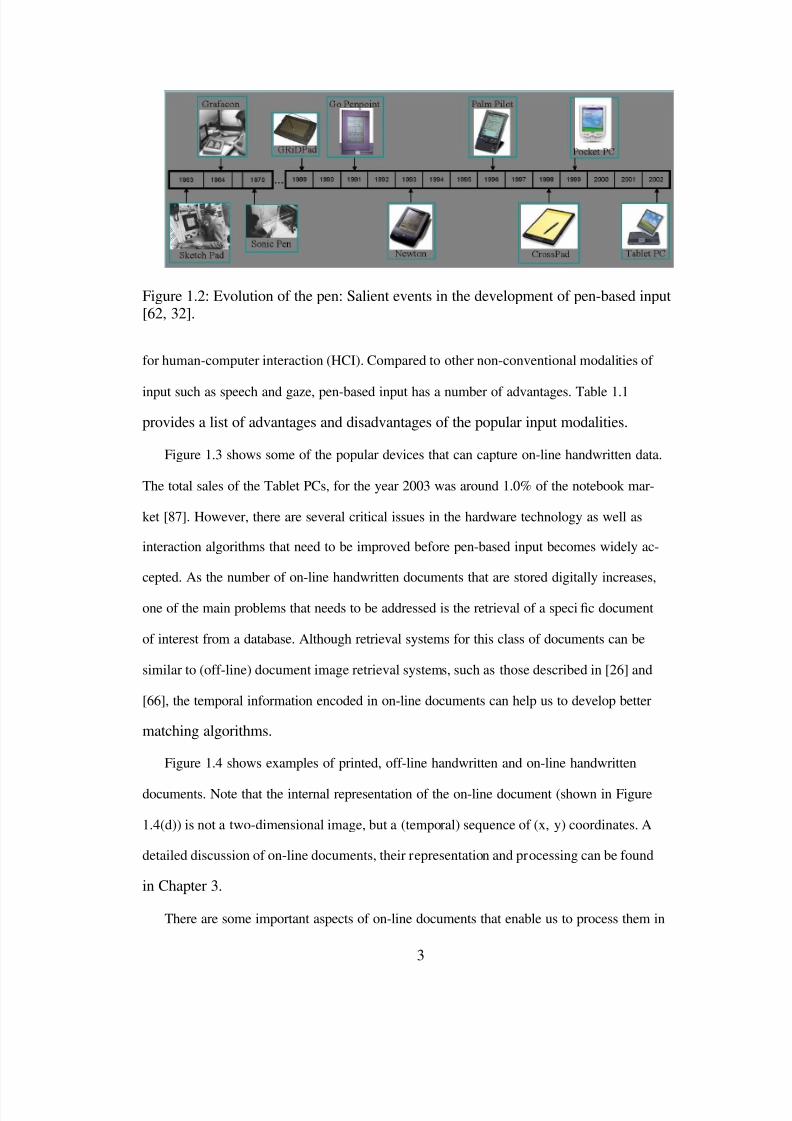
Figure 1.2: Evolution of the pen: Salient events in the development of pen-based input[62, 32].
for human-computer interaction (HCI). Compared to other non-conventional modalities of
input such as speech and gaze, pen-based input has a number of advantages. Table 1.1
provides a list of advantages and disadvantages of the popular input modalities.
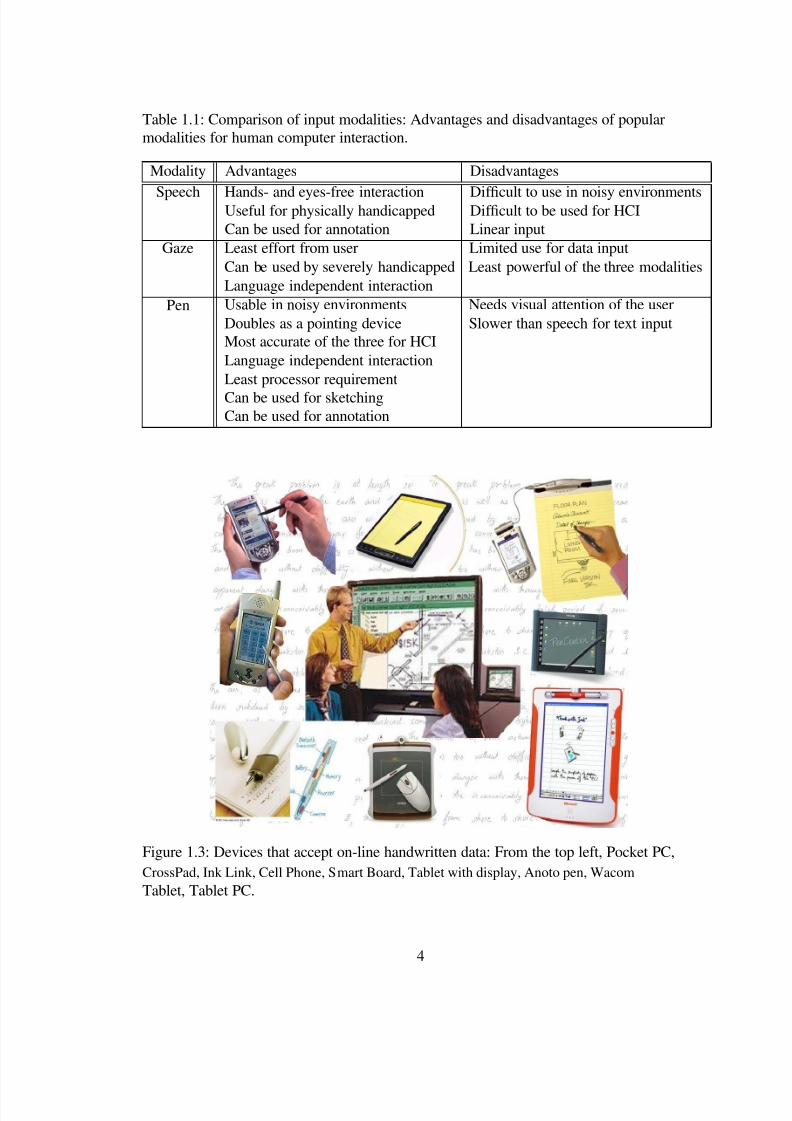
Figure 1.3 shows some of the popular devices that can capture on-line handwritten data.
The total sales of the Tablet PCs, for the year 2003 was around 1.0% of the notebook mar-
ket [87]. However, there are several critical issues in the hardware technology as well as
interaction algorithms that need to be improved before pen-based input becomes widely ac-
cepted. As the number of on-line handwritten documents that are stored digitally increases,
one of the main problems that needs to be addressed is the retrieval of a speci c document
of interest from a database. Although retrieval systems for this class of documents can be
similar to (off-line) document image retrieval systems, such as those described in [26] and
[66], the temporal information encoded in on-line documents can help us to develop better
matching algorithms.
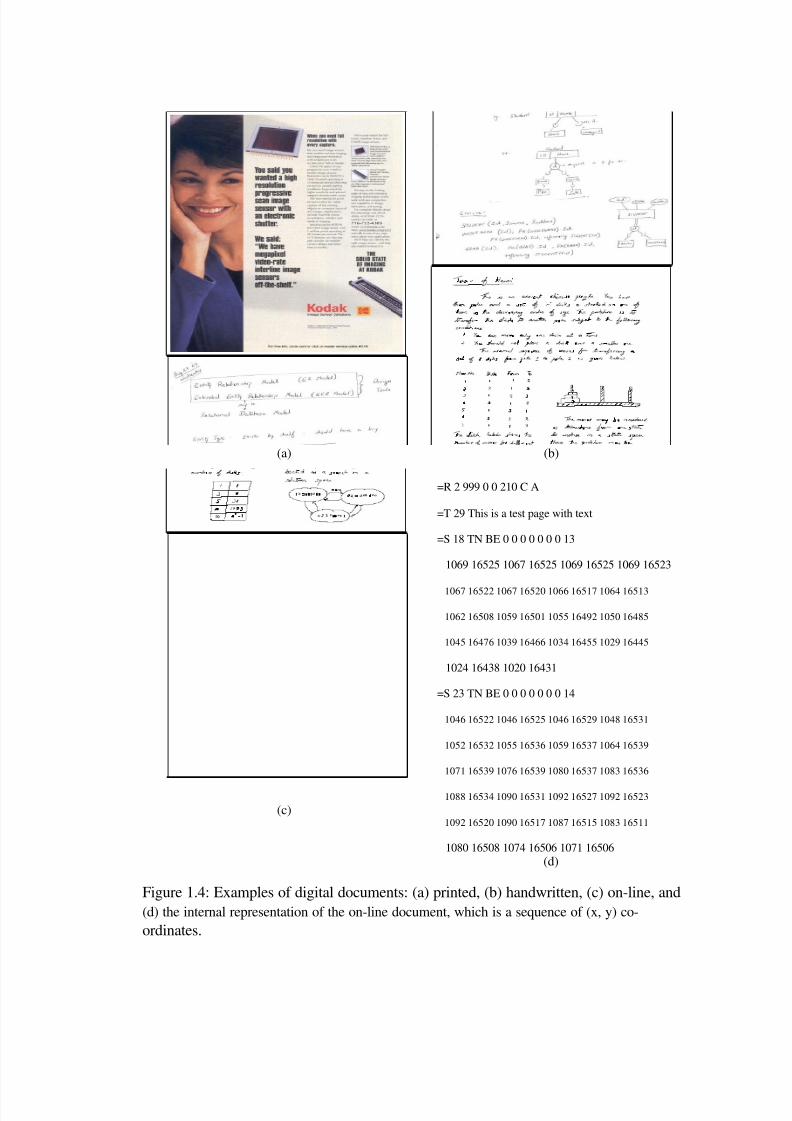
Figure 1.4 shows examples of printed, off-line handwritten and on-line handwritten
documents. Note that the internal representation of the on-line document (shown in Figure
1.4(d)) is not a two-dimensional image, but a (temporal) sequence of (x, y) coordinates. A
detailed discussion of on-line documents, their representation and processing can be found
in Chapter 3.
There are some important aspects of on-line documents that enable us to process them in
3
8/7/2019 Online HandWritten Document
http://slidepdf.com/reader/full/online-handwritten-document 23/191
Table 1.1: Comparison of input modalities: Advantages and disadvantages of popularmodalities for human computer interaction.
Modality Advantages
Speech Hands- and eyes-free interactionUseful for physically handicappedCan be used for annotation
Disadvantages
Dif cult to use in noisy environmentsDif cult to be used for HCILinear input
Gaze Least effort from user Limited use for data input
Pen
Can be used by severely handicapped Least powerful of the three modalitiesLanguage independent interactionUsable in noisy environments Needs visual attention of the userDoubles as a pointing device Slower than speech for text inputMost accurate of the three for HCILanguage independent interactionLeast processor requirementCan be used for sketchingCan be used for annotation
Figure 1.3: Devices that accept on-line handwritten data: From the top left, Pocket PC,CrossPad, Ink Link, Cell Phone, Smart Board, Tablet with display, Anoto pen, WacomTablet, Tablet PC.
4
8/7/2019 Online HandWritten Document
http://slidepdf.com/reader/full/online-handwritten-document 24/191
(a)
=R 2 999 0 0 210 C A
(b)
(c)
=T 29 This is a test page with text
=S 18 TN BE 0 0 0 0 0 0 0 13
1069 16525 1067 16525 1069 16525 1069 16523
1067 16522 1067 16520 1066 16517 1064 16513
1062 16508 1059 16501 1055 16492 1050 16485
1045 16476 1039 16466 1034 16455 1029 16445
1024 16438 1020 16431
=S 23 TN BE 0 0 0 0 0 0 0 14
1046 16522 1046 16525 1046 16529 1048 16531
1052 16532 1055 16536 1059 16537 1064 16539
1071 16539 1076 16539 1080 16537 1083 16536
1088 16534 1090 16531 1092 16527 1092 16523
1092 16520 1090 16517 1087 16515 1083 16511
1080 16508 1074 16506 1071 16506(d)
Figure 1.4: Examples of digital documents: (a) printed, (b) handwritten, (c) on-line, and(d) the internal representation of the on-line document, which is a sequence of (x, y) co-ordinates.

8/7/2019 Online HandWritten Document
http://slidepdf.com/reader/full/online-handwritten-document 25/191
5
8/7/2019 Online HandWritten Document
http://slidepdf.com/reader/full/online-handwritten-document 26/191
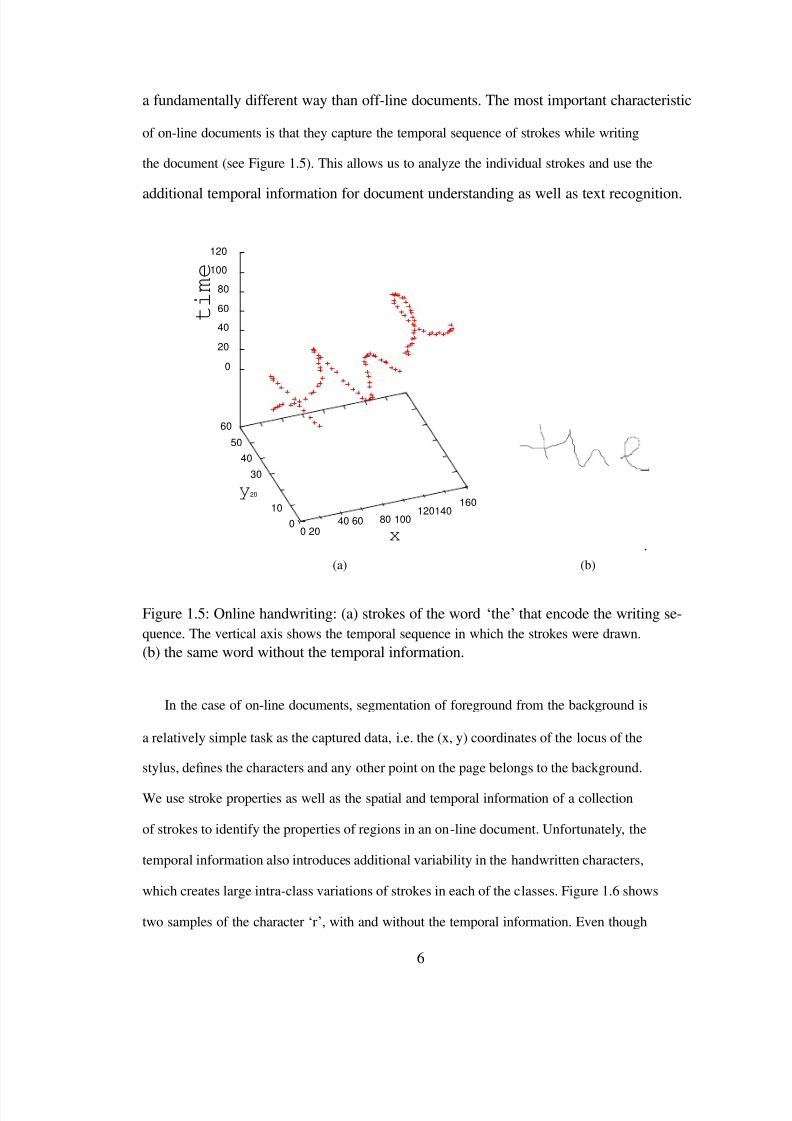
a fundamentally different way than off-line documents. The most important characteristic
of on-line documents is that they capture the temporal sequence of strokes while writing
the document (see Figure 1.5). This allows us to analyze the individual strokes and use the
additional temporal information for document understanding as well as text recognition.
120
100
80
60
40
20
0
60
5040
30
y 20 10
00 20
40 60
(a)
160120140
80 100
x
(b).
Figure 1.5: Online handwriting: (a) strokes of the word „the‟that encode the writing se-quence. The vertical axis shows the temporal sequence in which the strokes were drawn.(b) the same word without the temporal information.
In the case of on-line documents, segmentation of foreground from the background is
a relatively simple task as the captured data, i.e. the (x, y) coordinates of the locus of the
stylus, de nes the characters and any other point on the page belongs to the background.
We use stroke properties as well as the spatial and temporal information of a collection
of strokes to identify the properties of regions in an on-line document. Unfortunately, the
temporal information also introduces additional variability in the handwritten characters,
which creates large intra-class variations of strokes in each of the classes. Figure 1.6 shows
two samples of the character „r‟, with and without the temporal information. Even though
6
time

8/7/2019 Online HandWritten Document
http://slidepdf.com/reader/full/online-handwritten-document 27/191
the spatial representations in Figures 1.6(a) and 1.6(b) look similar, the temporal differ-
ences introduce large intra-class variability in the on-line data as shown in Figures 1.6(c)
and 1.6(d).
¡
¡
(a)
(c)
¢£¢¤£¤¢£¢
£¤£
(b)
(d)
¡¢¡¢
¡
Figure 1.6: On-line handwriting variability. The character „r‟written in two different styles.The off-line representations in (a) and (b) look similar, but the temporal variations in (c)and (d) make them look very different. The writing direction is indicated using arrows inFigures (a) and (b). The vertical axes in (c) and (d) represent time.
1.2 On-line Data Capture The technology used for the capture of on-line data is an important factor in determining the
quality of the data that is available for processing. The technologies vary in the sampling
resolution (both spatial and temporal), user feedback, active components of the system,
durability, accuracy, cost, etc. Depending on the technology, the capturing devices can
7
8/7/2019 Online HandWritten Document
http://slidepdf.com/reader/full/online-handwritten-document 28/191
provide a variety of information such as the (x, y) co-ordinates of the pen tip, a boolean
value indicating contact with x − y plane, pressure, angles with the x − y plane ( φx, φy)
or tilt, distance from x − y plane (height), etc. This section describes some of the popular
technologies for capture of on-line data.
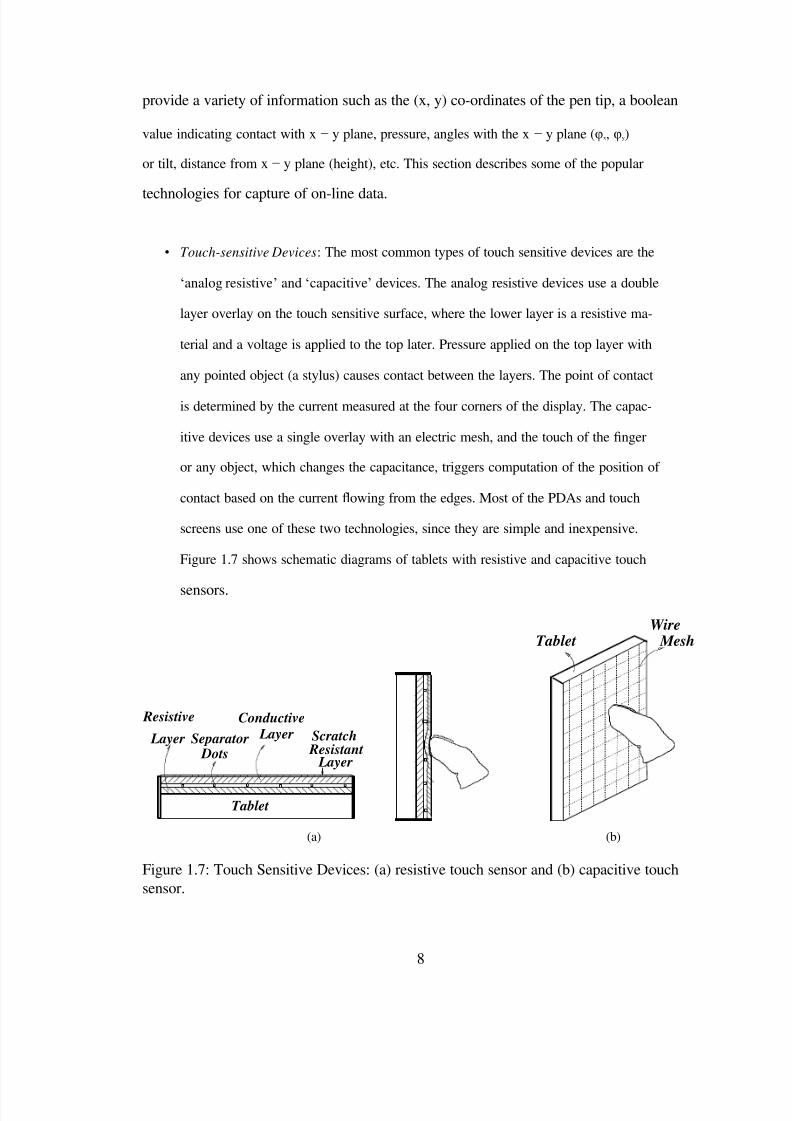
• Touch-sensitive Devices : The most common types of touch sensitive devices are the
„analog resistive ‟and „capacitive ‟devices. The analog resistive devices use a double
layer overlay on the touch sensitive surface, where the lower layer is a resistive ma-
terial and a voltage is applied to the top later. Pressure applied on the top layer with
any pointed object (a stylus) causes contact between the layers. The point of contact
is determined by the current measured at the four corners of the display. The capac-
itive devices use a single overlay with an electric mesh, and the touch of the nger
or any object, which changes the capacitance, triggers computation of the position of
contact based on the current owing from the edges. Most of the PDAs and touch
screens use one of these two technologies, since they are simple and inexpensive.
Figure 1.7 shows schematic diagrams of tablets with resistive and capacitive touch
sensors.
Wire
Resistive Conductive
Tablet Mesh
Layer Separator Dots
Layer Scratch Resistant
Layer
Tablet
(a) (b)
Figure 1.7: Touch Sensitive Devices: (a) resistive touch sensor and (b) capacitive touchsensor.
8
8/7/2019 Online HandWritten Document
http://slidepdf.com/reader/full/online-handwritten-document 29/191
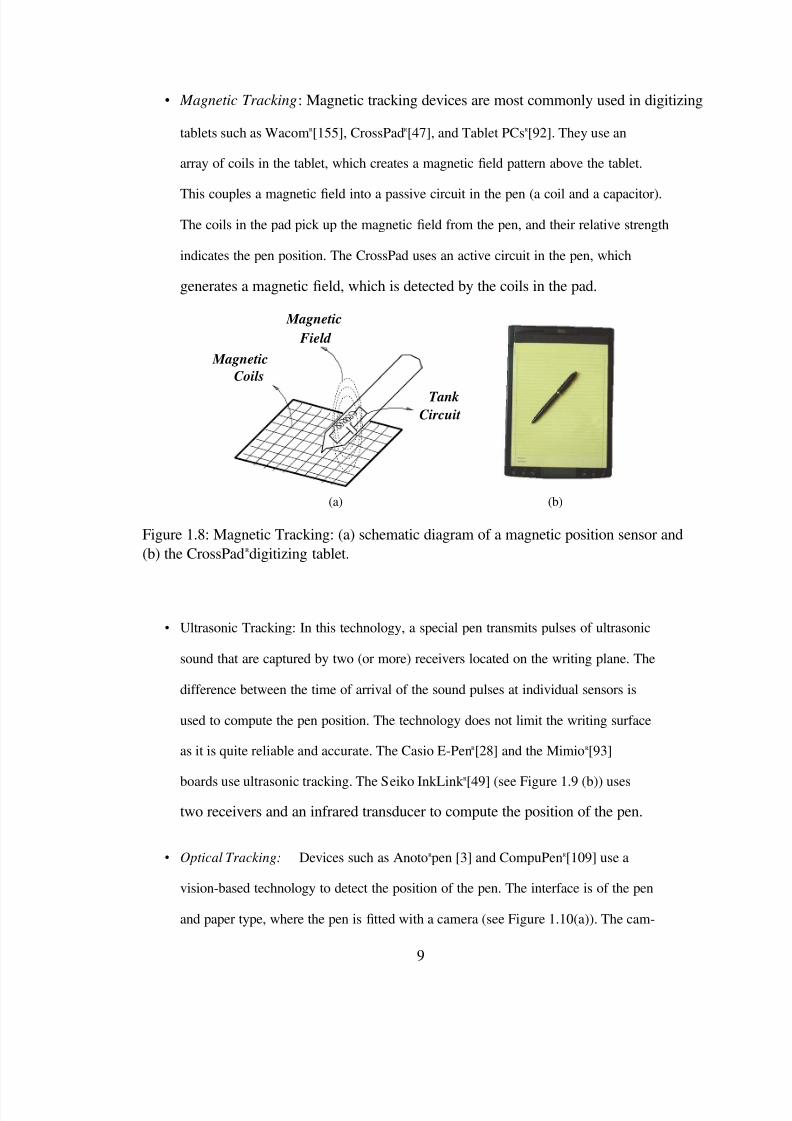
• Magnetic Tracking : Magnetic tracking devices are most commonly used in digitizing
tablets such as Wacom R[155], CrossPad R[47], and Tablet PCs R[92]. They use an
array of coils in the tablet, which creates a magnetic eld pattern above the tablet.
This couples a magnetic eld into a passive circuit in the pen (a coil and a capacitor).
The coils in the pad pick up the magnetic eld from the pen, and their relative strength
indicates the pen position. The CrossPad uses an active circuit in the pen, which
generates a magnetic eld, which is detected by the coils in the pad.
Magnetic Field
Magnetic Coils
Tank Circuit
(a) (b)
Figure 1.8: Magnetic Tracking: (a) schematic diagram of a magnetic position sensor and(b) the CrossPad Rdigitizing tablet.
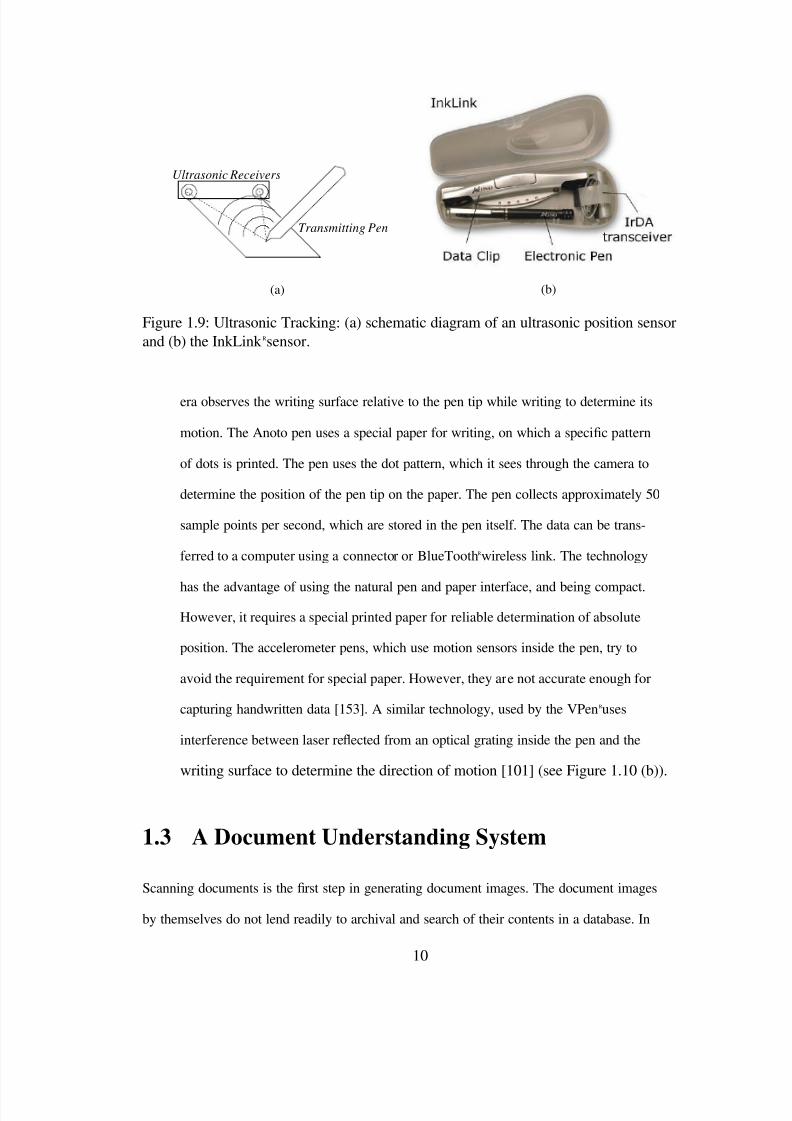
• Ultrasonic Tracking: In this technology, a special pen transmits pulses of ultrasonic
sound that are captured by two (or more) receivers located on the writing plane. The
difference between the time of arrival of the sound pulses at individual sensors is
used to compute the pen position. The technology does not limit the writing surface
as it is quite reliable and accurate. The Casio E-Pen R[28] and the Mimio R[93]
boards use ultrasonic tracking. The Seiko InkLink R
[49] (see Figure 1.9 (b)) uses
two receivers and an infrared transducer to compute the position of the pen.
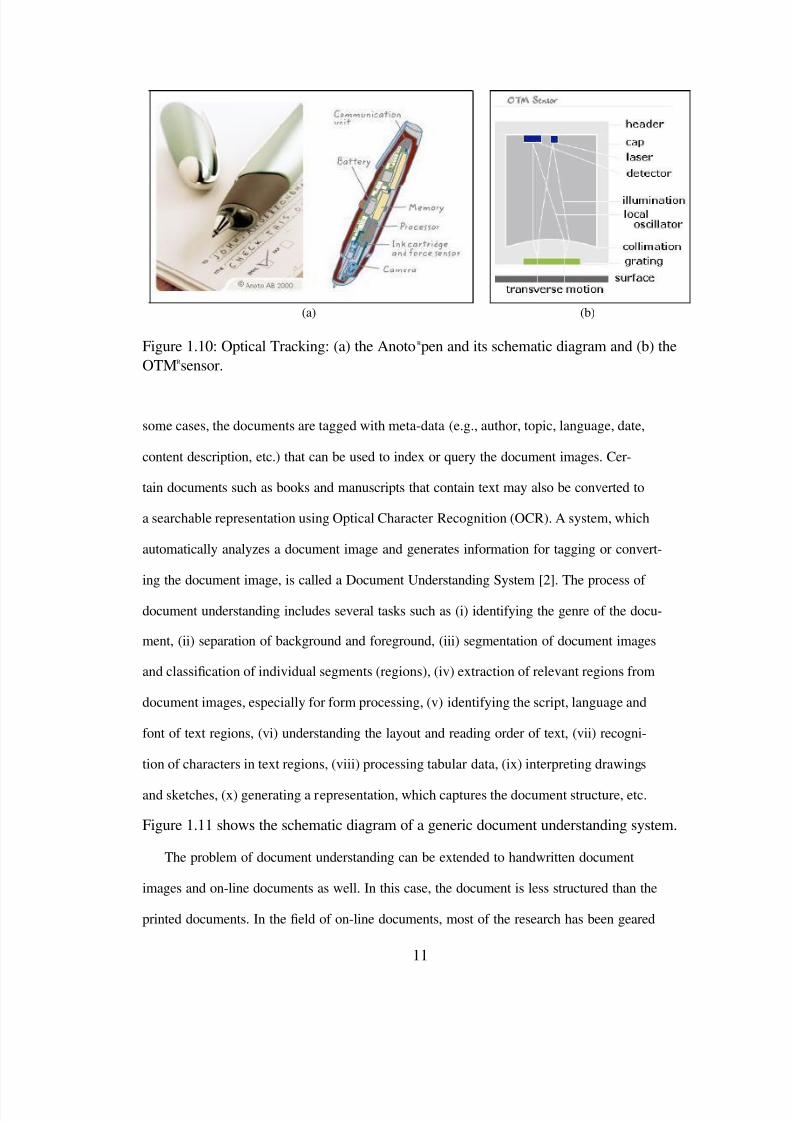
• Optical Tracking: Devices such as Anoto Rpen [3] and CompuPen R[109] use a
vision-based technology to detect the position of the pen. The interface is of the pen
and paper type, where the pen is tted with a camera (see Figure 1.10(a)). The cam-
9
8/7/2019 Online HandWritten Document
http://slidepdf.com/reader/full/online-handwritten-document 30/191
8/7/2019 Online HandWritten Document
http://slidepdf.com/reader/full/online-handwritten-document 31/191
(a) (b)
Figure 1.10: Optical Tracking: (a) the Anoto Rpen and its schematic diagram and (b) theOTM Rsensor.
some cases, the documents are tagged with meta-data (e.g., author, topic, language, date,
content description, etc.) that can be used to index or query the document images. Cer-
tain documents such as books and manuscripts that contain text may also be converted to
a searchable representation using Optical Character Recognition (OCR). A system, which
automatically analyzes a document image and generates information for tagging or convert-
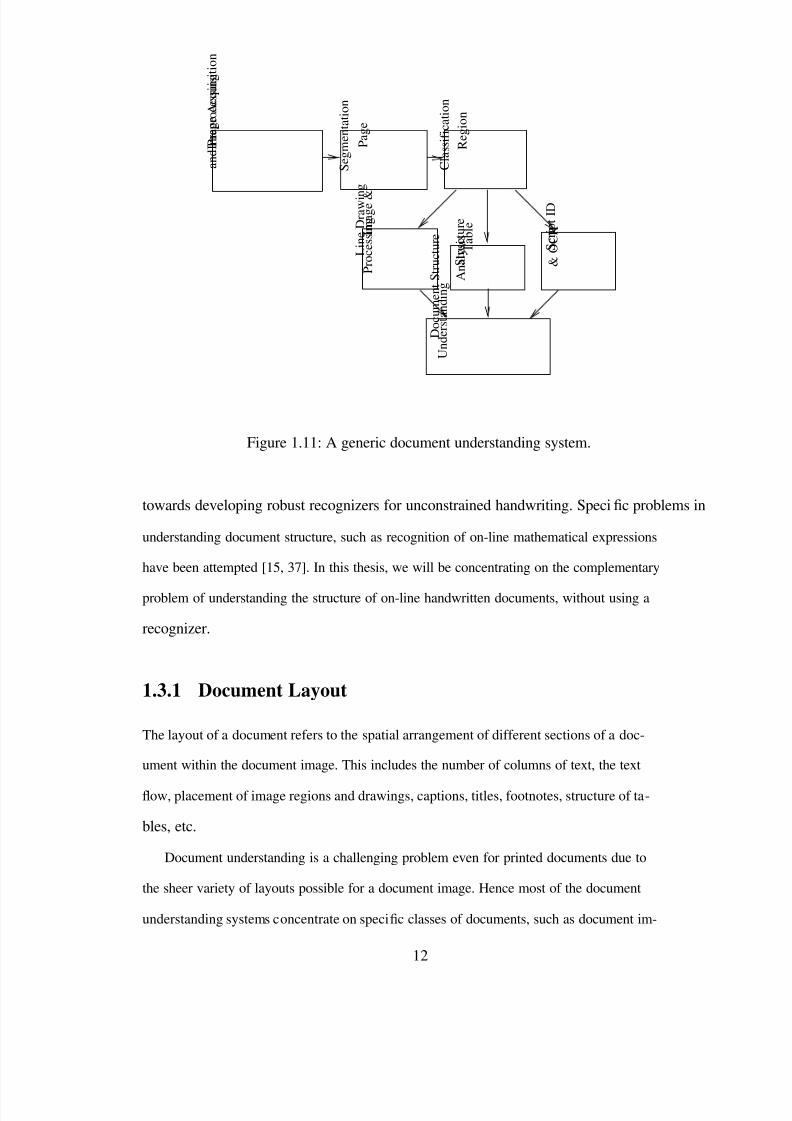
ing the document image, is called a Document Understanding System [2]. The process of
document understanding includes several tasks such as (i) identifying the genre of the docu-
ment, (ii) separation of background and foreground, (iii) segmentation of document images
and classi cation of individual segments (regions), (iv) extraction of relevant regions from
document images, especially for form processing, (v) identifying the script, language and
font of text regions, (vi) understanding the layout and reading order of text, (vii) recogni-
tion of characters in text regions, (viii) processing tabular data, (ix) interpreting drawings
and sketches, (x) generating a representation, which captures the document structure, etc.
Figure 1.11 shows the schematic diagram of a generic document understanding system.
The problem of document understanding can be extended to handwritten document
images and on-line documents as well. In this case, the document is less structured than the
printed documents. In the eld of on-line documents, most of the research has been geared
11
8/7/2019 Online HandWritten Document
http://slidepdf.com/reader/full/online-handwritten-document 32/191
Figure 1.11: A generic document understanding system.
towards developing robust recognizers for unconstrained handwriting. Speci c problems in
understanding document structure, such as recognition of on-line mathematical expressions
have been attempted [15, 37]. In this thesis, we will be concentrating on the complementary
problem of understanding the structure of on-line handwritten documents, without using a
recognizer.
1.3.1 Document Layout
The layout of a document refers to the spatial arrangement of different sections of a doc-
ument within the document image. This includes the number of columns of text, the text
ow, placement of image regions and drawings, captions, titles, footnotes, structure of ta-
bles, etc.
Document understanding is a challenging problem even for printed documents due to
the sheer variety of layouts possible for a document image. Hence most of the document
understanding systems concentrate on speci c classes of documents, such as document im-
12
Region
Classification
Page
Segmentation
Image Acquisition
and Preprocessing
& OCR
Script ID
Analysis
Table
Structure
Image &
Processing
Line Drawing
Document Structure
Understanding
8/7/2019 Online HandWritten Document
http://slidepdf.com/reader/full/online-handwritten-document 33/191
8/7/2019 Online HandWritten Document
http://slidepdf.com/reader/full/online-handwritten-document 34/191
1.4.1 Text and Sketch-based Retrieval
The most common approach to retrieving documents, based on their contents, is to specify
a set of keywords that are present in the document. In the case of on-line handwritten docu-
ments, the query can either be a handwritten or typed keyword. One could use a recognizer
to convert all the text data in a handwritten document to ASCII text. However, the expres-
sive power of handwritten data over typed text has led researchers to the conclusion that it is
desirable to treat handwritten data ( digital ink ) as a primary data-type [91, 88, 4]. Another
reason for requiring a recognition-free solution is the multitude of languages and symbols
that an application using pen-based input needs to handle. Due to the inherent advantages
of storing the handwritten data itself in documents as opposed to the recognized text, even
recognition-based solutions store the recognized text as supplemental information to the
handwritten data [127].
An alternate approach to retrieval of handwritten data is to use a search technique that
can nd a document in a database using a handwritten keyword as the query. The process
of comparing handwritten or spoken words of the query to those in a document database,
without explicit recognition, is referred to as „word-spotting ‟[90]. The technique has also
been used for recognition of on-line handwritten databases generated by a single writer
[30]. This approach also enables the user to do retrieval based on hand-drawn pictures
or diagrams as opposed to words. However, the matching of sketches and words poses
different challenges in the case of on-line documents, since the temporal variations between
similar sketches are larger compared to that of off-line handwritten words.
1.4.2 Structure-based Retrieval
The bottleneck in the word-based retrieval systems for document images and on-line doc-
uments is the recognition of text in the document to match the user ‟s query. Retrieval
systems try to deal with the ambiguity in recognition by using multiple interpretations of
the text provided by the recognition algorithm. This usually results in poor precision rates
14
8/7/2019 Online HandWritten Document
http://slidepdf.com/reader/full/online-handwritten-document 35/191
in the retrieved documents. Additional constraints in the query can signi cantly improve
the performance of the retrieval systems. The layout of a handwritten page provides such
a constraint, which is both intuitive for the user to specify and easy to combine with the
word-based retrieval algorithms. People generally tend to remember some of the attributes
of the page structure that they have written or seen. Hence, a layout based retrieval system
is primarily aimed to work with a small to medium sized database (hundreds of pages) of
handwritten notes, typically written and queried by a single user. Such a system can also
be employed in querying pages captured using electronic white-boards during seminars or
lectures since the attendees would have seen the pages being written.
The user who queries the database describes a layout of the page from his memory and
wants to retrieve the page based on the layout alone or in conjunction with some words
in the document. Typical queries could be of the form: “Retrieve the page that contains
a large map ( gure) ”. Even in cases where the user has not seen the page to be retrieved
before, such as while searching for documents on the web, layout or non-text content can be
used in the queries. The user could specify the presence of a particular region to restrict the
range of retrieved documents. For example, the user could pose a query such as: “Retrieve
pages on DNA structure with a sketch (gure) ”.
1.5 Script Recognition
Handwritten documents can contain multiple languages that can possibly be in different
scripts. For example, a document database could contain handwritten documents in En-
glish, Chinese and Arabic, which use three different scripts (Roman, Han and Arabic, re-
spectively). Identifying the script of text regions can be useful for retrieval as the presence
or absence of a particular script can be used to query the document. The user can specify
the scripts that might be present in a particular document, which can greatly enhance the ac-
curacy and speed of the retrieval system since the set of documents that need to be matched
15
8/7/2019 Online HandWritten Document
http://slidepdf.com/reader/full/online-handwritten-document 36/191
with the query become limited. In addition, the script recognizer can form a pre-processing
step in text recognition, since the recognizers are usually developed for a speci c script or
language.
In addition to script, there is a variety of information that can be extracted from doc-
uments that can help in the document retrieval process. Examples of such information
include presence of mathematical equations [14], music notations [122], speci c classes
of drawings such as maps [85], etc. However, such systems are developed with a speci c
document type in mind and hence are not dealt with in this thesis.
1.6 Security Issues in On-line Documents
Paper documents are commonly used for many applications where the document is legally
binding. The authorship of a document is established in such cases by the signature of
the author or a ngerprint impression on the document. The paper itself usually contains
watermarks and prints which help in authenticating the document. The widespread use of
digital documents in place of paper documents will require techniques to authenticate the
documents. In addition, digital documents pose an additional challenge of verifying the
integrity of documents after their creation, since the documents are easily modi ed on a
computer. Techniques such as public key encryption-based digital signatures and digital
watermarks have been used for this purpose in the case of document images.
One of the main approaches to authenticating digital documents is called (digital) water-
marking. Watermarking techniques can be classi ed according to the various information
hiding techniques and according to their use and properties (see Figure 1.13). The class
of watermarking techniques suitable for document authentication fall under the category of
fragile watermarking.
16

8/7/2019 Online HandWritten Document
http://slidepdf.com/reader/full/online-handwritten-document 37/191
Figure 1.12: A document retrieval system. The database contains metadata generated by
the document understanding system.
Information Hiding
Covert Channels Steganography Anonymity Copyright marking
Linguistic Technicalsteganography steganography
RobustCopyrightMarking
FragileWatermarking
Fingerprinting Watermarking
Imperceptible VisibleWatermarking Watermarking
Figure 1.13: Classi cation of information hiding techniques by Petitcolas et al. [111].
17
Matching Words,
Structure
Sketches and
Database
Document
Document
Display
Interface
Query
Understanding
System D
ocument
Query
Parsing
8/7/2019 Online HandWritten Document
http://slidepdf.com/reader/full/online-handwritten-document 38/191
1.7 Thesis Contribution and Outline
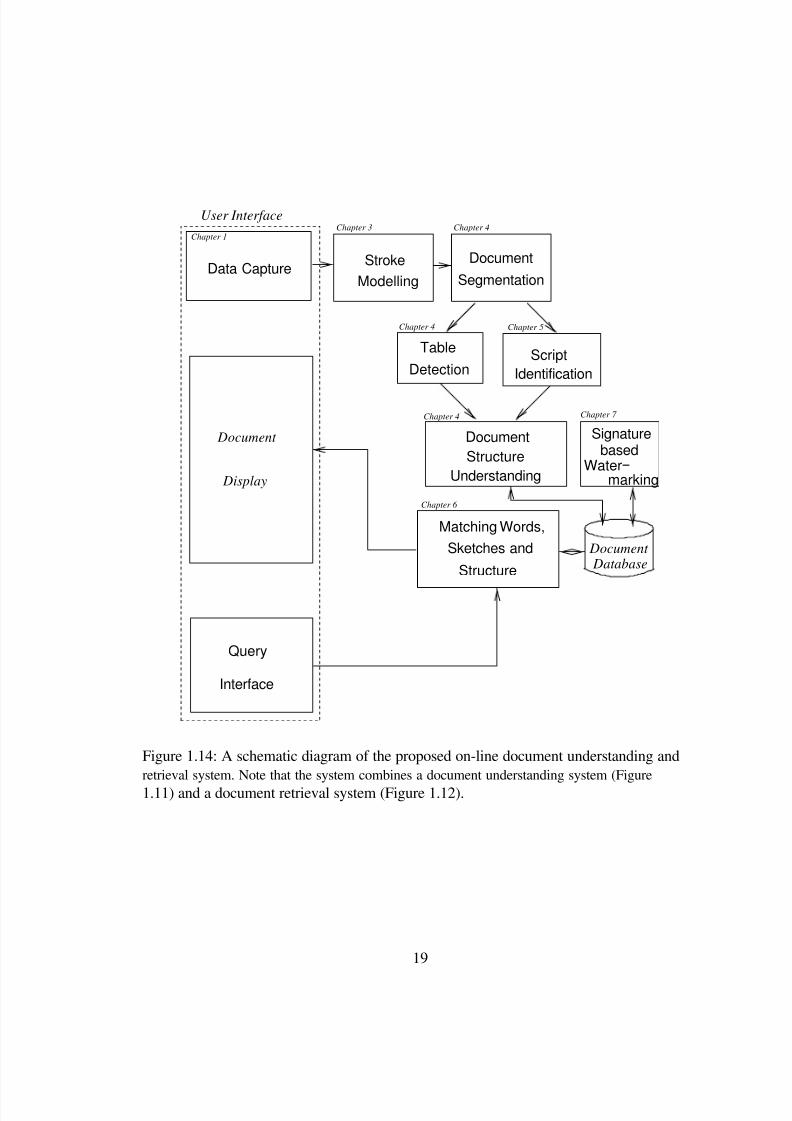
This thesis develops a mathematical basis for understanding the structure of on-line hand-
written documents and explores some of the related problems in detail. Figure 1.14 gives
an outline of the different problems that are dealt with in this thesis and their relationship
to each other. A document retrieval system is developed, which demonstrates a practical
application of the document understanding problem. A retrieval system that uses structure
and content of the documents should be able to perform the following tasks.
1. Segment a document page into component regions.
2. Use the segmentation algorithm to infer the layout of the page.
3. Generate a representation of the layout in memory with multiple interpretations for
ef cient retrieval.
4. Match user ‟s query with the layout and contents of the document.
5. Provide an interface to accept user ‟s queries and display results.
In this thesis, we concentrate on the problem of document understanding. The aspects
of ef ciency in matching and representation is an independent problem, although related.
There are several contributions in this thesis, which help to develop a better understand-
ing of the problem of on-line handwritten document understanding.
1. The thesis proposes a mathematical model for representation of on-line handwritten
strokes. The model is completely based on the mechanics of the handwriting process
and does not make any assumptions about the content or intent of the speci c hand-
writing sample. This is different from most of the generational models that are used
for recognition applications, which make speci c assumptions about the script and
style of writing. Moreover, the model is independent of the hardware that is used for
18
8/7/2019 Online HandWritten Document
http://slidepdf.com/reader/full/online-handwritten-document 39/191
User Interface Chapter 1
Data Capture
Chapter 3
StrokeModelling
Chapter 4
Chapter 4
DocumentSegmentation
Chapter 5
TableDetection
Chapter 4
ScriptIdentification
Chapter 7
Document
Display
Query
Interface
DocumentStructure
Understanding
Chapter 6
Matching Words,Sketches and
Structure
Signaturebased
Water − marking
Document Database
Figure 1.14: A schematic diagram of the proposed on-line document understanding andretrieval system. Note that the system combines a document understanding system (Figure1.11) and a document retrieval system (Figure 1.12).
19
8/7/2019 Online HandWritten Document
http://slidepdf.com/reader/full/online-handwritten-document 40/191

8/7/2019 Online HandWritten Document
http://slidepdf.com/reader/full/online-handwritten-document 41/191
6. An on-line signature-based watermarking technique that can establish the authorship
and integrity of on-line documents is presented in Chapter 7. The system uses fragile
watermarking to detect tampering of documents.
21
8/7/2019 Online HandWritten Document
http://slidepdf.com/reader/full/online-handwritten-document 42/191
Chapter 2
Background in Document
Understanding
In this chapter, we present an overview of the work done in the elds related to this thesis.
The intent is to provide an overview of the state of the art in the corresponding areas.
Hence, details of algorithms are not described, unless they are required to understand the
work presented in this thesis.
This chapter is organized as follows. Section 2.1 surveys the work that has been done in
the eld of document understanding. Work done on segmentation of documents is reviewed
in Section 2.2. Sections 2.3 and 2.4 present work done in the eld of indexing and retrieval
of document images in general and describe the speci c topic of on-line handwritten doc-
ument retrieval. Section 2.5 presents a literature survey of the eld of script recognition,
and Section 2.6 gives a brief overview of the work related to watermarking of document
images.
2.1 Document Understanding
Most of the research in document analysis has focused on off-line (scanned) documents
[142]. Examples of this work include page decomposition [58], locating embedded text in
22
8/7/2019 Online HandWritten Document
http://slidepdf.com/reader/full/online-handwritten-document 43/191
color images [163], skew detection [162] and table identi cation [68, 45, 148, 41, 75]. With
the introduction of devices like IBM ThinkPad TransNote c[143] and Electronic White-
boards, it is now possible to store and process the entire on-line document. The temporal
information, captured by the on-line documents can be used for both text recognition as
well as segmentation of documents.
Recent advances in the processing of on-line handwritten data include algorithms for (i)
segmentation of handwritten text into lines, words and sub-strokes [121, 82], (ii) character
and word recognition [156, 116, 51], and (iii) indexing and retrieval of on-line handwritten
documents.
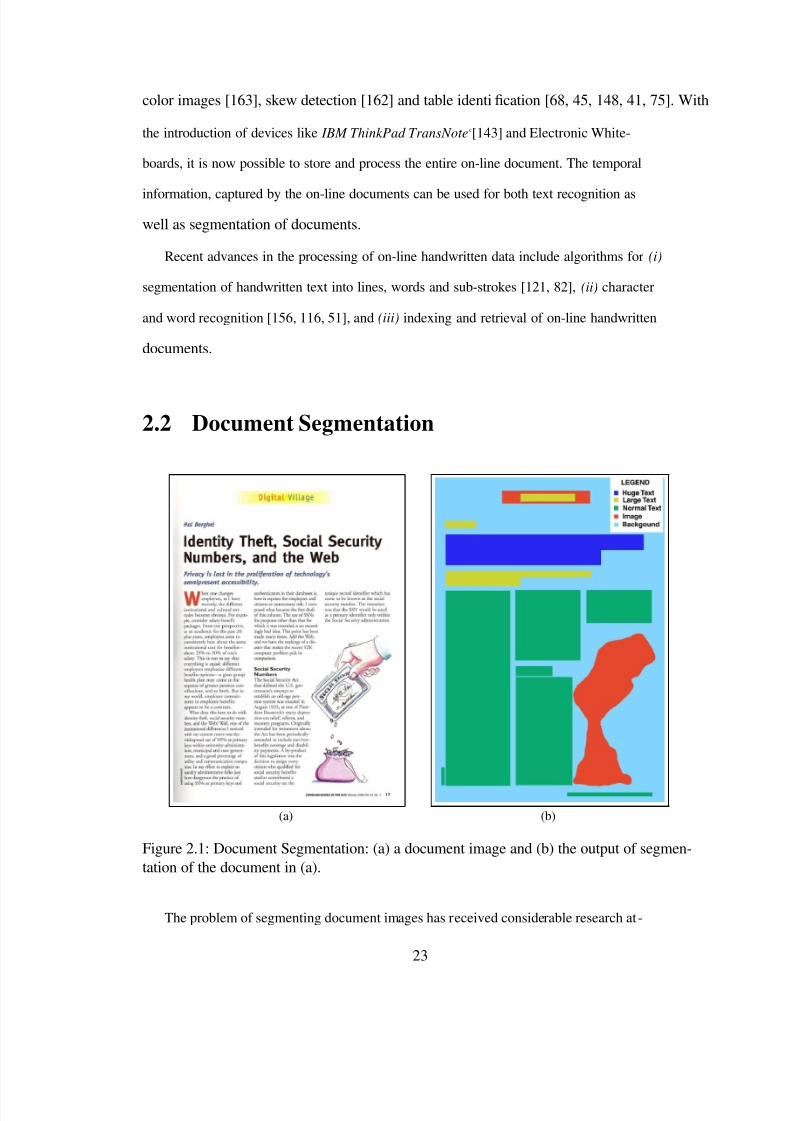
2.2 Document Segmentation
(a) (b)
Figure 2.1: Document Segmentation: (a) a document image and (b) the output of segmen-tation of the document in (a).
The problem of segmenting document images has received considerable research at -
23
8/7/2019 Online HandWritten Document
http://slidepdf.com/reader/full/online-handwritten-document 44/191
tention in the past. Figure 2.1 shows an example of a document image and the desired
output of the segmentation algorithm. The desired output may vary depending on the ap-
plication and could result in a coarser or ner segmentation of the document page. Various
approaches for segmentation can be broadly classi ed into two categories, top-down and
bottom-up. The top-down approaches start with the whole document page and divide it
into blocks. The blocks may be further divided into smaller blocks if an initial block is
believed to contain multiple regions. Wang et al. [157] used such an approach to segment
newspaper images into component regions and Li and Gray [81] used wavelet coef cient
distributions to perform top-down classi cation of complex document images. The bottom-
up approaches start with individual pixels or a collection of neighboring pixels and group
them together to form contiguous regions of the same type. Jain and Yu [58] used a top-
down document model for performing a bottom-up clustering of pixels while Etemad et al.
[31] used fuzzy decision rules for bottom-up clustering of pixels using a neural network.
Cheng et al. [17] proposed a hybrid bottom-up, top-down approach where the algorithm
adopts a ne-to-coarse-to- ne approach for segmenting a document image. A third ap-
proach is to use the white spaces available in document images to nd the boundaries of
text or image regions as proposed by Pavlidis [107]. Jain and Bhattacharjee [52] used Gabor
lters for texture-based segmentation of text in document images. Connected component
based methods have been used for both text segmentation in document images [104] and
for generic image segmentation [158, 135]. Nagy [94] provides an excellent survey of the
different document analysis approaches that have been attempted.
Grammar-based approaches have been used in many problems related to document un-
derstanding in the case of printed documents. Chou and Kopec [18, 74] described an at-
tribute grammar-based model of off-line documents and its use in document recognition.
Grammar-based approaches have also been used in the recognition of table structure. Rah-
gozar and Cooperman [119] used a graph-grammar model for recognition of table struc-
tures in printed documents. Zanibbi et al. [118] give a comprehensive review of the various
24
8/7/2019 Online HandWritten Document
http://slidepdf.com/reader/full/online-handwritten-document 45/191
table recognition models and algorithms. Description of pictures using grammars and their
use in comparison of pictures were investigated by Shaw [134] and Clowes [19]. Such
approaches could be extended to deal with on-line sketches.
The work in on-line document analysis till date is limited to segmentation of text lines
[121, 10, 117] Artieres [6] described a text line and word segmentation system using prob-
abilistic feature grammar, which uses a text model that is similar to that in this thesis.
2.3 Document Indexing and Retrieval
The area of content-based information retrieval has been an active research topic for almost
two decades. The speci c eld of content-based image retrieval has been explored in great
detail [26, 66, 84]. The notable commercial systems that perform content-based image
retrieval include the QBIC system [34] from IBM and the VIR Image Engine [7] from
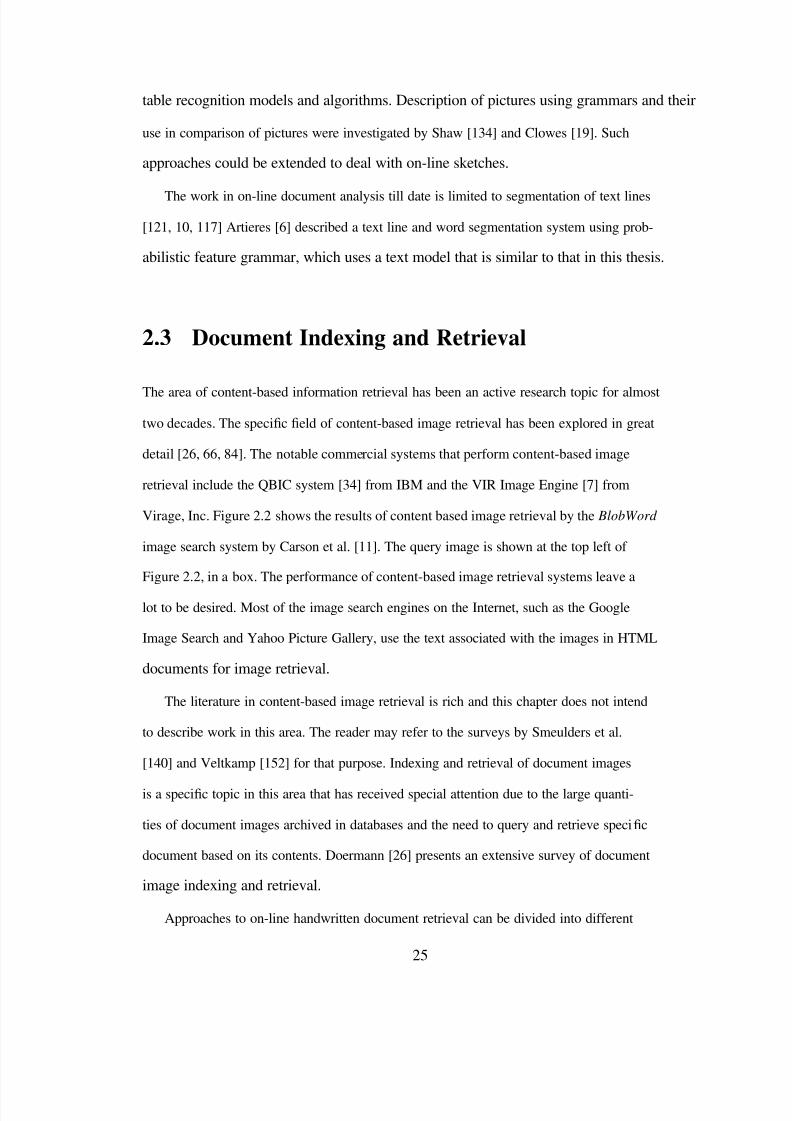
Virage, Inc. Figure 2.2 shows the results of content based image retrieval by the BlobWord
image search system by Carson et al. [11]. The query image is shown at the top left of
Figure 2.2, in a box. The performance of content-based image retrieval systems leave a
lot to be desired. Most of the image search engines on the Internet, such as the Google
Image Search and Yahoo Picture Gallery, use the text associated with the images in HTML
documents for image retrieval.
The literature in content-based image retrieval is rich and this chapter does not intend
to describe work in this area. The reader may refer to the surveys by Smeulders et al.
[140] and Veltkamp [152] for that purpose. Indexing and retrieval of document images
is a speci c topic in this area that has received special attention due to the large quanti-
ties of document images archived in databases and the need to query and retrieve speci c
document based on its contents. Doermann [26] presents an extensive survey of document
image indexing and retrieval.
Approaches to on-line handwritten document retrieval can be divided into different
25
8/7/2019 Online HandWritten Document
http://slidepdf.com/reader/full/online-handwritten-document 46/191
8/7/2019 Online HandWritten Document
http://slidepdf.com/reader/full/online-handwritten-document 47/191
vectors lead to simple matching techniques (e.g., Euclidean distance between points in
a parameter space), where as variable length representations such as point sequences or
sequence of feature vectors from stroke sequences require a soft distance measure (e.g.,
elastic string matching). Russell et al. [127] use the dot product of the con dence values of
the top N results of recognition of two handwritten words to arrive at a distance measure.
Leung and Chen [80] use the distance measure between features computed for each shape-
type, weighted by their con dence values. Kamel [65] uses a voting method to nd the
distance between strings, where the presence of a stroke type from the query, represented
as a feature vector, in a word in the database, results in a vote for the word. Lopresti and
Tomkins [88] use Dynamic Time Warping (DTW) to match the feature vector sequences
derived from the sample points and strokes. Manmatha et al. [90] used the edit distance
measure to nd the distance between two word images. The matching techniques used for
on-line handwritten data in [88, 127, 65, 80] are described later.
Several approaches to word-spotting in documents have been reported in the literature.
However, these studies are restricted to off-line handwritten or printed documents and au-
dio documents [35] for the most part. Kuo and Agazzi [77] used a Pseudo 2-D HMM model
to spot keywords in poorly printed documents. They achieved 96% accuracy on a syntheti-
cally generated dataset with words of different font sizes. Curtins [24] employs multi-font
character templates to match individual characters to spot keywords in noisy printed text
and attains a recall rate of 90% and precision rate of 97% on a set of 380 document images.
O‟Neill et al. [100] reported 90% recall and more than 95% precision in spotting printed
words using moment features of the word pixels. The test set contained two words in 13
font sizes with 20% salt-and-pepper noise.
In the case of handwritten documents, word-spotting systems attain considerably lower
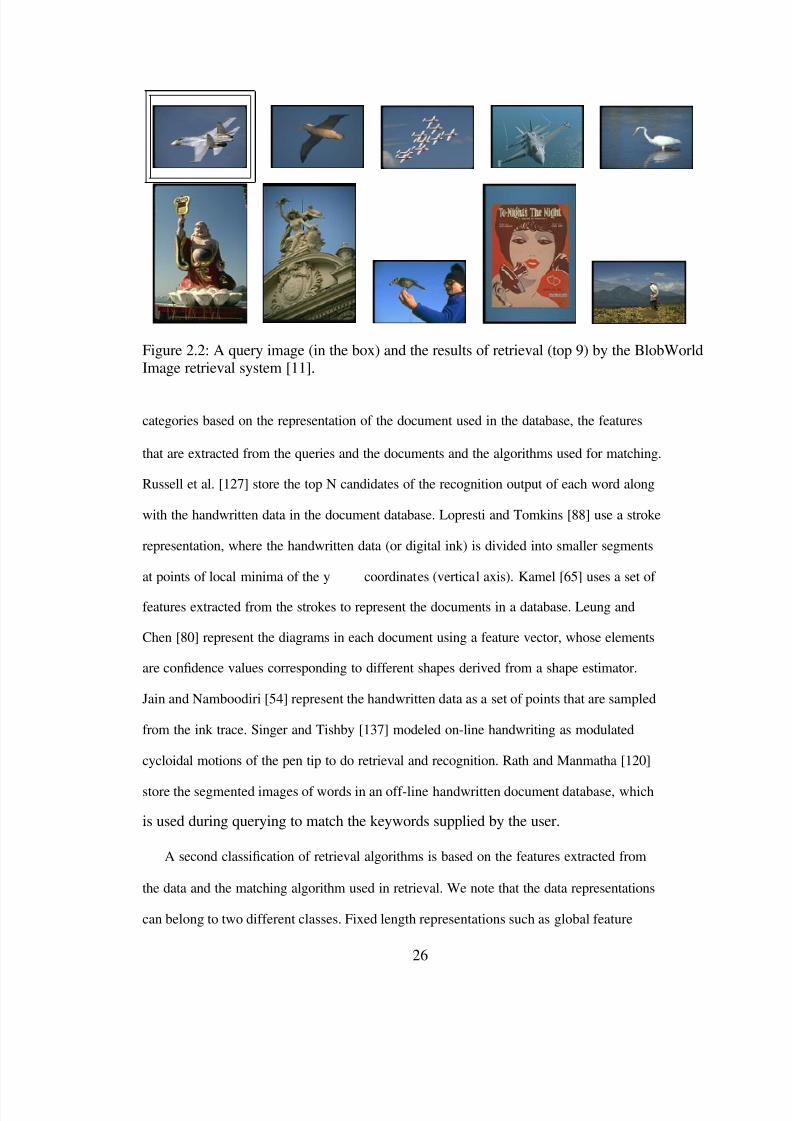
recall rates due to the intra-class variability in handwritten words (see Figure 2.3). Man-
matha et al. [90] used an Euclidean distance map-based algorithm to index handwritten
text using word image templates. Kolcz et al. [72] used the pro le of the words to match
27
8/7/2019 Online HandWritten Document
http://slidepdf.com/reader/full/online-handwritten-document 48/191
handwritten words. Their method achieves a recall rate of 45% with no false alarms. Singer
and Tishby [137] modelled on-line handwriting as modulated cycloidal motions of the pen
tip to do recognition. The authors reported successful spotting of parts of a word in a small
database of 30 words using dynamic time warping. Lopresti and Tomkins [88] used an edit
distance measure to match a sequence of feature vectors extracted from segments of strokes
in on-line handwritten data. The method achieves a recall rate of 95% with a precision of
4% to 7% on databases containing 2, 000 and 4, 000 words, respectively, by two writers.
(a) Writer 1 (b) Writer 2 (c) Writer 3
Figure 2.3: Variability in writing styles of three different writers for the same set of words.
Matching of hand-drawn sketches poses a different set of challenges due to the large
amount of variability among multiple instances of a gure. Lopresti et al. [89] have studied
the problem and provided some initial experimental results that are encouraging. They
describe the need for ef cient algorithms to match components of sketches and utilize
spatial arrangement of the components. Leung and Chen [80] represent the diagrams in
each document using a feature vector, whose elements are con dence values corresponding
to different primitive shapes derived from a shape estimator. One could also retrieve printed
or hand-drawn sketches and images using sketches as queries. Jain et al. [60] addressed
the problem of image retrieval using a deformable template, which is a binary edge image.
The matching process takes into consideration the energy required to deform the model and
the goodness of t of the deformed model to the target image based on the gradient of the
28
8/7/2019 Online HandWritten Document
http://slidepdf.com/reader/full/online-handwritten-document 49/191
8/7/2019 Online HandWritten Document
http://slidepdf.com/reader/full/online-handwritten-document 50/191
constrained. For example, a recognition based approach can handle only text documents
and that too in a speci c language. Moreover, the choice of data representation, such as
feature vectors used, becomes critical in the matching process and a poor choice of features
can affect the performance of the system.
Pattern Ink Text Ink
Pre −Processing
Normalization
Stroke Segmentation
Feature Extraction
Vector Quantization
Allograph Recognition
Word Hypothesization
Points
Normalized Points
Point Sequences
Feature Vectors
Stroke Types
Characters
Words
Matching Problem
Pre −Processing
Normalization
Stroke Segmentation
Feature Extraction
Vector Quantization
Allograph Recognition
Word Hypothesization
Figure 2.4: Word Matching at multiple levels of abstraction (from Lopresti and Tomkins[88]).
A lower level of abstraction in the data representation, such as a set of data points or a
set of feature vectors derived from point sequences (see [54]) can lead to a generic content-
based retrieval system. However, one needs to employ more powerful matching algorithms
such as Dynamic Time Warping (DTW) on longer data sequences, leading to a slower
retrieval system. Lopresti and Tomkins [88] use an intermediate level of abstraction, viz.
features derived from stroke sequences, which the authors claim to be the best suited for
word matching. However, a comparison of the retrieval results between their method and
ones with lower and higher levels of abstraction reported in [54] and [127], leaves a reader
30
8/7/2019 Online HandWritten Document
http://slidepdf.com/reader/full/online-handwritten-document 51/191
8/7/2019 Online HandWritten Document
http://slidepdf.com/reader/full/online-handwritten-document 52/191
2. Top vs. Top: The query in this case is a handwritten keyword. The top candidate
from the recognizer is used to retrieve documents from a database and the matching
is similar to the previous case.
3. N-Best vs. Top: This is similar to case 2, except that each of the N candidates
from recognition results of the keyword is matched against the top candidate from
recognition of words in the database.
4. Typed vs. N-Best: In this case, the query word is typed and is compared to each of
the N-best candidates from recognition of words in the database.
5. Dot Product: In this case, the query is a handwritten keyword. The distance metric
is the normalized dot product of the N-best con dence values of the keyword and
database word recognition results.
Figure 2.5 shows the precision vs. recall plots of Russell et al. ‟s algorithm on a database
of 35, 172 words. A total of 1, 600 independent query words were used for this experiment.
Figure 2.5: Precision vs. Recall curves for the algorithm reported in Russell et al. [127].
32
8/7/2019 Online HandWritten Document
http://slidepdf.com/reader/full/online-handwritten-document 53/191
8/7/2019 Online HandWritten Document
http://slidepdf.com/reader/full/online-handwritten-document 54/191
to 1; fewer number of points in the convex hull, and points traverse 360 oaround the
center of the stroke.
3. Straight line: Ratio of sum of distances between neighboring points in a stroke and
the distance between end points is 1, and the height of the triangle formed between
the end points and any point on the line is small.
For each stroke, the estimators return a con dence value for each stroke type. The
matching score between two strokes is the product of the con dence values for the stroke
type, which maximizes that value. The matching score is also multiplied with the product
of the feature vectors for each type to handle shapes that are not mentioned above. The
matching score of two sketches is computed by weighting the matching scores of individual
strokes, inversely, with the distance between their centers.
A database of 35 shapes was collected from 4 writers for testing, with each writer
drawing the shape 20 times. A second database of the same shapes was collected after 8
months with 5 repetitions. Figure 2.7 shows examples of on-line hand-drawn sketches from
the database.
Figure 2.8 gives the precision vs. recall curves for the experiments.
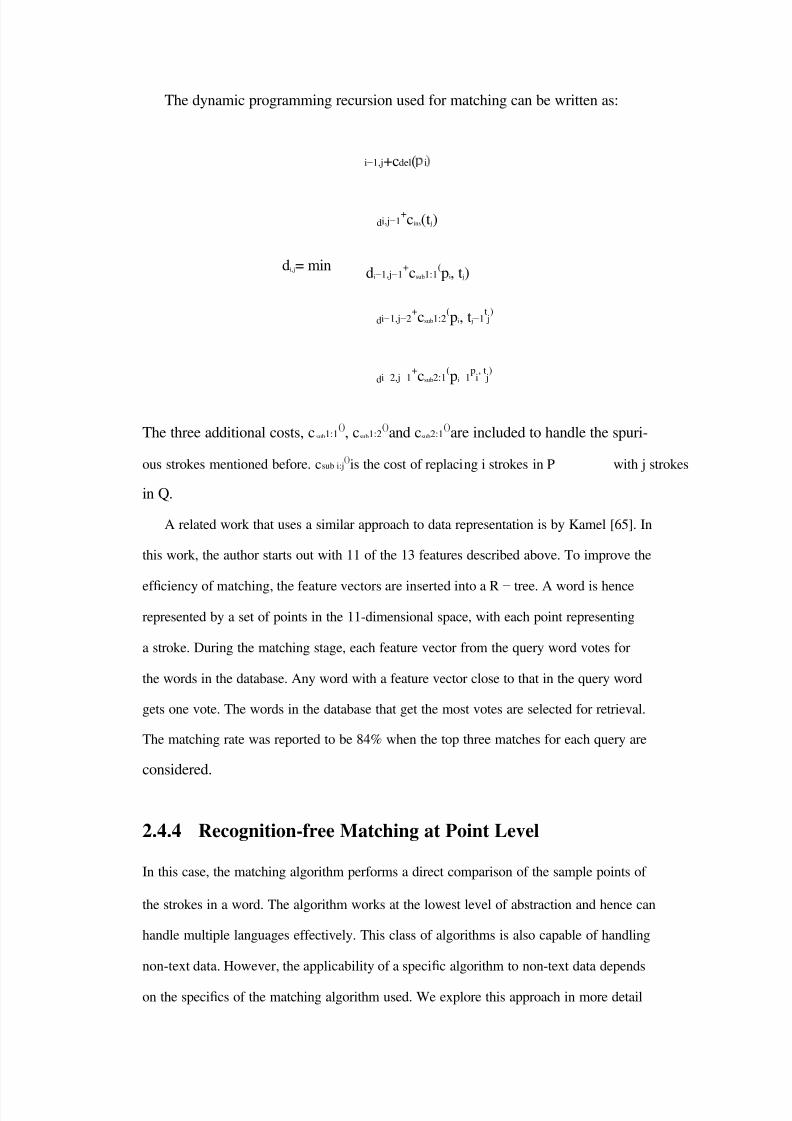
2.4.3 Recognition-free Text Matching at the Stroke Level
Lopresti and Tomkins [88] proposed a recognition-free approach for matching text data in
on-line handwritten documents. Even though the algorithm does not do recognition, the
rst stage of stroke segmentation assumes that the handwriting trace, referred to as ink, is
a sequence of regular up and down movements of the pen as in the case of cursive English
handwriting.
Stroke segmentation is the process of dividing the ink into smaller segments, called
strokes. The ink is split at every sample point that is a local minimum for the y-coordinate
along the trace. This might result in spurious strokes due to pen vibrations. However, the
34
8/7/2019 Online HandWritten Document
http://slidepdf.com/reader/full/online-handwritten-document 55/191
8/7/2019 Online HandWritten Document
http://slidepdf.com/reader/full/online-handwritten-document 56/191
matching stage is designed to handle a small amount of such spurious strokes. A set of
13 features are then extracted from each of the strokes, which together characterizes the
stroke type. The feature values extracted are described by Rubine in the context of gesture
recognition [124]. A handwritten document is thus converted to a sequence of feature
vectors, each corresponding to a stroke. Each feature vector is then classi ed into one of
c classes, where the classes are determined by clustering the strokes of the particular user
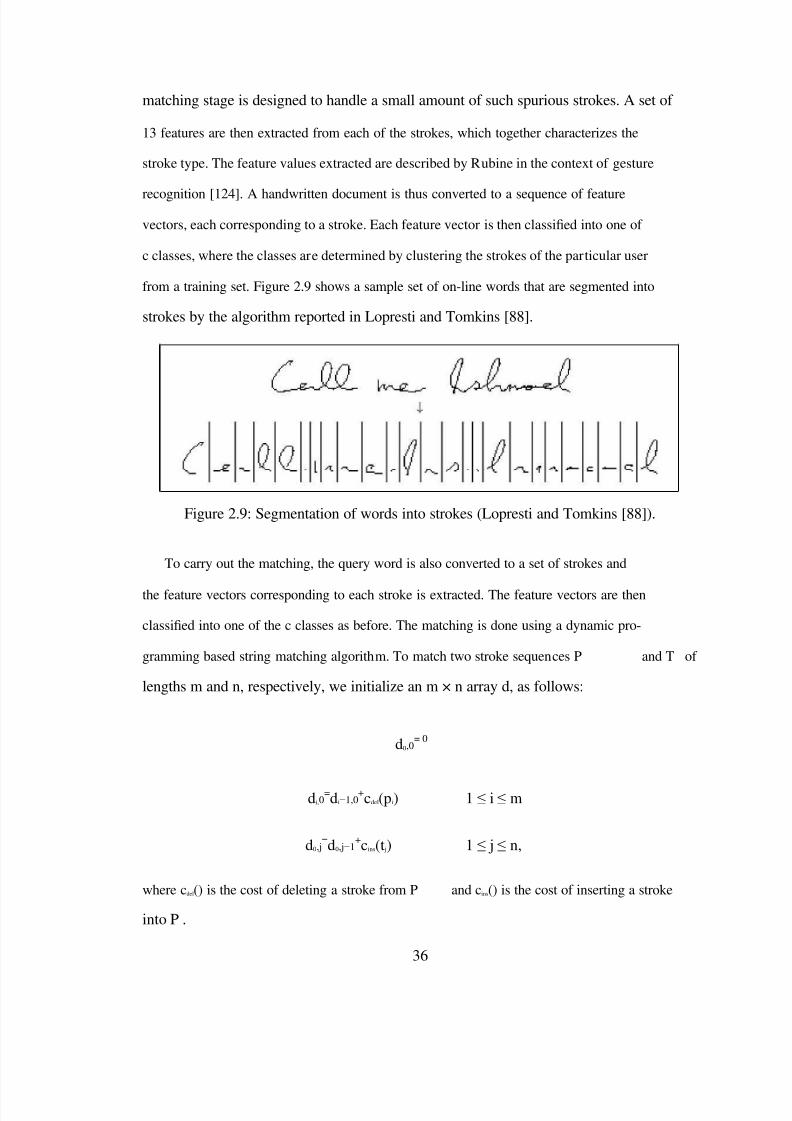
from a training set. Figure 2.9 shows a sample set of on-line words that are segmented into
strokes by the algorithm reported in Lopresti and Tomkins [88].
Figure 2.9: Segmentation of words into strokes (Lopresti and Tomkins [88]).
To carry out the matching, the query word is also converted to a set of strokes and
the feature vectors corresponding to each stroke is extracted. The feature vectors are then
classi ed into one of the c classes as before. The matching is done using a dynamic pro-
gramming based string matching algorithm. To match two stroke sequences P and T of
lengths m and n, respectively, we initialize an m × n array d, as follows:
d0,0= 0
d i,0=d i−1,0
+cdel(p i) 1 ≤ i ≤ m
d0,j=d0,j−1
+c ins(t j) 1 ≤ j ≤ n,
where c del() is the cost of deleting a stroke from P and c ins() is the cost of inserting a stroke
into P .
36
8/7/2019 Online HandWritten Document
http://slidepdf.com/reader/full/online-handwritten-document 57/191

8/7/2019 Online HandWritten Document
http://slidepdf.com/reader/full/online-handwritten-document 58/191
8/7/2019 Online HandWritten Document
http://slidepdf.com/reader/full/online-handwritten-document 59/191
in this work (see Chapter 6).
2.4.5 Comparing the Matching Techniques
One of the main obstacles in comparing the results of various retrieval algorithms is the
absence of a standard database. However, judging by the nature and size of the databases
used in each of the experiments reported, one could conclude that the recognition-based
approach described in Section 2.4.1 performs the best on databases containing only English
text. The stroke-based matching is good in cases where we want to avoid recognition, while
making use of the fact that the data contains only English text. The point-based matching
approach is powerful and exible, but is more suited for single-writer databases. One could
use an R-tree structure, similar to the one used by Kamel [65], to increase the speed of the
algorithm, by reducing the number of words that need to be compared.
Algorithms that combine matchers that work at multiple levels have also been proposed.
Hull et al. [46] describe a system that combines three matchers, each comparing words
as point sequences, sequence of stroke shapes and overall word shape, respectively. The
authors report an accuracy of 98.1% for the best match on a small database of 200 words.
Finally, the problem of determining the relevance of the retrieved documents based
on query words is very important, especially in the case of retrieval of documents from
a larger database, such as the Internet [150]. The critical problem here is to determine
the meaning of words or expressions in a document using higher level context analysis
[129]. The meanings of individual words and phrases in a document are then combined
using statistical methods to determine the topics of discussion of the document. A retrieval
system could then use the topic of the document to rank the documents that match a query.
The problem of document relevance needs to be addressed to make the retrieval systems
more useful.
38
8/7/2019 Online HandWritten Document
http://slidepdf.com/reader/full/online-handwritten-document 60/191

8/7/2019 Online HandWritten Document
http://slidepdf.com/reader/full/online-handwritten-document 61/191
8/7/2019 Online HandWritten Document
http://slidepdf.com/reader/full/online-handwritten-document 62/191
Chapter 3
On-line Data Model
In this chapter, we develop the mathematical basis for representation of the on-line hand-
written data. The model used to describe the handwriting should be able to closely approx-
imate the data collected from users, while being compact in representation. In addition, the
model should be ef cient to compute, and should easily lend to operations such as com-
parison, modi cation and computation of properties like intersections and bounding boxes
of handwriting samples. We will examine the desirable properties of such a model, later in
this chapter.
On-line handwriting is a two-dimensional process, unfolding in the x − y plane as the
time t progresses. The process can be described by the function:
H : R → R × R, (3.1)
where R is the set of real numbers. The function H is de ned only for those values of t for
which the pen is in contact with the digitizing surface. Hence, we divide the handwritten
data into a sequence of N curves:
H = < ξ1, ξ2· · · , ξN> .
41
(3.2)
8/7/2019 Online HandWritten Document
http://slidepdf.com/reader/full/online-handwritten-document 63/191
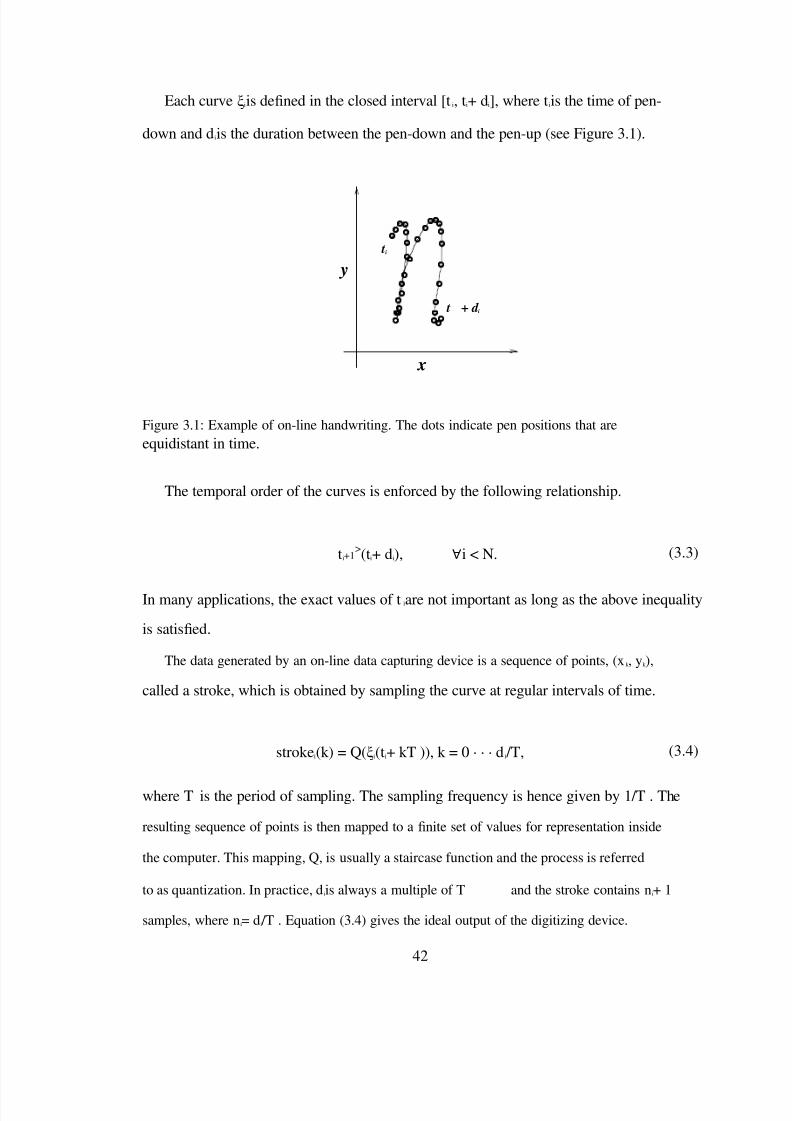
Each curve ξiis de ned in the closed interval [t i, t i+ d i], where t iis the time of pen-
down and d iis the duration between the pen-down and the pen-up (see Figure 3.1).
ti
y
t + d i
x
Figure 3.1: Example of on-line handwriting. The dots indicate pen positions that areequidistant in time.
The temporal order of the curves is enforced by the following relationship.
t i+1>(t i+ d i), ∀ i < N. (3.3)
In many applications, the exact values of t iare not important as long as the above inequality
is satis ed.
The data generated by an on-line data capturing device is a sequence of points, (x k , y k ),
called a stroke, which is obtained by sampling the curve at regular intervals of time.
stroke i(k) = Q( ξi(t i+ kT )), k = 0 · · · d i/T, (3.4)
where T is the period of sampling. The sampling frequency is hence given by 1/T . The
resulting sequence of points is then mapped to a nite set of values for representation inside
the computer. This mapping, Q, is usually a staircase function and the process is referred
to as quantization. In practice, d iis always a multiple of T and the stroke contains n i+ 1
samples, where n i= d i/T . Equation (3.4) gives the ideal output of the digitizing device.
42
8/7/2019 Online HandWritten Document
http://slidepdf.com/reader/full/online-handwritten-document 64/191
However, in practice the observed signal is corrupted by noise from various sources and
errors in the digitizing device. Details of this process are discussed later in this chapter.
The models for representing handwriting attempt to describe the functions ξifor the
purpose of storage, recognition, rendering, etc. In the next section, we look at the different
models that are currently used for representation of handwritten data, and some of their
properties.
3.1 Handwriting Models
There are a variety of properties that are desirable for a handwriting model. Some of them
are related to data representation, while others are important for recognition. In this work,
we are trying to develop a curve model that best approximates the data collected from a
user, while being ef cient for processing. Hence the desired properties might be different
from those of a model appropriate for recognition, which tries to model character or word
classes. The following is a list of desirable properties:
1. Flexibility : The curve model should be able to represent arbitrarily complex curves.
It should be able to precisely reproduce handwriting data collected from users. A
close approximation of a real handwriting sample should also retain as much of in-
formation of the handwriting sample as possible. Note that this is opposed to the
requirements in recognition models, which try to eliminate user speci c variations
of individual characters or words. However, it is desirable for the model to incor-
porate assumptions that are derived from the mechanics of the handwriting process.
This will enable us to eliminate some of the noise introduced by the digitizer, while
computing the parameters of the stroke for the model.
2. Compactness : The representation of the model should be compact so as to occupy the
least amount of memory while processing. This means that a speci c curve should
be represented using as few parameters as possible.
43

8/7/2019 Online HandWritten Document
http://slidepdf.com/reader/full/online-handwritten-document 65/191
8/7/2019 Online HandWritten Document
http://slidepdf.com/reader/full/online-handwritten-document 66/191
3.1.1 Handwriting as a Point Sequence
The simplest and the most popular representation of a curve is a sequence of points:
ξi= < (x k , y k ) >; k = 0, 1, · · · , n iand x k , y k ∈ [0, max xy], (3.5)
where max xyis the maximum value that x ior y ican take. The representation is widely used
because most digitizing devices generate the handwriting data in such a format. Hence this
representation also retains all the information that is captured by the digitizer. The point
sequence representation is equivalent to a piecewise linear curve obtained by connecting
the sample points with straight lines.
3.1.2 The Oscillation Model
The oscillation model, proposed by Eden [29], tries to explain the generation of cursive
English handwriting by modelling the pen tip movement as modulation of an oscillatory
motion. The model considers the handwriting as a result of two orthogonal oscillations in
the writing plane, which is superimposed on a constant horizontal velocity in the direction
of writing. The oscillations can be described as:
x˙ (t) = a sin( ωx(t − t0)φx) + c
y (̇t) = b sin( ωy(t − t0)φy), (3.6)
where ωx, φx, ωyand φyare the horizontal and vertical frequencies and phases, respec-
tively, a and b are the horizontal and vertical velocity amplitudes, t 0is the reference time
and c is the horizontal velocity, which creates the writing sweep. The letters are formed
by modulating the above parameters at appropriate times in the writing. The parameter a
controls the letter height, and by modulating ω and φ, one can control the slant and direc-
45
8/7/2019 Online HandWritten Document
http://slidepdf.com/reader/full/online-handwritten-document 67/191
tion of the cycloidal pen movement (see Hollerbach [44]). A modi cation of this model
was proposed by Chen et al. [16], who model the parameters ω and a damping factor of
oscillation, ζ as piecewise linear functions.
The model is a simplistic explanation of cursive English writing, speci cally for the
Palmer style of writing [103], and could be useful for its recognition. However, it fails to
model drawings, scripts other than English, or even printed letters in English. Hence the
oscillation model is not appropriate as a generic representation for on-line handwriting.
3.1.3 The Delta Lognormal Model
The Delta Lognormal theory, proposed by Plamondon [112, 113, 114, 115] is one of the
most powerful generational models of handwriting. It assumes that each curve is composed
of a sequence of primitives, called strokes. Note that, unlike our previous de nition, the
term stroke, as used by Plamondon, refers to a part of the trace of the pen between a pen-
down and pen-up. The strokes are formed by the hand motion resulting from two competing
muscle activities, the agonist and antagonist. The velocity resulting from each activity ismodelled as a lognormal function and the resulting velocity is the difference of the two.
Vσ(t) = V σ1(t) − Vσ2(t)
D i −1(ln(t −t0)−µ i)2
√ 2σ2
Vσi(t) = 2πσi(t − t0) e i , i = 1, 2, (3.7)
where D 1and D 2are the amplitudes of the two activities, and t 0is the start time of the
activities. The parameters µ iand σicharacterize the speed of the activities. In addition to
the above 7 parameters, the total curvature C 0and the angle of incidence of the stroke θ0,
completely characterizes a stroke. The curvature of a stroke is assumed to be a constant,
resulting in the following expression for the tangent of a curve.
46
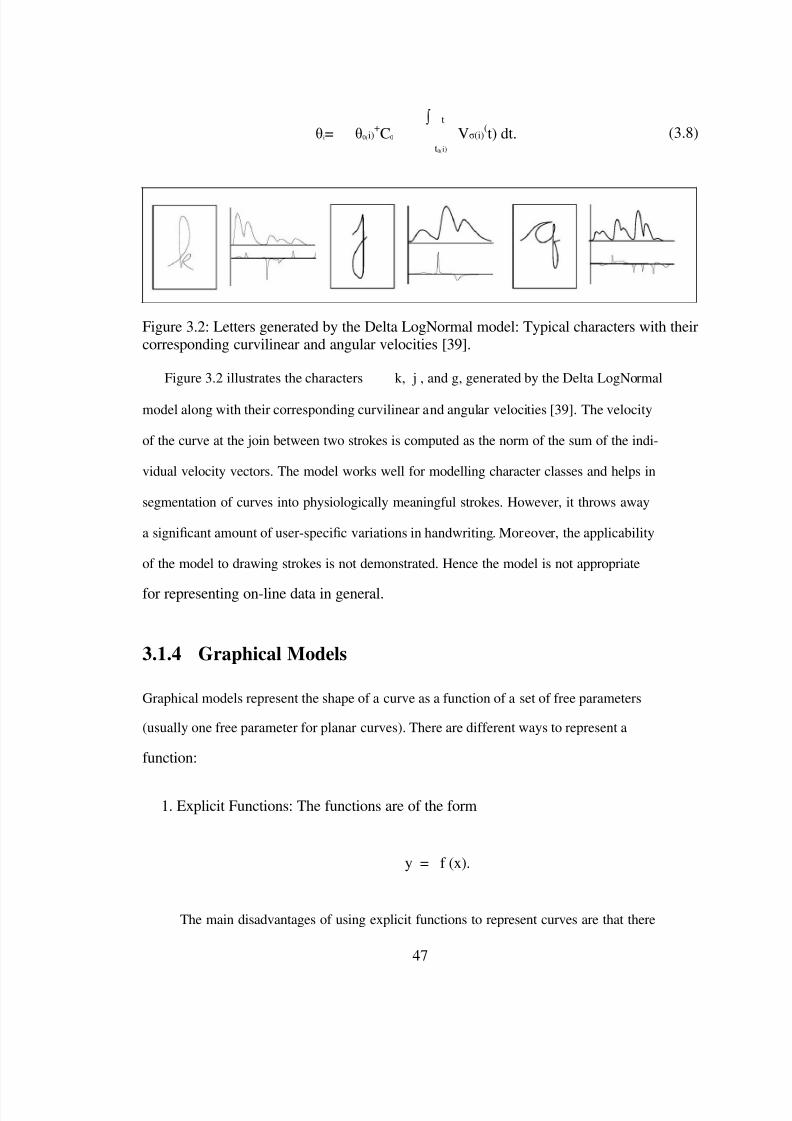
8/7/2019 Online HandWritten Document
http://slidepdf.com/reader/full/online-handwritten-document 68/191

8/7/2019 Online HandWritten Document
http://slidepdf.com/reader/full/online-handwritten-document 69/191
can be only one y for a given value of x and that you cannot have vertical tangents to
the curves.
2. Implicit functions: Implicit functions are of the form:
f (x, y) = 0.
Implicit functions overcome the disadvantages mentioned above with explicit func-
tion forms. However, they have multiple solutions and it is dif cult to determine
consecutive points on a curve, which excludes the possibility of representing tempo-
ral information. In addition, the tangent direction is dif cult to estimate.
3. Parametric functions: A third class of functions is the parametric form. There func-
tions are of the form:
x(t) = f (t); y(t) = g(t),
where t is the parameter that is used to compute the points on the curve (x(t), y(t)).
It is relatively easy to estimate tangent and curvature at a point in the parametric
representation. In addition, it is simpler to split a parametric curve at a point t, and
there are no ambiguities as in the case of explicit functions. However, it is dif cult
to select the appropriate parameter to represent a particular family of curves.
There are different parametric models available to represent curves. However, the class
of functions called splines [23] offer de nite advantages for representing handwriting. In
the following section, we examine different spline models, and describe our choice for
modelling on-line data.
48
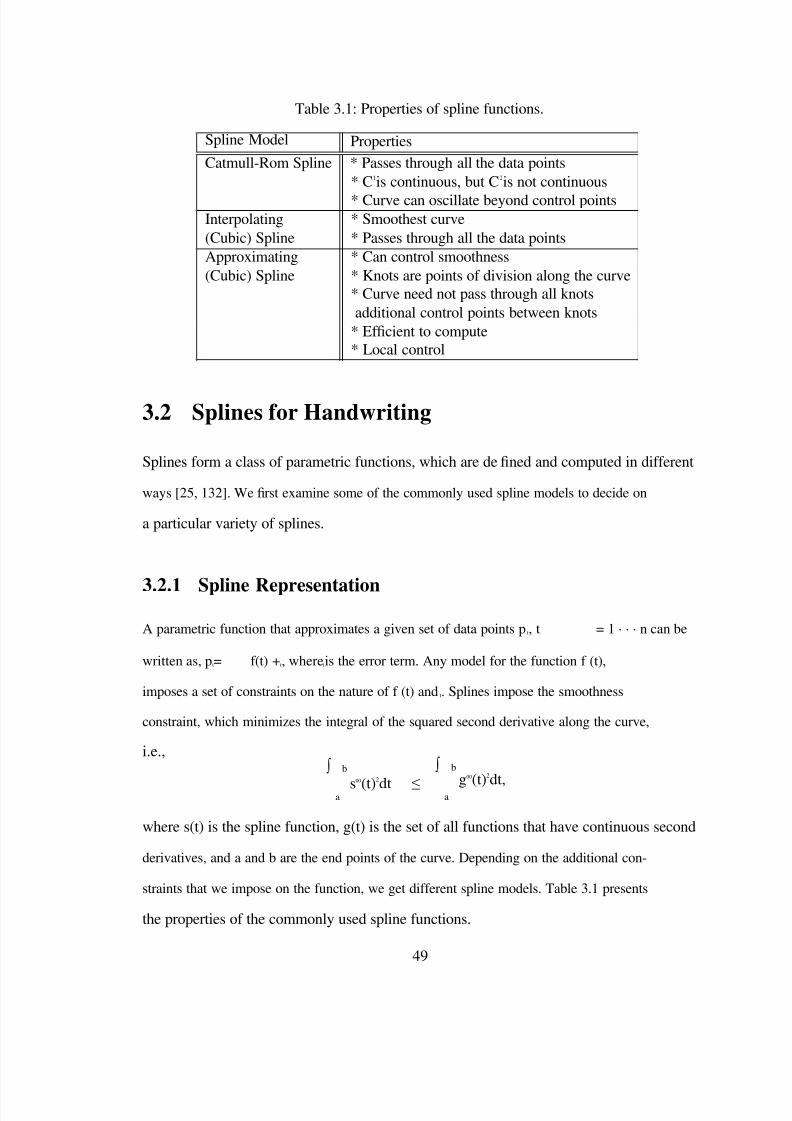
8/7/2019 Online HandWritten Document
http://slidepdf.com/reader/full/online-handwritten-document 70/191
Spline Model
Table 3.1: Properties of spline functions.
PropertiesCatmull-Rom Spline * Passes through all the data points
* C 1is continuous, but C 2is not continuous* Curve can oscillate beyond control points
Interpolating(Cubic) SplineApproximating(Cubic) Spline
* Smoothest curve* Passes through all the data points* Can control smoothness* Knots are points of division along the curve* Curve need not pass through all knotsadditional control points between knots
* Ef cient to compute* Local control
3.2 Splines for Handwriting
Splines form a class of parametric functions, which are de ned and computed in different
ways [25, 132]. We rst examine some of the commonly used spline models to decide on
a particular variety of splines.
3.2.1 Spline Representation
A parametric function that approximates a given set of data points p t, t = 1 · · · n can be
written as, p t= f(t) + t, where tis the error term. Any model for the function f (t),
imposes a set of constraints on the nature of f (t) and t. Splines impose the smoothness
constraint, which minimizes the integral of the squared second derivative along the curve,
i.e.,∫ b
a s00
(t)2
dt ≤
∫ b
a g00
(t)2
dt,
where s(t) is the spline function, g(t) is the set of all functions that have continuous second
derivatives, and a and b are the end points of the curve. Depending on the additional con-
straints that we impose on the function, we get different spline models. Table 3.1 presents
the properties of the commonly used spline functions.
49
8/7/2019 Online HandWritten Document
http://slidepdf.com/reader/full/online-handwritten-document 71/191
8/7/2019 Online HandWritten Document
http://slidepdf.com/reader/full/online-handwritten-document 72/191
3. The position of knot vectors.
The control points in our application are given directly by the handwriting digitizer,
which provides a sequence of x and y positions of the pen tip. The following subsections
describe the selection of each of the parameters mentioned above.
Order of Basis
The choice of order of the basis functions is the result of continuity constraints placed on the
derivatives. Since the curve is generated by force exerted by the muscles, the acceleration is
always nite. In mathematical terms, this ensures continuity of the rst derivative. Further,
if we wish to impose a smoothness constraint on the curve, we need the second derivatives
also to be continuous. The lowest order basis that satis es these constraints is 3, which
forms the cubic B-spline basis. Note that the smoothness constraint is not always satis ed
for handwritten curves (e.g., the sharp change in pen direction in the digit 3 in Figure
3.4(c).) However, the functions f x(t) and f y(t) (Figures 3.4(a) and (b)), which are functions
of time, will always be smooth due to the limit on force applied to the pen.
Knot Vectors
The choice of knot vectors will de ne the nature of the resulting spline. We select an
open uniform knot vector sequence, where the distance between two knot vectors is kept
constant. This ensures that all parts of the stroke are given equal importance (in absence
of evidence to the contrary). The only parameter that needs to be selected is the inter-knot
distance, which will decide the smoothness of the curve. The open uniform knot vector is
of the form: [1 1 1 1d 2d 3d ... kd = n n n n]. The extreme points are repeated as many
times as the order of the basis functions.
We notice from the above discussion that the order of the basis functions and the po-
sition of knots (in the knot vector) are inter-related in the context representing a speci c
curve. This is because, if we de ne the knots to be closer, the curve in between would be
51
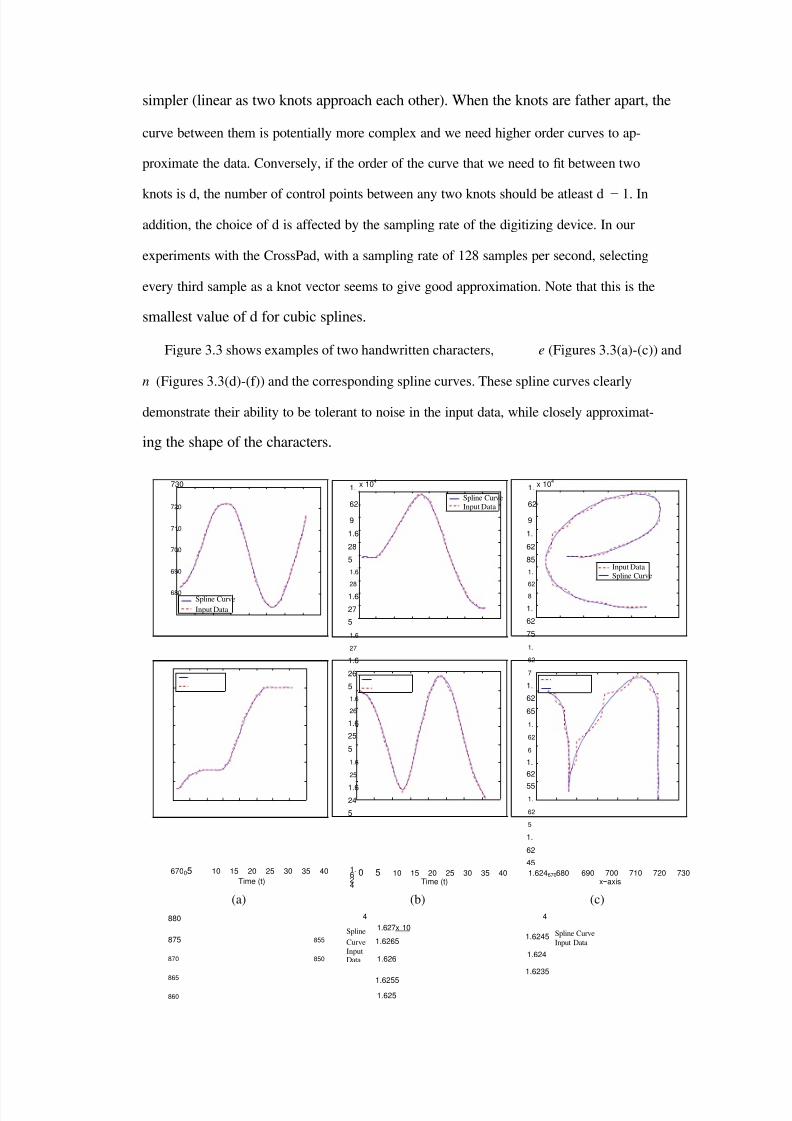
8/7/2019 Online HandWritten Document
http://slidepdf.com/reader/full/online-handwritten-document 73/191
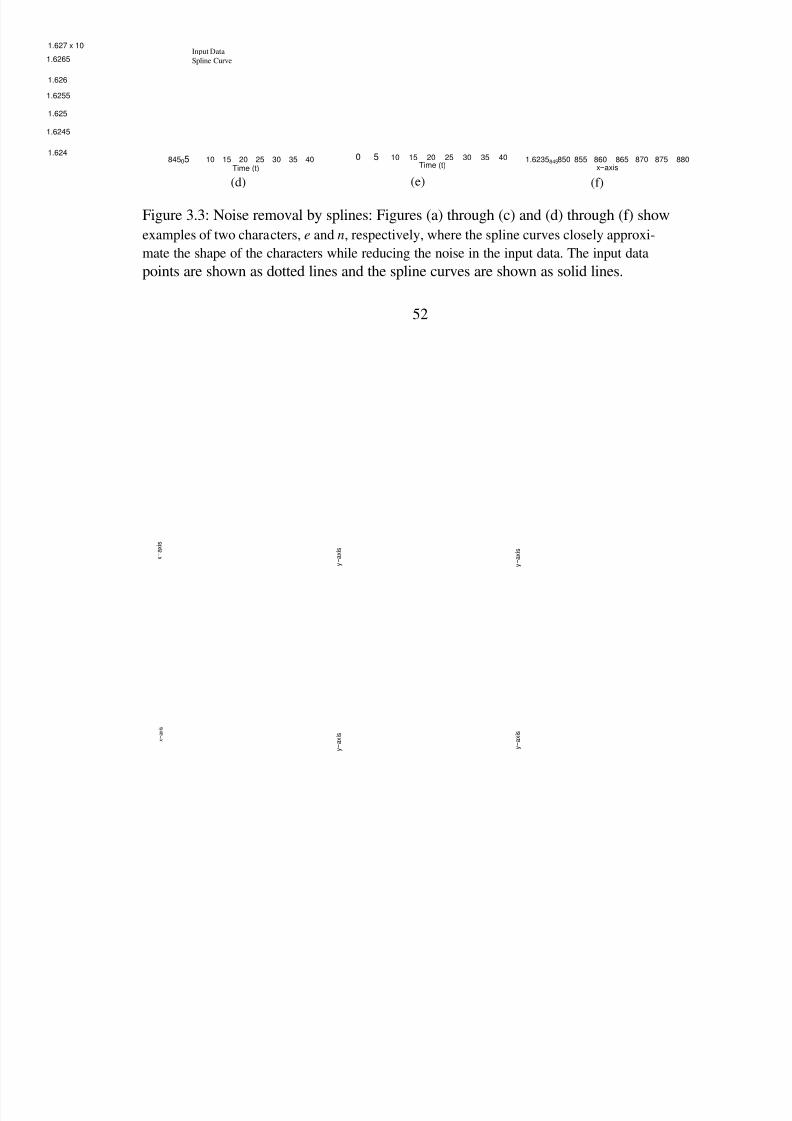
8/7/2019 Online HandWritten Document
http://slidepdf.com/reader/full/online-handwritten-document 74/191
1.627 x 10
1.6265
1.626
1.6255
1.625
1.6245
1.624
Input DataSpline Curve
845 05 10 15 20 25 30 35 40Time (t)
(d)
0 5 10 15 20 25 30 35 40Time (t)
(e)
1.6235 845850 855 860 865 870 875 880x−axis
(f)
Figure 3.3: Noise removal by splines: Figures (a) through (c) and (d) through (f) showexamples of two characters, e and n, respectively, where the spline curves closely approxi-mate the shape of the characters while reducing the noise in the input data. The input datapoints are shown as dotted lines and the spline curves are shown as solid lines.
52
x−axis
y−axis
y−axis
x−axis
y−axis
y−axis
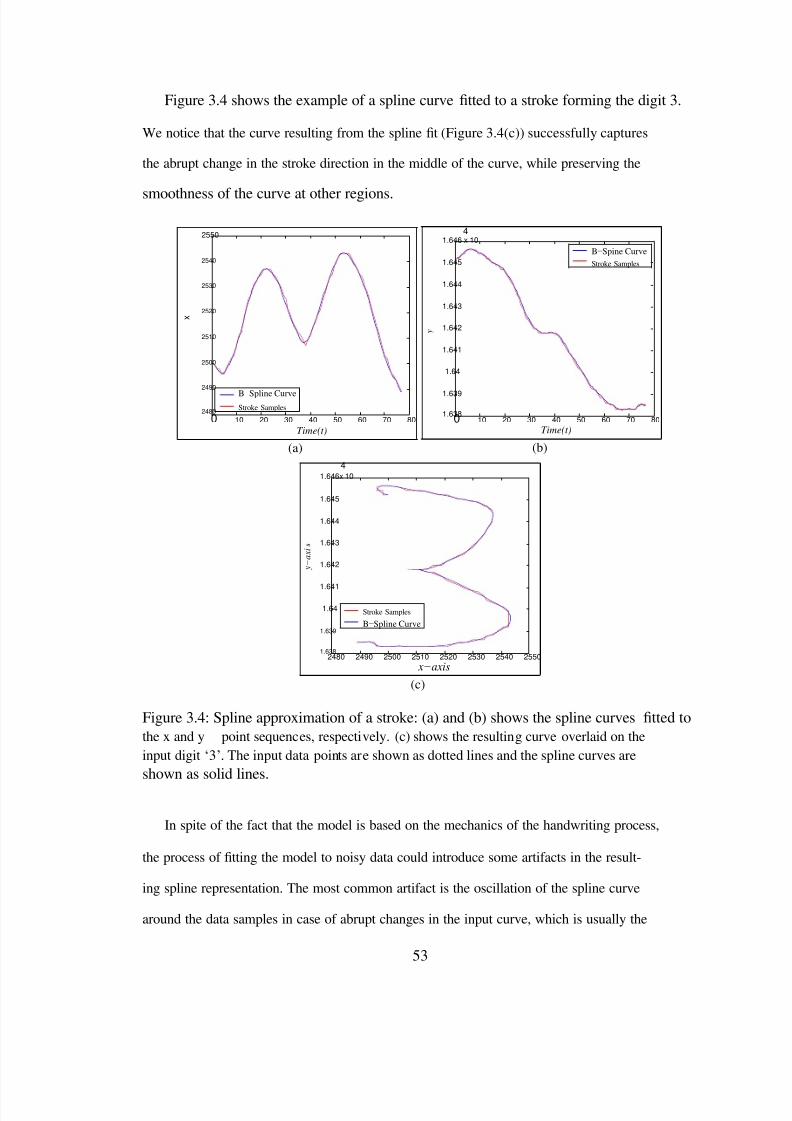
8/7/2019 Online HandWritten Document
http://slidepdf.com/reader/full/online-handwritten-document 75/191
Figure 3.4 shows the example of a spline curve tted to a stroke forming the digit 3.
We notice that the curve resulting from the spline t (Figure 3.4(c)) successfully captures
the abrupt change in the stroke direction in the middle of the curve, while preserving the
smoothness of the curve at other regions.
2550
2540
2530
2520
2510
2500
2490
2480
B−Spline CurveStroke Samples
41.646 x 10
1.645
1.644
1.643
1.642
1.641
1.64
1.639
1.638
B−Spine CurveStroke Samples
0 10 20 30 40 50 60 70 80Time(t)
(a)4
1.646x 10
1.645
1.644
1.643
1.642
1.641
0 10 20 30 40 50 60 70 80Time(t)
(b)
1.64
1.639
1.638
Stroke Samples
B−Spline Curve
2480 2490 2500 2510 2520 2530 2540 2550x− axis
(c)
Figure 3.4: Spline approximation of a stroke: (a) and (b) shows the spline curves tted tothe x and y point sequences, respectively. (c) shows the resulting curve overlaid on theinput digit „3‟. The input data points are shown as dotted lines and the spline curves areshown as solid lines.
In spite of the fact that the model is based on the mechanics of the handwriting process,
the process of tting the model to noisy data could introduce some artifacts in the result-
ing spline representation. The most common artifact is the oscillation of the spline curve
around the data samples in case of abrupt changes in the input curve, which is usually the
53
x
y
y−axi
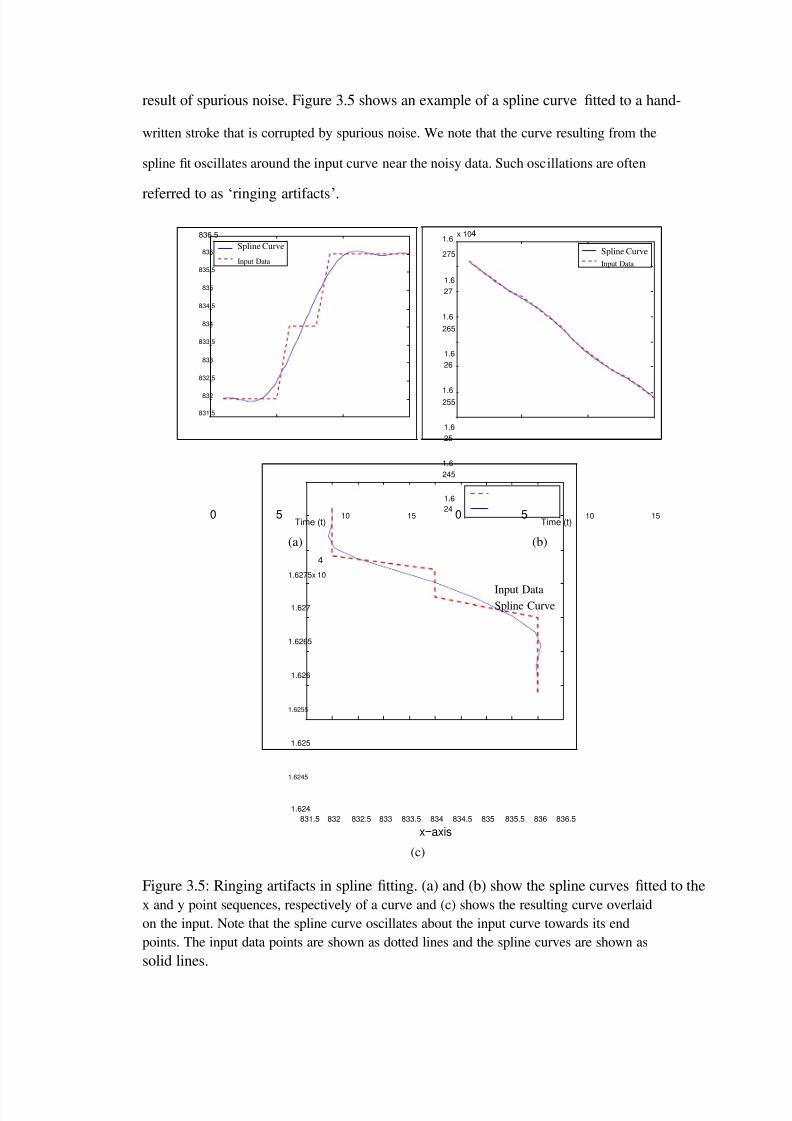
8/7/2019 Online HandWritten Document
http://slidepdf.com/reader/full/online-handwritten-document 76/191
result of spurious noise. Figure 3.5 shows an example of a spline curve tted to a hand-
written stroke that is corrupted by spurious noise. We note that the curve resulting from the
spline t oscillates around the input curve near the noisy data. Such oscillations are often
referred to as „ringing artifacts ‟.
836.5
836
835.5
835
834.5
834
833.5
833
832.5
832
831.5
Spline Curve
Input Data
1.6
275
1.627
1.6265
1.626
1.6255
1.625
1.6245
1.624
x 10 4
Spline CurveInput Data
0 5Time (t)
(a)4
1.6275x 10
10 15 0 5Time (t)
(b)
10 15
1.627
1.6265
1.626
1.6255
1.625
1.6245
1.624
Input DataSpline Curve
831.5 832 832.5 833 833.5 834 834.5 835 835.5 836 836.5
x−axis
(c)
Figure 3.5: Ringing artifacts in spline tting. (a) and (b) show the spline curves tted to thex and y point sequences, respectively of a curve and (c) shows the resulting curve overlaidon the input. Note that the spline curve oscillates about the input curve towards its endpoints. The input data points are shown as dotted lines and the spline curves are shown assolid lines.
8/7/2019 Online HandWritten Document
http://slidepdf.com/reader/full/online-handwritten-document 77/191
Figure 3.6 shows four additional examples of spline approximations to handwritten
54
x−axis
y−axis
y−axis
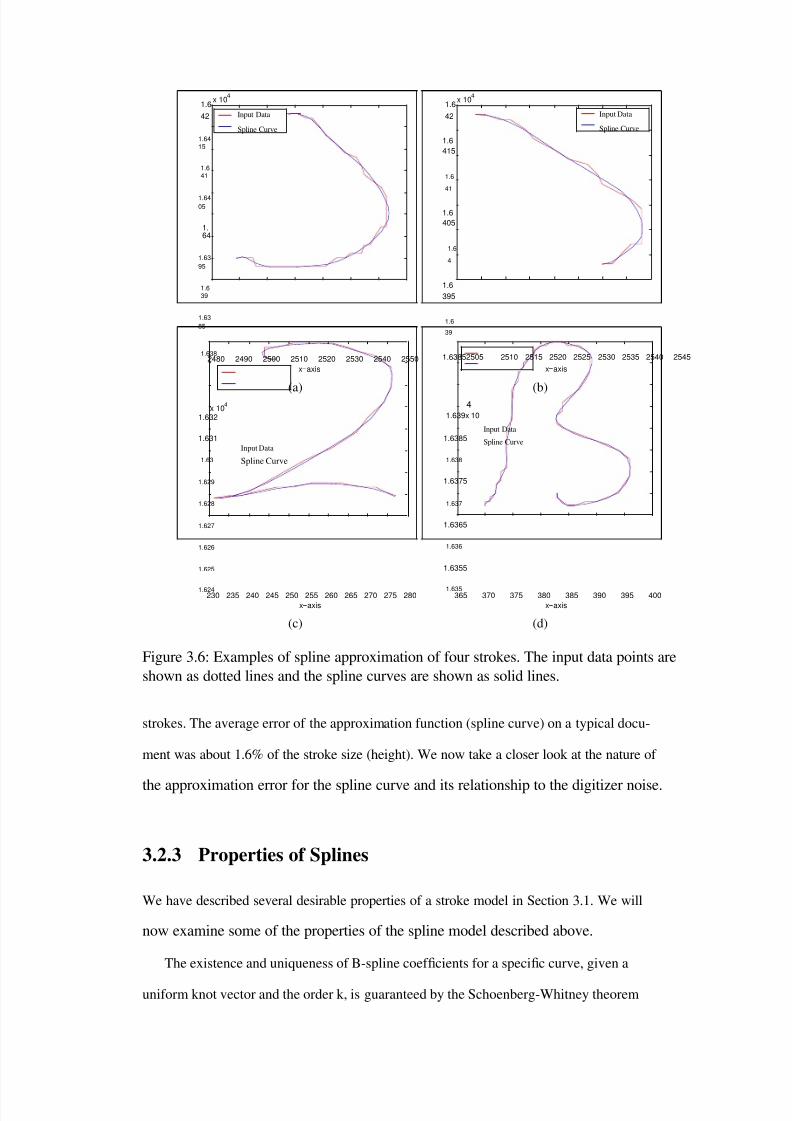
8/7/2019 Online HandWritten Document
http://slidepdf.com/reader/full/online-handwritten-document 78/191
1.642
1.6415
1.641
1.6405
1.64
1.6395
1.639
1.6385
x 104
Input Data
Spline Curve
1.642
1.6415
1.6
41
1.6405
1.6
4
1.6395
1.6
39
x 104
Input Data
Spline Curve
1.6382480 2490 2500 2510 2520 2530 2540 2550
x−axis
(a)x 10 4
1.632
1.63852505 2510 2515 2520 2525 2530 2535 2540 2545x−axis
(b)41.639x 10
Input Data1.631
1.63
1.629
1.628
1.627
1.626
1.625
1.624
Input Data
Spline Curve
1.6385
1.638
1.6375
1.637
1.6365
1.636
1.6355
1.635
Spline Curve
230 235 240 245 250 255 260 265 270 275 280x−axis
(c)
365 370 375 380 385 390 395 400x−axis
(d)
Figure 3.6: Examples of spline approximation of four strokes. The input data points areshown as dotted lines and the spline curves are shown as solid lines.
strokes. The average error of the approximation function (spline curve) on a typical docu-
ment was about 1.6% of the stroke size (height). We now take a closer look at the nature of
the approximation error for the spline curve and its relationship to the digitizer noise.
3.2.3 Properties of Splines
We have described several desirable properties of a stroke model in Section 3.1. We will
now examine some of the properties of the spline model described above.
The existence and uniqueness of B-spline coef cients for a speci c curve, given a
uniform knot vector and the order k, is guaranteed by the Schoenberg-Whitney theorem
8/7/2019 Online HandWritten Document
http://slidepdf.com/reader/full/online-handwritten-document 79/191
8/7/2019 Online HandWritten Document
http://slidepdf.com/reader/full/online-handwritten-document 80/191
[25]. The basis functions have compact support, which provides local control to ma-
nipulate curves represented as splines. In addition, the transformation of a stroke to the
spline-based representation has the advantage of being af ne invariant. This means that the
function F (stroke), which transforms a stroke from the point-based representation to its
spline-based representation, is commutative with any af ne transformation A(). In other
words:
F (A(stroke)) = A(F (stroke)). (3.11)
The result of the function F () is a set of coef cients of the spline basis functions. This
property helps us to compute the result of an af ne transformation to a stroke directly
from it ‟s spline-based representation. Note that this is different from an af ne invariant
representation, where the parameters of the representation of a curve remains unchanged
when an af ne transformation is applied to the handwritten curve.
3.2.4 Approximation Error and Noise
The digitization process introduces noise into the handwriting curve, which comes from
a variety of sources. These include electromagnetic interference, errors in pen position
detection, errors in analog to digital conversion, etc. An ideal model for handwriting should
be able to t the digitized data in such a way that the noise is eliminated in the curve
represented by the model. However, this is an extremely dif cult task as there is no easy
way to characterize the exact nature of the noise or the signal. We used the mechanics of
the handwriting process to de ne the spline model, which should ensure that the model is
able to t all handwritten data. Any error in approximation should solely result from noise
in the data. We try to verify this assertion by comparing the approximation error against a
noise model, which is described below.
We consider three different types of noise that are present in most digitizing devices.
These include a white noise that is introduced by the electronic components in the digitiz-
56
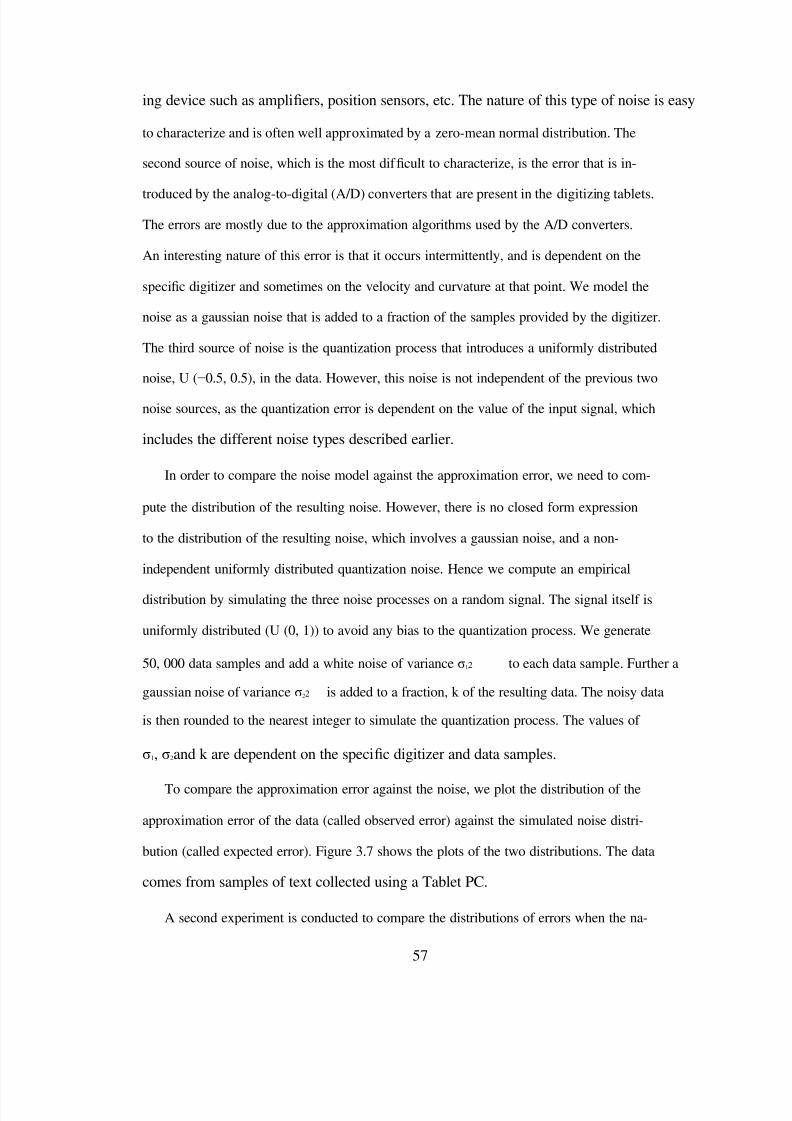
8/7/2019 Online HandWritten Document
http://slidepdf.com/reader/full/online-handwritten-document 81/191
ing device such as ampli ers, position sensors, etc. The nature of this type of noise is easy
to characterize and is often well approximated by a zero-mean normal distribution. The
second source of noise, which is the most dif cult to characterize, is the error that is in-
troduced by the analog-to-digital (A/D) converters that are present in the digitizing tablets.
The errors are mostly due to the approximation algorithms used by the A/D converters.
An interesting nature of this error is that it occurs intermittently, and is dependent on the
speci c digitizer and sometimes on the velocity and curvature at that point. We model the
noise as a gaussian noise that is added to a fraction of the samples provided by the digitizer.
The third source of noise is the quantization process that introduces a uniformly distributed
noise, U ( −0.5, 0.5), in the data. However, this noise is not independent of the previous two
noise sources, as the quantization error is dependent on the value of the input signal, which
includes the different noise types described earlier.
In order to compare the noise model against the approximation error, we need to com-
pute the distribution of the resulting noise. However, there is no closed form expression
to the distribution of the resulting noise, which involves a gaussian noise, and a non-
independent uniformly distributed quantization noise. Hence we compute an empirical
distribution by simulating the three noise processes on a random signal. The signal itself is
uniformly distributed (U (0, 1)) to avoid any bias to the quantization process. We generate
50, 000 data samples and add a white noise of variance σ12 to each data sample. Further a
gaussian noise of variance σ22 is added to a fraction, k of the resulting data. The noisy data
is then rounded to the nearest integer to simulate the quantization process. The values of
σ1, σ2and k are dependent on the speci c digitizer and data samples.
To compare the approximation error against the noise, we plot the distribution of the
approximation error of the data (called observed error) against the simulated noise distri-
bution (called expected error). Figure 3.7 shows the plots of the two distributions. The data
comes from samples of text collected using a Tablet PC.
A second experiment is conducted to compare the distributions of errors when the na-
57
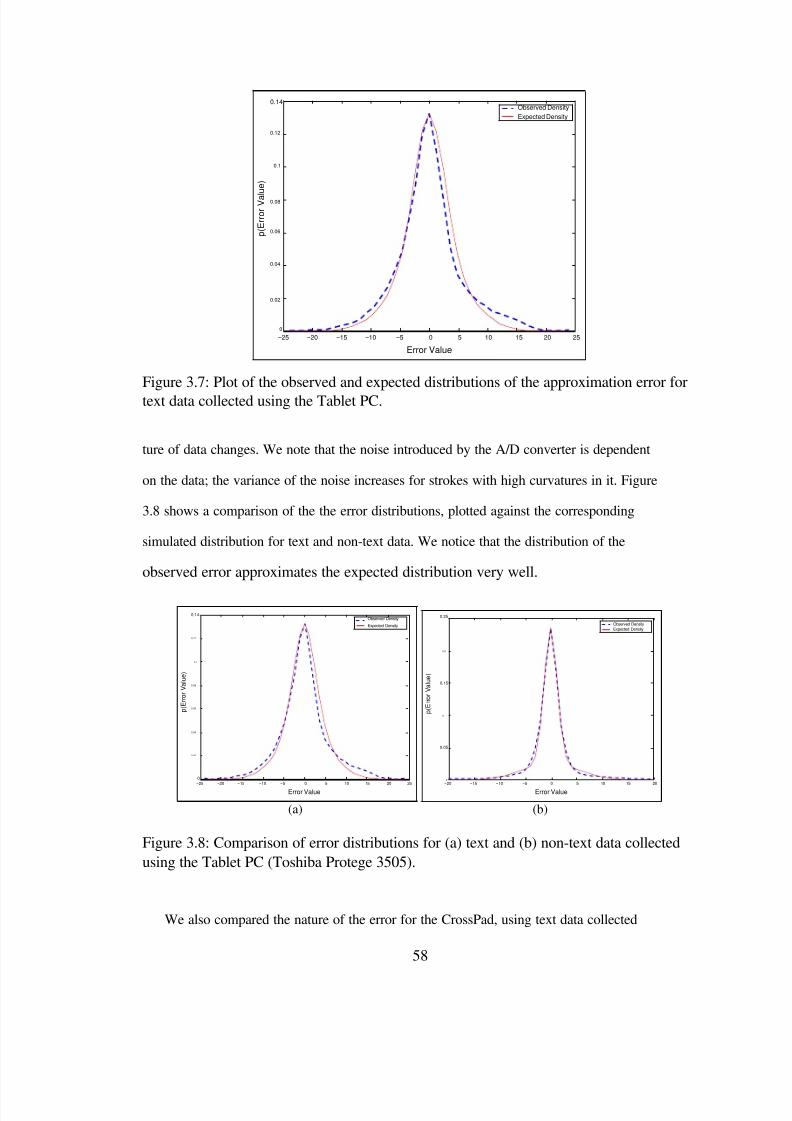
8/7/2019 Online HandWritten Document
http://slidepdf.com/reader/full/online-handwritten-document 82/191
0.14
0.12
0.1
0.08
0.06
0.04
0.02
0
Observed DensityExpected Density
−25 −20 −15 −10 −5 0 5 10 15 20 25
Error Value
Figure 3.7: Plot of the observed and expected distributions of the approximation error fortext data collected using the Tablet PC.
ture of data changes. We note that the noise introduced by the A/D converter is dependent
on the data; the variance of the noise increases for strokes with high curvatures in it. Figure
3.8 shows a comparison of the the error distributions, plotted against the corresponding
simulated distribution for text and non-text data. We notice that the distribution of the
observed error approximates the expected distribution very well.
0.14
0.12
0.1
0.08
0.06
0.04
0.02
0
Observed Density
Expected Density
0.25
0.2
0.15
0.1
0.05
0
Observed DensityExpected Density
−25 −20 −15 −10 −5 0 5 10 15 20 25
Error Value
(a)
−20 −15 −10 −5 0 5 10 15 20
Error Value
(b)
Figure 3.8: Comparison of error distributions for (a) text and (b) non-text data collectedusing the Tablet PC (Toshiba Protege 3505).
We also compared the nature of the error for the CrossPad, using text data collected
58
p(Error Value)
p(Error Value)
p(Error Value)
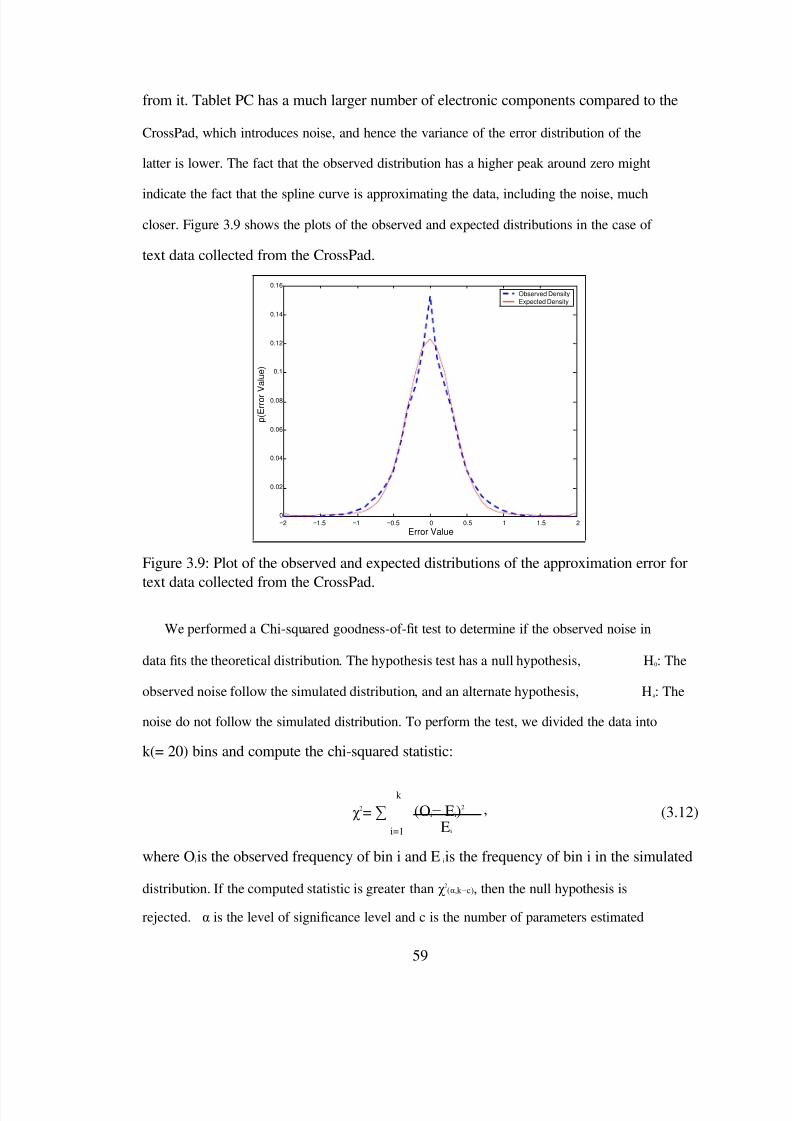
8/7/2019 Online HandWritten Document
http://slidepdf.com/reader/full/online-handwritten-document 83/191
8/7/2019 Online HandWritten Document
http://slidepdf.com/reader/full/online-handwritten-document 84/191
from the data. In our experiments, the degrees of freedom, k − c is 18, since the variance
of two normal distributions are estimated from the data. The chi squared value for 18
degrees of freedom at a level of signi cance of 0.99 is approximately 7.02 and the value
computed according to Equation 3.12 was around 800. This rejects the hypothesis that the
observed distribution strictly follows the simulated noise distribution. However, the value
of the computed statistic is not too high considering the number of samples (approximately
50, 000) and the difference is distribution could be primarily attributed to the noise model
of A/D converter and other noise sources that are not considered.
To summarize the experiments, we notice that the approximation error follows a dis-
tribution that is very close to that of the noise model that we described. This is not a
conclusive proof that the approximation process eliminates noise and only noise. How-
ever, since the restrictions on our model are primarily de ned based on the handwriting
process, we have reasons to believe that the approximation error is primarily composed of
noise introduced by the digitizer. In other words, the spline model closely approximates
the uncorrupted handwritten data.
3.3 Computing Stroke properties
Once the strokes are approximated using a spline, we can reliably compute different prop-
erties of the stroke. We will now derive the formulas for some of the common properties of
strokes that need to be computed.
• Stroke Length: The stroke length is de ned as the total length of the curve repre-
sented by the stroke. Let the stroke be de ned as S(t) = (S x(t), S y(t)). The length
of the stroke between two points, t iand t jis the arc-length integral of the stroke,
given by:∫ tj 0 2 0 2
L(t i, t j) =ti
((S x(t))
60
+ (S y(t)) ) 1/2dt.
8/7/2019 Online HandWritten Document
http://slidepdf.com/reader/full/online-handwritten-document 85/191
8/7/2019 Online HandWritten Document
http://slidepdf.com/reader/full/online-handwritten-document 86/191
C(t i, t j) = limδt→0
(t j−ti)/ δt ∑
k=0
|Θti+(k+1)dt − Θti+k.dt|, (3.15)
where Θ(t) is the slope of the curve (computed as the angle with respect to the x
axis) at time t, given by:
Θ(t) = arctan(S y0(t)/S x0(t)).
The change in parameter from arc-length s in Equation (3.14) to time t in Equation
(3.15) does not affect the value of C(). Further, we can approximate the limit by the
sum: j−1∑ C(t i, t j) = | Θtk+1 − Θtk
|.k=i
The approximation is exact under the assumption that the second derivative of the
curve has no zero crossings between t iand t j. The derivative of a spline function of
order n is another spline of order n − 1. The derivative of S(t) is given by:
n−1d ∑
where K iis given by:
dt S(t) = S 0(t) =
p
i=0N i,p−1
(t)K i,
K i= u i+p+1 − u i+1(P i+1 − P i)
• Centroid: The centroid, M (S) of a stroke is computed as the integral:
M (S) =1
L(t 1, t n)
∫ tn
t1S(t) dt.
We need to adopt a numerical solution for the integration as there is no closed form
solution to the integral. However, there is an ef cient way to compute an approximate
62
8/7/2019 Online HandWritten Document
http://slidepdf.com/reader/full/online-handwritten-document 87/191
value of this integral, which is given by the sum:
n
1 ∑(ti+ t i+1
L(t 1, t n) i=1S 2 . L 1(t i, t i+1
),
where L() and L 1() are de ned above.
Once again the summation approximates the stroke as a piecewise linear curve. The
approximation is valid due to the inverse relationship between the stroke speed and
curvature.
3.4 File Formats for On-line Data
We have been discussing the representation of handwritten data in memory for the purpose
of computing stroke properties. In this section, we take a look at the common le formats
used to represent the data collected from a digitizing tablet.
The CrossPad uses two different representations; a binary format and an ASCII format
for the data it transfers to a computer. The work in this thesis uses the ASCII format fromthe CrossPad or IBM Thinkpad Transnote, often referred to as the Rcard format. A second
format, which is becoming an industry standard, is the InkML format [36]. The two formats
are brie y described below.
The Rcard format represents a document in a le as a set of regions. Each region can
represent a single page or a part of it. The regions are designated by a „=R ‟marker at the
beginning of each region. This is followed by the number of strokes in that region and a
set of device tags. A „=T ‟tag accompanies every „=R‟tag, which is used to assign a name
for the region. Each stroke begins on a new line and is marked by a „=S‟tag, which also
speci es the number of sample points in the stroke. This is followed by the pairs of x and
y coordinates of the strokes. Figure 3.10 (a) shows part of a Rcard le.
The Tablet PC uses a proprietary binary representation for the data it collects in a le.
63
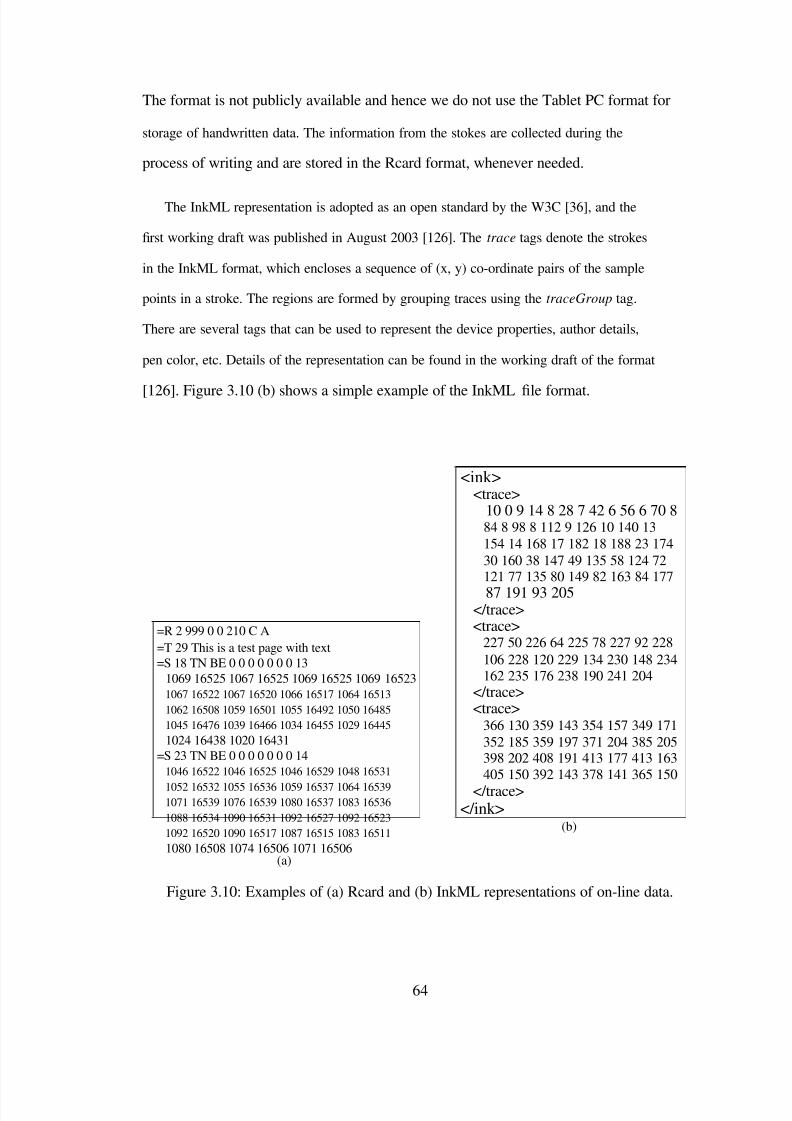
8/7/2019 Online HandWritten Document
http://slidepdf.com/reader/full/online-handwritten-document 88/191
The format is not publicly available and hence we do not use the Tablet PC format for
storage of handwritten data. The information from the stokes are collected during the
process of writing and are stored in the Rcard format, whenever needed.
The InkML representation is adopted as an open standard by the W3C [36], and the
rst working draft was published in August 2003 [126]. The trace tags denote the strokes
in the InkML format, which encloses a sequence of (x, y) co-ordinate pairs of the sample
points in a stroke. The regions are formed by grouping traces using the traceGroup tag.
There are several tags that can be used to represent the device properties, author details,
pen color, etc. Details of the representation can be found in the working draft of the format
[126]. Figure 3.10 (b) shows a simple example of the InkML le format.
<ink><trace>
10 0 9 14 8 28 7 42 6 56 6 70 884 8 98 8 112 9 126 10 140 13154 14 168 17 182 18 188 23 17430 160 38 147 49 135 58 124 72121 77 135 80 149 82 163 84 17787 191 93 205
</trace>=R 2 999 0 0 210 C A=T 29 This is a test page with text=S 18 TN BE 0 0 0 0 0 0 0 13
1069 16525 1067 16525 1069 16525 1069 165231067 16522 1067 16520 1066 16517 1064 165131062 16508 1059 16501 1055 16492 1050 164851045 16476 1039 16466 1034 16455 1029 164451024 16438 1020 16431
=S 23 TN BE 0 0 0 0 0 0 0 141046 16522 1046 16525 1046 16529 1048 16531
1052 16532 1055 16536 1059 16537 1064 165391071 16539 1076 16539 1080 16537 1083 165361088 16534 1090 16531 1092 16527 1092 165231092 16520 1090 16517 1087 16515 1083 165111080 16508 1074 16506 1071 16506
(a)
<trace>227 50 226 64 225 78 227 92 228106 228 120 229 134 230 148 234162 235 176 238 190 241 204
</trace><trace>
366 130 359 143 354 157 349 171352 185 359 197 371 204 385 205398 202 408 191 413 177 413 163405 150 392 143 378 141 365 150
</trace></ink>
(b)
Figure 3.10: Examples of (a) Rcard and (b) InkML representations of on-line data.
64
8/7/2019 Online HandWritten Document
http://slidepdf.com/reader/full/online-handwritten-document 89/191
3.5 Document Database
The data used in this thesis was collected using the CrossPad . The pen position is sampled
at a constant rate of 128 samples per second and the device has a resolution of 250 dpi along
the x and y axes 1. Part of the data was collected on ruled paper with an inter-line distance of
8.75mm although some writers wrote on alternate lines. We must point out that the actual
device for data collection is not important as long as it can generate a temporal sequence of
x and y positions of the pen tip. Most of the data used in the document segmentation work
was collected by the Pen Computing group at IBM T.J. Watson Research Center.
For the script identi cation work, the users were asked to write one page of text in a
particular script, with each page containing approximately 20 lines of text. No restriction
was imposed on the content or style of writing. The details of the database used for this
work are given in Table 6.9. Multiple pages from the same writer were collected at different
times. Appendix B shows some examples of the documents in the database used in various
experiments reported in this thesis.
3.6 Summary
In this chapter we have developed a generic representation for on-line handwritten data
using cubic splines. We have reviewed the popular models currently used for on-line hand-
writing and explained the advantages and drawbacks of each. The suitability of the model
is demonstrated based on the assumptions on hand motion and experimental results are pro-
vided to support the assertion. We derived formulas for some of the commonly used stroke
properties, based on the spline representation. We have also described the commonly used
le formats for on-line data.
There are no assumptions made regarding the nature of the data being written or drawn
in de ning the model. This makes the model suitable for a variety of applications such
1Users have reported that the actual resolution is only about half of this value [123].
65

8/7/2019 Online HandWritten Document
http://slidepdf.com/reader/full/online-handwritten-document 90/191
as handwriting recognition, writer identi cation, script or language identi cation, stroke
matching, handwritten data compression, etc.
66
8/7/2019 Online HandWritten Document
http://slidepdf.com/reader/full/online-handwritten-document 91/191
Chapter 4
Structure Identi cation
The problem of segmenting document pages into homogeneous regions containing unique
semantic entities is of prime importance in automatic document understanding systems
[94]. Several algorithms exist that recognize printed or handwritten text. However, most
of these algorithms assume that the input is a plain text and the text lines and words in the
text have been properly identi ed and segmented by a preprocessor. A typical handwritten
document page may contain several regions of interest such as underlined keywords, dif-
ferent types of tables, diagrams, sketches and text (see Figure 4.1(a)). The main task of a
segmentation algorithm is to identify contiguous regions of text, graphics and tables in such
a document for document understanding and retrieval based on semantic entities. Figure
4.1(b) shows the desired output of a document understanding system after segmentation
and full transcription of the handwritten document.
Different approaches to segmentation of document images were mentioned in Section
2.2. The top-down approaches are more suitable for printed documents such as journal
papers, where documents are well structured, and the prior knowledge can be used in iden-
tifying higher level structures. In the case of handwritten documents, especially on-line
documents, a bottom-up approach is more appropriate due to the large variations in the lay-
out of the documents. In addition, the lower level primitives of on-line documents (strokes)
67
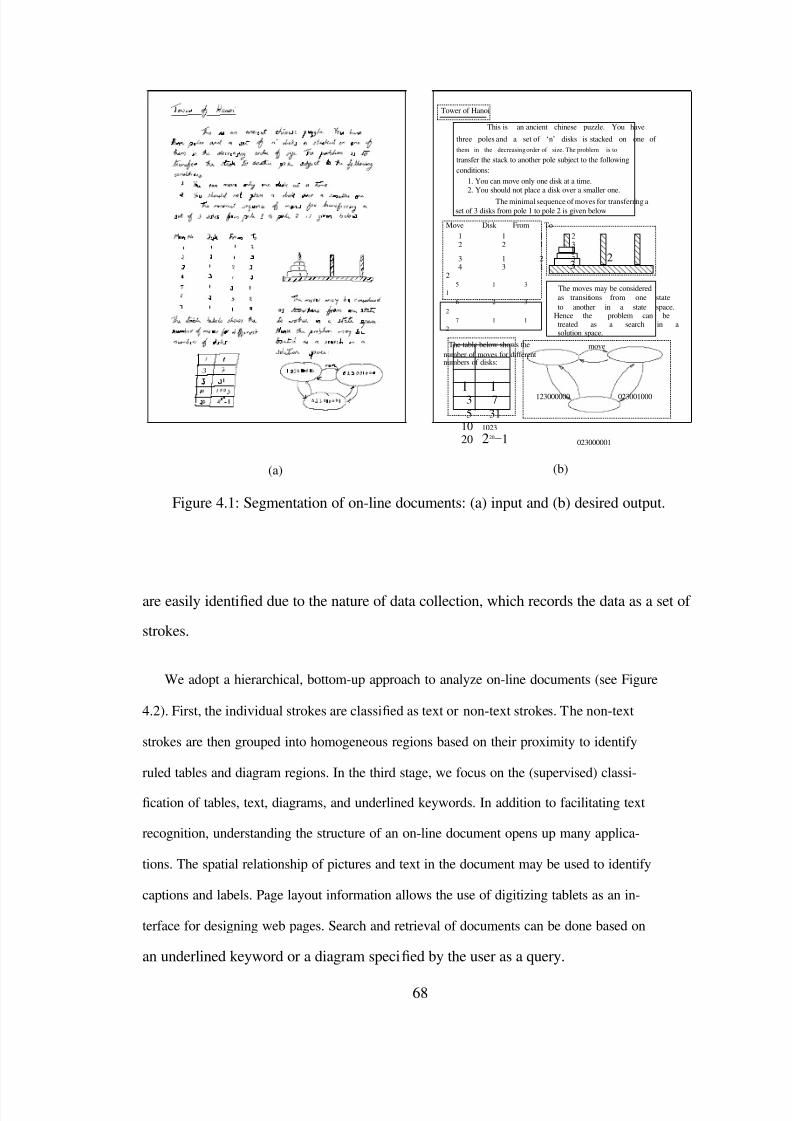
8/7/2019 Online HandWritten Document
http://slidepdf.com/reader/full/online-handwritten-document 92/191
Tower of Hanoi
This is an ancient chinese puzzle. You have
three poles and a set of „n‟ disks is stacked on one of them in the decreasing order of size. The problem is to
transfer the stack to another pole subject to the followingconditions:
1. You can move only one disk at a time.2. You should not place a disk over a smaller one.
The minimal sequence of moves for transferring aset of 3 disks from pole 1 to pole 2 is given below
Move Disk From To1 1 1 22 2 1 3
13 1 2 3 24 3 1
25 1 3
16 2 3
27 1 1
2
The table below shows thenumber of moves for differentnumbers of disks:
1 1
3
The moves may be consideredas transitions from one stateto another in a state space.
Hence the problem can betreated as a search in asolution space.
move
(a)
3 75 31
10 1023
20 220−1
123000000
(b)
023000001
023001000
Figure 4.1: Segmentation of on-line documents: (a) input and (b) desired output.
are easily identi ed due to the nature of data collection, which records the data as a set of
strokes.
We adopt a hierarchical, bottom-up approach to analyze on-line documents (see Figure
4.2). First, the individual strokes are classi ed as text or non-text strokes. The non-text
strokes are then grouped into homogeneous regions based on their proximity to identify
ruled tables and diagram regions. In the third stage, we focus on the (supervised) classi-
cation of tables, text, diagrams, and underlined keywords. In addition to facilitating text
recognition, understanding the structure of an on-line document opens up many applica-
tions. The spatial relationship of pictures and text in the document may be used to identify
captions and labels. Page layout information allows the use of digitizing tablets as an in-
terface for designing web pages. Search and retrieval of documents can be done based on
an underlined keyword or a diagram speci ed by the user as a query.
68
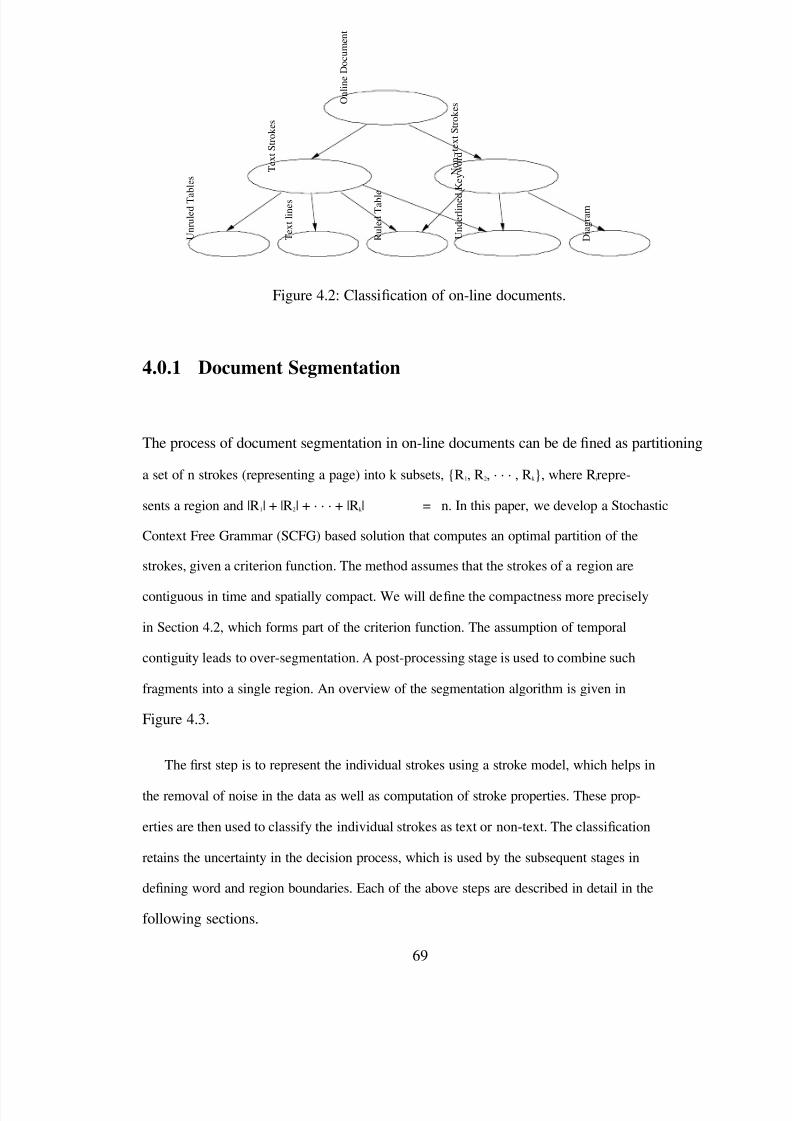
8/7/2019 Online HandWritten Document
http://slidepdf.com/reader/full/online-handwritten-document 93/191
Figure 4.2: Classi cation of on-line documents.
4.0.1 Document Segmentation
The process of document segmentation in on-line documents can be de ned as partitioning
a set of n strokes (representing a page) into k subsets, {R 1, R 2, · · · , R k }, where R irepre-
sents a region and |R 1| + |R 2| + · · · + |R k | = n. In this paper, we develop a Stochastic
Context Free Grammar (SCFG) based solution that computes an optimal partition of the
strokes, given a criterion function. The method assumes that the strokes of a region are
contiguous in time and spatially compact. We will de ne the compactness more precisely
in Section 4.2, which forms part of the criterion function. The assumption of temporal
contiguity leads to over-segmentation. A post-processing stage is used to combine such
fragments into a single region. An overview of the segmentation algorithm is given in
Figure 4.3.
The rst step is to represent the individual strokes using a stroke model, which helps in
the removal of noise in the data as well as computation of stroke properties. These prop-
erties are then used to classify the individual strokes as text or non-text. The classi cation
retains the uncertainty in the decision process, which is used by the subsequent stages in
dening word and region boundaries. Each of the above steps are described in detail in the
following sections.
69
Online Document
Text Strokes
Non−text Strokes
Unruled Tables
Text lines
Ruled Table
Underlined Keyword
Diagram
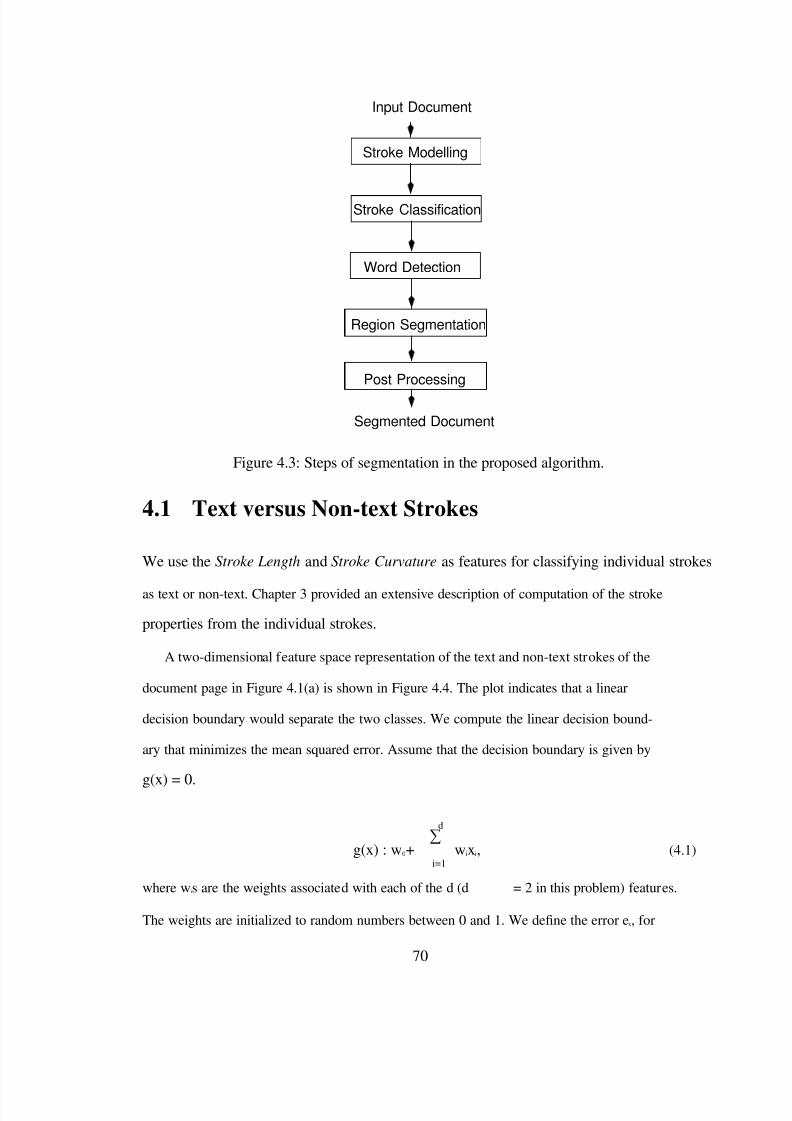
8/7/2019 Online HandWritten Document
http://slidepdf.com/reader/full/online-handwritten-document 94/191
Input Document
Stroke Modelling
Stroke Classification
Word Detection
Region Segmentation
Post Processing
Segmented Document
Figure 4.3: Steps of segmentation in the proposed algorithm.
4.1 Text versus Non-text Strokes
We use the Stroke Length and Stroke Curvature as features for classifying individual strokes
as text or non-text. Chapter 3 provided an extensive description of computation of the stroke
properties from the individual strokes.
A two-dimensional feature space representation of the text and non-text strokes of the
document page in Figure 4.1(a) is shown in Figure 4.4. The plot indicates that a linear
decision boundary would separate the two classes. We compute the linear decision bound-
ary that minimizes the mean squared error. Assume that the decision boundary is given by
g(x) = 0.
d∑
g(x) : w 0+ w ixi, (4.1)i=1
where w is are the weights associated with each of the d (d = 2 in this problem) features.
The weights are initialized to random numbers between 0 and 1. We de ne the error e x, for
70
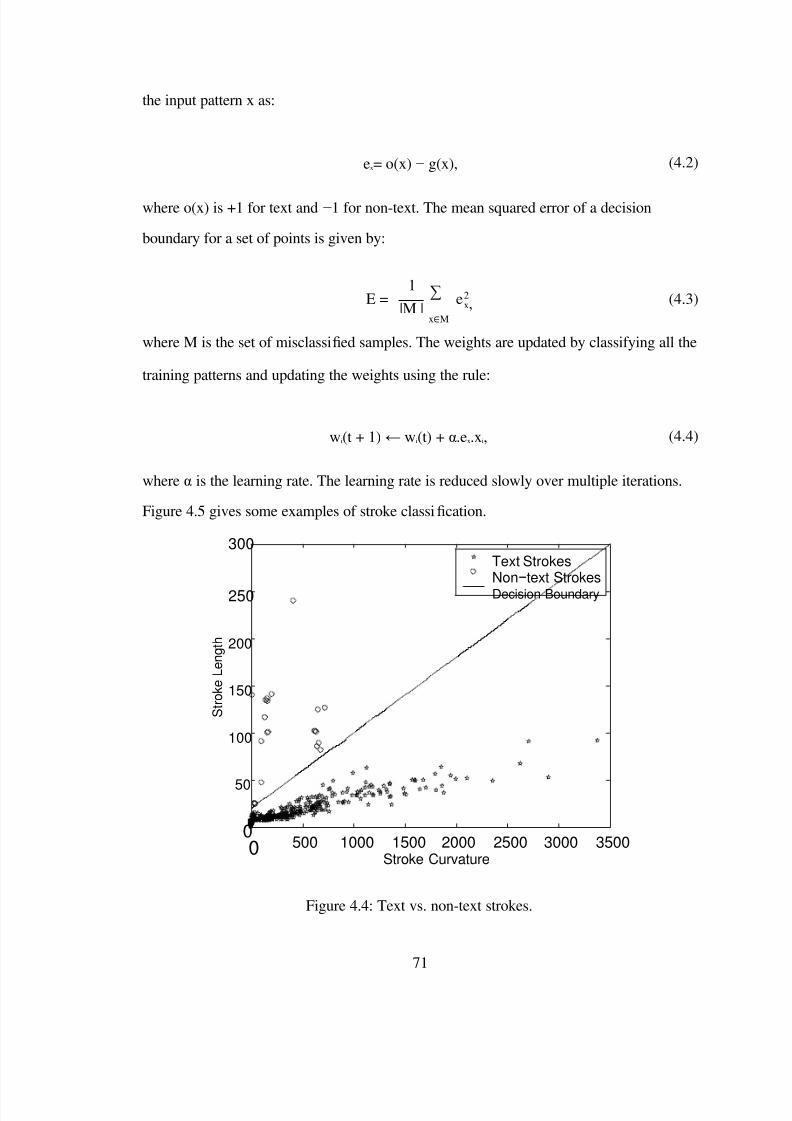
8/7/2019 Online HandWritten Document
http://slidepdf.com/reader/full/online-handwritten-document 95/191
the input pattern x as:
ex= o(x) − g(x), (4.2)
where o(x) is +1 for text and −1 for non-text. The mean squared error of a decision
boundary for a set of points is given by:
E =1
|M |∑
x∈M
e 2x, (4.3)
where M is the set of misclassi ed samples. The weights are updated by classifying all the
training patterns and updating the weights using the rule:
w i(t + 1) ←w i(t) + α.e x.x i, (4.4)
where α is the learning rate. The learning rate is reduced slowly over multiple iterations.
Figure 4.5 gives some examples of stroke classi cation.
300Text StrokesNon −text Strokes
250
200
150
100
50
00
Decision Boundary
500 1000 1500 2000 2500 3000 3500Stroke Curvature
Figure 4.4: Text vs. non-text strokes.
71
Stroke Length
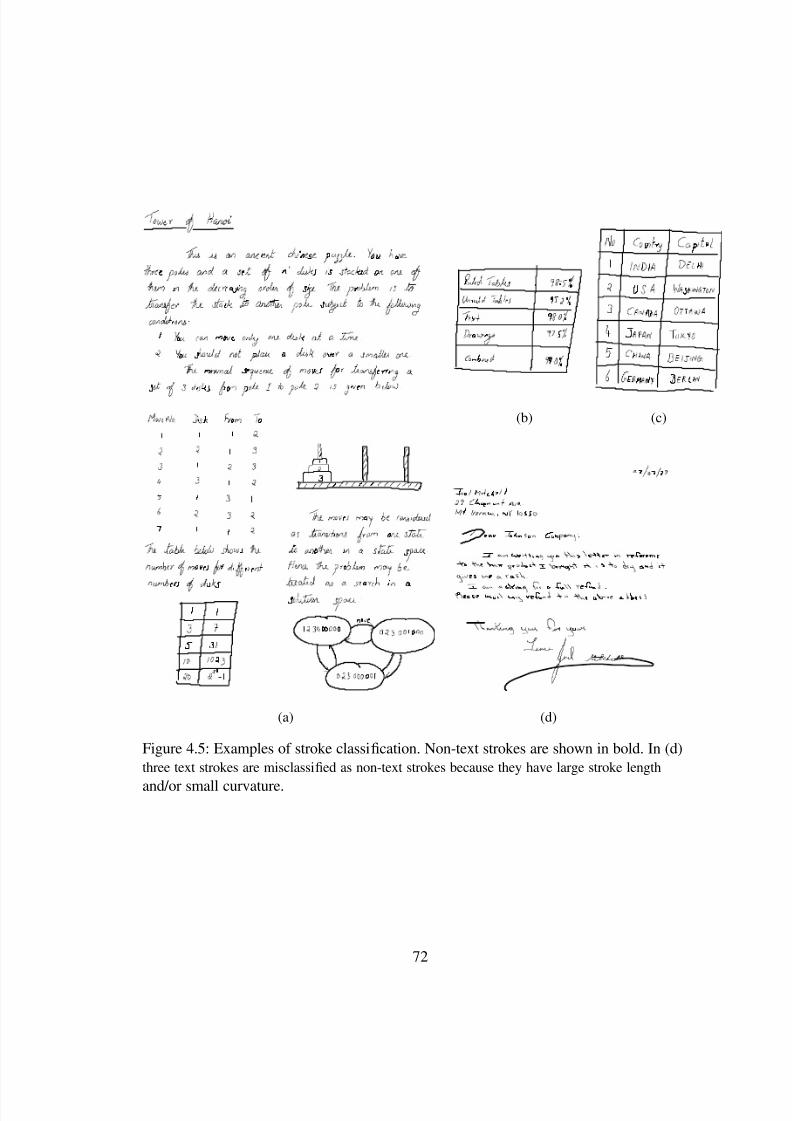
8/7/2019 Online HandWritten Document
http://slidepdf.com/reader/full/online-handwritten-document 96/191
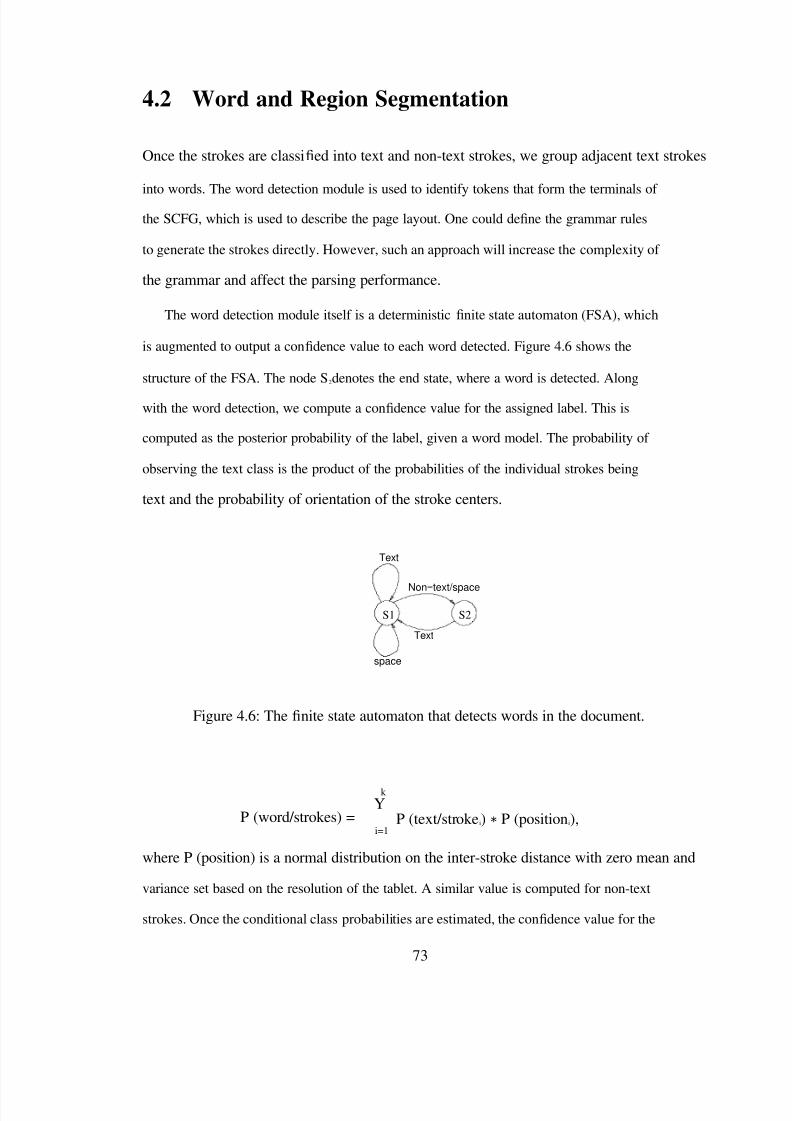
8/7/2019 Online HandWritten Document
http://slidepdf.com/reader/full/online-handwritten-document 97/191
4.2 Word and Region Segmentation
Once the strokes are classi ed into text and non-text strokes, we group adjacent text strokes
into words. The word detection module is used to identify tokens that form the terminals of the SCFG, which is used to describe the page layout. One could de ne the grammar rules
to generate the strokes directly. However, such an approach will increase the complexity of
the grammar and affect the parsing performance.
The word detection module itself is a deterministic nite state automaton (FSA), which
is augmented to output a con dence value to each word detected. Figure 4.6 shows the
structure of the FSA. The node S 2denotes the end state, where a word is detected. Along
with the word detection, we compute a con dence value for the assigned label. This is
computed as the posterior probability of the label, given a word model. The probability of
observing the text class is the product of the probabilities of the individual strokes being
text and the probability of orientation of the stroke centers.
Text
Non −text/space
S1
space
Text
S2
Figure 4.6: The nite state automaton that detects words in the document.
k Y
P (word/strokes) =i=1
P (text/stroke i) ∗ P (position i),
where P (position) is a normal distribution on the inter-stroke distance with zero mean and
variance set based on the resolution of the tablet. A similar value is computed for non-text
strokes. Once the conditional class probabilities are estimated, the con dence value for the
73
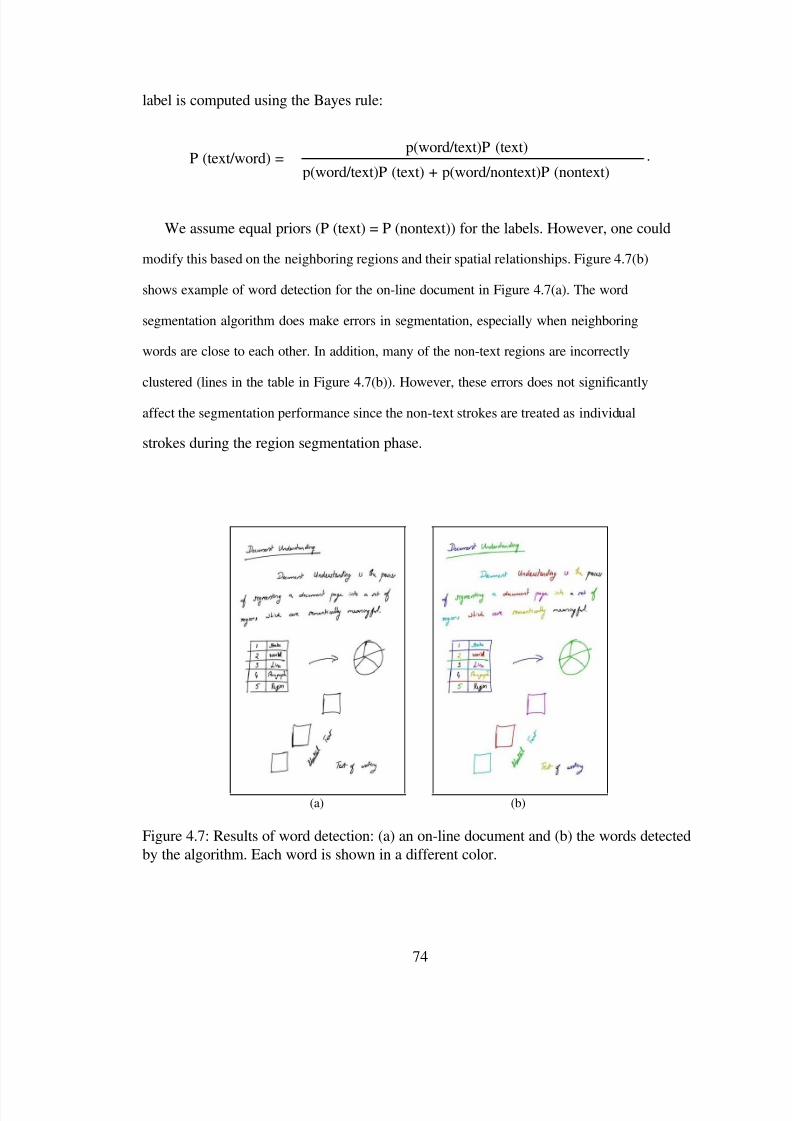
8/7/2019 Online HandWritten Document
http://slidepdf.com/reader/full/online-handwritten-document 98/191
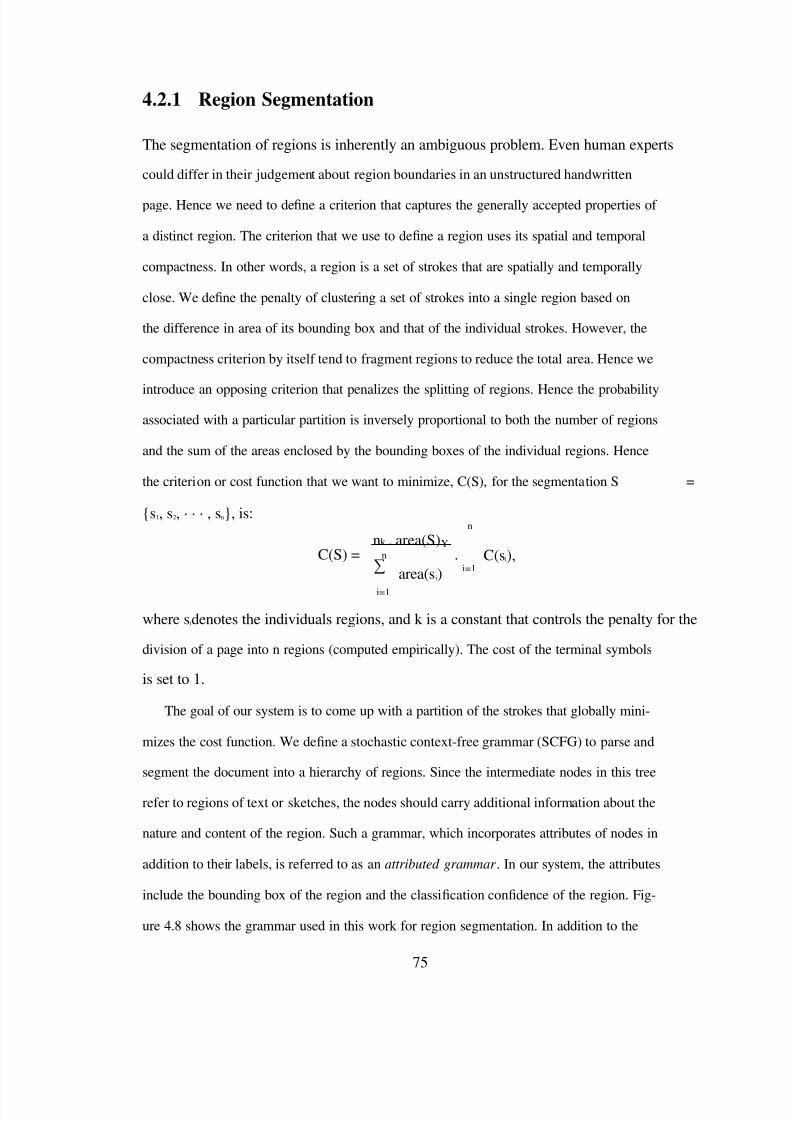
8/7/2019 Online HandWritten Document
http://slidepdf.com/reader/full/online-handwritten-document 99/191
4.2.1 Region Segmentation
The segmentation of regions is inherently an ambiguous problem. Even human experts
could differ in their judgement about region boundaries in an unstructured handwritten
page. Hence we need to de ne a criterion that captures the generally accepted properties of
a distinct region. The criterion that we use to de ne a region uses its spatial and temporal
compactness. In other words, a region is a set of strokes that are spatially and temporally
close. We de ne the penalty of clustering a set of strokes into a single region based on
the difference in area of its bounding box and that of the individual strokes. However, the
compactness criterion by itself tend to fragment regions to reduce the total area. Hence we
introduce an opposing criterion that penalizes the splitting of regions. Hence the probability
associated with a particular partition is inversely proportional to both the number of regions
and the sum of the areas enclosed by the bounding boxes of the individual regions. Hence
the criterion or cost function that we want to minimize, C(S), for the segmentation S =
{s 1, s 2, · · · , s n}, is:n
nk . area(S) Y C(S) = n
∑
i=1
area(s i).
i=1C(s i),
where s idenotes the individuals regions, and k is a constant that controls the penalty for the
division of a page into n regions (computed empirically). The cost of the terminal symbols
is set to 1.
The goal of our system is to come up with a partition of the strokes that globally mini-
mizes the cost function. We de ne a stochastic context-free grammar (SCFG) to parse and
segment the document into a hierarchy of regions. Since the intermediate nodes in this tree
refer to regions of text or sketches, the nodes should carry additional information about the
nature and content of the region. Such a grammar, which incorporates attributes of nodes in
addition to their labels, is referred to as an attributed grammar . In our system, the attributes
include the bounding box of the region and the classi cation con dence of the region. Fig-
ure 4.8 shows the grammar used in this work for region segmentation. In addition to the
75
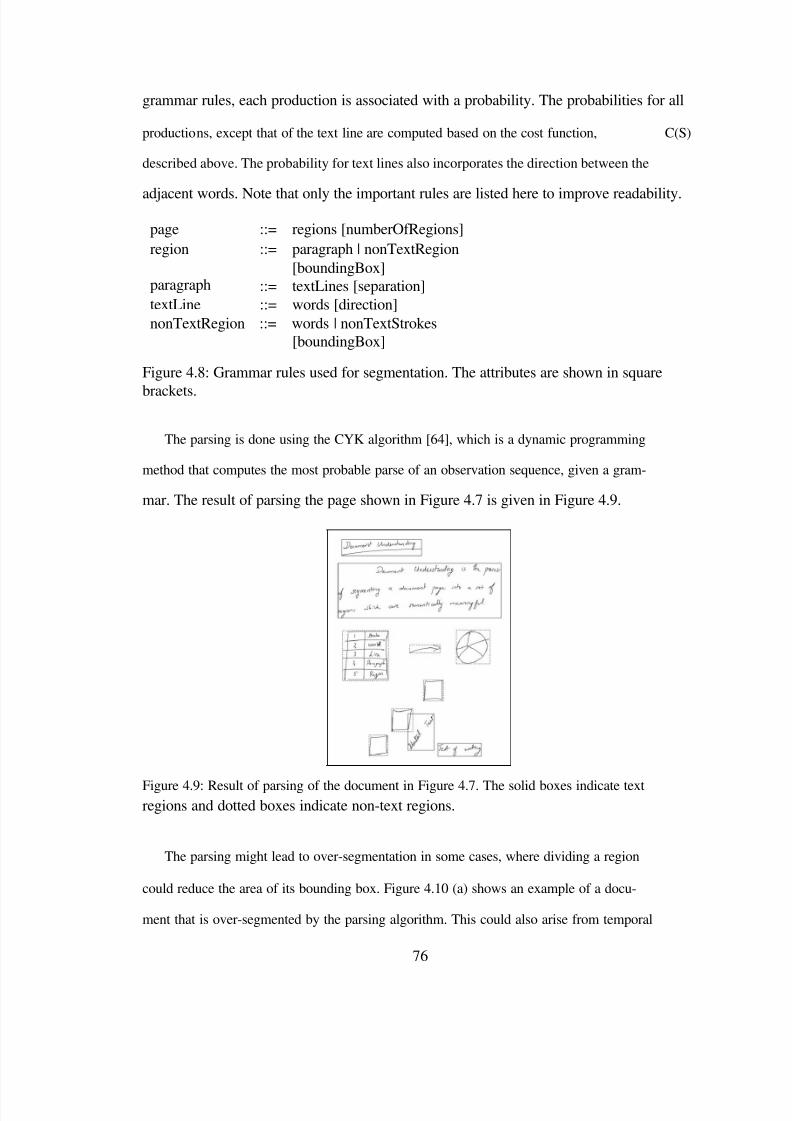
8/7/2019 Online HandWritten Document
http://slidepdf.com/reader/full/online-handwritten-document 100/191
grammar rules, each production is associated with a probability. The probabilities for all
productions, except that of the text line are computed based on the cost function, C(S)
described above. The probability for text lines also incorporates the direction between the
adjacent words. Note that only the important rules are listed here to improve readability.
pageregion
paragraphtextLine
::= regions [numberOfRegions]::= paragraph | nonTextRegion
[boundingBox]::= textLines [separation]::= words [direction]
nonTextRegion ::= words | nonTextStrokes[boundingBox]
Figure 4.8: Grammar rules used for segmentation. The attributes are shown in square
brackets.
The parsing is done using the CYK algorithm [64], which is a dynamic programming
method that computes the most probable parse of an observation sequence, given a gram-
mar. The result of parsing the page shown in Figure 4.7 is given in Figure 4.9.
Figure 4.9: Result of parsing of the document in Figure 4.7. The solid boxes indicate textregions and dotted boxes indicate non-text regions.
The parsing might lead to over-segmentation in some cases, where dividing a region
could reduce the area of its bounding box. Figure 4.10 (a) shows an example of a docu-
ment that is over-segmented by the parsing algorithm. This could also arise from temporal
76
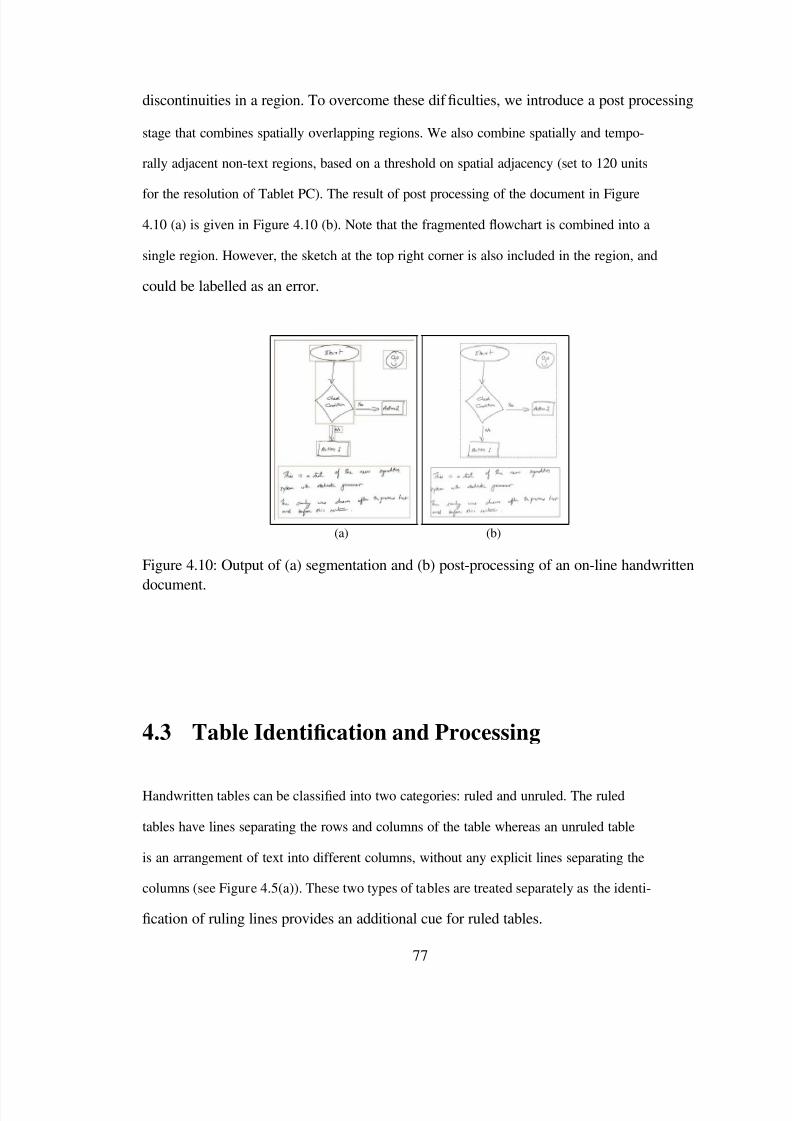
8/7/2019 Online HandWritten Document
http://slidepdf.com/reader/full/online-handwritten-document 101/191
discontinuities in a region. To overcome these dif culties, we introduce a post processing
stage that combines spatially overlapping regions. We also combine spatially and tempo-
rally adjacent non-text regions, based on a threshold on spatial adjacency (set to 120 units
for the resolution of Tablet PC). The result of post processing of the document in Figure
4.10 (a) is given in Figure 4.10 (b). Note that the fragmented owchart is combined into a
single region. However, the sketch at the top right corner is also included in the region, and
could be labelled as an error.
(a) (b)
Figure 4.10: Output of (a) segmentation and (b) post-processing of an on-line handwritten
document.
4.3 Table Identi cation and Processing
Handwritten tables can be classi ed into two categories: ruled and unruled. The ruled
tables have lines separating the rows and columns of the table whereas an unruled table
is an arrangement of text into different columns, without any explicit lines separating the
columns (see Figure 4.5(a)). These two types of tables are treated separately as the identi-
cation of ruling lines provides an additional cue for ruled tables.
77
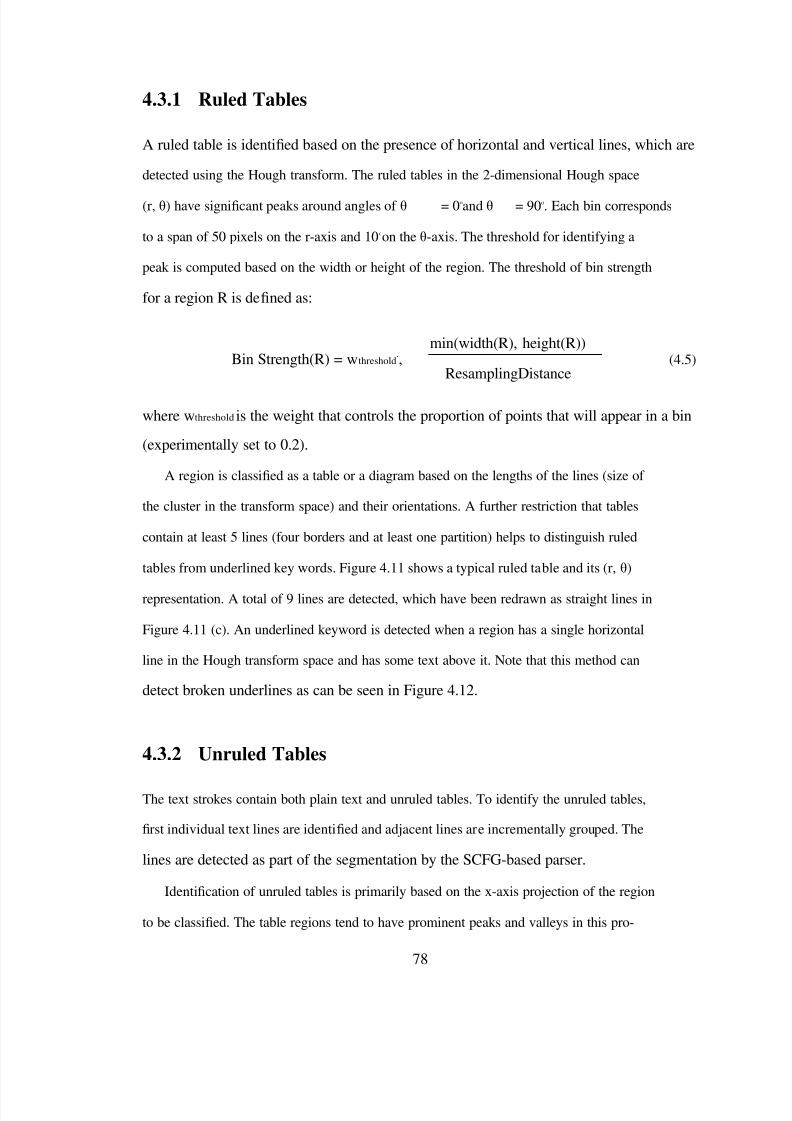
8/7/2019 Online HandWritten Document
http://slidepdf.com/reader/full/online-handwritten-document 102/191
4.3.1 Ruled Tables
A ruled table is identi ed based on the presence of horizontal and vertical lines, which are
detected using the Hough transform. The ruled tables in the 2-dimensional Hough space
(r, θ) have signi cant peaks around angles of θ = 0 oand θ = 90 o. Each bin corresponds
to a span of 50 pixels on the r-axis and 10 oon the θ-axis. The threshold for identifying a
peak is computed based on the width or height of the region. The threshold of bin strength
for a region R is de ned as:
min(width(R), height(R))Bin Strength(R) = w threshold
., (4.5)ResamplingDistance
where w threshold is the weight that controls the proportion of points that will appear in a bin
(experimentally set to 0.2).
A region is classi ed as a table or a diagram based on the lengths of the lines (size of
the cluster in the transform space) and their orientations. A further restriction that tables
contain at least 5 lines (four borders and at least one partition) helps to distinguish ruled
tables from underlined key words. Figure 4.11 shows a typical ruled table and its (r, θ)
representation. A total of 9 lines are detected, which have been redrawn as straight lines in
Figure 4.11 (c). An underlined keyword is detected when a region has a single horizontal
line in the Hough transform space and has some text above it. Note that this method can
detect broken underlines as can be seen in Figure 4.12.
4.3.2 Unruled Tables
The text strokes contain both plain text and unruled tables. To identify the unruled tables,
rst individual text lines are identi ed and adjacent lines are incrementally grouped. The
lines are detected as part of the segmentation by the SCFG-based parser.
Identi cation of unruled tables is primarily based on the x-axis projection of the region
to be classi ed. The table regions tend to have prominent peaks and valleys in this pro-
78
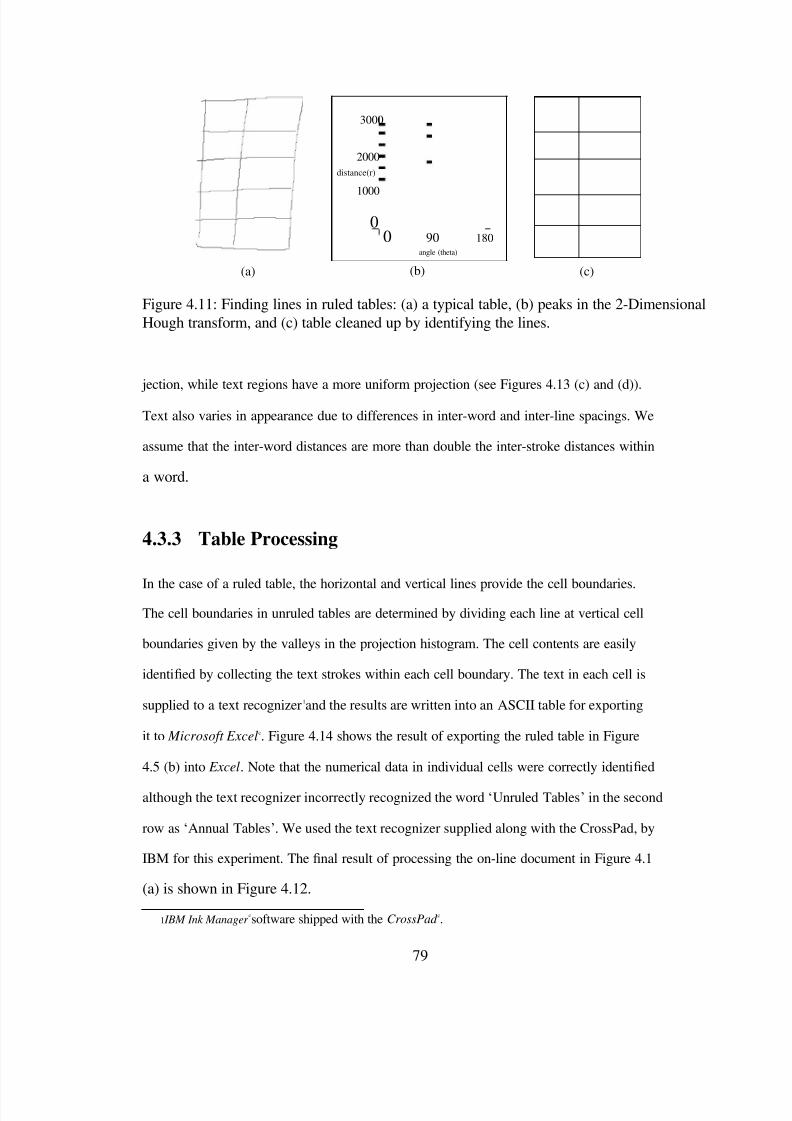
8/7/2019 Online HandWritten Document
http://slidepdf.com/reader/full/online-handwritten-document 103/191
(a)
3000
2000distance(r)
1000
00 90
angle (theta)
(b)
180
(c)
Figure 4.11: Finding lines in ruled tables: (a) a typical table, (b) peaks in the 2-DimensionalHough transform, and (c) table cleaned up by identifying the lines.
jection, while text regions have a more uniform projection (see Figures 4.13 (c) and (d)).
Text also varies in appearance due to differences in inter-word and inter-line spacings. We
assume that the inter-word distances are more than double the inter-stroke distances within
a word.
4.3.3 Table Processing
In the case of a ruled table, the horizontal and vertical lines provide the cell boundaries.The cell boundaries in unruled tables are determined by dividing each line at vertical cell
boundaries given by the valleys in the projection histogram. The cell contents are easily
identi ed by collecting the text strokes within each cell boundary. The text in each cell is
supplied to a text recognizer 1and the results are written into an ASCII table for exporting
it to Microsoft Excel c. Figure 4.14 shows the result of exporting the ruled table in Figure
4.5 (b) into Excel . Note that the numerical data in individual cells were correctly identi ed
although the text recognizer incorrectly recognized the word „Unruled Tables ‟in the second
row as „Annual Tables ‟. We used the text recognizer supplied along with the CrossPad, by
IBM for this experiment. The nal result of processing the on-line document in Figure 4.1
(a) is shown in Figure 4.12.
1IBM Ink Manager csoftware shipped with the CrossPad c.
79
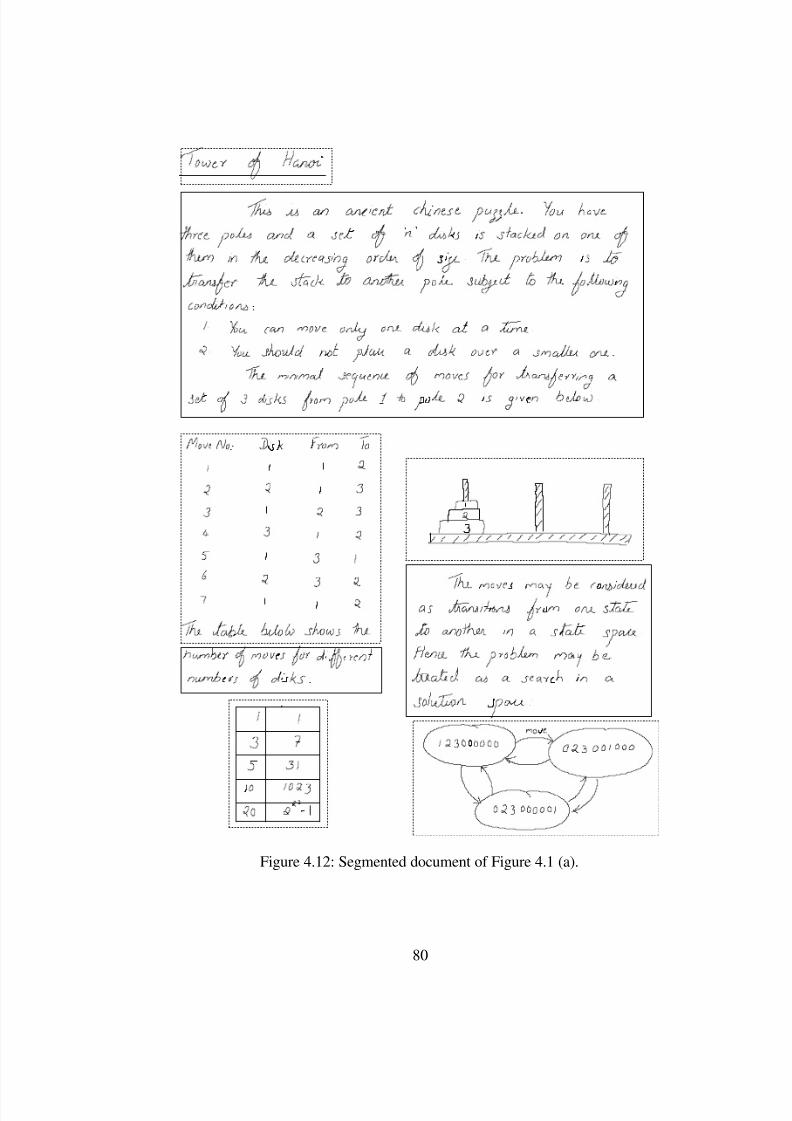
8/7/2019 Online HandWritten Document
http://slidepdf.com/reader/full/online-handwritten-document 104/191
8/7/2019 Online HandWritten Document
http://slidepdf.com/reader/full/online-handwritten-document 105/191
40
35
30
25
20
15
10
5
00 100 200
(a)
300 400 500
Tabl
e
600
90
80
70
60
50
40
30
20
10
00 100 200
(b)
300 400 500
Plain
Text
600x−axis / 4
(c)
x−axis / 4
(d)
Figure 4.13: Projections of (a) table and (b) text.
81
Number Of Pixels
Number Of Pixels
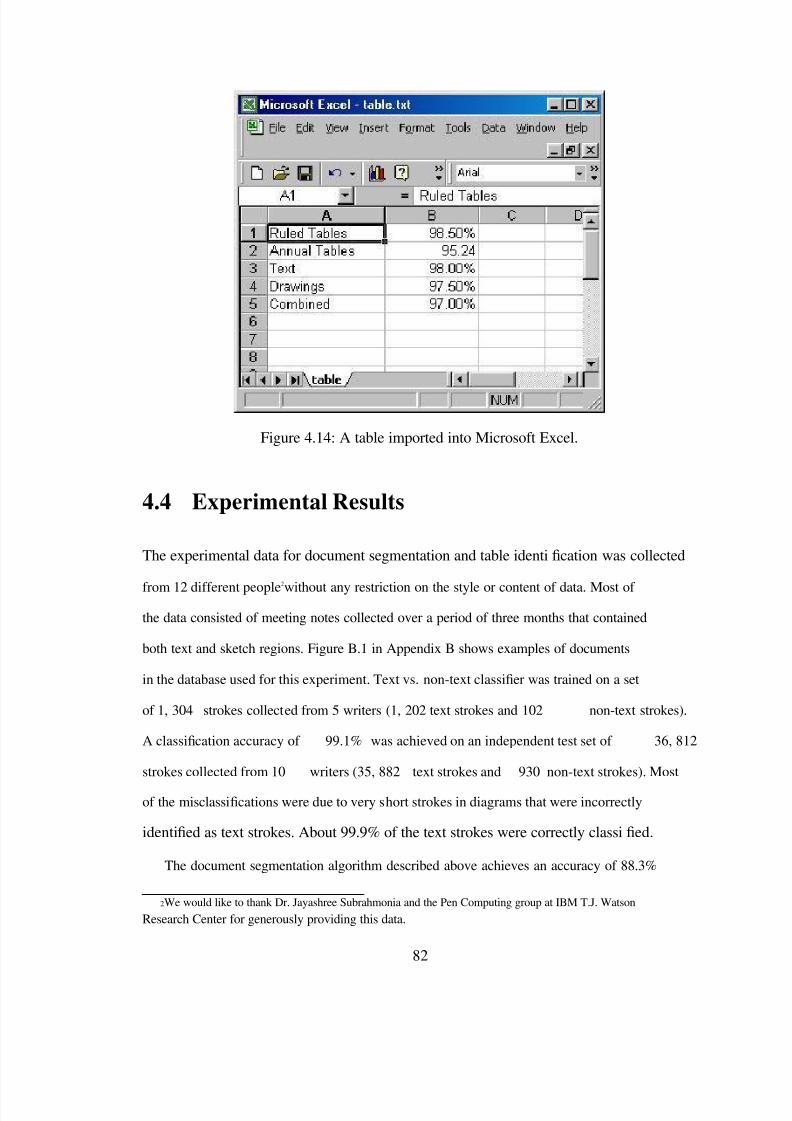
8/7/2019 Online HandWritten Document
http://slidepdf.com/reader/full/online-handwritten-document 106/191
Figure 4.14: A table imported into Microsoft Excel.
4.4 Experimental Results
The experimental data for document segmentation and table identi cation was collected
from 12 different people2
without any restriction on the style or content of data. Most of
the data consisted of meeting notes collected over a period of three months that contained
both text and sketch regions. Figure B.1 in Appendix B shows examples of documents
in the database used for this experiment. Text vs. non-text classi er was trained on a set
of 1, 304 strokes collected from 5 writers (1, 202 text strokes and 102 non-text strokes).
A classi cation accuracy of 99.1% was achieved on an independent test set of 36, 812
strokes collected from 10 writers (35, 882 text strokes and 930 non-text strokes). Most
of the misclassi cations were due to very short strokes in diagrams that were incorrectly
identi ed as text strokes. About 99.9% of the text strokes were correctly classi ed.
The document segmentation algorithm described above achieves an accuracy of 88.3%
2We would like to thank Dr. Jayashree Subrahmonia and the Pen Computing group at IBM T.J. Watson
Research Center for generously providing this data.
82
8/7/2019 Online HandWritten Document
http://slidepdf.com/reader/full/online-handwritten-document 107/191
on a data set of 40 documents containing a total of 154 regions. The accuracy refers to
the percentage of regions that was correctly identi ed. Each error corresponds to either
two separate regions that were merged or a single region that was split into two. The table
detection algorithm achieved a classi cation accuracy of 84.8% on a data set containing
105 ruled tables. The errors in table detection were primarily due to skewed lines and
the regions were classi ed as sketches. The unruled table detection algorithm is highly
sensitive to the alignment of text and it achieves a classi cation accuracy of only 60% on
a set of 30 regions containing text and unruled tables. Detection of unruled tables is an
extremely challenging problem and a projection-based approach is not very promising.
Figures 4.15 (a) - 4.15 (c) show examples of three on-line documents after the stroke
classi cation. The results of stroke classi cation is presented after making a hard decision
based on the probabilities computed as described before. Note that there ar e several clas-
sication errors such as detection of strokes of characters ‟T‟and ‟p‟as non-text and the
arrow heads in Figure 4.15 (a) being detected as text. These errors are primarily because of
the overlap of short text and non-text stokes in the feature space representation (see Figure
4.4). The results of segmentation and ruled table detection of these three documents are
shown in Figures 4.15 (d) - 4.15 (f). Note that all the regions and ruled tables are correctly
detected in spite of the errors in stroke classi cation. The grammar-based segmentation
algorithm is capable of tolerating many of the errors in stroke classi cation.
Figures 4.16 (a) - 4.16 (c) show examples of errors in segmentation of three on-line
documents. In Figure 4.16 (a), A owchart is divided into two segments due to the com-
pactness of the individual segments and the separation between them. Figure 4.16 (b)
shows an example, where three regions were merged together into a single region, due to
its spatial and temporal proximity. Figure 4.16 (c) shows the result of segmentation, where
a single region is divided into six smaller components due to the spatial separation of the
individual components.
Figures 4.17 (a) - 4.17 (c) show examples of three on-line documents with ruled tables
83
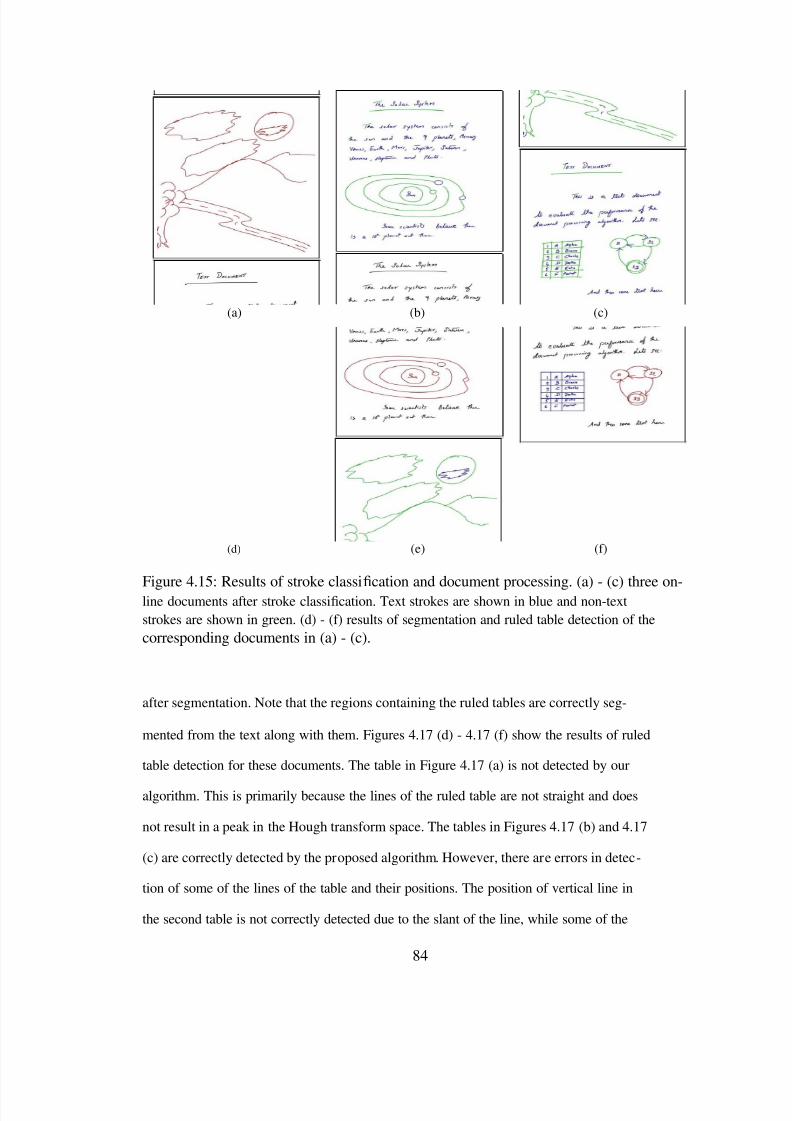
8/7/2019 Online HandWritten Document
http://slidepdf.com/reader/full/online-handwritten-document 108/191
(a)
(d)
(b)
(e)
(c)
(f)
Figure 4.15: Results of stroke classi cation and document processing. (a) - (c) three on-line documents after stroke classi cation. Text strokes are shown in blue and non-textstrokes are shown in green. (d) - (f) results of segmentation and ruled table detection of thecorresponding documents in (a) - (c).
after segmentation. Note that the regions containing the ruled tables are correctly seg-
mented from the text along with them. Figures 4.17 (d) - 4.17 (f) show the results of ruled
table detection for these documents. The table in Figure 4.17 (a) is not detected by our
algorithm. This is primarily because the lines of the ruled table are not straight and does
not result in a peak in the Hough transform space. The tables in Figures 4.17 (b) and 4.17
(c) are correctly detected by the proposed algorithm. However, there are errors in detec-
tion of some of the lines of the table and their positions. The position of vertical line in
the second table is not correctly detected due to the slant of the line, while some of the
84
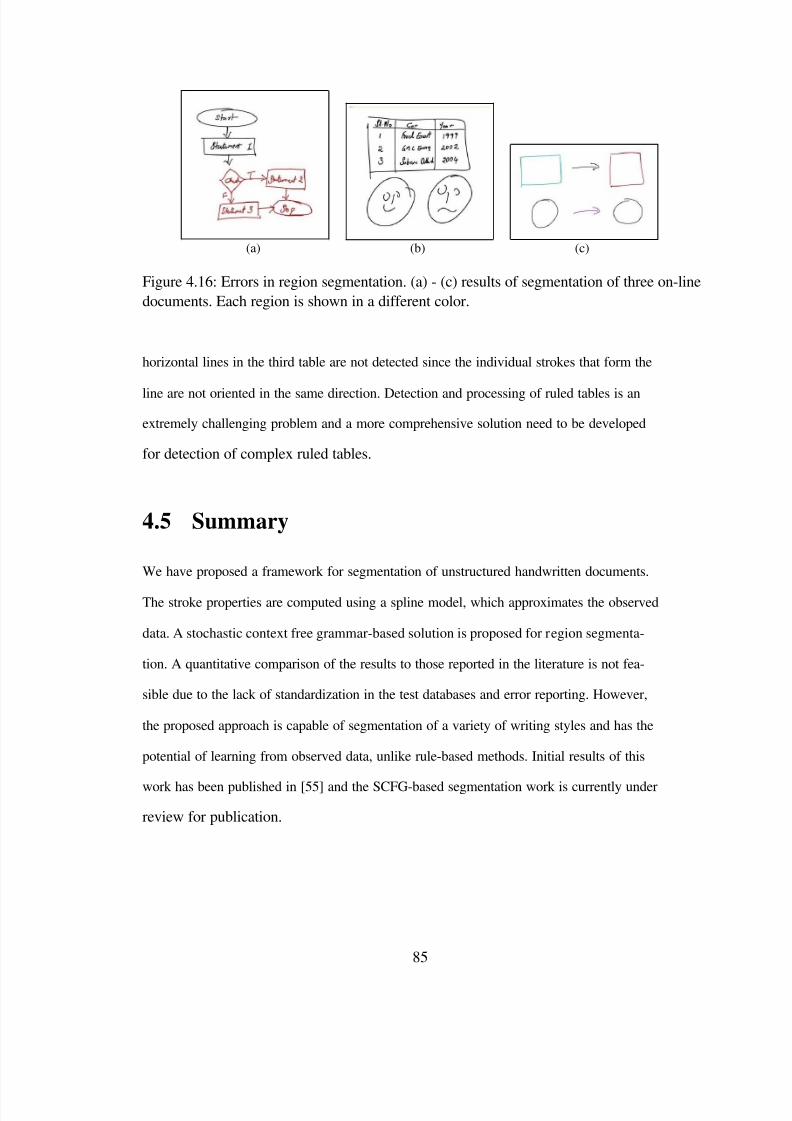
8/7/2019 Online HandWritten Document
http://slidepdf.com/reader/full/online-handwritten-document 109/191
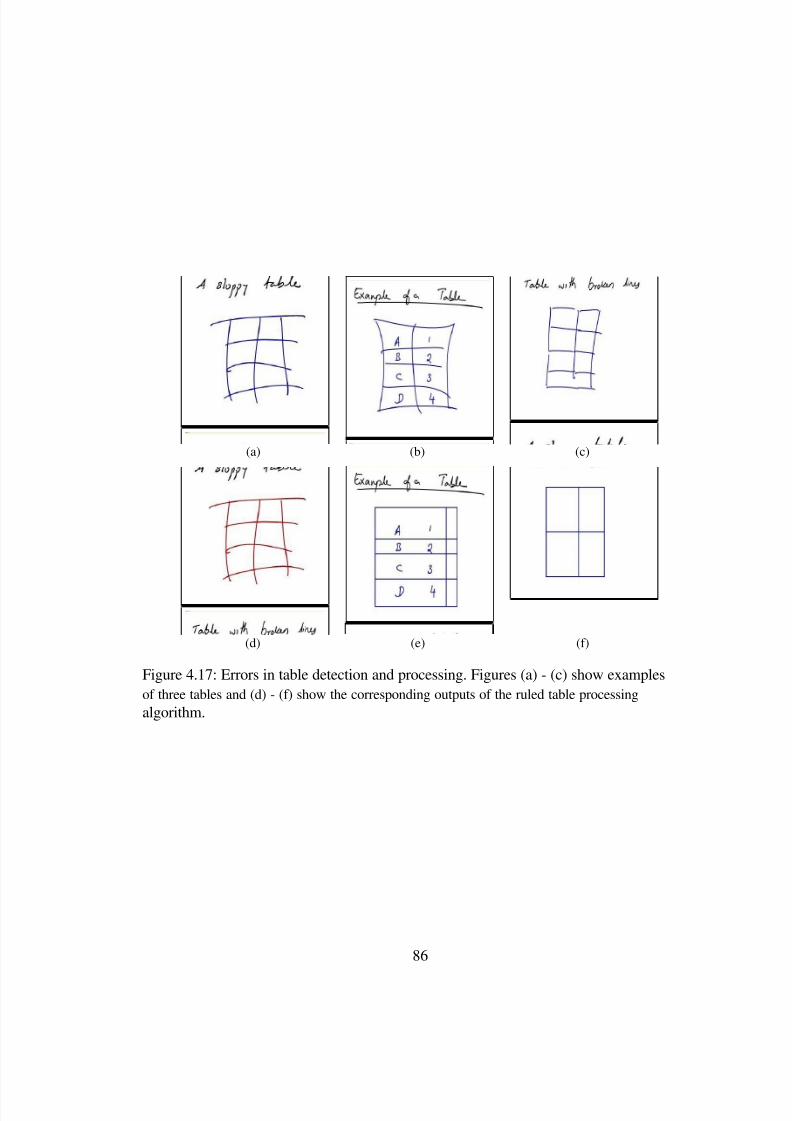
8/7/2019 Online HandWritten Document
http://slidepdf.com/reader/full/online-handwritten-document 110/191
8/7/2019 Online HandWritten Document
http://slidepdf.com/reader/full/online-handwritten-document 111/191
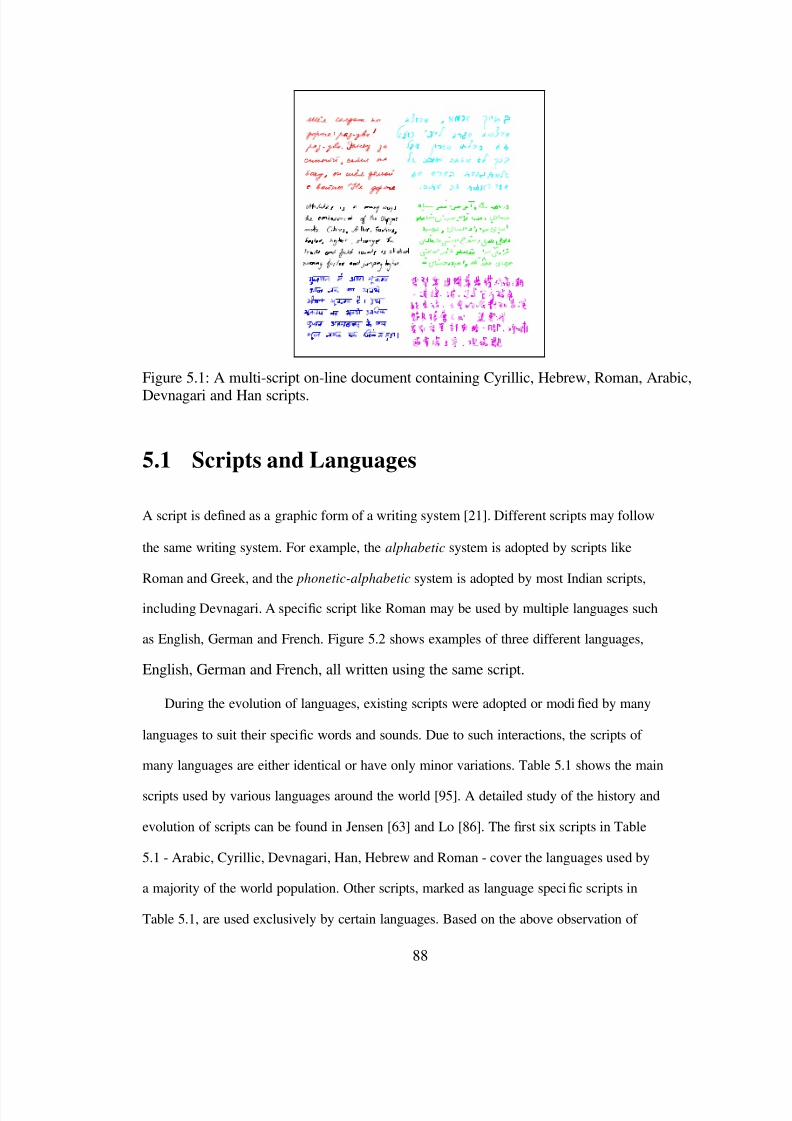
8/7/2019 Online HandWritten Document
http://slidepdf.com/reader/full/online-handwritten-document 112/191
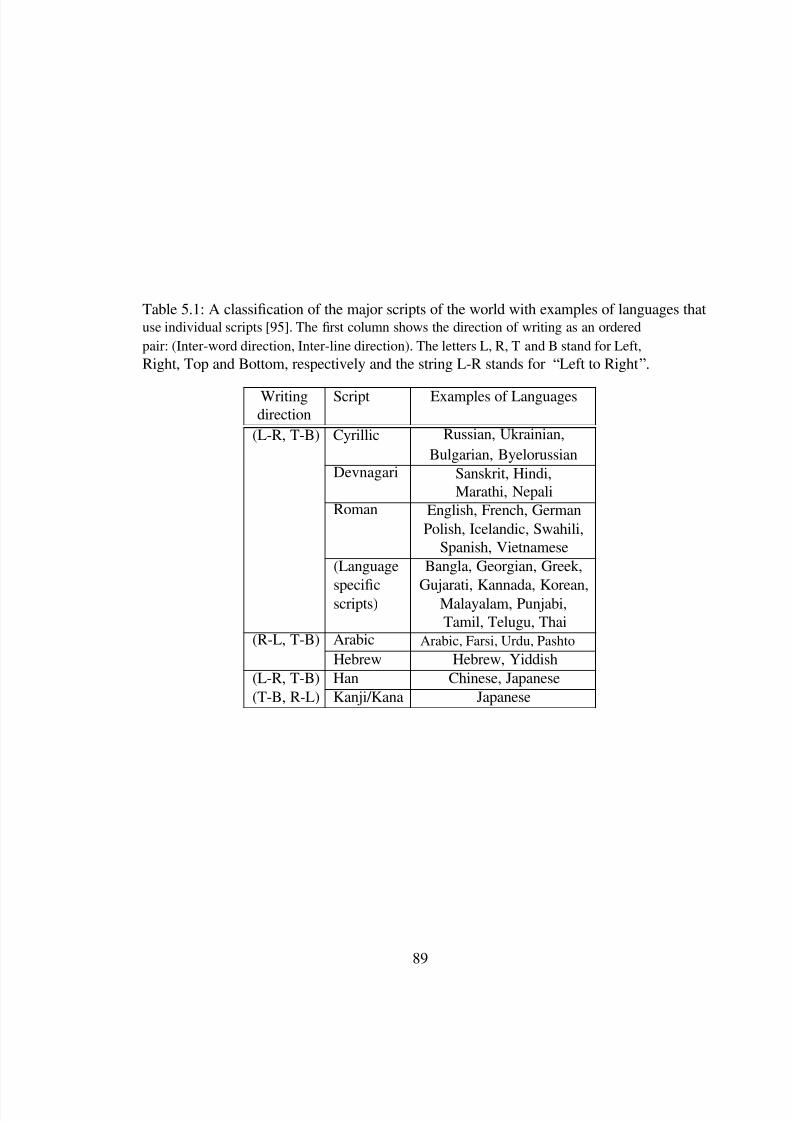
8/7/2019 Online HandWritten Document
http://slidepdf.com/reader/full/online-handwritten-document 113/191
Table 5.1: A classi cation of the major scripts of the world with examples of languages thatuse individual scripts [95]. The rst column shows the direction of writing as an orderedpair: (Inter-word direction, Inter-line direction). The letters L, R, T and B stand for Left,Right, Top and Bottom, respectively and the string L-R stands for “Left to Right ”.
Writing Scriptdirection
(L-R, T-B) Cyrillic
Devnagari
Roman
Examples of Languages
Russian, Ukrainian,Bulgarian, Byelorussian
Sanskrit, Hindi,Marathi, Nepali
English, French, GermanPolish, Icelandic, Swahili,
Spanish, Vietnamese(Language Bangla, Georgian, Greek,
speci cscripts)
(R-L, T-B) ArabicHebrew
(L-R, T-B) Han(T-B, R-L) Kanji/Kana
Gujarati, Kannada, Korean,Malayalam, Punjabi,Tamil, Telugu, Thai
Arabic, Farsi, Urdu, PashtoHebrew, Yiddish
Chinese, JapaneseJapanese
89

8/7/2019 Online HandWritten Document
http://slidepdf.com/reader/full/online-handwritten-document 114/191
(a)
(c)
(b)
Figure 5.2: Multiple languages using the same script. (a) English, (b) German, and (c)French, all use the same Roman script.
the relationship between languages and their scripts, the six most popular scripts, Arabic,
Cyrillic, Devnagari, Han, Hebrew and Roman, were chosen for our on-line classi cation
study (see Figure 5.1). The general class of Han-based scripts include Chinese, Japanese
and Korean. Japanese and Korean languages augment the main script with their own set
of characters (Kana and Han-Gul). In this work, we have used only Chinese characters
and hence we use the term Han Script to refer to the Chinese character set. This includes
both the traditional and simpli ed Chinese character sets. Devnagari script is used by
many Indian languages, including Hindi, Sanskrit, Marathi and Rajasthani. Arabic script is
used by Arabic, Farsi, Urdu, etc. Roman script is used by many European languages like
English, German, French and Italian. We attempt to solve the problem of script recognition,
where either an entire document or a part of a document (upto word level) is classi ed
into one of the six scripts mentioned above with the aim of facilitating text recognition.
The problem of identifying the actual language often involves recognizing the text and
identifying speci c words or sequences of characters, which is beyond the scope of this
paper.
90
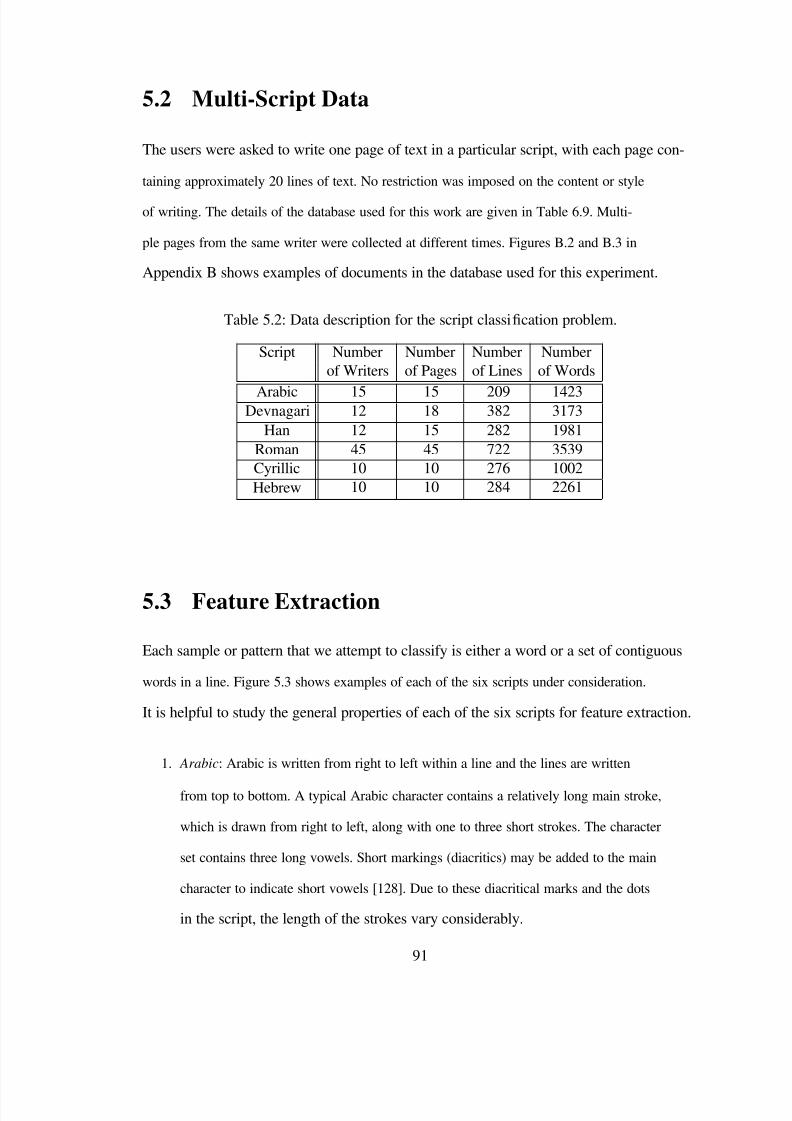
8/7/2019 Online HandWritten Document
http://slidepdf.com/reader/full/online-handwritten-document 115/191
5.2 Multi-Script Data
The users were asked to write one page of text in a particular script, with each page con-
taining approximately 20 lines of text. No restriction was imposed on the content or style
of writing. The details of the database used for this work are given in Table 6.9. Multi-
ple pages from the same writer were collected at different times. Figures B.2 and B.3 in
Appendix B shows examples of documents in the database used for this experiment.
Table 5.2: Data description for the script classi cation problem.
Script Number Number Number Numberof Writers of Pages of Lines of Words
ArabicDevnagari
HanRomanCyrillicHebrew
151212451010
151815451010
209382282722276284
142331731981353910022261
5.3 Feature Extraction
Each sample or pattern that we attempt to classify is either a word or a set of contiguous
words in a line. Figure 5.3 shows examples of each of the six scripts under consideration.
It is helpful to study the general properties of each of the six scripts for feature extraction.
1. Arabic : Arabic is written from right to left within a line and the lines are written
from top to bottom. A typical Arabic character contains a relatively long main stroke,
which is drawn from right to left, along with one to three short strokes. The character
set contains three long vowels. Short markings (diacritics) may be added to the main
character to indicate short vowels [128]. Due to these diacritical marks and the dots
in the script, the length of the strokes vary considerably.
91
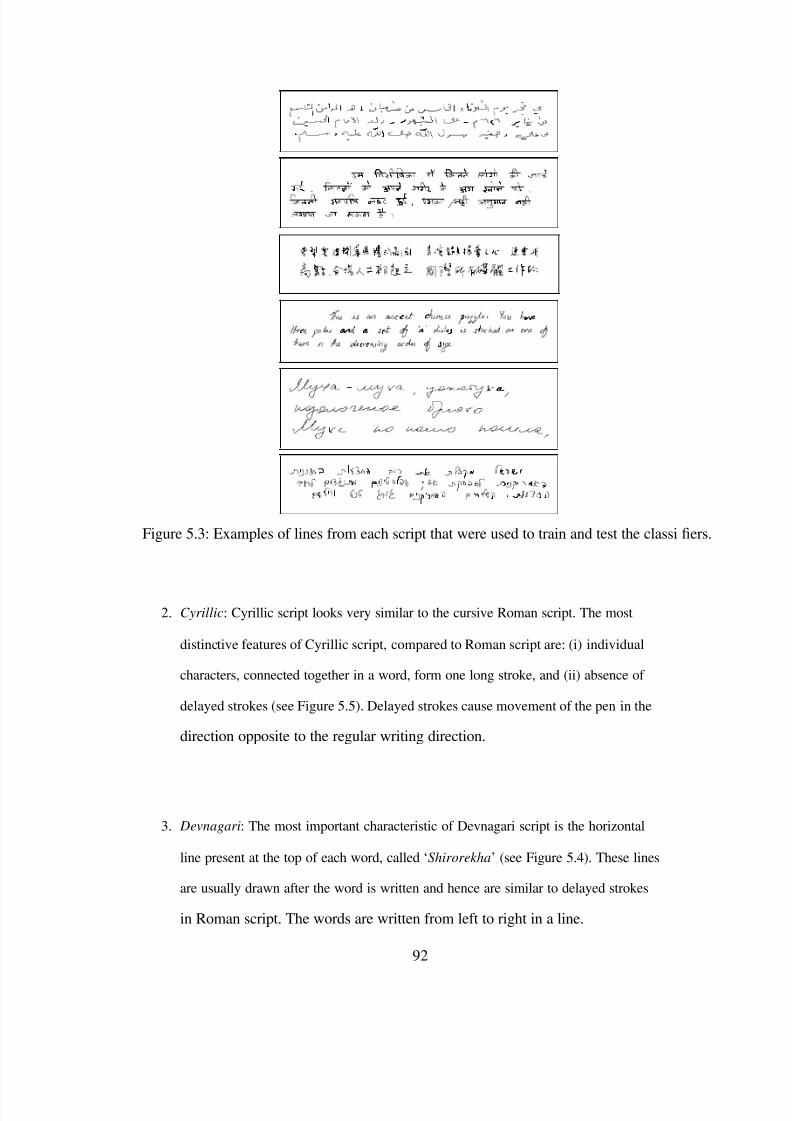
8/7/2019 Online HandWritten Document
http://slidepdf.com/reader/full/online-handwritten-document 116/191
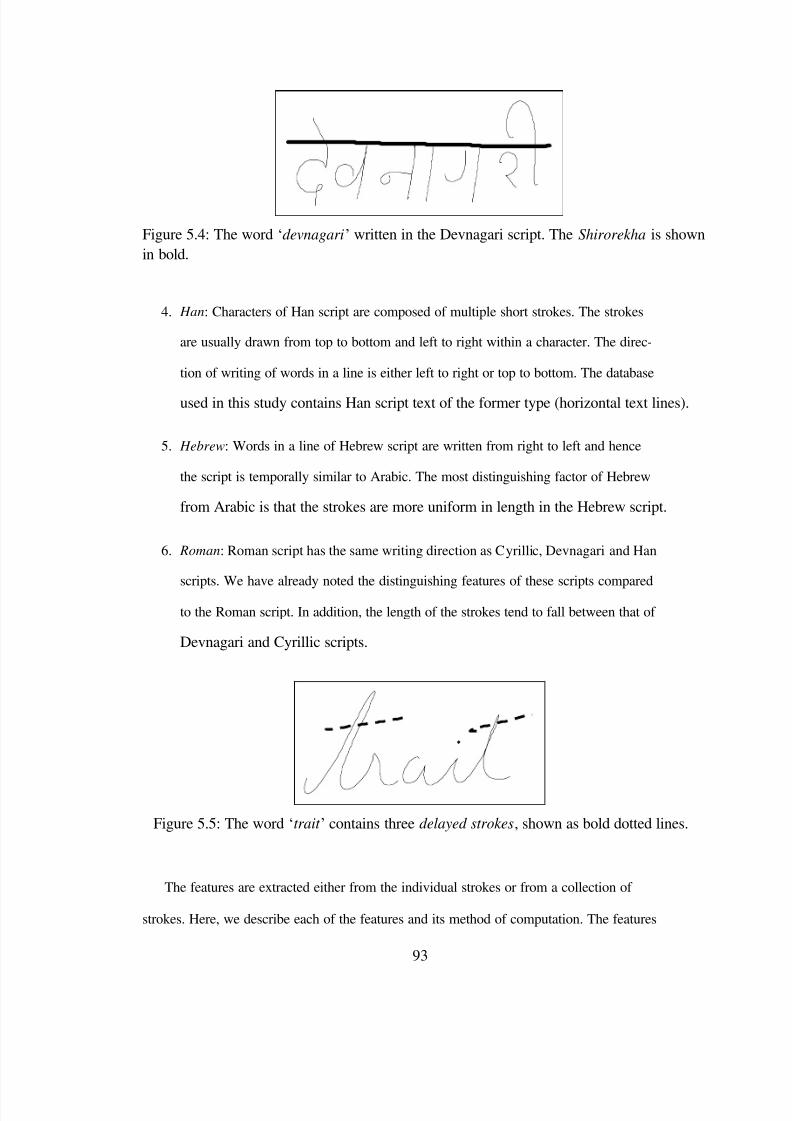
8/7/2019 Online HandWritten Document
http://slidepdf.com/reader/full/online-handwritten-document 117/191
Figure 5.4: The word „devnagari ‟written in the Devnagari script. The Shirorekha is shownin bold.
4. Han : Characters of Han script are composed of multiple short strokes. The strokes
are usually drawn from top to bottom and left to right within a character. The direc-
tion of writing of words in a line is either left to right or top to bottom. The database
used in this study contains Han script text of the former type (horizontal text lines).
5. Hebrew : Words in a line of Hebrew script are written from right to left and hence
the script is temporally similar to Arabic. The most distinguishing factor of Hebrew
from Arabic is that the strokes are more uniform in length in the Hebrew script.
6. Roman : Roman script has the same writing direction as Cyrillic, Devnagari and Han
scripts. We have already noted the distinguishing features of these scripts compared
to the Roman script. In addition, the length of the strokes tend to fall between that of
Devnagari and Cyrillic scripts.
Figure 5.5: The word „trait ‟contains three delayed strokes , shown as bold dotted lines.
The features are extracted either from the individual strokes or from a collection of
strokes. Here, we describe each of the features and its method of computation. The features
93
8/7/2019 Online HandWritten Document
http://slidepdf.com/reader/full/online-handwritten-document 118/191
are presented in the order of their saliency in the nal classi er (as determined by the feature
selection algorithm described in Section 5.5).
1. Horizontal Inter-stroke Direction (HID) : This is the sum of the horizontal directions
between the starting points of consecutive strokes in the pattern. The feature essen-
tially captures the writing direction within a line.
n−r∑
HID =i=1
dir(i, i + r), (5.1)
dir(i, j) = +1 if X start (stroke i) < X start (stroke j)
−1, otherwise,(5.2)
where X start(.) denotes the x coordinate of the pen-down position of the stroke, n is
the number of strokes in the pattern and r is set to 3 to reduce errors due to abrupt
changes in direction between successive strokes. The value of HID falls in the range
[r − n, n − r].
2. Average Stroke Length (ASL) : The computation of the stroke length for an individual
stroke is described in Chapter 3. The Average Stroke Length is de ned as the average
length of the individual strokes in the pattern.
n
ASL = 1n
∑
i=1
length(stroke i), (5.3)
where n is the number of strokes in the pattern. The value of ASL is a real number
that falls in the range (0.0, R 0], where the value of R 0depends on the resampling
distance used during pre-processing (R = 600 in our experiments).
3. Shirorekha Strength : This feature measures the strength of the horizontal line compo-
nent in the pattern using the Hough transform. The value of this feature is computed
94
8/7/2019 Online HandWritten Document
http://slidepdf.com/reader/full/online-handwritten-document 119/191
as:
ShirorekhaStrength =
∑
∀ r,−10<θ<10
∑
H(r, θ)
, (5.4)
∀ r,θ H(r, θ)
where H(r, θ) denotes the number of votes in the (r, θ)thbin in the two-dimensional
Hough transform space. The numerator is the sum of the bins corresponding to line
orientations between −10 ◦and10 ◦ and the denominator is the sum of all the bins in
the Hough transform space. Note that it is dif cult to constrain the values of r in the
transform space due to variations introduced by sampling and the handwriting itself.
The value of Shirorekha Strength is a real number that falls in the range [0.0, 1.0].
4. Shirorekha Con dence : We compute a con dence measure for a stroke being a Shi-
rorekha (see Figure 5.4). Each stroke in the pattern is inspected for three different
properties of a Shirorekha; Shirorekhas span the width of a word, always occur at
the top of the word and are horizontal. Hence the con dence (C) of a stroke (s) is
computed as:
C(s) = width(s)width(pattern)
∗ Y¯ (s)height(pattern)
∗ (
1 − height(s)width(s)
, (5.5)
where width(s) refers to the length along the x-axis (horizontal), height(s) is
the length of a stroke along the y-axis (vertical), and ¯ (s) is the average of the
y-coordinates of the stroke points. Note that 0 ≤ C(s) ≤ 1 for strokes with
height < width. For vertical strokes, the value of C(s) will be negative. To avoid
abnormal scaling of the values of this feature, C(s) was set to zero, if its computed
value is negative. For an n-stroke pattern, the Shirorekha Con dence is computed as
the maximum value for C among all its component strokes.
5. Stroke Density : This is the number of strokes per unit length (x-axis) of the pattern.
Note that the Han script is written using short strokes, while Roman and Cyrillic are
95
8/7/2019 Online HandWritten Document
http://slidepdf.com/reader/full/online-handwritten-document 120/191
written using longer strokes.
Stroke Density =n
width(pattern), (5.6)
where n is the number of strokes in the pattern. The value of Stroke Density is a real
number and can vary within the range (0.0, R 1) where R 1is a positive real number.
In practice, the value of R 1was observed to be 0.5.
6. Aspect Ratio : This is the ratio of the width to the height of a pattern.
width(pattern)AspectRatio(pattern) = . (5.7)
height(pattern)
The value of Aspect Ratio is a real number and can vary within the range (0.0, R 2),
where R 2is a positive number. In practice, the value of R 2was observed to be 5.0.
Note that this feature is more meaningful for word-level classi cation than for the
classi cation of a complete line.
7. Reverse Distance : This is the distance by which the pen moves in the direction op-
posite to the normal writing direction. The normal writing direction is different for
different scripts as we noted at the beginning of this section. The value of Reverse
Distance is a non-negative integer and its observed values are in the range [0, 1200].
8. Average Horizontal Stroke Direction : Horizontal Stroke Direction (HD) of a stroke,
s, can be understood as the horizontal direction from the start of the stroke to its end.
Formally, we de ne HD(s) as:
+1 if X pen−down
(s) < X pen−up(s)
HD(s) = (5.8) −1, otherwise,
96
8/7/2019 Online HandWritten Document
http://slidepdf.com/reader/full/online-handwritten-document 121/191
where X pen−down (.) and X pen−up(.) are the x-coordinates of the pen-down and pen-
up positions, respectively. For an n-stroke pattern, the Average Horizontal Stroke
Direction is computed as the average of the HD values of its component strokes.
The value of Average Horizontal Stroke Direction falls in the range [ −1.0, 1.0].
9. Average Vertical Stroke Direction : It is de ned similar to the Average Horizontal
Stroke Direction. The Vertical Direction (V D) of a single stroke s is de ned as:
+1 if Y pen−down
(s) < Y pen−up(s)
V D(s) = (5.9) −1, otherwise,
where Y pen−down(.) and Y pen−up
(.) are the y-coordinates of the pen-down and pen-up
positions, respectively. For an n-stroke pattern, the Average Vertical Stroke Direction
is computed as the average of the V D values of its component strokes. The value of
Average Vertical Stroke Direction falls in the range [ −1.0, 1.0].
10. Vertical Inter-stroke Direction (VID) : The Vertical Inter-stroke Direction is de ned
as:n−1∑
V ID = dir(i, i + 1), (5.10)i=1
where +1 if ̄ (stroke i) < ¯ (stroke j)
dir(i, j) = (5.11) −1, otherwise.
Y¯ (s) is the average of the y-coordinates of the stroke points and n is the number of
strokes in the pattern. The value of VID is an integer and falls in the range (1 −n, n − 1).
11. Variance of Stroke Length : This is the variance of the length of the individual strokes
within a pattern. The value of Variance of Stroke Length is a non-negative integer
and its observed value is between 0 and 250, 000 in our experiments.
97
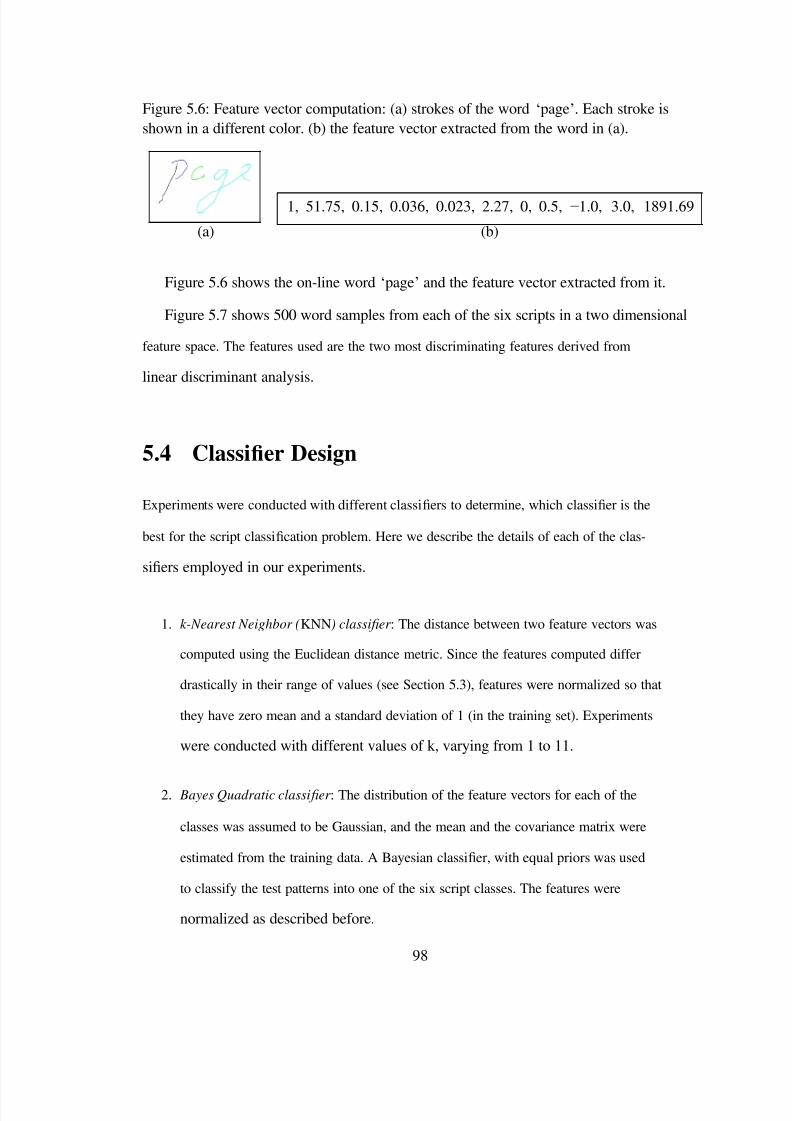
8/7/2019 Online HandWritten Document
http://slidepdf.com/reader/full/online-handwritten-document 122/191
Figure 5.6: Feature vector computation: (a) strokes of the word „page ‟. Each stroke isshown in a different color. (b) the feature vector extracted from the word in (a).
1, 51.75, 0.15, 0.036, 0.023, 2.27, 0, 0.5, −1.0, 3.0, 1891.69
(a) (b)
Figure 5.6 shows the on-line word „page ‟and the feature vector extracted from it.
Figure 5.7 shows 500 word samples from each of the six scripts in a two dimensional
feature space. The features used are the two most discriminating features derived from
linear discriminant analysis.
5.4 Classi er Design
Experiments were conducted with different classi ers to determine, which classi er is the
best for the script classi cation problem. Here we describe the details of each of the clas-
siers employed in our experiments.
1. k-Nearest Neighbor ( KNN ) classi er : The distance between two feature vectors was
computed using the Euclidean distance metric. Since the features computed differ
drastically in their range of values (see Section 5.3), features were normalized so that
they have zero mean and a standard deviation of 1 (in the training set). Experiments
were conducted with different values of k, varying from 1 to 11.
2. Bayes Quadratic classi er : The distribution of the feature vectors for each of the
classes was assumed to be Gaussian, and the mean and the covariance matrix were
estimated from the training data. A Bayesian classi er, with equal priors was used
to classify the test patterns into one of the six script classes. The features were
normalized as described before.
98
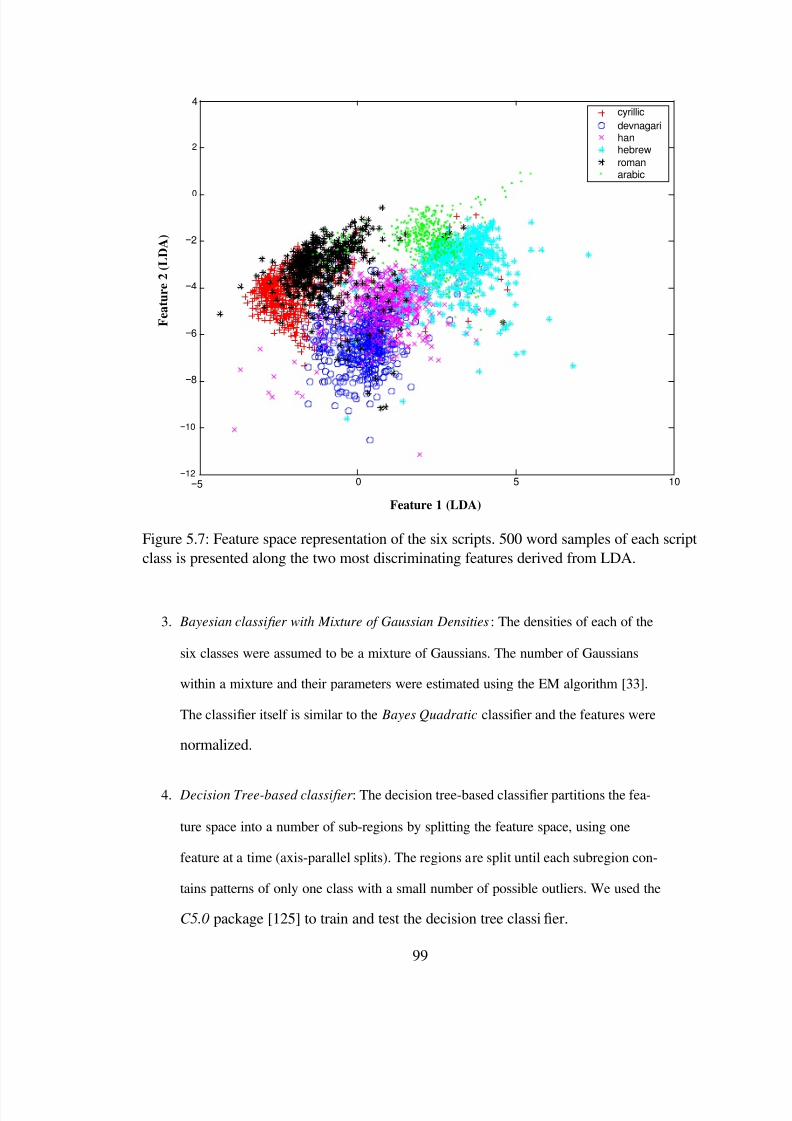
8/7/2019 Online HandWritten Document
http://slidepdf.com/reader/full/online-handwritten-document 123/191
4
2
0
−2
−4
−6
−8
−10
−12−5 0
Feature 1 (LDA)
5
cyrillicdevnagarihanhebrewromanarabic
10
Figure 5.7: Feature space representation of the six scripts. 500 word samples of each scriptclass is presented along the two most discriminating features derived from LDA.
3. Bayesian classi er with Mixture of Gaussian Densities : The densities of each of the
six classes were assumed to be a mixture of Gaussians. The number of Gaussians
within a mixture and their parameters were estimated using the EM algorithm [33].
The classi er itself is similar to the Bayes Quadratic classi er and the features were
normalized.
4. Decision Tree-based classi er : The decision tree-based classi er partitions the fea-
ture space into a number of sub-regions by splitting the feature space, using one
feature at a time (axis-parallel splits). The regions are split until each subregion con-
tains patterns of only one class with a small number of possible outliers. We used the
C5.0 package [125] to train and test the decision tree classi er.
99
Feature 2 (LDA)

8/7/2019 Online HandWritten Document
http://slidepdf.com/reader/full/online-handwritten-document 124/191
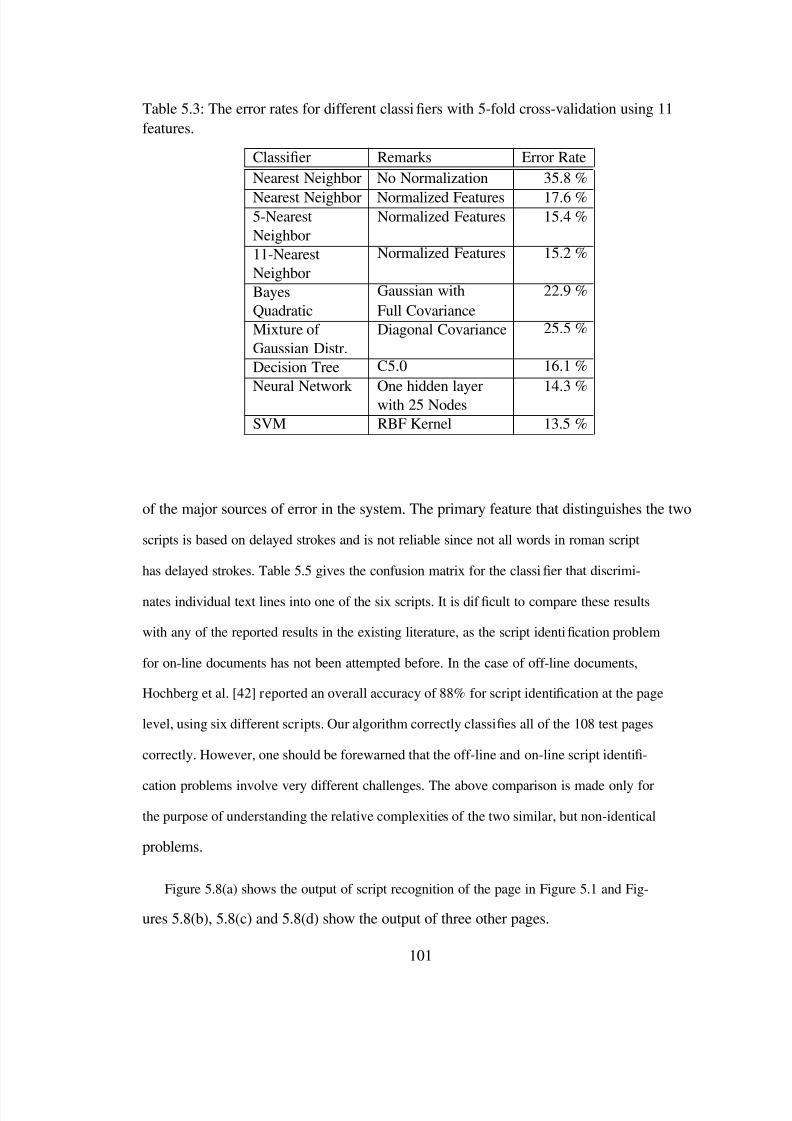
8/7/2019 Online HandWritten Document
http://slidepdf.com/reader/full/online-handwritten-document 125/191
Table 5.3: The error rates for different classi ers with 5-fold cross-validation using 11features.
Classi er Remarks Error RateNearest Neighbor No Normalization
Nearest Neighbor Normalized Features
35.8 %
17.6 %5-NearestNeighbor11-NearestNeighborBayesQuadraticMixture of Gaussian Distr.Decision Tree
Normalized Features
Normalized Features
Gaussian withFull CovarianceDiagonal Covariance
C5.0
15.4 %
15.2 %
22.9 %
25.5 %
16.1 %
Neural Network One hidden layerwith 25 Nodes 14.3 %
SVM RBF Kernel 13.5 %
of the major sources of error in the system. The primary feature that distinguishes the two
scripts is based on delayed strokes and is not reliable since not all words in roman script
has delayed strokes. Table 5.5 gives the confusion matrix for the classi er that discrimi-
nates individual text lines into one of the six scripts. It is dif cult to compare these results
with any of the reported results in the existing literature, as the script identi cation problem
for on-line documents has not been attempted before. In the case of off-line documents,
Hochberg et al. [42] reported an overall accuracy of 88% for script identi cation at the page
level, using six different scripts. Our algorithm correctly classi es all of the 108 test pages
correctly. However, one should be forewarned that the off-line and on-line script identi -
cation problems involve very different challenges. The above comparison is made only for
the purpose of understanding the relative complexities of the two similar, but non-identical
problems.
Figure 5.8(a) shows the output of script recognition of the page in Figure 5.1 and Fig-
ures 5.8(b), 5.8(c) and 5.8(d) show the output of three other pages.
101
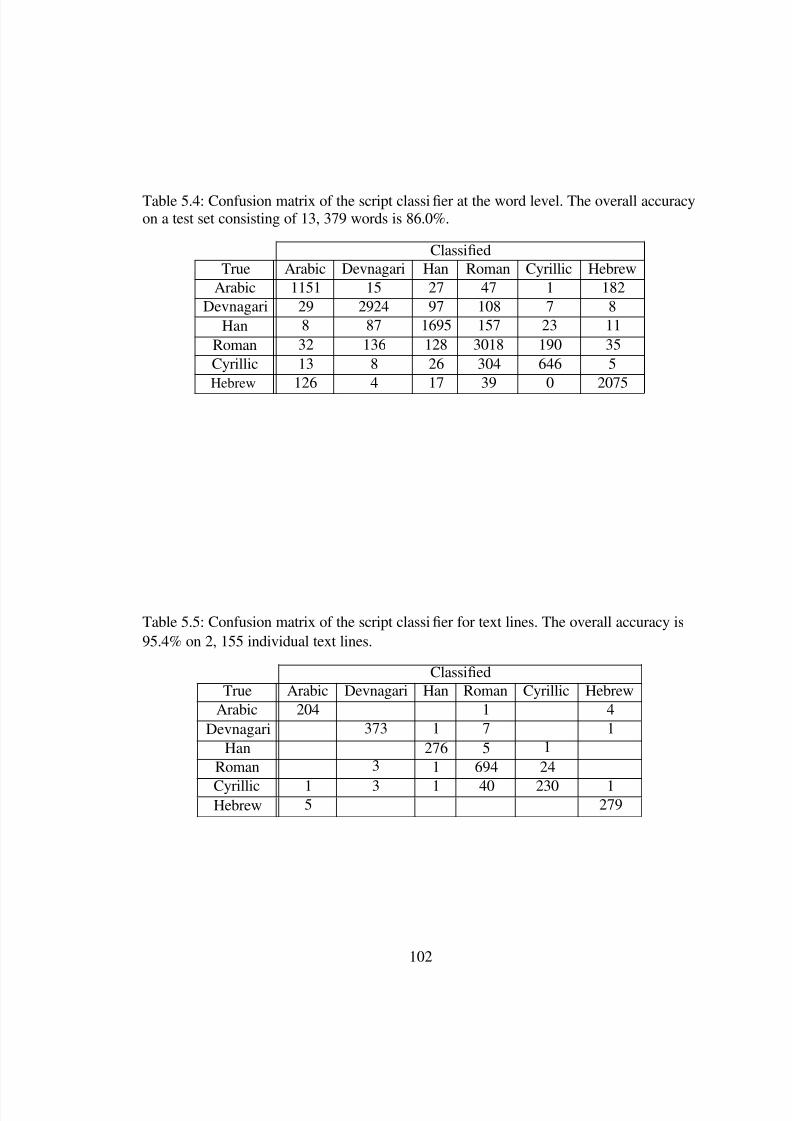
8/7/2019 Online HandWritten Document
http://slidepdf.com/reader/full/online-handwritten-document 126/191
Table 5.4: Confusion matrix of the script classi er at the word level. The overall accuracyon a test set consisting of 13, 379 words is 86.0%.
Classi edTrue Arabic Devnagari Han Roman Cyrillic Hebrew
ArabicDevnagari
115129
152924
2797
47108
17
1828
HanRoman
832
87136
1695 157128 3018
23190
1135
CyrillicHebrew
13126
84
2617
30439
6460
52075
Table 5.5: Confusion matrix of the script classi er for text lines. The overall accuracy is95.4% on 2, 155 individual text lines.
Classi edTrue Arabic Devnagari Han Roman Cyrillic Hebrew
Arabic 204 1 4Devnagari
HanRoman
373
3
1276
1
75
694124
1
CyrillicHebrew
15
3 1
102
40 230 1279
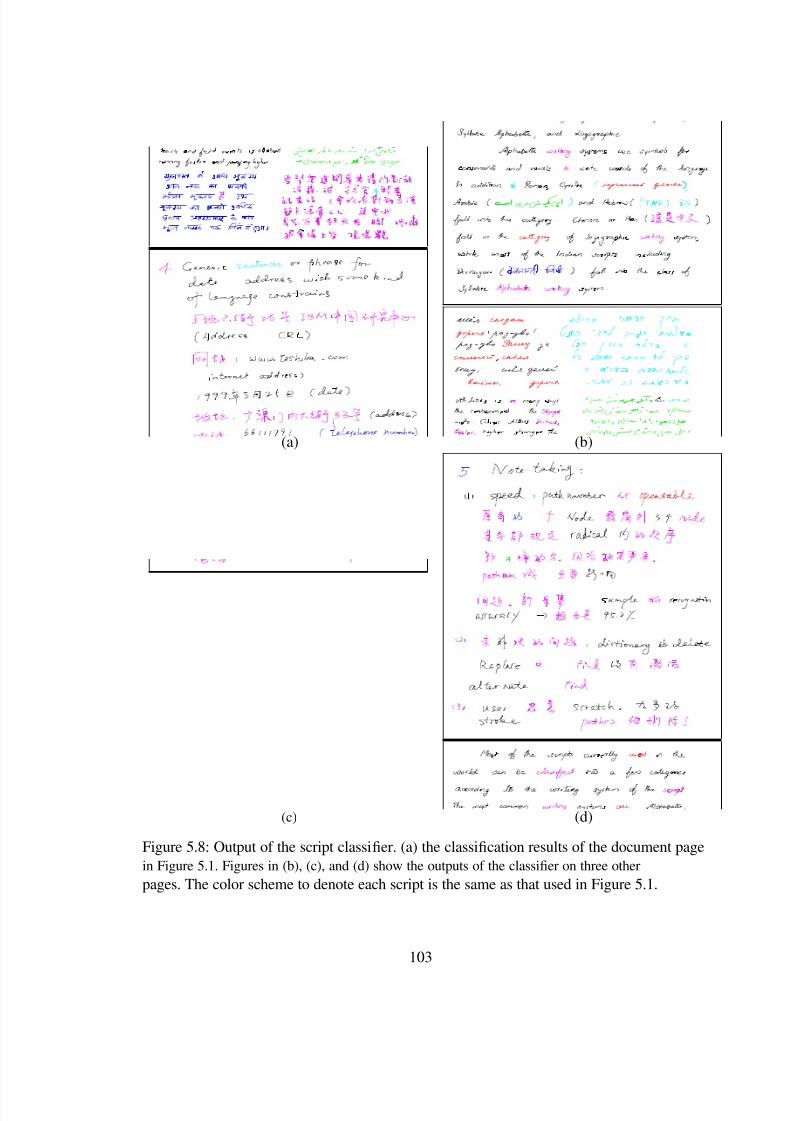
8/7/2019 Online HandWritten Document
http://slidepdf.com/reader/full/online-handwritten-document 127/191
(a)
(c)
(b)
(d)
Figure 5.8: Output of the script classi er. (a) the classi cation results of the document pagein Figure 5.1. Figures in (b), (c), and (d) show the outputs of the classi er on three otherpages. The color scheme to denote each script is the same as that used in Figure 5.1.
103
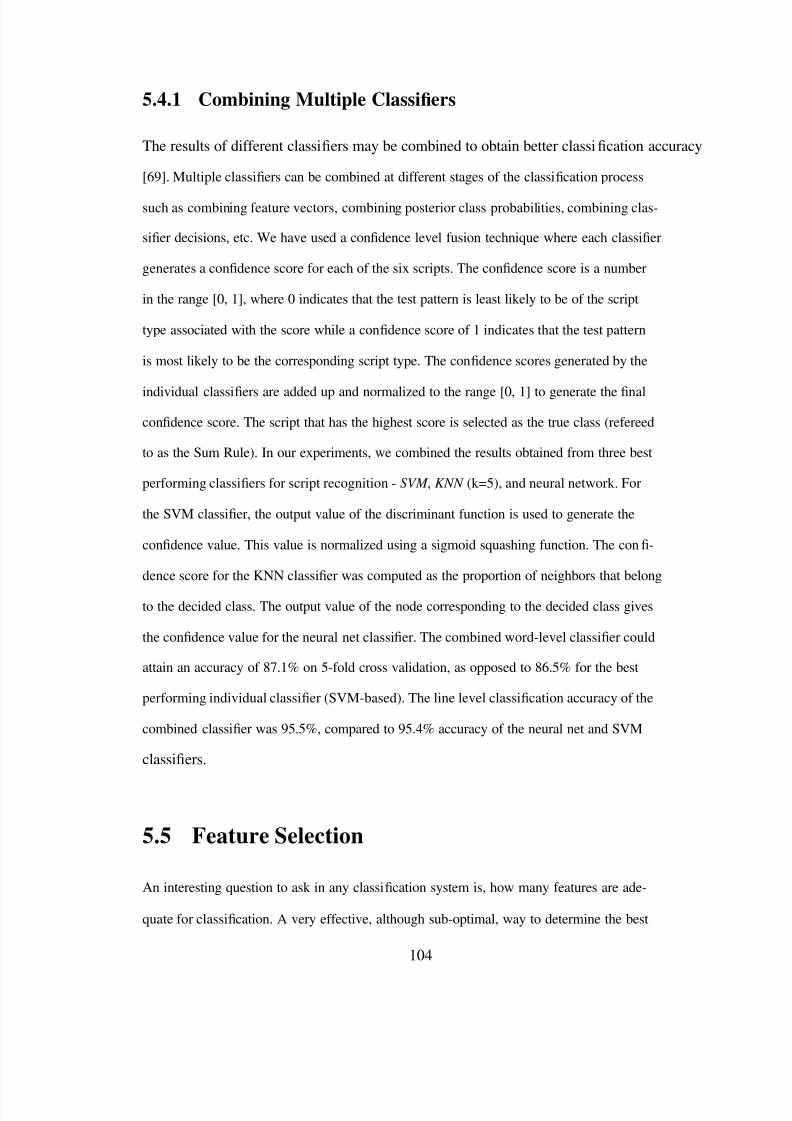
8/7/2019 Online HandWritten Document
http://slidepdf.com/reader/full/online-handwritten-document 128/191
5.4.1 Combining Multiple Classi ers
The results of different classi ers may be combined to obtain better classi cation accuracy
[69]. Multiple classi ers can be combined at different stages of the classi cation process
such as combining feature vectors, combining posterior class probabilities, combining clas-
sier decisions, etc. We have used a con dence level fusion technique where each classi er
generates a con dence score for each of the six scripts. The con dence score is a number
in the range [0, 1], where 0 indicates that the test pattern is least likely to be of the script
type associated with the score while a con dence score of 1 indicates that the test pattern
is most likely to be the corresponding script type. The con dence scores generated by the
individual classi ers are added up and normalized to the range [0, 1] to generate the nal
condence score. The script that has the highest score is selected as the true class (refereed
to as the Sum Rule). In our experiments, we combined the results obtained from three best
performing classi ers for script recognition - SVM , KNN (k=5), and neural network. For
the SVM classi er, the output value of the discriminant function is used to generate the
condence value. This value is normalized using a sigmoid squashing function. The con -
dence score for the KNN classi er was computed as the proportion of neighbors that belong
to the decided class. The output value of the node corresponding to the decided class gives
the con dence value for the neural net classi er. The combined word-level classi er could
attain an accuracy of 87.1% on 5-fold cross validation, as opposed to 86.5% for the best
performing individual classi er (SVM-based). The line level classi cation accuracy of the
combined classi er was 95.5%, compared to 95.4% accuracy of the neural net and SVM
classi ers.
5.5 Feature Selection
An interesting question to ask in any classi cation system is, how many features are ade-
quate for classi cation. A very effective, although sub-optimal, way to determine the best
104
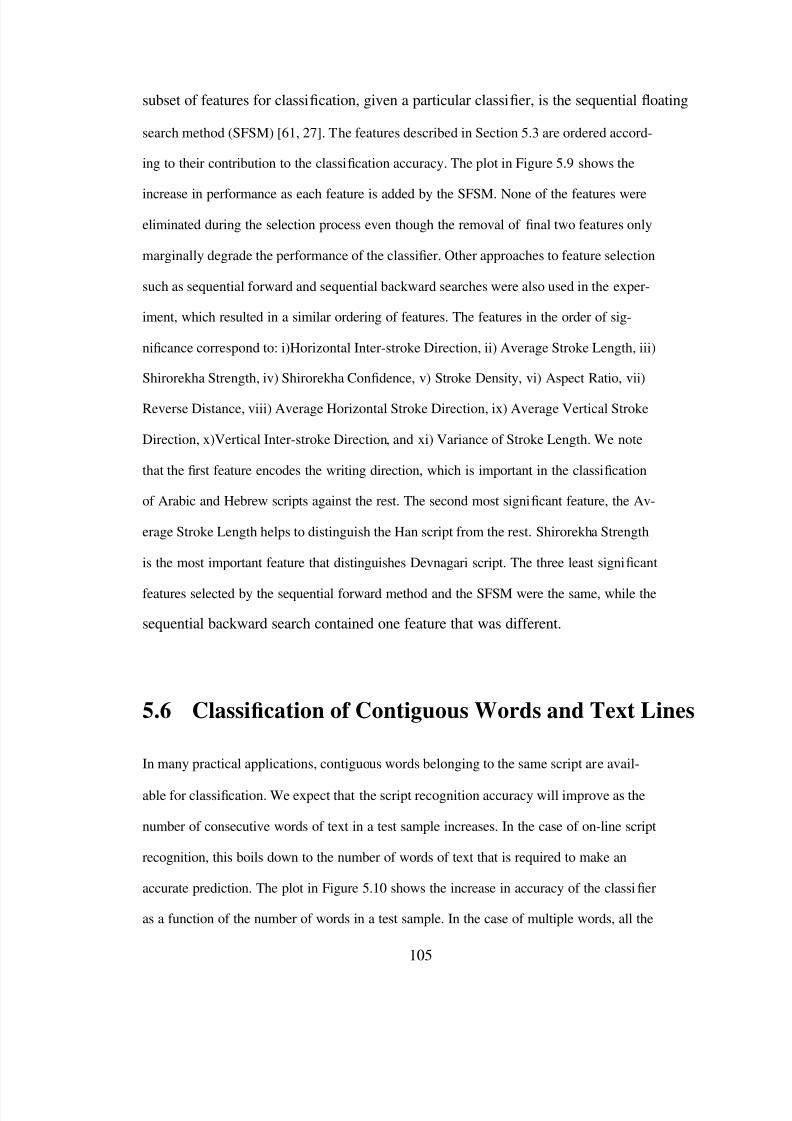
8/7/2019 Online HandWritten Document
http://slidepdf.com/reader/full/online-handwritten-document 129/191
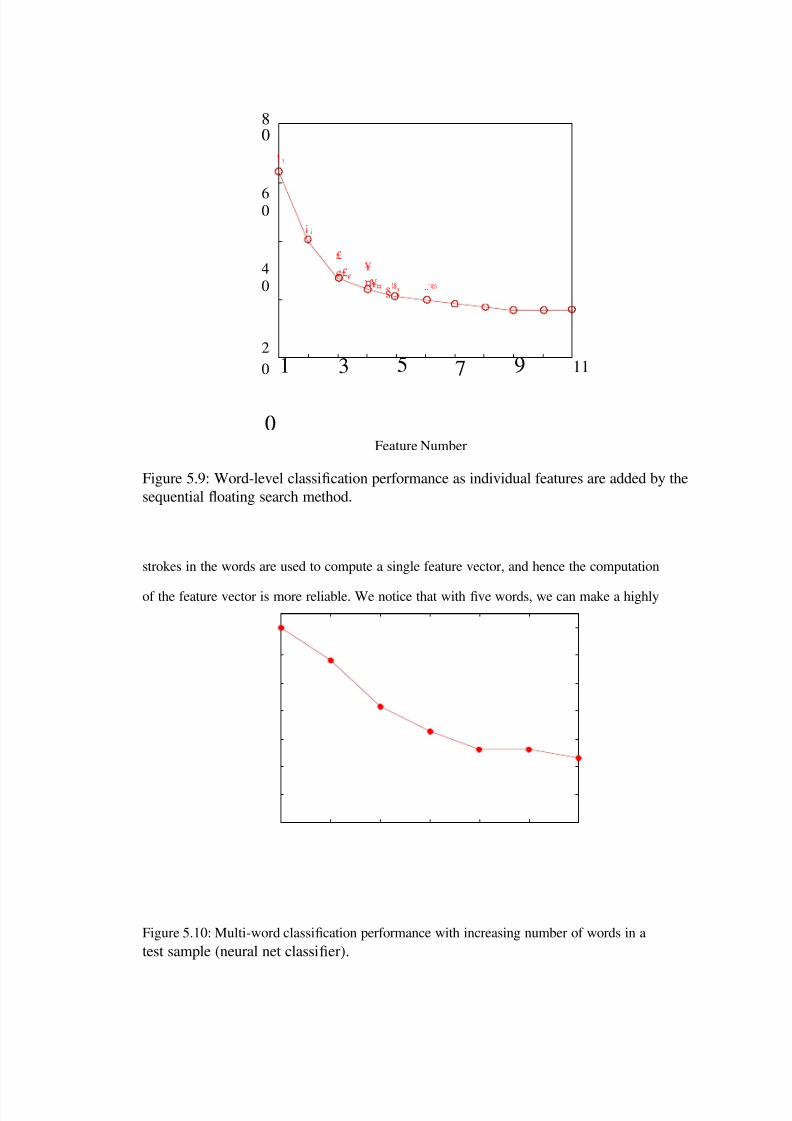
8/7/2019 Online HandWritten Document
http://slidepdf.com/reader/full/online-handwritten-document 130/191
8/7/2019 Online HandWritten Document
http://slidepdf.com/reader/full/online-handwritten-document 131/191
106
Error (in %)
0
4
8
1 12 14
1
2
3
4
5
6
Line
Number of words
in %)
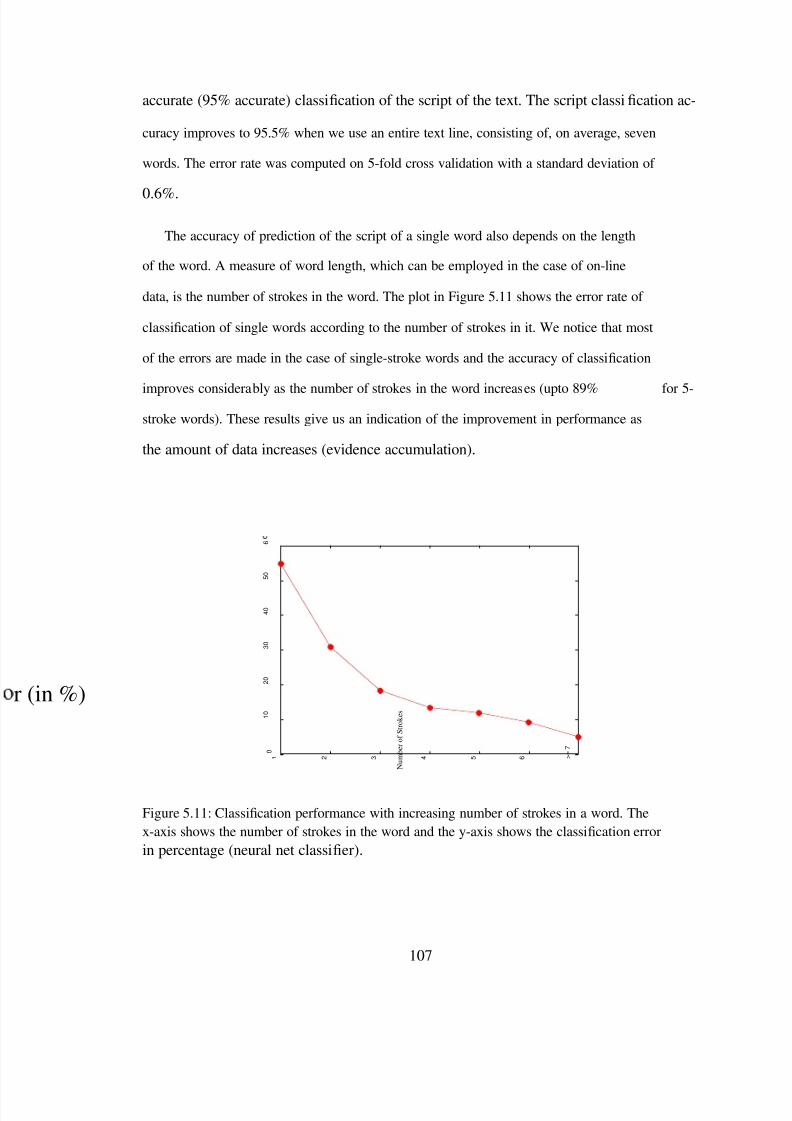
8/7/2019 Online HandWritten Document
http://slidepdf.com/reader/full/online-handwritten-document 132/191
accurate (95% accurate) classi cation of the script of the text. The script classi cation ac-
curacy improves to 95.5% when we use an entire text line, consisting of, on average, seven
words. The error rate was computed on 5-fold cross validation with a standard deviation of
0.6%.
The accuracy of prediction of the script of a single word also depends on the length
of the word. A measure of word length, which can be employed in the case of on-line
data, is the number of strokes in the word. The plot in Figure 5.11 shows the error rate of
classi cation of single words according to the number of strokes in it. We notice that most
of the errors are made in the case of single-stroke words and the accuracy of classi cation
improves considerably as the number of strokes in the word increases (upto 89% for 5-
stroke words). These results give us an indication of the improvement in performance as
the amount of data increases (evidence accumulation).
Figure 5.11: Classi cation performance with increasing number of strokes in a word. Thex-axis shows the number of strokes in the word and the y-axis shows the classi cation errorin percentage (neural net classi er).
107
0
10
20
30
40
50
6
1
2
3
4
5
6 >=
7
Number of Strokes in %)
8/7/2019 Online HandWritten Document
http://slidepdf.com/reader/full/online-handwritten-document 133/191
5.7 Summary
We present a script identi cation algorithm to recognize six major scripts in an on-line
document. The aim is to facilitate text recognition and to allow script-based retrieval of
on-line handwritten documents on the Internet. The classi cation is done at the word level,
which allows us to detect individual words of a particular script present within the text
of another script. The classi cation accuracies reported here are much higher than those
reported in the case of script identi cation of off-line handwritten documents till date,
although the reader should bear in mind that the complexities of the two problems are
different.
108
8/7/2019 Online HandWritten Document
http://slidepdf.com/reader/full/online-handwritten-document 134/191
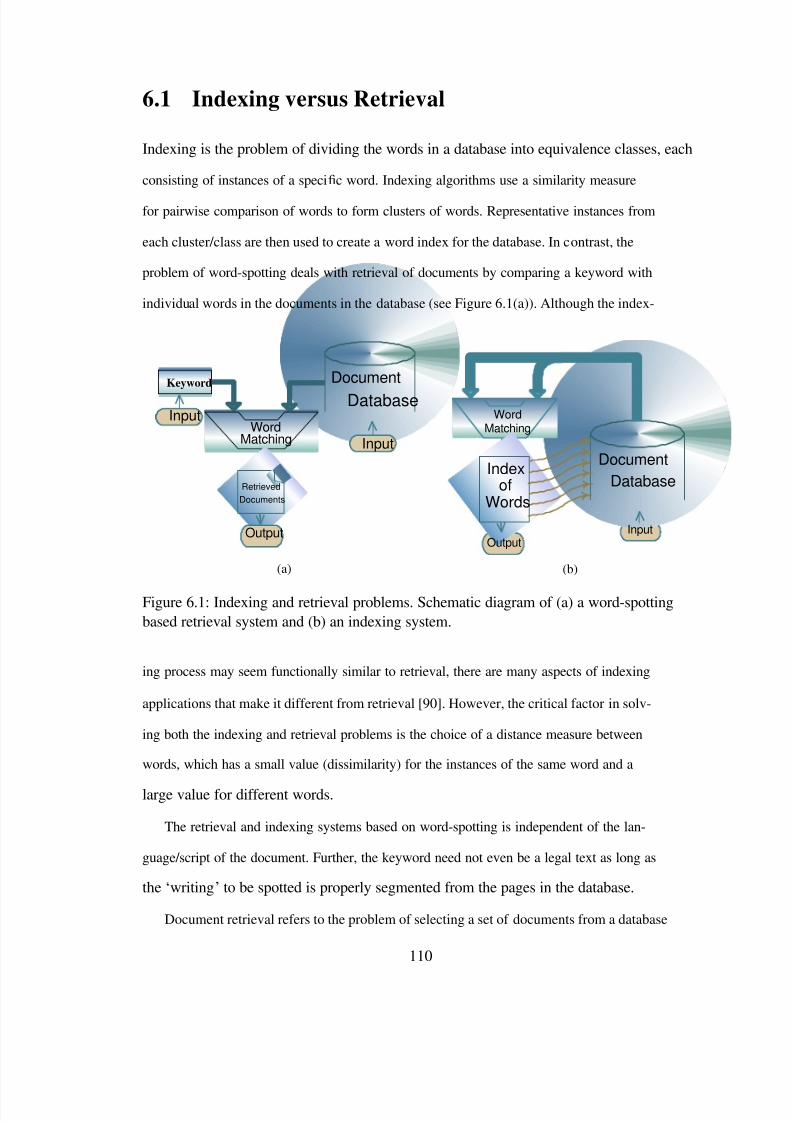
8/7/2019 Online HandWritten Document
http://slidepdf.com/reader/full/online-handwritten-document 135/191
6.1 Indexing versus Retrieval
Indexing is the problem of dividing the words in a database into equivalence classes, each
consisting of instances of a speci c word. Indexing algorithms use a similarity measure
for pairwise comparison of words to form clusters of words. Representative instances from
each cluster/class are then used to create a word index for the database. In contrast, the
problem of word-spotting deals with retrieval of documents by comparing a keyword with
individual words in the documents in the database (see Figure 6.1(a)). Although the index-
Keyword
InputWord
Matching
RetrievedDocuments
Output
(a)
DocumentDatabase
Input
WordMatching
Indexof
Words
Output
(b)
DocumentDatabase
Input
Figure 6.1: Indexing and retrieval problems. Schematic diagram of (a) a word-spottingbased retrieval system and (b) an indexing system.
ing process may seem functionally similar to retrieval, there are many aspects of indexing
applications that make it different from retrieval [90]. However, the critical factor in solv-
ing both the indexing and retrieval problems is the choice of a distance measure between
words, which has a small value (dissimilarity) for the instances of the same word and a
large value for different words.
The retrieval and indexing systems based on word-spotting is independent of the lan-
guage/script of the document. Further, the keyword need not even be a legal text as long as
the „writing ‟to be spotted is properly segmented from the pages in the database.
Document retrieval refers to the problem of selecting a set of documents from a database
110
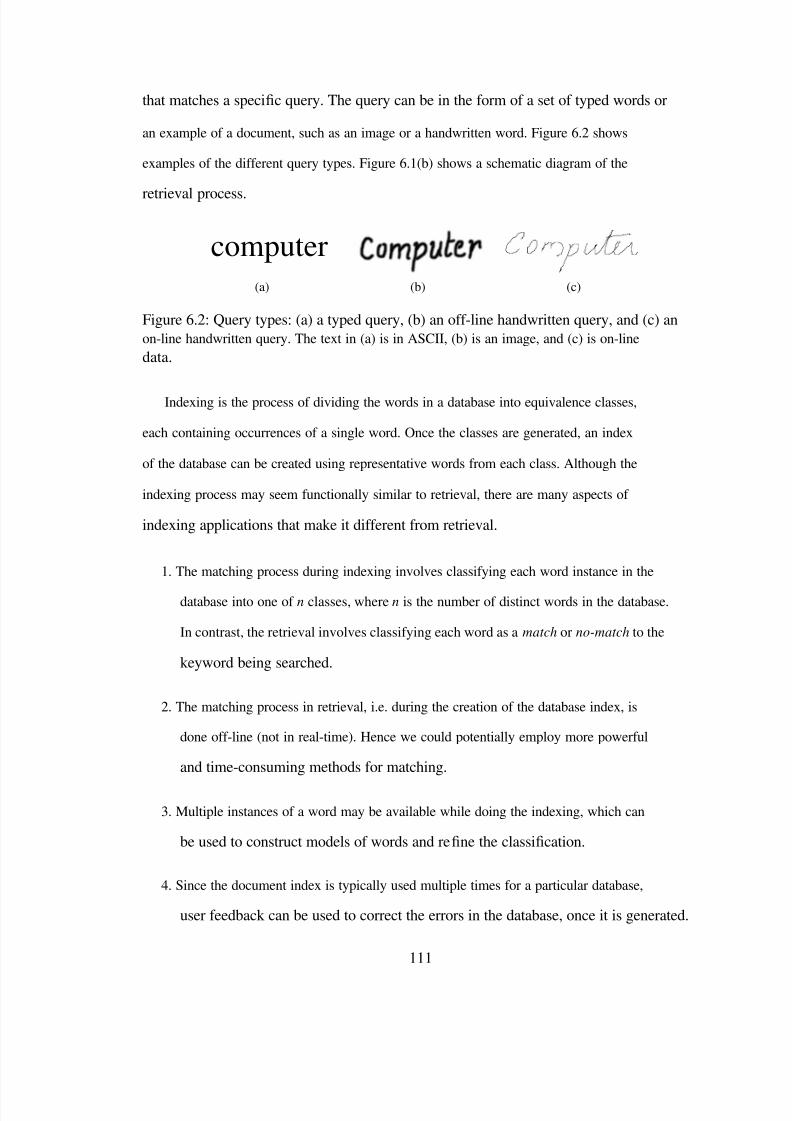
8/7/2019 Online HandWritten Document
http://slidepdf.com/reader/full/online-handwritten-document 136/191
that matches a speci c query. The query can be in the form of a set of typed words or
an example of a document, such as an image or a handwritten word. Figure 6.2 shows
examples of the different query types. Figure 6.1(b) shows a schematic diagram of the
retrieval process.
computer(a) (b) (c)
Figure 6.2: Query types: (a) a typed query, (b) an off-line handwritten query, and (c) anon-line handwritten query. The text in (a) is in ASCII, (b) is an image, and (c) is on-linedata.
Indexing is the process of dividing the words in a database into equivalence classes,
each containing occurrences of a single word. Once the classes are generated, an index
of the database can be created using representative words from each class. Although the
indexing process may seem functionally similar to retrieval, there are many aspects of
indexing applications that make it different from retrieval.
1. The matching process during indexing involves classifying each word instance in the
database into one of n classes, where n is the number of distinct words in the database.
In contrast, the retrieval involves classifying each word as a match or no-match to the
keyword being searched.
2. The matching process in retrieval, i.e. during the creation of the database index, is
done off-line (not in real-time). Hence we could potentially employ more powerful
and time-consuming methods for matching.
3. Multiple instances of a word may be available while doing the indexing, which can
be used to construct models of words and re ne the classi cation.
4. Since the document index is typically used multiple times for a particular database,
user feedback can be used to correct the errors in the database, once it is generated.
111
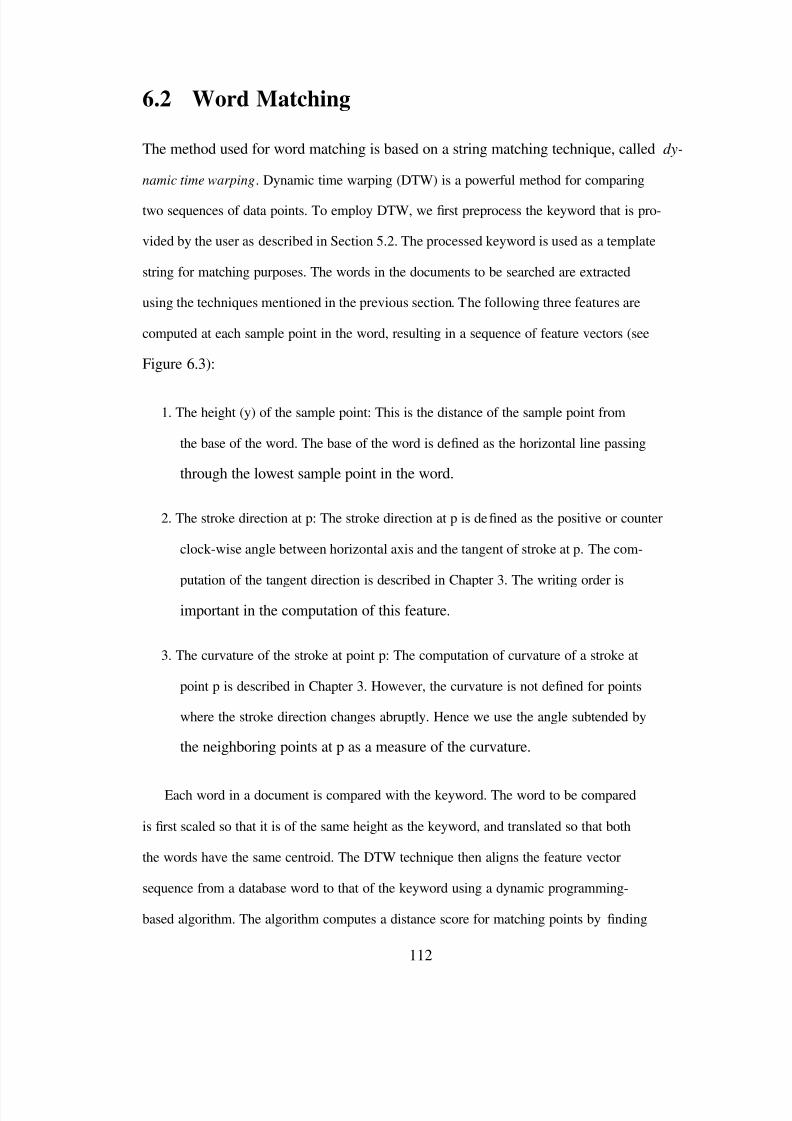
8/7/2019 Online HandWritten Document
http://slidepdf.com/reader/full/online-handwritten-document 137/191
6.2 Word Matching
The method used for word matching is based on a string matching technique, called dy-
namic time warping . Dynamic time warping (DTW) is a powerful method for comparing
two sequences of data points. To employ DTW, we rst preprocess the keyword that is pro-
vided by the user as described in Section 5.2. The processed keyword is used as a template
string for matching purposes. The words in the documents to be searched are extracted
using the techniques mentioned in the previous section. The following three features are
computed at each sample point in the word, resulting in a sequence of feature vectors (see
Figure 6.3):
1. The height (y) of the sample point: This is the distance of the sample point from
the base of the word. The base of the word is de ned as the horizontal line passing
through the lowest sample point in the word.
2. The stroke direction at p: The stroke direction at p is de ned as the positive or counter
clock-wise angle between horizontal axis and the tangent of stroke at p. The com-
putation of the tangent direction is described in Chapter 3. The writing order is
important in the computation of this feature.
3. The curvature of the stroke at point p: The computation of curvature of a stroke at
point p is described in Chapter 3. However, the curvature is not de ned for points
where the stroke direction changes abruptly. Hence we use the angle subtended by
the neighboring points at p as a measure of the curvature.
Each word in a document is compared with the keyword. The word to be compared
is rst scaled so that it is of the same height as the keyword, and translated so that both
the words have the same centroid. The DTW technique then aligns the feature vector
sequence from a database word to that of the keyword using a dynamic programming-
based algorithm. The algorithm computes a distance score for matching points by nding
112
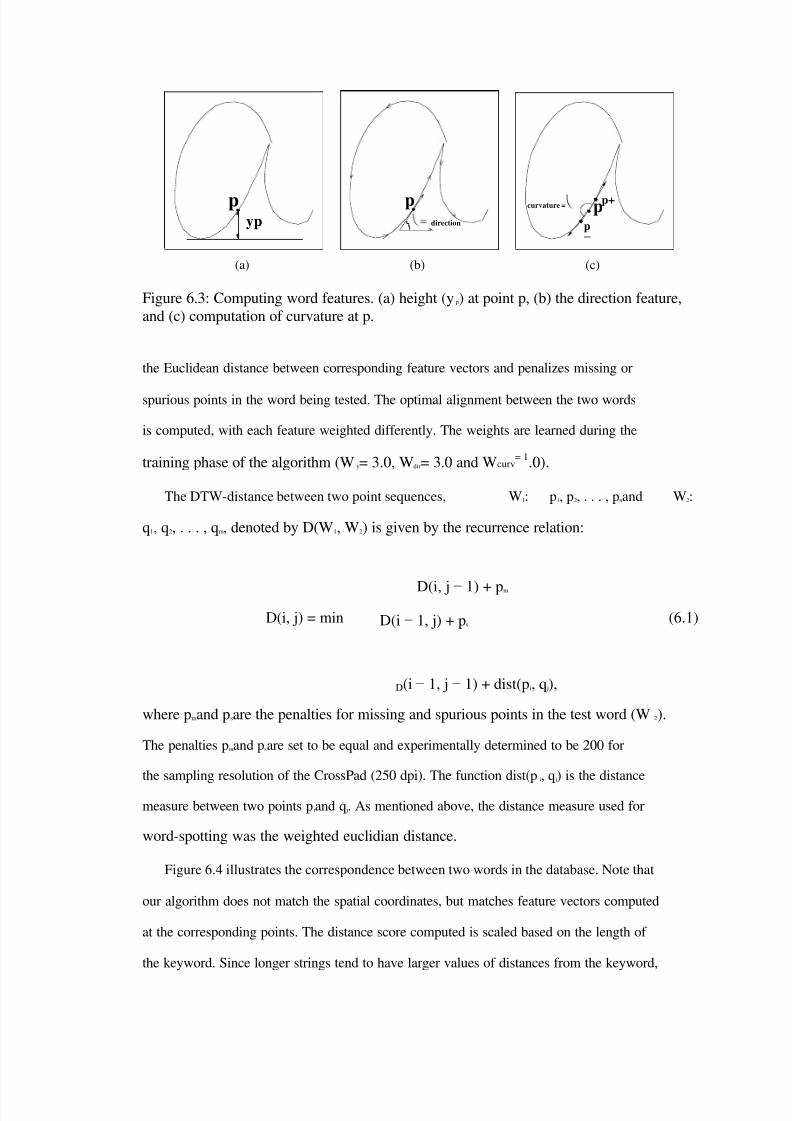
8/7/2019 Online HandWritten Document
http://slidepdf.com/reader/full/online-handwritten-document 138/191
p yp
p direction
curvature =
p−
p p+
(a) (b) (c)
Figure 6.3: Computing word features. (a) height (y p) at point p, (b) the direction feature,and (c) computation of curvature at p.
the Euclidean distance between corresponding feature vectors and penalizes missing or
spurious points in the word being tested. The optimal alignment between the two words
is computed, with each feature weighted differently. The weights are learned during the
training phase of the algorithm (W y= 3.0, W dir= 3.0 and W curv= 1 .0).
The DTW-distance between two point sequences, W 1: p 1, p 2, . . . , p nand W 2:
q1, q 2, . . . , q m, denoted by D(W 1, W 2) is given by the recurrence relation:
D(i, j − 1) + p m D(i, j) = min
D(i − 1, j) + p s (6.1)
D(i − 1, j − 1) + dist(p i, q j),
where p mand p sare the penalties for missing and spurious points in the test word (W 2).
The penalties p mand p sare set to be equal and experimentally determined to be 200 for
the sampling resolution of the CrossPad (250 dpi). The function dist(p i, q j) is the distance
measure between two points p iand q j. As mentioned above, the distance measure used for
word-spotting was the weighted euclidian distance.
Figure 6.4 illustrates the correspondence between two words in the database. Note that
our algorithm does not match the spatial coordinates, but matches feature vectors computed
at the corresponding points. The distance score computed is scaled based on the length of
the keyword. Since longer strings tend to have larger values of distances from the keyword,

8/7/2019 Online HandWritten Document
http://slidepdf.com/reader/full/online-handwritten-document 139/191
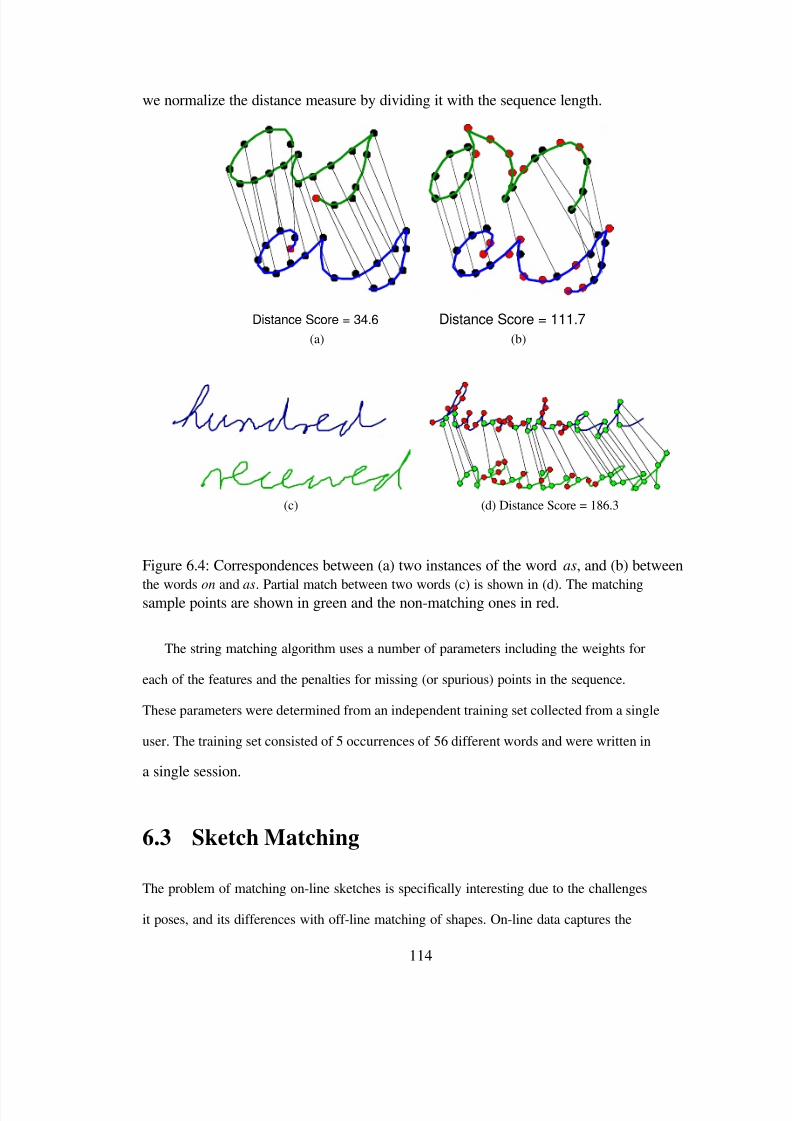
8/7/2019 Online HandWritten Document
http://slidepdf.com/reader/full/online-handwritten-document 140/191
we normalize the distance measure by dividing it with the sequence length.
Distance Score = 34.6(a)
(c)
Distance Score = 111.7(b)
(d) Distance Score = 186.3
Figure 6.4: Correspondences between (a) two instances of the word as , and (b) between
the words on and as . Partial match between two words (c) is shown in (d). The matchingsample points are shown in green and the non-matching ones in red.
The string matching algorithm uses a number of parameters including the weights for
each of the features and the penalties for missing (or spurious) points in the sequence.
These parameters were determined from an independent training set collected from a single
user. The training set consisted of 5 occurrences of 56 different words and were written in
a single session.
6.3 Sketch Matching
The problem of matching on-line sketches is speci cally interesting due to the challenges
it poses, and its differences with off-line matching of shapes. On-line data captures the
114
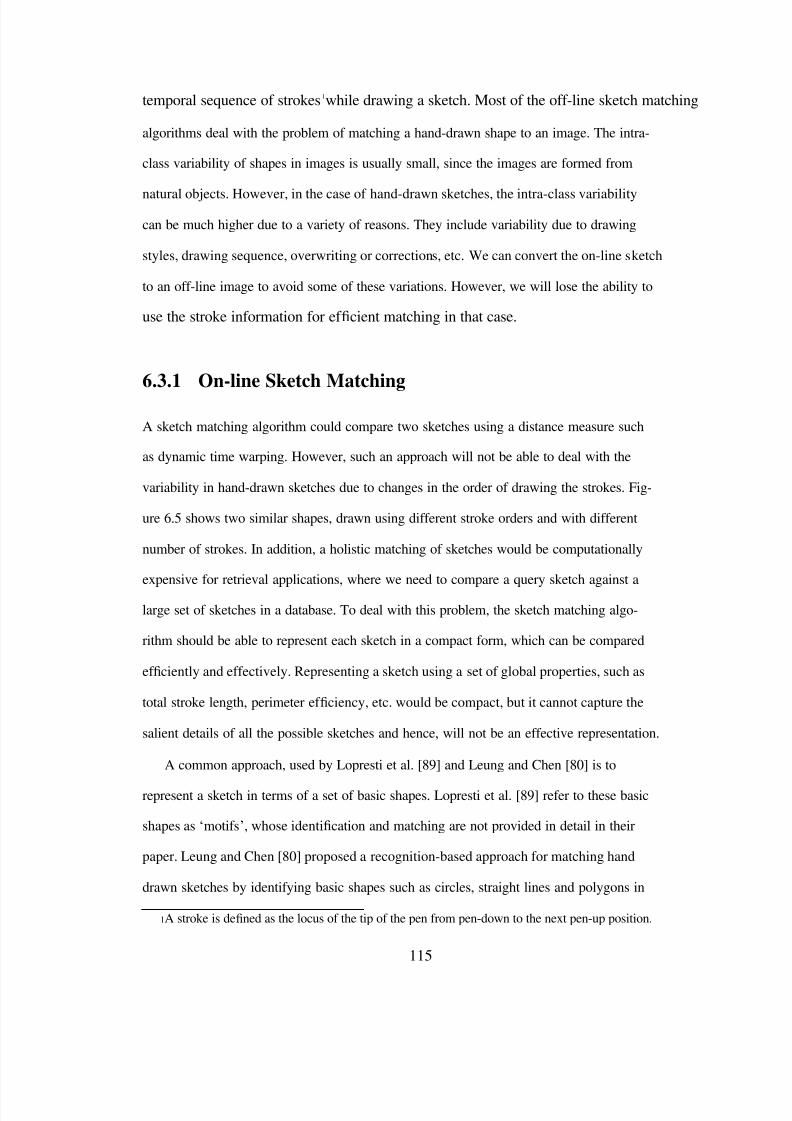
8/7/2019 Online HandWritten Document
http://slidepdf.com/reader/full/online-handwritten-document 141/191

8/7/2019 Online HandWritten Document
http://slidepdf.com/reader/full/online-handwritten-document 142/191
1
3
5
4
21 3
6
5
42
(a) (b)
Figure 6.5: On-line sketch variability: Two similar sketches, drawn using different strokeorders and with different number of strokes. The numbers indicate the order of the strokesand the dots indicate the end points of the strokes.
the sketch. The problem of developing a set of basic shapes for representing a generic setof sketches is dif cult at best. Once the basic shapes in a sketch are identi ed, one needs
to compare the two sketches, based on the identi ed shapes. This involves a comparison of
two shapes and their spatial arrangement in the two sketches. We note that an exhaustive
comparison of two sets of shapes to arrive at the best matching is exponential in time.
We present a matching algorithm that tries to overcome the problems with an ef cient
representation and similarity measure.
6.3.2 Proposed Algorithm
The matching algorithm consists of three stages. The rst stage tries to eliminate the noise
introduced in the sketches during data capture due to noise from the sensor, quantization,
etc. In the second stage, we divide the traces in the sketch into smaller units. This is
followed by a matching stage, where the sketches are compared based on their global prop-
erties and the properties of the individual portions of the strokes in the two sketches. The
input data for the matching algorithm can be noisy due to a variety of factors. We use the
spline-based representation described in Chapter 3 to smoothen the strokes in the sketch.
One of the main problems in comparing sketches based on a set of basic shapes is the
identi cation of the basic shapes from a sketch. The problem is similar to a structural
116
8/7/2019 Online HandWritten Document
http://slidepdf.com/reader/full/online-handwritten-document 143/191
pattern recognition [105, 106] problem, where a pattern class is described in terms of a set
of structural primitives. We overcome this problem by representing the sketches as a set of
stroke segments instead of a pre-de ned set of shapes. After pre-processing, each stroke is
divided at the points where the x or y direction of a stroke changes. Each resulting stroke
segment is represented using a line segments. Figure 6.6 shows a sketch, where the stroke
segments are identi ed and represented as a set of line segments.
(a) (b) (c)
Figure 6.6: Segmentation of strokes: (a) an input sketch, (b) the critical points in the sketch,and (c) the representation of the sketch as a set of straight lines.
Let { ζ1, ζ2, · · · , ζn} be the set of segments identi ed from a stroke ξ in the sketch S. A
sketch with m strokes is hence represented as:
S = ξ1∪ ξ2∪ · · · ∪ ξm= {ζ1, ζ2, · · · , ζk }, (6.2)
where k is the total number of stroke segments identi ed from all the m strokes in the
sketch. Each stroke segment ζiis represented using its position, direction, length, and
curvature, <P i, D i, L i, C i>. Consider a stroke segment, ζ, containing p sample points.
ζ =< (x 1, y1), (x 2, y2), · · · , (x p, y p) > .
117
(6.3)
8/7/2019 Online HandWritten Document
http://slidepdf.com/reader/full/online-handwritten-document 144/191
8/7/2019 Online HandWritten Document
http://slidepdf.com/reader/full/online-handwritten-document 145/191
with this algorithm. One could further re ne this algorithm by incorporating heuristics
for selecting the matching segment pair at each iteration, thus moving towards an optimal
solution. However, the algorithm works well in practice as indicated by the experiments.
We use the number of stroke segments, the total length of the strokes in a sketch to avoid
matching sketches that are markedly dissimilar and thus reducing the average time for
matching two sketches.
6.4 Experimental Results
The test set consisted of a passage of 30 pages (410 lines and 3, 872 words) collected from
a single writer and a set of 280 keywords (5 instances each of 56 words) collected from 10
writers (a total of 2, 800 words). The database was collected over a period of two weeks in
over ve sessions. To measure the performance of the algorithm, the words in the database
were manually labelled (ground truth) after detection of lines and words (a total of 6, 672
words). Figure 6.7 shows examples of pages from our on-line database. More examples of
documents in the database can be found in Appendix B.
The performance of a retrieval algorithm is typically measured using two quantities:
precision and recall . Consider an algorithm that retrieves n items (words or documents)
from a database of N items for a particular query. Further, assume that k of the retrieved
items match the query, and the actual number of items in the database that match the query
is K . The precision and recall are de ned as follows:
Precision refers to the fraction of the retrieved items that match the query. P recision =
k/n.
Recall refers to the fraction of items that match the query in the database, which was
retrieved by the algorithm. Recall = k/K .
119
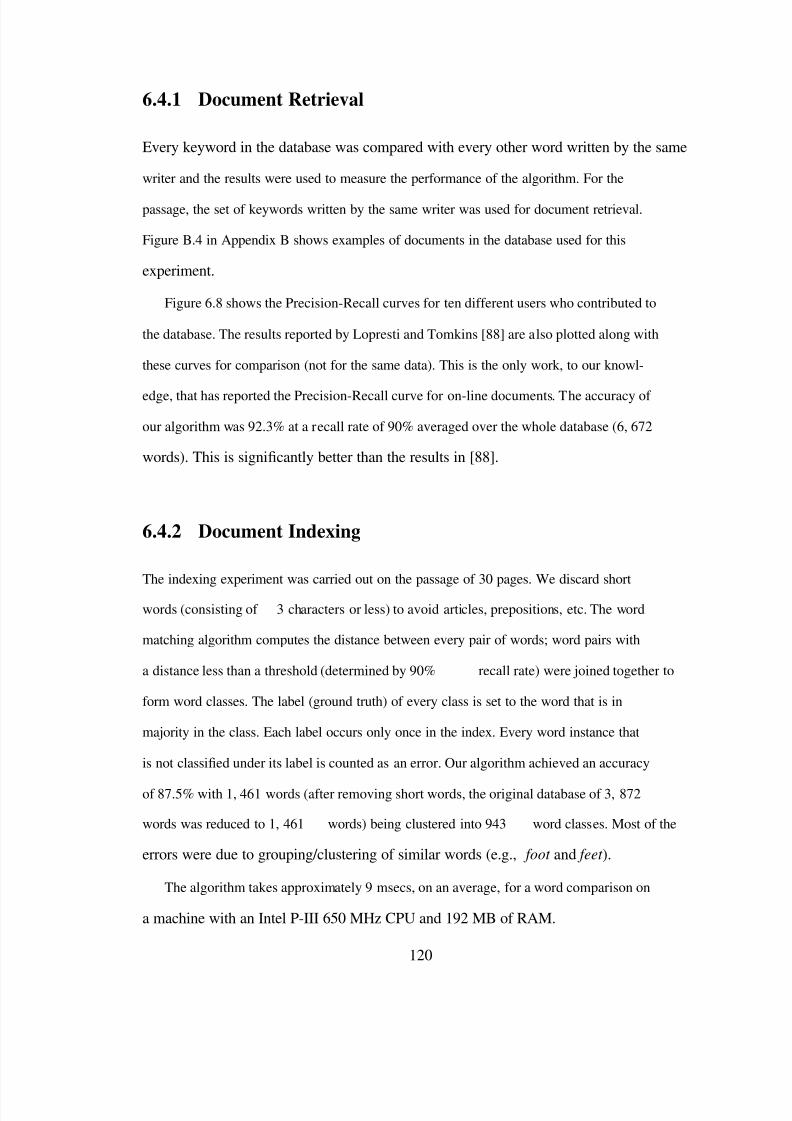
8/7/2019 Online HandWritten Document
http://slidepdf.com/reader/full/online-handwritten-document 146/191
6.4.1 Document Retrieval
Every keyword in the database was compared with every other word written by the same
writer and the results were used to measure the performance of the algorithm. For the
passage, the set of keywords written by the same writer was used for document retrieval.
Figure B.4 in Appendix B shows examples of documents in the database used for this
experiment.
Figure 6.8 shows the Precision-Recall curves for ten different users who contributed to
the database. The results reported by Lopresti and Tomkins [88] are also plotted along with
these curves for comparison (not for the same data). This is the only work, to our knowl-
edge, that has reported the Precision-Recall curve for on-line documents. The accuracy of
our algorithm was 92.3% at a recall rate of 90% averaged over the whole database (6, 672
words). This is signi cantly better than the results in [88].
6.4.2 Document Indexing
The indexing experiment was carried out on the passage of 30 pages. We discard short
words (consisting of 3 characters or less) to avoid articles, prepositions, etc. The word
matching algorithm computes the distance between every pair of words; word pairs with
a distance less than a threshold (determined by 90% recall rate) were joined together to
form word classes. The label (ground truth) of every class is set to the word that is in
majority in the class. Each label occurs only once in the index. Every word instance that
is not classi ed under its label is counted as an error. Our algorithm achieved an accuracy
of 87.5% with 1, 461 words (after removing short words, the original database of 3, 872
words was reduced to 1, 461 words) being clustered into 943 word classes. Most of the
errors were due to grouping/clustering of similar words (e.g., foot and feet ).
The algorithm takes approximately 9 msecs, on an average, for a word comparison on
a machine with an Intel P-III 650 MHz CPU and 192 MB of RAM.
120
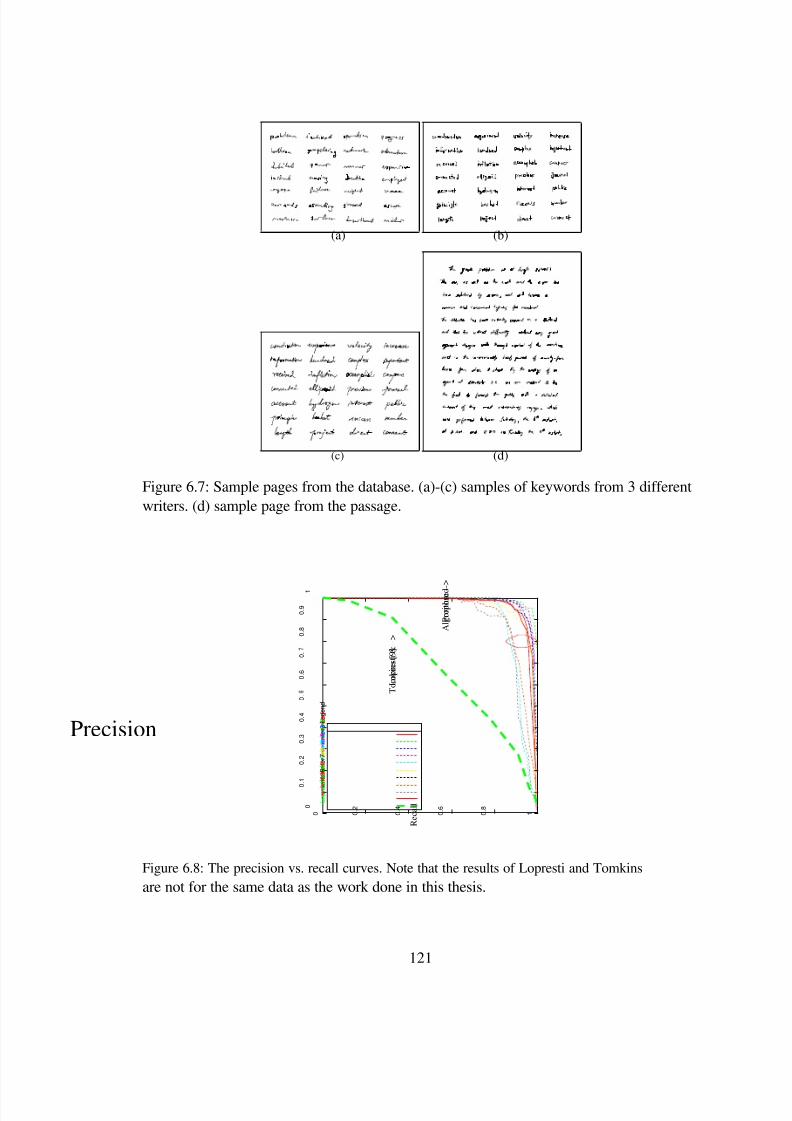
8/7/2019 Online HandWritten Document
http://slidepdf.com/reader/full/online-handwritten-document 147/191
(a)
(c)
(b)
(d)
Figure 6.7: Sample pages from the database. (a)-(c) samples of keywords from 3 differentwriters. (d) sample page from the passage.
Figure 6.8: The precision vs. recall curves. Note that the results of Lopresti and Tomkinsare not for the same data as the work done in this thesis.
121
0
0.1 0.2 0.3 0.4 0. 0.6 0. 0.8 0.9 1
0
0.2
0.4
0.6
0.8
1
Recall
Precision
Proposed
Algorithm -->
Lopresti &
Tomkins [9] -->
Legend
writer1
writer2
writer3
writer4
writer5
writer6
writer7
writer8
writer9
writer10
Lopresti et al.
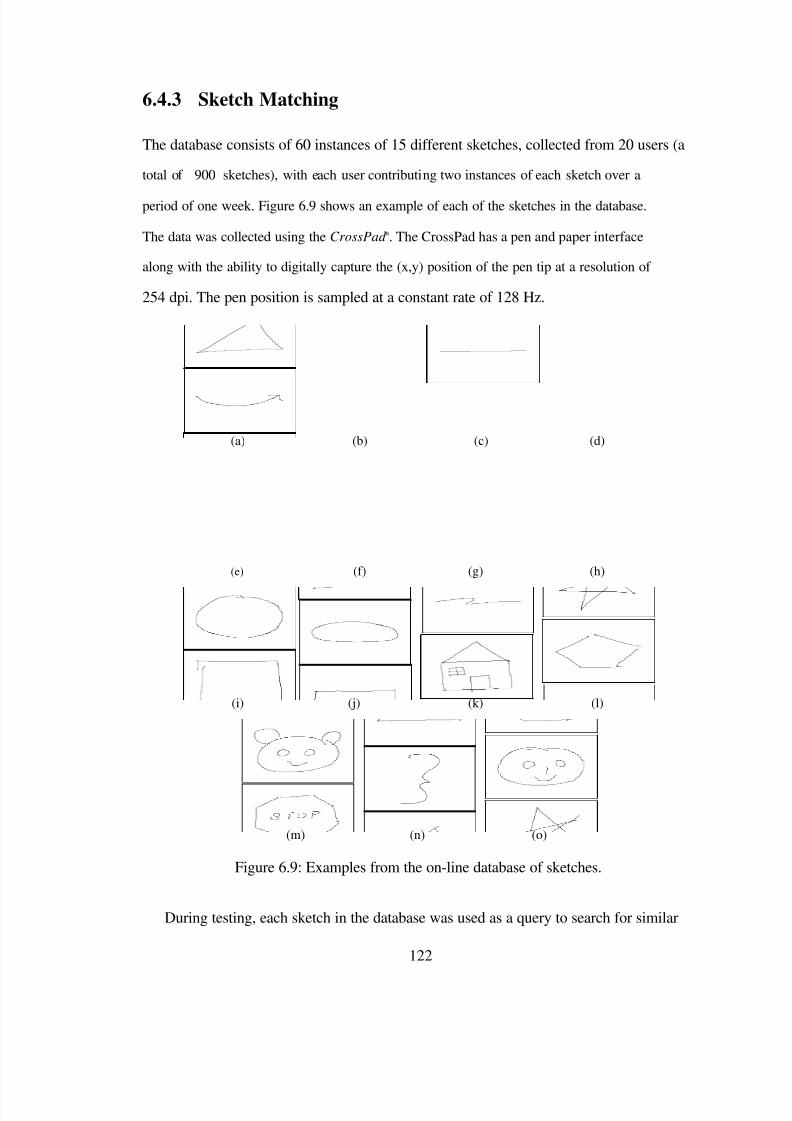
8/7/2019 Online HandWritten Document
http://slidepdf.com/reader/full/online-handwritten-document 148/191
6.4.3 Sketch Matching
The database consists of 60 instances of 15 different sketches, collected from 20 users (a
total of 900 sketches), with each user contributing two instances of each sketch over a
period of one week. Figure 6.9 shows an example of each of the sketches in the database.
The data was collected using the CrossPad R. The CrossPad has a pen and paper interface
along with the ability to digitally capture the (x,y) position of the pen tip at a resolution of
254 dpi. The pen position is sampled at a constant rate of 128 Hz.
(a)
(e)
(i)
(m)
(b)
(f)
(j)
(n)
(c)
(g)
(k)
(o)
(d)
(h)
(l)
Figure 6.9: Examples from the on-line database of sketches.
During testing, each sketch in the database was used as a query to search for similar
122

8/7/2019 Online HandWritten Document
http://slidepdf.com/reader/full/online-handwritten-document 149/191
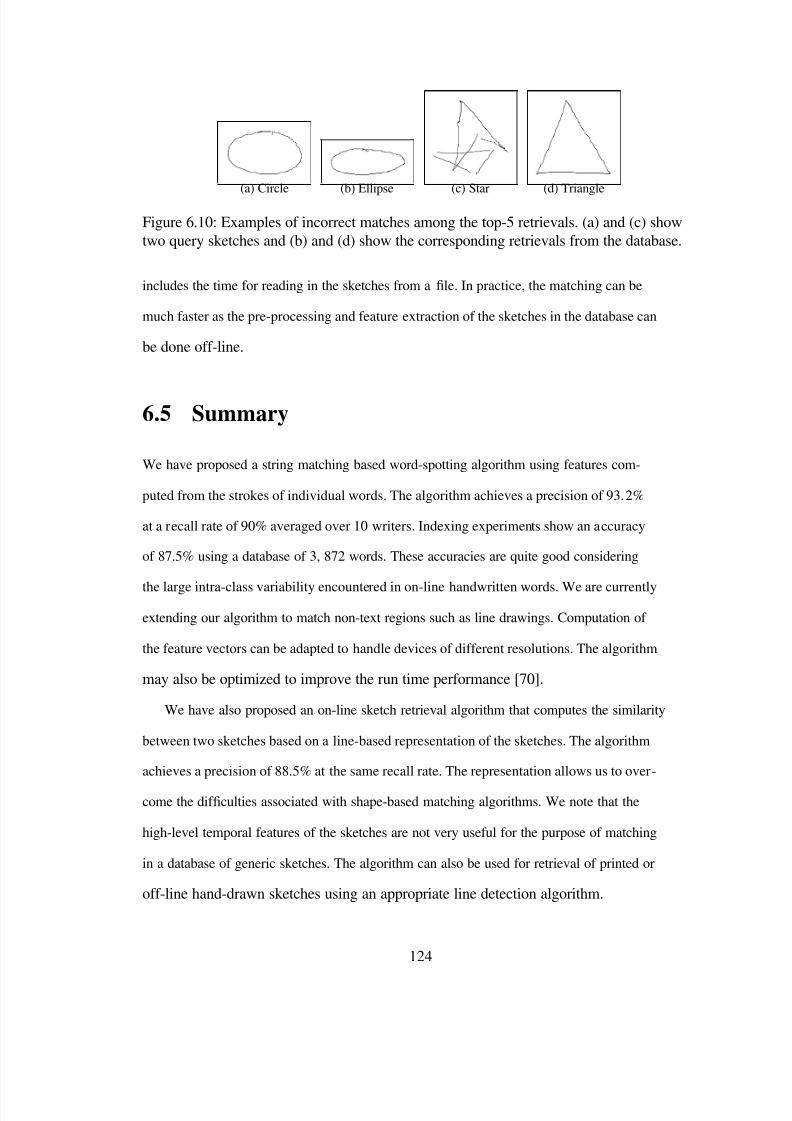
8/7/2019 Online HandWritten Document
http://slidepdf.com/reader/full/online-handwritten-document 150/191
8/7/2019 Online HandWritten Document
http://slidepdf.com/reader/full/online-handwritten-document 151/191
8/7/2019 Online HandWritten Document
http://slidepdf.com/reader/full/online-handwritten-document 152/191
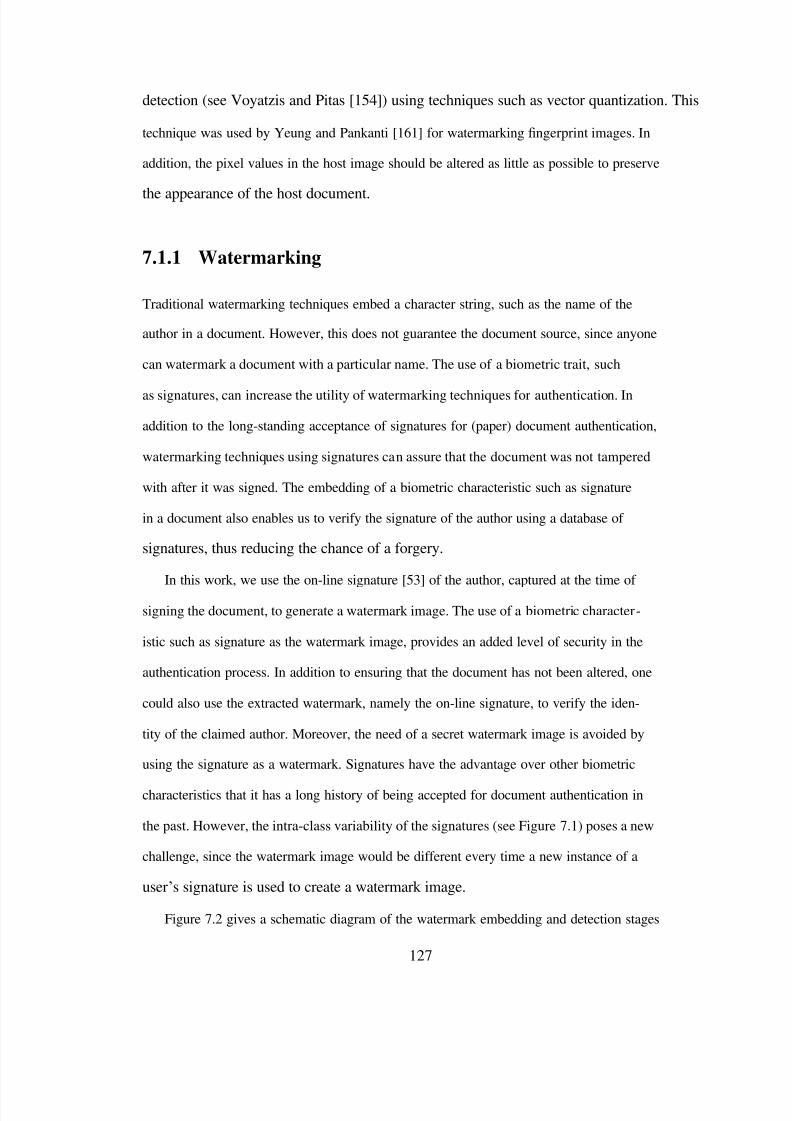
8/7/2019 Online HandWritten Document
http://slidepdf.com/reader/full/online-handwritten-document 153/191
detection (see Voyatzis and Pitas [154]) using techniques such as vector quantization. This
technique was used by Yeung and Pankanti [161] for watermarking ngerprint images. In
addition, the pixel values in the host image should be altered as little as possible to preserve
the appearance of the host document.
7.1.1 Watermarking
Traditional watermarking techniques embed a character string, such as the name of the
author in a document. However, this does not guarantee the document source, since anyone
can watermark a document with a particular name. The use of a biometric trait, such
as signatures, can increase the utility of watermarking techniques for authentication. In
addition to the long-standing acceptance of signatures for (paper) document authentication,
watermarking techniques using signatures can assure that the document was not tampered
with after it was signed. The embedding of a biometric characteristic such as signature
in a document also enables us to verify the signature of the author using a database of
signatures, thus reducing the chance of a forgery.
In this work, we use the on-line signature [53] of the author, captured at the time of
signing the document, to generate a watermark image. The use of a biometric character-
istic such as signature as the watermark image, provides an added level of security in the
authentication process. In addition to ensuring that the document has not been altered, one
could also use the extracted watermark, namely the on-line signature, to verify the iden-
tity of the claimed author. Moreover, the need of a secret watermark image is avoided by
using the signature as a watermark. Signatures have the advantage over other biometric
characteristics that it has a long history of being accepted for document authentication in
the past. However, the intra-class variability of the signatures (see Figure 7.1) poses a new
challenge, since the watermark image would be different every time a new instance of a
user‟s signature is used to create a watermark image.
Figure 7.2 gives a schematic diagram of the watermark embedding and detection stages
127
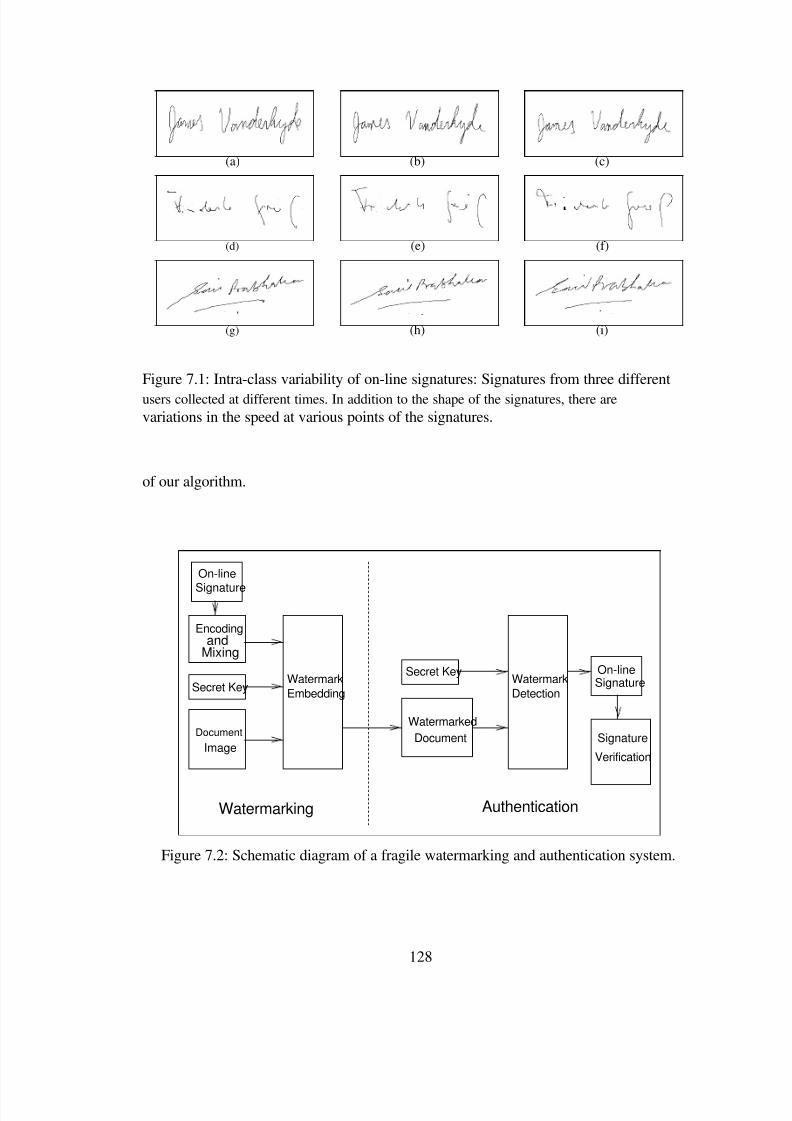
8/7/2019 Online HandWritten Document
http://slidepdf.com/reader/full/online-handwritten-document 154/191
(a)
(d)
(g)
(b)
(e)
(h)
(c)
(f)
(i)
Figure 7.1: Intra-class variability of on-line signatures: Signatures from three differentusers collected at different times. In addition to the shape of the signatures, there arevariations in the speed at various points of the signatures.
of our algorithm.
On-line
Signature
Encodingand
Mixing
Secret Key
DocumentImage
WatermarkEmbedding
Secret Key
WatermarkedDocument
WatermarkDetection
On-lineSignature
Signature
Verification
Watermarking Authentication
Figure 7.2: Schematic diagram of a fragile watermarking and authentication system.
128
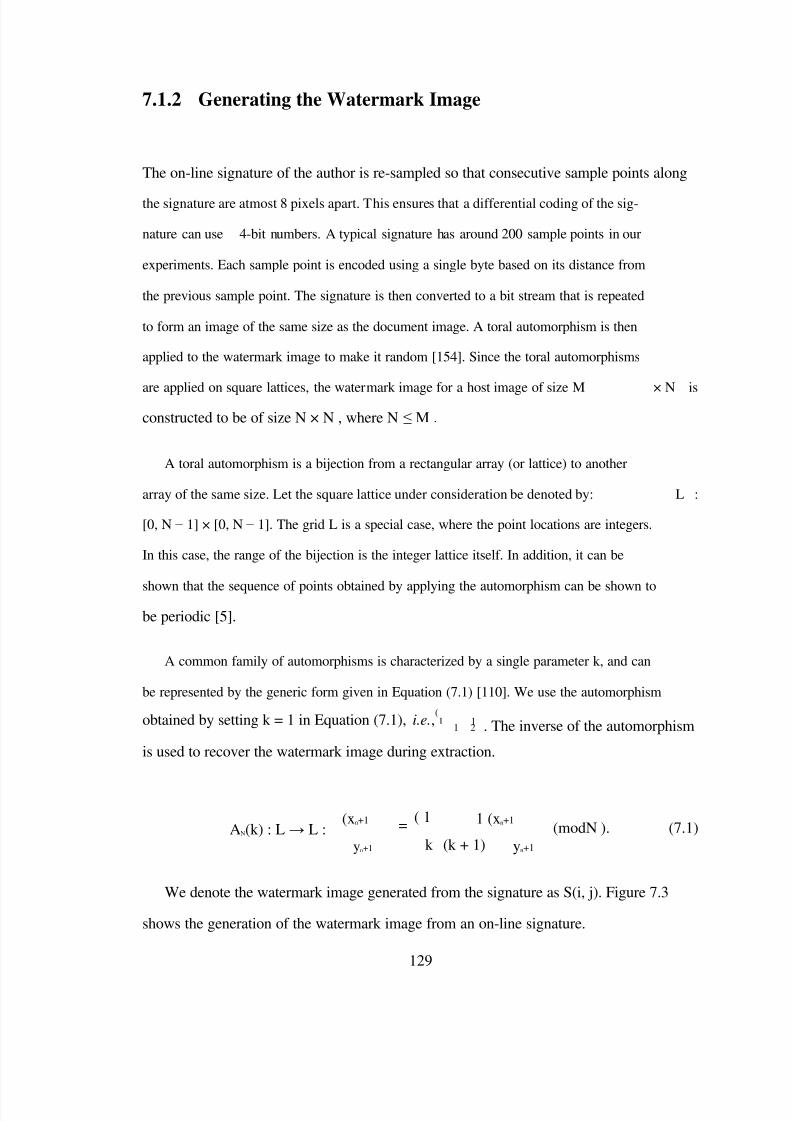
8/7/2019 Online HandWritten Document
http://slidepdf.com/reader/full/online-handwritten-document 155/191
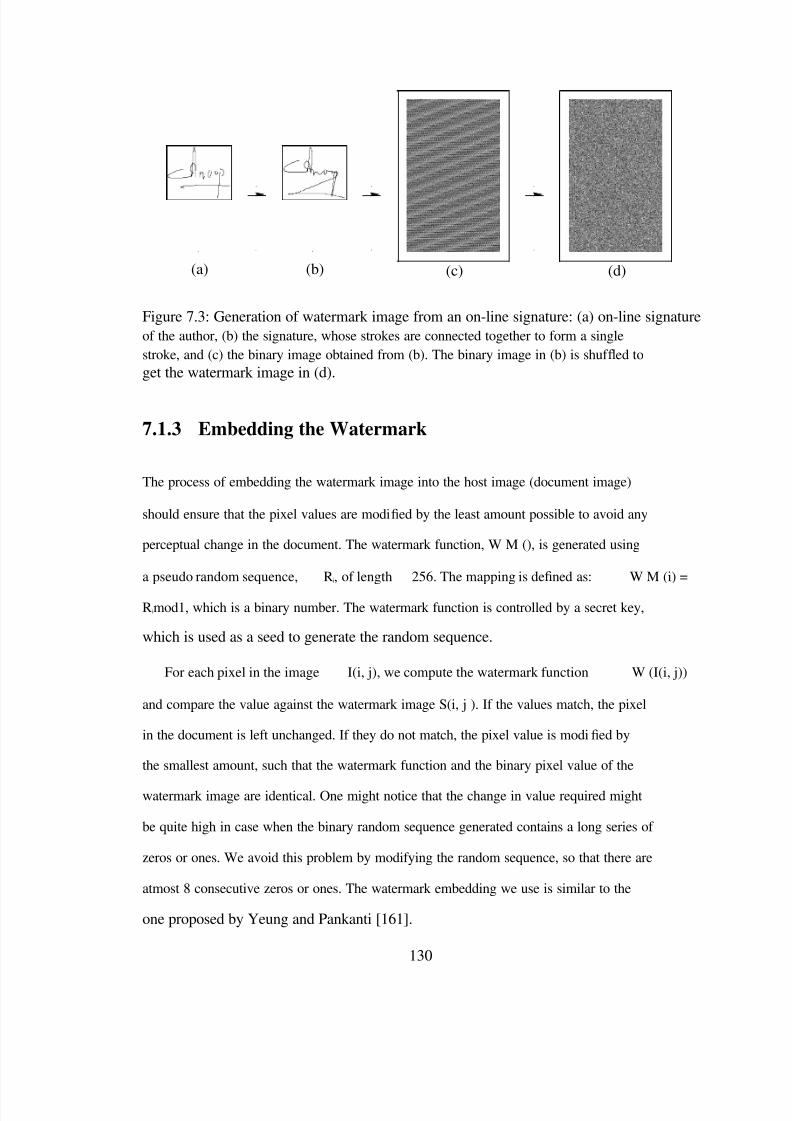
8/7/2019 Online HandWritten Document
http://slidepdf.com/reader/full/online-handwritten-document 156/191
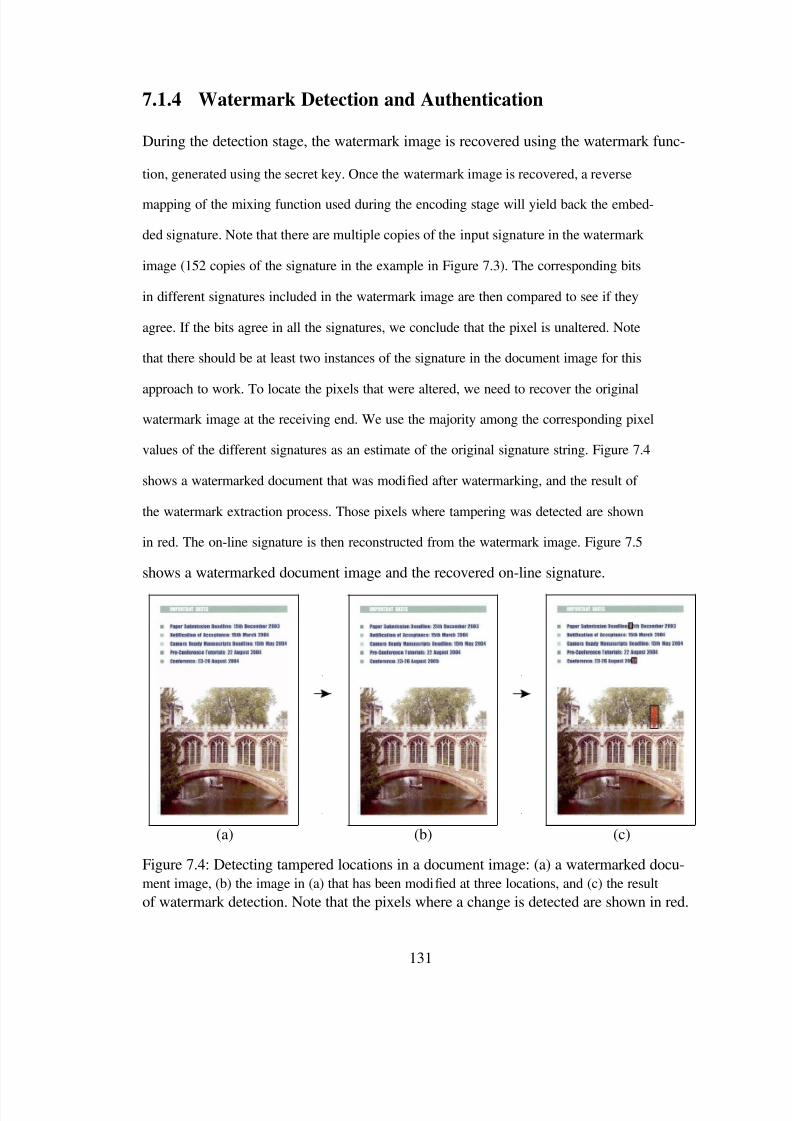
8/7/2019 Online HandWritten Document
http://slidepdf.com/reader/full/online-handwritten-document 157/191
7.1.4 Watermark Detection and Authentication
During the detection stage, the watermark image is recovered using the watermark func-
tion, generated using the secret key. Once the watermark image is recovered, a reverse
mapping of the mixing function used during the encoding stage will yield back the embed-
ded signature. Note that there are multiple copies of the input signature in the watermark
image (152 copies of the signature in the example in Figure 7.3). The corresponding bits
in different signatures included in the watermark image are then compared to see if they
agree. If the bits agree in all the signatures, we conclude that the pixel is unaltered. Note
that there should be at least two instances of the signature in the document image for this
approach to work. To locate the pixels that were altered, we need to recover the original
watermark image at the receiving end. We use the majority among the corresponding pixel
values of the different signatures as an estimate of the original signature string. Figure 7.4
shows a watermarked document that was modi ed after watermarking, and the result of
the watermark extraction process. Those pixels where tampering was detected are shown
in red. The on-line signature is then reconstructed from the watermark image. Figure 7.5
shows a watermarked document image and the recovered on-line signature.
(a)
.
.
(b)
.
.
(c)
Figure 7.4: Detecting tampered locations in a document image: (a) a watermarked docu-ment image, (b) the image in (a) that has been modi ed at three locations, and (c) the resultof watermark detection. Note that the pixels where a change is detected are shown in red.
131
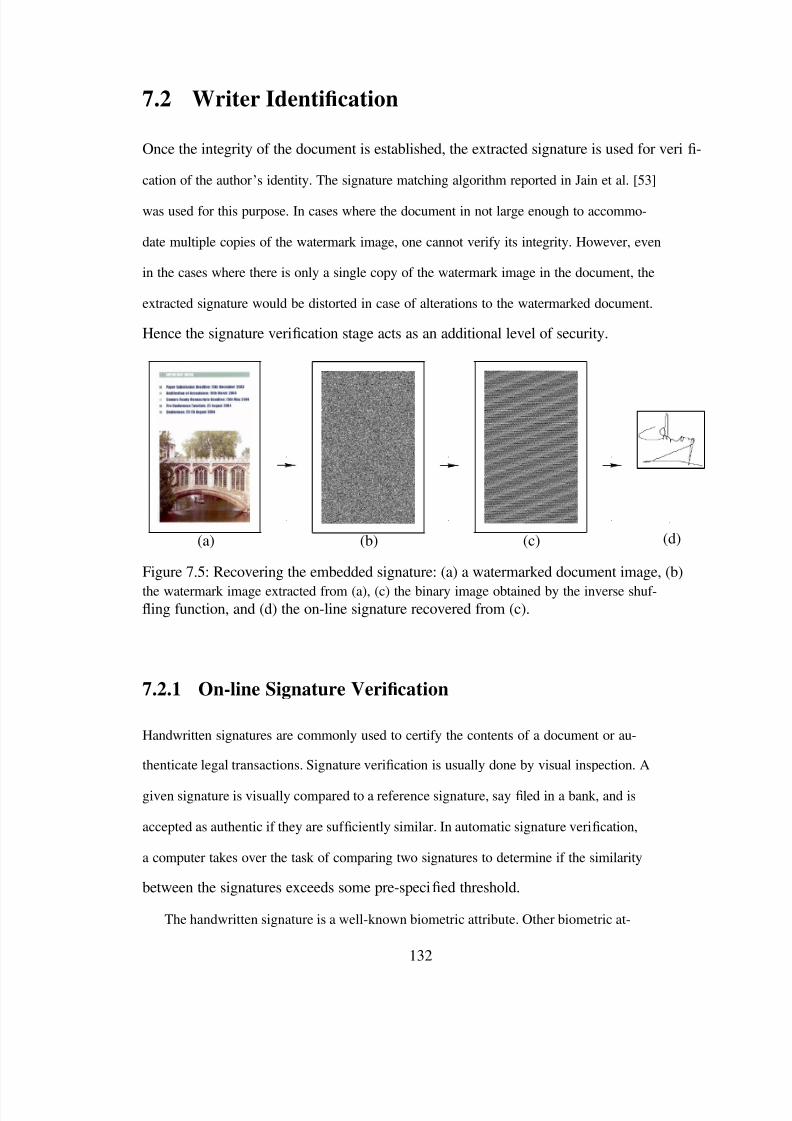
8/7/2019 Online HandWritten Document
http://slidepdf.com/reader/full/online-handwritten-document 158/191
7.2 Writer Identi cation
Once the integrity of the document is established, the extracted signature is used for veri -
cation of the author ‟s identity. The signature matching algorithm reported in Jain et al. [53]
was used for this purpose. In cases where the document in not large enough to accommo-
date multiple copies of the watermark image, one cannot verify its integrity. However, even
in the cases where there is only a single copy of the watermark image in the document, the
extracted signature would be distorted in case of alterations to the watermarked document.
Hence the signature veri cation stage acts as an additional level of security.
(a)
.
.
(b)
.
.
(c)
.
. .
(d)
Figure 7.5: Recovering the embedded signature: (a) a watermarked document image, (b)the watermark image extracted from (a), (c) the binary image obtained by the inverse shuf-ing function, and (d) the on-line signature recovered from (c).
7.2.1 On-line Signature Veri cation
Handwritten signatures are commonly used to certify the contents of a document or au-
thenticate legal transactions. Signature veri cation is usually done by visual inspection. A
given signature is visually compared to a reference signature, say led in a bank, and is
accepted as authentic if they are suf ciently similar. In automatic signature veri cation,
a computer takes over the task of comparing two signatures to determine if the similarity
between the signatures exceeds some pre-speci ed threshold.
The handwritten signature is a well-known biometric attribute. Other biometric at-
132
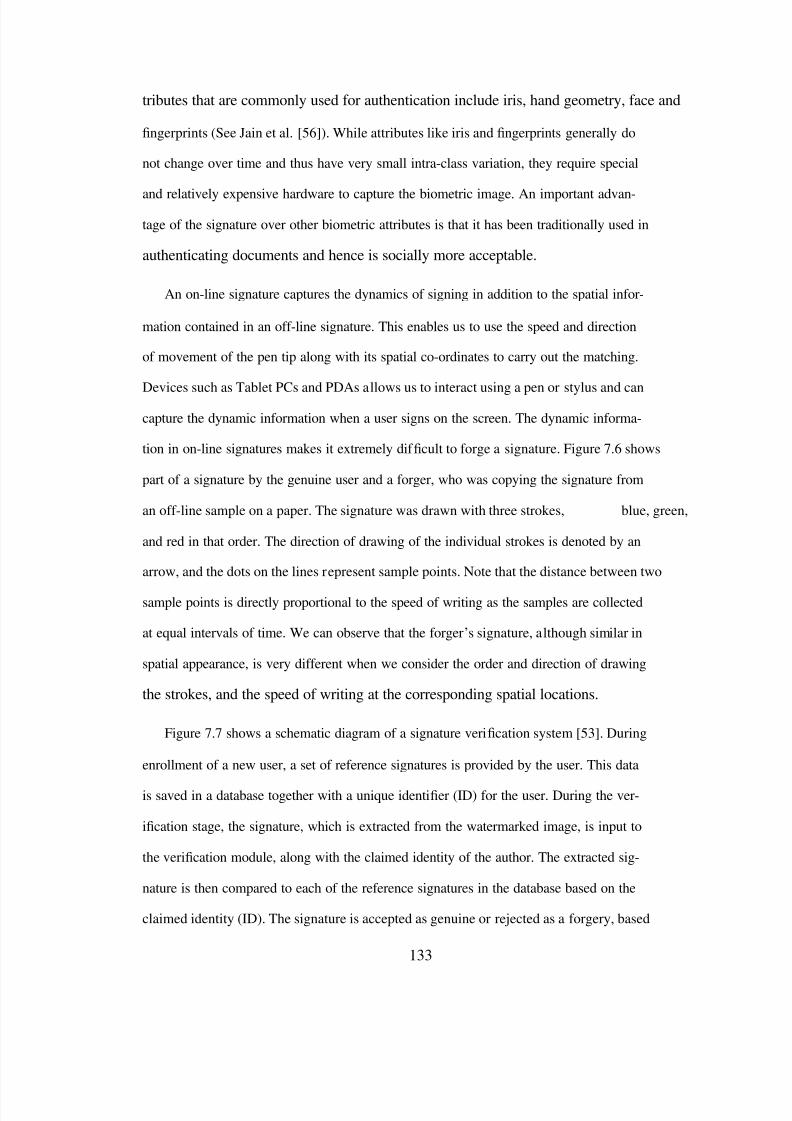
8/7/2019 Online HandWritten Document
http://slidepdf.com/reader/full/online-handwritten-document 159/191
tributes that are commonly used for authentication include iris, hand geometry, face and
ngerprints (See Jain et al. [56]). While attributes like iris and ngerprints generally do
not change over time and thus have very small intra-class variation, they require special
and relatively expensive hardware to capture the biometric image. An important advan-
tage of the signature over other biometric attributes is that it has been traditionally used in
authenticating documents and hence is socially more acceptable.
An on-line signature captures the dynamics of signing in addition to the spatial infor-
mation contained in an off-line signature. This enables us to use the speed and direction
of movement of the pen tip along with its spatial co-ordinates to carry out the matching.
Devices such as Tablet PCs and PDAs allows us to interact using a pen or stylus and cancapture the dynamic information when a user signs on the screen. The dynamic informa-
tion in on-line signatures makes it extremely dif cult to forge a signature. Figure 7.6 shows
part of a signature by the genuine user and a forger, who was copying the signature from
an off-line sample on a paper. The signature was drawn with three strokes, blue, green,
and red in that order. The direction of drawing of the individual strokes is denoted by an
arrow, and the dots on the lines represent sample points. Note that the distance between two
sample points is directly proportional to the speed of writing as the samples are collected
at equal intervals of time. We can observe that the forger ‟s signature, although similar in
spatial appearance, is very different when we consider the order and direction of drawing
the strokes, and the speed of writing at the corresponding spatial locations.
Figure 7.7 shows a schematic diagram of a signature veri cation system [53]. During
enrollment of a new user, a set of reference signatures is provided by the user. This data
is saved in a database together with a unique identi er (ID) for the user. During the ver-
ication stage, the signature, which is extracted from the watermarked image, is input to
the veri cation module, along with the claimed identity of the author. The extracted sig-
nature is then compared to each of the reference signatures in the database based on the
claimed identity (ID). The signature is accepted as genuine or rejected as a forgery, based
133
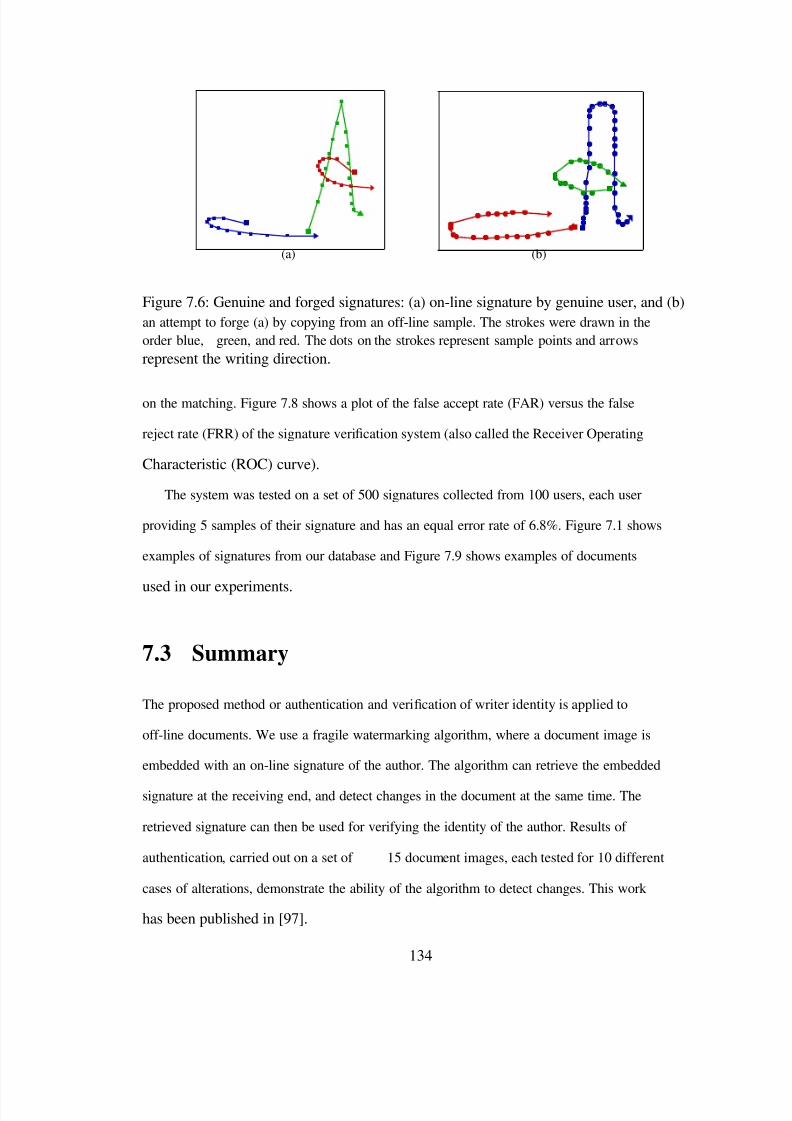
8/7/2019 Online HandWritten Document
http://slidepdf.com/reader/full/online-handwritten-document 160/191
(a) (b)
Figure 7.6: Genuine and forged signatures: (a) on-line signature by genuine user, and (b)an attempt to forge (a) by copying from an off-line sample. The strokes were drawn in theorder blue, green, and red. The dots on the strokes represent sample points and arrowsrepresent the writing direction.
on the matching. Figure 7.8 shows a plot of the false accept rate (FAR) versus the false
reject rate (FRR) of the signature veri cation system (also called the Receiver Operating
Characteristic (ROC) curve).
The system was tested on a set of 500 signatures collected from 100 users, each user
providing 5 samples of their signature and has an equal error rate of 6.8%. Figure 7.1 shows
examples of signatures from our database and Figure 7.9 shows examples of documents
used in our experiments.
7.3 Summary
The proposed method or authentication and veri cation of writer identity is applied to
off-line documents. We use a fragile watermarking algorithm, where a document image is
embedded with an on-line signature of the author. The algorithm can retrieve the embedded
signature at the receiving end, and detect changes in the document at the same time. The
retrieved signature can then be used for verifying the identity of the author. Results of
authentication, carried out on a set of 15 document images, each tested for 10 different
cases of alterations, demonstrate the ability of the algorithm to detect changes. This work
has been published in [97].
134
8/7/2019 Online HandWritten Document
http://slidepdf.com/reader/full/online-handwritten-document 161/191
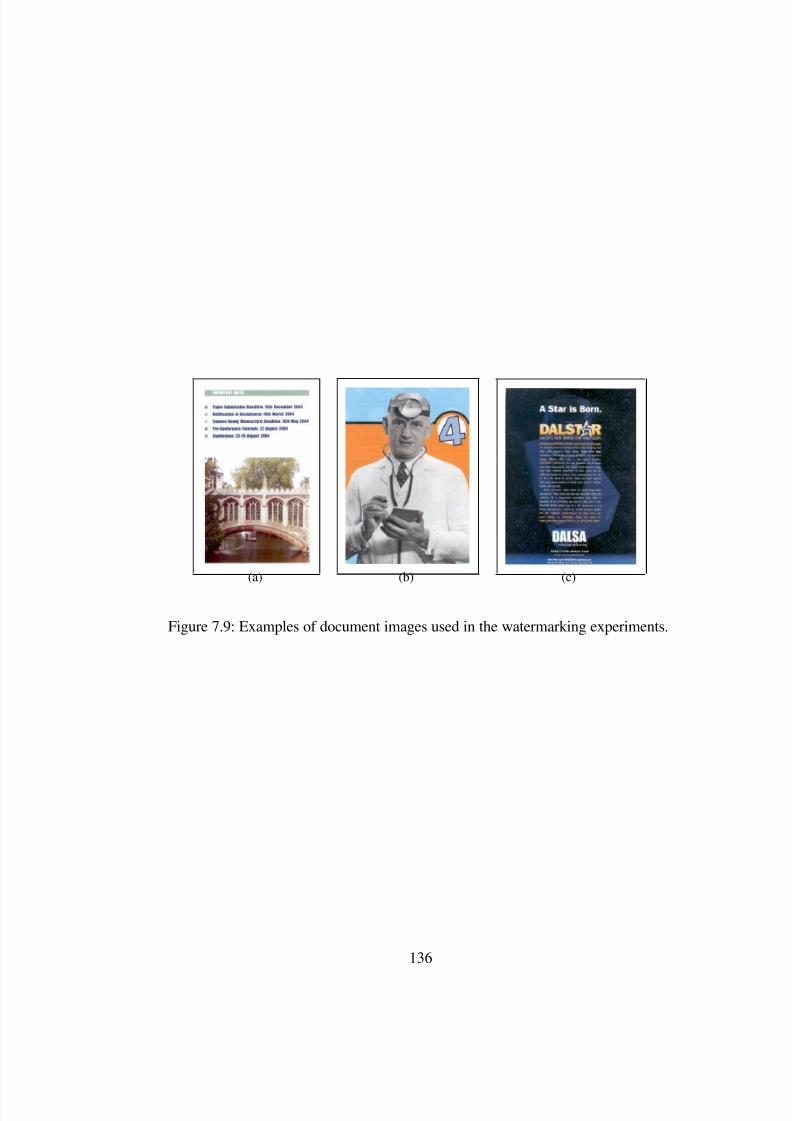
8/7/2019 Online HandWritten Document
http://slidepdf.com/reader/full/online-handwritten-document 162/191
(a) (b) (c)
Figure 7.9: Examples of document images used in the watermarking experiments.
136
8/7/2019 Online HandWritten Document
http://slidepdf.com/reader/full/online-handwritten-document 163/191

8/7/2019 Online HandWritten Document
http://slidepdf.com/reader/full/online-handwritten-document 164/191
the thesis and their interrelationship within the retrieval framework (reproduced from the
rst chapter). The salient parts of the work include:
User Interface
Chapter 1
Data Capture
Chapter 3
StrokeModelling
Chapter 4
Chapter 4
DocumentSegmentation
Chapter 5
TableDetection
Chapter 4
ScriptIdentification
Chapter 7
Document
Display
Query
Interface
DocumentStructure
Understanding
Chapter 6
Matching Words,
Sketches andStructure
Signaturebased
Water − marking
Document Database
Figure 8.1: A schematic diagram of the on-line document understanding and retrieval sys-tem proposed in this thesis.
• Representation of handwritten data : The thesis proposes a spline-based represen-
tation for handwritten data. The representation is based on the mechanics of the
handwriting process and can effectively approximate the handwritten strokes while
removing the noise introduced by the digitizing devices. Experiments on text and
non-text data from different digitizing devices show the generality of the representa-
tion. The average error of approximation at the data points was 1.6% of the stroke
size (height). A comparison of the distribution of the approximation error for the
model and the expected distribution of noise in the data, based on a noise model
derived from the digitization process, demonstrates the validity of the assumptions
138
8/7/2019 Online HandWritten Document
http://slidepdf.com/reader/full/online-handwritten-document 165/191
made while de ning the stroke model.
• Segmentation of handwritten documents : The problem of segmentation of uncon-
strained on-line handwritten documents, to the best of our knowledge, has not been
attempted before. We have proposed a segmentation algorithm based on the op-
timization of a compactness criterion de ned on the regions in a document. The
solution is based on a parsing technique using a stochastic context free grammar. We
also present an algorithm for the detection of ruled and unruled tables and sketches
within the regions identi ed by the segmentation process. The accuracy of segmen-
tation was 88.3% on a set of 154 regions, while the ruled table detection algorithm
achieved an accuracy of 84.8% on a test set of 105 tables and sketches.
• Identi cation of scripts in handwritten data : We have developed an algorithm for
identi cation of the script of on-line handwritten text. The algorithm classi es every
word in the input text into one of the following six scripts: Arabic, Cyrillic, Devna-
gari, Han, Hebrew, and Roman. We propose a set of features derived from the strokes
of a handwritten word for the purpose of script identi cation. The effectiveness of
the proposed features was tested using a variety of classi ers and also using a multi-
classi er approach. We achieved an average classi cation accuracy of 87.1% using
5-fold cross validation on a test set of 13, 379 words. The classi cation accuracy
increased to 95.5% when we used an entire text line, consisting of, on average, seven
words.
• Matching and retrieval of digital ink : The thesis proposes matching algorithms for in-
dexing and retrieval of on-line documents. The matching algorithms are recognition-
free and hence make few assumptions about the nature of the data. The segmentation
algorithm detects text regions and sketches that are used by the retrieval algorithm
to automatically apply the appropriate matching algorithm for the query. The word-
spotting algorithm achieves an overall accuracy of 92.3% at a recall rate of 90%
139
8/7/2019 Online HandWritten Document
http://slidepdf.com/reader/full/online-handwritten-document 166/191
averaged over a database containing 6, 672 words with an equal error rate of about
9%. The equal error rate of the sketch matching algorithm is 11.56%.
• Security issues in on-line documents : One of the fundamental obstacles of using
digital documents for legal purposes is the ability to manipulate them effortlessly
on a computer. We also present a solution to the problem of document integrity
veri cation and writer identi cation. An on-line signature of the author is used to
watermark digital documents (both on-line and off-line), which can be recovered and
used for authentication by the receiver of the document. The algorithm can detect
changes to a document image, which can be as small as 5 pixels (or 5 samples in the
case of on-line documents) with a probability of 97%.
8.2 Future Research
There are several promising directions to extend the work presented in this thesis:
• Improvements to the stroke representation : The spline based representation of the
stroke proposed in this work could be improved in several aspects. One could use
a limit on the speed of pen movement to detect spurious errors and reduce their
inuence on the spline tting process. However, computation of such a limit should
involve extensive experiments on the various handwriting styles, nature of data and
the digitizing hardware. In addition, one could also extend the representation in order
to model additional stroke properties such as pen pressure and tilt.
• Individuality of on-line handwritten data : A study of correlation between various
properties of the strokes could give valuable insights to the problem of writer iden-
tication. The spline-based representation could be used as the basis for computing
stroke properties.
140
8/7/2019 Online HandWritten Document
http://slidepdf.com/reader/full/online-handwritten-document 167/191
• Improvement to page segmentation : The page segmentation algorithm currently uses
a grammar that models text lines, paragraphs, and non-text regions. This subset
was chosen to include the most generic region types in any handwritten document.
One could extend the grammar to incorporate additional stroke and region types. A
more comprehensive grammar for the generation of handwritten documents is given
in Appendix A, which was developed in consultation with experts in handwriting
recognition in the Pen Computing Group at IBM T.J. Watson Research Center. One
has to de ne appropriate criterion functions that need to be optimized for any set of
grammar rules that are adopted, which is a non-trivial task. One could also create a
user interface that facilitates interactive updates of the segmentation by the user.
• Document genre identi cation : Another interesting direction of research is that of
document genre identi cation. The genre identi cation problem involves classifying
a given document into a set of genre classes (e.g., letters, articles, driving directions,
itemized lists, etc.). The problem involves de ning the appropriate set of document
genres and identifying or learning properties of each genre based on their structure
and content.
• Sketch matching in speci c domains : The matching of sketches could be improved
dramatically with certain assumptions about the nature of the sketch. For example,
the interesting parts of a sketch that need to match for the molecular structure of a
chemical would be different from that which is interesting in the case of a circuit
diagram.
• Retrieval using strokes as primitives : Since the basic primitives on on-line hand-
written data are strokes, one could model the retrieval framework with strokes as
primitives. Such a framework would model the generation of strokes in a document
and could do retrieval based on a representation of the strokes or a higher level un-
derstanding of the documents developed from the strokes. A related problem is the
141
8/7/2019 Online HandWritten Document
http://slidepdf.com/reader/full/online-handwritten-document 168/191
8/7/2019 Online HandWritten Document
http://slidepdf.com/reader/full/online-handwritten-document 169/191
APPENDICES
143
8/7/2019 Online HandWritten Document
http://slidepdf.com/reader/full/online-handwritten-document 170/191
Appendix A
Document Layout Description Rules
The grammar rules for segmentation of a generic handwritten document are given below.
The grammar was constructed by considering the commonly occurring structures in hand-
written documents. The grammar divides a document page into a set of regions, where
each region is one of the following types: (i) text, (ii) table, (iii) list, (iv) gure, or (v) void
(empty region). Each region could be decorated with an annotation that stands for a bullet
or underline or a cross-out (strike through line). In addition, the regions could be related
to each other by one of the following: a grouping (e.g., a box surrounding the regions), a
connection (e.g., an arrow from one region to another), or a separator (e.g., a line dividing
two regions). The grammar contains a total of 19 rules, which are divided into 3 primary
rules, 10 intermediate rules, and 6 primitive rules. The primary rules de ne the page as a set
of regions, while the intermediate rules de ne the components of each region type. The 6
primitive rules de ne the different stroke types that form the basis of the region de nitions.
144
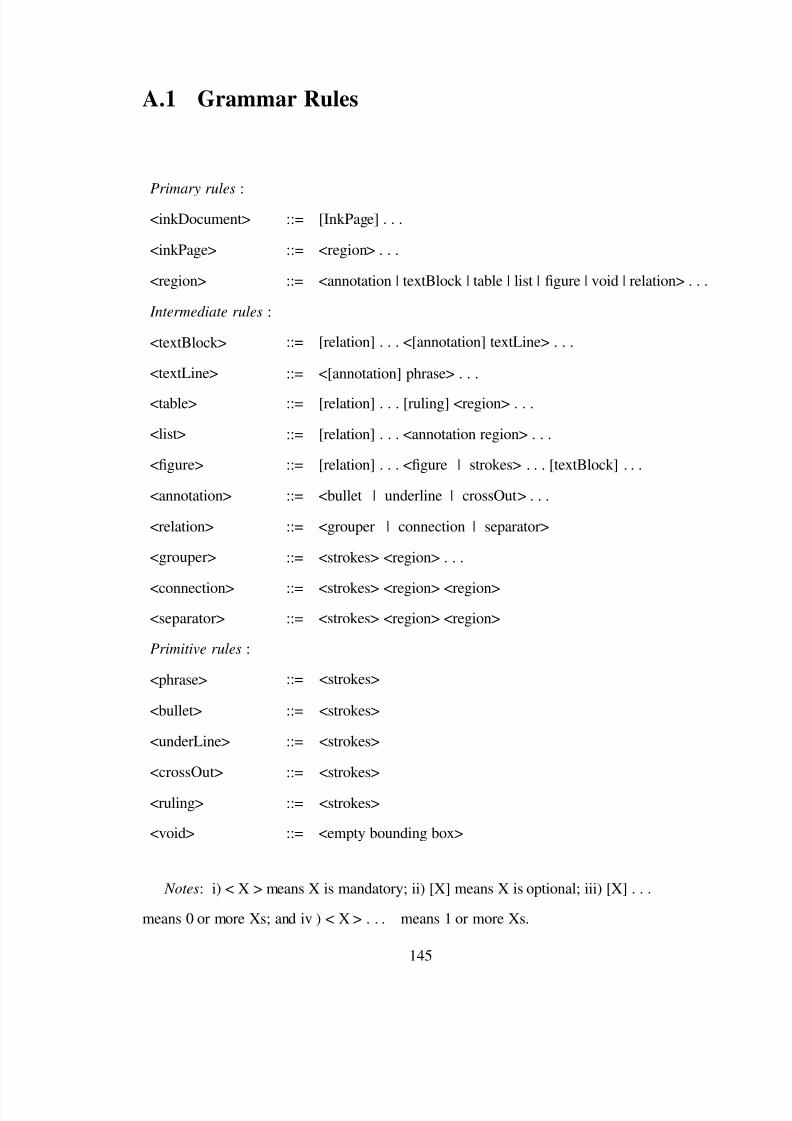
8/7/2019 Online HandWritten Document
http://slidepdf.com/reader/full/online-handwritten-document 171/191
A.1 Grammar Rules
Primary rules :<inkDocument>
<inkPage>
<region>
Intermediate rules :
<textBlock>
<textLine>
<table>
<list>
<gure>
<annotation>
<relation>
<grouper>
<connection>
<separator>
Primitive rules :
<phrase>
<bullet>
<underLine>
<crossOut>
<ruling>
<void>
::= [InkPage] . . .
::= <region> . . .
::= <annotation | textBlock | table | list | gure | void | relation> . . .
::= [relation] . . . <[annotation] textLine> . . .
::= <[annotation] phrase> . . .
::= [relation] . . . [ruling] <region> . . .
::= [relation] . . . <annotation region> . . .
::= [relation] . . . < gure | strokes> . . . [textBlock] . . .
::= <bullet | underline | crossOut> . . .
::= <grouper | connection | separator>
::= <strokes> <region> . . .
::= <strokes> <region> <region>
::= <strokes> <region> <region>
::= <strokes>
::= <strokes>
::= <strokes>
::= <strokes>
::= <strokes>
::= <empty bounding box>
Notes : i) < X > means X is mandatory; ii) [X] means X is optional; iii) [X] . . .
means 0 or more Xs; and iv ) < X > . . . means 1 or more Xs.
145
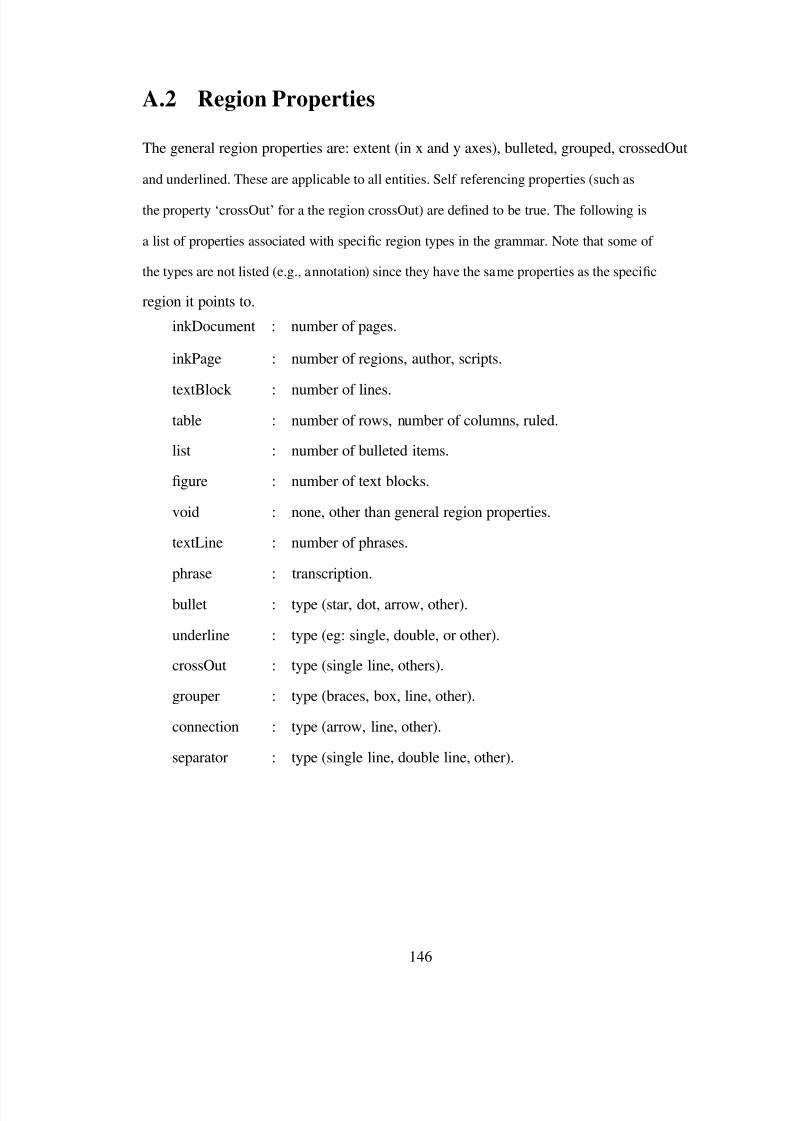
8/7/2019 Online HandWritten Document
http://slidepdf.com/reader/full/online-handwritten-document 172/191
A.2 Region Properties
The general region properties are: extent (in x and y axes), bulleted, grouped, crossedOut
and underlined. These are applicable to all entities. Self referencing properties (such as
the property „crossOut ‟for a the region crossOut) are de ned to be true. The following is
a list of properties associated with speci c region types in the grammar. Note that some of
the types are not listed (e.g., annotation) since they have the same properties as the speci c
region it points to.
inkDocument : number of pages.
inkPage
textBlock table
list
gure
void
textLine
phrase
bullet
underline
crossOut
grouper
connection
separator
: number of regions, author, scripts.
: number of lines.: number of rows, number of columns, ruled.
: number of bulleted items.
: number of text blocks.
: none, other than general region properties.
: number of phrases.
: transcription.
: type (star, dot, arrow, other).
: type (eg: single, double, or other).
: type (single line, others).
: type (braces, box, line, other).
: type (arrow, line, other).
: type (single line, double line, other).
146
8/7/2019 Online HandWritten Document
http://slidepdf.com/reader/full/online-handwritten-document 173/191
Appendix B
Sample Documents from Database
This section provides some examples of the documents used in the various experiments
reported in this thesis. A brief description of the gures is given below.
Figure B.1 shows examples of documents used in testing the document structure anal-
ysis work.
Figures B.2 and B.3 provide examples of the documents used for the script classi -
cation work. The scripts are: B.2(a): Arabic, B.2(b): Hebrew, B.2(c): Cyrillic, B.2(d):
Han, B.3(a): Devnagari, and B.3(b): Roman. Figures B.3(c) and B.3(d) show samples of multilingual pages containing both Han and Roman scripts.
Figure B.4 shows examples of documents used for word-spotting-based indexing and
retrieval.
147
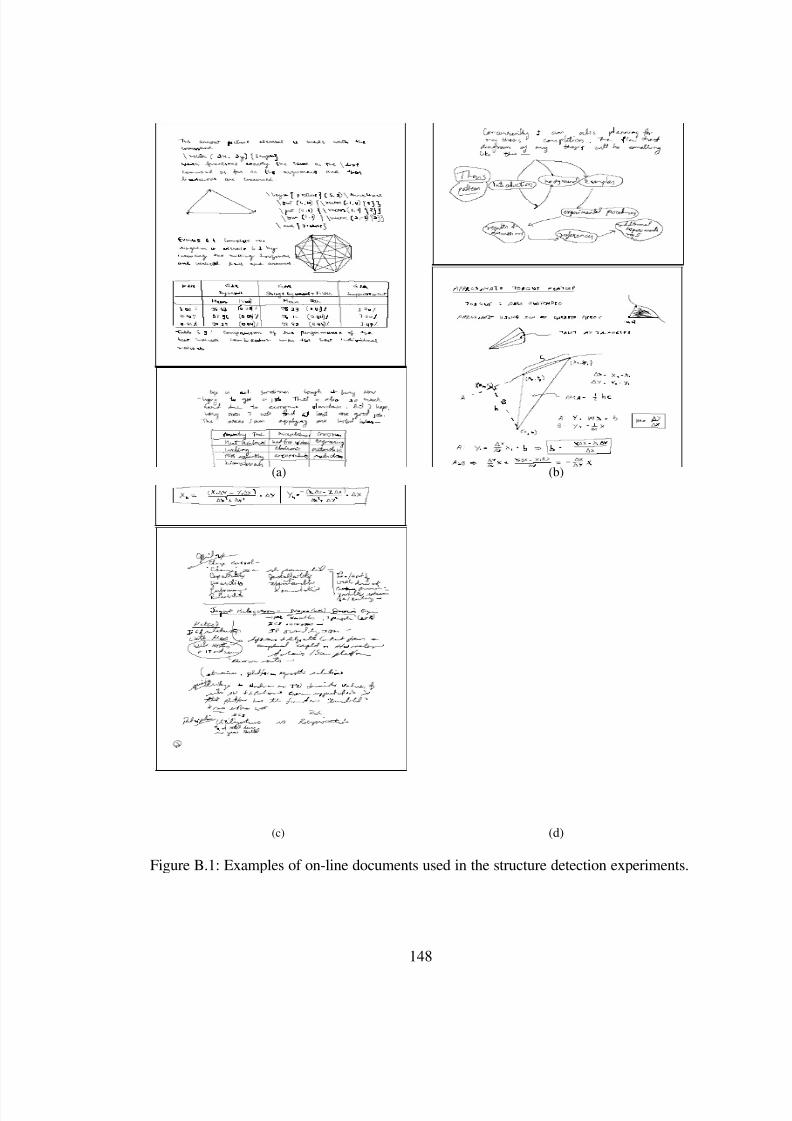
8/7/2019 Online HandWritten Document
http://slidepdf.com/reader/full/online-handwritten-document 174/191
(a)
(c)
(b)
(d)
Figure B.1: Examples of on-line documents used in the structure detection experiments.
148
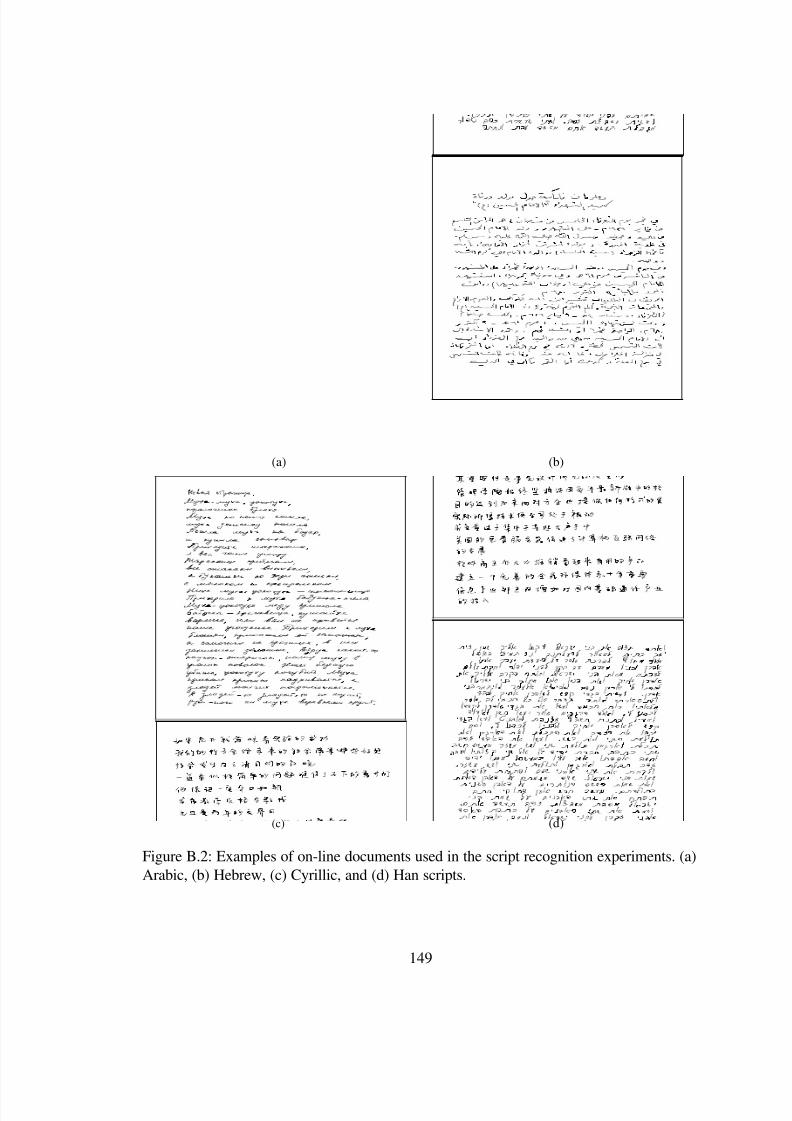
8/7/2019 Online HandWritten Document
http://slidepdf.com/reader/full/online-handwritten-document 175/191
(a)
(c)
(b)
(d)
Figure B.2: Examples of on-line documents used in the script recognition experiments. (a)Arabic, (b) Hebrew, (c) Cyrillic, and (d) Han scripts.
149
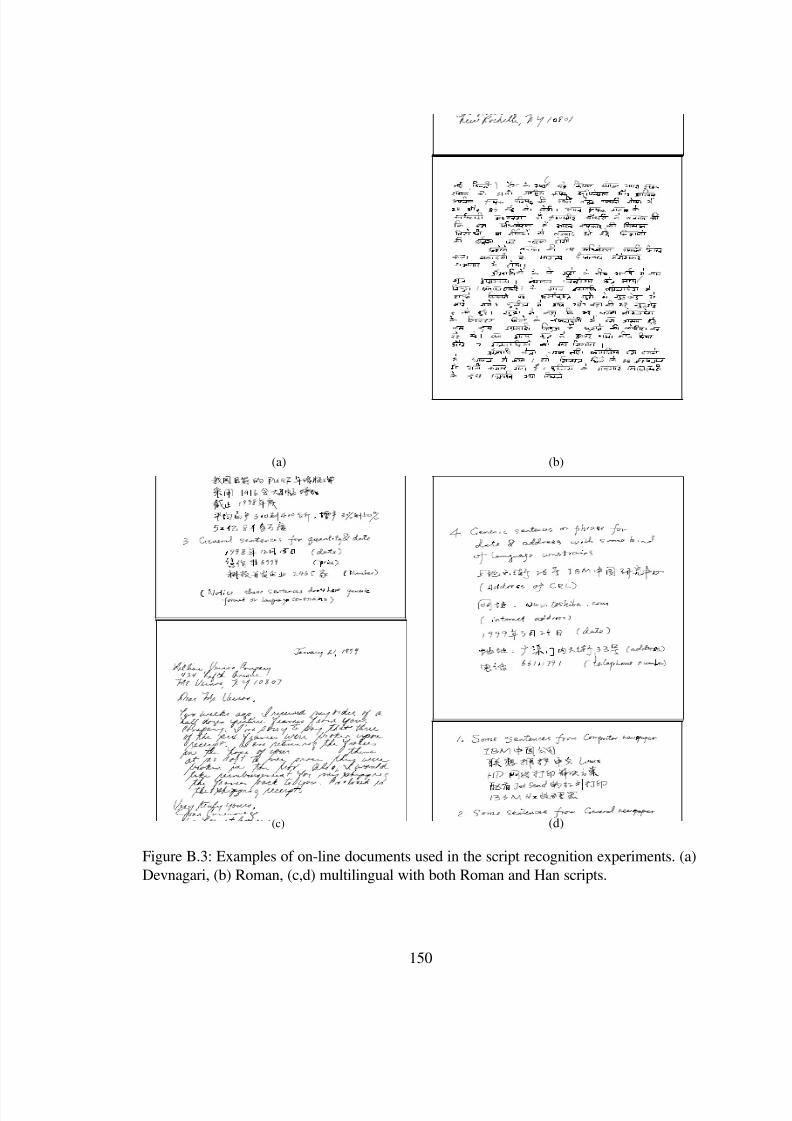
8/7/2019 Online HandWritten Document
http://slidepdf.com/reader/full/online-handwritten-document 176/191
(a)
(c)
(b)
(d)
Figure B.3: Examples of on-line documents used in the script recognition experiments. (a)Devnagari, (b) Roman, (c,d) multilingual with both Roman and Han scripts.
150
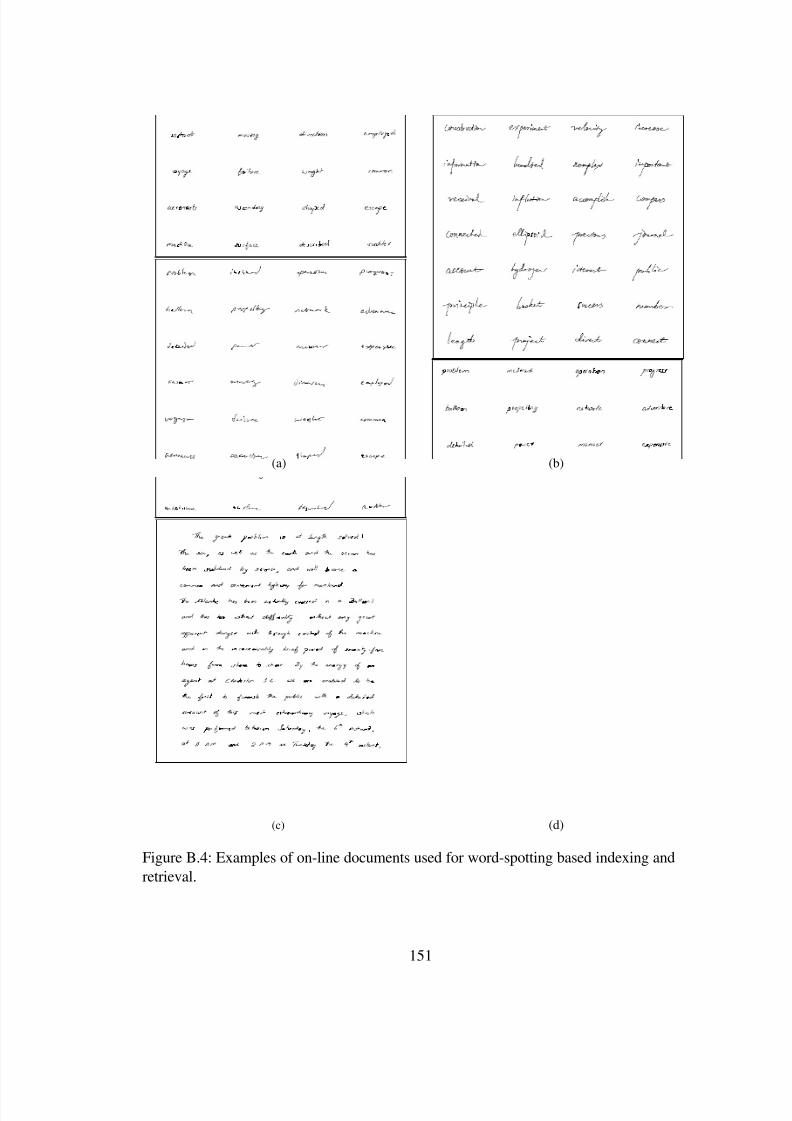
8/7/2019 Online HandWritten Document
http://slidepdf.com/reader/full/online-handwritten-document 177/191

8/7/2019 Online HandWritten Document
http://slidepdf.com/reader/full/online-handwritten-document 178/191
B IBLIOGRAPHY
152
8/7/2019 Online HandWritten Document
http://slidepdf.com/reader/full/online-handwritten-document 179/191
8/7/2019 Online HandWritten Document
http://slidepdf.com/reader/full/online-handwritten-document 180/191
[11] Chad Carson, Megan Thomas, Serge Belongie, Joseph M. Hellerstein, and JitendraMalik. Blobworld: A system for region-based image indexing and retrieval. In Pro- ceedings of the 3rdInternational Conference on Visual Information Systems , volume1614, pages 509 – 516, Amsterdam, The Netherlands, June 1999. Springer.
[12] R. Cattoni, T. Coianiz, S. Messelodi, and C. M. Modena. Geomet-ric layout analysis techniques for document image understanding: A review.citeseer.nj.nec.com/cattoni98geometric.html, 2004.
[13] CDLI. The Cuneiform Digital Library Initiative. http://cdli.ucla.edu/, 2004.
[14] K. F. Chan and D. Y. Yeung. Mathematical expression recognition: A survey. Inter- national Journal on Document Analysis and Recognition , 3(1):3 – 15, 2000.
[15] Kam-Fai Chan and Dit-Yan Yueng. An ef cient syntactic approach to structuralanalysis of online handwritten mathematical expressions. Pattern Recognition ,33(3):375 – 384, March 2000.
[16] Hao Chen, Oscar E. Agazzi, and Ching Y. Suen. Piecewise linear modulation modelof handwriting. In Proceedings of the 4 thInternational Conference on Document Analysis and Recognition , pages 363 – 367, Ulm, Germany, August 1997.
[17] Hui Cheng, Charles A. Bouman, and Jan P. Allebach. Multiscale document seg-mentation. In Proceedings of the IS&T 50 thAnnual Conference , pages 417 – 425,Cambridge, MA, May 1997.
[18] P.A. Chou and G.E. Kopec. A stochastic attribute grammar model of documentproduction and its use in document recognition. In Proceedings of the First Interna- tional Workshop on Principles of Document Processing , Washington, DC, October1992.
[19] M. Clowes. A generative picture grammar. In Proceedings of Computing Research Section , Melbourne, Australia, 1967. Commonwealth Scienti c and Industrial Re-search Organization.
[20] Scott D. Connell, R. M. K. Sinha, and Anil K. Jain. Recognition of unconstrainedon-line devanagari characters. In Proceedings of the 15 thInternational Conference on Pattern Recognition , volume 2, pages 368 – 371, Barcelona, Spain, September2000.
[21] Florian Coulmas. The Blackwell Encyclopedia of Writing Systems . Blackwell Pub-lishers, Malden, Massachusetts, 1999.
[22] Nello Cristianini and John Shawe-Taylor. An Introduction to Support Vector Ma- chines . Cambridge University Press, Cambridge, UK, March 2000.
[23] H. B. Curry and Isaac J. Schoenberg. On PLYA frequency functions IV: The fun-damental spline functions and their limits. Journal d ’ Analyse Math. , 17:71 – 107,1966.
154
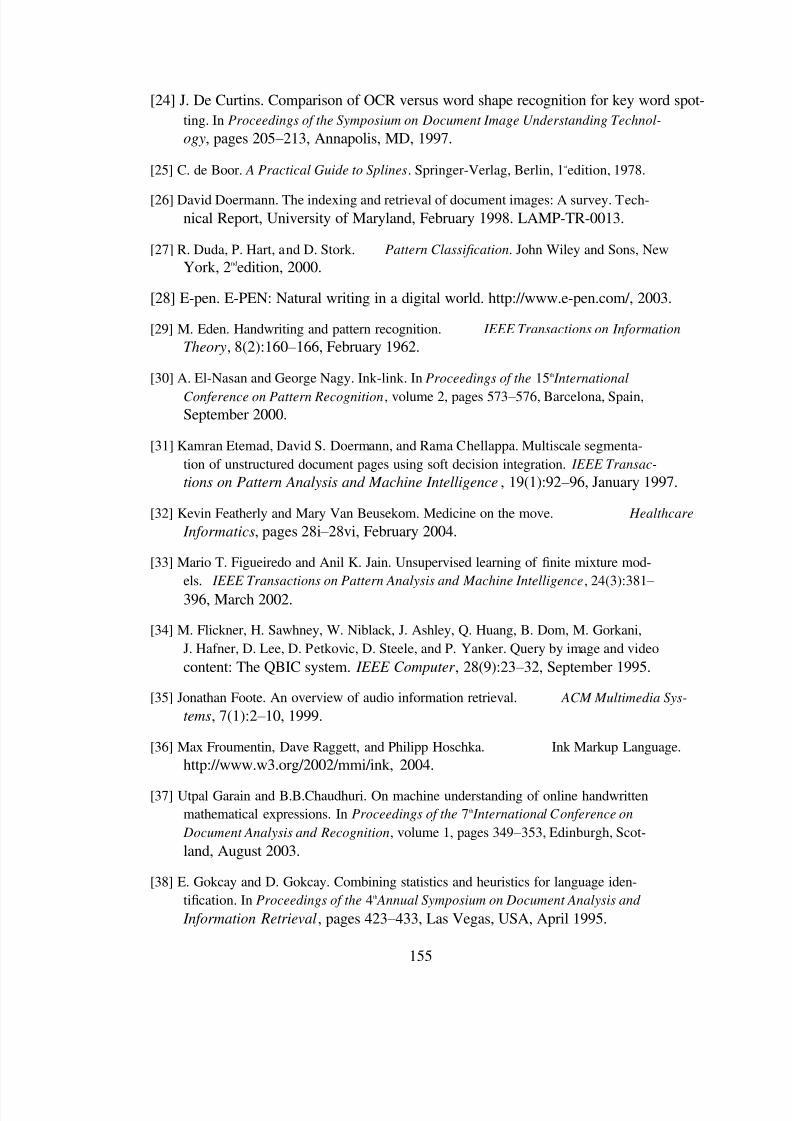
8/7/2019 Online HandWritten Document
http://slidepdf.com/reader/full/online-handwritten-document 181/191
[24] J. De Curtins. Comparison of OCR versus word shape recognition for key word spot-ting. In Proceedings of the Symposium on Document Image Understanding Technol- ogy , pages 205 – 213, Annapolis, MD, 1997.
[25] C. de Boor. A Practical Guide to Splines . Springer-Verlag, Berlin, 1 stedition, 1978.
[26] David Doermann. The indexing and retrieval of document images: A survey. Tech-nical Report, University of Maryland, February 1998. LAMP-TR-0013.
[27] R. Duda, P. Hart, and D. Stork. Pattern Classi cation . John Wiley and Sons, NewYork, 2 ndedition, 2000.
[28] E-pen. E-PEN: Natural writing in a digital world. http://www.e-pen.com/, 2003.
[29] M. Eden. Handwriting and pattern recognition. IEEE Transactions on Information Theory , 8(2):160 – 166, February 1962.
[30] A. El-Nasan and George Nagy. Ink-link. In Proceedings of the 15 thInternational Conference on Pattern Recognition , volume 2, pages 573 – 576, Barcelona, Spain,September 2000.
[31] Kamran Etemad, David S. Doermann, and Rama Chellappa. Multiscale segmenta-tion of unstructured document pages using soft decision integration. IEEE Transac- tions on Pattern Analysis and Machine Intelligence , 19(1):92 – 96, January 1997.
[32] Kevin Featherly and Mary Van Beusekom. Medicine on the move. Healthcare Informatics , pages 28i – 28vi, February 2004.
[33] Mario T. Figueiredo and Anil K. Jain. Unsupervised learning of nite mixture mod-els. IEEE Transactions on Pattern Analysis and Machine Intelligence , 24(3):381 – 396, March 2002.
[34] M. Flickner, H. Sawhney, W. Niblack, J. Ashley, Q. Huang, B. Dom, M. Gorkani,J. Hafner, D. Lee, D. Petkovic, D. Steele, and P. Yanker. Query by image and videocontent: The QBIC system. IEEE Computer , 28(9):23 – 32, September 1995.
[35] Jonathan Foote. An overview of audio information retrieval. ACM Multimedia Sys- tems , 7(1):2 – 10, 1999.
[36] Max Froumentin, Dave Raggett, and Philipp Hoschka. Ink Markup Language.http://www.w3.org/2002/mmi/ink, 2004.
[37] Utpal Garain and B.B.Chaudhuri. On machine understanding of online handwrittenmathematical expressions. In Proceedings of the 7 thInternational Conference on Document Analysis and Recognition , volume 1, pages 349 – 353, Edinburgh, Scot-land, August 2003.
[38] E. Gokcay and D. Gokcay. Combining statistics and heuristics for language iden-tication. In Proceedings of the 4 thAnnual Symposium on Document Analysis and Information Retrieval , pages 423 – 433, Las Vegas, USA, April 1995.
155
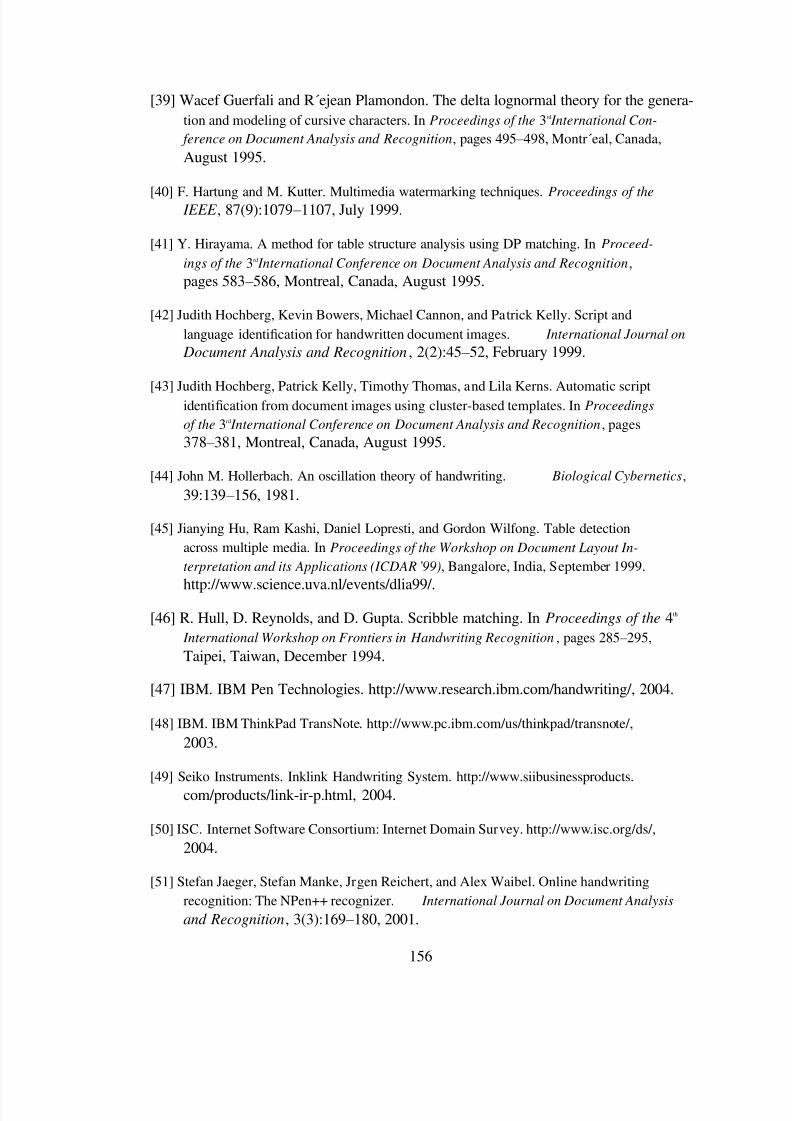
8/7/2019 Online HandWritten Document
http://slidepdf.com/reader/full/online-handwritten-document 182/191
[39] Wacef Guerfali and R´ejean Plamondon. The delta lognormal theory for the genera-tion and modeling of cursive characters. In Proceedings of the 3 rdInternational Con- ference on Document Analysis and Recognition , pages 495 – 498, Montr´eal, Canada,August 1995.
[40] F. Hartung and M. Kutter. Multimedia watermarking techniques. Proceedings of the IEEE , 87(9):1079 – 1107, July 1999.
[41] Y. Hirayama. A method for table structure analysis using DP matching. In Proceed- ings of the 3 rdInternational Conference on Document Analysis and Recognition ,pages 583 – 586, Montreal, Canada, August 1995.
[42] Judith Hochberg, Kevin Bowers, Michael Cannon, and Patrick Kelly. Script andlanguage identi cation for handwritten document images. International Journal on Document Analysis and Recognition , 2(2):45 – 52, February 1999.
[43] Judith Hochberg, Patrick Kelly, Timothy Thomas, and Lila Kerns. Automatic scriptidenti cation from document images using cluster-based templates. In Proceedings of the 3rdInternational Conference on Document Analysis and Recognition , pages378 – 381, Montreal, Canada, August 1995.
[44] John M. Hollerbach. An oscillation theory of handwriting. Biological Cybernetics ,39:139 – 156, 1981.
[45] Jianying Hu, Ram Kashi, Daniel Lopresti, and Gordon Wilfong. Table detectionacross multiple media. In Proceedings of the Workshop on Document Layout In- terpretation and its Applications (ICDAR ’ 99) , Bangalore, India, September 1999.
http://www.science.uva.nl/events/dlia99/.
[46] R. Hull, D. Reynolds, and D. Gupta. Scribble matching. In Proceedings of the 4th International Workshop on Frontiers in Handwriting Recognition , pages 285 – 295,Taipei, Taiwan, December 1994.
[47] IBM. IBM Pen Technologies. http://www.research.ibm.com/handwriting/, 2004.
[48] IBM. IBM ThinkPad TransNote. http://www.pc.ibm.com/us/thinkpad/transnote/,2003.
[49] Seiko Instruments. Inklink Handwriting System. http://www.siibusinessproducts.com/products/link-ir-p.html, 2004.
[50] ISC. Internet Software Consortium: Internet Domain Survey. http://www.isc.org/ds/,2004.
[51] Stefan Jaeger, Stefan Manke, Jrgen Reichert, and Alex Waibel. Online handwritingrecognition: The NPen++ recognizer. International Journal on Document Analysis and Recognition , 3(3):169 – 180, 2001.
156
8/7/2019 Online HandWritten Document
http://slidepdf.com/reader/full/online-handwritten-document 183/191
[52] Anil K. Jain and Sushil K. Bhattacharjee. Text segmentation using Gabor ltersfor automatic document processing. Machine Vision and Applications , 5:169 – 184,1992.
[53] Anil K. Jain, Friederike D. Griess, and Scott D. Connell. On-line signature veri ca-
tion. Pattern Recognition , 35(12):2963 – 2972, December 2002.
[54] Anil K. Jain and Anoop M. Namboodiri. Indexing and retrieval of on-line handwrit-ten documents. In Proceedings of the 7 thInternational Conference on Document Analysis and Recognition , volume 2, pages 655 – 659, Edinburgh, Scotland, August2003.
[55] Anil K. Jain, Anoop M. Namboodiri, and Jayashree Subrahmonia. Structure in on-line documents. In Proceedings of the 6 thInternational Conference on Document Analysis and Recognition , pages 844 – 848, Seattle, Washington, September 2001.
[56] Anil K. Jain, S. Pankanti, and R. Bolle (eds.). BIOMETRICS: Personal Identi cation in Networked Society . Kluwer, 1999.
[57] Anil K. Jain, Umut Uludag, and Rein-Lein Hsu. Hinding a face in a ngerprintimage. In Proceedings of the 16 thInternational Conference on Pattern Recognition ,volume 3, pages 756 – 759, Quebec City, Canada, August 2002.
[58] Anil K. Jain and Bin Yu. Document representation and its application to page de-composition. IEEE Transactions on Pattern Analysis and Machine Intelligence ,20(3):294 – 308, March 1998.
[59] Anil K. Jain and Y. Zhong. Page segmentation using texture analysis. Pattern Recog- nition , 29(5):743 – 770, May 1996.
[60] Anil K. Jain, Yu Zhong, and Sridhar Lakshmanan. Object matching using de-formable templates. IEEE Transactions on Pattern Analysis and Machine Intelli- gence , 18(3):267 – 278, March 1996.
[61] Anil K. Jain and D. Zongker. Feature-selection: Evaluation, application, and smallsample performance. IEEE Transactions on Pattern Analysis and Machine Intelli- gence , 19(2):153 – 158, 1997.
[62] Rob Jarrett and Philip Su. Building Tablet PC Applications . Microsoft Press, Red-mond, WA, 2002.
[63] Hans Jensen. Sign, Symbol and Script: An Account of Man ’ s Effort to Write . GeorgeAllen and Unwin, London, 3 rdedition, 1970.
[64] Daniel Jurafsky and James H. Martin. Speech and Language Processing: An In- troduction to Natural Language Processing . Computational Linguistics and SpeechRecognition. Prentice-Hall, New Jersey, 2000.
157
8/7/2019 Online HandWritten Document
http://slidepdf.com/reader/full/online-handwritten-document 184/191
8/7/2019 Online HandWritten Document
http://slidepdf.com/reader/full/online-handwritten-document 185/191
8/7/2019 Online HandWritten Document
http://slidepdf.com/reader/full/online-handwritten-document 186/191
8/7/2019 Online HandWritten Document
http://slidepdf.com/reader/full/online-handwritten-document 187/191
[107] Theo Pavlidis. Page segmentation by white streams. In Proceedings of the 1stIn- ternational Conference on Document Analysis and Recognition , pages 945 – 953, St.Malo, France, September 1991.
[108] G S. Peake and T N. Tan. Script and language identi cation from document images.In Proceedings of the 3 rdAsian Conference on Computer Vision , pages 96 – 104,Hong Kong, China, January 1998.
[109] Pen2Net. Compupen. http://www.compupen.com/Compupen/compupen.html,2004.
[110] I. Percival and F. Vivaldi. Arithmetical properties of strongly chaotic systems. Phys- ica , 25D:105 – 130, 1987.
[111] F. A. P. Petitcolas, R. J. Anderson, and M. G. Kuhn. Information hiding - A survey.Proceedings of the IEEE , 87(9):1062 – 1078, July 1999.
[112] Rejean Plamondon. A kinematic theory of rapid human movements: Part I: Move-ment representation and generation. Biological Cybernetics , 72(4):295 – 307, 1995.
[113] Rejean Plamondon. A kinematic theory of rapid human movements: Part II: Move-ment time and control. Biological Cybernetics , 72(4):309 – 320, 1995.
[114] Rejean Plamondon. A kinematic theory of rapid human movements: Part III: Kineticoutcomes. Biological Cybernetics , 78(2):133 – 145, 1998.
[115] Rejean Plamondon, R. Feng, and A. Woch. A kinematic theory of rapid humanmovements: Part IV: A formal mathematical proof and new insights. Biological Cybernetics , 89(2):126 – 138, 2003.
[116] Rjean Plamondon and Sargur N. Srihari. On-line and off-line handwriting recogni-tion: A comprehensive survey. IEEE Transactions on Pattern Analysis and Machine Intelligence , 22(1):63 – 84, 2000.
[117] Y. Pu and Z. Shi. A natural learning algorithm based on Hough transform for textlines extraction in handwritten documents. In Proceedings of the 6 thInternational Workshop on Frontiers in Handwriting Recognition , pages 637 – 646, Taejon, Korea,August 1998.
[118] D. Blostein R. Zanibbi and J.R. Cordy. A survey of table recognition: Models,observations, transformations and inferences. International Journal on Document
Analysis and Recognition , 7(1), 2004.
[119] M. Armon Rahgozar and Robert Cooperman. Graph-based table recognition system.In Luc M. Vincent and Jonathan J. Hull, editors, Proceedings of SPIE Vol. 2660, Document Recognition III , pages 192 – 203, San Jose, CA, January 1996.
[120] T. M. Rath and R. Manmatha. Word image matching using dynamic time warping. InProceedings of the IEEE Conference on Computer Vision and Pattern Recognition ,volume 2, pages 521 – 527, Madison, WI, June 2003.
161
8/7/2019 Online HandWritten Document
http://slidepdf.com/reader/full/online-handwritten-document 188/191
8/7/2019 Online HandWritten Document
http://slidepdf.com/reader/full/online-handwritten-document 189/191
[136] Bruno Simard, Birendra Prasada, and R. M. K. Sinha. On-line character recognitionusing hand-writing modelling. Pattern Recognition , 26(7):993 – 1007, 1993.
[137] Y. Singer and N. Tishby. Dynamical encoding of cursive handwriting. Biological Cybernetics , 71(3):227 – 237, 1994.
[138] R. M. K. Sinha. PLANG - A picture language schema for a class of pictures. Pattern Recognition , 16:373 – 383, 1983.
[139] SmartTech. SMART Technologies Inc. Homepage. http://www.smarttech.com/,2004.
[140] Arnold W. M. Smeulders, Marcel Worring, Simone Santini, Amarnath Gupta, andRamesh Jain. Content-based image retrieval at the end of the early years. IEEE Transactions on Pattern Analysis and Machine Intelligence , 22(12):1349 – 1380, De-cember 2000.
[141] A. L. Spitz. Determination of the script and language content of document images.IEEE Transactions on Pattern Analysis and Machine Intelligence , 19(3):235 – 245,March 1997.
[142] Birgit Stehno and Gregor Retti. Modelling the logical structure of books and jour-nals using augmented transition network grammars. Journal of Documentation ,59(1):69 – 83, January 2003.
[143] Jayashree Subrahmonia. Pen computing: Challenges and applications. In Proceed- ings of the 15 thInternational Conference on Pattern Recognition , volume 2, pages
60– 66, Barcelona, Spain, September 2000.
[144] Jayashree Subrahmonia, K. Nathan, and Michael Perrone. Writer dependent recog-nition of on-line unconstrained handwriting. In Proceedings of the IEEE Interna- tional Conference on Acoustics, Speech and Signal Processing , pages 3478 – 3481,Atlanta, GA, May 1996.
[145] C. Y. Suen, S. Bergler, N. Nobile, B. Waked, C. P. Nadal, and A. Bloch. Categorizingdocument images into script and language classes. In Proceedings of the Interna- tional Conference on Advances in Pattern Recognition , pages 297 – 306, Plymouth,UK, November 1998.
[146] C. L. Tan, P Y. Leong, and S. He. Language identi cation in multilingual docu-ments. In Proceedings of the International Symposium on Intelligent Multimedia and Distance Education , pages 59 – 64, Baden-Baden, Germany, August 1999.
[147] T. N. Tan. Rotation invariant texture features and their use in automatic scriptidenti cation. IEEE Transactions on Pattern Analysis and Machine Intelligence ,20(7):751 – 756, July 1998.
163
8/7/2019 Online HandWritten Document
http://slidepdf.com/reader/full/online-handwritten-document 190/191
[148] Taku A. Tokuyasu and Philip A. Chou. An iterative decoding approach to doc-ument image analysis. In Proceedings of the Workshop on Document Layout In- terpretation and its Applications (ICDAR ’ 99) , Bangalore, India, September 1999.http://www.science.uva.nl/events/dlia99/.
[149] C. I. Tomai, B. Zhang, and Venu Govindaraju. Transcript mapping for historichandwritten document images. In Proceedings of the 8 thInternational Workshop on Frontiers in Handwriting Recognition , pages 413 – 418, Ontario, Canada, August2002.
[150] TREC. Text REtrieval Conference (TREC). http://trec.nist.gov/, 2004.
[151] UDL. The Universal Library. http://www.ul.cs.cmu.edu/, 2004.
[152] Remco C. Veltkamp and Mirela Tanase. Content-based image retrieval systems: Asurvey. Technical report, Department of Computing Science, Utrecht University,UU-CS-2000-34, October 2000. UU-CS-2000-34.
[153] Christopher Verplaetse. Can a pen remember what it has written us-ing inertial navigation? an evaluation of current accelerometer technology.http://xenia.media.mit.edu/ verp/projects/smartpen/, 2004.
[154] G. Voyatzis and I. Pitas. Chaotic mixing of digital images and applications to water-marking. In Proceedings of the European Conference on Multimedia Applications Services and Techniques , volume 2, pages 687 – 695, Louvain-La-Neuve, Belgium,May 1996.
[155] Wacom. Wacom products. http://www.wacom.com/productinfo/, 2004.
[156] T. Wakahara, H. Murase, and K. Odaka. On-line handwriting recognition. Proceed- ings of the IEEE , 80(7):1181 – 1194, July 1992.
[157] Dacheng Wang and Sargur N. Srihari. Classi cation of newspaper image blocks us-ing texture analysis. Computer Vision Graphics, and Image Processing , 47(3):327 – 352, September 1989.
[158] Jia-Ping Wang. Stochastic relaxation on partitions with connected components andits application to image segmentation. IEEE Transactions on Pattern Analysis and Machine Intelligence , 20(6):619 – 636, June 1998.
[159] Min Wu and Bede Liu. Multimedia Data Hiding . Springer-Verlag, New York, NY,
2002.
[160] Minerva M. Yeung and F. C. Mintzer. Invisible watermarking for image veri cation.In Proceedings of the International Conference on Image Processing , volume 2,pages 680 – 683, Washington, DC, October 1997.
[161] Minerva M. Yeung and Sharath Pankanti. Veri cation watermarks on ngerprintrecognition and retrieval. Journal of Electronic Imaging , 9(4):468 – 476, October2000.
164

8/7/2019 Online HandWritten Document
http://slidepdf.com/reader/full/online-handwritten-document 191/191
[162] Bin Yu and Anil K. Jain. A robust and fast skew detection algorithm for genericdocuments. Pattern Recognition , 29(10):1599 – 1630, October 1996.
[163] Yu Zhong, Kalle Karu, and Anil K. Jain. Locating text in complex color images.Pattern Recognition , 28(10):1523 – 1535, October 1995.