ontogeny of glucocorticoid receptor and 11 -hydroxysteroid
TRANSCRIPT

Ontogeny of glucocorticoid receptor and 11�-hydroxysteroiddehydrogenase type-1 gene expression identifies potential criticalperiods of glucocorticoid susceptibility during development
H J L Speirs, J R Seckl and R W BrownMolecular Medicine Centre, Western General Hospital, Edinburgh EH4 2XU, UK
(Requests for offprints should be addressed to R Brown; Email: [email protected])
Abstract
Glucocorticoids play important roles in organ developmentand ‘fetal programming’. Fetal exposure to excess gluco-corticoids reduces birth weight and causes later hyperten-sion. To investigate these processes further we havedetermined the detailed ontogeny in the mouse of theglucocorticoid receptor (GR) and 11�-hydroxysteroiddehydrogenase type-1 (11�-HSD1), which amplifies glu-cocorticoid levels locally; the ontogeny was determinedusing in situ hybridisation from embryonic day 9·5 (E9·5,term=E19) until after birth.
At E9·5 fetal GR mRNA levels are very low, except infetal placenta. GR gene expression rises during gestationwith striking tissue-specific differences in timing andextent. Before E13·5, an increase is clear in gastrointestinal(GI) and upper respiratory tracts, discrete central nervoussystem (CNS) regions, precartilage and especially in theliver (E10·5–E12). Later, further increases occur in lung,GI and upper respiratory tracts, muscle, pituitary and
thymus. In a few tissues such increases are temporary, e.g.ureteric ducts (E13·5–E16·5) and pancreas (E14·5–E16·5,expression later falling sharply).
Fetal 11�-HSD1 mRNA expression is first clearlyobserved at E14·5–E15, initially in the fetal placenta thenin the umbilical cord. Later, 11�-HSD1 expression is seenas follows: (i) from E15 in lung and liver, rising strongly;(ii) thymus, from E15 (lower level); (iii) at low levels in afew brain regions, including the hippocampus (E16·5+);and (iv) in muscle group fascial planes and tendoninsertions.
This is the first detailed study of the ontogeny of thesetwo genes and, in combination with previous work on theontogeny of 11�-HSD2 and the mineralocorticoid recep-tor, suggests potential critical periods of glucocorticoidsensitivity during development for several organ systems.Journal of Endocrinology (2004) 181, 105–116
Introduction
Glucocorticoid hormones play many critical roles in bothnormal physiology and the stress response. Prenatally,glucocorticoids are important, not only in the structuraldevelopment of organs but also in the functional matu-ration of many key tissues, notably in preparation for birth.Indeed, glucocorticoids are used clinically to accelerate thematuration of the premature fetal lung. Mice homozygousfor targeted disruption of the glucocorticoid receptor (GR)gene die at birth because of a lack of normal lungmaturation (Cole et al. 1995). However, there can bepotentially detrimental longer-term consequences of glu-cocorticoid overexposure in utero. In particular, exposureto synthetic glucocorticoids reduces birth weight (Edwardset al. 1993, Seckl et al. 2000). Multiple studies associatelow birth weight with a substantially increased risk ofcardiovascular and metabolic disorders in adult life.Indeed, excess prenatal glucocorticoid exposure in ratsmodels these associations, reducing birth weight and
permanently ‘programming’ abnormalities in the off-spring; these abnormalities manifest in adulthood ashypertension, impaired glucose tolerance with hyper-insulinaemia and abnormalities of the hypothalamo–pituitary–adrenal axis and behaviour (Seckl et al. 2000).Clearly tight physiological control of fetal (and placental)glucocorticoid exposure is crucial to prevent such adverseconsequences.
Physiological glucocorticoids act via nuclear receptors oftwo types: a high affinity type-1 receptor (MR, alsobinding aldosterone with equal affinity) and a loweraffinity glucocorticoid or type-2 receptor (GR). Variationin tissue sensitivity to glucocorticoids is determined notonly by the levels of these two receptors but also bylocal glucocorticoid activation/inactivation by two keyintracellular enzymes (11�-hydroxysteroid dehydrogenase(11�-HSD) types 1 and 2). 11�-HSD2 inactivates gluco-corticoids, so greatly limiting glucocorticoid access toco-localised GR and MR. 11�-HSD2 has an adult tissuedistribution that is largely, but not exclusively, restricted to
105
Journal of Endocrinology (2004) 181, 105–1160022–0795/04/0181–105 � 2004 Society for Endocrinology Printed in Great Britain
Online version via http://www.endocrinology.org
Downloaded from Bioscientifica.com at 02/18/2022 06:22:26AMvia free access

MR-expressing aldosterone target tissues (e.g. distalnephron) (Brown et al. 1996a). When 11�-HSD2 isabundant this precludes glucocorticoid access to MR butallows the 100- to 1000-fold lower circulating levels ofaldosterone to pass unmetabolised and bind MR selec-tively. In humans, deficiencies of 11�-HSD2 in kidneyallows cortisol access to MR causing apparent mineralo-corticoid excess and hypertension. In contrast 11�-HSD1acts as a reductase locally regenerating glucocorticoids.11�-HSD1 is frequently co-localised with GR in adulttissues, both having a broad tissue distribution in adults(Whorwood et al. 1992). Thus, GR and 11�-HSD1 areseen as playing a major role in modulating the level ofglucocorticoid-dependent responses in a wide range ofadult tissues.
To elucidate the ontogeny of corticosteroid responsive-ness we have previously mapped gene expression of MRand 11�-HSD2 during mouse development (Brown et al.1996c). This revealed high placental 11�-HSD2 expres-sion, while in the fetus a pattern beginning to resembleadult MR and 11�-HSD2 expression appeared only in thelate-gestation/neonatal period. Earlier in gestation theexpression of these two genes was completely different asMR gene expression was very limited/absent, while11�-HSD2 was expressed very widely in fetal tissues athigh level. Such high placental and fetal 11�-HSD2activity affords protection to the developing fetus from themuch higher maternal glucocorticoid levels (Edwards et al.1993, Seckl & Brown 1994). Protection from excessglucocorticoid exposure during development is clearlyimportant. Thus, individuals homozygous for deleteriousmutations of the 11�-HSD2 gene (Mune et al. 1995), orthe use of 11�-HSD2 inhibitors in pregnant rats, causedramatic reductions in birth weight (Seckl et al. 2000).The adult rats have hypertension, hyperglycaemiaand central nervous system (CNS) changes similar tothose seen with gestational exposure to excess syntheticglucocorticoids (poor substrates for 11�-HSD2).
To further clarify the ontogeny of glucocorticoidresponsiveness we present a complementary in situ hy-bridisation study in the mouse of the ontogeny of GR andthe glucocorticoid-activating enzyme 11�-HSD1 fromembryonic day 9·5 (E9·5, term=E19) until after birth.This study reveals striking changes in the expression ofboth genes with 11�-HSD1 only appearing in later-gestation fetal tissues; the ontogeny of GR gene expressionis shown to be very dynamic, with a number of strikingincreases that are tissue-specific and arise within limiteddevelopmental time windows.
Materials and Methods
Animals
C57BL/6 mice were grouped for mating and werechecked the following morning. When mating had
occurred females were designated as potentially pregnantat gestation E0·5. This allowed embryos at appropriategestational ages (from E9·5) and pups (0·5 days postnatal,P0·5) to be obtained; these were frozen immediately(�20 �C isopentane bath) after death and were stored at�80 �C. Litters from 25 dams were collected havingequal gender ratio and 5–11 pups per litter. Crown–rumplength and morphological correlation with embryonic(Theiler) staging milestones allowed verification ofactual embryonic stage. All work was carried out underregulatory animal licence to ensure humane standards at alltimes.
11�-HSD1 and GR probes
Separate cDNA constructs incorporating mouse 11�-HSD1 or GR cDNA inserts flanked by T3 and T7polymerase binding sites were generated by PCR (insertidentities confirmed by sequencing) allowing productionof sense and antisense 35S-�-UTP-labelled RNA probes asdescribed previously for other genes (Brown et al. 1996a,Macdonald et al. 2000). The GR construct (cGR) allowedgeneration of 337 bp mouse GR probes corresponding tothe 3� untranslated region of mouse GR (running 3� frombp 2501 in mouse GR sequence X04435 (Danielsen et al.1986) and corresponding to bp 55–391 from BE377537;this showed 90% identity to the rat GR� sequence(M14053 bp 2590–2926)). For 11�-HSD1 two constructswere generated: (i) c11�1, producing 422 bp probes (to bp32–453 from AI097870) to the 5� untranslated region ofexon 1A through to just below the exon 3–4 splicejunction; and (ii) c11�1A, producing 178 bp probesspecific to exon 1A (bp 32–209 from the same sequence).
Figure 1 Initial expression of 11�-HSD1 during mousedevelopment. 1, uterine wall; 2, decidua; 3, fetal zone ofplacenta.
H J L SPEIRS and others · Ontogeny of GR and 11�-HSD1106
www.endocrinology.orgJournal of Endocrinology (2004) 181, 105–116
Downloaded from Bioscientifica.com at 02/18/2022 06:22:26AMvia free access

Figure 2(a).
Ontogeny of GR and 11�-HSD1 · H J L SPEIRS and others 107
www.endocrinology.org Journal of Endocrinology (2004) 181, 105–116
Downloaded from Bioscientifica.com at 02/18/2022 06:22:26AMvia free access

Figure 2(b).
H J L SPEIRS and others · Ontogeny of GR and 11�-HSD1108
www.endocrinology.orgJournal of Endocrinology (2004) 181, 105–116
Downloaded from Bioscientifica.com at 02/18/2022 06:22:26AMvia free access

These 11�-HSD1 cDNA regions are 92·8 (c11�1) and92·0% (c11�1A) identical to the rat 11�-HSD1 sequence(J05107 bp 1–419 and 1–175 respectively). Generally11�-HSD1 mRNA has been shown to overwhelminglyderive from one transcript, 11�-HSD1-A, which has fullpotential to generate active 11�-HSD1 enzyme. How-ever, in one context (adult kidney), a variant truncatedtranscript, 11�-HSD1-B (unable to make active 11�-HSD1 enzyme (Obeid et al. 1993)), has been shown in ratkidney to be as abundant as the normally dominant11�-HSD1-A transcript (Krozowski et al. 1990, Moisanet al. 1992). Probes from c11�1 detect 11�-HSD1 mRNAvery well and have been used throughout these studies.Probes from c11�1A (which also detect 11�1A but notany truncated 1B transcripts) were used to compare withc11�1 data to identify any sites (especially in the kidney)of major discrepancy between total 11�-HSD1 and 11�-HSD1-A expression (which would suggest importantexpression of a non-1A 11�-HSD1 transcript).
In situ hybridisation
Sagittal 10 µm cryostat sections were thaw-mounted onto3-amino propyl triethoxysilane-coated slides and stored at�80 �C. Tissue sections were fixed, prehybridised, hy-bridised and washed as described previously (Macdonaldet al. 2000; hybridisation was with �3�106 c.p.m./section 35S-UTP-labelled RNA probe at 50 �C for 12–14 h). Following washing/RNase A treatment slides weredehydrated, dried and placed against �-Max Hyperfilmfilm (Amersham) for 3–14 days to obtain a satisfactoryrange of film exposures for full analysis. Slides were thendipped in photographic emulsion and exposed in a light-tight box, before being developed as described previously(Macdonald et al. 2000) with the optimal emulsion expo-sure time (for 18–28 days) determined by the correspond-
ing film autoradiographs. The developed slides allowedexamination of the gene expression pattern (of silvergrains) at microscopic level. In situ hybridisation studieswere repeated allowing confirmation of findings in differ-ent experiments and different embryos. For GR, almost allfindings were confirmed across at least three in situhybridisation experiments at every gestational stage.Counterstaining, with cresyl violet, was used as necessaryto assist in localising expression. Graphical GR and 11�-HSD1 gene expression profiles for a number of tissueshave been derived using greyscale calibration of in situhybridisation autoradiographs (to those of co-exposedradioactive microscales designed for this purpose (RPA504and RPA511, Amersham)). Intensive image analysis of the11�-HSD1 and especially GR in situ hybridisation auto-radiographs was carried out. Autoradiographic films werescanned on a high-resolution flat-bed scanner, into taggedimage format files; these were then loaded into AIDA 2·0image analysis software (Raytek Scientific Ltd, Sheffield,UK). Two-dimensional densitometric analysis was per-formed allowing precise expression level data, in terms ofgreyscale values, to be gathered on over 2500 separatelydemarcated areas of known tissue type and gestation. Aspreviously described (Macdonald et al. 2000, Hou et al.2002) this calibration of in situ autoradiograph film greys-cale values to a common expression level scale (dividedinto arbitrary units based on the radioactive microscales)permits amalgamation and relative quantitation of the geneexpression level for each gene across different films, tissuesand gestations. The amalgamated data were used togenerate tissue-specific expression profiles having between3 and 30 measurements at each point; individual curveswere generated by least-squares line fitting of the pooleddata and the resultant profiles shown in Fig. 3a for GR andFig. 3b for 11�-HSD1 assist by illustrating, in multiple
Figure 2 Expression of GR and 11�-HSD1 in mouse development. In situ hybridisation studies for GR and 11�-HSD1 are shown acrossthe developmental period studied (E9·5–P0·5). (a) early expression pattern of GR prior to induction of significant fetal 11�-HSD1expression, E9·5–E14·5; (b) Gene expression of GR and 11�-HSD1 from E15·5 to postnatally. For each panel the gestation is shown on theleft of the row and the study type (histological staining (cresyl violet) or GR or 11�-HSD1 in situ hybridisation) is given at the bottom ofthe column. Autoradiographic exposure is for 6 days with the exception of E9·5 when fetal GR gene expression is faint and thus anexposure at 14 days ((a), E9·5, right panel) is also shown. Apart from extra-embryonic structures, labelling in the in situ hybridisation panelsis restricted to areas showing higher expression levels. The areas indicated are: 1, uterine wall; 2, decidua; 3, fetal zone of placenta(3a, labyrinthine zone; 3b, spongiotrophoblast zone); 4, chorionic plate; 5, amniotic fluid cavity; 6, primitive gut (6a, gut in region offoregut–midgut junction; 6b, ventral foregut in region of floor of pharynx); 7, heart; 8, periventricular neuroepithelium; 9, cerebral fourthventricle (and associated choroid plexus, 9a); 10, somite elements; 11, developing liver; 12, first branchial arch (12a, migrating thyroidprimordium); 13, epithelium of developing pharyngeal wall; 14, developing pituitary; 15, extra-embryonic membranes (15a, membranessurrounding umbilical cord); 16, developing lung; 17, bowel loops (17a, midgut loops in physiological hernia; 17b, distalhindgut–rectal/anal canal); 18, mesonephric duct/ductus deferens; 19, spinal cord; 20, bowel mesentery to physiological hernia; 21, nasalepithelia; 22, septum; 23, lateral ventricle (and associated choroid plexus, 23a); 24, anterior thalamus; 25, ventral isthmus region; 26,ventral pons/medulla; 27, developing larynx (27a, initial oesophagus; 27b, arytenoid swelling separating trachea and initial oesophagus;27c, tracheal diverticulum); 28, thymus; 29, heart; ventricular muscle; 30, oesophagus; 31, developing kidney (mesonephric) (31a, uretericducts); 32, stomach; 33, striatum (basal ganglia) (33a, striatonuclear neuroepithelium; 33b, striatum–pallidum junction); 34, thyroid;35, bronchus; 36, olfactory bulb neuroepithelium; 37, mesencephalic vesicle; 39, upper respiratory tract; 40, developing pancreas (withinellipse); 41, urinary bladder; 42, epithelium of tongue; 43, salivary glands (43a, sublingual; 43b, submandibular); 44, developingcochlea/inner ear; 45, adrenal gland; 46, muscle groups (and specifically 46a, prevertebral; 46b, limb-girdle; 46c, forelimb muscles); 47,muscle group tendons/ fascial planes; 48, whisker follicles (vibrissae); 49, testis; 50, tail; 51, hippocampus; 52, cerebellum; 53, artifactualspace. Actual embryo crown–rump length: E9·5, 3 mm; E18·5, 22 mm.
Ontogeny of GR and 11�-HSD1 · H J L SPEIRS and others 109
www.endocrinology.org Journal of Endocrinology (2004) 181, 105–116
Downloaded from Bioscientifica.com at 02/18/2022 06:22:26AMvia free access

tissues, the trends of expression level of these genes duringgestation.
Results
Control sense 11�-HSD1 and GR in situ hybridisationsshowed non-specific background radioactivity only, whichwas low for GR but more significant, though uniformacross tissues, for 11�-HSD1 and 11�-HSD1A. In con-trast, antisense studies were characterised by high levels ofhighly specific hybridisation with low background levels.Multiple sections at each gestation were analysed and forGR in particular this involved confirming findings at eachstage across at least three separate in situ hybridisationexperiments. Figures 1 and 2 show results of in situhybridisation from representative sections of the stagesstudied. Because of the more complex ontogeny of GR,Fig. 2 shows two sections at each gestational stage fromE11·5 onward. Sections are in the sagittal plane and afterexposure for 6 days with the exception of E9·5 when fetalGR gene expression is faint and thus an exposure at 14days is also shown. To show a greater range of structures,the sagittal sections used vary in their distance from themidline, though at all stages at least one section passesthrough the kidney or its embryonic antecedents. Expres-sion profiles by gestational age are illustrated in Fig. 3a (forGR) and b (for 11�-HSD1) for multiple tissues. Theprofiles are calibrated against common index units derivedfrom co-exposed radioactive microscales. Expression isalso shown in further detail at sites of particular interest inFigs 4 (for GR) and 5 (for 11�-HSD1).
Ontogeny of GR
At E9·5, the uterine wall and the developing fetal zone ofthe placenta express GR mRNA much more strongly thanthe maternal (decidual) zone of the placenta or the verylow expression prevailing in the fetus at this stage ofgestation, with the notable exception of the ventral foregut(see below). At later gestational ages, placental expressionshows very little change with the fetal.decidual zonepattern persisting, while expression clearly rises in thefetus. This rise in overall fetal GR gene expression(average expression across all fetal tissues) from the lowlevels of E9·5 is well developed by E11·5 and graduallycontinues until after birth. However it is abundantly clear(see Fig. 2) that this rising fetal GR gene expression is notuniform; there are striking differences across fetal tissuesboth in the extent and the pattern of increase. Indeed, ina few tissues there is a fall in GR mRNA later in gestation.The ontogeny of GR gene expression is considered indetail below for two periods: from E9·5 to E14 and thenfrom E14·5 to postnatally.
E9·5–E14 As noted above, early- to mid-gestation GRgene expression is generally very low but by E9–E9·5 it is
clearly higher in the ventral foregut (floor of pharynx).From E9·5 to E14·5 (especially by E12·5) this higherexpression in the pharynx increases further and spreads inall directions around the developing gut, including to thepouches and diverticulae, then branching from it toinvolve: (i) all foregut, midgut and hindgut by E11·5; (ii)the dorsal foregut involving Rathke’s pouch by E11·5–E12 and shortly afterwards the primitive anterior pituitary(from E12, Fig. 4b) and spreading also more proximallyinto early nasal cavities (from E12·5–E13·5 onwards); (iii)the branchial arches/pouches notably the second (hyoid)arch (contributing to midline tongue) and the third andfourth branchial pouches (all, E12–E12·5) with highexpression following in the thymus (a third pouch deriva-tive) clearly seen separately at E12·5–E13 (though thethymus is still small); and (iv) important ventral foregutdiverticulae involving the developing thyroid, trachea andearly bronchial tree and most dramatically the hepaticdiverticulum which initiates liver development on infil-trating into septum transversum (E10·5–E12). The pan-creatic diverticulae are present from �E9·5–E10, but GRgene expression remains very low/absent before E14 (seebelow and Fig. 4a). Thus, the most dramatic increase ofthe E9·5–E12·5 period is that in hepatic primordiaespecially E10·5–E12 (see Fig.2, E11·5), a phase duringwhich the liver is invaded by haematopoietic stem cellsand first takes over a major haematopoietic role. AcrossE12–E13·5 hepatic expression declines somewhat. In con-trast, expression in the upper GI and respiratory tract risesfurther while increased GR gene expression is first clearlyseen in: (i) mesonephric tubules and duct (E11·5–E12·5)and from E12·5/E13·5 onwards in the forming primitivedefinitive kidney (metanephros) and the ureteric duct andits branches; (ii) precartilage condensations at sites ofimminent cartilage and later bone development, mostnotably in the developing vertebral column (E12–E13,declining by E13·5 with cartilage formation); and (iii)discrete regions of the CNS (�E12 onwards) particularlyhypothalamus, the ventral aspect of the pons–medulla–rostral spinal cord, the ventral isthmus/midbrain, stronglyin choroid of lateral and fourth ventricles and at somewhatlower levels in periventricular neuroepithelium moregenerally.
E14·5–postnatal From E14·5 until term the majority offetal tissues show a gradual, modest further incrase in GRgene expression levels with rises to substantial expressionlevels in several tissues. As the expression in the fetalplacental zone remains at an approximately constant levelacross this period, this level serves as a useful referencethreshold with the following tissues showing higherGR gene expression levels for the durations indicated:(i) pharynx, upper respiratory tract and bronchial tree(from �E12·5 onwards) and lung (E14·5–E15 onwardsuntil P0·5 (with an additional sharp rise at E18·5 fallingback by P0·5)); (ii) intestine continuing from E12·5
H J L SPEIRS and others · Ontogeny of GR and 11�-HSD1110
www.endocrinology.orgJournal of Endocrinology (2004) 181, 105–116
Downloaded from Bioscientifica.com at 02/18/2022 06:22:26AMvia free access

Figure 3 (a) Developmental GR gene expression profiles for mouse tissues. These were generated from image analysis densitometry data,calibrated to co-exposed radioactive microscales, allowing expression from all in situ hybridisation studies (not just those used for illustration inFigure 2) to be pooled and profiles generated by least-squares curve fitting. Profiles from 19 organs/tissues are shown. Note that the scaling of thetop-left graph differs from all others in going to a much higher expression level and this graph profiles the most highly expressing tissues. Uretericducts are shown separately while expression over the kidney, except for ureteric ducts, is designated kidney. Upper GI/Resp Tract refers tooropharynx, larynx/trachea and upper oesophagus. Periventricular CNS is shown separately from the choroid plexus and the expression levelaverage over the rest of the CNS (designated Majority CNS). The purpose here is to identify trends, not to make quantitative comparisons, as theanalysis is semi-quantitative at most. Nonetheless two qualifications are useful: (i) it appears that as the expression level drops below �750 arbitraryunits it is not significantly different from background; (ii) changes of ,30–50% cannot be regarded as robust but become increasingly so above thislevel and when trends continue across multiple gestational ages. (b) Developmental 11�-HSD1 gene expression profiles for mouse tissues (seepanel (a) legend). Other major organs/tissues not shown had very little or no convincing evidence of expression across the organ as a whole.
Ontogeny of GR and 11�-HSD1 · H J L SPEIRS and others 111
www.endocrinology.org Journal of Endocrinology (2004) 181, 105–116
Downloaded from Bioscientifica.com at 02/18/2022 06:22:26AMvia free access

through to postnatal; (iii) liver briefly at E10·5–E12 andagain briefly at E18·5, dropping between these days andpostnatally; (iv) pancreas at E14·5/15 until E16·5 withlower expression before and afterwards; (v) muscle fromE16·5–E17 onwards especially in erector spinae and pos-terior cervical musculature; (vi) ureteric duct/collectingducts from E13·5 to E16·5, thereafter declining to lowerlevels then prevailing more widely in the kidney;
(vii) thymus from E13·5, rising sharply higher again from�E18 to P0·5; (viii) pituitary from E14·5/E15 onwards,also rising sharply higher again from E18·5 to P0·5;(ix) salivary gland from E17 onwards; and (x) nasalepithelium from E14·5 onwards and rising further sharplypostnatally. In all these cases expression is well above theaverage across all fetal tissues and the increases whichdevelop in early upper respiratory/GI tract, progressively
Figure 4 Detail of GR gene expression at sites of particular interest. (a) Changes in GR gene expression in stomach, pancreas andkidney; (b) early GR gene expression in the region of the developing pituitary and hard palate; (c) abundant GR gene expression in thedeveloping thymus and salivary gland. Right-hand panels show dark-field in situ hybridisation findings and left-hand panels showcorresponding appearance with cresyl violet histological staining and indicate the gestational stage. 1B, first branchial arch; A, adrenalgland; AT, anterior thalamus; C, colon; I, intestine; K, kidney; L, liver; M, mesonephric duct/ductus deferens; O, oesophagus; P, pancreas,PG, pituitary gland; S, stomach; SG, salivary (submandibular) gland; Sp, septum; T, testis; Ty, thymus.
H J L SPEIRS and others · Ontogeny of GR and 11�-HSD1112
www.endocrinology.orgJournal of Endocrinology (2004) 181, 105–116
Downloaded from Bioscientifica.com at 02/18/2022 06:22:26AMvia free access
in lung, pituitary and thymus and transient in developingpancreas (see also Fig. 4a) are especially striking.
In contrast, GR mRNA expression remains low in:(i) the decidual zone of the placenta; (ii) spinal cord andthe majority of CNS regions which are not periventricular;(iii) gonads; (iv) adrenal; (v) the pancreas from E17onwards; (vi) regions with cartilage formation especially inthe developing vertebral column from E14 onwards.Regions with intermediate GR gene expression levels(being higher than the six sites just listed but lower thanthe fetal zone of the placenta) include heart, liver (betweenE13 and E17) and the majority of periventricular neuro-epithelial regions of the CNS, basal ganglia, choroidplexus and later at lower levels in olfactory neuroepi-thelium, cerebellum and hippocampus.
Of special interest is GR expression in the pituitarywhich participates in functional hypothalamo–pituitary–adrenal (HPA)-axis feedback from at least as early asE16–E16·5 (Reichardt & Schutz 1996). As can be seen inFig. 4b, abundant GR mRNA is present by E12 and it isbetween these gestational days that fetal adrenal glucocor-ticoid production commences. GR in structures locatedinferiorly to the developing pituitary fossa also play keyroles in palatal fusion. The developing thymus is known tobe susceptible to glucocorticoid-driven apoptosis, playingan obvious potentially important role in the maturation ofimmune responses. As seen in Fig. 2, GR expression
develops strongly between E14·5 and E17·5. By E17·5 thethymus is also expressing moderate levels of 11�-HSD1mRNA as well as abundant GR expression (Fig 4c).
Ontogeny of 11�-HSD1
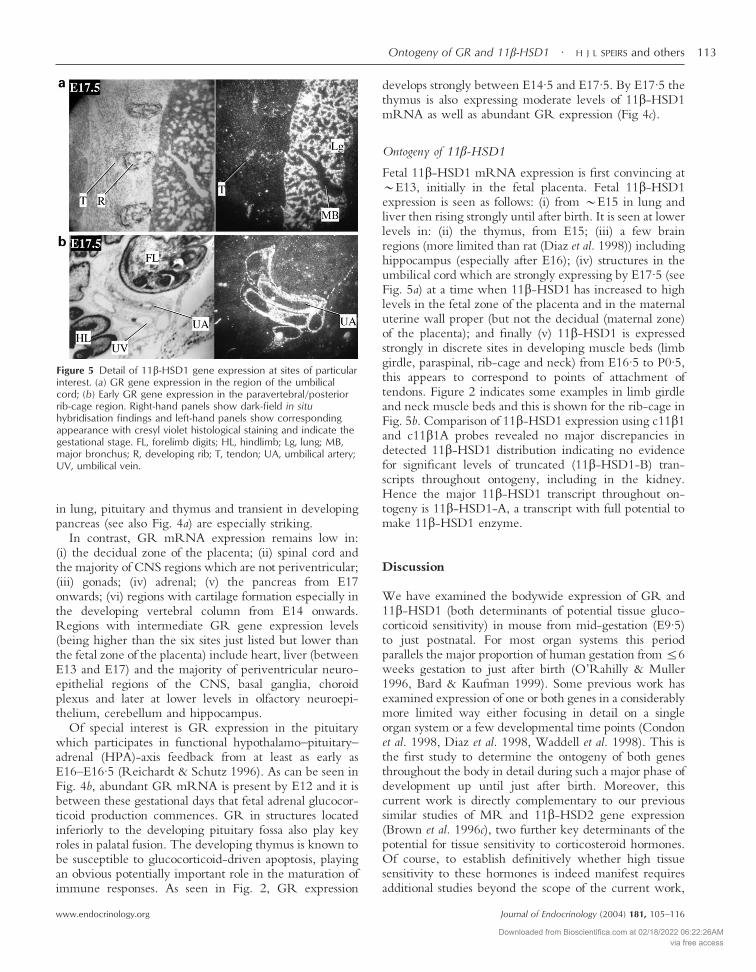
Fetal 11�-HSD1 mRNA expression is first convincing at�E13, initially in the fetal placenta. Fetal 11�-HSD1expression is seen as follows: (i) from �E15 in lung andliver then rising strongly until after birth. It is seen at lowerlevels in: (ii) the thymus, from E15; (iii) a few brainregions (more limited than rat (Diaz et al. 1998)) includinghippocampus (especially after E16); (iv) structures in theumbilical cord which are strongly expressing by E17·5 (seeFig. 5a) at a time when 11�-HSD1 has increased to highlevels in the fetal zone of the placenta and in the maternaluterine wall proper (but not the decidual (maternal zone)of the placenta); and finally (v) 11�-HSD1 is expressedstrongly in discrete sites in developing muscle beds (limbgirdle, paraspinal, rib-cage and neck) from E16·5 to P0·5,this appears to correspond to points of attachment oftendons. Figure 2 indicates some examples in limb girdleand neck muscle beds and this is shown for the rib-cage inFig. 5b. Comparison of 11�-HSD1 expression using c11�1and c11�1A probes revealed no major discrepancies indetected 11�-HSD1 distribution indicating no evidencefor significant levels of truncated (11�-HSD1-B) tran-scripts throughout ontogeny, including in the kidney.Hence the major 11�-HSD1 transcript throughout on-togeny is 11�-HSD1-A, a transcript with full potential tomake 11�-HSD1 enzyme.
Discussion
We have examined the bodywide expression of GR and11�-HSD1 (both determinants of potential tissue gluco-corticoid sensitivity) in mouse from mid-gestation (E9·5)to just postnatal. For most organ systems this periodparallels the major proportion of human gestation from�6weeks gestation to just after birth (O’Rahilly & Muller1996, Bard & Kaufman 1999). Some previous work hasexamined expression of one or both genes in a considerablymore limited way either focusing in detail on a singleorgan system or a few developmental time points (Condonet al. 1998, Diaz et al. 1998, Waddell et al. 1998). This isthe first study to determine the ontogeny of both genesthroughout the body in detail during such a major phase ofdevelopment up until just after birth. Moreover, thiscurrent work is directly complementary to our previoussimilar studies of MR and 11�-HSD2 gene expression(Brown et al. 1996c), two further key determinants of thepotential for tissue sensitivity to corticosteroid hormones.Of course, to establish definitively whether high tissuesensitivity to these hormones is indeed manifest requiresadditional studies beyond the scope of the current work,
Figure 5 Detail of 11�-HSD1 gene expression at sites of particularinterest. (a) GR gene expression in the region of the umbilicalcord; (b) Early GR gene expression in the paravertebral/posteriorrib-cage region. Right-hand panels show dark-field in situhybridisation findings and left-hand panels show correspondingappearance with cresyl violet histological staining and indicate thegestational stage. FL, forelimb digits; HL, hindlimb; Lg, lung; MB,major bronchus; R, developing rib; T, tendon; UA, umbilical artery;UV, umbilical vein.
Ontogeny of GR and 11�-HSD1 · H J L SPEIRS and others 113
www.endocrinology.org Journal of Endocrinology (2004) 181, 105–116
Downloaded from Bioscientifica.com at 02/18/2022 06:22:26AMvia free access

especially demonstrating levels of hormone-specificphysiological responsiveness. However, the current studiesprovide a useful starting point.
The prenatal expression pattern of 11�-HSD1 (anenzyme producing active glucocorticoid) is very simplecompared with GR. 11�-HSD1 expression is first seen atE13 in the fetal (labyrinthine) zone of the placenta,increasing in level towards birth; however, expression of11�-HSD2 (Brown et al. 1996c), which inactivates gluco-corticoids, drops from high to low or undetectable levels inmany fetal tissues between E12·5 and E13·5 and in thefetal zone of the placenta between E14·5 and E16. Thusthis zone of the placenta, which is the interface betweenmaternal and fetal circulations, transforms over E13–E16from a tissue potently inactivating glucocorticoids to one inwhich the gene expression supporting this (11�-HSD2)switches off while expression supporting the production ofglucocorticoid (11�-HSD1) switches on. The adjacentmaternal zone of the placenta, which has other roles, showsno convincing overall expression of either 11�-HSD1 or11�-HSD2 (Brown et al. 1996c). A recent study on mouseplacenta reports similar findings and discusses them insome detail (Thompson et al. 2002).
GR and 11�-HSD1 have proved to be genes wheremRNA expression reflects well the expression of thefunctional protein provided that the non-functional tran-scripts (GR� (Oakley et al. 1996) and 11�-HSD1-B(Krozowski et al. 1990, Moisan et al. 1992, Obeid et al.1993)) are not proportionately abundant. The in situhybridisation probes used in the work above selectivelydetect the functional GR� transcript, moreover GR� isnot expressed in the mouse (Otto et al. 1997). Similarly,we have shown no major discrepancies between the11�-HSD1 gene expression and that of the active 11�-HSD1-A transcript. 11�-HSD1 gene expression is mini-mal or absent up to P0·5 in the kidney (the organ where11�-HSD1-B has been found in other species).
The results above predict high glucocorticoid sensi-tivity in some tissues, especially lung (abundant GR and11�-HSD1) and thymus (abundant GR and moderate11�-HSD1). Evidence of such sensitivity is indeed present(including physiological responses, e.g. lung maturation,thymocyte apoptosis) from previous work in severalspecies including human, rodents and sheep (Dodic &Wintour 1994, Ballard 2000, Forhead et al. 2000). Toshow the strength of this evidence it is valuable to describea good example of this in some detail. Thus, for example,fetal lung maturation is strongly accelerated merely bymaternal glucocorticoid administration in later gestation inhumans and in animals that have been studied (Ballard2000). Conversly the ‘GR knockout’ mouse dies in theneonatal period because of lung immaturity; this situationcannot be avoided by the use of synthetic glucocorticoidsas GR is lacking (Cole et al. 1995). Furthermore, our geneexpression work predicts a varying glucocorticoid sensitiv-ity of developing lung which again appears borne out in its
responsiveness in several species (Ballard 2000). Specifi-cally, our previous work indicated that before E13 inmouse there is high 11�-HSD2 gene expression in manyfetal tissues potentially representing sites of eradication of,and insensitivity to, glucocorticoids (Brown et al. 1996c).By E13·5, this 11�-HSD2 expression sharply downregu-lates in many tissues including lung, where 11�-HSD2mRNA is minimal/absent by E15. The present workshows that in E15–E15·5 lung GR gene expression risesand 11�-HSD1 is first expressed and then also risessharply. These findings clearly suggest relative insensitivityto physiological glucocorticoids in the lung up to E13,diminishing over E13·5 with strongly increasing glucocor-ticoid sensitivity from E15. This is supported by animaland human studies. Abundant 11�-HSD2-like glucocor-ticoid inactivating activity is reported as late as embryonicweek (EW) 21 in the human lung (Murphy 1978) with11�-HSD2 present before this time (Condon et al. 1998)but absent by 22–23 weeks (Brown et al. 1996b). Benefitsaccelerating lung maturation with glucocorticoid treat-ment are clear from EW26 and probably diminish some-what going back to EW22–23 (the lower limit of viabilityfor premature babies) (Ward 1994). Glucocorticoid treat-ment in mice with comparable lung development (E14–E15·5) accelerates lung maturation; however, strongertreatment on both E14·5 and E15·5 increases lungmaturity but also reduces mature lung and lung/bodyweight ratio; this effect is permanent (Stewart et al. 1998),reflecting concerns about glucocorticoid overtreatmentprenatally in humans (Lacaze-Masmonteil & Audibert2000, Seckl et al. 2000). There is also ample evidence,from work in the fetal sheep, of glucocorticoid sensitivityin the lung and acceleration of lung maturation by suchtreatment (Ballard 2000, Forhead et al. 2000).
Some other sites with expression indicating increasingglucocorticoid sensitivity, e.g. bowel and periventricularCNS, are also now seen as sites where antenatal glucocor-ticoid can accelerate maturation in the human prematureinfant and reduce harmful sequelae such as periventricularleukomalacia (Canterino et al. 2001) (a major aetiologicalrisk factor for cerebral palsy) and impaired bowel motility(especially of the duodenum (Morriss et al. 1986)). Theseparallels between our studies and the functional glucocor-ticoid sensitivity of human and rodent organs (e.g. lung),give some support to the more general usefulness of thedetailed conclusions which can be drawn from the resultsabove. Of course conclusions that such tissues may beespecially responsive to glucocorticoids would requirefurther experimental work to assess. The current studiessuggest likely sites and critical periods where heightenedglucocorticoid sensitivity may have particularly long-lasting effects on ureteric ducts, the early skeleton,some CNS regions and especially GI and respiratorytracts, pancreas, pituitary–hypothalamus and thymus.The detailed role of glucocorticoids in development at themajority of these sites has not been directly ascertained but
H J L SPEIRS and others · Ontogeny of GR and 11�-HSD1114
www.endocrinology.orgJournal of Endocrinology (2004) 181, 105–116
Downloaded from Bioscientifica.com at 02/18/2022 06:22:26AMvia free access

often previous literature points to glucocorticoids having arole, especially in the transition to a more differentiatedless proliferative state.
One of the more intriguing of such sites is the devel-oping pancreas which by �E9·5–E10 has arisen from theforegut as two progenitor buds which proliferate stronglyand fuse at E13–E14. In the pancreas GR mRNA is at avery low level up to E13·5–E14, increasing steeply tomuch higher levels between E14·5 and 16·5, a periodcoinciding with two important changes in pancreaticdevelopment. First, from E14·5, acini and ducts are readilydiscernable histologically, representing the transition to aless proliferative more differentiated phase. Secondly, untilE14·5–E15·5 cells destined to form islets are largelyscattered and intraductal but during E15·5–E16·5 clustersmigrate out of duct epithelium, forming islets from E16·5onwards. The abundant GR mRNA expression observedat E14·5–E16·5 is too widespread to be solely in isletprogenitor cells and must represent expression in themajority of ductal cells; however, it is impossible to discernin the current work if this includes or excludes the rareislet progenitor cells.
Glucocorticoid action on the developing pancreas hasnot been extensively studied; however, previous work onthe immature pancreas (Lu et al. 1987, Komatsu et al.1998), poorly differentiated pancreatic cancers (Normanet al. 1994) and largely exocrine pancreatic cell lines(Rosewicz et al. 1991, Slater et al. 1993) shows clearevidence of GR expression and that glucocorticoids reduceproliferation rate (Norman et al. 1994) and alter geneexpression via GR (Rosewicz et al. 1991, Slater et al.1993). Indeed dexamethasone is a useful component ofchemotherapy for poorly differientated pancreatic cancers(Norman et al. 1994). Literature on the more maturepancreas indicates GR expression in islets (Matthes et al.1994) (co-localising exclusively to �-cells (Fischer et al.1990)) while GR in exocrine pancreas is much reduced(Matthes et al. 1994). Finally, one study on rats suggestedthat maternal adrenal steroids were required to maintain anormal rate of pancreatic �-cell growth in the developingfetus, with defects seen at or before E15 with maternaladrenalectomy (Komatsu et al. 1998). Another studyshowed reduced pancreatic weight (and some other organweights reduced too) after late-gestational glucocorticoidtreatment in monkeys (Johnson et al. 1981). The resultsabove and these previous reports strongly suggest that ifglucocorticoid exposure of the developing pancreas isinadequate or excessive then the function of the matureorgan will be altered. This is especially intriguing in viewof the fact that late-prenatal dexamethasone causes perma-nently impaired glucose tolerance in the offspring as adults(Seckl et al. 2000).
The results of this work should thus help to identify sitesthat are particularly vulnerable to the effects of glucocor-ticoid excess, either exogenous (maternally administered)or arising endogenously from substantial maternal (or fetal)
stress. Clearly further careful direct study is required todefine properly what effect glucocorticoid and its excesshave on these potentially vulnerable tissues, such as thedeveloping pancreas. Nonetheless, these findings givesome assistance in the investigation of how glucocorticoidsinfluence fetal programming and may give insights intothe association, shown in humans, between low birthweight and subsequent diabetes, hyperlipidaemia andhypertension (Barker 1994, Seckl et al. 2000).
Acknowledgements
We thank Susan Coan and Lynne Ramage for experttechnical assistance.
Funding
This work was supported by grants from the ScottishHospitals Endowment Research Trust (grant RG77/00),Urquhart Charitable Trust, Wellcome Trust and MedicalResearch Council.
References
Ballard PL 2000 Scientific rationale for the use of antenatalglucocorticoids to promote fetal development. Pediatrics in Review 1E83–E90.
Bard JBL & Kaufman MH 1999 The Anatomical Basis of MouseDevelopment. Oxford: Academic Press.
Barker DJP 1994 Mothers, Babies and Diseases in Later Life. London:BMJ Publishing Group.
Brown RW, Chapman KE, Kotelevtsev Y, Yau J, Lindsay RM, BrettL, Leckie C, Murad P, Lyons V, Mullins JJ, Edwards CRW &Seckl JR 1996a Cloning and production of antisera to humanplacental 11�-hydroxysteroid dehydrogenase type 2. BiochemicalJournal 313 997–1006.
Brown RW, Chapman KE, Kotelevtsev Y, Yau JLW, Lindsay RS,Brett L, Leckie C, Murad P, Lyons V, Mullins JJ, Edwards CRW& Seckl JR 1996b Cloning and production of antisera to humanplacental 11�-hydroxysteroid dehydrogenase type 2. BiochemicalJournal 313 1007–1017.
Brown RW, Diaz R, Robson AC, Kotelevtsev YV, Mullins JJ,Kaufman MH & Seckl JR 1996c The ontogeny of11�-hydroxysteroid dehydrogenase type 2 and mineralocorticoidreceptor gene expression reveal intricate control of glucocorticoidaction in development. Endocrinology 137 794–797.
Canterino JC, Verma U, Visintainer PF, Elimian A, Klein SA &Tejani N 2001 Antenatal steroids and neonatal periventricularleukomalacia. Obstetrics and Gynecology 97 135–139.
Cole TJ, Blendy JA, Monaghan AP, Krieglstein K, Schmid W, AguzziA, Fantuzzi G, Hummler E, Unsicker K & Schutz G 1995Targeted disruption of the glucocorticoid receptor gene blocksadrenergic chromaffin cell development and severely retards lungmaturation. Genes and Development 9 1608–1621.
Condon J, Gosden C, Gardener D, Nickson P, Hewison M, HowieAJ & Stewart PM 1998 Expression of type 2 11 beta-hydroxysteroid dehydrogenase and corticosteroid hormone receptorsin early human fetal life. Journal of Clinical Endocrinology andMetabolism 83 4490–4497.
Ontogeny of GR and 11�-HSD1 · H J L SPEIRS and others 115
www.endocrinology.org Journal of Endocrinology (2004) 181, 105–116
Downloaded from Bioscientifica.com at 02/18/2022 06:22:26AMvia free access
Danielsen M, Northrop JP & Ringold GM 1986 The mouseglucocorticoid receptor: mapping of functional domains by cloning,sequencing and expression of wild-type and mutant receptorproteins. EMBO Journal 5 2513–2522.
Diaz R, Brown RW & Seckl JR 1998 Distinct ontogeny ofglucocorticoid and mineralocorticoid receptor and 11 beta-hydroxysteroid dehydrogenase types I and II mRNAs in the fetalrat brain suggest a complex control of glucocorticoid actions. Journalof Neuroscience 18 2570–2580.
Dodic M & Wintour EM 1994 Effects of prolonged (48 h) infusion ofcortisol on blood pressure, renal function and fetal fluids in theimmature ovine foetus. Clinical and Experimental Pharmacology andPhysiology 21 971–980.
Edwards CRW, Benediktsson R, Lindsay RS & Seckl JR 1993Dysfunction of placental glucocorticoid barrier: link between fetalenvironment and adult hypertension? Lancet 341 355–357.
Fischer B, Rausch U, Wollny P, Westphal H, Seitz J & Aumuller G1990 Immunohistochemical localization of the glucocorticoidreceptor in pancreatic beta-cells of the rat. Endocrinology 1262635–2641.
Forhead AJ, Gillespie CE & Fowden AL 2000 Role of cortisol in theontogenic control of pulmonary and renal angiotensin-convertingenzyme in fetal sheep near term. Journal of Physiology 526 409–416.
Hou J, Speirs HJ, Seckl JR & Brown RW 2002 Sgk1 gene expressionin kidney and its regulation by aldosterone: spatio-temporalheterogeneity and quantitative analysis. Journal of the American Societyof Nephrology 13 1190–1198.
Johnson JWC, Mitzner W, Beck JC, London WT, Sly DL, Lee PA,Khouzami VA & Cavalieri RL 1981 Long-term effects ofbetamethasone on fetal development. American Journal of Obstetricsand Gynecology 141 1053–1064.
Komatsu S, Yamamoto M, Arishima K & Eguchi Y 1998 Maternaladrenocortical hormones maintain the early developmentof pancreatic B cells in the fetal rat. Journal of Anatomy 193551–557.
Krozowski Z, Stuchbery S, White P, Monder C & Funder JW 1990Characterization of 11 beta-hydroxysteroid dehydrogenase geneexpression: identification of multiple unique forms of messengerribonucleic acid in the rat kidney. Endocrinology 127 3009–3013.
Lacaze-Masmonteil T & Audibert F 2000 Multiple courses of antenatalglucocorticoid treatment and fetal outcome. Journal of PerinatalMedicine 28 185–193.
Lu RB, Lebenthal E & Lee PC 1987 Developmental changes ofglucocorticoid receptors in the rat pancreas. Journal of SteroidBiochemistry 26 213–218.
Macdonald P, MacKenzie S, Ramage LE, Seckl JR & Brown RW2000 Corticosteroid regulation of amiloride-sensitive sodium-channel subunit mRNA expression in mouse kidney. Journal ofEndocrinology 165 25–37.
Matthes H, Kaiser A, Stier U, Riecken EO & Rosewicz S 1994Glucocorticoid receptor gene expression in the exocrine andendocrine rat pancreas. Endocrinology 135 476–479.
Moisan MP, Edwards CR & Seckl JR 1992 Differential promoterusage by the rat 11 beta-hydroxysteroid dehydrogenase gene.Molecular Endocrinology 6 1082–1087.
Morriss FH Jr, Moore M, Weisbrodt NW & West MS 1986Ontogenic development of gastrointestinal motility: IV. Duodenalcontractions in preterm infants. Pediatrics 78 1106–1113.
Mune T, Rogerson FM, Nikkila H, Agarwal AK & White PC 1995Human hypertension caused by mutations in the kidney isozyme of11 beta-hydroxysteroid dehydrogenase. Nature Genetics 10 394–399.
Murphy BE 1978 Cortisol production and inactivation by the humanlung during gestation and infancy. Journal of Clinical Endocrinologyand Metabolism 47 243–248.
Norman J, Franz M, Schiro R, Nicosia S, Docs J, Fabri PJ & GowerWRJ 1994 Functional glucocorticoid receptor modulates pancreaticcarcinoma growth through an autocrine loop. Journal of SurgicalResearch 57 33–38.
O’Rahilly RR & Muller F 1996 Human Embryology and Teratology.Hoboken, New Jersey: Wiley.
Oakley RH, Sar M & Cidlowski JA 1996 The human glucocorticoidreceptor beta isoform. Expression, biochemical properties, andputative function. Journal of Biological Chemistry 271 9550–9559.
Obeid J, Curnow KM, Aisenberg J & White PC 1993 Transcriptsoriginating in intron 1 of the HSD11 (11 beta-hydroxysteroiddehydrogenase) gene encode a truncated polypeptide that isenzymatically inactive. Molecular Endocrinology 7 154–160.
Otto C, Reichardt HM & Schutz G 1997 Absence of glucocorticoidreceptor-beta in mice. Journal of Biological Chemistry 27226665–26668.
Reichardt HM & Schutz G 1996 Feedback control of glucocorticoidproduction is established during fetal development. MolecularMedicine 2 735–744.
Rosewicz S, Detjen K, Logsdon CD, Chen LM, Chao J & RieckenEO 1991 Glandular kallikrein gene expression is selectivelydown-regulated by glucocorticoids in pancreatic AR42J cells.Endocrinology 128 2216–2222.
Seckl JR & Brown RW 1994 11-Beta-hydroxysteroid dehydrogenase:on several roads to hypertension. Journal of Hypertension 12105–112.
Seckl JR, Cleasby M & Nyirenda MJ 2000 Glucocorticoids, 11beta-hydroxysteroid dehydrogenase, and fetal programming. KidneyInternational 57 1412–1417.
Slater EP, Hesse H, Muller JM & Beato M 1993 Glucocorticoidreceptor binding site in the mouse alpha-amylase 2 genemediates response to the hormone. Molecular Endocrinology 7907–914.
Stewart JD, Sienko AE, Gonzalez CL, Christensen HD & RayburnWF 1998 Placebo-controlled comparison between a single dose anda multidose of betamethasone in accelerating lung maturation ofmice offspring. American Journal of Obstetrics and Gynecology 1791241–1247.
Thompson A, Han VKM & Yang K 2002 Spatial and temporalpatterns of expression of 11�-hydroxysteroid dehydrogenase types 1and 2 messenger RNA and glucocorticoid receptor protein in themurine placenta and uterus during late pregnancy. Biology ofReproduction 67 1708–1718.
Waddell BJ, Benediktsson R, Brown RW & Seckl JR 1998Tissue-specific messenger ribonucleic acid expression of 11beta-hydroxysteroid dehydrogenase types 1 and 2 and theglucocorticoid receptor within rat placenta suggests exquisite localcontrol of glucocorticoid action. Endocrinology 139 1517–1523.
Ward RM 1994 Pharmacologic enhancement of fetal lung maturation.Clinics in Perinatology 21 523–542.
Whorwood CB, Franklyn JA, Sheppard MC & Stewart PM 1992Tissue localization of 11 beta-hydroxysteroid dehydrogenase and itsrelationship to the glucocorticoid receptor. Journal of SteroidBiochemistry and Molecular Biology 41 21–28.
Received 26 November 2003Accepted 9 December 2003
H J L SPEIRS and others · Ontogeny of GR and 11�-HSD1116
www.endocrinology.orgJournal of Endocrinology (2004) 181, 105–116
Downloaded from Bioscientifica.com at 02/18/2022 06:22:26AMvia free access