ontology matching - department of information engineering and
TRANSCRIPT

Ontology Matching
OM-2013
Proceedings of the ISWC Workshop
Introduction
Ontology matching1 is a key interoperability enabler for the semantic web, aswell as a useful tactic in some classical data integration tasks dealing with thesemantic heterogeneity problem. It takes the ontologies as input and determinesas output an alignment, that is, a set of correspondences between the seman-tically related entities of those ontologies. These correspondences can be usedfor various tasks, such as ontology merging, data translation, query answeringor navigation on the web of data. Thus, matching ontologies enables the knowl-edge and data expressed in the matched ontologies to interoperate.
The workshop has three goals:
• To bring together leaders from academia, industry and user institutions
to assess how academic advances are addressing real-world requirements.The workshop will strive to improve academic awareness of industrial and�nal user needs, and therefore direct research towards those needs. Simul-taneously, the workshop will serve to inform industry and user represen-tatives about existing research e�orts that may meet their requirements.The workshop will also investigate how the ontology matching technologyis going to evolve.
• To conduct an extensive and rigorous evaluation of ontology matchingapproaches through the OAEI (Ontology Alignment Evaluation Initiative)2013 campaign2. The particular focus of this year's OAEI campaign is onreal-world speci�c matching tasks as well as on evaluation of interactivematchers. Therefore, the ontology matching evaluation initiative itself willprovide a solid ground for discussion of how well the current approachesare meeting business needs.
• To examine similarities and di�erences from database schema matching,which has received decades of attention but is just beginning to transitionto mainstream tools.
The program committee selected 5 submissions for oral presentation and 11submissions for poster presentation. 23 matching system participated in thisyear's OAEI campaign.
Further information about the Ontology Matching workshop can be foundat: http://om2013.ontologymatching.org/.
1http://www.ontologymatching.org/2http://oaei.ontologymatching.org/2013
i

Acknowledgments. We thank all members of the program committee, au-thors and local organizers for their e�orts. We appreciate support from theTrentino as a Lab (TasLab)3 initiative of the European Network of the LivingLabs4 at Informatica Trentina SpA5, the EU SEALS (Semantic Evaluation atLarge Scale)6 project and the Semantic Valley7 initiative.
Pavel Shvaiko
Jérôme Euzenat
Kavitha Srinivas
Ming Mao
Ernesto Jiménez-Ruiz
October 2013
3http://www.taslab.eu4http://www.openlivinglabs.eu5http://www.infotn.it6http://www.seals-project.eu7http://www.semanticvalley.org/index_eng.htm
ii

Organization
Organizing Committee
Pavel Shvaiko, TasLab, Informatica Trentina SpA, ItalyJérôme Euzenat, INRIA & LIG, FranceKavitha Srinivas, IBM, USAMing Mao, eBay, USAErnesto Jiménez-Ruiz, University of Oxford, UK
Program Committee
Manuel Atencia, INRIA &LIG, FranceMichele Barbera, SpazioDati, ItalyZohra Bellahsene, LRIMM, FranceChris Bizer, University of Mannheim, GermanyOlivier Bodenreider, National Library of Medicine, USAMarco Combetto, Informatica Trentina, ItalyGianluca Correndo, University of Southampton, UKIsabel Cruz, The University of Illinois at Chicago, USAJérôme David, INRIA & LIG, FranceAnHai Doan, University of Wisconsin, USAAl�o Ferrara, University of Milan, ItalyBin He, IBM, USAWei Hu, Nanjing University, ChinaRyutaro Ichise, National Institute of Informatics, JapanAntoine Isaac, Vrije Universiteit Amsterdam & Europeana, NetherlandsKrzysztof Janowicz, University of California, USAAnja Jentzsch, Wikimedia Deutschland, GermanyYannis Kalfoglou, Ricoh Europe plc, UKAnastasios Kementsietsidis, IBM, USAPatrick Lambrix, Linköpings Universitet, SwedenMonika Lanzenberger, Vienna University of Technology, AustriaVincenzo Maltese, University of Trento, ItalyFiona McNeill, University of Edinburgh, UKChristian Meilicke, University of Mannheim, GermanyPeter Mork, Noblis, USAAxel-Cyrille Ngonga Ngomo, University of Leipzig, GermanyAndriy Nikolov, Open University, UKLeo Obrst, The MITRE Corporation, USAHeiko Paulheim, University of Mannheim, GermanyYefei Peng, Google, USAAndrea Perego, European Commission - Joint Research Centre, ItalyFrançois Schar�e, LIRMM & University of Montpellier, France
iii

Juan Sequeda, University of Texas at Austin, USALuciano Sera�ni, Fondazione Bruno Kessler - IRST, ItalyUmberto Straccia, ISTI-C.N.R., ItalyOnd°ej Zamazal, Prague University of Economics, Czech RepublicCássia Trojahn, IRIT, FranceRaphaël Troncy, EURECOM, FranceGiovanni Tummarello, Fondazione Bruno Kessler - IRST, ItalyLorenzino Vaccari, Autonomous Province of Trento, ItalyLudger van Elst, DFKI, GermanyShenghui Wang, Vrije Universiteit Amsterdam, NetherlandsBaoshi Yan, LinkedIn, USASongmao Zhang, Chinese Academy of Sciences, China
iv

Table of Contents
PART 1 - Technical Papers
Rapid execution of weighted edit distancesTommaso Soru, Axel-Cyrille Ngonga Ngomo . . . . . . . . . . . . . . . . . . . . . . . . . . . . . . . . 1
To repair or not to repair:reconciling correctness and coherence in ontology reference alignmentsCatia Pesquita, Daniel Faria, Emanuel Santos, Francisco M. Couto . . . . . . . 13
Unsupervised learning of link speci�cations:deterministic vs. non-deterministicAxel-Cyrille Ngonga Ngomo, Klaus Lyko . . . . . . . . . . . . . . . . . . . . . . . . . . . . . . . . . . 25
IncMap: pay as you go matching ofrelational schemata to OWL ontologiesChristoph Pinkel, Carsten Binnig, Evgeny Kharlamov, Peter Haase . . . . . . . . 37
Complex correspondences for query patterns rewritingPascal Gillet, Cássia Trojahn, Ollivier Haemmerlé, Camille Pradel . . . . . . . . 49
v

PART 2 - OAEI Papers
Results of the Ontology Alignment Evaluation Initiative 2013Bernardo Cuenca Grau, Zlatan Dragisic, Kai Eckert,
Jérôme Euzenat, Al�o Ferrara, Roger Granada, Valentina Ivanova,
Ernesto Jiménez-Ruiz, Andreas Oskar Kempf, Patrick Lambrix,
Andriy Nikolov, Heiko Paulheim, Dominique Ritze,
François Schar�e, Pavel Shvaiko, Cássia Trojahn, Ond°ej Zamazal . . . . . . . .61
AgreementMakerLight results for OAEI 2013Daniel Faria, Catia Pesquita, Emanuel Santos,
Isabel F. Cruz, Francisco M. Couto . . . . . . . . . . . . . . . . . . . . . . . . . . . . . . . . . . . . . . .101
Monolingual and cross-lingual ontology matching with CIDER-CL:evaluation report for OAEI 2013Jorge Gracia, Kartik Asooja . . . . . . . . . . . . . . . . . . . . . . . . . . . . . . . . . . . . . . . . . . . . . .109
CroMatcher - results for OAEI 2013Marko Guli¢, Boris Vrdoljak . . . . . . . . . . . . . . . . . . . . . . . . . . . . . . . . . . . . . . . . . . . . . 117
IAMA results for OAEI 2013Yuanzhe Zhang, Xuepeng Wang, Shizhu He, Kang Liu,
Jun Zhao, Xueqiang Lv . . . . . . . . . . . . . . . . . . . . . . . . . . . . . . . . . . . . . . . . . . . . . . . . . . .123
LogMap and LogMapLt results for OAEI 2013Ernesto Jiménez-Ruiz, Bernardo Cuenca Grau, Ian Horrocks . . . . . . . . . . . . . 131
Summary of the MaasMatch participation in the OAEI-2013 campaignFrederik C. Schadd, Nico Roos . . . . . . . . . . . . . . . . . . . . . . . . . . . . . . . . . . . . . . . . . . . 139
StringsAuto and MapSSS results for OAEI 2013Michelle Cheatham, Pascal Hitzler . . . . . . . . . . . . . . . . . . . . . . . . . . . . . . . . . . . . . . . .146
ODGOMS - results for OAEI 2013I-Hong Kuo, Tai-Ting Wu . . . . . . . . . . . . . . . . . . . . . . . . . . . . . . . . . . . . . . . . . . . . . . . .153
RiMOM2013 results for OAEI 2013Qian Zheng, Chao Shao, Juanzi Li, Zhichun Wang, Linmei Hu . . . . . . . . . . . 161
ServOMap results for OAEI 2013Amal Kammoun, Gayo Diallo . . . . . . . . . . . . . . . . . . . . . . . . . . . . . . . . . . . . . . . . . . . . 169
SLINT+ results for OAEI 2013 instance matchingKhai Nguyen, Ryutaro Ichise . . . . . . . . . . . . . . . . . . . . . . . . . . . . . . . . . . . . . . . . . . . . . 177
vi

System for Parallel Heterogeneity Resolution (SPHeRe)results for OAEI 2013Wajahat Ali Khan, Muhammad Bilal Amin,
Asad Masood Khattak, Maqbool Hussain, Sungyoung Lee . . . . . . . . . . . . . . . . . .184
SYNTHESIS: results for the Ontology AlignmentEvaluation Initiative (OAEI) 2013Antonis Koukourikos, George Vouros, Vangelis Karkaletsis . . . . . . . . . . . . . . . 190
WeSeE-Match results for OAEI 2013Heiko Paulheim, Sven Hertling . . . . . . . . . . . . . . . . . . . . . . . . . . . . . . . . . . . . . . . . . . . 197
XMapGen and XMapSiG results for OAEI 2013Warith Eddine Djeddi, Mohamed Tarek Khadir . . . . . . . . . . . . . . . . . . . . . . . . . . . 203
YAM++ results for OAEI 2013DuyHoa Ngo, Zohra Bellahsene . . . . . . . . . . . . . . . . . . . . . . . . . . . . . . . . . . . . . . . . . . .211
vii

PART 3 - Posters
Collective ontology alignmentJason B. Ellis, Oktie Hassanzadeh, Kavitha Srinivas, Michael J. Ward . . . 219
Uncertainty in crowdsourcing ontology matchingJérôme Euzenat . . . . . . . . . . . . . . . . . . . . . . . . . . . . . . . . . . . . . . . . . . . . . . . . . . . . . . . . . . 221
Mix'n'Match: iteratively combining ontology matchersin an anytime fashionSimon Steyskal, Axel Polleres . . . . . . . . . . . . . . . . . . . . . . . . . . . . . . . . . . . . . . . . . . . . 223
An ontology mapping method based on support vector machineJie Liu, Linlin Qin, Hanshi Wang . . . . . . . . . . . . . . . . . . . . . . . . . . . . . . . . . . . . . . . . 225
PLATAL - a tool for web hierarchies extraction and alignmentBernardo Severo, Cássia Trojahn, Renata Vieira . . . . . . . . . . . . . . . . . . . . . . . . . 227
Is my ontology matching system similar to yours?Ernesto Jiménez-Ruiz, Bernardo Cuenca Grau, Ian Horrocks . . . . . . . . . . . . . 229
Ontological quality control in large-scale, applied ontology matchingCatherine Legg, Samuel Sarjant . . . . . . . . . . . . . . . . . . . . . . . . . . . . . . . . . . . . . . . . . . 231
Variations on aligning linked open data ontologiesValerie Cross, Chen Gu, Xi Chen, Weiguo Xia, Peter Simon . . . . . . . . . . . . . 233
LOD4STAT: a scenario and requirementsPavel Shvaiko, Michele Mostarda, Marco Amadori, Claudio Giuliano . . . . . 235
Interlinking and visualizing linked open datawith geospatial reference dataAbdelfettah Feliachi, Nathalie Abadie,
Fayçal Hamdi, Ghislain Auguste Atemezing . . . . . . . . . . . . . . . . . . . . . . . . . . . . . . 237
Matching geospatial instancesHeshan Du, Natasha Alechina, Michael Jackson, Glen Hart . . . . . . . . . . . . . . .239
viii

ix

Rapid Execution of Weighted Edit Distances
Tommaso Soru and Axel-Cyrille Ngonga Ngomo
Department of Computer ScienceUniversity of Leipzig
Augustusplatz 10, 04109 Leipzig{tsoru|ngonga}@informatik.uni-leipzig.de
Abstract. The comparison of large numbers of strings plays a centralrole in ontology matching, record linkage and link discovery. While sev-eral standard string distance and similarity measures have been devel-oped with these explicit goals in mind, similarities and distances learnedout of the data have been shown to often perform better with respectto the F-measure that they can achieve. Still, the practical use of data-specific measures is often hindered by one major factor: their runtime.While time-efficient algorithms that allow scaling to millions of stringshave been developed for standard metrics over the last years, data-specific versions of these measures are usually slow to run and requiresignificantly more time for the same task. In this paper, we present anapproach for the time-efficient execution of weighted edit distances. Ourapproach is based on a sequence of efficient filters that allow reducingthe number of candidate pairs for which the weighted edit distance hasto be computed. We also show how existing time-efficient deduplicationapproaches based on the edit distance can be extended to deal withweighted edit distances. We compare our approach with such an exten-sion of PassJoin on benchmark data and show that we outperform it bymore than one order of magnitude.
1 Introduction
The computation of string similarities plays a central role in manifold disciplines,especially in ontology matching and link discovery on the Web of Data1 [20].Over the last decades, manifold domain-specific string similarities have beendeveloped for improving the accuracy of automatic techniques that rely on them.For example, the Jaro-Winkler similarity was developed especially to performwell on person names [22]. Still, newer works in machine learning have shownthat learning string similarities directly from data can lead to algorithms with aperformance superior to that of those which rely on standard similarity measures.Especially, work on link discovery on the Web of Data has shown that data-specific weighted edit distances can lead to higher F-measures [21].
One main problem has yet plagued the approaches which rely on string simi-larity measures learned from data: their runtime. While dedicated algorithms for
1 Throughout this paper, we use the expression “link discovery” to mean the discoveryof typed relations that link instances from knowledge bases on the Web of Data.

the time-efficient comparison of large volumes of data have been developed overthe last years (e.g., PPJoin+ [24], EDJoin [23], PassJoin [12] and TrieJoin [6]),the time-efficient computation of data-specific string similarities has been paidlittle attention to. Thus, running the data-specific counterparts of standard sim-ilarity measures is often orders of magnitude slower. Previous work have circum-vented this problem in manifold ways, including the execution of approximationsof the data-specific similarity measure. For example, weighted edit distancesare sometimes approximated by first computing the edit distance between twostrings A and B and only subsequently applying the weight of each of the editoperations [10]. Other approximations can be found in [3, 2].
In this paper, we address the problem of the time-efficient computation ofweighted edit distances by presenting a novel approach, REEDED. Our approachuses weight bounds on the input cost matrix to efficiently discard similaritycomputations that would lead to dissimilar pairs. By these means, REEDED canoutperform state-of-the-art approaches for the computation of edit distances bymore than one order of magnitude on real datasets. We explain our approachby using an example from link discovery based on the data shown in Table 1.Here, the task is to detect possible pairs (s, t) ∈ S×T such that s owl:sameAs t,where S is a set of source resources and T is a set of target resources.
This paper is structured as follows: In Section 2, we present preliminaries toour work. Thereafter, we present the REEDED approach for the time-efficientcomputation of weighted edit distances (Section 3). In Section 4, we evaluateour approach on four datasets and show that we outperform a weighted versionof the state-of-the-art approach PassJoin by more than one order of magnitude.Finally, we conclude with Section 6 after giving a brief overview of related workin Section 5.
2 Preliminaries
2.1 Notation and Problem Statement
Let Σ be an alphabet and Σ∗ be the set all sequences that can be generated byusing elements of Σ. We call the elements of Σ characters and assume that Σcontains the empty character ε. The edit distance – or Levenshtein distance –of two strings A ∈ Σ∗ and B ∈ Σ∗ is the minimum number of edit operationsthat must be performed to transform A into B [11]. An edit operation can bethe insertion or the deletion of a character, or the substitution of a characterwith another one. In a plain edit distance environment, all edit operations havea cost of 1. Thus, the distance between the strings “Generalized” and “Gener-alised” is the same as the distance between “Diabetes Type I” and “DiabetesType II”. Yet, while the first pair of strings is clearly semantically equivalentfor most applications, the elements of the second pair bears related yet signif-icantly different semantics (especially for medical applications). To account forthe higher probability of edit operations on certain characters bearing a highersemantic difference, weighted edit distances were developed. In a weighted editdistance environment, a cost function cost : Σ × Σ → [0, 1] assigned to each of
the possible edit operations. The totality all of costs can be encoded in a costmatrix M . The cost matrix is quadratic and of dimensions |Σ| × |Σ| for whichthe following holds:
∀i ∈ {1, . . . , |Σ|} mii = 0 (1)
The entry mij is the cost for substituting the ith character ci of Σ with the jth
character cj of the same set. Note that if ci = ε, mij encode the insertion of cj .On the other hand, if cj = ε, mij encode the deletion of ci.
In most applications which require comparing large sets of strings, stringsimilarities are used to address the following problem: Given a set S of sourcestrings and a set T of target strings, find the setR(S, T, δp, θ) of all pairs (A,B) ∈S × T such that
δp(A,B) ≤ θ (2)
where θ is a distance threshold and δp is the plain edit distance. Several scal-able approaches have been developed to tackle this problem for plain edit dis-tances [12, 24, 23]. Still, to the best of our knowledge, no scalable approach hasbeen proposed for finding all (A,B) ∈ S × T such that δ(A,B) ≤ θ for weightededit distances δ. In this paper we address exactly this problem by presentingREEDED. This approach assumes that the computation of weighted edit dis-tances can be carried out by using an extension of the dynamic programmingapproach used for the plain edit distance.
2.2 Extension of Non-Weighted Approaches
All of the approaches developed to address the problem at hand with the plainedit distance can be easily extended to deal with weighted edit distances forwhich the dynamic programming approach underlying the computation of theplain edit distance still holds. Such an extension can be carried out in the fol-lowing fashion: Let
μ = min1≤i,j≤|Σ|∧i�=j
mij . (3)
Then, if the weighted edit distance between two strings A and B is d, then atmost d/μ edit operations were carried out to transform A into B. By using thisinsight, we can postulate that for any weighted edit distance δ with cost matrixM , the following holds
∀A ∈ Σ∗ ∀B ∈ Σ∗ δ(A,B) ≤ θ → δp(A,B) ≤ θ
μ. (4)
Thus, we can reduce the task of finding the set R(S, T, δ, θ) to that of firstfinding R(S, T, δp, θ/μ) and subsequently filtering R(S, T, δp, θ/μ) by using thecondition δ(A,B) ≤ θ. To the best of our knowledge, PassJoin [12] is currentlythe fastest approach for computing R(S, T, δp, θ) with plain edit distances. Wethus extended it to deal with weighted edit distances and compared it with ourapproach. Our results show that we outperform the extension of PassJoin bymore than one order of magnitude.
3 The REEDED Approach
3.1 Overview
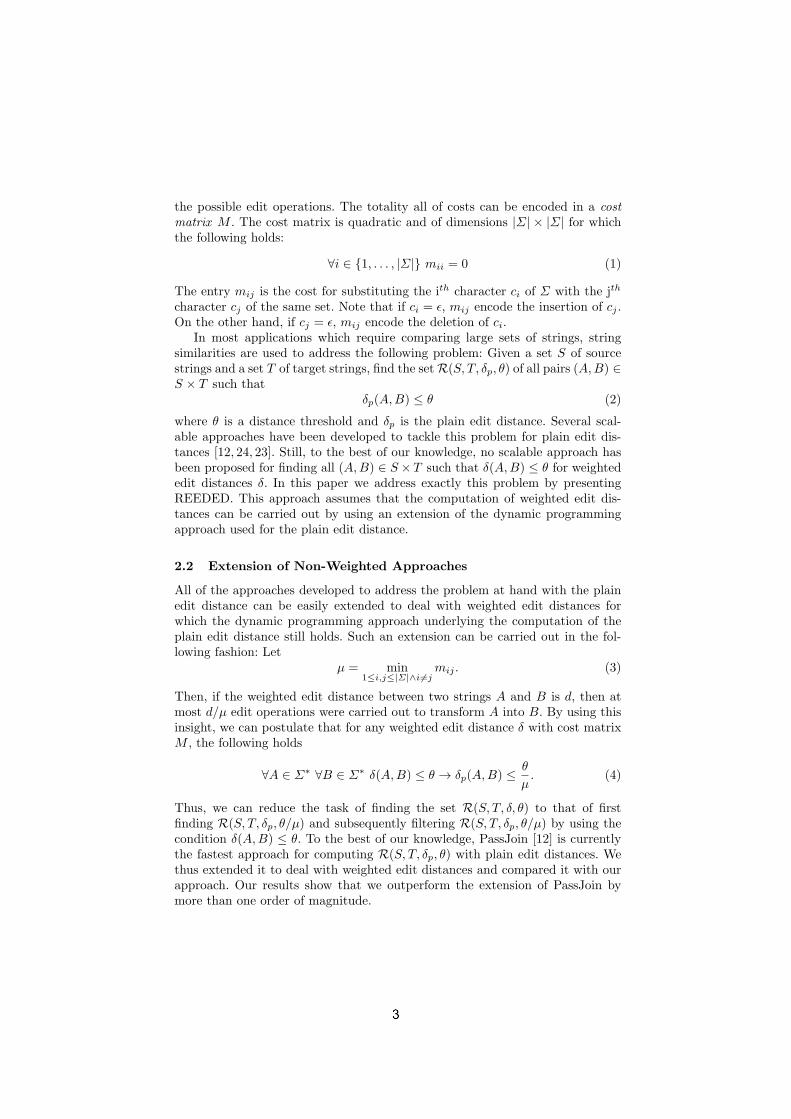
Our approach REEDED (Rapid Execution of Weighted Edit Distances) aims tocompute similar strings using weighted edit distance within a practicable amountof time. The REEDED approach is basically composed of three nested filters asshown in Figure 1, where each filter takes a set of pairs as input and yieldsa subset of the input set according to a predefined rule. In the initial step ofREEDED, the input data is loaded from S, a source data set, and T , a targetdata set. Their Cartesian product S × T is the input of the first length-awarefilter. The output of the first filter L is the input of the second character-awarefilter. The weighted edit distance will be calculated only for the pairs that passthrough the second filter, i.e. set N . The final result A is the set of pairs whoseweighted edit distance is less or equal than a threshold θ. Note that pairs areprocessed one by one. This ensures that our algorithm performs well with respectto its space complexity.
Fig. 1. Flowchart of the REEDED approach.
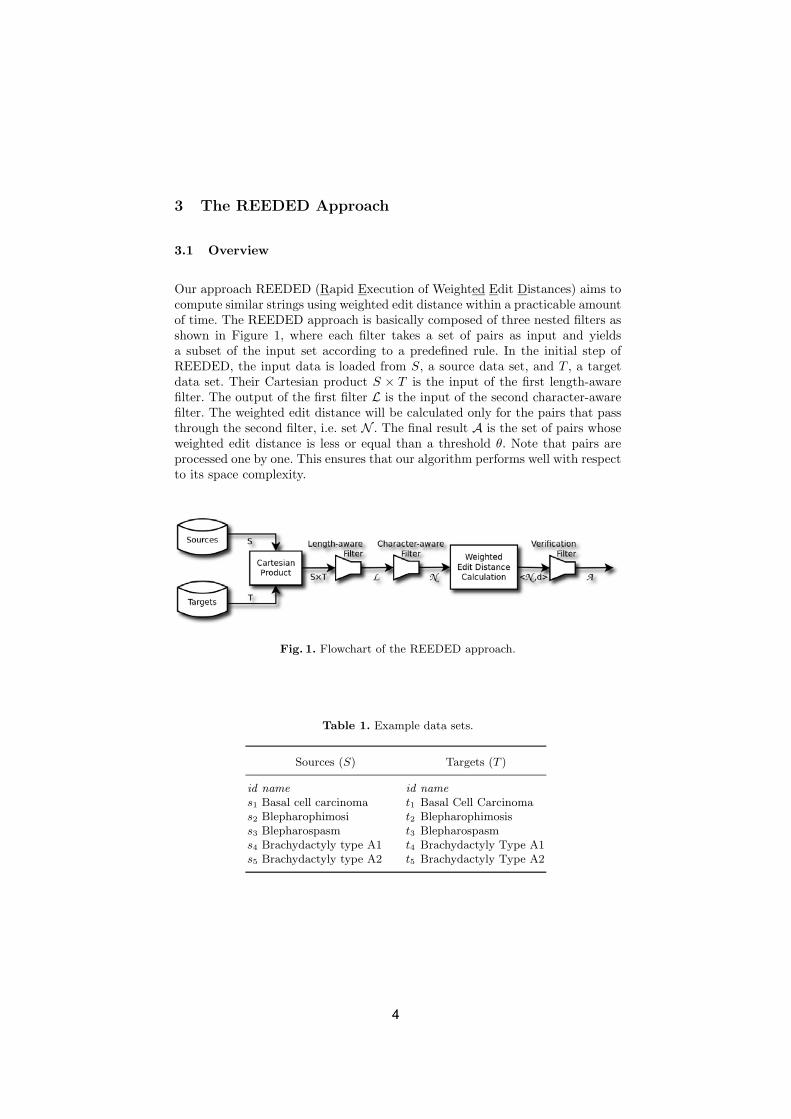
Table 1. Example data sets.
Sources (S) Targets (T )
id name id names1 Basal cell carcinoma t1 Basal Cell Carcinomas2 Blepharophimosi t2 Blepharophimosiss3 Blepharospasm t3 Blepharospasms4 Brachydactyly type A1 t4 Brachydactyly Type A1s5 Brachydactyly type A2 t5 Brachydactyly Type A2

3.2 Key Assumption
Similarly to the extensions of plain edit distances for weighted edit distances,REEDED assumes the dynamic programming approach commonly used for com-puting plain edit distances can be used for computing the weighted edit distancedescribed by the cost matrix M . With respect to M , this assumption translatesto the weights in the matrix being such that there is no sequence of two editoperations mij and mi′j′ that is equivalent to a third edit operation mi′′j′′ with
mi′′j′′ > mij +mi′j′ . (5)
for (i �= j) ∧ (i′ �= j′) ∧ (i′′ �= j′′). Formally, we can enforce this condition of thecost matrix M by ensuring that
∃k > 0 ∀mij : k < mij ≤ 2k. (6)
Given that the entries in cost matrices are usually bound to have a maximalvalue of 1, we will assume without restriction of generality that
∀i ∈ {1, . . . , |Σ|}∀j ∈ {1, . . . , |Σ|} i �= j → 0.5 < mij ≤ 1. (7)
Thus, in the following, we will assume that ∀mij : mij > 0.5.
3.3 Length-aware Filter
The length-aware filter is the first filter of REEDED. Once the data sets havebeen loaded, the Cartesian product
S × T = {〈s, t〉 : s ∈ S, t ∈ T} (8)
is computed, which in our example corresponds to {〈s1, t1〉, 〈s1, t2〉, . . . , 〈s5, t5〉}.The basic insight behind the first filter is that given two strings s and t withlengths |s| resp. |t|, we need at least ||s|− |t|| edit operations to transform s intot. Now given that each edit operation costs at least μ, the cost of transformings to t will be at least μ||s| − |t||. Consequently, the rule which the filter relies onis the following:
〈s, t〉 ∈ L ⇒ 〈s, t〉 ∈ S × T ∧ ||s| − |t|| ≤ θ/μ. (9)
In the following, we will set τ = θ/μ, where μ is as defined in Equation (3).
In our example, let us assume θ = 1 and mij ∈ (0.5, 1.0]. Then, τ = 2. If weassume that S.name has been mapped to T.name, then at the end of this step,13 of the 25 initial pairs in S × T are dismissed. The remaining 8 pairs are:
L = {〈s1, t1〉, 〈s2, t2〉, 〈s3, t3〉, 〈s4, t4〉, 〈s5, t5〉, 〈s2, t3〉, 〈s4, t5〉, 〈s5, t4〉} . (10)
3.4 Character-aware Filter
The second filter is the character-aware filter which only selects the pairs ofstrings that do not differ by more than a given number of characters. The intu-ition behind the filter is that given two strings s and t, if |C| is the number ofcharacters that do not belong to both strings, we need at least �|C|/2 opera-tions to transform s into t. As above, the cost of transforming s to t will be atleast μ�|C|/2 . The characters of each string are collected into two sets, respec-tively Cs for the source string and Ct for the target string. Since s and t maycontain more than one occurrence of a single character, characters in Cs and Ct
are enumerated. Then, the algorithm computes their exclusive disjunction C:
C = Cs ⊕ Ct. (11)
Finally, the filter performs the selection by applying the rule:
〈s, t〉 ∈ N ⇐⇒ 〈s, t〉 ∈ L ∧⌈ |C|
2
⌉≤ τ. (12)
In our example, a further pair can be dismissed by these means, leading to theset of remaining pairs being as follows:
N = {〈s1, t1〉, 〈s2, t2〉, 〈s3, t3〉, 〈s4, t4〉, 〈s5, t5〉, 〈s4, t5〉, 〈s5, t4〉}The pair that is rejected is 〈s2, t3〉, for which C = {h1, i1, o1, i2, a1, s1}, whichleads to the rule not being satisfied.
3.5 Verification
For all the pairs left in N , the weighted edit distance among is calculated. Afterthat, the third filter selects the pairs whose distance is less or equal than θ.
〈s, t〉 ∈ A ⇐⇒ 〈s, t〉 ∈ N ∧ δ (s, t) ≤ θ (13)
In our example data sets, the set
A = {〈s1, t1〉, 〈s2, t2〉, 〈s3, t3〉, 〈s4, t4〉, 〈s5, t5〉} (14)
is the final result of the selection. Note that the pairs 〈s4, t5〉 and 〈s5, t4〉 arediscarded, because their distance (1.2) is greater than the threshold (1.0). 2
4 Evaluation
The goal of our evaluation was to quantify how well REEDED performs in com-parison to the state of the art. We thus compared REEDED with the extensionof PassJoin as proposed in [12]. We chose PassJoin because it was shown to out-perform other approaches for the efficient computation of edit distances, incl.EDJoin [23] and TrieJoin [6]. Note that we did run an implementation of EdJoinon the DBLP dataset presented below and it required approximately twice theruntime of PassJoin.2 A proof of the correctness of REEDED can be found in the extended version of thispaper at http://svn.aksw.org/papers/2013/OM_Reeded/public.pdf.

4.1 Experimental Setup
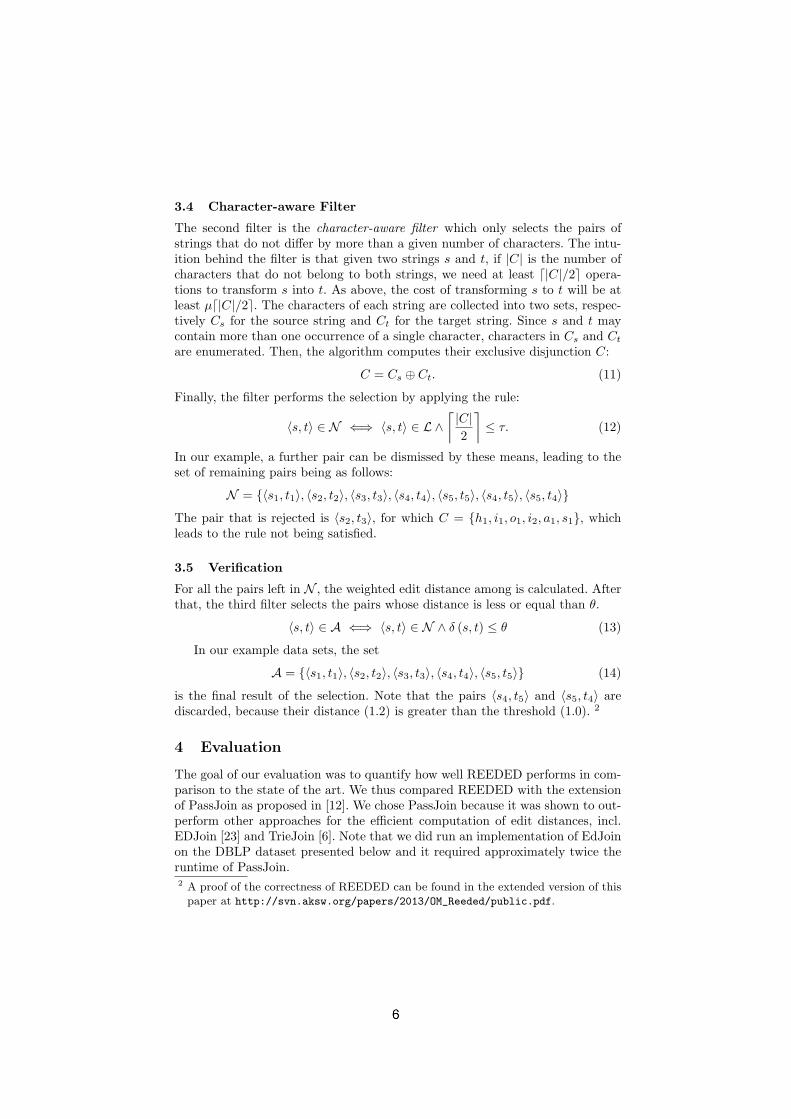
We compared the approaches across several distance thresholds on four differ-ent datasets that were extracted from real data (see Fig. 2).3 The first two ofthese data sets contained publication data from the datasets DBLP and ACM.The third and fourth dataset contained product labels from the product cata-logs Google Products and ABT [9]. We chose these datasets because they wereextracted from real data sources and because of the different string length dis-tribution across them. By running our experiments on these data sets, we couldthus ensure that our results are not only valid on certain string length distribu-tions. As weight matrix we used a confusion matrix built upon the frequency oftypographical errors presented in [8]. The original confusion matrices report thenumber of occurrences f for each error:
ΦS = {fij : substitution of i (incorrect) for j (correct)} (15)
ΦI = {fij : insertion of j after i} (16)
ΦD = {fij : deletion of j after i} (17)
For insertion and deletion, we calculate the total frequency:
ωIj =
∑i
ΦIij (18)
ωDj =
∑i
ΦDij (19)
The weights of our weight matrix are thus defined as:
mij =
⎧⎪⎪⎨⎪⎪⎩
1− ΦSij
2max(ΦS): i �= ε ∧ j �= ε
1− ωIj−min(ωI)
2(max(ωI)−min(ωI)): i = ε ∧ j �= ε
1− ωDi −min(ωD)
2(max(ωD)−min(ωD)): i �= ε ∧ j = ε
(20)
In other words, the higher the probability of an error encoded in mij , the lowerits weight.
All experiments were carried out on a 64-bit server running Ubuntu 10.0.4with 4 GB of RAM and a 2.5 GHz XEON CPU. Each experiment was run 5times.
4.2 Results
In Figure 2 we show the string length distribution in the data sets. The results ofour experiments are shown in Table 2. Our results show clearly that REEDED
3 The data used for the evaluation is publicly available at http://dbs.uni-leipzig.de/en/research/projects/object\_matching/fever/benchmark\_datasets\
_for\_entity\_resolution.
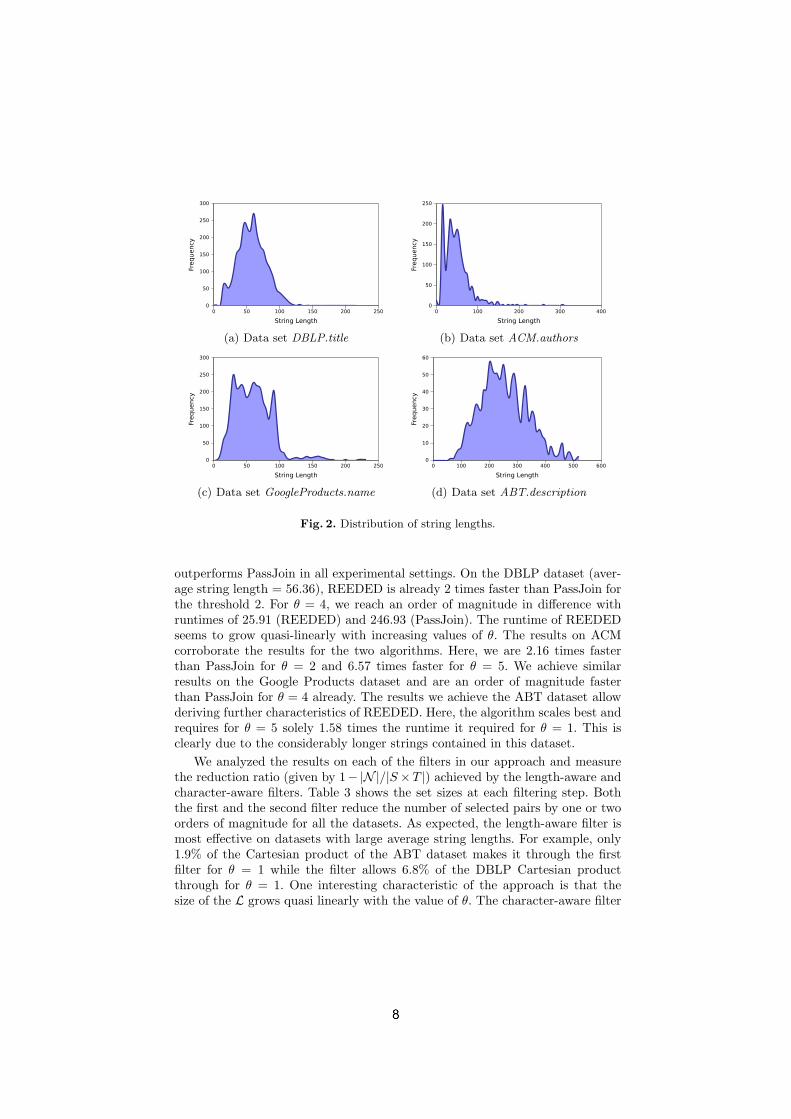
(a) Data set DBLP.title (b) Data set ACM.authors
(c) Data set GoogleProducts.name (d) Data set ABT.description
Fig. 2. Distribution of string lengths.
outperforms PassJoin in all experimental settings. On the DBLP dataset (aver-age string length = 56.36), REEDED is already 2 times faster than PassJoin forthe threshold 2. For θ = 4, we reach an order of magnitude in difference withruntimes of 25.91 (REEDED) and 246.93 (PassJoin). The runtime of REEDEDseems to grow quasi-linearly with increasing values of θ. The results on ACMcorroborate the results for the two algorithms. Here, we are 2.16 times fasterthan PassJoin for θ = 2 and 6.57 times faster for θ = 5. We achieve similarresults on the Google Products dataset and are an order of magnitude fasterthan PassJoin for θ = 4 already. The results we achieve the ABT dataset allowderiving further characteristics of REEDED. Here, the algorithm scales best andrequires for θ = 5 solely 1.58 times the runtime it required for θ = 1. This isclearly due to the considerably longer strings contained in this dataset.
We analyzed the results on each of the filters in our approach and measurethe reduction ratio (given by 1− |N |/|S×T |) achieved by the length-aware andcharacter-aware filters. Table 3 shows the set sizes at each filtering step. Boththe first and the second filter reduce the number of selected pairs by one or twoorders of magnitude for all the datasets. As expected, the length-aware filter ismost effective on datasets with large average string lengths. For example, only1.9% of the Cartesian product of the ABT dataset makes it through the firstfilter for θ = 1 while the filter allows 6.8% of the DBLP Cartesian productthrough for θ = 1. One interesting characteristic of the approach is that thesize of the L grows quasi linearly with the value of θ. The character-aware filter

Table 2. Runtime results in seconds.
PassJoin REEDEDDataset θ average st.dev. average st.dev.
1 10.75 ± 0.92 10.38 ± 0.352 30.74 ± 5.00 15.27 ± 0.76
DBLP.title 3 89.60 ± 1.16 19.84 ± 0.144 246.93 ± 3.08 25.91 ± 0.295 585.08 ± 5.47 37.59 ± 0.43
1 9.07 ± 1.05 6.16 ± 0.072 18.53 ± 0.22 8.54 ± 0.29
ACM.authors 3 42.97 ± 1.02 12.43 ± 0.474 98.86 ± 1.98 20.44 ± 0.275 231.11 ± 2.03 35.13 ± 0.35
1 17.86 ± 0.22 15.08 ± 2.502 62.31 ± 6.30 20.43 ± 0.10
GoogleProducts.name 3 172.93 ± 1.59 27.99 ± 0.194 475.97 ± 5.34 42.46 ± 0.325 914.60 ± 10.47 83.71 ± 0.97
1 74.41 ± 1.80 24.48 ± 0.412 140.73 ± 1.40 27.71 ± 0.29
ABT.description 3 217.55 ± 7.72 30.61 ± 0.344 305.08 ± 4.78 34.13 ± 0.305 410.72 ± 3.36 38.73 ± 0.44
seems to have the opposite behavior to the length-aware filter and can discardmore string pair on data with small average string lengths. For example, lessthan 1% of L makes it through the filter for θ = 1 on the DBLP dataset while5.1% of L makes it through the same filter for θ = 1 on ABT.
We also measured the runtime improvement as well as the precision and re-call we achieved by combining REEDED with the ACIDS approach and applyingthis combination to the datasets reported in [21]. The results are shown in Ta-ble 4. For the datasets on which the edit distance can be used, the approachachieves a superior precision and recall than state-of-the-art approaches (suchas MARLIN [4] and Febrl [5]) which do not rely on data-specific measures. Yet,on more noisy datasets, the approach leads to poorer results. In particular, theedit distance has been shown not to be a good measure when the strings to becompared are too long. Also, the words contained in the source string may becompletely different from the words contained in the target string, yet referringto the same meaning. A notable shortcoming of the ACIDS approach is the run-time, wherein the learning system iterated for at least 7 hours to find the weightconfiguration of the weighted edit distance and optimize the classification [21].As shown in Table 4, REEDED enhances the execution time of ACIDS reduc-ing the total runtime by 3 orders of magnitude on the DBLP–ACM and theABT–Buy dataset.
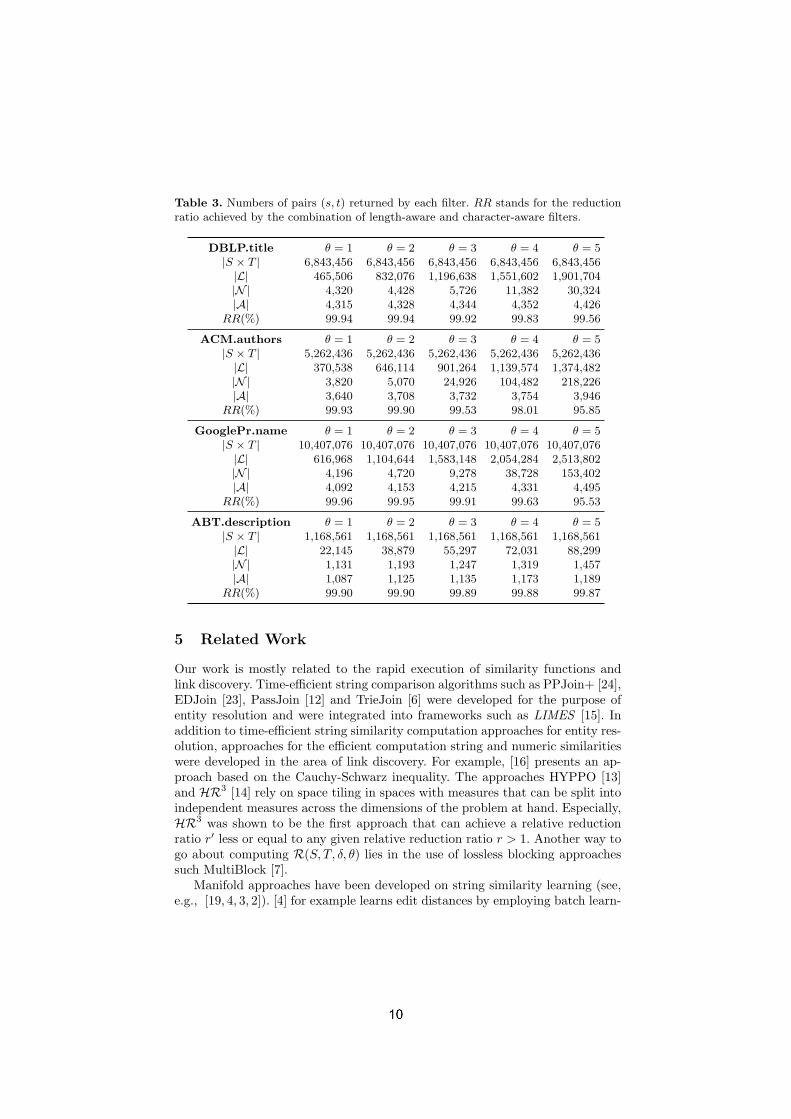
Table 3. Numbers of pairs (s, t) returned by each filter. RR stands for the reductionratio achieved by the combination of length-aware and character-aware filters.
DBLP.title θ = 1 θ = 2 θ = 3 θ = 4 θ = 5|S × T | 6,843,456 6,843,456 6,843,456 6,843,456 6,843,456|L| 465,506 832,076 1,196,638 1,551,602 1,901,704|N | 4,320 4,428 5,726 11,382 30,324|A| 4,315 4,328 4,344 4,352 4,426
RR(%) 99.94 99.94 99.92 99.83 99.56
ACM.authors θ = 1 θ = 2 θ = 3 θ = 4 θ = 5|S × T | 5,262,436 5,262,436 5,262,436 5,262,436 5,262,436|L| 370,538 646,114 901,264 1,139,574 1,374,482|N | 3,820 5,070 24,926 104,482 218,226|A| 3,640 3,708 3,732 3,754 3,946
RR(%) 99.93 99.90 99.53 98.01 95.85
GooglePr.name θ = 1 θ = 2 θ = 3 θ = 4 θ = 5|S × T | 10,407,076 10,407,076 10,407,076 10,407,076 10,407,076|L| 616,968 1,104,644 1,583,148 2,054,284 2,513,802|N | 4,196 4,720 9,278 38,728 153,402|A| 4,092 4,153 4,215 4,331 4,495
RR(%) 99.96 99.95 99.91 99.63 95.53
ABT.description θ = 1 θ = 2 θ = 3 θ = 4 θ = 5|S × T | 1,168,561 1,168,561 1,168,561 1,168,561 1,168,561|L| 22,145 38,879 55,297 72,031 88,299|N | 1,131 1,193 1,247 1,319 1,457|A| 1,087 1,125 1,135 1,173 1,189
RR(%) 99.90 99.90 99.89 99.88 99.87
5 Related Work
Our work is mostly related to the rapid execution of similarity functions andlink discovery. Time-efficient string comparison algorithms such as PPJoin+ [24],EDJoin [23], PassJoin [12] and TrieJoin [6] were developed for the purpose ofentity resolution and were integrated into frameworks such as LIMES [15]. Inaddition to time-efficient string similarity computation approaches for entity res-olution, approaches for the efficient computation string and numeric similaritieswere developed in the area of link discovery. For example, [16] presents an ap-proach based on the Cauchy-Schwarz inequality. The approaches HYPPO [13]and HR3 [14] rely on space tiling in spaces with measures that can be split intoindependent measures across the dimensions of the problem at hand. Especially,HR3 was shown to be the first approach that can achieve a relative reductionratio r′ less or equal to any given relative reduction ratio r > 1. Another way togo about computing R(S, T, δ, θ) lies in the use of lossless blocking approachessuch MultiBlock [7].
Manifold approaches have been developed on string similarity learning (see,e.g., [19, 4, 3, 2]). [4] for example learns edit distances by employing batch learn-

Table 4. Results for the combination of ACIDS and REEDED. The runtimes in the 2rows at the bottom are in seconds.
DBLP–ACM DBLP–Scholar ABT–Buy
Labeled examples 20 40 20 40 20 40F-score (%) 88.98 97.92 70.22 87.85 0.40 0.60Precision (%) 96.71 96.87 64.73 91.88 0.20 0.30Recall (%) 82.40 99.00 76.72 84.16 100.00 100.00Without REEDED 27,108 26,316 30,420 30,096 44,172 43,236With REEDED 14.25 14.24 668.62 668.62 13.03 65.21
ing and SVMs to record deduplication and points out that domain-specific simi-larities can improve the quality of classifiers. [3, 2] rely on a theory for good editdistances developed by [1] to determine classifiers based on edit distances thatare guaranteed to remain under a given classification error. Yet, to the best ofour knowledge, REEDED is the first approach for the time-efficient execution ofweighted edit distances.
6 Conclusion
In this paper we presented REEDED, an approach for the time-efficient com-parison of sets using weighted distances. After presenting the intuitions behindour approach, we proved that it is both correct and complete. We compared ourapproach with an extension of PassJoin for weighted edit distances and showedthat we are more than an order of magnitude faster on 4 different data sets.REEDED is the cornerstone of a larger research agenda. As it enable to nowrun weighted edit distances on large datasets within acceptable times, it is alsothe key to developing active learning systems for link discovery that do not onlylearn link specifications but also similarity measures directly out of the data.As shown in [21], this combination promises to outperform the state of the art,which has relied on standard measures so far. In future work, we will thus com-bine REEDED with specification learning approaches such as EAGLE [18] andRAVEN [17] and study the effect of weighted edit distances on these approaches.
References
1. Maria-Florina Balcan, Avrim Blum, and Nathan Srebro. Improved guarantees forlearning via similarity functions. In COLT, pages 287–298, 2008.
2. Aurelien Bellet, Amaury Habrard, and Marc Sebban. Good edit similarity learningby loss minimization. Machine Learning, 89(1-2):5–35, 2012.
3. Aurlien Bellet, Amaury Habrard, and Marc Sebban. Learning good edit similaritieswith generalization guarantees. In Proceedings of the ECML/PKDD 2011, 2011.
4. Mikhail Bilenko and Raymond J. Mooney. Adaptive duplicate detection usinglearnable string similarity measures. In KDD, pages 39–48, 2003.

5. Peter Christen. Febrl: a freely available record linkage system with a graphicaluser interface. In Proceedings of the second Australasian workshop on Health dataand knowledge management - Volume 80, HDKM ’08, pages 17–25, Darlinghurst,Australia, Australia, 2008. Australian Computer Society, Inc.
6. Jianhua Feng, Jiannan Wang, and Guoliang Li. Trie-join: a trie-based method forefficient string similarity joins. The VLDB Journal, 21(4):437–461, August 2012.
7. Robert Isele, Anja Jentzsch, and Christian Bizer. Efficient Multidimensional Block-ing for Link Discovery without losing Recall. In WebDB, 2011.
8. Mark D. Kernighan, Kenneth Ward Church, and William A. Gale. A spellingcorrection program based on a noisy channel model. In COLING, pages 205–210,1990.
9. Hanna Kopcke, Andreas Thor, and Erhard Rahm. Evaluation of entity resolutionapproaches on real-world match problems. PVLDB, 3(1):484–493, 2010.
10. S. Kurtz. Approximate string searching under weighted edit distance. In Proc.WSP, volume 96, pages 156–170. Citeseer, 1996.
11. V. I. Levenshtein. Binary codes capable of correcting deletions, insertions, andreversals. Doklady Akademii Nauk SSSR 163 (4), pages 845–848, 1965.
12. Guoliang Li, Dong Deng, Jiannan Wang, and Jianhua Feng. Pass-join: a partition-based method for similarity joins. Proc. VLDB Endow., 5(3):253–264, November2011.
13. Axel-Cyrille Ngonga Ngomo. A Time-Efficient Hybrid Approach to Link Discovery.In OM, 2011.
14. Axel-Cyrille Ngonga Ngomo. Link Discovery with Guaranteed Reduction Ratio inAffine Spaces with Minkowski Measures. In ISWC, pages 378–393, 2012.
15. Axel-Cyrille Ngonga Ngomo. On Link Discovery using a Hybrid Approach. Journalon Data Semantics, 1:203 – 217, 2012.
16. Axel-Cyrille Ngonga Ngomo and Soren Auer. LIMES - A Time-Efficient Approachfor Large-Scale Link Discovery on the Web of Data. In IJCAI, pages 2312–2317,2011.
17. Axel-Cyrille Ngonga Ngomo, Jens Lehmann, Soren Auer, and Konrad Hoffner.RAVEN – Active Learning of Link Specifications. In Sixth International OntologyMatching Workshop, 2011.
18. Axel-Cyrille Ngonga Ngomo and Klaus Lyko. Eagle: Efficient active learning oflink specifications using genetic programming. In Proceedings of ESWC, 2012.
19. E. S. Ristad and P. N. Yianilos. Learning string-edit distance. Pattern Analysisand Machine Intelligence, IEEE Transactions on, 20(5):522–532, 1998.
20. Pavel Shvaiko and Jerome Euzenat. Ontology matching: State of the art and futurechallenges. IEEE Trans. Knowl. Data Eng., 25(1):158–176, 2013.
21. Tommaso Soru and Axel-Cyrille Ngonga Ngomo. Active learning of domain-specificdistances for link discovery. In Proceedings of JIST, 2012.
22. William E. Winkler. Overview of record linkage and current research directions.Technical report, BUREAU OF THE CENSUS, 2006.
23. Chuan Xiao, Wei Wang, and Xuemin Lin. Ed-Join: an efficient algorithm forsimilarity joins with edit distance constraints. PVLDB, 1(1):933–944, 2008.
24. Chuan Xiao, Wei Wang, Xuemin Lin, and Jeffrey Xu Yu. Efficient similarity joinsfor near duplicate detection. In WWW, pages 131–140, 2008.

To repair or not to repair: reconciling correctnessand coherence in ontology reference alignments
Catia Pesquita1, Daniel Faria1, Emanuel Santos1, and Francisco M. Couto1
1Dept. de Informatica, Faculdade de Ciencias, Universidade de Lisboa, [email protected]
Abstract. A recent development in the field of ontology matching isthe alignment repair process, whereby mappings that lead to unsatisfi-able classes are removed to ensure that the final alignment is coherent.This process was showcased in the Large Biomedical Ontologies trackof OAEI 2012, where two repair systems (ALCOMO and LogMap) wereused to create separate coherent reference alignments from the originalalignment based on the UMLS metathesaurus. In 2013, the OAEI intro-duced new reference alignments for this track, created by using the tworepair systems in conjunction and manual curation when necessary. Inthis paper, we present the results of a manual analysis of the OAEI 2013Large Biomedical Ontologies reference alignments, focused on evaluat-ing the equivalence mappings removed by the repair process as well asthose that were replaced by subsumption mappings. We found that up totwo-thirds of the removed mappings were correct and that over 90% ofthe analyzed subsumption mappings were incorrect, since in most casesthe correct type of relation was the original equivalence. We discuss theimpact that disregarding correctness to ensure coherence can have onpractical ontology matching applications, as well as on the evaluation ofontology matching systems.
Keywords: Ontology Matching, Alignment Repair, Reference Align-ment, Biomedical Ontologies
1 Introduction
With ontologies growing in size and complexity, the interest in efficient and effec-tive matching methods capable of handling large and heterogeneous ontologiesis also on the rise. This is evidenced by the recent introduction of the LargeBiomedical Ontologies track in the Ontology Alignment Evaluation Initiative(OAEI) [1], currently the major benchmark for ontology alignment evaluation[2].The OAEI large biomedical track consists of finding alignments between theFoundational Model of Anatomy (FMA)[3], SNOMED CT [4], and the NationalCancer Institute Thesaurus (NCI) [5]. These ontologies are semantically rich andcontain tens of thousands of classes.However, evaluating the matching of very large ontologies is in itself a recognized

2 Pesquita et. al
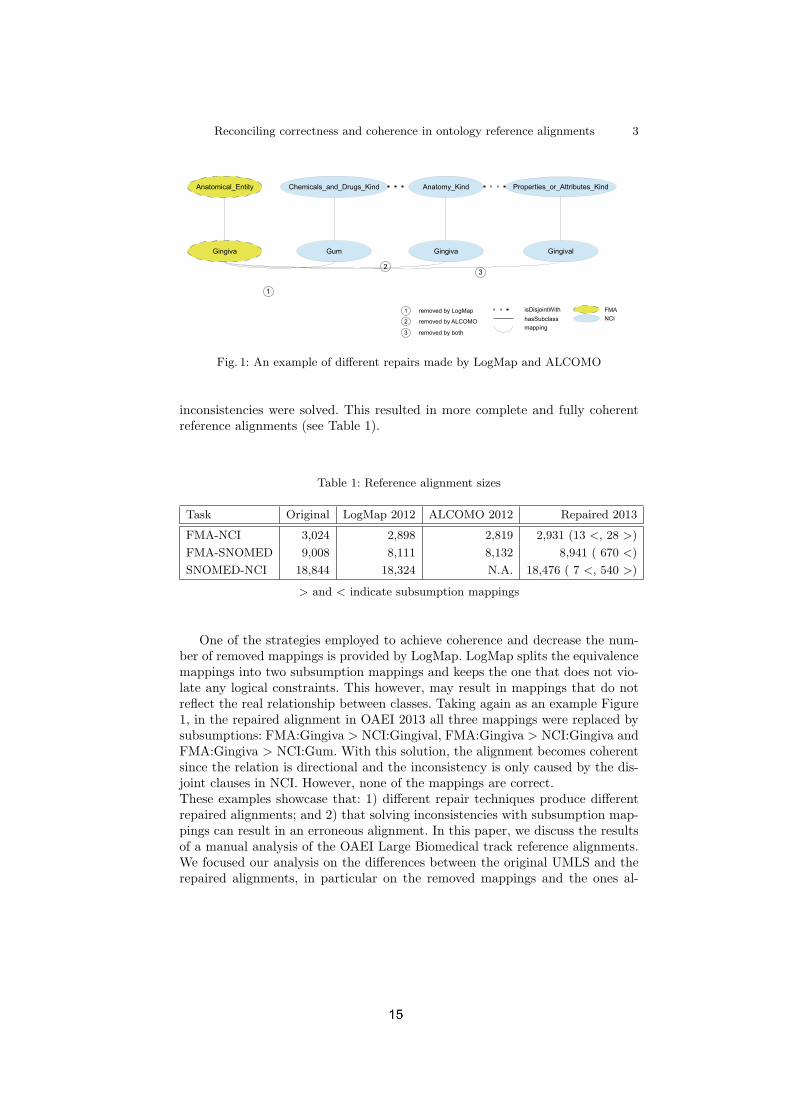
challenge [6], since the most common type of ontology matching evaluation relieson the comparison of an alignment produced by an ontology matching systemagainst a reference alignment. For smaller ontologies, reference alignments aremanually built, and can then be subject to debugging and quality checkingsteps [7, 8]. However for very large ontologies this is unfeasible since the numberof mappings that need to be manually evaluated grows quadratically with thenumber of classes in an ontology. Even if some heuristics are used to reduce thesearch space, the human effort is still too demanding, especially when we arefacing ontologies with tens or even hundreds of thousands of classes [9].Consequently, efforts have been made to create reference alignments in an auto-mated or semi-automated fashion [9–11]. One possible strategy to achieve thisis based on existing resources from which the reference alignment can be de-rived. For the three tasks in the large biomedical track in OAEI, the referencealignments were created by processing UMLS metathesaurus entries. UMLS com-bines expert assessment with automated methods to connect classes from distinctbiomedical ontologies and thesaurii according to their meaning.However, the produced reference alignments lead to a considerable number ofunsatisfiable classes when they are integrated with the input ontologies, andwhile the integration of FMA with NCI generates only 655 unsatisfiable classes,the integration of SNOMED CT and NCI leads to more than 20,000 unsatisfi-able classes [12]. To address this issue, in OAEI 2012, in addition to the originalreference alignment, two additional references were created by employing twodifferent techniques to repair the logical inconsistencies of the original align-ment, ALCOMO [13] and the repair facility of the ontology matching systemLogMap [14, 10] (LogMap-Repair).Ensuring that the alignment between two ontologies is coherent, i.e., that noclass or property is unsatisfiable, has recently become a major focus for ontol-ogy matching. This is especially relevant when matching very large ontologies,which typically produce more unsatisfiable classes. To ensure the coherence ofthe alignment, a system needs to first detect the incoherencies and then repairthem, by removing or altering them, in order to improve the coherent alignmentwith minimum intervention. However, different repair methods can produce dif-ferent alignments. For instance, Figure 1 depicts three conflicting mappings inthe original UMLS reference alignment for FMA-NCI. Each system removed twomappings to solve the inconsistencies caused by the disjoint clauses in NCI, butwhile ALCOMO removed mappings 2 and 3, LogMap removed 1 and 3. In thiscase, mapping 2 is correct. However the systems have no way of inferring thisfrom the ontologies and alignment, since there are no mappings between thesuperclasses. For instance, if Anatomy Kind was mapped to Anatomical Entity,then this information could be used to disambiguate between Gingiva and Gum.The application of these techniques reduced the number of unsatisfiable classesto a few [1]. However, this automated process for repair is rather agressive, re-moving a significant number of mappings (up to 10%). In an effort to counteractthis, in OAEI 2013, the three reference alignments were refined by using the tworepair systems in conjunction and manual curation when necessary to ensure all
Reconciling correctness and coherence in ontology reference alignments 3
�������������� ��
����� ��������� ���� ������������������ ����������
��������
����������������������������
��
�
����� ����!���
���"�� ����
������
#$
%�&
�
�
�
������'��'(��$��
������'��'(�)$)
������'��'����
Fig. 1: An example of different repairs made by LogMap and ALCOMO
inconsistencies were solved. This resulted in more complete and fully coherentreference alignments (see Table 1).
Table 1: Reference alignment sizes
Task Original LogMap 2012 ALCOMO 2012 Repaired 2013
FMA-NCI 3,024 2,898 2,819 2,931 (13 <, 28 >)
FMA-SNOMED 9,008 8,111 8,132 8,941 ( 670 <)
SNOMED-NCI 18,844 18,324 N.A. 18,476 ( 7 <, 540 >)
> and < indicate subsumption mappings
One of the strategies employed to achieve coherence and decrease the num-ber of removed mappings is provided by LogMap. LogMap splits the equivalencemappings into two subsumption mappings and keeps the one that does not vio-late any logical constraints. This however, may result in mappings that do notreflect the real relationship between classes. Taking again as an example Figure1, in the repaired alignment in OAEI 2013 all three mappings were replaced bysubsumptions: FMA:Gingiva > NCI:Gingival, FMA:Gingiva > NCI:Gingiva andFMA:Gingiva > NCI:Gum. With this solution, the alignment becomes coherentsince the relation is directional and the inconsistency is only caused by the dis-joint clauses in NCI. However, none of the mappings are correct.These examples showcase that: 1) different repair techniques produce differentrepaired alignments; and 2) that solving inconsistencies with subsumption map-pings can result in an erroneous alignment. In this paper, we discuss the resultsof a manual analysis of the OAEI Large Biomedical track reference alignments.We focused our analysis on the differences between the original UMLS and therepaired alignments, in particular on the removed mappings and the ones al-

4 Pesquita et. al
tered to subsumptions. We also investigated the influence of using the samerepair technique to repair both the matching result and to repair the referencealignment.The paper is organized as follows: Section 2 describes how we conducted ourevaluation, Section 3 presents and discusses the evaluation; and finally Section4 proposes future alternatives for the discussed issues.
2 Methods
To compare the repaired alignments of OAEI 2013 against the original UMLS,we manually evaluated all 41 subsumption mappings in FMA-NCI and 100 ran-domly chosen subsumption mappings of both FMA-SNOMED and SNOMED-NCI. The evaluation was conducted by two researchers with a biomedical back-ground. We classified each mapping as: correct, incorrect or debatable. We con-sider mappings correct, not based on their compliance with ontological con-straints, but based on their depiction of a real existing relation. For instance, weconsider the FMA-NCI mappings between Visceral Pleura, Lung and ThoracicCavity to be correct even if their integration with the ontologies leads to unsat-isfiable classes.Furthermore, we discerned between mappings where the right relationship wouldhave been equivalence, from those that would have been incorrect with either asubsumption or an equivalence relation. We chose to include a debatable categoryfor those mappings that raised disagreement between the experts, or that theydeemed subject to interpretation. For instance, the mappings FMA:Hormone toNCI:Therapeutic Hormone or SNOMED:Child to NCI:Children.Our manual evaluation also included the verification of all removed mappingsin FMA-NCI and FMA-SNOMED, and of 100 randomly chosen mappings inSNOMED-NCI. These were also classified into the three above-mentioned cat-egories. In addition, we also repaired the original reference alignment with ournovel repair technique (AML-Repair) [15] and evaluated the removed mappings.
3 Results and Discussion
Table 2 shows the results of our manual evaluation of the mappings removed oraltered from equivalence to subsumption in the repair of the OAEI 2013 LargeBiomedical reference alignments. Please note that for the sake of calculatingstatistics we chose to ignore the debatable removals and alterations.For FMA-NCI the removal of equivalence mappings is quite successful, with60 out of 87 removed mappings being correctly so. However, in SNOMED-NCIonly half of the mappings were correctly removed, while in FMA-SNOMED thisdropped to only 19 out of 65. Regarding the alteration of the mapping relationfrom equivalence to subsumption, the results are even poorer if more homoge-neous between tasks, with 80 to 95% of the alterations being incorrect. Takinginto account both removals and alterations, the percentage of correct reparations

Reconciling correctness and coherence in ontology reference alignments 5
ranges from 13% in FMA-SNOMED to 54% in FMA-NCI. Furthermore, consid-ering that the majority of the mappings altered to subsumption by the OAEI2013 repair are actually equivalences, these alterations do not actually improvethe practical quality of the alignment, they just allow the alignment to becomecoherent without removing the mappings.To complement this analysis we also repaired the original UMLS reference align-ments with our own repair technique (AML-Repair). Compared to the OAEI2013 repair, AML-Repair makes far more incorrect removals (see Table 3). How-ever, when both removal and alteration are taken into account, AML has a higherpercentage of correct repairs in both FMA-SNOMED and SNOMED-NCI.
Table 2: Evaluation of the OAEI 2013 Repair in the Large Biomedical Ontologies track
Equivalence removal Alteration to subsumption
Task Correct ? Incorrect Correct ? Incorrect Total correct
FMA-NCI 60 6 27 8 3 30 (26) 54.4 %
FMA-SNOMED 19 1 46 2 5 93 (73) 13.1 %
SNOMED-NCI 42 16 42 4 5 91 (73) 25.7 %
?: Debatable mapping. Numbers in ( ) correspond to mappings where the correctrelation is equivalence.
Table 3: Evaluation of AML-Repair in the Large Biomedical Ontologies track
Equivalence removal
Task Size Correct ? Incorrect Total correct
FMA-NCI 2901 48 11 54 47.1%
FMA-SNOMED 8349 19 0 81 19%
SNOMED-NCI 18065 43 6 51 45.7%
?: Debatable mapping.
These results mean that a large percentage of the removed or altered map-pings were correct and that both repair techniques are in fact too aggressive.A fundamental issue here is that different ontologies can have different modelsof the same subject, and as such, a set of mappings that should be consideredcorrect can render some classes unsatisfiable when the alignment is integratedwith the ontologies. For instance, consider the mappings FMA:Fibrillar Actin =NCI:F-actin and FMA:Actin = NCI:Actin. Both mappings could be consideredcorrect, but when they are integrated with the ontologies they cause an incon-sistency. Figure 2 illustrates this issue. Since in FMA F-actin is a subclass of

6 Pesquita et. al
Actin and in NCI it is a subclass of Actin Fillament which is disjoint with Actin,the two mappings are in conflict. However, from the biomedical perspective it isarguable that both mappings are correct: F-Actin is the polymer microfilamentform of Actin. The OAEI 2013 repair technique solves this issue by changing therelation type in the FMA:Actin=NCI:Actin mapping to subsumption. Since theonly constraints violated by the mapping reside in the NCI ontology, by makingthe mapping one-way, this strategy restores the coherence to the alignment. How-ever, FMA:Actin > NCI:Actin does not represent the true relationship betweenthese classes, which is equivalence.
����� ������������ �����
����������������������������������������
�����������
��������������
����������
�������
���
� !
����"�������������������"������
���������
##############################����������
Fig. 2: Two correct mappings causing an inconsistency
So the question is: when creating a reference alignment through automatedmethods, what is best, an incomplete but coherent reference alignment, or acomplete but incoherent one? The answer, we think, depends on the applicationof the alignment. If the final goal of creating an alignment is to support theintegration of two ontologies, then it is necessary to ensure coherence, so thatthe derived ontology is logically correct and supports reasoning. However, if thegoal is supporting the establishment of cross-references between the ontologies toallow navigation between them, then an alignment that does not support linkingFMA:Actin to NCI:Actin or reduces the relation to a subsumption would pre-vent a user from reaching the information that actin plays a role in cell motility.One of the underlying problems is that the existing repair techniques are notguaranteed to remove the incorrect mappings and may erroneously remove cor-rect mappings. The reason for this is that the premise of removing the minimumnumber of mappings possible (either locally or globally) can fail in cases wherethere are as many or more incorrect mappings than correct mappings leading tounsatisfiable classes. Indeed, this is exemplified in Figure 1, where ALCOMO er-roneously removed the correct mapping. If we evaluated an alignment containing

Reconciling correctness and coherence in ontology reference alignments 7
the correct mapping and not the incorrect ones against the ALCOMO-repairedreference, the alignment would be penalized twice: first for having a mapping notpresent in the reference, and second for not including the erroneous mapping.This means that, even if the true alignment between two ontologies is coherent,by employing an automated repair technique to create a coherent reference align-ment we risk excluding correct mappings, and thus providing a more misleadingevaluation than if we used the unrepaired reference alignment.This problem is amplified by the fact that two repair techniques may removedifferent mappings and arrive at different coherent alignments of comparablesize, as exemplified in Figure 1. Without knowing the true alignment, it is im-possible to assess which repair technique produces the more correct alignment.However, if the differences between the techniques are statistically significant, inchoosing one technique to repair the reference alignment we may bias the evalu-ation towards that technique. More concretely, if two matching systems producea similar unrepaired algorithm but use different repair techniques, the one thatuses the same repair technique used to repair the reference alignment is likely toproduce better results. This is illustrated in Figure 3, which shows two differentrepairs with techniques 1 and 2 of the same original reference alignment (A).When technique 1 is used to repair the alignment produced by a matching sys-tem, its overlap with the reference alignment repaired by 1 (B) is considerablegreater than its overlap with the reference alignment repaired by 2 (C).
Table 4: McNemar’s exact test for differences between alignments
Task ALCOMO - LogMap-Repair OAEI 2013 Repair - AML-Repair
FMA-NCI 2.80E-4 9.01E-4
FMA-SNOMED 2.97E-09 <1.00E-15
SNOMED-NCI <1.00E-15 2.08E-08
Values shown are two-sided exact p-values
A related work argued that the differences between repair techniques wereon average negligible, by comparing the results of applying LogMap-Repair andALCOMO to the top three systems that participated in the Large Biomedicaltrack of OAEI 2012 [16]. Although the differences between the repair techniqueswere indeed generally small in percentage, they reflect differences in tens or evenhundreds of mappings and can be significant in the context of the OAEI com-petition.To demonstrate that the alignments produced by different repair techniques arestatistically different, we performed a McNemar’s exact test [17] comparing twosets of reference alignments: the OAEI 2012 reference alignments repaired byLogMap and ALCOMO, and the OAEI 2013 reference alignment with the origi-nal UMLS reference alignment repaired by AML-Repair. LogMap and ALCOMO

8 Pesquita et. al
disagree over 177 mappings and UMLS original and repaired differ in 78 map-pings. The results in Table 4 show that there is indeed a statistical differencebetween these sets of alignments, as the p-values obtained are clearly below thelowest significance intervals typically considered (0.01).To empirically test the possibility that the repair technique selected to repairthe reference alignment may lead to a bias in evaluation, we produced simplelexical-based alignments for the three tasks of the Large Biomedical Ontolo-gies (by using AML on the small overlapping ontology fragments [18]). Then,we repaired these alignments using either LogMap-Repair or AML-Repair, andevaluated the repaired alignments against a set of reference alignments: original(UMLS unrepaired), LogMap-Repair (the original repaired with LogMap, as pro-vided in OAEI 2012), and AML-Repair (the original repaired with AML-repair).The results of this evaluation are shown in Table 5. With the sole exception ofthe AML + LogMap-Repair in the FMA-SNOMED task, the best evaluationresults in each task were obtained when the repair technique used to repair thealignment was the same that was used in the reference. Although the differencesbetween the various reference alignments were relatively small (usually below1%) they are not irrelevant from the perspective of the OAEI evaluation, as thedifferences between matching systems are often in this range. Thus, the repairtechnique used to repair the reference alignment can indeed lead to a biasedevaluation. What is more, this encourages systems competing in OAEI to adoptexisting repair techniques, rather than try to develop novel and potentially betteralternatives.
Fig. 3: Comparing a repaired alignment with two different repaired references
We posit that a reference alignment for evaluating ontology matching sys-tems should not exclude potentially correct alignments. As we have shown inFigure 2, it is possible that the true alignment between two ontologies is notcoherent. In such cases, repairing the alignment should only be considered if the

Reconciling correctness and coherence in ontology reference alignments 9
Table 5: Influence of different repair techniques on the evaluation of matching systems
Reference Precision Recall F-measure Size Correct Reference
AML + AML-Repair (FMA vs NCI small)
Original 96.9% 78.8% 87.4% 2457 2382 3024
LogMap-Repair 95.2% 80.7% 87.7% 2457 2339 2898
AML-Repair 95.9% 81.2% 88.2% 2457 2356 2901
AML + LogMap-Repair (FMA vs NCI small)
Original 96.8% 78.8% 87.4% 2461 2383 3024
LogMap-Repair 95.4% 81% 87.9% 2461 2347 2898
AML-Repair 95.2% 80.8% 87.7% 2461 2343 2901
AML + AML-Repair (FMA vs SNOMED small)
Original 95.2% 65.4% 78.9% 6187 5889 9008
LogMap-Repair 86.1% 65.7% 75.2% 6187 5329 8111
AML-Repair 93.2% 69% 80.2% 6187 5764 8349
AML + LogMap-Repair (FMA vs SNOMED small)
Original 94.9% 66.4% 79.4% 6298 5978 9008
LogMap-Repair 86.4% 67.1% 76.1% 6298 5439 8111
AML-Repair 89.9% 67.8% 78.1% 6298 5660 8349
AML + AML-Repair (SNOMED vs NCI small)
Original 92.6% 60.4% 74.8% 12305 11390 18844
LogMap-Repair 91.6% 61.5% 75.1% 12305 11275 18324
AML-Repair 91.5% 62.3% 75.5% 12305 11255 18065
AML + LogMap-Repair (SNOMED vs NCI small)
Original 92.6% 61.3% 75.3% 12474 11550 18844
LogMap-Repair 91.7% 62.4% 75.7% 12474 11439 18324
AML-Repair 90.7% 62.6% 75.4% 12474 11312 18065
Best F-score values in bold face

10 Pesquita et. al
ontologies are to be merged into an integrated resource, as otherwise repairingit implies losing correct mappings. However, even in the cases where the truealignment between two ontologies is expected to be coherent, the use of auto-matic repair techniques to build a reference alignment is likely to lead to theloss of some correct mappings. Penalizing a system that finds true hard-to-findmappings because these happened to be removed during the repair of the refer-ence alignment is certainly not desirable. The OAEI 2013 reference alignmentsattempt to minimize the number of mappings removed while still maintainingcoherence by replacing equivalence relations with subsumption relations wherenecessary. But as we have shown, only a small fraction of these relationshipsare correct as subsumptions. In most cases, the original equivalence relation wascorrect, and in some other cases the mappings should not exist at all.On the other hand, using the original (unrepaired) reference alignments is notwithout issues because these do contain erroneous mappings. Going back to theexample in Figure 1, a system that finds only the correct mapping would geta worst result than a system that found the two incorrect mappings if it wereevaluated with the original reference alignment. The same would also be true ifthe system were evaluated with the OAEI 2013 reference alignment, as all threemappings are present in this alignment in the form of subsumptions (assumingthe evaluation only considers the presence/absence of mappings and not theirrelationships).We propose that a more impartial evaluation could benefit from the fact thatexisting alignment repair algorithms compute the sets of conflicting mappingsas part of their process. Mappings within these sets would be tagged as uncer-tain, and their presence or absence in the evaluated alignments would not betaken into account when calculating performance metrics. A similar approachhas been proposed for cases where only a fraction of the possible mappings havebeen manually evaluated [19]. Coupling this approach with a satisfiability checkon the alignment would allow a more impartial evaluation w.r.t. the repair ap-proach chosen by the matching systems. To illustrate this we have evaluated theAML, AML+AML-Repair and AML+LogMap-Repair alignments for FMA-NCIagainst an unbiased reference alignment where all conflicting mappings (due todisjointness clauses) have been identified and their presence or absence is notconsidered in the evaluation. Table 6 presents these results, showing that re-paired alignments have a higher precision without losing recall.
Table 6: Evaluaton of different repair techniques against an unbiased reference
Repair Technique Precision Recall F-measure Size Correct Reference
No Repair 95.2% 81.8% 88.2% 1845 1756 2147
AML-Repair 95.9% 81.8% 88.6% 1831 1756 2147
LogMap-Repair 95.7% 81.8% 88.5% 1834 1756 2147
Size and Reference do not include uncertain mappings.

Reconciling correctness and coherence in ontology reference alignments 11
4 Conclusions
As ontologies become more prevalent, large and complex, so must ontologymatching systems evolve and with them their evaluation strategies. A recentstep in this direction has been the introduction of the large biomedical trackin OAEI 2012, where the reference was automatically created by processing anexternal set of integrated vocabularies and then taking this unrefined alignmentand repairing it to diminish its incoherence.We have found that the repair technique employed to create the OAEI 2013reference alignment, although less aggressive than the ones used in 2012, stillremoves a considerable portion of correct mappings and incorrectly alters equiv-alence mappings to subsumptions. Furthermore, we have shown that alignmentsrepaired with different techniques are significantly different, which can have animpact on the evaluation of ontology matching systems. To decrease the impactof these issues on the evaluation of ontology matching systems, we have proposedan alternative for the evaluation of repaired alignments, where the presence orabsence of conflicting mappings is not accounted for. We consider that an align-ment between two ontologies should enforce coherence, when the advantagesof doing so outweigh the disadvantages, which depends on the application ofthe alignment and on the ontologies themselves. For instance, if the goal of analignment is to support integration, then coherence is paramount. However, ifthe alignment is only intended to support a “lighter” connection between theontologies (e.g., cross-references), then coverage is likely more relevant than co-herence, especially if we consider the error rates of repair techniques. Moreover,when ontologies do not model conflicting views of their domain, then a fruitfulalignment between them should be coherent, and ensuring coherence can be acrucial step in filtering out errors. However, when ontologies have incompatibleontological models, their complete integration is impossible and enforcing coher-ence in their alignment will necessarily remove or alter correct mappings.How to best integrate ontologies with conflicting views is still a debated question[20], and in some cases the goal might not even be a full-fledged integration. Weagree with the opinion expressed in [21] that to solve inherent incompatibilitiesbetween ontologies, expert intervention is necessary. However, some incompat-ibilities are unsolvable, and consequently a full coherent integration of the on-tologies is impossible. To promote the usefulness of the alignments there shouldbe room for alignments to contain mappings that violate constraints but areultimately relevant. A next logical step is to investigate the best approach tosupport the encoding of these conflicts in the alignment.
Acknowledgements
DF, CP, ES and FMC were funded by the Portuguese FCT through the SOMERproject (PTDC/EIA-EIA/119119/2010) and the multi-annual funding programto LASIGE. CP was funded by the FLAD-NSF 2013 Programme under theproject “Turning Big Data into Smart Data”.

12 Pesquita et. al
References
1. Eckert, K., Ferrara, A., Hollink, L., Meilicke, C., Nikolov, A., Ritze, D., Shvaiko, P.,Grau, B.C., Zapilko, B.: Results of the Ontology Alignment Evaluation Initiative2012. (2012) 73–115
2. Euzenat, J., Meilicke, C., Stuckenschmidt, H.: Ontology Alignment EvaluationInitiative : six years of experience. Volume 6720. (2011)
3. Rosse, C., Jr, L.V.M.: A reference ontology for biomedical informatics : the Foun-dational Model of Anatomy. Journal of Biomedical Informatics 36 (2003) 478–500
4. Schulz, S., Cornet, R., Spackman, K.: Consolidating SNOMED CT’s ontologicalcommitment. Applied Ontology 6 (2011) 1–11
5. Golbeck, J., Fragoso, G.: The National Cancer Institute’s thesaurus and ontology.Web Semantics: Science, Services and Agents on the World Wide Web (2011)
6. Shvaiko, P., Euzenat, J.: Ontology Matching: State of the Art and Future Chal-lenges. IEEE Transactions on Knowledge and Data Engineering 25(1) (January2013) 158–176
7. Lambrix, P., Ivanova, V.: A unified approach for debugging is-a structure andmappings in networked taxonomies. Journal of Biomedical Semantics 4(1) (2013)
8. Beisswanger, E., Hahn, U.: Towards valid and reusable reference alignments - tenbasic quality checks for ontology alignments and their application to three differentreference data sets. Journal of Biomedical Semantics 3 Suppl 1 (2012) S4
9. Giunchiglia, F., Yatskevich, M., Avesani, P., Shvaiko, P.: A large scale dataset forthe evaluation of matching systems. Knowledge Eng. Review (January) (2009)
10. Jimenez-Ruiz, E., Grau, B., Zhou, Y., Horrocks, I.: Large-scale Interactive Ontol-ogy Matching: Algorithms and Implementation. ECAI (ii) (2012) 444–449
11. Rosoiu, M., dos Santos, C., Euzenat, J.: Ontology matching benchmarks: genera-tion and evaluation. In: 6th ISWC workshop on ontology matching (OM). (2011)
12. Jimenez-Ruiz, E., Grau, B.C., Horrocks, I.: Exploiting the UMLS Metathesaurusin the Ontology Alignment Evaluation Initiative. E-LKR Workshop (2012) 1–6
13. Meilicke, C.: Alignment incoherence in ontology matching. PhD thesis, Universityof Mannheim (2011)
14. Jimenez-Ruiz, E., Grau, B.: Logmap: Logic-based and scalable ontology matching.The Semantic WebISWC 2011 (2011)
15. Santos, E., Faria, D., Pesquita, C., Couto, F.: Ontology alignment repair throughmodularization and confidence-based heuristics. arXiv:1307.5322 (2013)
16. Jimenez-Ruiz, E., Meilicke, C., Grau, B., Horrocks, I.: Evaluating Mapping RepairSystems with Large Biomedical Ontologies. In: 26th International Workshop onDescription Logics. (2013)
17. Liddell, F.D.: Simplified exact analysis of case-referent studies: matched pairs;dichotomous exposure. Journal of Epidemiology and Community Health 37(1)(1983) 82–84
18. Faria, D., Pesquita, C., Santos, E., Palmonari, M., Cruz, I., Couto, F.M.: TheAgreementMakerLight Ontology Matching System. In: ODBASE. (2013)
19. Autayeu, A., Maltese, V., Andrews, P.: Recommendations for better quality ontol-ogy matching evaluations. In: AISB Workshop on Matching and Meaning. (2010)
20. Schulz, S., Rector, A., Rodrigues, J., Chute, C., Ustun, B., Spackman, K.:Ontology-based convergence of medical terminologies: SNOMED CT and ICD-11.In: eHealth2012. (2012) 89–94
21. Jimenez-Ruiz, E., Grau, B.C., Horrocks, I., Berlanga, R.: Logic-based assessmentof the compatibility of UMLS ontology sources. Journal of Biomedical Semantics2 Suppl 1 (2011) S2

Unsupervised Learning of Link Specifications:Deterministic vs. Non-Deterministic
Axel-Cyrille Ngonga Ngomo1 and Klaus Lyko1
Department of Computer ScienceUniversity of Leipzig
Johannisgasse 26, 04103 [email protected],
WWW home page: http://limes.sf.net
Abstract. Link Discovery has been shown to be of utter importance forthe Linked Data Web. In previous works, several supervised approacheshave been developed for learning link specifications out of labelled data.Most recently, genetic programming has also been utilized to learn linkspecifications in an unsupervised fashion by optimizing a parametrizedpseudo-F-measure. The questions underlying this evaluation paper aretwofold: First, how well do pseudo-F-measures predict the real accu-racy of non-deterministic and deterministic approaches across differenttypes of datasets? Second, how do deterministic approaches compare tonon-deterministic approaches? To answer these questions, we evaluatedlinear and Boolean classifiers against classifiers computed by using ge-netic programming on six different data sets. We also studied the corre-lation between two different pseudo-F-measures and the real F-measuresachieved by the classifiers at hand. Our evaluation suggests that pseudo-F-measures behave differently on the synthetic and real data sets.
1 Introduction
Over the last years, the importance of Link Discovery (LD) as a research topichas increased significantly. This increase was upheld mainly by the ever-growingsize of the Linked Data Web and the scalability and accuracy requirements itbrings about. The creation of links between knowledge bases, one of the mostimportant steps in the realization of the vision of the Linked Data Web hasprofited from this boost of research and seen the development of several LDframeworks and approaches [7, 2, 12, 11, 3]. Two main research focuses played arole so far: (1) the determination of time-efficient algorithms [3, 7, 6] for LD and(2) the development of approaches for the efficient computation of link specifi-cations (also called linkage rules) [8, 4, 10, 9]. In most cases, supervised machinelearning approaches were used to tackle the second challenge of LD. Approachesdeveloped so far include batch learning using genetic programming [3], the com-bination of active learning and of linear and Boolean classifiers [8] as well asthe combination of active learning and genetic programming [9]. In addition,unsupervised approaches for learning link specifications have been recently de-veloped [10]. While all these approaches have been shown to achieve good results,

unsupervised approaches obviously trump batch and active learning approachesas they do not require any feedback from the user and can still achieve remark-ably good performance. In addition, genetic programming approaches yield thecentral advantage of being able to exploit the whole spectrum of the link speci-fication grammar provided by the framework in which they were implemented.So far, unsupervised approaches to the discovery of link specifications have onlybeen tested with artificially generated benchmark data and low-noise datasets.Moreover, no deterministic approach for the unsupervised discovery of link spec-ifications has been presented so far, although deterministic approaches such asthose presented in [8] counterbalance their limitations in expressiveness by beingclearly more time-efficient than approaches based on genetic programming.
The aim of this paper is to experimentally examine the unsupervised discov-ery of link specifications with respect to two main questions:
1. Are deterministic approaches able to achieve results comparable to those ofgenetic approaches? To address this question, we extended the approachpresented in [9] and devised an approach for the unsupervised learning ofBoolean and linear classifiers which is loosely based on the RAVEN ap-proach [8]. We refrained from reusing the approach presented in [10] as oneof the pseudo-measures we rely on was designed especially to work well withthis approach. Consequently, using it could have led to a bias in our results.
2. How well are pseudo-F-measures suited for unsupervised discovery performedon synthetic and real data sets? Here, we compared the results achievedby the approaches above on the three OAEI 2010 datasets1 and on threedata sets extracted from real data2. In addition to the pseudo-F-measuredescribed in [10] (which we dub Fβ
u ), we devised a supplementary pseudo-F-
measure Fβd which relies more on the standard definition of the Fβ-measure.
We performed a correlation analysis of the values of Fβu , Fβ
d and the F1
measure and detected a surprisingly different behaviour of these measuresacross our two groups of data sets.
The rest of this paper is structured as follows: We first give an overview of theapproaches and measures we used for our experiments. We then present theresults of our experimental setup as well as the results of our experiments. Forthe sake of reproducibility, we chose to use freely available datasets and made theapproaches presented herein freely available at the project website.3 We concludewith a summary of the implications of our results for the LD community.
2 Approaches
In general, a link specification is a classifier C that assigns each element of theset S×T to one of the classes of Y = {+1,−1}, where S is called the set of source
1 Freely available at http://oaei.ontologymatching.org/2010/.2 Freely available at http://dbs.uni-leipzig.de/en/research/projects/object_
matching/fever/benchmark_datasets_for_entity_resolution.3 http://saim.sf.net

instances, while T is the set of target instances. (s, t) ∈ S×T is considered by Cto be a correct link when C(s, t) = +1. Otherwise, (s, t) is considered not be apotential link. We will assume that the classifier C relies on a complex similarityfunction σ which consists of a combination of atomic similarity measure σi.Each of the atomic similarity measures is associated with a parameter ωi, whichis used in main cases as threshold or weight for σi. Supervised approaches to thecomputation of link specifications use labelled training data L ⊆ S × T × Y tomaximize an objective function such as the distance from the labelled data itemsto the boundary of the classifier in the case of Support Vector Machines [1]. Theidea behind unsupervised approaches to learning link specifications is that theydo not to utilize any training data (i.e., L = ∅). Instead, they aim to optimizean objective function F . In the following, we present the non-deterministic andthe deterministic approaches we utilized in our experiments. We then presenttwo different objective functions that are based on the well-know Fβ-measure.These functions build the basis for our evaluation.
2.1 Non-Deterministic Approach
Algorithm 1 EAGLE
Require: Sets of instances S and T , size of population, number of iterationsGet property mapping (S, T )Generate initial populationrepeat
Compute F for all individuals.Apply genetic operators to population
until Number of iterations is reachedreturn Overall fittest individual
The non-deterministic approach we evaluated is based on the EAGLE ap-proach presented in [9] and implemented in the LIMES framework [8]. The ap-proach was modified as described in Algorithm 1. We begin by generating arandom population of n individuals. Let Gt be the population at the iterationt. To evolve a population to the generation Gt+1, the fitness of each individ-uals gt ∈ Gt is computed. For this purpose, the mapping M(gt) generated bygt is evaluated and the value F(M(gt)) is assigned to gt. These fitness valuesbuild the basis for selecting individuals for the genetic operator reproduction.EAGLE uses a tournament setting between two selected individuals to decidewhich one is copied to the next generation gt+1. On randomly selected indi-viduals the operator mutation is applied according to a probability called themutation rate. A mutation can affect an individual in three different ways: First,it can alter the thresholds used by the individual. Second, a mutation can alterthe property values that are compared by one of the atomic measures on whichthe classifier relies. Finally, mutations can modify the measures included in the

individuals. The third genetic operator, crossover, operates on two parent in-dividuals and builds a new offspring by swapping two random sub-trees of theparent genotypes. The application of these operators is carried out iterativelyuntil a maximal number of iterations is reached. The result of this process isthe mapping M that is returned by the best individual. M is postprocessed asfollows: Each s ∈ S such that ∃t ∈ T : (s, t) ∈ M is mapped to argmax
t∈Tσ(s, t).
The postprocessed mapping is finally returned.
2.2 Deterministic Approaches
Algorithm 2 EUCLID
Require: Specification of the datasets S and TRequire: Δω ∈]0, 1[Require: γ > 1, θ > 0 with (γ, θ) ∈ N
2
Get property mapping (S, T )bestClassifier = (1, . . . , 1)Ω = ∅for k = 0 → �1/Δω� do
Ω = Ω ∪ {1− kΔω}end forfor i = 1 → n do
σmaxi = argmax
ω∈Ω,σi∈ΣF(σi ≥ ω), ωmin
i = 0, ωmaxi = 1
end forfor iterations = 1 → θ do
Δ =|ωmax
i −ωmini |
γ
C =n
argmaxi=1
F(ωmini + kiΔ)
if F(C) > F(bestClassifier) thenC = bestClassifier
elsebestClassifier = C
end iffor j = 1 → n do
ωminj = max(0, ζj), ω
maxj = min(1, ζj)
end forend forreturn bestClassifier
Linear and Boolean classifiers have been shown in previous work [8] to alsoachieve good results on the task of LD. Both types of classifiers can be char-acterized by a similarity function σ which depends on similarity measures σi
and parameters ωi. Linear classifiers L classify (s, t) as belonging to +1 iffn∑
i=1
ωiσi(s, t) ≥ 1. For Boolean classifiers B, the inequalityn∧
i=1
σi(s, t) ≥ ωi must

be fulfilled by the pair (s, t) for it belong to +1. In both cases, a classifier canbe encoded by the vector Ω = (ω1, . . . , ωn). Determining the best L or B wouldrequire testing all possible combinations of values ωi ∈ [0, 1], which would beimpracticable. The idea behind our algorithm EUCLID (Efficient and Unsuper-vised Classification for Link Discovery) is to reduce the number of configurationsthat must be tested by applying a search within the search space whose granular-ity increases gradually as described in Algorithm 2: We first begin by detectingthe right similarity measure for each pair of properties. To achieve this goal, weuse the similarity σmax
i = argmaxω∈Ω,σi∈Σ
F(σi ≥ ω) for each pair of properties, where
F(σi ≥ ω) is the value of the pseudo-F-measure (PFM) of the classifier C0 suchthat C0(s, t) = +1 ⇐⇒ σi(s, t) ≥ ω, Ω = {ω > 0 with ∃k ∈ N : ω = 1 − kΔω}is a set of threshold values and Σ is the set of similarity measures implementedby the framework at hand. Note that Δω is the first of the three parametersrequired by EUCLID.
In a second step, we compute the actual link specification. Given two param-eters γ > 1 and θ > 0, ωmin
i and ωmaxi are set to 0 and 1 respectively for each
of the similarities σi. Then the interval ωmini and ωmax
i is split into γ intervalsof the same size Δ = (|ωmax
i − ωmini |/γ. For each of the possible parametriza-
tion ωi = ωmini + kΔ, k ∈ {0, . . . , γ}, EUCLID simply runs all of the resulting
classifiers C and compute their fitness F(C). The current overall best classifierC = (ζ1, . . . , ζn) is used as new reference point. ωi
min is set to max{0, ζi − Δ}and ωi
max to min{ζi +Δ, 1} while γ := γ/2. This procedure is repeated θ timesand the best overall classifier w.r.t. F is returned.
3 Pseudo-F-measures
We considered two different PFMs for the automatic discovery of link specifica-tions. The first PFM, dubbed Fβ
u , was proposed by [10] and is based on the Fβ
measure. Consequently, it is defined as
Fβu = (1 + β2)
PuRu
β2Pu +Ru. (1)
Let M ⊆ S×T be a mapping generated by an algorithm, S be the set of sourceinstances and T be the set of target instances. Pu is defined as
Pu(M) =|{s|∃t : (s, t) ∈ M}|∑s|{t : (s, t) ∈ M}| , (2)
while Ru is computed as follows:
Ru(M) =|M |
min(|S|, |T |) . (3)
Note that Ru(M) can be larger than 1 as |M | can be larger than min(|S|, |T |).While this does not occur in the setup proposed by [10], it seems rather counter-intuitive that a recall measure can lead to values beyond 1. We thus specified

the following novel pseudo-recall dubbed Rd:
Rd(M) =|{s|∃t : (s, t) ∈ M}|+ |{t|∃s : (s, t) ∈ M}|
|S|+ |T | . (4)
This pseudo-recall computes the ratio how well all source and target instancesare covered by the Mapping M . Thus, Rd(M) = 1 if every s ∈ S is mapped toat least one t ∈ T and vice versa. We would argue that it is therewith more inline with the original definition of precision and recall. Our pseudo-F-measureFd is thus defined as
Fβd (M) = (1 + β2)
Pd(M)Rd(M)
β2Pd(M) +Rd(M)with Pd = Pu. (5)
4 Experiments and Results
The goal of our experiments was twofold. First, we wanted to know how deter-ministic approaches perform in comparison to non-deterministic approaches forthe discovery of link specifications. The basic intuition here was that if deter-ministic approaches can achieve F-scores similar to those of non-deterministicapproaches, they should be preferred as they are usually more time-efficient.We thus compared the maximal F-measure achieved by each of our approacheson the six different data sets at hand. Moreover, we wanted to measure howwell PFM can predict the real performance of classifiers. Especially, we wereinterested in knowing whether the predictive power of pseudo-F-measures is asreliable on real data as it has been shown to be on synthetic data. Within thiscontext, we were also interested in knowing which setting of β led to the best realF-measure across the different datasets that we used, as β = 0.1 was suggestedin the past [10]. We thus ran our evaluation using both Fu and Fd for β-valuesbetween 0.1 and 2.0 using a 0.1 increment. We used two different measures toevaluate the correlation between PFM and F1. In the following, we present thedata, algorithmic parameters and correlation measures used for our experiments.We then present our results and discuss their implications for the next steps ofresearch on link discovery.
4.1 Experimental Setup
In all experiments, we assumed that we knew the perfect mapping between theproperties. Each experiment was ran on a single thread of an Ubuntu Linux serverrunning JDK1.7 and was allocated maximally 2GB of RAM. The processors were2.0GHz quadcore Opterons.
Data We ran our experiments on three synthetic and three real datasets. Thesynthetic datasets consisted of widely used and well-known Persons1, Persons2and Restaurant datasets from the OAEI2010 set of benchmark data sets. The real

datasets consisted of the ACM-DBLP, Amazon-Google and Abt-Buy datasetsthat were extracted from websites or databases and for which a gold standard wascreated manually as reported in [5]. The ACM-DBLP dataset consists of 2,617source and 2,295 target publications (gold standard: 2,224 links). The Amazon-Google dataset links 1,363 to 3,226 products (gold standard: 1,300 links). Finally,the Abt-Buy dataset links 1,081 to 1,092 products via 1,097 correct links. Allnon-RDF datasets were transformed into RDF and all attribute values were setto lower case. Apart from this preprocessing, no other preprocessing step wascarried out.
Parametrization of the algorithms Four parameters need to be set to runEAGLE: the number of iterations, the size of the population, the crossover rateand the mutation rate. Similarly to [10], we used 20 iterations with a populationof 100 individuals. The crossover and mutation rates were set to 0.6. Given thatthis approach is not deterministic, we ran the experiments 5 times and presentthe average values in Section 4.2. Note that the standard deviations for the F-measures were always under 5% of the average value. For EUCLID, we usedΔω = 0.1, γ = 4, θ = 10.
Correlation Measures To measure the accuracy of the algorithms, we used thestandard F1-measure. We were interested in determining whether the pseudo-F-measures Fβ
u and Fβd can be used practically to predict the F1 measure achieved
by an algorithm and which setting of β was the best to achieve this goal. Thus,we measured the correlation of Fβ
u and Fβd with F1 across different values of
β. We used two different correlation measures: The Pearson and the Spearmancorrelation. We used the Pearson correlation to ensure the comparability of ourapproach with other correlation studies as this correlation is one of the mostcommonly used. The main drawback of the Pearson correlation is that it is mostreliable at detecting linear correlations between distributions. As there was noreason for assuming a linear relationship between our measures, we opted toalso use another correlation measure that do not make any assumption uponthe type of correlation between the input distributions. We used the Spear-man correlation [13], which assesses how well a monotonic function can describethe relationship between the input distributions by comparing the ranks of thevalues in the two input distribution. For both correlations, we used a 2-tailedsignificance test with a confidence threshold of 95%.
4.2 Results
We first measured the F1-scores achieved by our approaches when relying on Fd
(see Figure 1) and Fu (see Figure 2). Our results indicate that EUCLID is ingeneral slightly superior to EAGLE. Note that the linear classifier in combinationwith Fd even outperforms the supervised approaches presented in [5] and [9] onthe ACM-DBLP data set. In addition the linear model leads to better resultsthan the Boolean model in most cases (expect on the Restaurant dataset). Our

0.0 0.5 1.0 1.5 2.0
0.990
0.992
0.994
0.996
0.998
1.000
1.002
FdPseudoLinear
FdRealLinear
FdPseudoBoolean
FdRealBoolean
FdPseudoGenetic
FdRealGenetic
(a) Persons1
0.0 0.5 1.0 1.5 2.0
0.0
0.1
0.2
0.3
0.4
0.5
0.6
0.7
0.8
0.9 FdPseudoLinear
FdRealLinear
FdPseudoBoolean
FdRealBoolean
FdPseudoGenetic
FdRealGenetic
(b) Persons2
0.0 0.5 1.0 1.5 2.0
0.2
0.3
0.4
0.5
0.6
0.7
0.8
0.9
1.0
FdPseudoLinear
FdRealLinear
FdPseudoBoolean
FdRealBoolean
FdPseudoGenetic
FdRealGenetic
(c) Restaurant
0.0 0.5 1.0 1.5 2.0
0.84
0.86
0.88
0.90
0.92
0.94
0.96
0.98
1.00
FdPseudoLinear
FdRealLinear
FdPseudoBoolean
FdRealBoolean
FdPseudoGenetic
FdRealGenetic
(d) ACM-DBLP
0.0 0.5 1.0 1.5 2.0
0.0
0.1
0.2
0.3
0.4
0.5
0.6
0.7
0.8
0.9
1.0
FdPseudoLinear
FdRealLiner
FdPseudoBoolean
FdRealBoolean
FdPseudoGenetic
FdRealGenentic
(e) Amazon-Google
0.0 0.5 1.0 1.5 2.0
0.1
0.2
0.3
0.4
0.5
0.6
0.7
0.8
0.9
FdPseudoLinear
FdRealLinear
FdPseudoBoolean
FdRealBoolean
FdPseudoGenetic
FdRealGenetic
(f) Abt-Buy
Fig. 1. Evaluation of algorithms based on Fd. The y-axis shows the different F-measures while the x-axis stands for different β-values. Note that “FdPseudo” standsfor the pseudo-F-measures achieved by the different classifiers while “FdReal” standsfor the real F-measures.
results suggest that Fd is better suited for EUCLID while Fu and Fd tie forEAGLE. With respect to runtime, EUCLID requires between 2.5 and 30s and istherewith between 1 and 2 orders of magnitude faster than EAGLE. Given thesignificant different in runtimes we observed within our experiments, we suggest

0.0 0.5 1.0 1.5 2.0
0.65
0.70
0.75
0.80
0.85
0.90
0.95
1.00
1.05
1.10
1.15
1.20
1.25
FuPseudoLinear
FuRealLinear
FuPseudoBoolean
FuRealBoolean
FuPseudoGenetic
FuRealGenetic
(a) Persons1
0.0 0.5 1.0 1.5 2.0
0.0
0.1
0.2
0.3
0.4
0.5
0.6
0.7
0.8
0.9
1.0
1.1 FuPseudoLinear
FuRealLinear
FuPseudoBoolean
FuRealBoolean
FuPseudoGenetic
FuRealGenetic
(b) Persons2
0.0 0.5 1.0 1.5 2.0
0.2
0.4
0.6
0.8
1.0
1.2
1.4 FuPseudoLinear
FuRealLinear
FuPseudoBoolean
FuRealBoolean
FuPseudoGenetic
FuRealGenetic
(c) Restaurant
0.0 0.5 1.0 1.5 2.0
0.5
0.6
0.7
0.8
0.9
1.0
1.1
1.2
1.3
FuPseudoLinear
FuRealLinear
FuPseudoBoolean
FuRealBoolean
FuPseudoGenetic
FuRealGenetic
(d) ACM-DBLP
0.0 0.5 1.0 1.5 2.0
0.0
0.1
0.2
0.3
0.4
0.5
0.6
0.7
0.8
0.9
1.0
FuPseudoLinear
FuRealLinear
FuPseudoBoolean
FuRealBoolean
FuPseudoGenetic
FuRealGenetic
(e) Amazon-Google
0.0 0.5 1.0 1.5 2.0
0.1
0.2
0.3
0.4
0.5
0.6
0.7
0.8
0.9
1.0
1.1
1.2
1.3
FuPseudoLinear
FuRealLinear
FuPseudoBoolean
FuRealBoolean
FuPseudoGenetic
FuRealGenetic
(f) Abt-Buy
Fig. 2. Evaluation of algorithm based on Fu. The y-axis is the F-measure while thex-axis stands for different β-values. Note that “FuPseudo” stands for the pseudo-F-measures achieved by the different classifiers while “FuReal” stands for the real F-measures.
that the development of specific algorithms for classifiers of a given type canlead to algorithms for the discovery of link specifications that are both time-efficient and highly accurate. The insight we gain is thus a clear answer to our

first question: unsupervised deterministic approaches can perform as well asunsupervised approaches on both synthetic and real data.
Linear Boolean Genetic
Fd Fu Fd Fu Fd Fu
Persons1 100 100 99.50 99.50 100 100Persons2 41.45 40.60 59.12 59.12 33.77 37.04Restaurant 88.56 88.56 88.56 88.56 88.56 88.56ACM-DBLP 97.96 97.94 97.46 97.46 97.62 97.71Amazon-Google 49.08 48.55 39.97 39.97 43.11 42.68Abt-Buy 48.60 48.60 37.66 37.66 45.03 45.08
Table 1. Maximal F-scores (in %) achieved by the approaches.
0.0 0.5 1.0 1.5 2.0
0.4
0.5
0.6
0.7
0.8
0.9
1.0
FdPearson
FuPearson
(a) Pearson
0.0 0.5 1.0 1.5 2.0
0.4
0.5
0.6
0.7
0.8
0.9
1.0
FdSpearman
FuSpearman
(b) Spearman
Fig. 3. Spearman and Pearson correlation of Fβu and Fβ
d across different values of βmeasured independently from the algorithm used.
To answer our second question, we first computed the algorithm-independentcorrelation of Fd and the F1 measure as well as the correlation of Fu and the F1
measure (see Figure 3). In our experiments, the correlations varied significantlyacross the different values of β, yet remained positive and significant in 97.5%of the cases (the 2 lowest correlation scores of the Pearson correlation for Fu
were not significant). This means that optimizing Fu and Fd for one particularsetting of β is a sensible approach towards finding the best classifier for thatparticular setting of β. We then computed the Pearson and Spearman correlation(see Table 2) between Fu, Fd and the F1 measure achieved by the differentapproaches across different values of β. Our results were somewhat surprisingas we detected both significant positive and negative correlations across thedifferent datasets and for both correlations. Interestingly, while the number of

Linear Boolean Genetic
Fd Fu Fd Fu Fd Fu
Persons1 – – – -0.85* 0.84* -0.1Persons2 -0.09 0.54* -0.12 0.43 -0.43 -0.43Restaurant 0.73* -0.71* 0.71* 1* 0.84* 0.16
ACM-DBLP -0.70* -0.65* -0.43 -0.97* 0.46* 0.51*Amazon-Google -0.95* 0.49 -0.79* 0.07 -0.88* -0.03Abt-Buy -0.9* 0.27 -0.98* -0.27 0.38 -0.9*
Persons1 – – – -0.87* 0.99* -0.1Persons2 0.02 -0.09 0.21 -0.11 -0.56* -0.56*Restaurant 0.85* -0.54* 0.85* 1* 0.91* 0.15
ACM-DBLP -0.87* -0.73* 0.05 -0.95* 0.34 0.47*Amazon-Google -0.49* 0.68* -0.27 -0.22 -0.64* -0.39Abt-Buy -0.37 0.59* -0.82* -0.47* -0.13 -0.49*
Table 2. Pearson and Spearman Correlation of PFM and real F-measures across dif-ferent β-values. The top section of the table shows the Pearson correlation while thebottom part shows the Spearman correlation. The correlations are not defined for thefields marked with “–” due to at least one of the standard deviations involved being 0.Correlations marked with “*” are significant.
significant positive and negative correlations were relatively balanced for thesynthetic data sets, negative correlations seemed to dominate the set of realdatasets, thus hinting towards Fu and Fd behaving differently depending on thetype of data they are confronted with. The negative correlation values suggestthat to detect the best values of β for a real dataset automatically, the mappingM which leads to the smallest best value of Fd across the different values of βshould be chosen. This seems rather counter-intuitive and is a hypothesis thatrequires ampler testing on a larger number of real datasets. Overall, our resultsshow clearly that no β-value achieves a maximal F1-measure across our datasets. Still, for real datasets, Fd seems to perform well for β ∈ [0.8, 1.2]. Statingsuch an interval for Fu is more difficult as the set of β-values that lead to thebest mapping is very heterogeneous across the different datasets. Interestingly,this conclusion diverges from that proposed in previous work. The answer to oursecond question is still clearly that while the predictive power of Fβ
u and Fβd is
sufficient for the results to be used in practical settings, significant effort stillneeds to investigated to create a generic non-parametric PFM that can be usedacross different datasets and algorithms to predict the F1-measure reliably .
5 Conclusion
In this paper, we present a first series of experiments to determine how wellstandard classifier models such as linear and Boolean classifiers perform in com-

parison to classifiers generated by the means of genetic programming in an un-supervised learning setting based on maximizing a PFM. Overall, our resultsindicate that we are still at the beginning of the search towards the “holy grail”of PFMs. Especially on real data, the maximal PFM achieved by algorithmsacross different values of β is often negatively correlated with the value of theF1. The magnitude of this effect is significantly reduced on synthetic data. Thisdifference suggest that there is still a need for benchmark generation methodsthat allow creating benchmark data sets which reflect real data in a more holis-tic way. Moreover, our evaluation shows that deterministic classifiers performas well as or better than non-deterministic approaches while still bearing themain advantage of being significantly more time-efficient. Thus, finding more ef-ficient extension of EUCLID or similar approaches should allow providing usersof LD frameworks with accurate link specifications within an interactive setting.Detecting the right parametrization for PFM yet remains an unsolved problem.
References
1. Nello Cristianini and Elisa Ricci. Support vector machines. In Encyclopedia ofAlgorithms. 2008.
2. Aidan Hogan, Axel Polleres, Jrgen Umbrich, and Antoine Zimmermann. Some en-tities are more equal than others: statistical methods to consolidate linked data. InWorkshop on New Forms of Reasoning for the Semantic Web: Scalable & Dynamic(NeFoRS2010), 2010.
3. R. Isele, A. Jentzsch, and C. Bizer. Efficient Multidimensional Blocking for LinkDiscovery without losing Recall. In WebDB, 2011.
4. Robert Isele and Christian Bizer. Learning Linkage Rules using Genetic Program-ming. In Sixth International Ontology Matching Workshop, 2011.
5. Hanna Kopcke, Andreas Thor, and Erhard Rahm. Comparative evaluation of entityresolution approaches with fever. Proc. VLDB Endow., 2(2):1574–1577, 2009.
6. Axel-Cyrille Ngonga Ngomo. A time-efficient hybrid approach to link discovery.In Proceedings of OM@ISWC, 2011.
7. Axel-Cyrille Ngonga Ngomo and Soren Auer. Limes - a time-efficient approach forlarge-scale link discovery on the web of data. In Proceedings of IJCAI, 2011.
8. Axel-Cyrille Ngonga Ngomo, Jens Lehmann, Soren Auer, and Konrad Hoffner.Raven: Active learning of link specifications. In Proceedings of the Ontology Match-ing Workshop (co-located with ISWC), 2011.
9. Axel-Cyrille Ngonga Ngomo and Klaus Lyko. Eagle: Efficient active learning oflink specifications using genetic programming. In Proceedings of ESWC, 2012.
10. Andriy Nikolov, Mathieu D’Aquin, and Enrico Motta. Unsupervised learning ofdata linking configuration. In Proceedings of ESWC, 2012.
11. George Papadakis, Ekaterini Ioannou, Claudia Niedere, Themis Palpanasz, andWolfgang Nejdl. Eliminating the redundancy in blocking-based entity resolutionmethods. In JCDL, 2011.
12. Jennifer Sleeman and Tim Finin. Computing foaf co-reference relations with rulesand machine learning. In Proceedings of the Third International Workshop onSocial Data on the Web, 2010.
13. C. Spearman. The proof and measurement of association between two things. TheAmerican journal of psychology, 15:72–101, 1904.
IncMap: Pay as you go Matching ofRelational Schemata to OWL Ontologies
Christoph Pinkel1, Carsten Binnig2, Evgeny Kharlamov3, and Peter Haase1
1 fluid Operations AG, D-69190 Walldorf, Germany,2 University of Mannheim, D-68131 Mannheim, Germany,
3 University of Oxford, Oxford, UK
Abstract. Ontology Based Data Access (OBDA) enables access to re-lational data with a complex structure through ontologies as conceptualdomain models. A key component of an OBDA system are mappings be-tween the schematic elements in the ontology and their correspondencesin the relational schema. Today, in existing OBDA systems these map-pings typically need to be compiled by hand, which is a complex and la-bor intensive task. In this paper we address the problem of creating suchmappings and present IncMap, a system that supports a semi-automaticapproach for matching relational schemata and ontologies. Our approachis based on a novel matching technique that represents the schematic ele-ments of an ontology and a relational schema in a unified way. IncMap isdesigned to work in a query-driven, pay as you go fashion and leveragespartial, user-verified mappings to improve subsequent mapping sugges-tions. This effectively reduces the overall effort compared to compilinga mappings in one step. Moreover, IncMap can incorporate knowledgefrom user queries to enhance suggestion quality.
1 Introduction
Effective understanding of complex data is a crucial task for enterprises to sup-port decision making and retain competitiveness on the market. This task is nottrivial especially since the data volume and complexity keep growing fast in thelight of Big Data [1]. While there are many techniques and tools for scalabledata analytics today, there is little known on how to find the right data.
Today, enterprise information systems of large companies store petabytes ofdata distributed across multiple – typically relational – databases, each withhundreds or sometimes even thousands of tables (e.g., [2]). For example, aninstallation of an SAP ERP system comes with tens of thousands of tables [3].Due to the complexity of data a typical scenario for data analyses today involvesa domain expert who formulates an analytical request and an IT expert who hasto understand the request, find the data relevant to it, and then translate therequest into an executable query. In large enterprises this process may iterateseveral times between the domain and IT experts, the complexity of data andother factors, and may take up to several weeks.
Ontology-based data access (OBDA) [4] is an approach that has recentlyemerged to provide semantic access to complex structured relational data. The
2 Christoph Pinkel et al.
core elements of an OBDA system are an ontology, describing the applicationdomain, and a set of declarative mappings, relating the ontological schema ele-ments (e.g., names of classes and properties) with the relational schema elements(e.g., names of table and attributes) of the underlying data sources. Using theontology and the mappings, domain experts can access the data directly by for-mulating queries in terms defined in the ontology that reflects their vocabularyand conceptualization. Using query rewriting techniques, the end-user queriesare then translated into queries over the underlying data sources.
Today, most approaches for ontology-based data access focus on the definitionof mapping languages and the efficient translation of high-level user queries overan ontology into executable queries over relational data [4,5]. These approachesassume that a declarative mapping of the schema elements of the ontology tothe relational elements is already given. So far, in real-world systems [6,7] thatfollow the ontology-based data access principle, the mappings have to be createdmanually. The costs for the manual creation of mappings constitute a significantentry barrier for applying OBDA in practice.
To overcome this limitation we propose a novel semi-automatic schema match-ing approach and a system called IncMap to support the creation of mappingsdirectly from relational schemata to ontologies.
We focus on finding one-to-one (direct) correspondences of ontological andrelational schema elements, while we also work on extensions for finding morecomplex correspondences. In order to compute mapping suggestions IncMap usesa relational schema, an OWL ontology, a set of user conjunctive queries over theontology, and user feedback as basic input.
The matching approach of IncMap is inspired by the Similarity Floodingalgorithm of Melnik et al. [8] that works well for schemata that follow the samemodeling principles (e.g., same level of granularity). However, applying the Sim-ilarity Flooding algorithm naively for matching schema elements of a relationalschema to an OWL ontology results in rather poor quality of the suggested cor-respondences as we show in our experiments. A major reason is the impedancemismatch between ontologies and relational schemata: While ontologies typi-cally model high-level semantic information, relational schemata describe thesyntactical structure on a very low level of granularity.
The contributions of the paper are the following:
– In Section 3, we propose a novel graph structure called IncGraph to representschema elements from both ontologies and relational schemata in a unifiedway. Therefore, we devise algorithms to convert an ontology as well as arelational schema into their unified IncGraph representation. We also brieflydiscuss techniques to further improve IncGraph.
– In Section 4, we present our matching algorithm that we use for matchingIncGraphs. Its most prominent feature is that IncMap can produce the map-ping incrementally, query by query. While the original Similarity Floodingalgorithm generates correspondences for all schema elements, IncMap sup-ports a pay as you go matching strategy. For each query we produce onlyrequired mappings. IncMap leverages the structure of mappings from previ-

IncMap: Pay as you go schema matching 3
ous queries to improve suggestion quality. This effectively reduces the totaleffort for the user to verify mapping suggestions.
– Section 5 presents an experimental evaluation using different (real-world)relational schemata and ontologies. We see that even in the basic version ofIncMap, the effort for creating a mapping is up to 20% less than using theSimilarity Flooding algorithm in a naive way. In addition, the incrementalversion of IncMap can reduce the total effort by another 50%− 70%.
2 Background
In this section we briefly introduce ontologies [9], relational schemata, and theSimilarity Flooding algorithm [8].
Ontologies. An ontology O specifies a conceptualization of a domain in termsof classes and properties and consists of a set of axioms. Without explanation,ontologies in this paper are OWL ontologies and we will use the following OWLconstructs: object and data properties P , and domains Domain(P ) and rangesRange(P ) of properties. We denote with Class(O) and Property(O) the sets ofclass and property names, respectively, occurring in the ontology O. For a givenontology O, with C ∈ Domain(P ) we denote the fact that one can derive fromO that the class name C is a domain of the property P . Also, C ′ ∈ Range(P )denotes the fact that C ′ is a range of P and it is derivable from O.
Relational Schemata. A relational schema R defines a set of relations (tables)T , where each table defines a set of columns c. We also assume that a schemacontains foreign keys k that define references between tables.
Similarity Flooding Algorithm. The Similarity Flooding algorithm matches agiven schema S with a schema S ′. In the first step, directed labeled graphsG(S) and G(S ′) are constructed from S and S ′, where the nodes represent theschema elements, and the edges with labels define relationships between theschema elements. There is no exact procedure to construct the graphs fromthe schemata given in [8]. Thus, the Similarity Flooding algorithm is open forany graph construction process. The second step in the algorithm is to mergeG(S) and G(S ′) into one graph, a so-called pairwise connectivity graph PCG.Intuitively, each node of the PCG is a pair of nodes, and represents a potentialmatch between schema elements of S and S ′. Then, the PCG is enriched withinverse edges and edge weights (propagation coefficients), where the value of theweights is based on the number of outgoing edges with the same label from agiven node. This graph is called the induced propagation graph IPG. The finalstep of the algorithm is a fix-point computation to propagate initial similaritiesby using the structural dependencies represented by the propagation coefficients.The fix-point computation termination is based either on threshold values or thenumber of iterations. The result is a ranked list of suggested mappings. We referto [8] for further details.
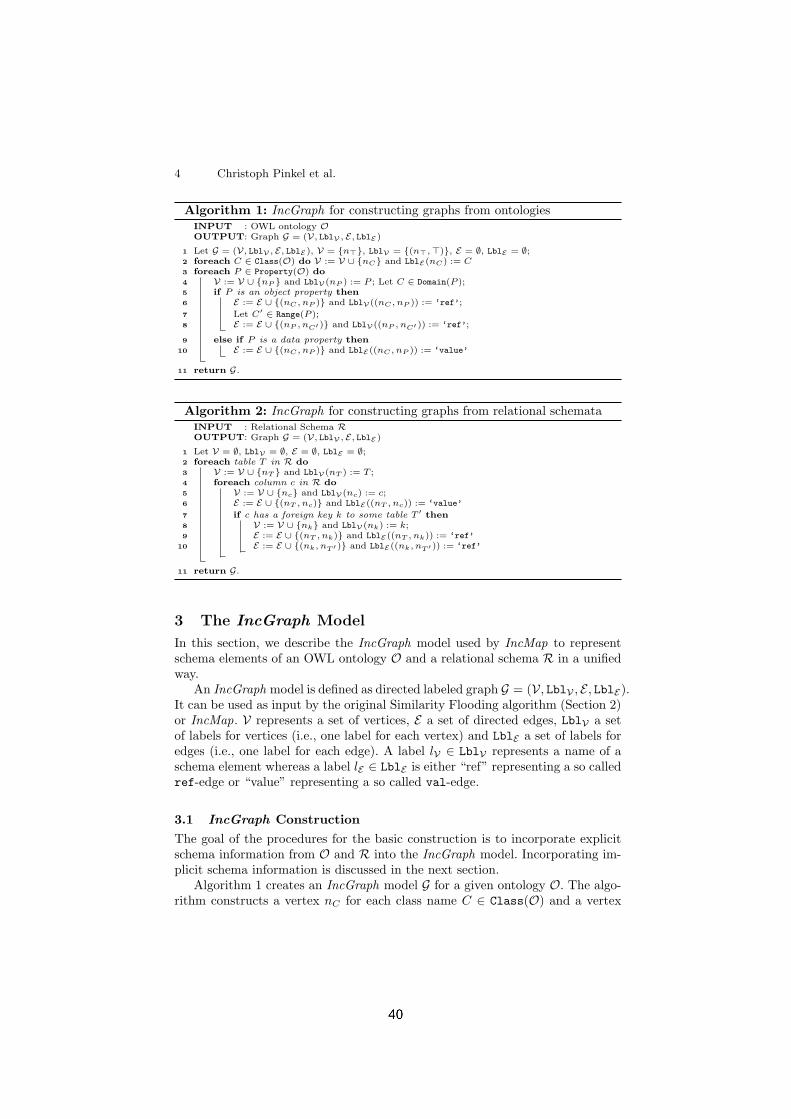
4 Christoph Pinkel et al.
Algorithm 1: IncGraph for constructing graphs from ontologiesINPUT : OWL ontology OOUTPUT: Graph G = (V, LblV , E, LblE)
1 Let G = (V, LblV , E, LblE), V = {n�}, LblV = {(n�,�)}, E = ∅, LblE = ∅;2 foreach C ∈ Class(O) do V := V ∪ {nC} and LblE(nC) := C3 foreach P ∈ Property(O) do4 V := V ∪ {nP } and LblV(nP ) := P ; Let C ∈ Domain(P );5 if P is an object property then6 E := E ∪ {(nC , nP )} and LblV((nC , nP )) := ‘ref’;
7 Let C′ ∈ Range(P );8 E := E ∪ {(nP , nC′ )} and LblV((nP , nC′ )) := ‘ref’;
9 else if P is a data property then10 E := E ∪ {(nC , nP )} and LblE((nC , nP )) := ‘value’
11 return G.
Algorithm 2: IncGraph for constructing graphs from relational schemataINPUT : Relational Schema ROUTPUT: Graph G = (V, LblV , E, LblE)
1 Let V = ∅, LblV = ∅, E = ∅, LblE = ∅;2 foreach table T in R do3 V := V ∪ {nT } and LblV(nT ) := T ;4 foreach column c in R do5 V := V ∪ {nc} and LblV(nc) := c;6 E := E ∪ {(nT , nc)} and LblE((nT , nc)) := ‘value’
7 if c has a foreign key k to some table T ′ then8 V := V ∪ {nk} and LblV(nk) := k;9 E := E ∪ {(nT , nk)} and LblE((nT , nk)) := ‘ref’
10 E := E ∪ {(nk, nT ′ )} and LblE((nk, nT ′ )) := ‘ref’
11 return G.
3 The IncGraph Model
In this section, we describe the IncGraph model used by IncMap to representschema elements of an OWL ontology O and a relational schema R in a unifiedway.
An IncGraph model is defined as directed labeled graph G = (V, LblV , E , LblE).It can be used as input by the original Similarity Flooding algorithm (Section 2)or IncMap. V represents a set of vertices, E a set of directed edges, LblV a setof labels for vertices (i.e., one label for each vertex) and LblE a set of labels foredges (i.e., one label for each edge). A label lV ∈ LblV represents a name of aschema element whereas a label lE ∈ LblE is either “ref” representing a so calledref-edge or “value” representing a so called val-edge.
3.1 IncGraph Construction
The goal of the procedures for the basic construction is to incorporate explicitschema information from O and R into the IncGraph model. Incorporating im-plicit schema information is discussed in the next section.
Algorithm 1 creates an IncGraph model G for a given ontology O. The algo-rithm constructs a vertex nC for each class name C ∈ Class(O) and a vertex

IncMap: Pay as you go schema matching 5
!"#$%&!!’()
*+,-$./,)0/1 &+2)
0+,-$.!) 3 /4+-),&25-)
6%&!!)
!"#$%&!!’()’#7-$.)8,/9-,.:)
!"#$%&!!’()
*&.&)8,/9-,.:)
;&!<+.%-)0/1 &+2)
!"#$%&!!’()
!"#$%&’#(
0+,-$./,)8=)
>>>)
) ’*"$(
?.%-)
0+,-$./,)@=)
>>>)
+,&’-’./(+! 0$-12’,1-(3%4$5 1(0!
*+,-$./,),-()
0+,-$.!) 3 /4+-),-()
;&!<+.%-)
4&%)
*+,-$./,),-()
0+,-$./,)@=)
3 /4+-),-()
;&!<+.%-)
4&%)0+,-$./,)@=)
*+,-$./,)8=)
4&%)
6,%7#1849+:! 6,%.#18490:!
4&%)
Fig. 1. IncGraph Construction Example
nP for each property name P ∈ Property(O) using the names of these ontologyelements as label in LblV . Directed edges in the IncGraph model are createdfor each domain and range definition in O. The labels LblE for edges are either“ref” in case of an object property or “value” in case of a data property. Fora domain definition in O the direction of the edge in G is from the node nC
representing the domain of P to the node nP representing the property P . For arange definition the direction of the edge in G is from the node nP representingobject property to the node nC′ representing the range of P (i.e., another class).If an object property in O has no range (respectively, domain) definition, then adirected labeled edge to a node n� is added to explicitly model the most generalrange (respectively, domain), i.e., a top-level concept � like Thing.
Algorithm 2 creates a IncGraph model G for a given relational schema R:The algorithm constructs a vertex nT for each table and a vertex nc for eachcolumn using the names of these schema elements as labels LblV . Directed edgeswith the label “value” are created from a node nT representing a table to a nodenc representing a columns of that table. For columns with a foreign key k anadditional node nk is created. Moreover, two directed edges with the label “ref”are added, which represent a path from node nT to a node nT ′ representing thereferenced table via node nk.
Figure 1 shows the result of applying these two algorithms to the ontologyO and the relational schema R in this figure. Both O and R describe the sameentities Directors and Movies using different schema elements. The resultingIncGraph models of O and R represent the schema structure in a unified way.
3.2 IncGraph Annotations
IncGraph is designed to represent both relational schemata and ontologies ina structurally similar fashion because matching approaches such as ours workbest when the graph representations on both the source and target side are assimilar as possible. However, even in IncGraph structural differences remain dueto the impedance mismatch and different design patterns used in ontologies andrelational schemata, respectively.
We consider this issue by supporting annotations in IncGraph. Annotationsbasically are additional ref-edges in either the source or target model that canbe designed to bridge structural gaps for different design patterns or levels of

6 Christoph Pinkel et al.
granularity. For instance, shortcut edges in the relational IncGraph model couldrepresent a multi-hop join over a chain of relationship relations. Annotations canbe constructed by plug-ins during IncGraph construction.
We plan to evaluate the opportunities of different kinds of annotations infuture work.
4 The IncMap System
In this section, we present our matching approach and system called IncMap. In-cMap takes a source and target IncGraph as input, i.e., the IncGraphs producedfor a relational schema and for an ontology as described in Section 3.
4.1 Overview of IncMap
In its basic version, IncMap applies the original Similarity Flooding algorithm(with minor adaptions) and thus creates initial mapping suggestions for theIncGraph of an ontology O and a relational schema R. In its extended version,IncMap activates inactive ref-edges before executing the Similarity Floodingalgorithm to achieve better mapping suggestions.
Another extension is the incremental version of IncMap. In this version theinitial mapping suggestions are re-ranked by IncMap in a semi-automatic ap-proach by including user feedback. Re-ranking works iteratively in a query-drivenfashion thus increasing the quality of the suggested mappings. In each iteration,IncMap applies a version of the Similarity Flooding algorithm (as described be-fore). However, in addition between each iteration user feedback is incorporated.
The idea of user feedback is that the user confirms those mapping suggestionsof the previous iteration, which are required to answer a given user query overontology O. Confirmed suggestions are used as input for the next iteration toproduce better suggestions for follow-up queries. This is in contrast to manyother existing approaches (including the original Similarity Flooding algorithm)that return a mapping for the complete source and target schema only once.
IncMap is designed as a framework and provides different knobs to controlwhich extensions to use and within each extension which concrete variants tochoose (e.g., to select a concrete strategy for activating inactive edges). The goalof this section is to present IncMap with all its variants and to show their benefitsfor different real-world data sets in our experimental evaluation in Section 5. Amajor avenue of future work is to apply optimization algorithms to find the bestconfigurations of IncMap for a given ontology O and schema R automaticallyby searching the configuration space based on the knobs presented before.
4.2 Basic Matching in IncMap
As already mentioned, in the basic version of IncMap, we simply apply theSimilarity Flooding algorithm for the two IncGraphs produced for a relationalschema R and for an ontology O similar to the process as described in Section 2.
As a first step, IncMap generates the PCG (i.e., a combined graph which pairssimilar nodes of both input IncGraphs) using an initial lexical matching, which

IncMap: Pay as you go schema matching 7
supports interchangeable matchers as one knob for configuration. One differenceis the handling of inactive ref-edges in the input IncGraphs. For inactive ref-edges, which are not handled in the original Similarity Flooding, we apply the fol-lowing rule when building the PCG: if an edge in the PCG refers to at least one inac-tive ref-edge in one of the IncGraph models, it also becomes inactive in the PCG.
In addition, other than in the original Similarity Flooding approach, wherepropagation coefficients for the IPG are ultimately determined during graph con-struction, our propagation coefficients can be calculated several times when thegraph changes with the activation and deactivation of edges. Also, propagationcoefficients in IncMap are modular and can be changed. In particular, a newweighting formula supported by IncMap considers the similarity scores on bothends of an edge in the IPG. The intuition behind this is that a higher score in-dicates better chances of the match being correct. Thus, an edge between twomatches with relatively high scores is more relevant for the structure than anedge between one isolated well-scored match and another with a poor score. Forcalculating the weight w(e) of a directed edge e = (n1, n2) from n1 to n2 in theIPG where l is the label of the edge, we currently use two alternatives:– Original Weight as in [8] : w(e) = 1/outl where outl is the number of edges
connected to node n1 with the same label l– Normalized Similarity Product : w(e) = (score(n1) ∗ score(n2))/outl.
4.3 Extended IncMap: Iterative User FeedbackQuery-driven incremental mappings allow to leverage necessary user feedbackafter each iteration to improve the quality of mapping suggestions in subsequentiterations. One of the reasons why we have chosen Similarity Flooding as a basisfor IncMap is the fact that user feedback can be integrated by adopting theinitial match scores in an IPG before the fix-point computation starts.
Though the possibility of an incremental approach has been mentioned al-ready in the Similarity Flooding paper [8], it so far has not been implementedand evaluated. Also, while it is simple to see where user feedback could be in-corporated in the IPG, it is far less trivial to decide which feedback should beemployed and how exactly it should be integrated in the graph. In this paper wefocus on leveraging only the most important kind of user feedback, i.e., the pre-vious confirmation and rejection of suggested mappings. We have devised threealternative methods how to add this kind of feedback into the graph.
First, as a confirmed match corresponds to a certain score of 1.0, while arejected match corresponds to a score of 0.0, we could simply re-run the fix-pointcomputation with adjusted initial scores of confirmed and/or rejected matches.We consequently name this first method Initializer. However, there is a clearrisk that the influence of such a simple initialization on the resulting mapping istoo small as scores tend to change rapidly during the first steps of the fix-pointcomputation.
To tackle this potential problem, our second method guarantees maximuminfluence of feedback throughout the fix-point computation. Instead of just ini-tializing a confirmed or rejected match with their final score once, we could re-peat the initialization at the end of each step of the fix-point computation after
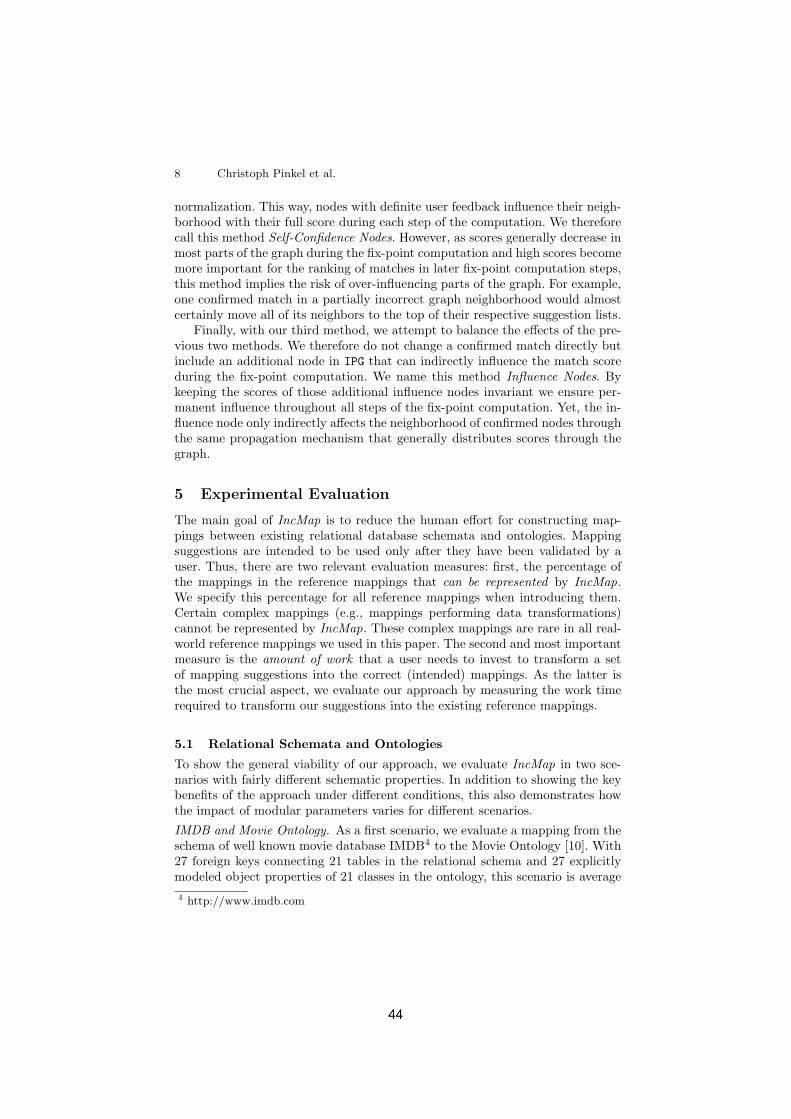
8 Christoph Pinkel et al.
normalization. This way, nodes with definite user feedback influence their neigh-borhood with their full score during each step of the computation. We thereforecall this method Self-Confidence Nodes. However, as scores generally decrease inmost parts of the graph during the fix-point computation and high scores becomemore important for the ranking of matches in later fix-point computation steps,this method implies the risk of over-influencing parts of the graph. For example,one confirmed match in a partially incorrect graph neighborhood would almostcertainly move all of its neighbors to the top of their respective suggestion lists.
Finally, with our third method, we attempt to balance the effects of the pre-vious two methods. We therefore do not change a confirmed match directly butinclude an additional node in IPG that can indirectly influence the match scoreduring the fix-point computation. We name this method Influence Nodes. Bykeeping the scores of those additional influence nodes invariant we ensure per-manent influence throughout all steps of the fix-point computation. Yet, the in-fluence node only indirectly affects the neighborhood of confirmed nodes throughthe same propagation mechanism that generally distributes scores through thegraph.
5 Experimental Evaluation
The main goal of IncMap is to reduce the human effort for constructing map-pings between existing relational database schemata and ontologies. Mappingsuggestions are intended to be used only after they have been validated by auser. Thus, there are two relevant evaluation measures: first, the percentage ofthe mappings in the reference mappings that can be represented by IncMap.We specify this percentage for all reference mappings when introducing them.Certain complex mappings (e.g., mappings performing data transformations)cannot be represented by IncMap. These complex mappings are rare in all real-world reference mappings we used in this paper. The second and most importantmeasure is the amount of work that a user needs to invest to transform a setof mapping suggestions into the correct (intended) mappings. As the latter isthe most crucial aspect, we evaluate our approach by measuring the work timerequired to transform our suggestions into the existing reference mappings.
5.1 Relational Schemata and Ontologies
To show the general viability of our approach, we evaluate IncMap in two sce-narios with fairly different schematic properties. In addition to showing the keybenefits of the approach under different conditions, this also demonstrates howthe impact of modular parameters varies for different scenarios.
IMDB and Movie Ontology. As a first scenario, we evaluate a mapping from theschema of well known movie database IMDB4 to the Movie Ontology [10]. With27 foreign keys connecting 21 tables in the relational schema and 27 explicitlymodeled object properties of 21 classes in the ontology, this scenario is average
4 http://www.imdb.com

IncMap: Pay as you go schema matching 9
in size and structural complexity. The reference mappings we use to derive corre-spondences for this scenario5 has been made available by the -ontop- team [11].A set of example queries is provided together with these reference mappings.We use these to construct annotations for user queries as well as to structureour incremental, query-by-query experiments. We extract a total of 73 potentialcorrespondences from this mapping, 65 of which can be represented by IncMapas mapping suggestions. This corresponds to 89% of the mappings that could berepresented in IncMap.MusicBrainz and Music Ontology. The second scenario is a mapping from theMusicBrainz database6 to the Music Ontology [12]. The relational schema con-tains 271 foreign keys connecting 149 tables, while the ontology contains 169explicitly modeled object properties and 100 classes, making the scenario bothlarger and more densely connected than the previous one. Here we use R2RMLreference mappings that have been developed in the project EUCLID.7 As therewere no example queries provided with the mapping in this case, we use exam-ple queries provided by the Music Ontology for user query annotations and tostructure the incremental experiment runs.
For these reference mappings, two out of 48 correspondences cannot be repre-sented as mapping suggestions by IncMap as they require data transformations.This corresponds to 95.8% of the mappings that could be represented in IncMap.
5.2 Work Time Cost Model
We evaluate our algorithms w.r.t. reducing work time (human effort). As theuser feedback process always needs to transform mapping suggestions generatedby IncMap into the correct mappings (i.e. to achieve a precision and recall of100%), the involved effort is the one distinctive quality measure. To this end, wehave devised a simple and straightforward work time cost model as follows: weassume that users validate mappings one by one, either accepting or rejectingthem. We further assume that each validation, on average, takes a user the sameamount of time tvalidate. The costs for finding the correct correspondence for anyconcept in this case is identical with the rank of the correct mapping suggestionin the ranked list of mapping suggestions for the concept times tvalidate.
As IncMap is interactive by design and would propose the user one mappingsuggestion after another, this model closely corresponds to end user reality. Weare aware that this process represents a simplification of mapping reality whereusers may compile some of the mappings by other means for various reasons. Nev-ertheless, this happens in the same way for any suggestion system and thereforedoes not impact the validity of our model for the purpose of comparison.
5.3 Experimental Evaluation
Experiment 1 – Naive vs. IncGraph. In our first experiment we compare theeffort required to correct the mapping suggestions when the schema and ontol-
5 https://babbage.inf.unibz.it/trac/obdapublic/wiki/Example MovieOntology6 http://musicbrainz.org/doc/MusicBrainz Database7 http://euclid-project.eu
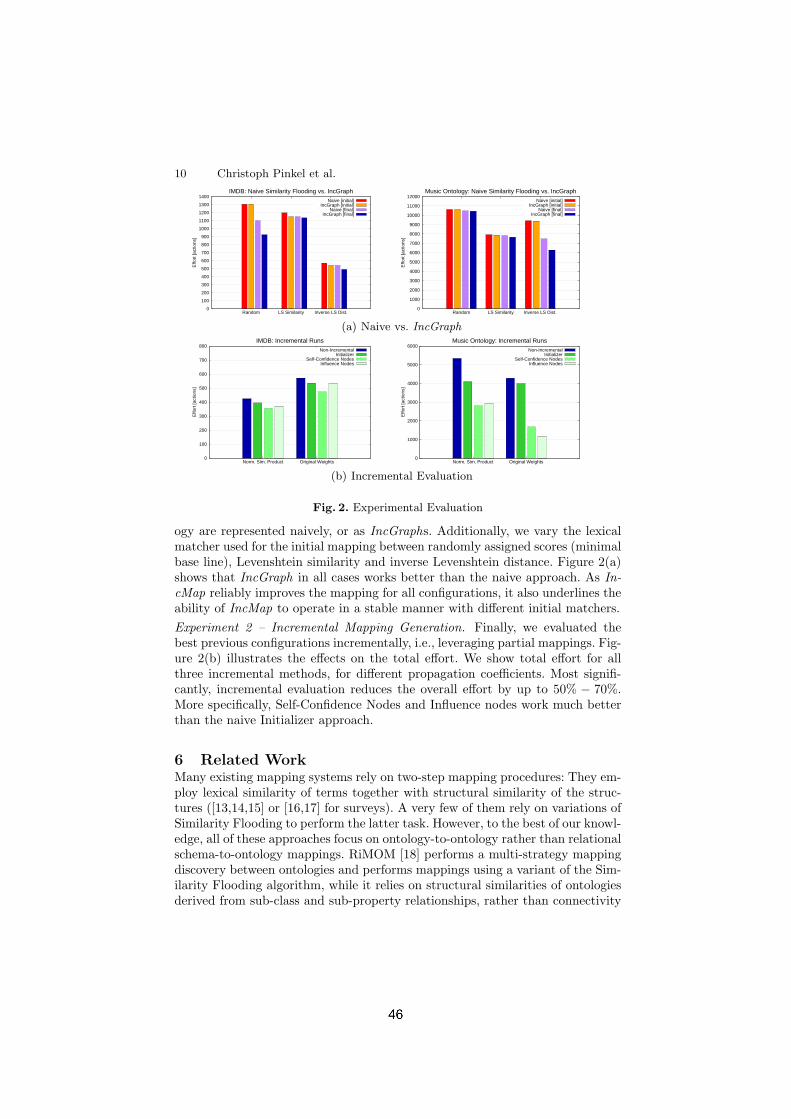
10 Christoph Pinkel et al.
0
100
200
300
400
500
600
700
800
900
1000
1100
1200
1300
1400
Random LS Similarity Inverse LS Dist.
Effo
rt [a
ctio
ns]
IMDB: Naive Similarity Flooding vs. IncGraphNaive [initial]
IncGraph [initial]Naive [final]
IncGraph [final]
0
1000
2000
3000
4000
5000
6000
7000
8000
9000
10000
11000
12000
Random LS Similarity Inverse LS Dist.
Effo
rt [a
ctio
ns]
Music Ontology: Naive Similarity Flooding vs. IncGraphNaive [initial]
IncGraph [initial]Naive [final]
IncGraph [final]
(a) Naive vs. IncGraph
0
100
200
300
400
500
600
700
800
Norm. Sim. Product Original Weights
Effo
rt [a
ctio
ns]
IMDB: Incremental RunsNon-Incremental
InitializerSelf-Confidence Nodes
Influence Nodes
0
1000
2000
3000
4000
5000
6000
Norm. Sim. Product Original Weights
Effo
rt [a
ctio
ns]
Music Ontology: Incremental RunsNon-Incremental
InitializerSelf-Confidence Nodes
Influence Nodes
(b) Incremental Evaluation
Fig. 2. Experimental Evaluation
ogy are represented naively, or as IncGraphs. Additionally, we vary the lexicalmatcher used for the initial mapping between randomly assigned scores (minimalbase line), Levenshtein similarity and inverse Levenshtein distance. Figure 2(a)shows that IncGraph in all cases works better than the naive approach. As In-cMap reliably improves the mapping for all configurations, it also underlines theability of IncMap to operate in a stable manner with different initial matchers.
Experiment 2 – Incremental Mapping Generation. Finally, we evaluated thebest previous configurations incrementally, i.e., leveraging partial mappings. Fig-ure 2(b) illustrates the effects on the total effort. We show total effort for allthree incremental methods, for different propagation coefficients. Most signifi-cantly, incremental evaluation reduces the overall effort by up to 50% − 70%.More specifically, Self-Confidence Nodes and Influence nodes work much betterthan the naive Initializer approach.
6 Related WorkMany existing mapping systems rely on two-step mapping procedures: They em-ploy lexical similarity of terms together with structural similarity of the struc-tures ([13,14,15] or [16,17] for surveys). A very few of them rely on variations ofSimilarity Flooding to perform the latter task. However, to the best of our knowl-edge, all of these approaches focus on ontology-to-ontology rather than relationalschema-to-ontology mappings. RiMOM [18] performs a multi-strategy mappingdiscovery between ontologies and performs mappings using a variant of the Sim-ilarity Flooding algorithm, while it relies on structural similarities of ontologiesderived from sub-class and sub-property relationships, rather than connectivity
IncMap: Pay as you go schema matching 11
of classes via properties as we do in order to get a better alignment of relationalschemata and ontologies. In Yamm++ [19] the authors used Similarity Flood-ing and exploit both sub-class and sub-property relationships, and domain andranges of ontologies, while they did it in a naive way which, as our experimentalresults showed, does not give good results for relational schemata-to-ontologymappings. Moreover, they use Similarity Flooding to obtain new mappings ontop of the ones obtained via linguistic similarities, while we do not derive newmappings but refine the ranking over the linguistically derived ones. There areworks on semi-automatic discovery of relational schema-to-ontology mappings,but they use approaches different from ours: For example, [20] transforms re-lational schemata and ontologies into directed labeled graphs respectively andreuse COMA [21] for essentially syntactic graph matching. Ronto [22] uses acombination of syntactic strategies to discover mappings by distinguishing thetypes of entities in relational schemata. The authors of [23] exploit structure ofontologies and relational schemata by calculating the confidence measures be-tween virtual documents corresponding to them via the TF/IDF model. All theseapproaches do not incorporate implicit schema information and do not supportan incremental mapping construction in the pay as you go fashion as IncMapdoes. Finally, [24] describes an approach to derive complex correspondences fora relational schema-to-ontology mapping using simple correspondences as input.This work is orthogonal to the approach presented in this paper.
7 Conclusions and OutlookWe presented IncMap, a novel semi-automatic matching approach for generat-ing relational schema-to-ontology mappings. Our approach is based on a novelunified graph model called IncGraph for ontologies and relational schemata. In-cMap implements a semi-automatic matching approach to derive mappings fromIncGraphs using both lexical and structural similarities between ontologies andrelational schemata. In order to find structural similarities IncMap exploits bothexplicit and implicit schema information. Moreover, IncMap allows to incorpo-rate user queries and user feedback in an incremental way, thus, enabling a payas you go fashion of the mapping generation. Our experiments with IncMap ondifferent real-world relational schemata and ontologies showed that the effort forcreating a mapping with IncMap is up to 20% less than using the SimilarityFlooding algorithm in a naive way. The incremental version of IncMap reducesthe total effort of mapping creation by another 50% − 70%. As future work weplan to follow three lines: (1) add more implicit schema information (annota-tions) to the IncGraphs, (2) support more complex mappings in IncMap, and(3) devise a search strategy over the configuration space to auto-tune IncMap.
8 Acknowledgements
This work was supported by the Seventh Framework Program (FP7) of theEuropean Commission under Grant Agreement 318338, the Optique project.
12 Christoph Pinkel et al.
References
1. Beyer, M.A., Lapkin, A., Gall, N., Feinberg, D., Sribar, V.T.: ‘Big Data’ is Only theBeginning of Extreme Information Management. Gartner rep. G00211490 (2011)
2. Crompton, J.: Keynote talk at the W3C Workshop on Sem. Web in Oil & GasIndustry (2008) http://www.w3.org/2008/12/ogws-slides/Crompton.pdf.
3. SAP HANA Help: http://help.sap.com/hana/html/sql export.html (2013)4. Poggi, A., Lembo, D., Calvanese, D., Giacomo, G.D., Lenzerini, M., Rosati, R.:
Linking Data to Ontologies. J. Data Semantics 10 (2008) 133–1735. Kontchakov, R., Lutz, C., Toman, D., Wolter, F., Zakharyaschev, M.: The Com-
bined Approach to Ontology-Based Data Access. In: IJCAI. (2011) 2656–26616. Hepp, M., Wechselberger, A.: OntoNaviERP: Ontology-Supported Navigation in
ERP Software Documentation. In: International Semantic Web Conference. (2008)7. Blunschi, L., Jossen, C., Kossmann, D., Mori, M., Stockinger, K.: SODA: Gener-
ating SQL for Business Users. PVLDB 5(10) (2012) 932–9438. Melnik, S., Garcia-Molina, H., Rahm, E.: Similarity Flooding: A Versatile Graph
Matching Algorithm and its Application to Schema Matching. In: ICDE, IEEEComputer Society (2002)
9. Motik, B., Patel-Schneider, P.F., Parsia, B.: OWL 2 Web Ontology LanguageStructural Specification and Functional-Style Syntax (2012) W3C Rec.
10. Bouza, A.: MO – The Movie Ontology, http://www.movieontology.org (2010)11. Rodriguez-Muro, M., Calvanese, D.: High Performance Query Answering over
DL-Lite Ontologies. In: KR. (2012)12. Raimond, Y., Giasson, F., (eds): Music Ontology, www.musicontology.com (2012)13. Jimenez-Ruiz, E., Grau, B.C.: LogMap: Logic-Based and Scalable Ontology Match-
ing. In: International Semantic Web Conference (1). (2011) 273–28814. Lambrix, P., Tan, H.: SAMBO – A system for aligning and merging biomedical
ontologies. J. Web Sem. 4(3) (2006) 196–20615. Fagin, R., Haas, L.M., Hernandez, M.A., Miller, R.J., Popa, L., Velegrakis, Y.:
Clio: Schema Mapping Creation and Data Exchange. In: Conceptual Modeling:Foundations and Applications. (2009) 198–236
16. Shvaiko, P., Euzenat, J.: Ontology Matching: State of the Art and Future Chal-lenges. IEEE Trans. Knowl. Data Eng. 25(1) (2013) 158–176
17. Rahm, E., Bernstein, P.A.: A Survey of Approaches to Automatic Schema Match-ing. In: VLDB J. (2001) 334–350
18. Li, J., Tang, J., Li, Y., Luo, Q.: RiMOM: A Dynamic Multistrategy OntologyAlignment Framework. IEEE Trans. Knowl. Data Eng. (2009) 1218–1232
19. Ngo, D., Bellahsene, Z.: YAM++: A Multi-strategy Based Approach for OntologyMatching Task. In: EKAW. (2012) 421–425
20. Dragut, E.C., Lawrence, R.: Composing Mappings Between Schemas Using a Ref-erence Ontology. In: CoopIS/DOA/ODBASE (1). (2004) 783–800
21. Do, H.H., Rahm, E.: COMA – A System for Flexible Combination of SchemaMatching Approaches. In: VLDB. (2002) 610–621
22. Papapanagiotou, P., Katsiouli, P., Tsetsos, V., Anagnostopoulos, C., Hadjiefthymi-ades, S.: Ronto: Relational to Ontology Schema Matching. In: AIS SIGSEMISBULLETIN. (2006) 32–34
23. Hu, W., Qu, Y.: Discovering Simple Mappings Between Relational DatabaseSchemas and Ontologies. In: ISWC/ASWC. (2007) 225–238
24. An, Y., Borgida, A., Mylopoulos, J.: Inferring Complex Semantic Mappings Be-tween Relational Tables and Ontologies from Simple Correspondences. In: OTMConferences (2). (2005)
Complex Correspondences for Query PatternsRewriting
Pascal Gillet, Cassia Trojahn, Ollivier Haemmerle, and Camille Pradel
IRIT & Universite de Toulouse 2, Toulouse, [email protected],{cassia.trojahn,ollivier.haemmerle,camille.pradel}@irit.fr
Abstract. This paper discusses the use of complex alignments in thetask of automatic query patterns rewriting. We apply this approachin SWIP, a system that allows for querying RDF data from naturallanguage-based queries, hiding the complexity of SPARQL. SWIP isbased on the use of query patterns that characterise families of queriesand that are instantiated with respect to the initial user query expressedin natural language. However, these patterns are specific to the vocabu-lary used to describe the data source to be queried. For rewriting querypatterns, we experiment ontology matching approaches in order to findcomplex correspondences between two ontologies describing data sources.From the alignments and initial query patterns, we rewrite these patternsin order to be able to query the data described using the target ontology.These experiments have been carried out on an ontology on the musicdomain and DBpedia ontology.
1 Introduction
Despite the fact that SPARQL is the standard de facto language for queryingRDF data, its complexity may restrict its use at a large scale, specially for non-expert RDF users. Translating natural language queries into SPARQL ones isthe object of researches in both Natural Language Processing and Semantic Webfields. Within the SWIP system [11], users express queries in natural languagesentences and pre-written query patterns are instantiated with respect to a syn-tactic analysis of the initial query. Several possible interpretations of the queriesare shown to the user which selects the query he/she is interested in. Unlike otherproposals, such as the one in [5, 4], where user queries are limited to keywords,or in [16], where users can express their queries using a visual query language,the originality of SWIP is related to the use of query patterns.
The main principle behind query patterns states that, in real applications,the submitted queries are variations of few typical query families (i.e., the familyof queries asking for the actors playing in movies or the queries asking for themembers of a musical band, or the albums of a musical artist). On the one hand,the use of patterns avoids exploring the whole ontology to link the semanticentities identified from the keywords since the potential relations are alreadyexpressed in the patterns. The process thus benefits from the pre-establishedfamilies of frequently expressed queries for which real information needs exist.
A query pattern can also be seen as the projection of a subgraph of the under-lying knowledge base, used as a mediator for the translation between the queryexpressed in natural language and the corresponding SPARQL query. On theother hand, one of the main limitations of the query pattern-based approach isthat reusing patterns across different data sources can be done in a very limitedextent. For each data source to be queried, the corresponding query patternshave to be (manually) built. Rewriting query patterns based on a vocabulary toquery patterns based on another vocabulary is a task that can be carried outwith the help of ontology alignments.
This paper discusses the use of complex correspondences for automatic querypatterns rewriting. While the usefulness of simple correspondences has long beenrecognised, query rewriting requires more expressive links between ontology en-tities expressing the true relationships between them. At a lower level of abstrac-tion, ontology alignments have been used to support the task of SPARQL queryrewriting [2, 9, 8]. However, query patterns and SPARQL refer to different lev-els of expressivity in their representations, where query patterns are articulatedas a set of subpatterns and rely solely on the T Box of ontologies. Hence, weexperiment ontology matching approaches in order to find complex correspon-dences between two ontologies describing two different data collections. Fromthe complex alignments and source query patterns, we rewrite these patterns inorder to be able to query the data collection described using the target ontology.Experiments have been carried out on an ontology on the music domain andDBpedia ontology. As a main outcoming, we have a set of manually validatedcomplex correspondences, from which query patterns can be reused across thedata sets described using those ontologies.
The rest of the paper is organised as follows. First, we introduce complexcorrespondences and query patterns (§2). Then, we present the approach forquery pattern rewriting that is based on the use of complex correspondences(§3). Next, the experiments are discussed (§4). Finally, we discuss related work(§5) and conclude the paper (§6).
2 Foundations
2.1 Complex correspondences
Matching two ontologies is the process of generating an alignment between them[6]. An alignment A is directional and refers to a source ontology O and a targetontology O′, denoted AO→O′ :
Definition 1 (Alignment). An alignment AO→O′ between two ontologies Oand O′ is a set of correspondences AO→O′ = {c1, c2, ..., cn}, where each ci is atriple 〈ei, e′i, r〉, where:
– whether the correspondence is simple, then it relates one and only one entity(i.e., a class or a property) ei of O to one and only one entity e′i of O
′ (1:1);

– or the correspondence is complex, and it involves one or more entities ina logical formulation (1:n,m:1,m:n), where ei refers to a subset of elements∈ O, and e′i refers to a subset of elements ∈ O′, and these elements arerelated using the constructors of a formal language (First-Order Logic orDescription Logics);
– r is a relation, e.g., equivalence (≡), more general(�), more specific (�),holding between ei and e′i;
– additionally, a value n (typically in [0,1]) is assigned to ci indicating thedegree of confidence that the relation r holds between the e and e′.
The correspondence 〈ei, e′i, r〉 is unique in AO→O′ . On the other hand, ei ore′i may be present in more than one correspondence ci. The alignment AO→O′
is said complex if it contains at least one complex correspondence. In the rest ofthis paper, a correspondence ci, which is a triple 〈ei, e′i, r〉 (suffix notation), willbe noted ei r e′i. For example, Film � Work is a simple correspondence andasserts that Film in O is more specific than Work in O′. On the other hand,we can have the following two complex correspondences :
∀x, Short F ilm(x) ≡ Film(x) ∧ duration(x, y) ∧ y ≤ 59 (1)
∀x,Biopic(x) ≡ Film(x) ∧ Celebrity(y) ∧ topic(x, y) (2)
(1) asserts that a Short F ilm in O is equivalent to a Film in O′ whose dura-tion is less than 59 minutes, and (2) asserts that a Biopic (or biographical film)in O is equivalent to a Film in O′ whose the topic is about a famous person. Wecan either use First-Order Logic (FOL) or the constructors of Description Logics(DL) for expressing the complex correspondences. In FOL, a class correspondsto a unary predicate with one variable, a property to a binary predicate with twovariables, and an instance to a constant. In DL, a class corresponds to a (atomic)concept, a property to a role, and an instance to an individual. We can equallytranspose logical statements from DL to FOL, and conversely, as long as the DLfragment is always respected. In particular, we take advantage of the expressiv-ity allowed by SHOIN , describing the following DL operators: ¬C (negationof concepts), C � C (intersection or conjunction of concepts), C � C (union ordisjunction of concepts), ∃R.C (existential restriction), ∀R.C (universal restric-tion), ≤ nR (at most restriction), ≥ nR (at least restriction). For instance, theformula (1) becomes (3) and the formula (2) becomes (4) :
Short F ilm ≡ Film � ∃duration. ≤ 59 (3)
Biopic ≡ Film � ∃topic.Celebrity (4)
In a (complex) correspondence formula expressed in FOL, a variable may occurin several entities in left and right operands. Intuitively, two classes referringto the same single variable are bound and are first connected by a simple cor-respondence (with a subsumption relation, otherwise there is no need for anadditional complex correspondence to characterise the entities involved). For in-stance, the formulas (1) and (2) are consistent only if Court metrage � Filmand Biopic � Film, respectively. The use of DL in (4) requires to explicitly as-sert the simple correspondence Biopic � Film first, as we do not know if Biopicis a specialisation or rather a generalisation of Film or Celebrity otherwise.
2.2 Query patterns
A pattern pO targetting an ontology O is composed of an RDF graph whichis the prototype of a relevant family of queries. A pattern can be composedof several subpatterns spi, such as pO = {sp1, sp2, ..., spn}. Subpatterns areassigned minimal and maximal cardinalities, making these subgraphs optional orrepeatable when generating the final SPARQL query. Formally, a query patterncan be defined as follows [12]:
Definition 2 (Query pattern). Let G be a graph and v a vertex of the graph,we denote by G\v the graph deprived of the vertex v and all the arcs incident tothe vertex. A query pattern p is a triple (G,Q, SP ) such as :
– G is a RDF connected graph that describes the general structure of the patternand represents a family of requests;
– Q is a subset of elements in G, called qualifier elements; these are typicalof the pattern and will be taken into account during the association of theuser request to the pattern in question. A qualifier element is either a vertex(class or data type), or an arc (object or data property) in G;
– SP is the set of subpatterns sp in p such that ∀sp = (SG, v, cardmin, cardmax) ∈SP , we have:• SG is a subgraph of G and v is a vertex of SG (and thus of G), such
as G\v is not connected (v is a joint vertex in G, also called junctionvertex) and admits SG\v as a connected component (i.e. all the verticesin this connected component belong to the subpattern subpattern’s graph);
• At least one vertex or an arc of SG is a qualifier element;• cardmin, cardmax ∈ N et 0 ≤ cardmin ≤ cardmax ; are respectively theminimum and maximum cardinality of sp that define the optional andrepeatable characteristics of sp.
Figure 2.2 shows an example of a query pattern which deals with the events,and the performers involved, where musical works have been performed (or con-versely) with the corresponding artist(s) and release date. The pattern is com-posed of three subpatterns named live, artist and date. All of them are optional,and only the subpatterns live and artist are repeatable: it is considered that amusical work can have only one release date, but a musical work may be thework of several artists and can be performed many times.
3 Patterns rewriting approach
The rewriting approach takes as input a complex alignment AO→O′ and a setP={pO1 ,...,pOn } of query patterns pOi , and outputs a set P ′={pO′
1 ,...,pO′
n } of query
patterns pO′
j . The intuition is that every subgraph from the input patterns haspotentially a (complex) correspondence associating its entities to entities in thetarget ontology. We consider that the subpattern is the relevant unit of semanticinformation constituting the patterns. Each subpattern is ideally replaced with

Fig. 1. Query pattern asking for events and their performers, where musical workshave been performed (or conversely), with the corresponding artist(s) and release date.
an equivalent subgraph corresponding to a logical statement relating conceptsand properties of the target ontology. This statement is the target part of thecorrespondence, if any in the alignment, in which the source part matches theinitial subpattern. But the subpatterns and the correspondences in the alignmentmay not have the same granularity (correspondences can be either simple or canrelate smaller subgraphs). Thus, we define an algorithm that is similar to aDepth-First Search algorithm (DFS) for traversing and searching graph datastructures in the input query patterns. It starts at the largest subgraph, i.e. thesubpattern, and recursively explores its subgraphs (i.e. subpattern > RDF triples> classes and properties), until a correspondence is found for the consideredsubgraph (in which case, the target graph is written to the subpattern beingoutputted) or a class or property is reached. If at the end of this process, there areentities that have not been translated, the whole subpattern will be discarded1.The operation is repeated for each subpattern in the input patterns.
The approach is inherently limited by the use of ontology alignment, whichis itself an incomplete process. The subpattern is the indivisible expression of aneed for information: it can be rewritten by chunks but if it is not fully rewrittenat the end of the process, it is discarded. Thus, the conservation of the semanticsof original patterns directly depends on the completeness of the input alignment(coverage of the source ontology, quality of correspondences, etc.). We considerthat some loss of (semantic) information is acceptable, and that it can be filledwith other techniques (for instance, by interacting with the user). However,it is out of the scope of this paper. Figure 3 illustrates the rewriting of thepattern depicted in Figure 2.2 (with the input alignment given later in §4.3,Table 1). The subpattern named live is rewritten to live’, following the complexcorrespondence #6 in the alignment. The subpattern named artist is rewritten toartist’, following the complex correspondence #2 in the alignment (in this case,only the first term of the disjunction artist � author � creator � musicComposerappears in the resulting subpattern, for the sake of simplicity and readability).
1In this case, the pattern is still connected, i.e. there is a chain connecting each pairof vertices.

Finally, the subpattern named date could not be directly rewritten since thereis no correspondence for this subgraph. Instead, the property release date isrewritten to releaseDate, following a simple correspondence, and the data typexsd:date remains xsd:date.
Fig. 2. Example of query pattern rewriting.
4 Experiments and discussion
4.1 Data sets
SWIP provides two sets of query patterns, one for the MusicBrainz collectiondescribed in terms of the Music ontology2 (containing 249 T Box entities), andanother for querying the ABox of the Cinema IRIT3 ontology (containing 300T Box entities). We have carried out our experiments using the Music ontologyand DBpedia 3.84 ontology (containing 2213 entities), in order to rewrite querypatterns targeting MusicBrainz collection into patterns targeting DBpedia. Themusic set of patterns is composed of 5 query patterns and 19 subpatterns.
4.2 Preliminary experiments
In a first series of experiments, we used a set of simple correspondences for rewrit-ing patterns. These correspondences come from a merge of alignments generated
2http://musicontology.com/3http://ontologies.alwaysdata.net/cinema4http://wiki.dbpedia.org/Ontology?v=181z

by OAEI 2012 matching systems (the reader can refer to [7] for details). Over-all, 67% of the entities in the Music ontology were covered in the alignment.25 out of 60 entities in the query patterns for this ontology could be replacedby a target entity (coverage of 41%). In terms of subpatterns, only 2 out of the19 subpatterns could be fully rewritten using the alignment. Although we havefound a handmade (reference) alignment between Music and DBpedia ontolo-gies5, we could not use it because it is mostly composed by correspondenceslinking classes only, using subsumption relations, and few equivalences could beinferred from them. Despite the fact that the quality of the alignment from thematchers was not measured, these first experiments highlighted the limitationsin replacing individually the entities in the patterns. Nevertheless, we needed toaccurately assess this deficiency and to know to what extent we could rewritequery patterns. It turned out that simple correspondences are not sufficient tocapture all the meaningful relations between entities of two related ontologies.
4.3 Complex correspondences
Very few systems are able to find complex correspondences. First, we tried thetool described in [14], which finds complex correspondences using a set of pre-defined patterns. Besides the two ontologies to align, this tool takes an alignmentas input. We used the tool on the pair Music-DBpedia, with (i) the handmadealignment between Music and DBpedia ontologies, and (ii) the merged alignmentfrom the matchers used in the preliminary experiments (§4.2). In both cases, fewcorrect correspondences could be identified. We tried then the successor of thistool described in [15], which benefits of natural language processing techniquesinstead of requiring an input alignment, and we obtained similar results.
Hence, we manually created a set of 28 complex correspondences (along 11simple ones) for the pair Music-DBpedia, guided by the query patterns for Mu-sic6. A subset of them is presented in Table 1. The idea behind using complexcorrespondences is that every subgraph pattern has potentially a (complex) cor-respondence in the target ontology. Given that the subpattern is the relevant unitof semantic information constituting the patterns, we isolated them, and for eachof them, we tried to find an equivalent logical statement relating concepts andproperties of the target ontology. For constructing the complex correspondenceset, we used as basis a set of simple correspondences (the left operand refers to anentity of the Music ontology, and the right operand refers to an entity of the DB-pedia ontology): MusicalManifestation�MusicalWork, MusicalWork≡Musical-Work*, MusicArtist ≡ MusicalArtist*, Performance � Event, Performer ≡ Mu-sicalArtist, foaf:Group � Band, MusicGroup ≡ Band*, SoloMusicArtist � Mu-sicalArtist, Track � MusicalWork, Track ≡ Song, and Record � MusicalWork7.
For each correspondence, we identified the complex correspondence pat-terns that characterise it, from the patterns proposed in the literature: Class
5http://knoesis.org/projects/BLOOMS/#Resources_for_Download6The resulting alignment do not cover all possible correspondences between Music-
DBpedia, but a subset of them where entities appear in the query patterns.7Correspondences with an asterisk were discovered using OAEI matchers.
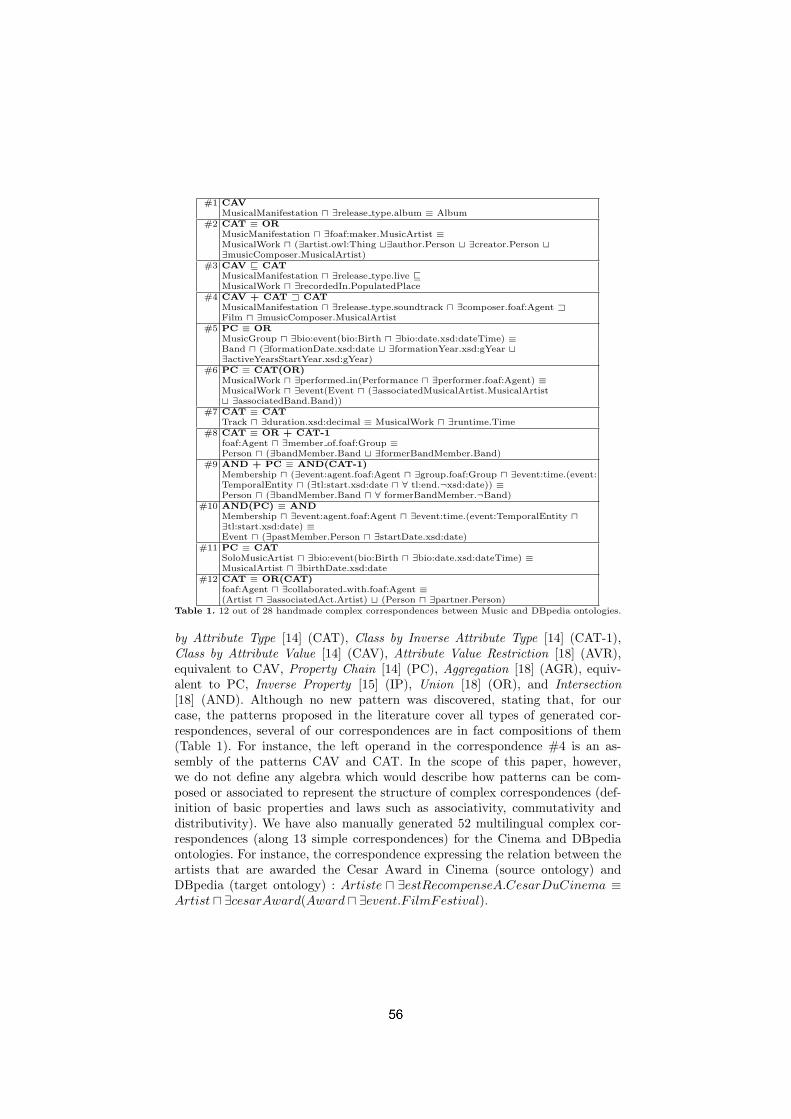
#1 CAVMusicalManifestation � ∃release type.album ≡ Album
#2 CAT ≡ ORMusicManifestation � ∃foaf:maker.MusicArtist ≡MusicalWork � (∃artist.owl:Thing �∃author.Person � ∃creator.Person �∃musicComposer.MusicalArtist)
#3 CAV � CATMusicalManifestation � ∃release type.live �MusicalWork � ∃recordedIn.PopulatedPlace
#4 CAV + CAT � CATMusicalManifestation � ∃release type.soundtrack � ∃composer.foaf:Agent �Film � ∃musicComposer.MusicalArtist
#5 PC ≡ ORMusicGroup � ∃bio:event(bio:Birth � ∃bio:date.xsd:dateTime) ≡Band � (∃formationDate.xsd:date � ∃formationYear.xsd:gYear �∃activeYearsStartYear.xsd:gYear)
#6 PC ≡ CAT(OR)MusicalWork � ∃performed in(Performance � ∃performer.foaf:Agent) ≡MusicalWork � ∃event(Event � (∃associatedMusicalArtist.MusicalArtist� ∃associatedBand.Band))
#7 CAT ≡ CATTrack � ∃duration.xsd:decimal ≡ MusicalWork � ∃runtime.Time
#8 CAT ≡ OR + CAT-1foaf:Agent � ∃member of.foaf:Group ≡Person � (∃bandMember.Band � ∃formerBandMember.Band)
#9 AND + PC ≡ AND(CAT-1)Membership � (∃event:agent.foaf:Agent � ∃group.foaf:Group � ∃event:time.(event:TemporalEntity � (∃tl:start.xsd:date � ∀ tl:end.¬xsd:date)) ≡Person � (∃bandMember.Band � ∀ formerBandMember.¬Band)
#10 AND(PC) ≡ ANDMembership � ∃event:agent.foaf:Agent � ∃event:time.(event:TemporalEntity �∃tl:start.xsd:date) ≡Event � (∃pastMember.Person � ∃startDate.xsd:date)
#11 PC ≡ CATSoloMusicArtist � ∃bio:event(bio:Birth � ∃bio:date.xsd:dateTime) ≡MusicalArtist � ∃birthDate.xsd:date
#12 CAT ≡ OR(CAT)foaf:Agent � ∃collaborated with.foaf:Agent ≡(Artist � ∃associatedAct.Artist) � (Person � ∃partner.Person)
Table 1. 12 out of 28 handmade complex correspondences between Music and DBpedia ontologies.
by Attribute Type [14] (CAT), Class by Inverse Attribute Type [14] (CAT-1),Class by Attribute Value [14] (CAV), Attribute Value Restriction [18] (AVR),equivalent to CAV, Property Chain [14] (PC), Aggregation [18] (AGR), equiv-alent to PC, Inverse Property [15] (IP), Union [18] (OR), and Intersection[18] (AND). Although no new pattern was discovered, stating that, for ourcase, the patterns proposed in the literature cover all types of generated cor-respondences, several of our correspondences are in fact compositions of them(Table 1). For instance, the left operand in the correspondence #4 is an as-sembly of the patterns CAV and CAT. In the scope of this paper, however,we do not define any algebra which would describe how patterns can be com-posed or associated to represent the structure of complex correspondences (def-inition of basic properties and laws such as associativity, commutativity anddistributivity). We have also manually generated 52 multilingual complex cor-respondences (along 13 simple correspondences) for the Cinema and DBpediaontologies. For instance, the correspondence expressing the relation between theartists that are awarded the Cesar Award in Cinema (source ontology) andDBpedia (target ontology) : Artiste � ∃estRecompenseA.CesarDuCinema ≡Artist � ∃cesarAward(Award � ∃event.F ilmFestival).

4.4 Rewriting SPARQL queries and query patterns
From the set of complex correspondences for the pair Music-DBpedia and thequery patterns for Music, we applied our approach (§3) for rewriting Music pat-terns in terms of the DBpedia vocabulary. Before rewriting patterns, we evalu-ated the use of these correspondences for rewriting SPARQL queries. For doingso, we defined a set of rules for translating a complex correspondence patterninto RDF graph patterns (Table 2). These rules are intended to be used forguiding the process of SPARQL rewriting. Following these rules, we managed torewrite the 25 first SPARQL queries from the benchmark training data in QALD20138. The training data include 100 natural language questions for MusicBrainzwith the corresponding SPARQL queries, as well as the answers these queriesretrieve. The queries have been rewritten in order to interrogate DBpedia.
ID Formal pattern SPARQL rewriting rule
CAT A ≡ ∃R.B ?x a A → { ?x R B }CAT-1 A ≡ B � ∃R-.T ?x a A → { ?x a B . ?y R ?x }CAV A ≡ ∃R.{...} ?x a A → { ?x R ”...”ˆˆex:dataType }AVR A ≡ B � ∃R.{...} ?x a A → { ?x a B . ?x R SomeValue . }PC R ≡ P.(A � ∃Q) ?x R ?y → { ?x P A . A Q ?y }IP R- � P ?x R ?y → ?y P ?xOR A ≡ B � (∃R.T ∃Q.T) ?x a A → {?x a B . {B R ?y} UNION {B Q ?z}}AND A ≡ B � (∃R.T � ∃Q.T) ?x a A → {?x a B . ?x R ?y ; Q ?z .}
Table 2. Complex correspondence patterns and SPARQL rewriting rules.
As an example, consider the query in Table 3 asking if there are members of theRamones who are not named Ramone (question #25) over MusicBrainz, and thesame query rewritten for DBpedia. The MusicBrainz result answers false, whilethe DBpedia result asserts the opposite. The DBpedia request is not less correct:if we return the actual query solutions (SELECT) instead of testing whether ornot the query pattern has a solution (ASK), we find that Clem Burke in DB-pedia was a member of The Ramones under the name “Elvis Ramone”, whilethe MusicBrainz data set directly refers to him with this alias. In fact, bothsets of instances do not fully intersect and they are not necessarily/correctlyinterlinked9. From this point of view, 18 of the 25 rewritten queries are cor-rect and consistent with the queries for MusicBrainz: they do not necessarilygive the same results, but they do answer the same question. 3 of these 18 re-sults give the same number of solutions with exactly the same literals. 5 out ofthe 7 remaining results give no solution at all (no instance). And finally, the 2last results are not fully correct since the complex correspondences ahead are notcorrect themselves. For instance, MusicalManifestation�∃release type.live �MusicalWork � ∃recordedIn.PopulatedP lace turns out to be erroneous sincethe albums which have been recorded in a recording studio are equally selectable
8Open challenge on Multilingual Question Answering over Linked Data: http://greententacle.techfak.uni-bielefeld.de/~cunger/qald/index.php?x=task1&q=3
9http://wiki.dbpedia.org/Interlinking?v=vn
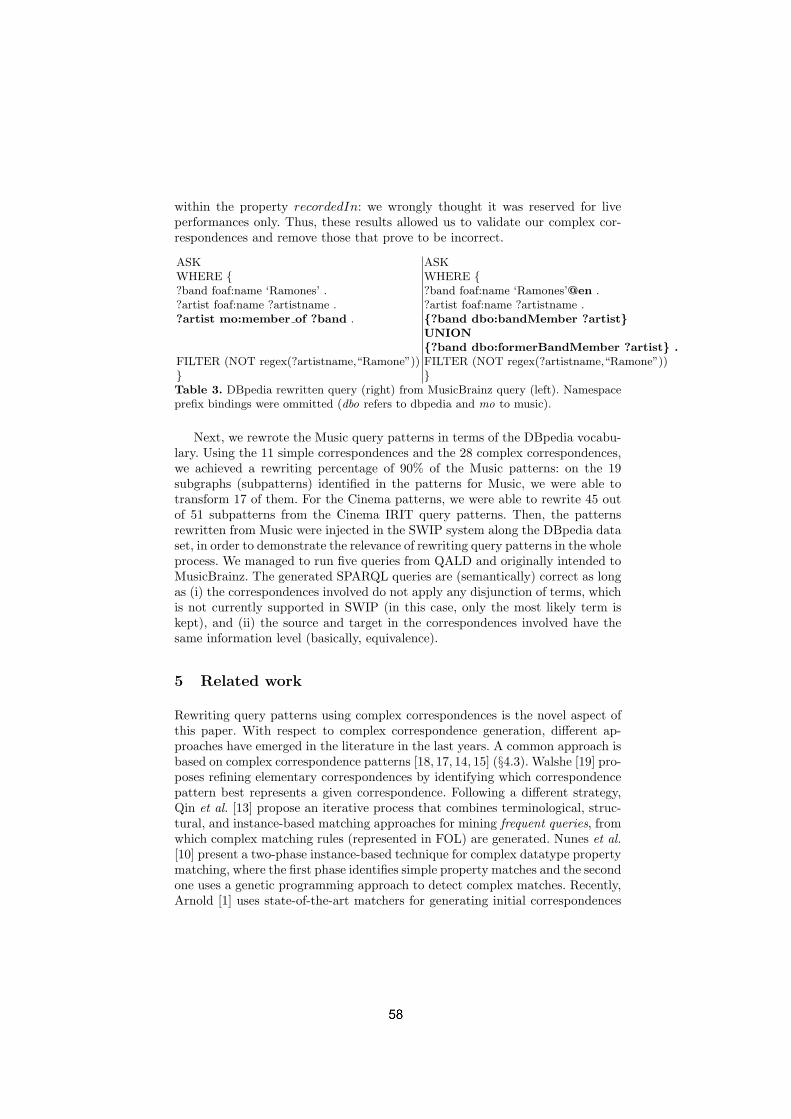
within the property recordedIn: we wrongly thought it was reserved for liveperformances only. Thus, these results allowed us to validate our complex cor-respondences and remove those that prove to be incorrect.
ASK ASKWHERE { WHERE {?band foaf:name ‘Ramones’ . ?band foaf:name ‘Ramones’@en .?artist foaf:name ?artistname . ?artist foaf:name ?artistname .?artist mo:member of ?band . {?band dbo:bandMember ?artist}
UNION{?band dbo:formerBandMember ?artist} .
FILTER (NOT regex(?artistname,“Ramone”)) FILTER (NOT regex(?artistname,“Ramone”))} }Table 3. DBpedia rewritten query (right) from MusicBrainz query (left). Namespaceprefix bindings were ommitted (dbo refers to dbpedia and mo to music).
Next, we rewrote the Music query patterns in terms of the DBpedia vocabu-lary. Using the 11 simple correspondences and the 28 complex correspondences,we achieved a rewriting percentage of 90% of the Music patterns: on the 19subgraphs (subpatterns) identified in the patterns for Music, we were able totransform 17 of them. For the Cinema patterns, we were able to rewrite 45 outof 51 subpatterns from the Cinema IRIT query patterns. Then, the patternsrewritten from Music were injected in the SWIP system along the DBpedia dataset, in order to demonstrate the relevance of rewriting query patterns in the wholeprocess. We managed to run five queries from QALD and originally intended toMusicBrainz. The generated SPARQL queries are (semantically) correct as longas (i) the correspondences involved do not apply any disjunction of terms, whichis not currently supported in SWIP (in this case, only the most likely term iskept), and (ii) the source and target in the correspondences involved have thesame information level (basically, equivalence).
5 Related work
Rewriting query patterns using complex correspondences is the novel aspect ofthis paper. With respect to complex correspondence generation, different ap-proaches have emerged in the literature in the last years. A common approach isbased on complex correspondence patterns [18, 17, 14, 15] (§4.3). Walshe [19] pro-poses refining elementary correspondences by identifying which correspondencepattern best represents a given correspondence. Following a different strategy,Qin et al. [13] propose an iterative process that combines terminological, struc-tural, and instance-based matching approaches for mining frequent queries, fromwhich complex matching rules (represented in FOL) are generated. Nunes et al.[10] present a two-phase instance-based technique for complex datatype propertymatching, where the first phase identifies simple property matches and the secondone uses a genetic programming approach to detect complex matches. Recently,Arnold [1] uses state-of-the-art matchers for generating initial correspondences

that are further (semi-automatically) enriched by using linguistic, structuraland background knowledge-based strategies. Although different strategies havebeen proposed, very few matchers for generating complex correspondences areavailable or use EDOAL, an expressive alignment language [3], for representingthem. With respect to query patterns rewriting, the problem can be seen, at alower level of abstraction, as a problem of SPARQL rewriting. Correndo et al.[2] propose a set of SPARQL rewriting rules exploiting both (complex) ontologyalignments and entity co-reference resolution. Zheng et al. [20] propose to rewriteSPARQL queries from different contexts, where context mappings provide thearticulation of the data semantics for the sources and receivers. Makris et al.[9, 8] present the SPARQL-RW rewriting framework that applies a set of prede-fined (complex) correspondences. They define a set of correspondence types thatare used as basis for the rewriting process (i.e., Class Expression, Object Prop-erty Expression, Datatype Property, and Individual). However, the way the setof complex correspondences is established is not described. Our naive approachfor rewriting query patterns is close to these SPARQL rewriting proposals inthe sense of using complex correspondences. One of the difficulties is the lackof established ways for automatically identifying them. Although m:n complexcorrespondences are proposed at conceptual level, few concrete examples areavailable in the literature. Most of our correspondences are n:m. As most pro-posals, we start from a set of (automatically) discovered simple correspondences.Finally, our method is applied in an applicative context of rewriting patterns fora question answering system over RDF data.
6 Conclusions and future work
This paper has discussed the use of complex correspondences for rewriting querypatterns, aiming at reusing query families across data sets that overlap. Althoughwe could not fully evaluate the rewriting process mainly due to the fact thatSWIP does not treat pattern disjunctions, we were able to validate our approachon a subset of manually validated complex correspondences. This opens severalopportunities for future work. First, the structure of query patterns in SWIPcould evolve so that they match the structure of the complex correspondenceswe have established. In particular, SWIP would benefit from the disjunction ofsubpatterns or specification of instances in patterns. Second, we plan to representour complex correspondences using EDOAL. Third, we plan to formalise thecomposition of complex correspondence patterns, which are thereby the buildingblocks to obtain richer correspondences, following a grammar defining a set ofrules for rewriting logical statements in FOL or DL. The grammar must definethe properties of pattern precedence, transitivity, associativity, commutativity,and distributivity. Finally, we plan to propose an approach for (multilingual)complex correspondence generation, exploiting specially the ABox of ontologies.

References
1. P. Arnold. Semantic enrichment of ontology mappings: Detecting relation typesand complex correspondences. In 25th GI-Workshop on Foundations of Databases,2013.
2. G. Correndo, M. Salvadores, I. Millard, H. Glaser, and N. Shadbolt. SPARQLQuery Rewriting for Implementing Data Integration over Linked Data. In 1stInternational Workshop on Data Semantics (DataSem 2010), March 2010.
3. J. David, J. Euzenat, F. Scharffe, and C. Trojahn. The Alignment API 4.0. Se-mantic Web, 2(1):3–10, 2011.
4. S. Elbassuoni and R. Blanco. Keyword search over rdf graphs. In Proceedings of the20th ACM International Conference on Information and Knowledge Management,CIKM ’11, pages 237–242. ACM, 2011.
5. S. Elbassuoni, M. Ramanath, R. Schenkel, and G. Weikum. Searching RDF Graphswith SPARQL and Keywords. IEEE Data Eng. Bull., 33(1):16–24, 2010.
6. J. Euzenat and P. Shvaiko. Ontology Matching. Springer-Verlag, Berlin, Heidelberg,2007.
7. P. Gillet, C. Trojahn, and O. Haemmerle. Reecriture de patrons de requetes al’aide d’alignements d’ontologies. In Atelier Qualite et Robustesse dans le Web deDonnees, IC, 2013.
8. K. Makris, N. Bikakis, N. Gioldasis, and S. Christodoulakis. SPARQL-RW: trans-parent query access over mapped RDF data sources. In 15th International Con-ference on Extending Database Technology, pages 610–613. ACM, 2012.
9. K. Makris, N. Gioldasis, N. Bikakis, and S. Christodoulakis. Ontology mapping andSPARQL rewriting for querying federated RDF data sources. In 2010 Conferenceon On the Move to Meaningful Internet Systems, pages 1108–1117, 2010.
10. B. Nunes, A. Mera, M. Casanova, K. Breitman, and L. A. Leme. Complex Matchingof RDF Datatype Properties. In 6th Workshop on Ontology Matching, 2011.
11. C. Pradel, O. Haemmerle, and N. Hernandez. A Semantic Web Interface UsingPatterns: The SWIP System. In Graph Structures for Knowledge Representationand Reasoning, LNCS, pages 172–187. Springer Berlin Heidelberg, 2012.
12. C. Pradel, O. Haemmerle, N. Hernandez, et al. Des patrons modulaires de requetessparql dans le systeme swip. 23es Journees d’Ingenierie des Connaissances, 2012.
13. H. Qin, D. Dou, and P. LePendu. Discovering executable semantic mappings be-tween ontologies. In OTM International Conference, pages 832–849, 2007.
14. D. Ritze, C. Meilicke, O. Svab-Zamazal, and H. Stuckenschmidt. A pattern-basedontology matching approach for detecting complex correspondences. In 4th Work-shop on Ontology Matching, 2009.
15. D. Ritze, J. Volker, C. Meilicke, and O. Svab-Zamazal. Linguistic analysis forcomplex ontology matching. In 5th Workshop on Ontology Matching, 2010.
16. A. Russell and P. R. Smart. Nitelight: A graphical editor for sparql queries. InPoster and Demo Session at the 7th International Semantic Web Conference, 2008.
17. F. Scharffe. Correspondence Patterns Representation. PhD thesis, University ofInnsbruck, Innsbruck, 2009.
18. F. Scharffe and D. Fensel. Correspondence patterns for ontology alignment. InKnowledge Engineering: Practice and Patterns, pages 83–92. Springer, 2008.
19. B. Walshe. Identifying complex semantic matches. In 9th International Conferenceon The Semantic Web: Research and Applications, pages 849–853, 2012.
20. X. Zheng, S. E. Madnick, and X. Li. SPARQL Query Mediation over RDF DataSources with Disparate Contexts. In WWW Workshop on Linked Data on theWeb, 2012.

Results of theOntology Alignment Evaluation Initiative 2013�
Bernardo Cuenca Grau1, Zlatan Dragisic2, Kai Eckert3, Jerome Euzenat4,Alfio Ferrara5, Roger Granada6,7, Valentina Ivanova2, Ernesto Jimenez-Ruiz1,Andreas Oskar Kempf8, Patrick Lambrix2, Andriy Nikolov9, Heiko Paulheim3,
Dominique Ritze3, Francois Scharffe10, Pavel Shvaiko11,Cassia Trojahn7, and Ondrej Zamazal12
1 University of Oxford, UK{berg,ernesto}@cs.ox.ac.uk
2 Linkoping University & Swedish e-Science Research Center, Linkoping, Sweden{zlatan.dragisic,valentina.ivanova,patrick.lambrix}@liu.se
3 University of Mannheim, Mannheim, Germany{kai,heiko,dominique}@informatik.uni-mannheim.de
4 INRIA & LIG, Montbonnot, [email protected]
5 Universita degli studi di Milano, [email protected]
6 Pontifıcia Universidade Catolica do Rio Grande do Sul, Porto Alegre, [email protected]
7 IRIT & Universite Toulouse II, Toulouse, [email protected]
8 GESIS – Leibniz Institute for the Social Sciences, Cologne, [email protected]
9 Fluid operations, Walldorf, [email protected]
10 LIRMM, Montpellier, [email protected]
11 TasLab, Informatica Trentina, Trento, [email protected]
12 University of Economics, Prague, Czech [email protected]
Abstract. Ontology matching consists of finding correspondences between se-mantically related entities of two ontologies. OAEI campaigns aim at comparingontology matching systems on precisely defined test cases. These test cases canuse ontologies of different nature (from simple thesauri to expressive OWL on-tologies) and use different modalities, e.g., blind evaluation, open evaluation andconsensus. OAEI 2013 offered 6 tracks with 8 test cases followed by 23 partici-pants. Since 2010, the campaign has been using a new evaluation modality whichprovides more automation to the evaluation. This paper is an overall presentationof the OAEI 2013 campaign.
� This paper improves on the “Preliminary results” initially published in the on-site proceedingsof the ISWC workshop on Ontology Matching (OM-2013). The only official results of thecampaign, however, are on the OAEI web site.

1 Introduction
The Ontology Alignment Evaluation Initiative1 (OAEI) is a coordinated internationalinitiative, which organizes the evaluation of the increasing number of ontology match-ing systems [11, 14]. The main goal of OAEI is to compare systems and algorithms onthe same basis and to allow anyone for drawing conclusions about the best matchingstrategies. Our ambition is that, from such evaluations, tool developers can improvetheir systems.
Two first events were organized in 2004: (i) the Information Interpretation and In-tegration Conference (I3CON) held at the NIST Performance Metrics for IntelligentSystems (PerMIS) workshop and (ii) the Ontology Alignment Contest held at the Eval-uation of Ontology-based Tools (EON) workshop of the annual International SemanticWeb Conference (ISWC) [28]. Then, a unique OAEI campaign occurred in 2005 at theworkshop on Integrating Ontologies held in conjunction with the International Confer-ence on Knowledge Capture (K-Cap) [3]. Starting from 2006 through 2012 the OAEIcampaigns were held at the Ontology Matching workshops collocated with ISWC [12,10, 5, 7–9, 1]. In 2013, the OAEI results were presented again at the Ontology Matchingworkshop2 collocated with ISWC, in Sydney, Australia.
Since 2011, we have been promoting an environment for automatically processingevaluations (§2.2), which has been developed within the SEALS (Semantic EvaluationAt Large Scale) project3. SEALS provided a software infrastructure, for automaticallyexecuting evaluations, and evaluation campaigns for typical semantic web tools, includ-ing ontology matching. For OAEI 2013, almost all of the OAEI data sets were evaluatedunder the SEALS modality, providing a more uniform evaluation setting.
This paper synthetizes the 2013 evaluation campaign and introduces the results pro-vided in the papers of the participants. The remainder of the paper is organised as fol-lows. In Section 2, we present the overall evaluation methodology that has been used.Sections 3-10 discuss the settings and the results of each of the test cases. Section 11overviews lessons learned from the campaign. Finally, Section 12 concludes the paper.
2 General methodology
We first present the test cases proposed this year to the OAEI participants (§2.1). Then,we discuss the resources used by participants to test their systems and the executionenvironment used for running the tools (§2.2). Next, we describe the steps of the OAEIcampaign (§2.3-2.5) and report on the general execution of the campaign (§2.6).
2.1 Tracks and test cases
This year’s campaign consisted of 6 tracks gathering 8 test cases and different evalua-tion modalities:
1 http://oaei.ontologymatching.org2 http://om2013.ontologymatching.org3 http://www.seals-project.eu

The benchmark track (§3): Like in previous campaigns, a systematic benchmark se-ries has been proposed. The goal of this benchmark series is to identify the areasin which each matching algorithm is strong or weak by systematically altering anontology. This year, we generated a new benchmark based on the original biblio-graphic ontology.
The expressive ontology track offers real world ontologies using OWL modelling ca-pabilities:Anatomy (§4): The anatomy real world test case is about matching the Adult
Mouse Anatomy (2744 classes) and a small fragment of the NCI Thesaurus(3304 classes) describing the human anatomy.
Conference (§5): The goal of the conference test case is to find all correct cor-respondences within a collection of ontologies describing the domain of or-ganizing conferences. Results were evaluated automatically against referencealignments and by using logical reasoning techniques.
Large biomedical ontologies (§6): The Largebio test case aims at finding align-ments between large and semantically rich biomedical ontologies such asFMA, SNOMED-CT, and NCI. The UMLS Metathesaurus has been used asthe basis for reference alignments.
MultilingualMultifarm(§7): This test case is based on a subset of the Conference data set,
translated into eight different languages (Chinese, Czech, Dutch, French, Ger-man, Portuguese, Russian, and Spanish) and the corresponding alignments be-tween these ontologies. Results are evaluated against these alignments.
Directories and thesauriLibrary(§8): The library test case is a real-word task to match two thesauri. The
goal of this test case is to find whether the matchers can handle such lightweightontologies including a huge amount of concepts and additional descriptions.Results are evaluated both against a reference alignment and through manualscrutiny.
Interactive matchingInteractive(§9): This test case offers the possibility to compare different interac-
tive matching tools which require user interaction. Its goal is to show if userinteraction can improve matching results, which methods are most promisingand how many interactions are necessary. All participating systems are evalu-ated on the conference data set using an oracle based on the reference align-ment.
Instance matching (§10): The goal of the instance matching track is to evaluate theperformance of different tools on the task of matching RDF individuals whichoriginate from different sources but describe the same real-world entity. Both thetraining data set and the evaluation data set were generated by exploiting the sameconfiguration of the RDFT transformation tool. It performs controlled alterationsof an initial data source generating data sets and reference links (i.e. alignments).Reference links were provided for the training set but not for the evaluation set, sothe evaluation is blind.
Table 1 summarizes the variation in the proposed test cases.
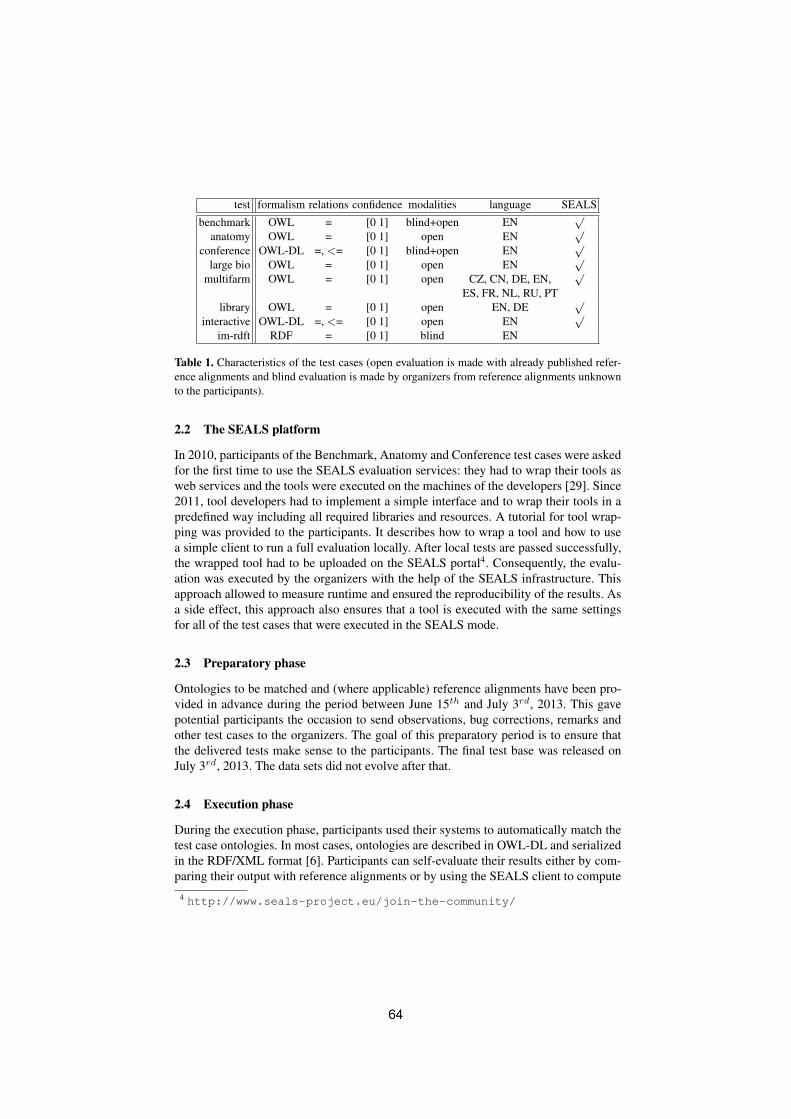
test formalism relations confidence modalities language SEALS
benchmark OWL = [0 1] blind+open EN√
anatomy OWL = [0 1] open EN√
conference OWL-DL =, <= [0 1] blind+open EN√
large bio OWL = [0 1] open EN√
multifarm OWL = [0 1] open CZ, CN, DE, EN,√
ES, FR, NL, RU, PTlibrary OWL = [0 1] open EN, DE
√interactive OWL-DL =, <= [0 1] open EN
√im-rdft RDF = [0 1] blind EN
Table 1. Characteristics of the test cases (open evaluation is made with already published refer-ence alignments and blind evaluation is made by organizers from reference alignments unknownto the participants).
2.2 The SEALS platform
In 2010, participants of the Benchmark, Anatomy and Conference test cases were askedfor the first time to use the SEALS evaluation services: they had to wrap their tools asweb services and the tools were executed on the machines of the developers [29]. Since2011, tool developers had to implement a simple interface and to wrap their tools in apredefined way including all required libraries and resources. A tutorial for tool wrap-ping was provided to the participants. It describes how to wrap a tool and how to usea simple client to run a full evaluation locally. After local tests are passed successfully,the wrapped tool had to be uploaded on the SEALS portal4. Consequently, the evalu-ation was executed by the organizers with the help of the SEALS infrastructure. Thisapproach allowed to measure runtime and ensured the reproducibility of the results. Asa side effect, this approach also ensures that a tool is executed with the same settingsfor all of the test cases that were executed in the SEALS mode.
2.3 Preparatory phase
Ontologies to be matched and (where applicable) reference alignments have been pro-vided in advance during the period between June 15th and July 3rd, 2013. This gavepotential participants the occasion to send observations, bug corrections, remarks andother test cases to the organizers. The goal of this preparatory period is to ensure thatthe delivered tests make sense to the participants. The final test base was released onJuly 3rd, 2013. The data sets did not evolve after that.
2.4 Execution phase
During the execution phase, participants used their systems to automatically match thetest case ontologies. In most cases, ontologies are described in OWL-DL and serializedin the RDF/XML format [6]. Participants can self-evaluate their results either by com-paring their output with reference alignments or by using the SEALS client to compute
4 http://www.seals-project.eu/join-the-community/

precision and recall. They can tune their systems with respect to the non blind evalua-tion as long as the rules published on the OAEI web site are satisfied. This phase hasbeen conducted between July 3rd and September 1st, 2013.
2.5 Evaluation phase
Participants have been encouraged to provide (preliminary) results or to upload theirwrapped tools on the SEALS portal by September 1st, 2013. For the SEALS modality,a full-fledged test including all submitted tools has been conducted by the organizersand minor problems were reported to some tool developers, who had the occasion to fixtheir tools and resubmit them.
First results were available by September 23rd, 2013. The organizers provided theseresults individually to the participants. The results were published on the respectiveweb pages by the organizers by October 1st. The standard evaluation measures areusually precision and recall computed against the reference alignments. More detailson evaluation measures are given in each test case section.
2.6 Comments on the execution
The number of participating systems has regularly increased over the years: 4 partici-pants in 2004, 7 in 2005, 10 in 2006, 17 in 2007, 13 in 2008, 16 in 2009, 15 in 2010,18 in 2011, 21 in 2012, 23 in 2013. However, participating systems are now constantlychanging. In 2013, 11 (7 in 2012) systems have not participated in any of the previouscampaigns. The list of participants is summarized in Table 2. Note that some systemswere also evaluated with different versions and configurations as requested by develop-ers (see test case sections for details).
System AM
LC
IDE
R-C
LC
roM
atch
erH
erT
UD
AH
otM
atch
IAM
AL
ilyIO
ML
ogM
apL
ogM
apL
iteM
aasM
tch
Map
SSS
OD
GO
MS
Ont
oKR
iMO
M20
13Se
rvO
Map
SLIN
T++
SPH
eRe
Stri
ngsA
uto
Synt
hesi
sW
eSeE
Wik
iMat
chX
Map
YAM
++
Tota
l=23
Confidence√ √ √ √ √ √ √ √ √ √ √ √ √ √
14
benchmarks√ √ √ √ √ √ √ √ √ √ √ √ √ √ √ √ √ √ √ √
20anatomy
√ √ √ √ √ √ √ √ √ √ √ √ √ √ √ √17
conference√ √ √ √ √ √ √ √ √ √ √ √ √ √ √ √ √ √ √ √
20multifarm
√ √ √ √ √ √ √ √ √ √ √ √ √ √ √ √ √17
library√ √ √ √ √ √ √ √ √ √ √
11interactive
√ √ √ √4
large bio√ √ √ √ √ √ √ √ √ √ √ √ √
13im-rdft
√ √ √ √4
total 7 4 2 7 6 6 1 8 6 5 4 6 3 4 5 1 1 6 3 5 4 5 6 106
Table 2. Participants and the state of their submissions. Confidence stands for the type of resultsreturned by a system: it is ticked when the confidence is a non boolean value.

Only four systems participated in the instance matching track, where two of them(LogMap and RiMOM2013) also participated in the SEALS tracks. The interactivetrack also had the same participation, since there are not yet many tools supporting userintervention within the matching process. Finally, some systems were not able to passsome test cases as indicated in Table 2. SPHeRe is an exception since it only participatedin the largebio test case. It is a special system based on cloud computing which did notuse the SEALS interface this year.
The result summary per test case is presented in the following sections.
3 Benchmark
The goal of the benchmark data set is to provide a stable and detailed picture of eachalgorithm. For that purpose, algorithms are run on systematically generated test cases.
3.1 Test data
The systematic benchmark test set is built around a seed ontology and many variationsof it. Variations are artificially generated, and focus on the characterization of the be-havior of the tools rather than having them compete on real-life problems.
Since OAEI 2011.5, they are obtained by discarding and modifying features from aseed ontology. Considered features are names of entities, comments, the specializationhierarchy, instances, properties and classes. Full description of the systematic bench-mark test set can be found on the OAEI web site.
This year, we used a version of the benchmark test suite generated by the test gen-erator described in [13] from the usual bibliography ontology. The biblio seed ontol-ogy concerns bibliographic references and is inspired freely from BibTeX. It contains33 named classes, 24 object properties, 40 data properties, 56 named individuals and20 anonymous individuals. The test case was not available to participants: participantscould test their systems with respect to last year data sets, but they have been evaluatedagainst a newly generated test. The tests were also blind for the organizers since we didnot looked into them before running the systems.
We also generated and run another test suite from a different seed ontology, butwe decided to cancel the evaluation because, due to the particular nature of the seedontology, the generator was not able to properly discard important information. We didnot run scalability tests this year.
The reference alignments are still restricted to named classes and properties and usethe “=” relation with confidence of 1.
3.2 Results
We run the experiments on a Debian Linux virtual machine configured with four pro-cessors and 8GB of RAM running under a Dell PowerEdge T610 with 2*Intel XeonQuad Core 2.26GHz E5607 processors and 32GB of RAM, under Linux ProxMox 2(Debian). All matchers where run under the SEALS client using Java 1.7 and a maxi-mum heap size of 6GB. No timeout was explicitly set.

Reported figures are the average of 5 runs. As has already been shown in [13], thereis not much variance in compliance measures across runs. This is not necessarily thecase for time measurements so we report standard deviations with time measurements.
From the 23 systems listed in Table 2, 20 systems participated in this test case.Three systems were only participating in the instance matching or largebio test cases.XMap had two different system versions.
A few of these systems encountered problems (marked * in the results table):LogMap and OntoK had quite random problems and did not return results for sometests sometimes; ServOMap did not return results for tests past #261-4; MaasMatch didnot return results for tests past #254; MapSSS and StringsAuto did not return resultsfor tests past #202 or #247. Besides the two last systems, the problems where persistentacross all 5 runs. MapSSS and StringsAuto alternated between the two failure patterns.We suspect that some of the random problems are due to internal or network timeouts.
Compliance Concerning F-measure results, YAM++ (.89) and CroMatcher (.88) arefar ahead before Cider-CL (.75), IAMA (.73) and ODGOMS (.71). Without surprise,such systems have all the same profile: their precision is higher than their recall.
With respect to 2012, some systems maintained their performances or slightlyimproved them (YAM++, MaasMatch, Hertuda, HotMatch, WikiMatch) while othershowed severe degradations. Some of these are explained by failures (MapSSS, Ser-vOMap, LogMap) some others are not explained (LogMapLite, WeSeE). Matchers withlower performance than the baseline are those mentioned before as encountering prob-lems when running tests. This is a problem that such matchers are not robust to theseclassical tests. It is noteworthy, and surprising, that most of the systems which did notcomplete all the tests were systems which completed them in 2012!
Confidence accuracy Confidence-weighted measures reward systems able to provideaccurate confidence values. Using confidence-weighted F-measures does not increasethe evaluation of systems (beside edna which does not perform any filtering). In princi-ple, the weighted recall cannot be higher, but the weighted precision can. In fact, onlyedna, OntoK and XMapSig have an increased precision. The order given above doesnot change much with the weighted measures: IAMA and ODGOMS pass CroMatcherand Cider-CL. The only system to suffer a dramatic decrease is RiMOM, owing to thevery low confidence measures that it provides.
For those systems which have provided their results with confidence measures dif-ferent from 1 or 0, it is possible to draw precision/recall graphs in order to comparethem; these graphs are given in Figure 1. The graphs show the real precision at n%recall and they stop when no more correspondences are available; then the end pointcorresponds to the precision and recall reported in the Table 3.
The precision-recall curves confirm the good performances of YAM++ and Cro-Matcher. CroMatcher achieves the same level of recall as YAM++ but with consistentlylower precision. The curves show the large variability across systems. This year, sys-tems seem to be less focussed on precision and make progress at the expense of preci-sion. However, this may be an artifact due to systems facing problems.

recall0. 1.0.
precision
1.
refalign1,00
edna0,50
AML0,40
CIDER-CL0,65
CroMatcher0,80
HerTUDA0,54
HotMatch0,50
IAMA0,57
LogMap0,36
LogMapLite0,50
MaasMatch0,52
MapSSS0,02
ODGOMS0,55
OntoK0,40
RiMOM20130,44
ServOMap0,22
StringsAuto0,02
Synthesis0,60
WeSeE0,39
WikiMatch0,53
XMapGen0,40
XMapSig0,49
YAM++0,82
Fig. 1. Precision/recall graphs for benchmarks. The alignments generated by matchers are cutunder a threshold necessary for achieving n% recall and the corresponding precision is com-puted. Systems for which these graphs are not meaningful (because they did not provide gradedconfidence values) are drawn in dashed lines.

Runtime There is a large discrepancy between matchers concerning the time spentto match one test run, i.e., 94 matching tests. It ranges from less than a minute forLogMapLite and AML (we do not count StringsAuto which failed to perform manytests) to nearly three hours for OntoK. In fact, OntoK takes as much time as all the othermatchers together. Beside these large differences, we also observed large deviationsacross runs.
We provide (Table 3) the average F-measure point provided per second by matchers.This makes a different ordering of matchers: AML (1.04) comes first before Hertuda(0.94) and LogMapLite (0.81). None of the matchers with the best performances comefirst. This means that, for achieving good results, considerable time should be spent(however, YAM++ still performs the 94 matching operations in less than 12 minutes).
3.3 Conclusions
Regarding compliance, we observed that, with very few exceptions, the systems per-formed always better than the baseline. Most of the systems are focussing on precision.This year there was a significant number of systems unable to pass the tests correctly.On the one hand, this is good news: this means that systems are focussing on other testcases than benchmarks. On the other hand, it exhibits system brittleness.
Except for a very few exception, system run time performance is acceptable on testsof that size, but we did not perform scalability tests like last year.

biblio2 (2012) biblioc timeMatching system Prec. F-m. Rec. Prec. F-m. Rec. Time(s) St. Dev. pt F-m./s
edna 0.46 0.48 0.50 0.35 0.41 0.50(0.61) (0.55) (0.58) (0.54)
AML 1.00 0.57 0.40 55 ±6 1.04CIDER-CL 0.85 0.75 0.67 844 ±19 0.09
(0.84) (0.66) (0.55)CroMatcher 0.95 0.88 0.82 1114 ±21 0.08
(0.75) (0.68) (0.63)Hertuda 0.93 0.67 0.53 0.90 0.68 0.54 72 ±6 0.94
Hotmatch 0.99 0.68 0.52 0.96 0.68 0.50 103 ±6 0.66IAMA 0.99 0.73 0.57 102 ±10 0.72
LogMap 1.00 0.64 0.47 0.72 0.53 0.42 123 ±7 0.43(0.59) (0.42) (0.51) (0.39)
LogMapLt 0.95 0.66 0.50 0.43 0.46 0.50 57 ±7 0.81MaasMtch (*) 0.6 0.6 0.6 0.84 0.69 0.59 173 ±6 0.40
(0.93) (0.65) (0.5) (0.66) (0.50) (0.41)MapSSS (*) 1.00 0.86 0.75 0.84 0.14 0.08 81 ±44 0.17ODGOMS 0.99 0.71 0.55 100 ±6 0.71
(0.98) (0.70) (0.54)OntoK 0.63 0.51 0.43 10241 ±347 0.00
(0.69) (0.40)RiMOM2013 0.59 0.58 0.58 105 ±34 0.55
(0.49) (0.19) (0.12)ServOMap (*) 1.00 0.67 0.5 0.53 0.33 0.22 409 ±33 0.08StringsAuto (*) 0.84 0.14 0.08 56 ±38 0.25
Synthesis 0.60 0.60 0.60 659 ±11 0.09WeSeE 1.00 0.69(0.68) 0.52 0.96 0.55 0.39 4933 ±40 0.01
Wikimatch 0.97 0.67(0.68) 0.52 0.99 0.69 0.53 1845 ±39 0.04XMapGen 0.66 0.54 0.46 594 ±5 0.09
(0.52) (0.44)XMapSig 0.70 0.58 0.50 612 ±11 0.09
(0.71) (0.59)YAM++ 0.96 0.89 0.82 0.97 0.89 0.82 702 ±46 0.13
(1.00) (0.72) (0.56) (0.84) (0.77) (0.70)
Table 3. Results obtained by participants on the biblio benchmark test suite aggregated withharmonic means (values within parentheses are weighted version of the measure reported onlywhen different).

4 Anatomy
The anatomy test case confronts matchers with a specific type of ontologies from thebiomedical domain. We focus on two fragments of biomedical ontologies which de-scribe the human anatomy5 and the anatomy of the mouse6. This data set has been usedsince 2007 with some improvements over the years.
4.1 Experimental setting
We conducted experiments by executing each system in its standard setting and wecompare precision, recall, F-measure and recall+. The measure recall+ indicates theamount of detected non-trivial correspondences. The matched entities in a non-trivialcorrespondence do not have the same normalized label. The approach that generatesonly trivial correspondences is depicted as baseline StringEquiv in the following sec-tion.
This year we run the systems on a server with 3.46 GHz (6 cores) and 8GB RAM al-located to the matching systems. This is a different setting compared to previous years,so, runtime results are not fully comparable across years. The evaluation was performedwith the SEALS client. However, we slightly changed the way how precision and recallare computed, i.e., the results generated by the SEALS client vary in some cases by0.5% compared to the results presented below. In particular, we removed trivial corre-spondences in the oboInOwl namespace like
http://...oboInOwl#Synonym = http://...oboInOwl#Synonym
as well as correspondences expressing relations different from equivalence. Using thePellet reasoner we also checked whether the generated alignment is coherent, i.e., thereare no unsatisfiable concepts when the ontologies are merged with the alignment.
4.2 Results
In Table 4, we analyze all participating systems that could generate an alignment in lessthan ten hours. The listing comprises of 20 entries sorted by F-measure. Four systemsparticipated each with two different versions. These are AML and GOMMA with ver-sions which use background knowledge (indicated with suffix “-bk”), LogMap with alightweight version LogMapLite that uses only some core components and XMap withversions XMapSig and XMapGen which use two different parameters. For comparisonpurposes, we run again last year version of GOMMA. GOMMA and HerTUDA par-ticipated with the same system as last year (indicated by * in the table). In addition tothese two tools we have eight more systems which participated in 2012 and now partic-ipated with new versions (HotMatch, LogMap, MaasMatch, MapSSS, ServOMap, We-SeE, WikiMatch and YAM++). Due to some software and hardware incompatibilities,
5 http://www.cancer.gov/cancertopics/cancerlibrary/terminologyresources/
6 http://www.informatics.jax.org/searches/AMA_form.shtml

YAM++ had to be run on a different machine and therefore its runtime (indicated by **)is not fully comparable to that of other systems. Thus, 20 different systems generated analignment within the given time frame. Four participants (CroMatcher, RiMOM2013,OntoK and Synthesis) did not finish in time or threw an exception.
Matcher Runtime Size Precision F-measure Recall Recall+ Coherent
AML-bk 43 1477 0.95 0.94 0.93 0.82√
GOMMA-bk* 11 1534 0.92 0.92 0.93 0.81 -YAM++ 62** 1395 0.94 0.90 0.87 0.66 -AML 15 1315 0.95 0.89 0.83 0.54
√LogMap 13 1398 0.92 0.88 0.85 0.59
√GOMMA* 9 1264 0.96 0.87 0.80 0.47 -StringsAuto 1444 1314 0.90 0.83 0.78 0.43 -LogMapLite 7 1148 0.96 0.83 0.73 0.29 -MapSSS 2040 1296 0.90 0.83 0.77 0.44 -ODGOMS 1212 1102 0.98 0.82 0.71 0.24 -WikiMatch 19366 1027 0.99 0.80 0.67 0.15 -HotMatch 300 989 0.98 0.77 0.64 0.14 -StringEquiv - 946 1.00 0.77 0.62 0.00 -XMapSig 393 1192 0.86 0.75 0.67 0.13 -ServOMap 43 975 0.96 0.75 0.62 0.10 -XMapGen 403 1304 0.81 0.75 0.69 0.19 -IAMA 10 845 1.00 0.71 0.55 0.01 -CIDER-CL 12308 1711 0.65 0.69 0.73 0.31 -HerTUDA* 117 1479 0.69 0.68 0.67 0.15 -WeSeE 34343 935 0.62 0.47 0.38 0.09 -MaasMatch 8532 2011 0.36 0.41 0.48 0.23 -
Table 4. Comparison, ordered by F-measure, against the reference alignment, runtime is mea-sured in seconds, the “size” column refers to the number of correspondences in the generatedalignment.
Nine systems finished in less than 100 seconds, compared to 8 systems in OAEI2012 and 2 systems in OAEI 2011. This year, 20 out of 24 systems generated resultscompared to last year when 14 out of 18 systems generated results within the giventime frame. The top systems in terms of runtimes are LogMap, GOMMA, IAMA andAML. Depending on the specific version of the systems, they require between 7 and 15seconds to match the ontologies. The table shows that there is no correlation betweenquality of the generated alignment in terms of precision and recall and required runtime.This result has also been observed in previous OAEI campaigns.
Table 4 also shows the results for precision, recall and F-measure. In terms of F-measure, the two top ranked systems are AML-bk and GOMMA-bk. These systemsuse specialised background knowledge, i.e., they are based on mapping compositiontechniques and the reuse of mappings between UMLS, Uberon and FMA. AML-bk andGOMMA-bk are followed by a group of matching systems (YAM++, AML, LogMap,GOMMA) generating alignments that are very similar with respect to precision, recalland F-measure (between 0.87 and 0.91 F-measure). LogMap uses the general (biomed-ical) purpose UMLS Lexicon, while the other systems either use Wordnet or no back-
ground knowledge. The results of these systems are at least as good as the results of thebest system in OAEI 2007-2010. Only AgreementMaker using additional backgroundknowledge could generate better results than these systems in 2011.
This year, 8 out of 20 systems achieved an F-measure that is lower than the baselinewhich is based on (normalized) string equivalence (StringEquiv in the table).
Moreover, nearly all systems find many non-trivial correspondences. An exceptionare IAMA and WeSeE which generated an alignment that is quite similar to the align-ment generated by the baseline approach.
From the systems which participated last year WikiMatch showed a considerableimprovement. It increased precision from 0.86 to 0.99 and F-measure from 0.76 to0.80. The other systems produced very similar results compared to the previous year.One exception is WeSeE which achieved a much lower F-measure than in 2012.
Three systems have produced an alignment which is coherent. Last year two systemsproduced such alignments.
4.3 Conclusions
This year 24 systems (or system variants) participated in the anatomy test case outof which 20 produced results within 10 hours. This is so far the highest number ofparticipating systems as well as the highest number of systems which produce resultsgiven time constraints for the anatomy test case.
As last year, we have witnessed a positive trend in runtimes as the majority of sys-tems finish execution in less than one hour (16 out of 20). The AML-bk system improvesthe best result in terms of F-measure set by a previous version of the system in 2010and makes it also the top result for the anatomy test case.
5 Conference
The conference test case introduces matching several moderately expressive ontologies.Within this test case, participant results were evaluated against reference alignments(containing merely equivalence correspondences) and by using logical reasoning. Theevaluation has been performed with the SEALS infrastructure.
5.1 Test data
The data set consists of 16 ontologies in the domain of organizing conferences. Theseontologies have been developed within the OntoFarm project7.
The main features of this test case are:
– Generally understandable domain. Most ontology engineers are familiar with or-ganizing conferences. Therefore, they can create their own ontologies as well asevaluate the alignments among their concepts with enough erudition.
7 http://nb.vse.cz/˜svatek/ontofarm.html
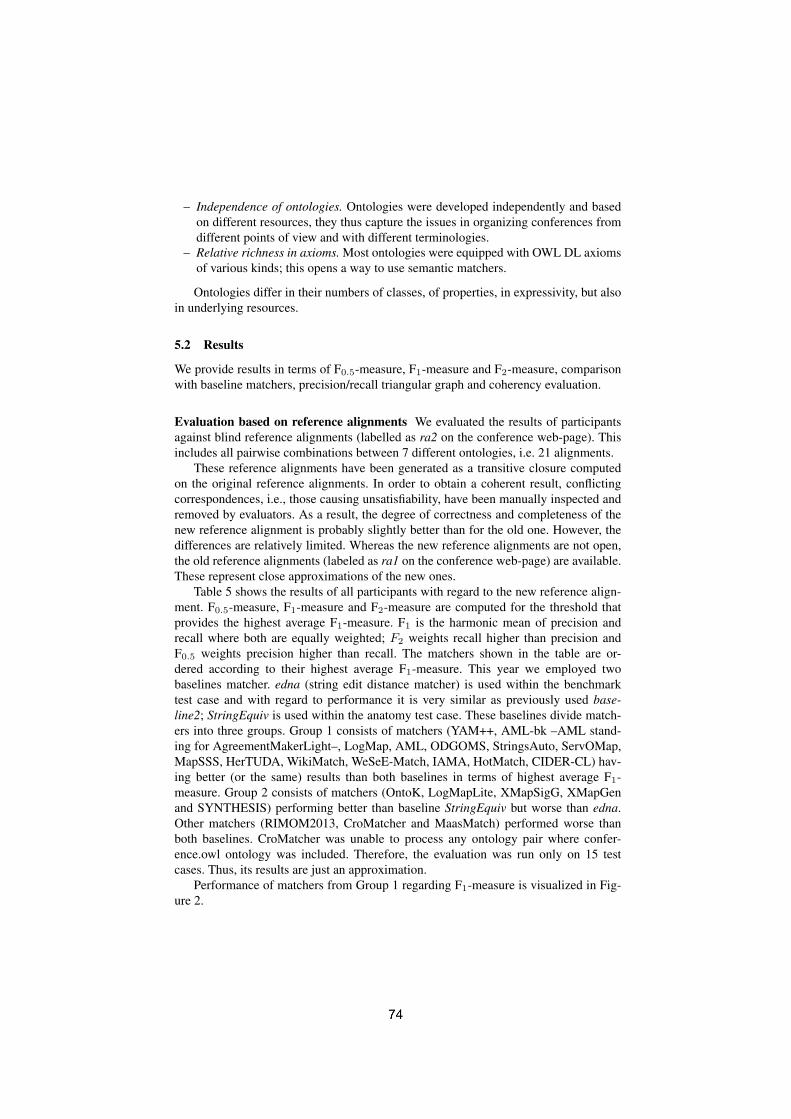
– Independence of ontologies. Ontologies were developed independently and basedon different resources, they thus capture the issues in organizing conferences fromdifferent points of view and with different terminologies.
– Relative richness in axioms. Most ontologies were equipped with OWL DL axiomsof various kinds; this opens a way to use semantic matchers.
Ontologies differ in their numbers of classes, of properties, in expressivity, but alsoin underlying resources.
5.2 Results
We provide results in terms of F0.5-measure, F1-measure and F2-measure, comparisonwith baseline matchers, precision/recall triangular graph and coherency evaluation.
Evaluation based on reference alignments We evaluated the results of participantsagainst blind reference alignments (labelled as ra2 on the conference web-page). Thisincludes all pairwise combinations between 7 different ontologies, i.e. 21 alignments.
These reference alignments have been generated as a transitive closure computedon the original reference alignments. In order to obtain a coherent result, conflictingcorrespondences, i.e., those causing unsatisfiability, have been manually inspected andremoved by evaluators. As a result, the degree of correctness and completeness of thenew reference alignment is probably slightly better than for the old one. However, thedifferences are relatively limited. Whereas the new reference alignments are not open,the old reference alignments (labeled as ra1 on the conference web-page) are available.These represent close approximations of the new ones.
Table 5 shows the results of all participants with regard to the new reference align-ment. F0.5-measure, F1-measure and F2-measure are computed for the threshold thatprovides the highest average F1-measure. F1 is the harmonic mean of precision andrecall where both are equally weighted; F2 weights recall higher than precision andF0.5 weights precision higher than recall. The matchers shown in the table are or-dered according to their highest average F1-measure. This year we employed twobaselines matcher. edna (string edit distance matcher) is used within the benchmarktest case and with regard to performance it is very similar as previously used base-line2; StringEquiv is used within the anatomy test case. These baselines divide match-ers into three groups. Group 1 consists of matchers (YAM++, AML-bk –AML stand-ing for AgreementMakerLight–, LogMap, AML, ODGOMS, StringsAuto, ServOMap,MapSSS, HerTUDA, WikiMatch, WeSeE-Match, IAMA, HotMatch, CIDER-CL) hav-ing better (or the same) results than both baselines in terms of highest average F1-measure. Group 2 consists of matchers (OntoK, LogMapLite, XMapSigG, XMapGenand SYNTHESIS) performing better than baseline StringEquiv but worse than edna.Other matchers (RIMOM2013, CroMatcher and MaasMatch) performed worse thanboth baselines. CroMatcher was unable to process any ontology pair where confer-ence.owl ontology was included. Therefore, the evaluation was run only on 15 testcases. Thus, its results are just an approximation.
Performance of matchers from Group 1 regarding F1-measure is visualized in Fig-ure 2.

Matcher Prec. F0.5-m. F1-m. F2-m. Rec. Size Inc. Al. Inc-dg
YAM++ 0.78 0.75 0.71 0.67 0.65 12.524 0 0.0%AML-bk 0.82 0.74 0.64 0.57 0.53 9.714 0 0.0%LogMap 0.76 0.70 0.63 0.57 0.54 10.714 0 0.0%
AML 0.82 0.73 0.63 0.55 0.51 9.333 0 0.0%ODGOMS1 2 0.70 0.66 0.62 0.57 0.55 11.762 13 6.5%StringsAuto 0.74 0.68 0.60 0.53 0.50 11.048 0 0.0%
ServOMap v104 0.69 0.64 0.58 0.53 0.50 11.048 4 2.0%MapSSS 0.77 0.68 0.58 0.50 0.46 9.857 0 0.0%
ODGOMS1 1 0.72 0.65 0.57 0.51 0.47 9.667 9 4.4%HerTUDA 0.70 0.63 0.56 0.49 0.46 9.857 9 5.3%WikiMatch 0.70 0.63 0.55 0.48 0.45 9.762 10 6.1%
WeSeE-Match 0.79 0.67 0.55 0.46 0.42 8 1 0.4%IAMA 0.74 0.65 0.55 0.48 0.44 8.857 7 4%
HotMatch 0.67 0.62 0.55 0.50 0.47 10.524 9 5.0%CIDER-CL 0.72 0.64 0.55 0.48 0.44 22.857 21 19.5%
edna 0.73 0.64 0.55 0.48 0.44OntoK 0.72 0.63 0.54 0.47 0.43 8.952 7 3.9%
LogMapLite 0.68 0.62 0.54 0.48 0.45 9.952 7 5.4%XMapSiG1 3 0.68 0.61 0.53 0.47 0.44 10.714 0 0.0%XMapGen1 4 0.64 0.59 0.53 0.48 0.45 18.571 0 0.0%SYNTHESIS 0.73 0.63 0.53 0.45 0.41 8.429 9 4.8%StringEquiv 0.76 0.64 0.52 0.43 0.39
RIMOM2013* 0.55 0.53 0.51 0.48 0.47 56.81 20 27.1%XMapSiG1 4 0.75 0.62 0.50 0.41 0.37 8.048 1 0.8%CroMatcher 0.56 0.53 0.49 0.45 0.43XMapGen 0.70 0.59 0.48 0.40 0.36 12 1 0.4%MaasMatch 0.27 0.30 0.36 0.44 0.53
Table 5. The highest average F[0.5|1|2]-measure and their corresponding precision and recall foreach matcher with its F1-optimal threshold (ordered by F1-measure). Average size of alignments,number of incoherent alignments and average degree of incoherence. The mark * is added whenwe only provide lower bound of the degree of incoherence due to the combinatorial complexityof the problem.
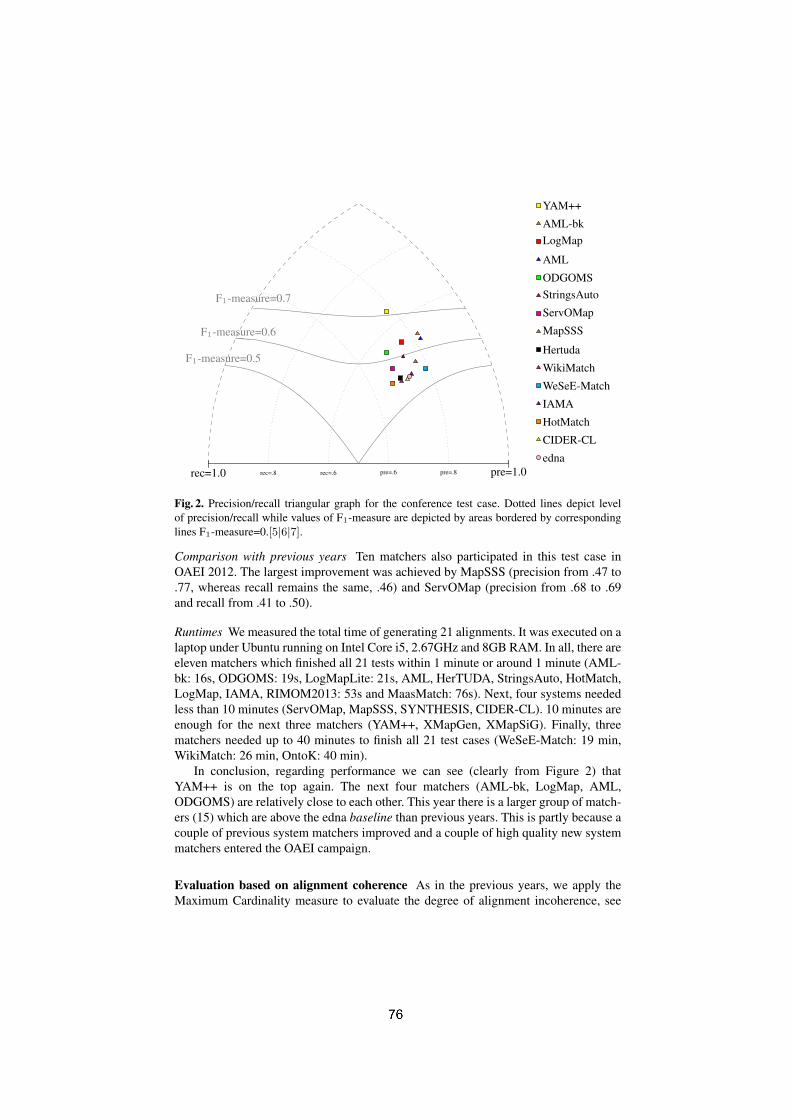
rec=1.0 rec=.8 rec=.6 pre=1.0pre=.8pre=.6
F1-measure=0.5
F1-measure=0.6
F1-measure=0.7
YAM++
AML-bkLogMap
AML
ODGOMSStringsAuto
ServOMap
MapSSS
Hertuda
WikiMatch
WeSeE-Match
IAMA
HotMatch
CIDER-CL
edna
Fig. 2. Precision/recall triangular graph for the conference test case. Dotted lines depict levelof precision/recall while values of F1-measure are depicted by areas bordered by correspondinglines F1-measure=0.[5|6|7].Comparison with previous years Ten matchers also participated in this test case inOAEI 2012. The largest improvement was achieved by MapSSS (precision from .47 to.77, whereas recall remains the same, .46) and ServOMap (precision from .68 to .69and recall from .41 to .50).
Runtimes We measured the total time of generating 21 alignments. It was executed on alaptop under Ubuntu running on Intel Core i5, 2.67GHz and 8GB RAM. In all, there areeleven matchers which finished all 21 tests within 1 minute or around 1 minute (AML-bk: 16s, ODGOMS: 19s, LogMapLite: 21s, AML, HerTUDA, StringsAuto, HotMatch,LogMap, IAMA, RIMOM2013: 53s and MaasMatch: 76s). Next, four systems neededless than 10 minutes (ServOMap, MapSSS, SYNTHESIS, CIDER-CL). 10 minutes areenough for the next three matchers (YAM++, XMapGen, XMapSiG). Finally, threematchers needed up to 40 minutes to finish all 21 test cases (WeSeE-Match: 19 min,WikiMatch: 26 min, OntoK: 40 min).
In conclusion, regarding performance we can see (clearly from Figure 2) thatYAM++ is on the top again. The next four matchers (AML-bk, LogMap, AML,ODGOMS) are relatively close to each other. This year there is a larger group of match-ers (15) which are above the edna baseline than previous years. This is partly because acouple of previous system matchers improved and a couple of high quality new systemmatchers entered the OAEI campaign.
Evaluation based on alignment coherence As in the previous years, we apply theMaximum Cardinality measure to evaluate the degree of alignment incoherence, see

Table 5. Details on this measure and its implementation can be found in [21]. We com-puted the average for all 21 test cases of the conference test case for which there existsa reference alignment. In one case, RIMOM2013, marked with an asterisk, we couldnot compute the exact degree of incoherence due to the combinatorial complexity of theproblem, however we were still able to compute a lower bound for which we know thatthe actual degree is higher. We do not provide numbers for CroMatcher since it did notgenerate all 21 alignments. For MaasMatch, we could not compute the degree of inco-herence since its alignments are highly incoherent (and thus the reasoner encounteredexceptions).
This year eight systems managed to generate coherent alignments: AML, AML-bk,LogMap, MapSSS, StringsAuto, XMapGen, XMapSiG and YAM++. Coherent resultsneed not only be related to a specific approach ensuring the coherency, but it can beindirectly caused by generating small and highly precise alignments. However, look-ing at Table 5 it seems that there is no matcher which on average generate too smallalignments. In all, this is a large important improvement compared to previous years,where we observed that only four (two) systems managed to generate (nearly) coherentalignments in 2011-2012.
6 Large biomedical ontologies (largebio)
The Largebio test case aims at finding alignments between the large and semanticallyrich biomedical ontologies FMA, SNOMED-CT, and NCI, which contains 78,989,306,591 and 66,724 classes, respectively.
6.1 Test data
The test case has been split into three matching problems: FMA-NCI, FMA-SNOMEDand SNOMED-NCI; and each matching problem in 2 tasks involving different frag-ments of the input ontologies.
The UMLS Metathesaurus [4] has been selected as the basis for reference align-ments. UMLS is currently the most comprehensive effort for integrating independently-developed medical thesauri and ontologies, including FMA, SNOMED-CT, and NCI.Although the standard UMLS distribution does not directly provide “alignments” (in theOAEI sense) between the integrated ontologies, it is relatively straightforward to extractthem from the information provided in the distribution files (see [18] for details).
It has been noticed, however, that although the creation of UMLS alignments com-bines expert assessment and auditing protocols they lead to a significant number oflogical inconsistencies when integrated with the corresponding source ontologies [18].
To address this problem, in OAEI 2013, unlike previous editions, we have createda unique refinement of the UMLS mappings combining both Alcomo (mapping) de-bugging system [21] and LogMap’s (mapping) repair facility [17], and manual curationwhen necessary. This refinement of the UMLS mappings, which does not lead to unsat-isfiable classes8, has been used as the Large BioMed reference alignment. Objections
8 For the SNOMED-NCI case we used the OWL 2 EL reasoner ELK, see Section 6.4 for details.

have been raised on the validity (and fairness) of the application of mapping repair tech-niques to make reference alignments coherent [24]. For next year campaign, we intendto take into consideration their suggestions to mitigate the effect of using repair tech-niques. This year reference alignment already aimed at mitigating the fairness effectby combining two mapping repair techniques, however further improvement should bedone in this line.
6.2 Evaluation setting, participation and success
We have run the evaluation in a high performance server with 16 CPUs and allocating15 Gb RAM. Precision, Recall and F-measure have been computed with respect to theUMLS-based reference alignment. Systems have been ordered in terms of F-measure.
In the largebio test case, 13 out of 21 participating systems have been able to copewith at least one of the tasks of the largebio test case. Synthesis, WeSeEMatch andWikiMatch failed to complete the smallest task with a time out of 18 hours, whileMapSSS, RiMOM, CIDER-CL, CroMatcher and OntoK threw an exception during thematching process. The latter two threw an out-of-memory exception. In total we haveevaluated 20 system configurations.
6.3 Tool variants and background knowledge
There were, in this test case, different variants of tools using background knowledge tocertain degree. These are:
– XMap participates with two variants. XMapSig, which uses a sigmoid function,and XMapGen, which implements a genetic algorithm. ODGOMS also participateswith two versions (v1.1 and v1.2). ODGOMS-v1.1 is the original submitted versionwhile ODGOMS-v1.2 includes some bug fixes and extensions.
– LogMap has also been evaluated with two variants: LogMap and LogMap-BK.LogMap-BK uses normalisations and spelling variants from the general (biomedi-cal) purpose UMLS Lexicon9 while LogMap has this feature deactivated.
– AML has been evaluated with 6 different variants depending on the use of repairtechniques (R), general background knowledge (BK) and specialised backgroundknowledge based on the UMLS Metathesaurus (SBK).
– YAM++ and MaasMatch also use the general purpose background knowledge pro-vided by WordNet10.
Since the reference alignment of this test case is based on the UMLS Metathesaurus,we did not included within the results the alignments provided by AML-SBK and AML-SBK-R. Nevertheless we consider their results very interesting: AML-SBK and AML-SBK-R averaged F-measures higher than 0.90 in all 6 tasks.
We have also re-run the OAEI 2012 version of GOMMA. The results of GOMMAmay slightly vary w.r.t. those in 2012 since we have used a different reference align-ment.
9 http://www.nlm.nih.gov/pubs/factsheets/umlslex.html10 http://wordnet.princeton.edu/

SystemFMA-NCI FMA-SNOMED SNOMED-NCI
Average #Task 1 Task 2 Task 3 Task 4 Task 5 Task 6
LogMapLt 7 59 14 101 54 132 61 6IAMA 13 139 27 217 98 206 117 6AML 16 201 60 542 291 569 280 6AML-BK 38 201 93 530 380 571 302 6AML-R 18 194 86 554 328 639 303 6GOMMA2012 39 243 54 634 220 727 320 6AML-BK-R 42 204 121 583 397 635 330 6YAM++ 93 365 100 401 391 712 344 6LogMap-BK 44 172 85 556 444 1,087 398 6LogMap 41 161 78 536 433 1,232 414 6ServOMap 140 2,690 391 4,059 1,698 6,320 2,550 6SPHeRe (*) 16 8,136 154 20,664 2,486 10,584 7,007 6XMapSiG 1,476 - 11,720 - - - 6,598 2XMapGen 1,504 - 12,127 - - - 6,816 2Hertuda 3,403 - 17,610 - - - 10,507 2ODGOMS-v1.1 6,366 - 27,450 - - - 16,908 2HotMatch 4,372 - 32,243 - - - 18,308 2ODGOMS-v1.2 10,204 - 42,908 - - - 26,556 2StringsAuto 6,358 - - - - - 6,358 1MaasMatch 12,409 - - - - - 12,409 1
# Systems 20 12 18 12 12 12 5,906 86
Table 6. System runtimes (s) and task completion. GOMMA is a system provided in 2012. (*)SPHeRe times were reported by the authors. SPHeRe is a special tool which relies on the utiliza-tion of cloud computing resources.
6.4 Alignment coherence
Together with Precision, Recall, F-measure and Runtimes we have also evaluated thecoherence of alignments. We report (1) the number of unsatisfiabilities when reasoningwith the input ontologies together with the computed mappings, and (2) the ratio ofunsatisfiable classes with respect to the size of the union of the input ontologies.
We have used the OWL 2 reasoner MORe [2] to compute the number of unsatisfi-able classes. For the cases in which MORe could not cope with the input ontologies andthe mappings (in less than 2 hours) we have provided a lower bound on the number ofunsatisfiable classes (indicated by ≥) using the OWL 2 EL reasoner ELK [20].
In this OAEI edition, only three systems have shown mapping repair facilities,namely: YAM++, AML with (R)epair configuration and LogMap. Tables 7-10 showthat even the most precise alignment sets may lead to a huge amount of unsatisfiableclasses. This proves the importance of using techniques to assess the coherence of thegenerated alignments.
6.5 Runtimes and task completion
Table 6 shows which systems (including variants) were able to complete each of thematching tasks in less than 18 hours and the required computation times. Systems have

been ordered with respect to the number of completed tasks and the average time re-quired to complete them. Times are reported in seconds.
The last column reports the number of tasks that a system could complete. Forexample, 12 system configurations were able to complete all six tasks. The last rowshows the number of systems that could finish each of the tasks. The tasks involvingSNOMED were also harder with respect to both computation times and the number ofsystems that completed the tasks.
6.6 Results for the FMA-NCI matching problem
Table 7 summarizes the results for the tasks in the FMA-NCI matching problem.LogMap-BK and YAM++ provided the best results in terms of both Recall and F-measure in Task 1 and Task 2, respectively. IAMA provided the best results in termsof precision, although its recall was below average. Hertuda provided competitive re-sults in terms of recall, but the low precision damaged the final F-measure. On the otherhand, StringsAuto, XMapGen and XMapSiG provided a set of alignments with highprecision, however, the F-measure was damaged due to the low recall of their align-ments. Overall, the results were very positive and many systems obtained an F-measurehigher than 0.80 in the two tasks.
Efficiency in Task 2 has decreased with respect to Task 1. This is mostly due tothe fact that larger ontologies also involve more possible candidate alignments and it isharder to keep high precision values without damaging recall, and vice versa.
6.7 Results for the FMA-SNOMED matching problem
Table 8 summarizes the results for the tasks in the FMA-SNOMED matching problem.YAM++ provided the best results in terms of F-measure on both Task 3 and Task 4.YAM++ also provided the best Precision and Recall in Task 3 and Task 4, respectively;while AML-BK provided the best Recall in Task 3 and AML-R the best Precision inTask 4.
Overall, the results were less positive than in the FMA-NCI matching problemand only YAM++ obtained an F-measure greater than 0.80 in the two tasks. Further-more, 9 systems failed to provide a recall higher than 0.4. Thus, matching FMA againstSNOMED represents a significant leap in complexity with respect to the FMA-NCImatching problem.
As in the FMA-NCI matching problem, efficiency also decreases as the ontologysize increases. The most important variations were suffered by SPHeRe, IAMA andGOMMA in terms of precision.
6.8 Results for the SNOMED-NCI matching problem
Table 9 summarizes the results for the tasks in the SNOMED-NCI matching problem.LogMap-BK and ServOMap provided the best results in terms of both Recall and F-measure in Task 5 and Task 6, respectively. YAM++ provided the best results in termsof precision in Task 5 while AML-R in Task 6.
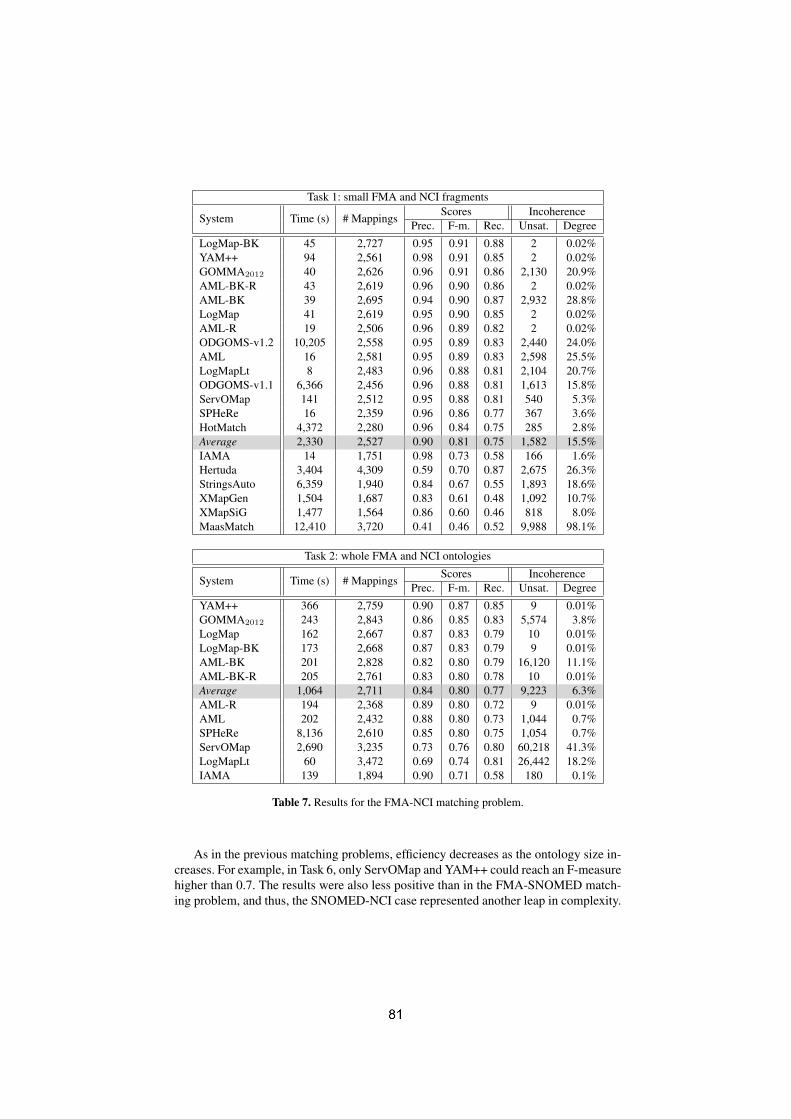
Task 1: small FMA and NCI fragments
System Time (s) # MappingsScores Incoherence
Prec. F-m. Rec. Unsat. Degree
LogMap-BK 45 2,727 0.95 0.91 0.88 2 0.02%YAM++ 94 2,561 0.98 0.91 0.85 2 0.02%GOMMA2012 40 2,626 0.96 0.91 0.86 2,130 20.9%AML-BK-R 43 2,619 0.96 0.90 0.86 2 0.02%AML-BK 39 2,695 0.94 0.90 0.87 2,932 28.8%LogMap 41 2,619 0.95 0.90 0.85 2 0.02%AML-R 19 2,506 0.96 0.89 0.82 2 0.02%ODGOMS-v1.2 10,205 2,558 0.95 0.89 0.83 2,440 24.0%AML 16 2,581 0.95 0.89 0.83 2,598 25.5%LogMapLt 8 2,483 0.96 0.88 0.81 2,104 20.7%ODGOMS-v1.1 6,366 2,456 0.96 0.88 0.81 1,613 15.8%ServOMap 141 2,512 0.95 0.88 0.81 540 5.3%SPHeRe 16 2,359 0.96 0.86 0.77 367 3.6%HotMatch 4,372 2,280 0.96 0.84 0.75 285 2.8%Average 2,330 2,527 0.90 0.81 0.75 1,582 15.5%IAMA 14 1,751 0.98 0.73 0.58 166 1.6%Hertuda 3,404 4,309 0.59 0.70 0.87 2,675 26.3%StringsAuto 6,359 1,940 0.84 0.67 0.55 1,893 18.6%XMapGen 1,504 1,687 0.83 0.61 0.48 1,092 10.7%XMapSiG 1,477 1,564 0.86 0.60 0.46 818 8.0%MaasMatch 12,410 3,720 0.41 0.46 0.52 9,988 98.1%
Task 2: whole FMA and NCI ontologies
System Time (s) # MappingsScores Incoherence
Prec. F-m. Rec. Unsat. Degree
YAM++ 366 2,759 0.90 0.87 0.85 9 0.01%GOMMA2012 243 2,843 0.86 0.85 0.83 5,574 3.8%LogMap 162 2,667 0.87 0.83 0.79 10 0.01%LogMap-BK 173 2,668 0.87 0.83 0.79 9 0.01%AML-BK 201 2,828 0.82 0.80 0.79 16,120 11.1%AML-BK-R 205 2,761 0.83 0.80 0.78 10 0.01%Average 1,064 2,711 0.84 0.80 0.77 9,223 6.3%AML-R 194 2,368 0.89 0.80 0.72 9 0.01%AML 202 2,432 0.88 0.80 0.73 1,044 0.7%SPHeRe 8,136 2,610 0.85 0.80 0.75 1,054 0.7%ServOMap 2,690 3,235 0.73 0.76 0.80 60,218 41.3%LogMapLt 60 3,472 0.69 0.74 0.81 26,442 18.2%IAMA 139 1,894 0.90 0.71 0.58 180 0.1%
Table 7. Results for the FMA-NCI matching problem.
As in the previous matching problems, efficiency decreases as the ontology size in-creases. For example, in Task 6, only ServOMap and YAM++ could reach an F-measurehigher than 0.7. The results were also less positive than in the FMA-SNOMED match-ing problem, and thus, the SNOMED-NCI case represented another leap in complexity.
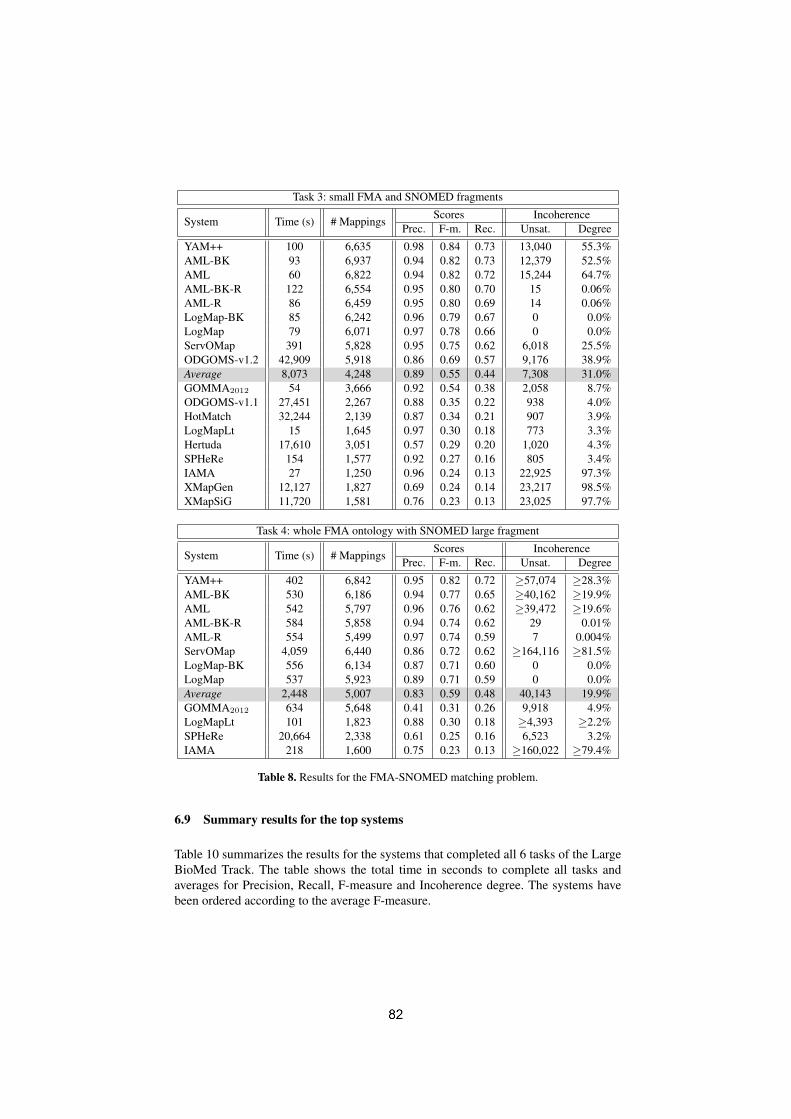
Task 3: small FMA and SNOMED fragments
System Time (s) # MappingsScores Incoherence
Prec. F-m. Rec. Unsat. Degree
YAM++ 100 6,635 0.98 0.84 0.73 13,040 55.3%AML-BK 93 6,937 0.94 0.82 0.73 12,379 52.5%AML 60 6,822 0.94 0.82 0.72 15,244 64.7%AML-BK-R 122 6,554 0.95 0.80 0.70 15 0.06%AML-R 86 6,459 0.95 0.80 0.69 14 0.06%LogMap-BK 85 6,242 0.96 0.79 0.67 0 0.0%LogMap 79 6,071 0.97 0.78 0.66 0 0.0%ServOMap 391 5,828 0.95 0.75 0.62 6,018 25.5%ODGOMS-v1.2 42,909 5,918 0.86 0.69 0.57 9,176 38.9%Average 8,073 4,248 0.89 0.55 0.44 7,308 31.0%GOMMA2012 54 3,666 0.92 0.54 0.38 2,058 8.7%ODGOMS-v1.1 27,451 2,267 0.88 0.35 0.22 938 4.0%HotMatch 32,244 2,139 0.87 0.34 0.21 907 3.9%LogMapLt 15 1,645 0.97 0.30 0.18 773 3.3%Hertuda 17,610 3,051 0.57 0.29 0.20 1,020 4.3%SPHeRe 154 1,577 0.92 0.27 0.16 805 3.4%IAMA 27 1,250 0.96 0.24 0.13 22,925 97.3%XMapGen 12,127 1,827 0.69 0.24 0.14 23,217 98.5%XMapSiG 11,720 1,581 0.76 0.23 0.13 23,025 97.7%
Task 4: whole FMA ontology with SNOMED large fragment
System Time (s) # MappingsScores Incoherence
Prec. F-m. Rec. Unsat. Degree
YAM++ 402 6,842 0.95 0.82 0.72 ≥57,074 ≥28.3%AML-BK 530 6,186 0.94 0.77 0.65 ≥40,162 ≥19.9%AML 542 5,797 0.96 0.76 0.62 ≥39,472 ≥19.6%AML-BK-R 584 5,858 0.94 0.74 0.62 29 0.01%AML-R 554 5,499 0.97 0.74 0.59 7 0.004%ServOMap 4,059 6,440 0.86 0.72 0.62 ≥164,116 ≥81.5%LogMap-BK 556 6,134 0.87 0.71 0.60 0 0.0%LogMap 537 5,923 0.89 0.71 0.59 0 0.0%Average 2,448 5,007 0.83 0.59 0.48 40,143 19.9%GOMMA2012 634 5,648 0.41 0.31 0.26 9,918 4.9%LogMapLt 101 1,823 0.88 0.30 0.18 ≥4,393 ≥2.2%SPHeRe 20,664 2,338 0.61 0.25 0.16 6,523 3.2%IAMA 218 1,600 0.75 0.23 0.13 ≥160,022 ≥79.4%
Table 8. Results for the FMA-SNOMED matching problem.
6.9 Summary results for the top systems
Table 10 summarizes the results for the systems that completed all 6 tasks of the LargeBioMed Track. The table shows the total time in seconds to complete all tasks andaverages for Precision, Recall, F-measure and Incoherence degree. The systems havebeen ordered according to the average F-measure.


System Total Time (s)Average
Prec. F-m. Rec. Inc. Degree
YAM++ 2,066 0.94 0.82 0.73 14%AML-BK 1,814 0.91 0.79 0.71 44%LogMap-BK 2,391 0.90 0.78 0.70 0%AML-BK-R 1,987 0.92 0.78 0.69 0%AML 1,681 0.93 0.78 0.68 43%LogMap 2,485 0.91 0.78 0.69 0%AML-R 1,821 0.94 0.78 0.67 0%ServOMap 15,300 0.87 0.77 0.69 52%GOMMA2012 1,920 0.81 0.65 0.57 29%LogMapLt 371 0.87 0.60 0.52 34%SPHeRe 42,040 0.86 0.57 0.46 21%IAMA 704 0.91 0.52 0.39 46%
Table 10. Summary results for the top systems (values in italics are not absolute 0 but are causedby rounding).
6.10 Conclusions
Although the proposed matching tasks represent a significant leap in complexity withrespect to the other OAEI test cases, the results have been very promising and 12 sys-tems (including all system configurations) completed all matching tasks with very com-petitive results.
There is, however, plenty of room for improvement: (1) most of the participatingsystems disregard the coherence of the generated alignments; (2) the size of the inputontologies should not significantly affect efficiency, and (3) recall in the tasks involvingSNOMED should be improved while keeping the current precision values.
The alignment coherence measure was the weakest point of the systems participat-ing in this test case. As shown in Tables 7-10, even highly precise alignment sets maylead to a huge number of unsatisfiable classes. The use of techniques to assess mappingcoherence is critical if the input ontologies together with the computed mappings areto be used in practice. Unfortunately, only a few systems in OAEI 2013 have shown tosuccessfully use such techniques. We encourage ontology matching system developersto develop their own repair techniques or to use state-of-the-art techniques such as Al-como [21], the repair module of LogMap (LogMap-Repair) [17] or the repair moduleof AML [26], which have shown to work well in practice [19].
7 MultiFarm
For evaluating the ability of matching systems to deal with ontologies in different natu-ral languages, the MultiFarm data set has been proposed [22]. This data set results fromthe translation of 7 Conference test case ontologies (cmt, conference, confOf, iasted,sigkdd, ekaw and edas), into 8 languages (Chinese, Czech, Dutch, French, German,Portuguese, Russian, and Spanish, in addition to English). The 9 language versions re-sult in 36 pairs of languages. For each pair of language, we take into account the align-ment direction (cmten→confOfde and cmtde→confOfen, for instance, as two matching

tasks), what results in 49 alignments. Hence, MultiFarm contains 36 × 49 matchingtasks.
7.1 Experimental setting
For the 2013 evaluation campaign, we have used a subset of the whole MultiFarm dataset, omitting all the matching tasks involving the edas and ekaw ontologies (resulting in36×25 = 900 matching tasks). In this sub set, we can distinguish two types of matchingtasks: (i) those test cases where two different ontologies have been translated in differentlanguages, e.g., cmt→confOf, and (ii) those test cases where the same ontology hasbeen translated in different languages, e.g., cmt→cmt. For the test cases of type (ii),good results are not necessarily related to the use of specific techniques for dealingwith ontologies in different natural languages, but on the ability to exploit the fact thatboth ontologies have an identical structure (and that the reference alignment covers allentities described in the ontologies).
This year, 7 systems (out of 23 participants, see Table 2) use specific cross-lingual11
methods : CIDER-CL, MapSSS, RiMOM2013, StringsAuto, WeSeE, WikiMatch, andYAM++. This maintains the number of participants implementing specific modules asin 2012 (ASE, AUTOMSv2, GOMMA, MEDLEY, WeSeE, WikiMatch, and YAM++),counting on 4 new participants (some of them, extensions of systems participating inprevious campaigns). The other systems are not specifically designed to match ontolo-gies in different languages nor do they use any component for that purpose. CIDER-CL uses textual definitions of concepts (from Wikipedia articles) and computes co-occurrence information between multilingual definitions. MapSSS, StringsAuto andRiMOM201312 apply translation, using Google Translator API, before the matchingstep. In particular, RiMOM2013 uses a two-step translation: a first step for translatinglabels from the target language into the source language and a second step for translat-ing all labels into English (for using WordNet). WeSeE uses the Web Translator APIand YAM++ uses Microsoft Bing Translation, where both of them consider English aspivot language. Finally, WikiMatch exploits Wikipedia for extracting cross-languagelinks for helping in the task of finding correspondences between the ontologies.
7.2 Execution setting and runtime
All systems have been executed on a Debian Linux virtual machine configured withfour processors and 20GB of RAM running under a Dell PowerEdge T610 with 2*Intel11 We have revised the definitions of multilingual and cross-lingual matching. Initially, as re-
ported in [22], MultiFarm was announced as a benchmark for multilingual ontology matching,i.e., multilingual in the sense that we have a set of ontologies in 8 languages. However, itis more appropriate to use the term cross-lingual ontology matching. Cross-lingual ontologymatching refers to the matching cases where each ontology uses a different natural language(or a different set of natural languages) for entity naming, i.e., the intersection of sets is empty.It is the case of the matching tasks in MultiFarm.
12 These 3 systems have encountered problems for accessing Google servers. New versions ofthese tools were received after the deadline, improving, for some test cases, the results reportedhere.

Xeon Quad Core 2.26GHz E5607 processors and 32GB of RAM, under Linux ProxMox2 (Debian). The runtimes for each system can be found in Table 11. The measurementsare based on 1 run. We can observe large differences between the time required for asystem to complete the 900 matching tasks. While RiMOM requires around 13 minutes,WeSeE takes around 41 hours. As we have used this year a different setting from theone in 2012, we are not able to compare runtime measurements over the campaigns.
7.3 Evaluation results
Overall results Before discussing the results per pairs of languages, we present the ag-gregated results for the test cases within type (i) and (ii) matching task. Table 11 showsthe aggregated results. Systems not listed in this table have generated empty alignments,for most test cases (ServOMap) or have thrown exceptions (CroMatcher, XMapGen,XMapSiG). For computing these results, we do not distinguish empty and erroneousalignments. As shown in Table 11, we observe significant differences between the re-sults obtained for each type of matching task (specially in terms of precision). Mostof the systems that implement specific cross-lingual techniques – YAM++ (.40), Wiki-Match (.27), RiMOM2013 (.21), WeSeE (.15), StringsAuto (.14), and MapSSS (.10) –generate the best results for test cases of type (i). For the test cases of type (ii), systemsnon specifically designed for cross-lingual matching – MaasMatch and OntoK – arein the top-5 F-measures together with YAM++, WikiMatch and WeSeE. ConcerningCIDER-CL, this system in principle is able to deal with a subset of languages, i.e., DE,EN, ES, and NL.
Overall (for both types i and ii), in terms of F-measure, most systems implementingspecific cross-lingual methods outperform non-specific systems: YAM++ (.50), Wiki-Match (.22), RiMOM (.17), WeSeE (.15) – with MaasMatch given its high scores oncases (ii) – and StringsAuto (.10).
Comparison with previous campaigns In the first year of evaluation of MultiFarm,we have used a subset of the whole data set, where we omitted the ontologies edas andekaw, and suppressed the test cases where Russian and Chinese were involved. Since2012, we have included Russian and Chinese translations, but still have not includededas and ekaw. In the 2011.5 intermediary campaign, 3 participants (out of 19) usedspecific techniques – AUTOMSv2, WeSeE, and YAM++. In 2012, 7 systems (out of24) implemented specific techniques for dealing with ontologies in different natural lan-guages – ASE, AUTOMSv2, GOMMA, MEDLEY, WeSeE, WikiMatch, and YAM++.This year, as in 2012, 7 participants out of 21 use specific techniques: 2 of them havebeen participating since 2011.5 (WeSeE and YAM), 1 since 2012 (WikiMatch), 3 sys-tems (CIDER-CL, RiMOM2013 and MapSSS) have included cross-lingual approachesin their implementations, and 1 new system (StringsAuto) has participated.
Comparing 2012 and 2013 results (on the same basis), WikiMatch improved preci-sion for both test case types – from .22 to .34 for type (i) and .43 to .65 for type (ii) –preserving its values of recall. On the other hand, WeSeE has decreased both precision– from .61 to .22 – and recall – from .32 to .12 – for type (i) and precision – from .90 to.56 – and recall – from .27 to .09 – for type (ii).

Different ontologies (i) Same ontologies (ii)
System Runtime Prec. F-m. Rec. Prec. F-m. Rec.C
ross
-lin
gual
CIDER-CL 110 .03 .03 .04 .18 .06 .04MapSSS 2380 .27 .10 .07 .50 .06 .03
RiMOM2013 13 .52 .21 .13 .87 .14 .08StringsAuto 24 .30 .14 .09 .51 .07 .04
WeSeE 2474 .22 .15 .12 .56 .16 .09WikiMatch 1284 .34 .27 .23 .65 .18 .11
YAM++ 443 .51 .40 .36 .91 .60 .50
Non
spec
ific
AML 7 .14 .04 .03 .35 .03 .01HerTUDA 46 .00 .01 1.0 .02 .03 1.0HotMatch 17 .00 .00 .00 .41 .04 .02
IAMA 15 .15 .05 .03 .58 .04 .02LogMap 18 .18 .05 .03 .35 .03 .01
LogMapLite 6 .13 .04 .02 .25 .02 .01MaasMatch 70 .01 .02 .03 .62 .29 .19ODGOMS 44 .26 .10 .06 .47 .05 .03
OntoK 1602 .01 .01 .05 .16 .16 .15Synthesis 67 .30 .05 .03 .25 .04 .03
Table 11. MultiFarm aggregated results per matcher, for each type of matching task – types (i)and (ii). Runtime is measured in minutes (time for completing the 900 matching tasks).
Language specific results Table 12 shows the results aggregated per language pair,for the the test cases of type (i). For the sake of readability, we present only F-measurevalues. The reader can refer to the OAEI results web page for more detailed results onprecision and recall. As expected and already reported above, the systems that applyspecific strategies to match ontology entities described in different natural languagesoutperform the other systems. For most of these systems, the best performance is ob-served for the pairs of language including Dutch, English, German, Spanish, and Por-tuguese: CIDER-CL (en-es .21, en-nl and es-nl .18, de-nl .16), MapSSS (es-pt and en-es.33, de-en .28, de-es .26), RiMOM2013 (en-es .42, es-pt .40, de-en .39), StringsAuto(en-es .37, es-pt .36, de-en .33), WeSeE (en-es .46, en-pt .41, en-nl .40), WikiMatch(en-es .38, en-pt, es-pt and es-fr .37, es-ru .35). The exception is YAM++ which gener-ates its best results for the pairs including Czech : cz-en and en-pt .57, cz-pt .56, cz-nland fr-pt .53. For all specific systems, English is present in half of the top pairs.
For non-specific systems, most of them cannot deal at all with Chinese and Russianlanguages. 7 out of 10 systems generate their best results for the pair es-pt (followedby the pair de-en). Again, similarities in the language vocabulary have an importantrole in the matching task. On the other hand, although it is likely harder to find corre-spondences between cz-pt than es-pt, for some systems Czech is on pairs for the top-5F-measure (cz-pt, for AML, IAMA, LogMap, LogMapLite and Synthesis). It can beexplained by the specific way systems combine their internal matching techniques (on-tology structure, reasoning, coherence, linguistic similarities, etc).

AM
L
CID
ER
-CL
Her
TU
DA
Hot
Mat
ch
IAM
A
Log
Map
Log
Map
Lite
Maa
sMat
ch
Map
SSS
OD
GO
MS
Ont
oK
RiM
OM
2013
Stri
ngsA
uto
Synt
hesi
s
WeS
eE
Wik
iMat
ch
YAM
++
cn-cz .00 .01 .01 .12 .12 .36cn-de .00 .01 .00 .01 .18 .15 .37cn-en .01 .01 .01 .25 .16 .43cn-es .00 .01 .01 .00 .01 .17 .24 .19cn-fr .01 .01 .01 .01 .01 .17 .01 .10 .42cn-nl .00 .01 .01 .00 .01 .16 .19 .31cn-pt .01 .01 .01 .10 .18 .32cn-ru .00 .01 .01 .00 .01 .01 .23 .34cz-de .10 .00 .01 .10 .09 .09 .01 .14 .13 .01 .24 .22 .11 .02 .26 .48cz-en .04 .00 .01 .12 .05 .04 .02 .25 .24 .01 .25 .29 .06 .08 .18 .57cz-es .11 .00 .01 .11 .11 .11 .02 .18 .18 .03 .24 .22 .14 .09 .29 .19cz-fr .01 .00 .01 .01 .01 .01 .01 .01 .15 .07 .02 .17 .17 .02 .04 .22 .52cz-nl .04 .00 .01 .05 .04 .04 .01 .12 .12 .03 .32 .18 .04 .01 .23 .53cz-pt .12 .01 .01 .13 .13 .13 .01 .18 .20 .02 .24 .23 .16 .04 .25 .56cz-ru .01 .01 .01 .25 .48de-en .20 .12 .01 .21 .22 .20 .05 .28 .30 .01 .39 .33 .22 .33 .32 .50de-es .07 .15 .01 .07 .09 .06 .02 .26 .24 .01 .31 .29 .08 .28 .29 .19de-fr .05 .01 .01 .04 .04 .04 .02 .08 .06 .01 .29 .23 .04 .32 .26 .44de-nl .05 .16 .01 .04 .04 .04 .04 .17 .21 .01 .30 .19 .05 .31 .27 .40de-pt .07 .01 .08 .07 .07 .02 .13 .11 .02 .27 .18 .09 .34 .26 .41de-ru .00 .01 .01 .01 .01 .31 .47en-es .06 .21 .01 .05 .15 .04 .03 .33 .30 .01 .42 .37 .05 .46 .38 .23en-fr .06 .01 .01 .10 .06 .04 .05 .17 .15 .01 .32 .29 .04 .32 .33 .50en-nl .07 .18 .01 .07 .07 .10 .05 .22 .24 .02 .35 .24 .08 .40 .32 .52en-pt .06 .01 .06 .06 .06 .02 .18 .19 .02 .36 .30 .07 .41 .37 .57en-ru .00 .01 .00 .01 .24 .50es-fr .03 .01 .06 .06 .01 .03 .17 .14 .02 .36 .29 .02 .25 .37 .20es-nl .18 .01 .02 .07 .03 .01 .29 .15 .34 .32 .16es-pt .29 .01 .29 .24 .23 .05 .33 .33 .04 .40 .36 .25 .33 .37 .25es-ru .00 .01 .02 .35 .19fr-nl .12 .00 .01 .01 .12 .13 .12 .06 .16 .13 .03 .30 .26 .15 .24 .34 .46fr-pt .01 .01 .01 .01 .04 .10 .11 .26 .19 .34 .28 .53fr-ru .01 .01 .00 .01 .33 .46nl-pt .01 .01 .02 .01 .01 .02 .03 .04 .01 .15 .07 .02 .31 .27 .51nl-ru .00 .01 .01 .01 .33 .44pt-ru .00 .01 .00 .01 .29 .47
Table 12. MultiFarm results per pair of languages, for the test cases of type (i). In this detailedview, we distinguished empty alignments, represented by empty cells, from wrong ones (.00)
7.4 Conclusion
As expected, systems using specific methods for dealing with ontologies in differentlanguages work much better than non specific systems. However, the absolute results

are still not very good, if compared to the top results of the original Conference data set(approximatively 75% F-measure for the best matcher). For all specific cross-lingualmethods, the techniques implemented in YAM++, as in 2012, generate the best align-ments in terms of F-measure (around 50% overall F-measure for both types of matchingtasks). All systems privilege precision rather than recall. Although we count this yearon 4 new systems implementing specific cross-lingual methods, there is room for im-provements to achieve the same level of compliance as in the original data set.
8 Library
The library test case was established in 201213. The test case consists of matching oftwo real-world thesauri: The Thesaurus for the Social Sciences (TheSoz, maintainedby GESIS) and the Standard Thesaurus for Economics (STW, maintained by ZBW).The reference alignment is based on a manually created alignment from 2006. As ad-ditional benefit from this test case, the reference alignment is constantly improved bythe maintainers by manually checking the generated correspondences that have not yetbeen checked and that are not part of the reference alignment14.
8.1 Test data
Both thesauri used in this test case are comparable in many respects. They have roughlythe same size (6,000 resp. 8,000 concepts), are both originally developed in German,are today both multilingual, both have English translations, and, most important, de-spite being from two different domains, they have significant overlapping areas. Notleast, both are freely available in RDF using SKOS15. To enable the participation ofall OAEI matchers, an OWL version of both thesauri is provided, effectively by cre-ating a class hierarchy from the concept hierarchy. Details are provided in the reportof the 2012 campaign [1]. As stated above, we updated the reference alignment withall correct correspondences found during the 2012 campaign, it now consists of 3161correspondences.
8.2 Experimental setting
All matching processes have been performed on a Debian machine with one 2.4GHzcore and 7GB RAM allocated to each system. The evaluation has been executed byusing the SEALS infrastructure. Each participating system uses the OWL version.
To compare the created alignments with the reference alignment, we usethe Alignment API. For this evaluation, we only included equivalence relations(skos:exactMatch). We computed precision, recall and F1-measure for each matcher.Moreover, we measured the runtime, the size of the created alignment and checked
13 There has already been a library test case from 2007 to 2009 using different thesauri, as wellas other thesaurus test cases like the food and the environment test cases.
14 With the reasonable exception of XMapGen, which produces almost 40.000 correspondences.15 http://www.w3.org/2004/02/skos

whether a 1:1 alignment has been created. To assess the results of the matchers, wedeveloped three straightforward matching strategies, using the original SKOS versionof the thesauri:
– MatcherPrefDE: Compares the German lower-case preferred labels and generatesa correspondence if these labels are completely equivalent.
– MatcherPrefEN: Compares the English lower-case preferred labels and generates acorrespondence if these labels are completely equivalent.
– MatcherPref: Creates a correspondence, if either MatcherPrefDE or Matcher-PrefEN or both create a correspondence.
– MatcherAllLabels: Creates a correspondences whenever at least one label (pre-ferred or alternative, all languages) of an entity is equivalent to one label of anotherentity.
8.3 Results
Of all 21 participating matchers (or variants), 12 were able to generate an alignmentwithin 12 hours. CroMatcher, MaasMatch, RiMOM2013, WeSeE and WikiMatch didnot finish in the time frame, OntoK had heap space problems and CiderCL, MapSSSand Synthesis threw an exception. The results can be found in Table 13.
Matcher Precision F-Measure Recall Time (ms) Size 1:1
ODGOMS 0.70 0.76 0.83 27936433 3761 -YAM++ 0.69 0.74 0.81 731860 3689 -
MatcherPref 0.91 0.74 0.63 - 2190 -ServOMap 0.70 0.74 0.78 648138 3540 -
AML 0.62 0.7 0.88 39366 4433 -MatcherPrefDE 0.98 0.73 0.58 - 1885 -
MatcherAllLabels 0.61 0.72 0.88 - 4605 -LogMap 0.78 0.70 0.64 98958 2622 -
LogMapLite 0.65 0.70 0.77 20312 3775 -HerTUDA 0.52 0.67 0.92 11228741 5559 -HotMatch 0.73 0.65 0.58 12128682 2494
√MatcherPrefEN 0.88 0.57 0.42 - 1518 -
XmapSig 0.80 0.45 0.32 2914167 1256 -StringsAuto 0.77 0.30 0.19 1966012 767
√IAMA 0.78 0.08 0.04 18599 166 -
XmapGen 0.03 0.06 0.37 3008820 38360 -Table 13. Results of the Library test case (ordered by F-measure).
The best systems in terms of F-measure are ODGOMS and YAM++. These match-ers also have a higher F-measure than MatcherPref. ServOMap and AML are belowthis baseline but better than MatcherPrefDE and MatcherAllLabels. A group of match-ers including LogMap, LogMapLite, HerTUDA and HotMatch are above the Matcher-PrefEN baseline. Compared to last year evaluation with the updated reference align-ment, the matchers clearly improved: in 2012, no matcher was able to beat MatcherPrefand MatcherPrefDE, only ServOMapLt was better than MatcherAllLabels. Today, two

matchers outperformed all baselines; further two matchers outperformed all baselinesbut MatcherPref. This is remarkable, as the matchers are still not able to consume SKOSand therefore neglect the distinction between preferred and alternative labels. The base-lines are tailored for very high precision by design, while the matchers usually have ahigher recall. This is reflected in the F-measure, where the highest value increased from0.72 to 0.76 by almost 5 percentage points since last year. The recall mostly increased,e.g. YAM++ from 0.76 to 0.81 (without affecting the precision negatively, which alsoincreased from 0.68 to 0.69).
Like in the previous year, an additional intellectual evaluation of the alignmentsestablished automatically was done by a domain expert to further improve the referencealignment. Unsurprisingly, the matching tools predominantly detected matches basedon the character string. This included the term alone as well as the term’s context.Especially in the case of short terms, this could easily lead to wrong correspondences,e.g., “tea” �= “team”, “sheep” �= “sleep”. Except for its sequence of letters the term’scontext was not taken into account.
This sole attention to the character string was a main source of error in cases inwhich on the term as well as on the context level similar terminological entities ap-peared, e.g., “Green revolution” subject category: “Development Politic” �= “permanentrevolution” subject category: “Political Developments and Processes”.
Additionally, identical components of a compound frequently lead to incorrect cor-respondences, e.g., “prohibition of interest” �= “prohibition of the use of force”. More-over, terms in different domains might look similar, but in fact have very different mean-ings. An illustrative example is “Chicago Antitrust Theory” �= “Chicago School”, whereindeed the same Chicago is referenced, but without any effect on the (dis-)similarity ofboth concepts.
8.4 Conclusion
The overall performance improvement is encouraging in this test case. While it mightnot look impressive to beat simple baselines as ours at first sight, it is actually a notableachievement. The baselines are not only tailored for very high precision, benefittingfrom the fact that in many cases a consistent terminology is used, they also exploitadditional knowledge about the labels. The matchers are general-purpose matchers thathave to perform well in all OAEI test cases. Nonetheless, there does not seems to bematchers who understand SKOS in order to make use of the many concept hierarchiesprovided on the Web.
Generally, matchers still rely too much on the character string of the labels andthe labels of the concepts in the immediate vicinity. During the intellectual evaluationprocess, it became obvious that a multitude of incorrect matches could be preventedif the subject categories, respectively the thesauri’s classification schemes be matchedbeforehand. In many cases, misleading candidate correspondences could be discardedby taking these higher levels of the hierarchy into account. It could be prevented, forexample, to build up correspondences between personal names and subject headings. Athesaurus, however, is not a classification system. The disjointness of two subthesauriis therefore not easy to establish, let alone to detect by automatic means. Nonetheless,
thesauri oftentimes have their own classification schemes which partly follow classifi-cation principles. We believe that further exploiting this context knowledge could beworthwhile.
9 Interactive matching
The interactive matching test case was evaluated at OAEI 2013 for the first time. Thegoal of this evaluation is to simulate interactive matching [23], where a human expertis involved to validate mappings found by the matching system. In the evaluation, welook at how user interaction may improve matching results.
For the evaluation, we use the conference data set 5 with the ra1 alignment, wherethere is quite a bit of room for improvement, with the best fully automatic, i.e., non-interactive matcher achieving an F-measure below 80%. The SEALS client was modi-fied to allow interactive matchers to ask an oracle, which emulates a (perfect) user. Theinteractive matcher can present a correspondence to the oracle, which then tells the userwhether the correspondence is right or wrong.
All matchers participating in the interactive test case support both interactive andnon-interactive matching. This allows us to analyze how much benefit the interactionbrings for the individual matchers.
9.1 Results
Overall, five matchers participated in the interactive matching test case: AML andAML-bk, Hertuda, LogMap, and WeSeE-Match. All of them implement interactivestrategies that run entirely as a post-processing step to the automatic matching, i.e., takethe alignment produced by the base matcher and try to refine it by selecting a suitablesubset.
AML and AML-bk present all correspondences below a certain confidence thresh-old to the oracle, starting with the highest confidence values. They stop adding refer-ences once the false positive rate exceeds a certain threshold. Similarly, LogMap checksall questionable correspondences using the oracle. Hertuda and WeSeE-Match try toadaptively set an optimal threshold for selecting correspondences. They perform a bi-nary search in the space of possible thresholds, presenting a correspondence of averageconfidence to the oracle first. If the result is positive, the search is continued with ahigher threshold, otherwise with a lower threshold.
The results are depicted in Table 14. Please note that the values in this table slightlydiffer from the original values in the conference test case, since the latter uses microaverage recall and precision, while we use macro averages, so that we can computesignificance levels using T-Tests on the series of recall and precision values from theindividual test cases. The reason for the strong divergence of the results for WeSeEto the conference test case results is unknown. Altogether, the biggest improvement inF-measure, as well as the best overall result (although almost at the same level as AML-bk), is achieved by LogMap, which increases its F-measure by four percentage points.Furthermore, LogMap, AML and AML-bk show a statistically significant increase inrecall as well as precision, while all the other tools except for Hertuda show a significant

AML AML-bk Hertuda LogMap WeSeENon-Interactive ResultsPrecision 0.88 0.88 0.77 0.83 0.57F-measure 0.69 0.71 0.62 0.68 0.49Recall 0.59 0.61 0.53 0.62 0.46Interactive ResultsPrecision 10.91 10.91 0.79 10.90 10.73F-measure 10.71 10.73 0.58 10.73 0.47Recall 50.61 50.63 0.50 50.64 0.40Average Number of InteractionsPositive 1.43 1.57 1.95 2.57 1.67Negative 5.14 5.05 10.33 1.76 3.81Total 6.57 6.67 12.33 4.33 5.48
Table 14. Results of the interactive matching test case. The table reports both the results with andwithout interaction, in order to analyze the improvement that was gained by adding interactivefeatures. Improvements of the interactive variants over the non-interactive variants are shown inbold. Statistically significant differences are marked with 5(p < 0.05) and 1(p < 0.01). Fur-thermore, we report the average number of interactions, showing both the positive and negativeexamples presented to the oracle.
increase in precision. The increase in precision is in all cases however higher than theincrease of recall. It can be observed for AML, AML-bk and LogMap that a highlysignificant increase in precision also increases F-measure at a high significance level,even if the increase in recall is less significant.
At the same time, LogMap has the lowest number of interactions with the oracle,which shows that it also makes the most efficient use of the oracle. In a truly interactivesetting, this would mean that the manual effort is minimized. Furthermore, it is the onlytool that presents more positive than negative examples to the oracle.
On the other hand, Hertuda and WeSeE even show a decrease in recall, which can-not be compensated by the increase in precision. The biggest increase in precision (17percentage points) is achieved by WeSeE, but on an overall lower level than the othermatching systems. Thus, we conclude that their strategy is not as efficient as those ofthe other participants.
Compared to the results of the non-interactive conference test case, the best inter-active matcher (in terms of F-measure) is slightly below the best matcher (YAM++)with a F-measure value of 0.76 (using macro averages). Except for YAM++, the inter-active versions of AML-bk, AML and LogMap achieve better F-measure scores thanall non-interactive matchers.
9.2 Discussion
The results show that current interactive matching tools mainly use interaction as ameans to post-process an alignment found with fully automatic means. There are, how-ever, other interactive approaches that can be thought of, which include interaction atan earlier stage of the process, e.g., using interaction for parameter tuning [25], or de-termining anchor elements for structure-based matching approaches using interactive

methods. The maximum F-measure of 0.73 achieved shows that there is still room forimprovement.
Furthermore, different variations of the evaluation method can be thought of, in-cluding different noise levels in the oracle’s responses, i.e., simulating errors made bythe human expert, or allowing other means of interactions than the validation of singlecorrespondences, e.g., providing a random positive example, or providing the corre-sponding element in one ontology, given an element of the other one.
So far, we only compare the final results of the interactive matching process. In[23], we have introduced an evaluation method based on learning curves, which givesinsights into how quickly the matcher converges towards its final result. However, wehave not implemented that model for this year’s OAEI, since it requires more changes tothe matchers (each matcher has to provide an intermediate result at any point in time).
10 Instance matching
The instance matching track aims at evaluating the performance of different matchingtools on the task of matching RDF individuals which originate from different sourcesbut describe the same real-world entity [16].
10.1 RDFT test cases
Starting from the experience of previous editions of the instance matching track inOAEI [15], this year we provided a set of RDF-based test cases, called RDFT, that isautomatically generated by introducing controlled transformations in some initial RDFdata sets. The controlled transformations introduce artificial distortions into the data,which include data value transformations as well as structural transformations. RDFTincludes blind evaluation. The participants are provided with a list of five test cases. Foreach test case, we provide training data with the accompanying alignment to be used toadjust the settings of the tools, and contest data, based on which the final results will becalculated. The evaluation data set is generated by exploiting the same configuration ofthe RDFT transformation tool used for generating training data.
The RDFT test cases have been generated from an initial RDF data set about well-known computer scientists data extracted from DBpedia. The initial data set is com-posed by 430 resources, 11 RDF properties and 1744 triples. Some descriptive statisticsabout the initial data set are available online. Starting from the initial data set, we pro-vided the participants with five test cases, where different transformations have beenimplemented, as follows:
– Testcase 1: value transformation. Values of 5 properties have been changed byrandomly deleting/adding chars, by changing the date format, and/or by randomlychange integer values.
– Testcase 2: structure transformation. The length of property path between re-sources and values has been changed. Property assertions have been split in two ormore assertions.
– Testcase 3: languages. The same as Testcase 1, but using French translation forcomments and labels instead of English.

tescase01 tescase02 tescase03 tescase04 tescase05system Prec. F-m. Rec. Prec. F-m. Rec. Prec. F-m. Rec. Prec. F-m. Rec. Prec. F-m. Rec.
LilyIOM 1.00 1.00 0.99 0.74 0.74 0.74 0.94 0.93 0.92 0.71 0.72 0.73 0.71 0.58 0.49LogMap 0.97 0.80 0.69 0.79 0.88 0.99 0.98 0.84 0.73 0.95 0.80 0.70 0.92 0.74 0.62
RiMOM2013 1.00 1.00 1.00 0.95 0.97 0.99 0.96 0.98 0.99 0.94 0.96 0.98 0.93 0.96 0.99SLINT+ 0.98 0.98 0.98 1.00 1.00 1.00 0.94 0.92 0.91 0.91 0.91 0.91 0.87 0.88 0.88
Table 15. Results for the RDFT test cases.
– Testcase 4: combined. A combination of value and structure transformations usingFrench text.
– Testcase 5: cardinality. The same as Testcase 4, but now part of the resources havenone or multiple matching counterparts.
10.2 RDFT results
An overview of the precision, recall and F1-measure results for the RDFT test cases isshown in Table 15.
All the tools show good performances when dealing with singular type of data trans-formation, i.e., Testcases 1-3, either value, structural, and language transformations.Performances drop when different kinds of transformations are combined together, i.e.,Testcases 4-5, except for RiMOM2013, which still has performances close to 1.0 forboth precision and recall. This suggests that a possible challenge for instance matchingtools is to work in the direction of improving the combination and balancing of differentmatching techniques in a single, general-purpose, configuration scheme.
In addition to precision, recall and F1-measure results, we performed also a testbased on the similarity values provided by participating tools. In particular, we selectedthe provided mappings by different thresholds on the similarity values, in order to mon-itor the behavior of precision and recall16. Results of this second evaluation are shownin Figure 3.
Testing the results when varying the threshold used for mapping selection is usefulto understand how robust are the mappings retrieved by the participating tools. In par-ticular, RiMOM2013 is the only tool which has very good results with all the thresholdvalues that have been tested. This means that the retrieved mappings are generally cor-rect and associated with high levels of similarity. Other tools, especially LilyIOM andLogMap, retrieve a high number of mappings which are associated with low levels ofconfidence. In such cases, when we rely only on mappings between resources that areconsidered very similar by the tool, the quality of results becomes lower.
Finally, as a general remark suggested from the result analysis, we stress the oppor-tunity of working toward two main goals in particular: one one side, on the integrationof different matching techniques and the need of conceiving self-adapting tools, capa-ble of self-configuring the most suitable combination of matching metrics according tothe nature of data heterogeneity that needs to be handled; on the other side, the need for
16 This experiment is partially useful in the case of SLINT+, where the similarity values are notin the range [0,1] and are not necessarily proportional to the elements similarity.

●
●
●
● ● ●● ● ● ●
● ● ● ● ● ● ● ●
● ●
●
●
●
● ● ● ● ● ● ●
● ● ● ● ●● ● ●
● ●
● ● ● ● ●
● ● ● ● ●
● ● ● ● ●
● ● ●● ●
● ●●
●●
●● ● ● ●
● ● ● ● ● ● ● ● ●
●
● ●
●
●●
●● ● ● ●
● ●
●
●●
● ● ● ● ●
● ● ●● ●
●● ●
● ●
● ●
●
● ● ● ● ● ● ●
● ●
●
● ● ● ● ● ● ●
● ● ● ● ● ●
● ●
● ●
● ●
●● ● ● ● ● ● ●
testcase01, f1−measure testcase01, precision testcase01, recall
testcase02, f1−measure testcase02, precision testcase02, recall
testcase03, f1−measure testcase03, precision testcase03, recall
testcase04, f1−measure testcase04, precision testcase04, recall
testcase05, f1−measure testcase05, precision testcase05, recall
0.000.250.500.751.00
0.000.250.500.751.00
0.000.250.500.751.00
0.000.250.500.751.00
0.000.250.500.751.00
0.00 0.25 0.50 0.75 0.00 0.25 0.50 0.75 0.00 0.25 0.50 0.75Threshold for mapping selection
tool ● LilyIOM LogMap RiMOM2013 SLINT+
Fig. 3. Evaluation test based on the similarity values.
tools capable of providing a degree of confidence which could be used for measuringthe reliability of the provided mappings.

11 Lesson learned and suggestions
There are, this year, very few comments about the evaluation execution:
A) This year indicated again that requiring participants to implement a minimal inter-face was not a strong obstacle to participation. Moreover, the community seems toget used to the SEALS infrastructure introduced for OAEI 2011. This might be oneof the reasons for an increasing participation.
B) Related to the availability of the platform, participants checked that their tools wereworking on minimal tests and discovered in September that they were not workingon other tests. For that reason, it would be good to set the preliminary evaluationresults by the end of July.
C) Now that all tools are run in exactly the same configuration across all test cases,some discrepancies appear across such cases. For instance, benchmarks expect onlyclass correspondences in the name space of the ontologies, some other cases expectsomething else. This is a problem, which could be solved either by passing param-eters to the SEALS client (this would make its implementation heavier) or by postprocessing results (which may be criticized).
D) [24] raised and documented objections (on validity and fairness) to the way refer-ence alignments are made coherent with alignment repair techniques. Appropriatemeasures should be taken to mitigate this.
E) Last years we reported that we had many new participants. The same trend can beobserved for 2013.
F) Again and again, given the high number of publications on data interlinking, it issurprising to have so few participants to the instance matching track.
12 Conclusions
OAEI 2013 saw an increased number of participants and most of the test cases per-formed on the SEALS platform. This is good news for the interoperability of matchingsystems.
Compared to the previous years, we observed improvements of runtimes and theability of systems to cope with large ontologies and data sets (testified by the largebioand instance matching results). This comes in addition to progress in overall F-measure,which is more observable as the test case is more recent. More preoccupying was thelack of robustness of some systems observed in the simple benchmarks. This seemsto be due to an increased reliance on the network and networked resources that maytime-out systems.
As usual, most of the systems favour precision over recall. In general, participat-ing matching systems do not take advantage of alignment repairing system and returnsometimes incoherent alignments. This is a problem if their result has to be taken as in-put by a reasoning system. They do not generally use natural language aware strategies,while the multilingual tests show the worthiness of such an approach.
A novelty of this year was the evaluation of interactive systems, included in theSEALS client. It brings interesting insight on the performances of such systems andshould certainly be continued.

Most of the participants have provided a description of their systems and their ex-perience in the evaluation. These OAEI papers, like the present one, have not been peerreviewed. However, they are full contributions to this evaluation exercise and reflect thehard work and clever insight people put in the development of participating systems.Reading the papers of the participants should help people involved in ontology match-ing to find what makes these algorithms work and what could be improved. Sometimesparticipants offer alternate evaluation results.
The Ontology Alignment Evaluation Initiative will continue these tests by improv-ing both test cases and testing methodology for being more accurate. Matching eval-uation still remains a challenging topic, which is worth further research in order tofacilitate the progress of the field [27]. Further information can be found at:
http://oaei.ontologymatching.org.
Acknowledgements
We warmly thank the participants of this campaign. We know that they have workedhard for having their matching tools executable in time and they provided insightfulpapers presenting their experience. The best way to learn about the results remains toread the following papers.
We are very grateful to STI Innsbruck for providing the necessary infrastructure tomaintain the SEALS repositories.
We are also grateful to Martin Ringwald and Terry Hayamizu for providing thereference alignment for the anatomy ontologies and thank Elena Beisswanger for herthorough support on improving the quality of the data set.
We thank Christian Meilicke for help with incoherence evaluation within the con-ference and his support of the anatomy test case.
We also thank for their support the other members of the Ontology AlignmentEvaluation Initiative steering committee: Yannis Kalfoglou (Ricoh laboratories, UK),Miklos Nagy (The Open University (UK), Natasha Noy (Stanford University, USA),Yuzhong Qu (Southeast University, CN), York Sure (Leibniz Gemeinschaft, DE), JieTang (Tsinghua University, CN), Heiner Stuckenschmidt (Mannheim Universitat, DE),George Vouros (University of the Aegean, GR).
Bernardo Cuenca Grau, Jerome Euzenat, Ernesto Jimenez-Ruiz, Christian Meilicke,and Cassia Trojahn dos Santos have been partially supported by the SEALS (IST-2009-238975) European project in the previous years.
Ernesto and Bernardo have also been partially supported by the Seventh Frame-work Program (FP7) of the European Commission under Grant Agreement 318338,“Optique”, the Royal Society, and the EPSRC projects Score!, ExODA and MaSI3.
Cassia Trojahn dos Santos and Roger Granada are also partially supported by theCAPES-COFECUB Cameleon project number 707/11.
References
1. Jose Luis Aguirre, Bernardo Cuenca Grau, Kai Eckert, Jerome Euzenat, Alfio Ferrara,Robert Willem van Hague, Laura Hollink, Ernesto Jimenez-Ruiz, Christian Meilicke, An-
driy Nikolov, Dominique Ritze, Francois Scharffe, Pavel Shvaiko, Ondrej Svab-Zamazal,Cassia Trojahn, and Benjamin Zapilko. Results of the ontology alignment evaluation initia-tive 2012. In Proc. 7th ISWC ontology matching workshop (OM), Boston (MA US), pages73–115, 2012.
2. Ana Armas Romero, Bernardo Cuenca Grau, and Ian Horrocks. MORe: Modular combina-tion of OWL reasoners for ontology classification. In Proc. 11th International Semantic WebConference (ISWC), Boston (MA US), pages 1–16, 2012.
3. Benhamin Ashpole, Marc Ehrig, Jerome Euzenat, and Heiner Stuckenschmidt, editors. Proc.K-Cap Workshop on Integrating Ontologies, Banff (Canada), 2005.
4. Olivier Bodenreider. The unified medical language system (UMLS): integrating biomedicalterminology. Nucleic Acids Research, 32:267–270, 2004.
5. Caterina Caracciolo, Jerome Euzenat, Laura Hollink, Ryutaro Ichise, Antoine Isaac,Veronique Malaise, Christian Meilicke, Juan Pane, Pavel Shvaiko, Heiner Stuckenschmidt,Ondrej Svab-Zamazal, and Vojtech Svatek. Results of the ontology alignment evaluation ini-tiative 2008. In Proc. 3rd ISWC ontology matching workshop (OM), Karlsruhe (DE), pages73–120, 2008.
6. Jerome David, Jerome Euzenat, Francois Scharffe, and Cassia Trojahn dos Santos. Thealignment API 4.0. Semantic web journal, 2(1):3–10, 2011.
7. Jerome Euzenat, Alfio Ferrara, Laura Hollink, Antoine Isaac, Cliff Joslyn, VeroniqueMalaise, Christian Meilicke, Andriy Nikolov, Juan Pane, Marta Sabou, Francois Scharffe,Pavel Shvaiko, Vassilis Spiliopoulos, Heiner Stuckenschmidt, Ondrej Svab-Zamazal, Vo-jtech Svatek, Cassia Trojahn dos Santos, George Vouros, and Shenghui Wang. Results ofthe ontology alignment evaluation initiative 2009. In Proc. 4th ISWC ontology matchingworkshop (OM), Chantilly (VA US), pages 73–126, 2009.
8. Jerome Euzenat, Alfio Ferrara, Christian Meilicke, Andriy Nikolov, Juan Pane, FrancoisScharffe, Pavel Shvaiko, Heiner Stuckenschmidt, Ondrej Svab-Zamazal, Vojtech Svatek, andCassia Trojahn dos Santos. Results of the ontology alignment evaluation initiative 2010. InProc. 5th ISWC ontology matching workshop (OM), Shanghai (CN), pages 85–117, 2010.
9. Jerome Euzenat, Alfio Ferrara, Robert Willem van Hague, Laura Hollink, Christian Meil-icke, Andriy Nikolov, Francois Scharffe, Pavel Shvaiko, Heiner Stuckenschmidt, OndrejSvab-Zamazal, and Cassia Trojahn dos Santos. Results of the ontology alignment evalu-ation initiative 2011. In Proc. 6th ISWC ontology matching workshop (OM), Bonn (DE),pages 85–110, 2011.
10. Jerome Euzenat, Antoine Isaac, Christian Meilicke, Pavel Shvaiko, Heiner Stuckenschmidt,Ondrej Svab, Vojtech Svatek, Willem Robert van Hage, and Mikalai Yatskevich. Results ofthe ontology alignment evaluation initiative 2007. In Proc. 2nd ISWC ontology matchingworkshop (OM), Busan (KR), pages 96–132, 2007.
11. Jerome Euzenat, Christian Meilicke, Pavel Shvaiko, Heiner Stuckenschmidt, and Cassia Tro-jahn dos Santos. Ontology alignment evaluation initiative: six years of experience. Journalon Data Semantics, XV:158–192, 2011.
12. Jerome Euzenat, Malgorzata Mochol, Pavel Shvaiko, Heiner Stuckenschmidt, Ondrej Svab,Vojtech Svatek, Willem Robert van Hage, and Mikalai Yatskevich. Results of the ontologyalignment evaluation initiative 2006. In Proc. 1st ISWC ontology matching workshop (OM),Athens (GA US), pages 73–95, 2006.
13. Jerome Euzenat, Maria Rosoiu, and Cassia Trojahn dos Santos. Ontology matching bench-marks: generation, stability, and discriminability. Journal of web semantics, 21:30–48, 2013.
14. Jerome Euzenat and Pavel Shvaiko. Ontology matching. Springer-Verlag, Heidelberg (DE),2nd edition, 2013.
15. Alfio Ferrara, Andriy Nikolov, Jan Noessner, and Francois Scharffe. Evaluation of instancematching tools: The experience of OAEI. Journal of Web Semantics, 21:49–60, 2013.

16. Alfio Ferrara, Andriy Nikolov, and Francois Scharffe. Data linking for the semantic web.International Journal on Semantic Web and Information Systems, 7(3):46–76, 2011.
17. Ernesto Jimenez-Ruiz and Bernardo Cuenca Grau. LogMap: Logic-based and scalable on-tology matching. In Proc. 10th International Semantic Web Conference (ISWC), Bonn (DE),pages 273–288, 2011.
18. Ernesto Jimenez-Ruiz, Bernardo Cuenca Grau, Ian Horrocks, and Rafael Berlanga. Logic-based assessment of the compatibility of UMLS ontology sources. J. Biomed. Sem., 2, 2011.
19. Ernesto Jimenez-Ruiz, Christian Meilicke, Bernardo Cuenca Grau, and Ian Horrocks. Eval-uating mapping repair systems with large biomedical ontologies. In Proc. 26th DescriptionLogics Workshop, 2013.
20. Yevgeny Kazakov, Markus Krotzsch, and Frantisek Simancik. Concurrent classification ofEL ontologies. In Proc. 10th International Semantic Web Conference (ISWC), Bonn (DE),pages 305–320, 2011.
21. Christian Meilicke. Alignment Incoherence in Ontology Matching. PhD thesis, UniversityMannheim, 2011.
22. Christian Meilicke, Raul Garcıa Castro, Frederico Freitas, Willem Robert van Hage, ElenaMontiel-Ponsoda, Ryan Ribeiro de Azevedo, Heiner Stuckenschmidt, Ondrej Svab-Zamazal,Vojtech Svatek, Andrei Tamilin, Cassia Trojahn, and Shenghui Wang. MultiFarm: A bench-mark for multilingual ontology matching. Journal of web semantics, 15(3):62–68, 2012.
23. Heiko Paulheim, Sven Hertling, and Dominique Ritze. Towards evaluating interactive ontol-ogy matching tools. In Proc. 10th Extended Semantic Web Conference (ESWC), Montpellier(FR), pages 31–45, 2013.
24. Catia Pesquita, Daniel Faria, Emanuel Santos, and Francisco Couto. To repair or not torepair: reconciling correctness and coherence in ontology reference alignments. In Proc. 8thISWC ontology matching workshop (OM), Sydney (AU), page this volume, 2013.
25. Dominique Ritze and Heiko Paulheim. Towards an automatic parameterization of ontologymatching tools based on example mappings. In Proc. 6th ISWC ontology matching workshop(OM), Bonn (DE), pages 37–48, 2011.
26. Emanuel Santos, Daniel Faria, Catia Pesquita, and Francisco Couto. Ontology alignmentrepair through modularization and confidence-based heuristics. CoRR, abs/1307.5322, 2013.
27. Pavel Shvaiko and Jerome Euzenat. Ontology matching: state of the art and future challenges.IEEE Transactions on Knowledge and Data Engineering, 25(1):158–176, 2013.
28. York Sure, Oscar Corcho, Jerome Euzenat, and Todd Hughes, editors. Proc. ISWC Workshopon Evaluation of Ontology-based Tools (EON), Hiroshima (JP), 2004.
29. Cassia Trojahn dos Santos, Christian Meilicke, Jerome Euzenat, and Heiner Stuckenschmidt.Automating OAEI campaigns (first report). In Proc. ISWC Workshop on Evaluation of Se-mantic Technologies (iWEST), Shanghai (CN), 2010.
Oxford, Linkoping Mannheim, Grenoble, Milano, Porto Alegre, Toulouse, Koln,Walldorf, Montpellier, Trento, Prague
November 2013

AgreementMakerLight Results for OAEI 2013
Daniel Faria1, Catia Pesquita1, Emanuel Santos1,Isabel F. Cruz2, and Francisco M. Couto1
1 LASIGE, Dept Informatics, Faculty of Sciences of the University of Lisbon, Portugal2 ADVIS Lab, Dept Computer Science, University of Illinois at Chicago, USA
Abstract. AgreementMakerLight (AML) is an automated ontology matchingframework based on element-level matching and the use of external resourcesas background knowledge. This paper describes the configuration of AML forthe OAEI 2013 competition and discusses its results.Being a newly developed and still incomplete system, our focus in this year’sOAEI were the anatomy and large biomedical ontologies tracks, wherein back-ground knowledge plays a critical role. Nevertheless, AML was fairly success-ful in other tracks as well, showing that in many ontology matching tasks, alightweight approach based solely on element-level matching can compete withmore complex approaches.
1 Presentation of the system
1.1 State, purpose, general statement
AgreementMakerLight (AML) is an automated ontology matching framework derivedfrom the AgreementMaker system [2, 4]. It was developed with the main goal of tack-ling very large ontology matching problems such as those in the life science domain,which AgreementMaker cannot handle efficiently.
The key design principles of AML were efficiency and simplicity, although flexibil-ity and extensibility—which are key features of AgreementMaker—were also high onthe list [5]. Additionally, AML drew upon the knowledge accumulated in Agreement-Maker by reusing, adapting, and building upon many of its components. Finally, one ofthe main paradigms of AML is the use of external resources as background knowledgein ontology matching.
AML is primarily focused on lexically rich ontologies in general and on life sciencesontologies in particular, although it can be adapted to many other ontology matchingtasks, thanks to its flexible and extensible framework. However, due to its short devel-opment time (eight months), it does not include components for instance matching ortranslation yet, and thus cannot handle all ontology matching tasks.
1.2 Specific techniques used
The AML workflow for the OAEI 2013 can be divided into six steps, as shown in Fig.1: ontology loading, baseline matching and profiling, background knowledge match-ing (optional), extension matching and selection, property matching (conditional), andrepair (optional).

Fig. 1. The AgreementMakerLight Workflow for the OAEI 2013.
Ontology Loading In the ontology loading step, AML reads and processes each ofthe input ontologies and stores the information necessary for the subsequent steps in itsown data structures.First, AML reads the localName, labels and synonym properties of all classes, normal-izes them, and enters them into the Lexicon [5] of that ontology. Then, it derives newsynonyms for each name in the Lexicon by removing leading and trailing stop words[8], and by removing name sections within parenthesis. After class names, AML readsthe class-subclass relationships and the disjoint clauses and stores them in the Relation-shipMap [5]. Finally, AML reads the name, type, domain, and range of each propertyand stores them in the PropertyList.Note that AML currently does not store or use comments, definitions, or instances.
Baseline Matching and Profiling In the baseline matching and profiling step, AMLemploys an efficient weighted string-equivalence algorithm, the Lexical Matcher [5], toobtain a baseline class alignment between the input ontologies. Then, AML profiles thematching problem by assessing the size (i.e., number of classes) of the input ontologies,the cardinality of the baseline alignment, and the property/class ratio.Regarding size, AML divides matching problems into three size categories (small,medium or large), which will affect decisions and thresholds during the backgroundknowledge matching and the extension matching and selection steps.Regarding cardinality, AML also considers three categories (near-one, medium andhigh), which will determine how selection is performed during the extension match-ing and selection step.As for the property/class ratio, it determines whether AML will match properties duringthe property matching step.
Background Knowledge Matching For the OAEI 2013, AML employs three sourcesof background knowledge: Uberon [6], UMLS [1] and WordNet [10]. When using back-ground knowledge, AML tests how well each source fits the matching problem by com-paring the coverage of its alignment with the coverage of the baseline alignment.The Uberon Matcher uses the Uberon ontology (in OWL) and a table of pre-processedUberon cross-references (in a text file). Each input ontology is matched both againstthe Uberon ontology using the Lexical Matcher and directly against the cross-reference

table, and AML determines which form of matching is best (giving priority to the cross-references, since they are more reliable). When Uberon is a good fit for the matchingproblem, it is selected as the only source of background knowledge and is used to ex-tend the Lexicons of the input ontologies [8]. When it is a reasonable fit, its alignmentis merged with the baseline alignment.The UMLS Matcher uses a pre-processed version of the MRCONSO table from theUMLS Metathesaurus (in a text file). Each input ontology is matched against the wholeUMLS table, then AML decides whether to use a single UMLS source (by compar-ing the coverage of all sources) or the whole table. When UMLS is a good fit for thematching problem, its alignment is used exclusively, and the extension matching andselection step is skipped. Otherwise, if it is a reasonable fit, its alignment is mergedwith the baseline alignment.The WordNet Matcher queries the WordNet database for synonyms of each name inthe Lexicons of the input ontologies, using the Jaws API CITATION. These synonymsare used to create temporary extended Lexicons, which are matched with the LexicalMatcher. Because WordNet is prone to induce errors, AML uses it only to extend thebaseline alignment, meaning that it matches only previously unmatched classes.
Extension Matching and Selection The extension matching and selection step com-prises two matching sub-steps that alternate with two selection sub-steps. First, AMLemploys a word-based similarity algorithm, the Word Matcher [5], to extend the currentalignment globally, followed by a selection algorithm to reduce the alignment to thedesired cardinality. Then AML employs the Parametric String Matcher [5], which im-plements the Isub string similarity metric [11], to extend the resulting alignment locally(i.e., by matching the children, parents and siblings of already matched class pairs).This is followed by a final selection sub-step.When the matching problem is profiled as ’large’, the Word Matcher is skipped becauseit is too memory intensive to be used globally, and its local use is subsumed by that ofthe Parametric String Matcher [3].In the interactive matching track, AML employs an interactive selection algorithm,which asks the user for feedback about mappings in case of conflict or below a givensimilarity threshold, until a given number of negative answers is reached.
Property Matching In the property matching step, AML matches the ontology prop-erties. AML compares the properties’ types, domains and ranges, looking for mappingsin the class alignment when the domains/ranges are classes. Then, if the properties haveattributes in common, AML measures the word-based similarity between their names(as per the Word Matcher [5]), employing also WordNet when background knowledgeis turned on.
Repair In the repair step, AML employs a heuristic repair algorithm [9] to ensure thatthe final alignment is coherent with regard to disjoint clauses. The repair algorithm wasused by default in all OAEI tracks, except for the Large Biomedical Ontologies trackwhere we ran AML both with and without repair.

1.3 Link to the system and parameters file
The AML system and the alignments it produced for the OAEI 2013 are available at theSOMER project page (http://somer.fc.ul.pt/).
2 Results
2.1 Benchmark
AML had a very high precision (100%) but a fairly low recall (40%) in the Bench-mark track, returning empty alignments in several of the tests. This is a consequence ofAML’s simple framework, which is exclusively based on element-level matching anddoes not handle instances. Nevertheless, it was interesting to note that AML had thehighest F-measure/time ratio, which attests to its efficiency.
2.2 Anatomy
The AML Anatomy results are shown in Table 1. AML ran in this track both with andwithout background knowledge (AML-BK and AML respectively). In the case of thistrack, AML-BK selects Uberon exclusively as the source of background knowledge,and uses it for Lexicon extension. Thus, the only difference between AML and AML-BK is that the latter has Lexicons enriched with Uberon synonyms.
Table 1. AgreementMakerLight results in the Anatomy track.
Configuration Precision Recall F-Measure Recall+AML 95.4% 82.7% 88.6% 54.5%
AML-BK 95.4% 92.9% 94.2% 81.7%
The results of AML-BK were very good, with a fairly high precision, and the high-est recall, F-measure and recall+ in this year’s evaluation. However, the AML resultswithout background knowledge were also good, ranking fourth overall in F-measure,and second if we exclude the systems using Uberon. In fact, we believe that the AMLresults are near-optimal for a strategy based solely on element-level matching, and thatbackground knowledge is required to obtain substantial improvements. The impact andquality of the Uberon cross-references is clear when we note that AML-BK gained 10%recall over AML without any loss in precision. Finally, it is also noteworthy that AMLwas one of only two systems to produce coherent alignments.
2.3 Conference
The AML Conference results with reference alignment 1 are shown in Table 2 (theresults with reference alignment 2 are slightly worst for all systems, but do not affecttheir ranking). AML ran in this track with and without background knowledge, with

Table 2. AgreementMakerLight results in the Conference track with reference alignment 1.
Configuration Precision Recall F-MeasureAML 87% 56% 68%
AML-BK 87% 58% 70%
AML-BK using WordNet as the only source of background knowledge (to match bothclasses and properties).
The results of both AML-BK and AML were good, having the highest precisionof this year’s evaluation and ranking second and tied for third in terms of F-measure,respectively. An important part of the success of AML in this task was the propertymatching algorithm, which found 9 and 11 property mappings with 100% precision,with and without background knowledge respectively.
2.4 Multifarm
As we expected, the performance of AML in the Multifarm track was poor, with F-measures of only 4% and 3% when comparing different ontologies and the same on-tologies respectively. Participation in this track was beyond our scope, as AML does nothandle translations or employ structural-level matching, which are essential for successin this track.
2.5 Library
The results of AML in the Library track were reasonable, as it ranked 4th in terms ofF-measure (with 73%) and had the second highest recall of this year’s OAEI (87.7%).Nevertheless, there is clearly room for improvement regarding precision, which wassignificantly lower than that of other top systems (62.5%) likely due to the fact thatAML does not take the language of labels into account. Indeed, the results of AMLwere very similar to the MatcherAllLabels benchmark.
2.6 Interactive Matching
The AML Interactive Matching results are shown in Table 3. AML ran with the sameconfigurations used in the Conference track, except that in this track the selection algo-rithm employed is interactive, rather than automatic.
Table 3. AgreementMakerLight results in the Interactive Matching track.
Configuration Precision Recall F-Measure InteractionsAML 91% 60.7% 71.5% 138
AML-BK 91.2% 62.7% 73% 140
The results show that AML’s interactive selection algorithm was effective, gainingboth precision and recall in comparison with the conference results. Nevertheless, this

algorithm is far from optimized, and it should be possible to reduce the number of userinteractions without sacrificing F-measure.
2.7 Large Biomedical Ontologies
The AML Large Biomedical Ontologies results are shown in Table 4. AML ran in thistrack with six different configurations: without background knowledge (AML); withbackground knowledge (AML-BK); with specialized background knowledge (AML-SBK); and in all three cases with (-R) and without repair. AML-BK selects Uberon inall six tasks of this track (although never for Lexicon extension) and selects WordNetonly in the SNOMED-NCI small task. AML-SBK is given access to UMLS, and selectsit exclusively for all six tasks.Our goals in testing all these configurations were: to assess the impact of using domainbackground knowledge both unrelated (Uberon) and directly related (UMLS) to thereference alignments; to assess the effect of using repair on the quality of the results;and to contribute to improve the quality of the reference alignments.
Table 4. Summary AgreementMakerLight results in the Large Biomedical Ontologies track.
Configuration Precision Recall F-Measure IncoherenceAML 92.6% 68.3% 78.3% 43.1%
AML-R 93.9% 66.6% 77.6% 0.028%AML-BK 90.8% 70.9% 79.2% 44.2%
AML-BK-R 92.1% 69.2% 78.5% 0.027%AML-SBK 96.2% 96.1% 96.2% 55%
AML-SBK-R 97.6% 92.5% 95% 0.015%
The results of AML-SBK were very good, with a marked advantage over all othersystems in this year’s evaluation. This is unsurprising given that AML-SBK derivedits alignments from UMLS using an automatic strategy that is likely analogous to thatused to build the reference alignments in the first place. This evidently gives AML-SBK an advantage over systems that do not use UMLS. Note, however, that the strategyemployed by AML is a general-purpose strategy for reusing preexisting mappings andcross-references, which is used for both UMLS and Uberon. The only issue is that thereference alignments were also automatically derived from UMLS, which makes theevaluation of AML-SBK positively biased.The results of AML-BK were also good, ranking second overall in recall and F-measureif we exclude the systems that used UMLS. However, in this case the evaluation ofAML-BK is negatively biased by the reference alignments. The reason for this is thatAML-BK uses Uberon, and many of the mappings derived from Uberon are not presentin UMLS despite being correct. This is particularly evident in the FMA-NCI matchingproblem with whole ontologies, where the contribution of Uberon (based on cross-references which are manually curated) was approximately neutral, decreasing the pre-cision as substantially as it increased the recall (in relation to AML). Perhaps extendingthe reference alignments by compiling mappings from multiple reliable data sources

such as Uberon could enable a fairer evaluation of the systems competing in this track,and make the tasks less trivial for systems using background knowledge.The use of repair led to clearly more coherent alignments, as all AML configurationswith repair obtained very low degrees of unsatisfiability. However, in terms of qualityof the results, the use of repair led to a minor increase in F-measure in some cases, buta substantial decrease in others, and thus had a negative effect overall. This is tied toyet another bias in the reference alignments, caused by the fact that they were automat-ically repaired [7]. Employing a repair strategy that differs from that used to build thereference alignments can be more penalizing than not doing any repair at all, since foreach different decision a repair algorithm makes, it will remove a “correct” mappingand keep an “incorrect” one, whereas without repair we would only have the latter. Theproblem is that such decisions are essentially arbitrary regarding correctness.
3 General comments
3.1 Comments on the results
On the whole, the results of AML (without background knowledge) were interesting,and show that, for many ontology matching tasks, a lightweight approach based solelyon element-level matching can compete with more complex approaches. It is worthhighlighting that AML was among the quickest systems in all tracks, and thus had aconsistently high F-measure/time ratio in all tracks except for Multifarm. However, theresults in the Multifarm track, and to a lesser degree those in the Benchmark track, re-mind us that AML is still a system in development.The results of AML-BK (and SBK) show that using suitable background knowledge iscritical in specialized domains such as the biomedical, but can be advantageous evenfor more typical matching problems (such as those in the Conference track).
3.2 Discussions on the way to improve the proposed system
Implementing efficient and effective structural-level matching algorithms will be crit-ical to improve the performance of AML overall. Language handling and translationwill also be important to expand the scope of AML, and allow it to tackle tasks suchas those in the Multifarm track. Finally, the inclusion of more sources of backgroundknowledge will undoubtedly contribute to improve the performance of AML in tasksbeyond the biomedical domain.
4 Conclusion
The participation of AML in the OAEI 2013 was a success overall, with very goodresults in the Anatomy, Conference, Interactive Matching and Biomedical Ontologiestracks, and reasonable results in the Library track. These results validate the backgroundknowledge paradigm of AML, and demonstrate the effectiveness of a lightweight ontol-ogy matching strategy based solely on element-level matching. Nevertheless, it is also

clear from the results that AML is not a complete ontology matching system yet, andthat it can benefit from the addition of new tools to its base strategy.Regarding its namesake, AML was able to build upon the success AgreementMakerhad in the Anatomy track in previous OAEI competitions, and was able to transposethis success to the Large Biomedical Ontologies track.
Acknowledgments
DF, CP, ES and FMC were funded by the Portuguese FCT through the SOMER project(PTDC/EIA-EIA/119119/2010) and the multi-annual funding program to LASIGE. CPwas also funded by the FLAD-NSF 2013 PORTUGAL-U.S. Research Networks Pro-gram through the project “Turning Big Data into Smart Data”. The research of IFCwas partially supported by NSF Awards IIS-0812258, IIS-1143926, IIS-1213013, andCCF-1331800, by a UIC Area of Excellence Award, and by a IPCE Civic EngagementResearch Fund Award.
References
1. O. Bodenreider. The Unified Medical Language System (UMLS): integrating biomedicalterminology. Nucleic Acids Res, 32(Database issue):267–270, 2004.
2. I. F. Cruz, F. Palandri Antonelli, and C. Stroe. AgreementMaker: Efficient Matching forLarge Real-World Schemas and Ontologies. PVLDB, 2(2):1586–1589, 2009.
3. I. F. Cruz, F. Palandri Antonelli, C. Stroe, U. Keles, and A. Maduko. Using AgreementMakerto Align Ontologies for OAEI 2009: Overview, Results, and Outlook. In ISWC InternationalWorkshop on Ontology Matching (OM), volume 551 of CEUR Workshop Proceedings, pages135–146, 2009.
4. I. F. Cruz, C. Stroe, F. Caimi, A. Fabiani, C. Pesquita, F. M. Couto, and M. Palmonari. UsingAgreementMaker to Align Ontologies for OAEI 2011. In ISWC International Workshop onOntology Matching (OM), volume 814 of CEUR Workshop Proceedings, pages 114–121,2011.
5. D. Faria, C. Pesquita, E. Santos, M. Palmonari, I. F. Cruz, and F. M. Couto. The Agreement-MakerLight Ontology Matching System. In OTM Conferences - ODBASE, pages 527–541,2013.
6. C. J. Mungall, C. Torniai, G. V. Gkoutos, S. Lewis, and M. A. Haendel. Uberon, an Integra-tive Multi-species Anatomy Ontology. Genome Biology, 13(1):R5, 2012.
7. C. Pesquita, D. Faria, E. Santos, and F. M. Couto. Using AgreementMaker to Align Ontolo-gies for OAEI 2011. In ISWC International Workshop on Ontology Matching (OM), CEURWorkshop Proceedings, page To appear, 2013.
8. C. Pesquita, C. Stroe, D. Faria, E. Santos, I. F. Cruz, and F. M. Couto. What’s in a ”nym”?Synonyms in Biomedical Ontology Matching. In International Semantic Web Conference(ISWC), page To appear, 2013.
9. E. Santos, D. Faria, C. Pesquita, and F. M. Couto. Ontology alignment repair through mod-ularization and confidence-based heuristics. arXiv:1307.5322, 2013.
10. B. Spell. Java API for WordNet Searching (JAWS). http://lyle.smu.edu/∼tspell/jaws/, 2009.11. G. Stoilos, G. Stamou, and S. Kollias. A string metric for ontology alignment. In Interna-
tional Semantic Web Conference (ISWC), pages 624–637, 2005.

Monolingual and Cross-lingual Ontology Matching withCIDER-CL: evaluation report for OAEI 2013
Jorge Gracia1 and Kartik Asooja1,2
1 Ontology Engineering Group, Universidad Politecnica de Madrid, [email protected]
2 Digital Enterprise Research Institute, National University of Ireland, Galway, [email protected]
Abstract. CIDER-CL is the evolution of CIDER, a schema-based ontology align-ment system. Its algorithm compares each pair of ontology entities by analysingtheir similarity at different levels of their ontological context (linguistic descrip-tion, superterms, subterms, related terms, etc.). Then, such elementary similari-ties are combined by means of artificial neural networks. In its current version,CIDER-CL uses SoftTFIDF for monolingual comparisons and Cross-Lingual Ex-plicit Semantic Analysis for comparisons between entities documented in differ-ent natural languages. In this paper we briefly describe CIDER-CL and com-ment its results at the Ontology Alignment Evaluation Initiative 2013 campaign(OAEI’13).
1 Presentation of the system
CIDER-CL is the evolution of CIDER (Context and Inference baseD alignER) [7], nowincorporating cross-lingual capabilities. In order to match ontology entities, CIDER-CL extracts their ontological context and enriches it by applying lightweight inferencerules. Then, elementary similarity comparisons are performed to compare different fea-tures of the ontological contexts. Such elementary comparisons are combined by meansof artificial neural networks (ANNs) [9] to produce a final similarity value between thecompared entities. The use of ANNs saves a lot of effort on manual tuning and allows toquickly adapt the system into different domains (as far as there are reference alignmentsavailable for them).
In its current version, the aligner has been re-implemented to include more featuresin the comparisons and to add new metrics for similarity computation. In particular,cross-lingual capabilities have been added by including the use of Cross-Lingual Ex-plicit Semantic Analysis (CL-ESA) [10] between entities documented in different nat-ural languages. Further, the previous metrics for monolingual comparison (based onVector Space Modelling [8]) have been changed by the SoftTFIDF metric [3]. CIDER-CL is not intended to be used with large ontologies, particularly in the cross-lingualcase (CL-ESA computation is quite costly in terms of time).
1.1 State, purpose, general statement
According to the high level classification given in [5], our method is a schema-basedsystem (opposite to others which are instance-based, or mixed), because it relies mostly

on schema-level input information for performing ontology matching. CIDER-CL canoperate in two modes: (i) as an ontology aligner, taking two ontologies as input andgiving their alignment as output, and (ii) as a similarity service, taking two ontologyentities as input and giving the similarity value between them as output. In the first casethe input to CIDER-CL are two OWL ontologies and a threshold value and the outputis an RDF file expressed in the alignment format3, although it can be easily translatedinto another formats such as EDOAL4.
The type of alignment that CIDER-CL obtains is semantic equivalence. In its cur-rent implementation the following languages are covered: English (EN), Spanish (ES),German (DE), and Dutch (NL).
1.2 Specific techniques used
In this section we briefly introduce the monolingual and cross-lingual metrics used byCIDER-CL, as well as the overall architecture of the ontology aligner.
SoftTFIDF. SoftTFIDF [3] is a hybrid string similarity measure that combines TF-IDF,a token-based similarity widely used in information retrieval [8], with an edit-basedsimilarity such as Jaro-Winkler [11] (although any other could be used instead).
Typically, string comparisons to compute TF-IDF weights are based on exact match-ing (after some normalisation or tokenisation step). The idea of SoftTFIDF is to use anedit distance instead to support a higher degree of variation between the terms. In par-ticular, we use Jaro-Winkler similarity with a 0.9 threshold, above which two stringsare consider equal. SoftTFIDF measure has proved to be very effective when compar-ing short strings [3]. In our case, the corpus used by SoftTFIDF is dynamically createdwith the lexical information coming from the two compared ontologies (extracting theirlabels, comments, and URI fragments).
CL-ESA. For cross-lingual ontology matching we propose the use of CL-ESA [10],a cross-lingual extension of an approach called Explicit Semantic Analysis [6] (ESA).ESA allows comparing two texts semantically with the help of explicitly defined con-cepts. This method uses the co-occurrence information of the words from the textualdefinitions of the concepts using, for instance, the Wikipedia articles. In short, ESA ex-tends a simple bag of words model to a bag of concepts model. Some reports [2] havedemonstrated the good behaviour of CL-ESA for certain tasks such as cross lingualinformation retrieval.
To compare two texts in different languages semantically, Wikipedia-based CL-ESA represents the two texts as vectors in a vector space that has the Wikipedia titles(articles) as dimensions, each vector in its own language specific Wikipedia. The mag-nitude of each title/dimension is the associativity weight of the text to that title. Toquantify this associativity, the textual content of the Wikipedia article is utilized. Thisweight can be calculated by using different methods, for instance, TF-IDF score.
3 http://alignapi.gforge.inria.fr/format.html4 http://alignapi.gforge.inria.fr/edoal.html
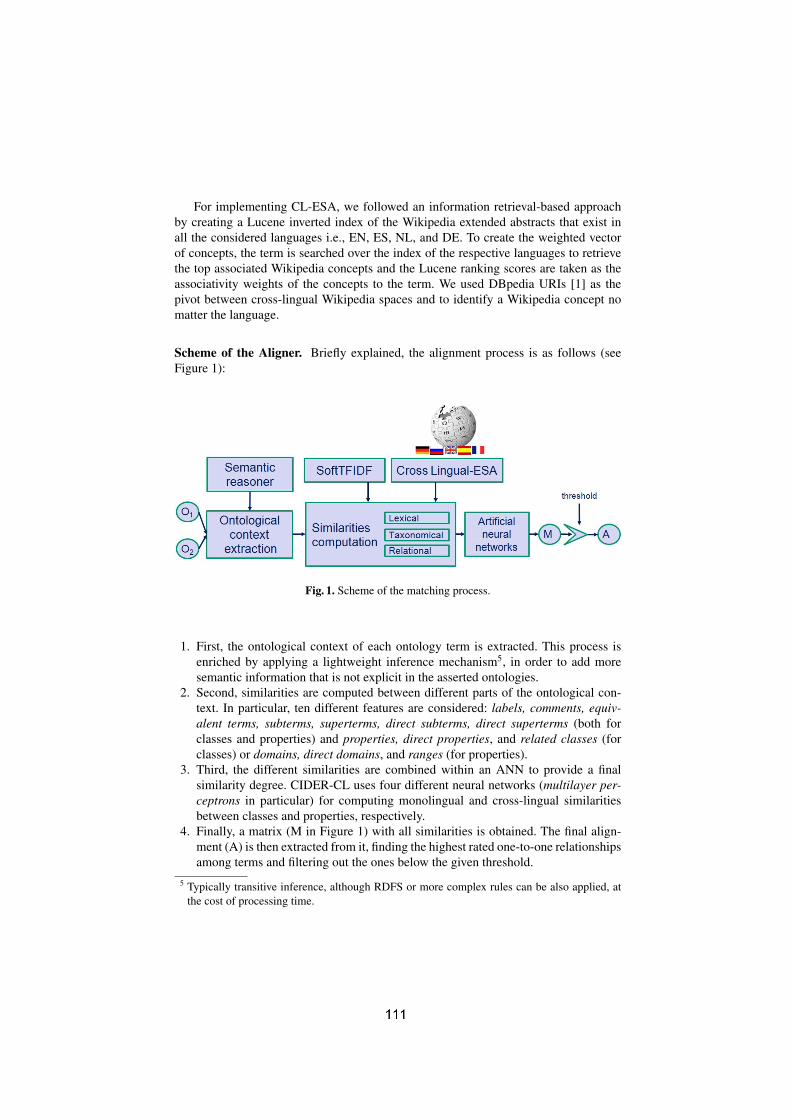
For implementing CL-ESA, we followed an information retrieval-based approachby creating a Lucene inverted index of the Wikipedia extended abstracts that exist inall the considered languages i.e., EN, ES, NL, and DE. To create the weighted vectorof concepts, the term is searched over the index of the respective languages to retrievethe top associated Wikipedia concepts and the Lucene ranking scores are taken as theassociativity weights of the concepts to the term. We used DBpedia URIs [1] as thepivot between cross-lingual Wikipedia spaces and to identify a Wikipedia concept nomatter the language.
Scheme of the Aligner. Briefly explained, the alignment process is as follows (seeFigure 1):
Fig. 1. Scheme of the matching process.
1. First, the ontological context of each ontology term is extracted. This process isenriched by applying a lightweight inference mechanism5, in order to add moresemantic information that is not explicit in the asserted ontologies.
2. Second, similarities are computed between different parts of the ontological con-text. In particular, ten different features are considered: labels, comments, equiv-alent terms, subterms, superterms, direct subterms, direct superterms (both forclasses and properties) and properties, direct properties, and related classes (forclasses) or domains, direct domains, and ranges (for properties).
3. Third, the different similarities are combined within an ANN to provide a finalsimilarity degree. CIDER-CL uses four different neural networks (multilayer per-ceptrons in particular) for computing monolingual and cross-lingual similaritiesbetween classes and properties, respectively.
4. Finally, a matrix (M in Figure 1) with all similarities is obtained. The final align-ment (A) is then extracted from it, finding the highest rated one-to-one relationshipsamong terms and filtering out the ones below the given threshold.
5 Typically transitive inference, although RDFS or more complex rules can be also applied, atthe cost of processing time.

Implementation. Some datasets used in OAEI campaigns are open and the referencealignments available for download. We have used part of such data to train our system.In particular, we chose a subset of the OAEI’11 benchmark track to train our neuralnetworks for the monolingual case. We used the whole dataset but excluding cases 202and 248-266, which present a total absence or randomization of labels and comments(however their variations, 248-2, 248-4, etc., were not excluded). Also the referencealignments of the conference track, which are also open, were added to the trainingdata set.
The use of the benchmark track for adjusting the ANNs is motivated by the factthat it covers many possible situations and variations well, such as presence or ab-sence of certain ingredients (labels, comments, etc.) or the effect of aligning at differentgranularity levels (flattened/expanded hierarchies), etc. Further, we add also data of theconference track to include training data coming from “real world” ontologies.
For the cross-lingual case, we trained the neural networks with a subset of the on-tologies of the OAEI’13 Multifarm track (in EN, ES, DE, and NL): cmt, conference,confOf, and sigkdd. Comparisons were run among the different ontologies in the dif-ferent languages, excluding comparisons between the same ontologies. Due to the slowperformance of CL-ESA, we decided to perform an attribute selection analysis to dis-cover which features have more predictive power. As result, we limited the system tocompute these features for classes: labels, subterms, direct superterms, direct subterms,and properties; while for properties they were limited to: labels, subterms, and ranges.
CIDER-CL has been developed in Java, extending the Alignment API [4]. To createand manipulate neural networks we use Weka6 data mining framework. For SoftTFIDFwe use SecondString7 and for CL-ESA we use the implementation developed by theMonnet project8, which is available in GitHub as open source9.
1.3 Adaptations made for the evaluation
The weights and the configuration of the neural networks remained constant for allthe tests and tracks of OAEI’13, as well as the threshold. In particular we selected athreshold of 0.0025. The intention of such a small value was to promote recall overprecision (while filtering out some extremely low values). Therefore, later filtering canbe made to perform a threshold analysis as the organisers of some OAEI tracks do (e.g.,conference track).
Some minor technical adaptations were needed to integrate the system into the Sealsplatform, like solving compatibility issues with the libraries used by the Seals wrapper.
1.4 Link to the system and parameters file
The version of CIDER-CL used for this evaluation (v1.1) was uploaded to the Sealsplatform: http://www.seals-project.eu/ . More information can be found at CIDER-CL’swebsite http://www.oeg-upm.net/files/cider-cl .
6 http://www.cs.waikato.ac.nz/ml/weka/7 http://secondstring.sourceforge.net/8 http://www.monnet-project.eu/9 https://github.com/kasooja/clesa
1.5 Link to the set of provided alignments (in align format)
The resultant alignments will be provided by the Seals platform: http://www.seals-project.eu/
2 Results
For OAEI’13 campaign, CIDER-CL participated in all the Seals-based tracks10. In thefollowing, we report the results of CIDER-CL for benchmark, conference, anatomy, andmultifarm tracks. For the other tracks, the system was not fit for the type of evaluation(e.g., interactive track) or could not complete the task (e.g., library). Details about thetest ontologies, the evaluation process, and the complete results for all tracks can befound at the OAEI’13 website11.
2.1 Benchmark
This year, a blind test set was generated based on a seed ontology of the bibliographicdomain. Out of the 21 systems participating in this track, CIDER-CL was within thethree best systems in terms of F-measure. In particular, the obtained results were:
Precision(P)=0.85, Recall(R)=0.67 and F-Measure(F)=0.75
Compare to the F=0.41 of edna, a simple edit distance-based baseline. In addition,confidence-weighted measures were also computed for those systems that provided aconfidence value. In almost all cases the results were worse, as it was also the case ofCIDER-CL: P=0.84, R=0.55, and F=0.66
Also the time spent in the evaluation was calculated. CIDER-CL took 844±19 sec-onds, which was slower than most of the systems (the median value was 173 sec) al-though still far from the slowest one (10241±347 sec).
2.2 Conference
In this track, several ontologies from the conference domain were matched, resultingin 21 alignments. In this case the organisers explored different thresholds and selectedthe best achievable results. This test is not blind and the participants have the referencealignments at their disposal before the evaluation phase.
Two reference alignments were used in this track: the original reference alignment(ra1) and its transitive closure (ra2). Two baselines (edna and string equivalence) werecomputed for comparison. Notice that the results for CIDER-CL in this track are merelyillustrative and should not be taken as a proper test, due to the fact that part of the train-ing data of its neural networks came from the conference track reference alignments(i.e., training and test data coincide partially).
Out of the 25 systems participating in this track (some of them were variations ofthe same system), CIDER-CL performance was close to the average. The results were:10 http://oaei.ontologymatching.org/2013/seals-eval.html11 http://oaei.ontologymatching.org/2013

test ra1 (original): P = 0.75, R = 0.47, and F = 0.58 with threshold= 0.14test ra2 (entailed): P = 0.72, R = 0.44, and F = 0.55 with threshold= 0.08
CIDER-CL was in the group of systems that performed better than the two base-lines for ra2 and between the two baselines for ra1. The results for ra1 illustrates animprovement with respect to the results obtained by its previous version (CIDER v0.4)for the same test at OAEI’11 (F=0.53). The runtime was also registered: CIDER-CLtook less than 10 minutes for computing the 21 alignments. The other systems rangedfrom 1 minute to more than 40.
2.3 Anatomy
This year, the current version of CIDER-CL completed the task and gave results for thefirst time. In fact, in previous editions of OAEI, CIDER gave time-outs and the tool didnot finish the task, due to the big size of the involved ontologies. The results are:
P = 0.65, R = 0.73, F = 0.69, R+ = 0.31
These results are below the average of the overall results (F-Measure ranging from0.41 to 0.94, with a median value of 0.81). An “extended recall” (R+) was also com-puted, that is, the amount of detected non-trivial correspondences (that do not have thesame normalized label). For this metric CIDER-CL behaved better than the medianvalue (0.23). In terms of running time, CIDER-CL was the third slowest system (12308sec) in this track, after discarding those that gave time-out.
2.4 Multifarm
This track is based on the alignment of ontologies in nine different languages: EN, DE,ES, NL, CZ, RU, PT, FR, and CN. All pairs of languages (36 pairs) were considered inthe evaluation. A total of 900 matching tasks were performed. There were 21 partici-pants in this track, 7 of them implementing specific cross-lingual modules as it was thecase of CIDER-CL.
The organisers divided the results in two types: comparisons between different on-tologies (type i) and comparisons between the same ontologies (type ii). The result sum-mary published by the organisers aggregates the individual results for all the languagepairs. In the case of CIDER-CL this hampers direct comparisons with other systems,owing to the fact that CIDER-CL only covers a subset of languages (EN, DE, ES, NL)and non produced alignments in other languages penalised the overall results. For thisreason we have filtered the language specific results to consider only such subset oflanguages. The averaged results for CIDER-CL are:
type i (different ontologies): P = 0.16, R = 0.19, F = 0.17type ii (same ontologies): P = 0.82 , R = 0.16, F = 0.26
For type ii, CIDER-CL got the 4th best result overall in terms of F-Measure andthe 3rd best result in the set of systems implementing specific cross-lingual techniques(the results for such systems ranged from F = 0.12 to F = 0.44 for the referred subset of

languages). On the other hand, for type i CIDER-CL was in 8th position out of the 21participants, although in the last place among the set of systems implementing cross-lingual techniques (F-measure of the other techniques ranged from 0.17 to 0.35).
3 General comments
The following subsections contain some remarks and comments about the results ob-tained and the evaluation process.
3.1 Comments on the results
CIDER-CL obtained good results for the benchmark track (third place out of 21 par-ticipants). This shows that our system performs well for domains in which the systemcould be trained with available reference data. Also that SoftTFIDF is suitable for on-tology matching. In contrast, the results for the anatomy track were relatively poor. Thisshows that creating a general purpose aligner based on our technique is not immediate.Adding more training data from other domains would help to solve this.
The results from the multilingual track are rather modest, but the fact that even thebest systems scored low illustrates the difficulty of the problem. We consider that theuse of CL-ESA is promising for cross-lingual matching, but it will require more studyand adaptation to achieve better results.
3.2 Discussions on the way to improve the proposed system
More reference alignments from “real world” ontologies will be used in the future fortraining the ANNs, in order to cover more domains and different types of ontologies.Regarding the cross-lingual matching, there is still room for continuing improving theuse of CL-ESA to that end. We plan also to combine this novel technique with otherones such as machine translation.
Time response in CIDER-CL is still an issue and has to be further improved. Infact CIDER-CL works well with small and medium sized ontologies but not with largeones. Partitioning and other related techniques will be explored in order to solve this.
3.3 Comments on the OAEI 2013 test cases
The variety of tracks and the improvements introduced along the years makes thecampaign very useful to test the performance of ontology aligners and analyse theirstrengths and weaknesses. Nevertheless, we miss blind tests cases in more tracks, whichwould allow a fair comparison between systems.
4 Conclusion
CIDER-CL is a schema-based alignment system that compares the ontological contextof each pair of terms in the aligned ontologies. Several elementary comparisons are

computed and combined by means of artificial neural networks. Monolingual and cross-lingual metrics are used in the matching.
We have presented here some results of the participation of CIDER-CL at OAEI’13campaign. The results vary depending on the track, from the good results in the bench-mark track to the relatively limited behaviour in anatomy, for instance. We confirmedthat the proposed technique, based on ANNs, is suitable in conjunction with SoftTFIDFmetric for monolingual ontology matching. The use of CL-ESA metric for cross-lingualmatching is promising but requires more study.
Acknowledgments. This work is supported by the Spanish national project BabeLData(TIN2010-17550) and the Spanish Ministry of Economy and Competitiveness withinthe Juan de la Cierva program.
References
1. C. Bizer, J. Lehmann, G. Kobilarov, S. Auer, C. Becker, R. Cyganiak, and S. Hellmann.DBpedia - a crystallization point for the web of data. Web Semantics: Science, Services andAgents on the World Wide Web, 7(3):154–165, Sept. 2009.
2. P. Cimiano, A. Schultz, S. Sizov, P. Sorg, and S. Staab. Explicit versus latent concept mod-els for cross-language information retrieval. In Proceedings of the 21st international jontconference on Artifical intelligence, IJCAI’09, pages 1513–1518, San Francisco, CA, USA,2009. Morgan Kaufmann Publishers Inc.
3. W. W. Cohen, P. Ravikumar, and S. E. Fienberg. A comparison of string distance metrics forname-matching tasks. In Proc. Workshop on Information Integration on the Web (IIWeb-03)@ IJCAI-03, Acapulco, Mexico, pages 73–78, Aug. 2003.
4. J. Euzenat. An API for ontology alignment. In 3rd International Semantic Web Conference(ISWC’04), Hiroshima (Japan). Springer, November 2004.
5. J. Euzenat and P. Shvaiko. Ontology matching. Springer-Verlag, 2007.6. E. Gabrilovich and S. Markovitch. Computing semantic relatedness using wikipedia-based
explicit semantic analysis. In In Proceedings of the 20th International Joint Conference onArtificial Intelligence, pages 1606–1611, 2007.
7. J. Gracia, J. Bernad, and E. Mena. Ontology matching with CIDER: Evaluation report forOAEI 2011. In Proc. of 6th Ontology Matching Workshop (OM’11), at 10th InternationalSemantic Web Conference (ISWC’11), Bonn (Germany), volume 814. CEUR-WS, Oct. 2011.
8. V. V. Raghavan and M. S. K. Wong. A critical analysis of vector space model for informationretrieval. Journal of the American Society for Information Science, 37(5):279–287, 1986.
9. M. Smith. Neural Networks for Statistical Modeling. John Wiley & Sons, Inc., New York,NY, USA, 1993.
10. P. Sorg and P. Cimiano. Exploiting wikipedia for cross-lingual and multilingual informationretrieval. Data Knowl. Eng., 74:26–45, Apr. 2012.
11. W. E. Winkler. String comparator metrics and enhanced decision rules in the Fellegi-Suntermodel of record linkage. In Proceedings of the Section on Survey Research, pages 354–359,1990.
CroMatcher - Results for OAEI 2013
1, Boris Vrdoljak2
1 Faculty of Maritime Studies, Rijeka, Croatia [email protected]
2 Faculty of Electrical Engineering and Computing, Zagreb, Croatia [email protected]
Abstract. CroMatcher is an ontology matching system based on terminological and structural matchers. The most important part of the system is automated weighted aggregation of correspondences produced by using different basic ontology matchers. This is the first year CroMatcher has been involved in the OAEI campaign. The results obtained this year will certainly help in finding and resolving shortcomings in the system before the next campaign.
1 Presentation of the system
CroMatcher is an automatic ontology matching system for determining correspondences between entities of two different ontologies. There are several terminological and structural basic matchers in CroMatcher. The system is based on a weighted aggregation that automatically determines the importance of each basic matcher according to the produced correspondences. As this is the first time the CroMatcher has taken part in the OAEI campaign, CroMatcher is fully prepared only for benchmark test set.
1.1 State, purpose, general statement
CroMatcher is a system that executes several basic matchers and then aggregates the results obtained by these matchers. The system does not use any external resource. After the execution of terminological basic matchers, the automatic weighted aggregation is executed. The results of certain terminological basic matcher are included into the common results depending on their importance. The importance of certain basic matcher is determined automatically within weighted aggregation. Then, the several iterative structural matchers are executed (e.g. if the child entities are similar, the parent entities are similar too). To find correspondences with structural matchers, the common results of terminological matchers are used. After the execution of structural basic matchers, the automatic weighted aggregation is executed too. At the end of matching process, the weighted aggregation is executed for the terminological and structural common results. Finally, the method of final alignment (choosing the relevant correspondences between entities of two ontologies) is executed. This method iteratively takes the best correspondences between two

certain entities into the final alignment. Each entity can be related just to one entity of other ontology.
1.2 Specific techniques used
In this section, the main components of the CroMatcher will be described in details. The workflow and the main components of the system can be seen in the Fig. 1. The CroMatcher consists of the following components:
1. Data extraction from ontologies - the information of every entity is extracted from given ontologies. After extraction of all data about certain entity, all textual data is normalized by tokenizing into set of tokens, and removing stop words.
Data extraction fromontologies Terminological matchers
Autoweighted aggregation(aggregated correspondencesof terminological matchers)
Structural matchers
Autoweighted aggregation(final aggregation)
Autoweighted aggregation(aggregated correspondences
of structural matchers)
Finalalignment
Parallel composition
Parallel composition
Fig. 1. The workflow and the main components of the Cromatcher
2. Terminological matchers:
properties) with the bi(tri)gram matcher (tests how many bi(tri)grams, i.e. (substrings of length 2, 3) are the same within two names, e.g. FTP and FTPServer have 2 bigrams - FT and TP) [1]
does not have label) of two entities (classes or properties) with the bi(tri)gram matcher
Matcher that compares textual profiles of two entities with TF/IDF [2] and cosine similarity [3]. A profile of class entity contains annotations of actual class entity (and all sub classes) and annotations of every property whose domain is actual class. A profile of property entity contains annotations of actual property entity and all sub properties.

Matcher that compares individuals of two entities with TF/IDF and cosine similarity. An individual of class entity contains individual values of actual class entity and individual values of all subclasses. An individual of property entity contains individual values of its range class entities.
Matcher that compares extra individuals of two entities with TF/IDF and cosine similarity. An extra individual of class entity contains individual values of first super class of actual class entity. An extra individual of property entity contains individual values of its domain and range class entities.
Matcher that compares some general data about the entities. A general data of class entity contains number of object (data) properties, number of restrictions and number of sub (super) class entities. A general data of property entity contains number of sub (super) property entities, number of domain class entities. More similar the general data, there is the greater correspondence between entities.
3. Structural matchers: Matcher that compares the similarity between super entities (classes or
properties) of currently compared entities. If the super entities are similar, compared entities are similar too. The matcher is executed iteratively and it ends when the correspondence value of compared entities stops changing. In each step, the new correspondence value of compared entities is calculated by summing 50% of the previous similarity value and 50% of the similarity value between super entities.
Matcher that compares the similarity between sub entities (classes or properties) of currently compared entities. If the sub entities are similar, the compared entities are similar too. The matcher is executed iteratively and it ends when the correspondence value of compared entities stops changing. In each step, the new correspondence value of compared entities is calculated by summing 50% of the previous similarity value and 50% of the similarity value between sub entities.
Matcher that compares the similarity between properties (and its range classes) that have the currently compared classes as their domain. A part of matcher for similarity between properties compares domain classes of properties.
Matcher that compares the similarity between range classes of currently compared properties.
4. Autoweighted aggregation for parallel composition of basic matchers: After the execution of terminological and structural matchers, the results of these
matchers have to be aggregated together. In our system, we used a parallel composition of matchers for integration of multiple matchers. The main problem in parallel composition is how to aggregate the results obtained by every basic matcher. Weighted aggregation is one of the methods for aggregation of matchers [4]. This method determines a weighted sum of similarity values of the basic matchers and needs relative weights which should correspond to the expected importance of the basic matchers. The problem is how to determine the importance of every basic matcher. Our automatic Autoweight method proposed in [5] automatically defines the importance of various basic matchers in order to improve overall performance of the matching system. In this method, the importance of certain basic matcher is specified

by determining the importance of individual best correspondences (greatest correspondences between two entities in both directions of mapping, as those correspondences are the most relevant) within the results obtained by that matcher. The importance of a certain correspondence found within the results of a basic matcher is higher when the same correspondence is found within a smaller number of other basic matchers. The method that finds the same correspondences as all other methods does not provide any new significant information for the matching process.
5. Process of final alignment: At the end, the selection of relevant correspondences, for inclusion in the final
alignment, is executed iteratively. The final alignment includes only the greatest correspondences between entity1i (first ontology) and entity2j (second ontology). A correspondence between entity1i and entity2j is the greatest correspondence only if it has the greatest value among all correspondences in which the entity1i (or entity2j) is included. Threshold for these greatest correspondences is set to 0.15. We consider that this threshold is sufficient because the final alignment included only those correspondences that are the greatest for both compared entities.
1.3 Link to the system and parameters file
A system can be downloaded from the http://www.seals-project.eu (tool identifier: e0fe95d5-943e-4652-bc53-5b36b712c9cb, version: 1.0).
2 Results
In this section, the evaluation results of CroMatcher matching system executed on the SEALS platform are presented.
2.1 Benchmark
In OAEI 2013, benchmark includes one blind test (biblio). In Table 1 the result obtained by running the CroMatcher ontology system can be seen.
Test set Recall Precision F-Measure Time (s) Benchmark 0.82 0.95 0.88 1114
Table 1. CroMatcher result for benchmark track
2.2 Anatomy, conferences, multifarm, library, large biomedical ontologies and instance matching
This is the first year CroMatcher has been involved in the OAEI campaign and the focus was on benchmark track. Therefore, the system had problems with other tracks because we did not manage to test the system for other tracks before the evaluation due the lack of time. This year, the ontology matching system had to finish matching
the anatomy ontologies within 10 hours, and our system has not finished even after 30 hours therefore we need to speed up the system before the next OAEI campaign. In the conference track, our system was partially evaluated because it could not process several ontologies. In the multifarm, library, large biomedical ontologies, our system
next evaluation. Regarding the instance matching, we did not participate in this track.
3 General comments
As we stated before, this is the first time the CroMatcher system participates in the OAEI campaign. We are very pleased that our ontology matching system was evaluated on the SEALS platform because this way we could compare our system with existing systems. There are many different test cases and we think that these test cases will help us to improve our system in the future.
3.1 Comments on the results
Our system shows great results in benchmark track. Considering the fact that the benchmark track contains the largest number of ontologies in which the different parts are missing, we can conclude that our system performs well but only while matching small ontologies like these in the benchmark track. While matching big ontologies (thousands of entities), our system is quite slow and it cannot handle big ontologies yet.
3.2 Discussions on the way to improve the proposed system
We will have to find faster measure than TF/IDF to compare different documents of entities. Also, we will have to store the data about the entities in a separate file instead in the java objects in order to reduce the usage of memory in the system.
4 Conclusion
The CroMatcher ontology matching system and its results of evaluation on different OAEI track were presented in this paper. The evaluation results show that CroMatcher successfully matches small ontologies but it has problems dealing with ontologies that have a large number of entities. We will try to solve this problem and prepare the system to be competitive in all OAEI tracks next year.
References
1. Euzenat, J., Shvaiko, P.: Ontology matching. Springer, 2007.

2. Salton, G., McGill, M.H.: Introduction to Modern Information Retrieval. McGraw-Hill, New York (1983)
3. Baeza-Yates, R., Ribeiro-Neto B.: Modern Information Retrieval. Addison-Wesley, Boston (1999)
4. Do, H., Rahm, E.: COMA - a system for flexible combination of schema matching approaches. In Proc. 28th International Conference on VLDB, pages 610-621, 2002.
5Matchers in Ontology Matching Process. In: Barriocanal, E. G., Cebeci, Z., Okur, M. C., Öztürk, A. (eds.) MTSR 2011. Communications in Computer and Information Science, vol. 240, pp. 22-33. Springer, Berlin Heidelberg (2011)

IAMA Results for OAEI 2013
Yuanzhe Zhang1, Xuepeng Wang1, Shizhu He1,Kang Liu1, Jun Zhao1, and Xueqiang Lv2
1 Institute of Automation, Chinese Academy of Sciences, China{yzzhang, xpwang, shizhu.he, kliu, jzhao}@nlpr.ia.ac.cn2 Beijing Key Laboratory of Internet Culture and Digital Dissemination Research
Abstract. This paper presents the results of IAMA on OAEI 2013. IAMA (Insti-tute of Automation’s Matcher) is an ontology matching system with the capabilityto deal with large scale ontologies. IAMA is designed to find out the correspon-dences between two ontologies by using multiple similarity measures. Candidatefiltering technique is adopted when processing ontologies at large scale.
1 Presentation of the system
1.1 State, purpose, general statement
Large amount of ontologies has been published since the semantic web emerged. How-ever, managing the heterogeneity among various ontologies is still a problem [1]. Forexample, many ontologies describe the same entity (i.e., class or property) using dif-ferent terminologies, while the entities having the same name belonging to differentontologies may refer to disparate objects. Finding the matching between different on-tologies is still challenging. Ontology matching, as a solution to the aforementionedproblem, has received great interests in these years.
The principal goal of IAMA is to discover equivalent entities rapidly between d-ifferent ontologies. We use efficient terminology matching techniques and do not turnto any external resource at this stage. IAMA is able to match classes and propertiesof two input ontologies. The system could achieve qualified results, though neglectingthe structural information. The Matching process takes little time to cope with smallontologies. When processing large scale ontologies, IAMA could still, with the help ofcandidate filtering, yield the alignment in reasonable time. We tend to make an universaland extensible system, so more matching methods could be conveniently incorporatedin the future.
1.2 Specific techniques used
IAMA employs various similarity measures to take advantage of the available informa-tion in the ontologies. The entities in two ontologies are pairwise compared, and lexicalsimilarities and structural similarities are calculated respectively. In the current version,only 1:1 alignment is considered.

Let O1 and O2 denote the two input ontologies, and e1 is an entity in O1. Each enti-ty e2 in O2 has a similarity with e1 indicated as sim(e1, e2). We are able to find out themaximum value as sim(e1, e). If sim(e1, e) is greater than a predetermined thresholdt1, entity pair (e1, e) will be added to the alignment. In the following paragraphs, wewill present the used similarity measures in our system.
Lexical SimilarityThe system extracts local names, labels, and comments of the entities in the two
input ontologies as lexical features. For most situations, the lexical information is ef-fective.
Local Name similarity measures the similarity between the names of two entities.We get rid of the spaces and other punctuations because the entity name is comprisedof multiple words or contains hyphens at times. All the letters are turned to lower casesimultaneously. Label Similarity measures the similarity between the labels. Not all theentities have labels, and many entities have a label exactly the same as its local name.Comment Similarity measures the similarity between the comments. A comment of anentity is usually a brief descriptive sentence, which is helpful when the two ontologiesname their entities with quite different style. Both labels and comments are processedas local names, thereby treated as a single word.
IAMA uses Levenshtein [2] distance, which is proved competent in [3], to calculatelexical similarities. For the three lexical similarities mentioned above, we do not takethem equally. Each similarity is assigned a weight intuitively. Local name similarity hasa greater weight than label similarity, while comments similarity has the lowest weight.
Individual SimilarityBetween the classes that have individuals, Individual Similarity is additionally cal-
culated. The names of individuals that belong to a class are extracted to a set of string.Assume S1 and S2 are two sets, then the similarity between them is computed as fol-lows:
sim(S1, S2) = 2× #(S1 ∩ S2)
#S1 +#S2(1)
For example, if c1 is a class in ontology O1, and c2 is a class in ontology O2. The namesof the individuals belonging to c1 is a set of string i1 = {s1, s2, s3}, and similarly weget i2 = {s2, s3, s4, s5}. The individual similarity simi(c1, c2) is:
simi(c1, c2) = 2× #(i1 ∩ i2)
#i1 +#i2= 2× 2
3 + 4= 0.571
IAMA adopts the maximum value of all the similarities as the final similarity ofthe entity pair. It is worth noting that other similarities such as superclass similarity,subclass similarity, domain similarity and range similarity are also tested in our earli-er attempts. But they contributed little considering the time increased. They could beadded easily if needed, which makes IAMA extensible.
Candidate Filtering
Pairwise compare is time consuming. In most cases, calculating similarities for ev-ery entity pair is unnecessary. Candidate Filtering helps to find out a few promisingentity pairs in advance, thus saving running time dramatically.
Assume the two input ontologies are O1 and O2, and O2 has more entities thanO1. For each entity in O1, we attempt to find out potential entities in O2 to constructa candidate set. The idea is implemented as follow. First, the lexical information inthe bigger ontology O2, namely name, label and comment is tokenized and indexedby Lucene3. Second, we construct search query for each entity in O1. For instance,the lexical information of an entity in O1 is ”Reference”, ”Reference”, ”Base class forall entries”. We split it into index tokens, and every single token is searched in theconstructed index, yielding top-k entities as a candidate set. Last, our system calculatesthe final similarity values pairwise.
The time used for indexing and searching is acceptable. For large input ontologies,candidate filtering improves the matching speed substantially. Take anatomy track forexample, the difference can be seen in Table 1. The experiment is conducted on a com-puter with 4.7GHz Intel i5 CPU (4 core) and 8GB RAM.
Precision F-Measure Recall Runtime (ms)IAMA without candidate filtering 0.994 0.719 0.563 117,503
IAMA with candidate filtering 0.995 0.713 0.555 5,376
Table 1. The impact of candidate filtering in Anatomy track
Candidate filtering could still miss some potential entity pairs though negligible.IAMA defined an alterable trigger threshold t2, which is set to 500 empirically. Onlyboth the two ontologies have more than 500 entities, candidate filtering is employed.
1.3 Adaptations made for the evaluation
There are two key parameters in IAMA (i.e., t1 and t2). Specifically, if the final similar-ity of an entity pair is greater than t1, the pair will be added to the alignment. t2 is thetrigger threshold of candidate filtering component as mentioned before. In the versionto participate in OAEI 2013, t1 is set to 0.9 and t2 is set to 500.
1.4 Link to the system and parameters file
The latest version of IAMA can be seen on https://github.com/YuanzheZhang/IAMA.
2 Results
This section presents the results of IAMA achieved in OAEI 2013. Our system mainlyfocuses on benchmark, anatomy, conference, and large biomedical ontologies. We donot provide multilingual support for the moment.
3 http://lucene.apache.org

2.1 benchmark
The goal of the benchmark data set is to provide a stable and detailed picture of eachalgorithm[4]. The benchmark test library consists of several test suits. The test suitesare generated from the usual bibliography ontology this year, and they are blind toparticipants. Table 2 shows the results of benchmark track. Pt F-m./s means the averageF-measure point provided per second.
Precision F-Measure Recall Time (s) pt F-m./s0.99 0.73 0.57 102 0.72
Table 2. Results for Benchmark track
Our system acquired its best results in this track. Concerning F-measure, IAMA rankedfourth in the 21 systems. The comparison with other top systems is shown in Table 3
System Precision F-Measure Recall Time (s) pt F-m./sYAM++ 0.97 0.89 0.82 702 0.13
CroMatcher 0.95 0.88 0.82 1,114 0.08CIDER-CL 0.85 0.75 0.67 844 0.09
IAMA 0.99 0.73 0.57 102 0.72ODGOMS 0.99 0.71 0.55 100 0.71
Table 3. Comparison with other top systems in Benchmark track
2.2 anatomy
The task of anatomy track is to find the alignment between the Adult Mouse Anatomyand a part of the NCI Thesaurus. These two ontologies describe the mouse anatomy andthe human anatomy respectively. The results of our system on anatomy are shown inTable 4.
Runtime Size Precision F-Measure Recall Recall Coherent10 845 0.996 0.713 0.555 0.014 -
Table 4. Results for Anatomy track
Since both the two ontologies have the scale larger than 500 entities, candidate filteringis employed. As a result, IAMA finishes this track in 10 seconds. Only two system-s are faster than IAMA. The simple use of lexical similarity generates mostly trivialcorrespondences, leading the low recall+ measure.
2.3 conference
Conference track contains sixteen ontologies from the conference organization domain.There are two versions of reference alignment. The original reference alignment is la-beled as ra1, and the new reference alignment, generated as a transitive closure com-puted on the original reference alignment, is labeled as ra2. Table 5 shows the resultsof our system in this track.
Precision F-Measure Recallra1 0.78 0.59 0.48ra2 0.74 0.55 0.44
Table 5. Results for Conference track
IAMA finishes the conference track in 53 seconds. Candidate filtering has not beenactivated.
2.4 multifarm
The MultiFarm data set contains ontologies in eight different languages. These ontolo-gies are translated from conference track. IAMA does not design a multilingual methodspecifically, thus obtained relatively poor results. We managed to utilize language detec-tion and translation API. Unfortunately, it increased the processing time of our systemand led to other problems. In the next version, IAMA will adopt specialized method todeal with multilingual ontologies. The results are presented in Table 6.
Average Precision Average F-Measure Average Recall0.30 0.05 0.03
Table 6. Results for MultiFarm track
2.5 library
The task of library track is to match two real-world thesaurus, namely STW and TheSoz.IAMA does not provide particular method aiming at this track. The results can be seenin Table 7. IAMA does not apply particular method for this track.

Precision F-Measure Recall0.78 0.04 0.08
Table 7. Results for Library track
2.6 large biomedical ontologies
Large Biomedical track challenges matching tools by offering large scale ontologies.The task of this track is to find alignments between Foundational Model of Anatomy(FMA), SNOMED CT, and the National Cancer Institute Thesaurus (NCI). IAMA fin-ishes the task in reasonable time owe to the use of candidate filtering. Table 8 shows theresults.
Task 1: Small FMA and NCI fragmentsP F R #Mappings Runtime (s)
0.979 0.733 0.585 1,751 14Task 2: Whole FMA and NCI ontologies
P F R #Mappings Runtime (s)0.901 0.708 0.582 1,894 139
Task 3: Small FMA and SNOMED fragmentsP F R #Mappings Runtime (s)
0.962 0.236 0.134 1,250 27Task 4: Whole FMA and SNOMED ontologies
P F R #Mappings Runtime (s)0.749 0.227 0.134 1,600 218
Task 5: Small SNOMED and NCI fragmentsP F R #Mappings Runtime (s)
0.965 0.604 0.439 8,406 99Task 6: Whole SNOMED and NCI ontologies
P F R #Mappings Runtime (s)0.917 0.593 0.439 8,843 207
Table 8. Results for Large Biomedical track
IAMA is one of the fifteen systems that are able to complete all six tasks, andprovides the best results in terms of precision in task 1 and task 2. Furthermore, oursystem finishes all the tasks in 704 seconds, only slower than LogMapLt (371 seconds).The average results are shown in Table 9.

Precision F-Measure Recall Incoherence Total time (s)0.912 0.517 0.386 46.4% 704
Table 9. The average results for Large Biomedical track
3 General comments
3.1 Comments on the results
IAMA achieved qualified results in its first participation in OAEI. The results for bench-mark, conference, and large biomedical track is better. Since the system does not designspecific method to handle MultiFarm and library track, the results are relatively poor. Itis evident that IAMA got relatively high precision but low recall. The reason is that thethreshold t1 is fixed to a high value of 0.9. Candidate filtering, as already mentioned,cuts down the recall as well.
3.2 Discussions on the way to improve the proposed system
IAMA remains much to be improved. First, the system does not take advantage ofstructural information, which is beneficial when lack of lexical information. We triedto calculate structural similarity like subclass similarity and superclass similarity, butdid not receive expected results. The hierarchy information is also remained to be ex-ploited. Second, predetermining all the parameters loses the flexibility. The influenceof parameter t1 can be seen in Table 10. The experiment is conducted on a computerwith 4.7GHz Intel i5 CPU (4 core) and 8GB RAM. A self-adjust mechanism is to beemployed in the future. Third, the system lacks the ability to match ontologies in dif-ferent languages. The next version will support multi-language inputs. We expect theoptimized system would become an eligible universal ontology matching system.
Precision F-Measure Recallt1=0.7 0.800 0.752 0.710t1=0.8 0.945 0.783 0.668t1=0.9 0.995 0.719 0.563
Table 10. Impact of parameter t1 in anatomy track (without candidate filtering)
4 Conclusion
This paper has reported the results of IAMA in OAEI 2013. The results reflect thatIAMA has the ability to deal with a majority of ontologies, including large ones. Onthe other hand, for those disadvantages exposed, we discuss the possible solutions. Byand large, IAMA achieved reasonable results for its first participation in OAEI, and itis promising to be much improved in the future.
Acknowledgement
This work was supported by the National Natural Science Foundation of China (No.61070106,61272332,61202329) and the Opening Project of Beijing Key Laboratory ofInternet Culture and Digital Dissemination Research(ICDD201201).
References
1. P Shvaiko and Jerome Euzenat. Ontology matching: State of the art and future challenges.Knowledge and Data Engineering, IEEE Transactions on, (99), 2012.
2. Vladimir I Levenshtein. Binary codes capable of correcting deletions, insertions and reversals.In Soviet physics doklady, volume 10, page 707, 1966.
3. Giorgos Stoilos, Giorgos Stamou, and Stefanos Kollias. A string metric for ontology align-ment. In The Semantic Web–ISWC 2005, pages 624–637. Springer, 2005.
4. Jose Luis Aguirre, Bernardo Cuenca Grau, Kai Eckert, Jerome Euzenat, Alfio Ferrara,Robert Willem van Hague, Laura Hollink, Ernesto Jimenez-Ruiz, Christian Meilicke, An-driy Nikolov, et al. Results of the ontology alignment evaluation initiative 2012. In Proc. 7thISWC workshop on ontology matching (OM), pages 73–115, 2012.

LogMap and LogMapLt results for OAEI 2013
Ernesto Jimenez-Ruiz, Bernardo Cuenca Grau, Ian Horrocks
Department of Computer Science, University of Oxford, Oxford, UK
Abstract. We present the results obtained in the OAEI 2013 campaign by our on-tology matching system LogMap and its ‘lightweight” variant called LogMapLt.The LogMap project started in January 2011 with the objective of developing ascalable and logic-based ontology matching system. This is our fourth participa-tion in the OAEI and the experience has so far been very positive.
1 Presentation of the system
LogMap [11, 12] is a highly scalable ontology matching system with built-in reasoningand inconsistency repair capabilities. LogMap also supports (real-time) user interactionduring the matching process, which is essential for use cases requiring very accuratemappings. LogMap is one of the few ontology matching system that (1) can efficientlymatch semantically rich ontologies containing tens (and even hundreds) of thousandsof classes, (2) incorporates sophisticated reasoning and repair techniques to minimisethe number of logical inconsistencies, and (3) provides support for user interventionduring the matching process. LogMap is also available as a “lightweight” variant calledLogMapLt, which essentially only applies (efficient) string matching techniques.
LogMap relies on the following elements, which are keys to its favourable scalabil-ity behaviour (see [11, 12] for details).
Lexical indexation. An inverted index is used to store the lexical information containedin the input ontologies. This index is the key to efficiently computing an initial set ofmappings of manageable size. Similar indexes have been successfully used in informa-tion retrieval and search engine technologies [4].
Logic-based module extraction. The practical feasibility of unsatisfiability detectionand repair critically depends on the size of the input ontologies. To reduce the size ofthe problem, we exploit ontology modularisation techniques. Ontology modules withwell-understood semantic properties can be efficiently computed and are typically muchsmaller than the input ontology (e.g. [7]).
Propositional Horn reasoning. The relevant modules in the input ontologies togetherwith (a subset of) the candidate mappings are encoded in LogMap using a Horn propo-sitional representation. Furthermore, LogMap implements the classic Dowling-Gallieralgorithm for propositional Horn satisfiability [8, 10]. Such encoding, although incom-plete, allows LogMap to detect unsatisfiable classes soundly and efficiently.
Axiom tracking and greedy repair. LogMap extends Dowling-Gallier’s algorithm totrack all mappings that may be involved in the unsatisfiability of a class. This exten-sion is key to implementing a highly scalable repair algorithm.

Semantic indexation. The Horn propositional representation of the ontology modulesand the mappings are efficiently indexed using an interval labelling schema [1] — anoptimised data structure for storing directed acyclic graphs (DAGs) that significantlyreduces the cost of answering taxonomic queries [6, 17]. In particular, this semanticindex allows us to answer many entailment queries over the input ontologies and themappings computed thus far as an index lookup operation, and hence without the needfor reasoning. The semantic index complements the use of the propositional encodingto detect and repair unsatisfiable classes.
1.1 Adaptations made for the 2013 evaluation
The new version of LogMap also integrates MORe [2, 3] as OWL 2 reasoner. MORe isa modular reasoner which combines a fully-fledged (and slower) reasoner with a profilespecific (and more efficient) reasoner.
LogMap’s algorithm described in [11–13] has also been adapted to meet the re-quirements of the new interactive matching track which uses an Oracle as expert user.
LogMap aims at making a reduced number of calls to the Oracle, i.e.: only thoseborderline mappings that cannot be clearly included or excluded with automatic heuris-tics. For each call to the Oracle, LogMap applies conflict and ambiguity based heuristics(see [12] for details) to reduce the remaining number of calls (i.e. mappings).
Additionally, the interactive algorithm described in [12] has been slightly extendedto include object and data properties in the process.
1.2 Link to the system and parameters file
LogMap is open-source and released under GNU Lesser General Public License 3.0.1
Latest components and source code are available from the LogMap’s Google code page:http://code.google.com/p/logmap-matcher/.
LogMap distributions can be easily customized through a configuration file contain-ing the matching parameters.
LogMap, including support for interactive ontology matching, can also be used di-rectly through an AJAX-based Web interface: http://csu6325.cs.ox.ac.uk/.This interface has been very well received by the community, with more than 900 re-quests processed so far coming from a broad range of users.
1.3 Modular support for mapping repair
Only very few systems participating in the OAEI 2013 competition implement repairtechniques. As a result, existing matching systems (even those that typically achievevery high precision scores) compute mappings that lead in many cases to a large numberof unsatisfiable classes.
We believe that these systems could significantly improve their output if they wereto implement repair techniques similar to those available in LogMap. Therefore, with
1 http://www.gnu.org/licenses/

Table 1: Results for Benchmark track.
Systembiblio 2012 bibliocP R F P R F
LogMap 1.00 0.47 0.64 0.73 0.42 0.53LogMapLt 0.95 0.50 0.66 0.43 0.50 0.46
Table 2: Results for Anatomy track.
System P R F Time (s)
LogMap 0.918 0.846 0.881 13LogMapLt 0.962 0.728 0.829 7
the goal of providing a useful service to the community, we have made LogMap’s ontol-ogy repair module (LogMap-Repair) available as a self-contained software componentthat can be seamlessly integrated in most existing ontology matching systems [14].
2 Results
In this section, we present a summary of the results obtained by LogMap and LogMapLtin the OAEI 2013 campaign. Please refer to http://oaei.ontologymatching.org/2013/results/index.html for complete results.
2.1 Benchmark track
Ontologies in this track have been synthetically generated. The goal of this track is toevaluate the matching systems in scenarios where the input ontologies lack importantinformation (e.g., classes contain no meaningful URIs or labels) [9].
Table 1 summarises the average results obtained by LogMap and LogMapLt. Notethat the computation of candidate mappings in LogMap and LogMapLt heavily relieson the similarities between the vocabularies of the input ontologies; hence, there is adirect negative impact in the cases where the labels are replaced by random strings.
2.2 Anatomy track
This track involves the matching of the Adult Mouse Anatomy ontology (2,744 classes)and a fragment of the NCI ontology describing human anatomy (3,304 classes). The ref-erence alignment has been manually curated [19], and it contains a significant numberof non-trivial mappings.
Table 2 summarises the results obtained by LogMap and LogMapLt. LogMap ranked3rd among the systems not using specialised background knowledge. Regarding map-ping coherence, only two tools (including LogMap) generated coherent alignments. Theevaluation was run on a server with 3.46 GHz (6 cores) and 8GB RAM.

Table 3: Results for Conference track.
SystemRA1 reference RA2 reference
Time (s)P R F P R F
LogMap 0.80 0.59 0.68 0.76 0.54 0.63 24LogMapLt 0.73 0.50 0.59 0.68 0.45 0.54 21
Table 4: Results for Library track.
System P R F Time (s)
LogMap 0.777 0.645 0.705 99LogMapLt 0.646 0.771 0.703 20
2.3 Conference track
The Conference track uses a collection of 16 ontologies from the domain of academicconferences [18]. These ontologies have been created manually by different people andare of very small size (between 14 and 140 entities). The track uses two reference align-ments RA1 and RA2. RA1 contains manually curated mappings between 21 ontologypairs, while RA2 also contains composed mappings based on the alignments in RA1.
Table 3 summarises the average results obtained by LogMap and LogMapLt. Thelast column represents the total runtime on generating all 21 alignments. Tests wererun on a laptop with Intel Core i5 2.67GHz and 8GB RAM. LogMap ranked 3rd andproduced coherent alignments.
2.4 Multifarm track
This track is based on the translation of the OntoFarm collection of ontologies into9 different languages [16]. Both LogMap and LogMapLt, as expected, obtained poorresults since they do not implement specific multilingual techniques.
2.5 Library track
The library track involves the matching of the STW thesaurus (6,575 classes) and theTheSoz thesaurus (8,376 classes). Both of these thesauri provide vocabulary for eco-nomic and social sciences. Table 4 summarises the results obtained by LogMap andLogMapLt. The track was run on a computer with one 2.4GHz core with 7GB RAMand 2 cores. LogMap ranked 5th in this track.
2.6 Interactive matching track
The interactive track is based on the conference track and it uses the RA1 referencealignment as Oracle. Table 5 summarizes the obtained results by LogMap with andwithout the interactive mode activated. LogMap with interactivity (LogMap-Int) im-proved both the average Precision and Recall wrt LogMap with the interactive mode
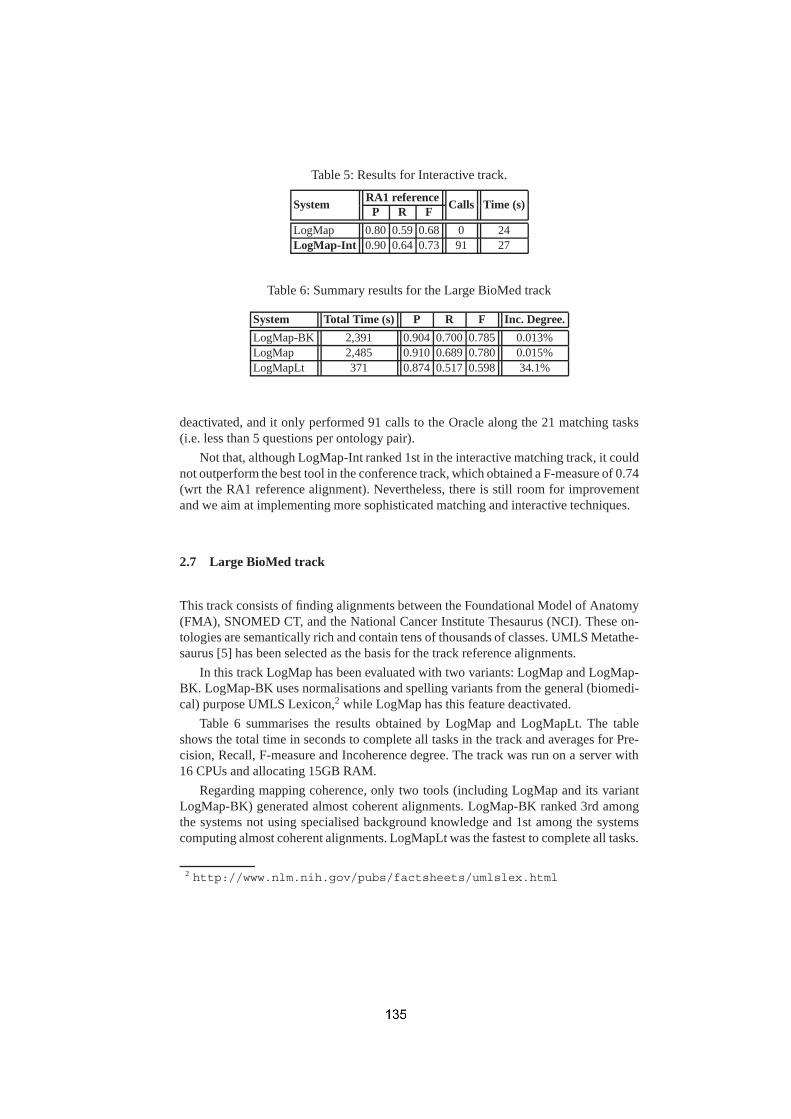
Table 5: Results for Interactive track.
SystemRA1 reference
Calls Time (s)P R F
LogMap 0.80 0.59 0.68 0 24LogMap-Int 0.90 0.64 0.73 91 27
Table 6: Summary results for the Large BioMed track
System Total Time (s) P R F Inc. Degree.
LogMap-BK 2,391 0.904 0.700 0.785 0.013%LogMap 2,485 0.910 0.689 0.780 0.015%LogMapLt 371 0.874 0.517 0.598 34.1%
deactivated, and it only performed 91 calls to the Oracle along the 21 matching tasks(i.e. less than 5 questions per ontology pair).
Not that, although LogMap-Int ranked 1st in the interactive matching track, it couldnot outperform the best tool in the conference track, which obtained a F-measure of 0.74(wrt the RA1 reference alignment). Nevertheless, there is still room for improvementand we aim at implementing more sophisticated matching and interactive techniques.
2.7 Large BioMed track
This track consists of finding alignments between the Foundational Model of Anatomy(FMA), SNOMED CT, and the National Cancer Institute Thesaurus (NCI). These on-tologies are semantically rich and contain tens of thousands of classes. UMLS Metathe-saurus [5] has been selected as the basis for the track reference alignments.
In this track LogMap has been evaluated with two variants: LogMap and LogMap-BK. LogMap-BK uses normalisations and spelling variants from the general (biomedi-cal) purpose UMLS Lexicon,2 while LogMap has this feature deactivated.
Table 6 summarises the results obtained by LogMap and LogMapLt. The tableshows the total time in seconds to complete all tasks in the track and averages for Pre-cision, Recall, F-measure and Incoherence degree. The track was run on a server with16 CPUs and allocating 15GB RAM.
Regarding mapping coherence, only two tools (including LogMap and its variantLogMap-BK) generated almost coherent alignments. LogMap-BK ranked 3rd amongthe systems not using specialised background knowledge and 1st among the systemscomputing almost coherent alignments. LogMapLt was the fastest to complete all tasks.
2 http://www.nlm.nih.gov/pubs/factsheets/umlslex.html

Table 7: Results for Instance matching track.
SystemRDFT
P R F
LogMap 0.922 0.746 0.812
2.8 Instance matching
This year only LogMap participated in the Instance Matching track. The dataset wasbased on dbpedia ontology3 and included controlled transformations in the data (i.e.value and structure transformations).
Table 7 summarises the average results obtained by LogMap. The results are quitepromising considering that LogMap does not implement sophisticated instance match-ing techniques. Furthermore, LogMap outperformed one of the participating tools spe-cialised in instance matching.
Adaptations to the original dataset The original provided dataset was preprocessedin order to be properly interpreted by the OWL API and to avoid inconsistencies whenreasoning. Next we summarise the performed changes:
– Added import of dbpedia: The dataset (ABOX) is based on dbpedia, however, thedbpedia ontology was not included as TBOX. Hence the OWL API was interpret-ing the instance entities of the dataset as “annotations” and not as “OWL namedindividuals”. Furthermore, by adding dbpedia TBOX to the datasets, an OWL 2reasoner could be used to infer the corresponding class type for each instance.
– Minor changes to dbpedia: The integration of the provided dataset (ABOX) anddbpedia (TBOX) resulted in an inconsistent knowledge base. The inconsistencieswere due to some data property assertion axioms pointing to the incorrect datatypeand a functional datatype property which was used in two or more data propertyassertion axioms with the same subject. To avoid these inconsistencies dbpedia wasslightly modified by removing the range and the functionality of the correspondingdata properties.
– Added additional object properties: The dataset also references the object proper-ties “curriculum”, “places” and “label” which are not included in the dbpedia ontol-ogy. Hence, these properties has been explicitly declared as OWL object properties.
– Removal of invalid characters: the dataset also included some characters that couldnot be processed by the OWL API and Protege (e.g. \u).
3 General comments and conclusions
3.1 Comments on the results
LogMap, apart from Benchmark and Multifarm tracks for which does not implementspecific techniques, has been one of the top systems in the OAEI 2013. Furthermore,
3 http://dbpedia.org/

it has also been one of the few systems implementing repair techniques and providing(almost) coherent mappings in all tracks.
LogMap’s main weakness relies on the fact that the computation of candidate map-pings is based on the similarities between the vocabularies of the input ontologies;hence, there is a direct negative impact in the cases where the ontologies are lexicallydisparate or do not provide enough lexical information (e.g. Benchmark and Multifarm).
3.2 Discussions on the way to improve the proposed system
LogMap is now a stable and mature system that has been made available to the commu-nity. There are, however, many exciting possibilities for future work. For example weaim at exploiting background knowledge to be competitive in the Multifarm track andto improve the performance in the other tracks.
3.3 Comments on the OAEI test cases
The number and quality of the OAEI tracks is growing year by year. However, there isalways room for improvement:
Comments on the OAEI instance matching track. I consider the 2012 IIMB InstanceMatching track more challenging, from the logical point of view, than the current task.The IIMB dataset included a TBOX and the controlled transformations also involvedchanges on the instance class types. Thus the application of logic based techniques hadan important impact since lexically similar instances belonging to two disjoint classtypes should not be matched.
Comments on the OAEI interactive matching track. The new interactive track has been avery important step forward in the OAEI, however, larger and more challengings tasksshould be included. For example, matching tasks (e.g. anatomy and largebio) wherethe number of questions to the expert user or Oracle may be critical. Furthermore, it isquite unlikely that the expert user will be perfect, thus, the interactive matching trackshould also consider the evaluation of several Oracles with different error rates such asthe evaluation performed in [12].
Comments on the OAEI largebio track. One of the objectives of the largebio track is thecreation of a “silver standard” reference alignment by harmonising the output of the dif-ferent participating systems. In the next OAEI campaign it would be very interesting toactively use this “silver standard” in the construction of the track’s reference alignment.
3.4 Comments on the OAEI 2013 measures
Although the mapping coherence is a measure already used in the OAEI we considerthat is not given yet the required weight in the evaluation. Thus, developers focus oncreating matching systems that maximize the F-measure but they disregard the impactof the generated output in terms of logical errors. As a result, even highly precise map-pings lead to a large number of unsatisfiable classes.
Thus, we encourage ontology matching system developers to develop their own re-pair techniques or to use state-of-the-art techniques such as Alcomo [15] and LogMap-Repair (see Section 1.3), which have shown to work well in practice [14].

Acknowledgements
This work was supported by the Seventh Framework Program (FP7) of the EuropeanCommission under Grant Agreement 318338, ”Optique”, the Royal Society, and theEPSRC projects Score!, ExODA and MaSI3.
References
1. Agrawal, R., Borgida, A., Jagadish, H.V.: Efficient management of transitive relationshipsin large data and knowledge bases. In: ACM SIGMOD Conf. on Management of Data. pp.253–262 (1989)
2. Armas Romero, A., Cuenca Grau, B., Horrocks, I.: MORe: Modular Combination of OWLReasoners for Ontology Classification. In: Int’l Sem. Web Conf. (ISWC). pp. 1–16 (2012)
3. Armas Romero, A., Cuenca Grau, B., Horrocks, I., Jimenez-Ruiz, E.: MORe: a ModularOWL Reasoner for Ontology Classification. In: OWL Reasoning Evaluation (ORE) (2013)
4. Baeza-Yates, R.A., Ribeiro-Neto, B.A.: Modern Information Retrieval. ACM Press /Addison-Wesley (1999)
5. Bodenreider, O.: The unified medical language system (UMLS): integrating biomedical ter-minology. Nucleic Acids Research 32, 267–270 (2004)
6. Christophides, V., Plexousakis, D., Scholl, M., Tourtounis, S.: On labeling schemes for theSemantic Web. In: Int’l World Wide Web (WWW) Conf. pp. 544–555 (2003)
7. Cuenca Grau, B., Horrocks, I., Kazakov, Y., Sattler, U.: Modular reuse of ontologies: Theoryand practice. J. Artif. Intell. Res. 31, 273–318 (2008)
8. Dowling, W.F., Gallier, J.H.: Linear-time algorithms for testing the satisfiability of proposi-tional Horn formulae. J. Log. Prog. 1(3), 267–284 (1984)
9. Euzenat, J., Rosoiu, M.E., dos Santos, C.T.: Ontology matching benchmarks: Generation,stability, and discriminability. J. Web Sem. 21, 30–48 (2013)
10. Gallo, G., Urbani, G.: Algorithms for testing the satisfiability of propositional formulae. J.Log. Prog. 7(1), 45–61 (1989)
11. Jimenez-Ruiz, E., Cuenca Grau, B.: LogMap: Logic-based and Scalable Ontology Matching.In: Int’l Sem. Web Conf. (ISWC). pp. 273–288 (2011)
12. Jimenez-Ruiz, E., Cuenca Grau, B., Zhou, Y., Horrocks, I.: Large-scale interactive ontologymatching: Algorithms and implementation. In: European Conf. on Artif. Intell. (ECAI). pp.444–449 (2012)
13. Jimenez-Ruiz, E., Grau, B.C., Horrocks, I.: LogMap and LogMapLt results for OAEI 2012.In: Proceedings of the 7th International Workshop on Ontology Matching (2012)
14. Jimenez-Ruiz, E., Meilicke, C., Cuenca Grau, B., Horrocks, I.: Evaluating mapping repairsystems with large biomedical ontologies. In: 26th Description Logics Workshop (2013)
15. Meilicke, C.: Alignment Incoherence in Ontology Matching. Ph.D. thesis, University ofMannheim (2011)
16. Meilicke, C., Castro, R.G., Freitas, F., van Hage, W.R., Montiel-Ponsoda, E., de Azevedo,R.R., Stuckenschmidt, H., Svab-Zamazal, O., Svatek, V., Tamilin, A., Trojahn, C., Wang, S.:MultiFarm: a benchmark for multilingual ontology matching. J. Web Sem. (2012)
17. Nebot, V., Berlanga, R.: Efficient retrieval of ontology fragments using an interval labelingscheme. Inf. Sci. 179(24), 4151–4173 (2009)
18. Svab, O., Svatek, V., Berka, P., Rak, D., Tomasek, P.: OntoFarm: towards an experimentalcollection of parallel ontologies. In: Int’l Sem. Web Conf. (ISWC). Poster Session (2005)
19. Zhang, S., Mork, P., Bodenreider, O.: Lessons learned from aligning two representations ofanatomy. In: Conf. on Princliples of Knowledge Representation and Reasoning (KR) (2004)

Summary of the MaasMatch participation in theOAEI-2013 campaign
Frederik C. Schadd, Nico Roos
Maastricht University, The Netherlands{frederik.schadd, roos}@maastrichtuniversity.nl
Abstract. This paper summarizes the results of the third participation of theMaasMatch system in the Ontology Alignment Evaluation Initiative (OAEI) com-petition. Several additions were made to the MaasMatch system with the intent ofrectifying its limitations, as observed during the previous OAEI campaign. Theextent of the additions and their effect on the individual dataset will be elaborated.
1 Presentation of the system
MaasMatch is a ontology mapping system with the initial focus of fully utilizing theinformation located in the concept names, labels and descriptions in order to produce amapping between two ontologies. This was achieved through the utilization of syntacticsimilarities and virtual documents, which can also be used as a disambiguation methodfor the improvement of lexical similarities [3,4]. The results of the benchmark trackin the OAEI 2012 competition [1] substantiated the evident conclusion that when thenaming and annotation features of an ontology are not present or distorted, the systemproduces unsatisfactory mappings. Several additions have been made to rectify thisissue, the details of which are presented in the next subsection.
1.1 Specific techniques used
The current version of MaasMatch utilizes a wider spectrum of similarity techniquesthan past versions. The overall setup in which these are used can be seen in Figure 1.
When given two input ontologies, these are parsed into an OWL format to allowfurther processing. For each configured similarity measure the pairwise similarities be-tween the ontology concepts are computed, which are then combined into a similaritycube. The different similarity values are then aggregated, such that these can be usedas initial vertex weights for the similarity flooding procedure [2]. The vertex weightsare propagated until they converge, with a limit of 10 iteration configured to deal withsituation where the values do not converge. However, in our own preliminary evalua-tions we found that on average only 4 iterations were needed until the values converged.Using the resulting vertex weights the results alignment is extracted.
The previous version of MaasMatch utilized four similarity measures which rely onthe names, labels and comments of the concept definitions. One of which is a syntacticalsimilarity (Jaccard), two a type of structural similarity (Name-Path, Virtual Document

Parsing and Processing
Ontology 1
Ontology 2
Similarity 1
Similarity 2
Similarity n
Aggregation Similarity Cube
Result Alignment
Similarity Flooding
Alignment Extraction
Fig. 1. Visualization of the MaasMatch architecture.
Similarity) and one a lexical similarity. The details of these can be found in the reportpaper of the previous year [4].
The aim of this year’s development was to increase the utilization of other ontologyfeature, with the hope that the resulting system will be more robust to distortions andproduce alignments of better quality. To achieve this, the system now also utilizes ainternal structural similarity and a instance similarity, while also a similarity floodingprocedure after the aggregation step in order to discover additional mappings.
When comparing classes, the internal structural similarity gathers all propertieswhose inferred domains correspond with the given classes. Then the a maximum corre-spondence between these two sets of properties are computed according to the similari-ties between the data-types of the properties. Comparing properties involves a combina-tions of two similarities. First, the data-types of the properties themselves are compared.Second, the other properties in the immediate neighbourhood are compared using themaximum correspondence of the two property sets.
The instance similarity compares the asserted instances of concepts using informa-tion retrieval techniques. For classes, all instances that are asserted to belong to theircorresponding class are gathered, where all values that are asserted in each of theseinstances are collected in a document. For properties, all values that are asserted usingthese properties are gathered in a document instead. The similarity between classes andproperties is then determined by the similarity of their instance documents.
It is important to note that with the attempt of making the system more robust byadding more similarities and procedures, the runtime of the system will be negativelyimpacted, especially since the full similarity cube is computed. Also, the similarityflooding procedure entails the process of computing a pairwise connectivity graph ofthe two input ontologies. This means that, given two large input ontologies, the resultinggraph will have many nodes and vertices, which will have to be stored in memory.Hence, the memory requirements for large matching tasks will be quite high. Givenboth of these issues, future endeavours will likely entail some methodologies to reducethe memory requirements and the amount of comparisons between concepts.
140

1.2 Adaptations made for the evaluation
For this year’s evaluation we have re-introduced a alignment cut-off based on prelimi-nary evaluations, since not all tracks perform a thresholding procedure during the evalu-ation, yielding results that do not reflect the alignment quality. For the similarity flood-ing procedure the vertex weights are updated using the increment method C [2]. Wealso added secondary matcher, based on our anchor-profile approach [5], to the bridgefor the evaluation using partial input alignments. Unfortunately, this year’s competi-tion did not run this specific sub-track, meaning that we were not able to observe itsperformance in the field. The functionality however is still available.
1.3 Link to the system and parameters file
MaasMatch and its corresponding parameter file is available on the SEALS platformand can be downloaded at http://www.seals-project.eu/tool-services/browse-tools.
2 Results
This section presents the evaluation of the OAEI2013 results achieved by MaasMatch.Evaluations utilizing ontologies exceeding the supported complexity range, such as theLibrary track, will be excluded from the discussion for the sake of brevity.
2.1 Benchmark
The benchmark track consists of synthetic datasets, where an ontology is procedurallyaltered in various ways and to different extents, in order to see under what circumstancesa system can still produce good results. Table 1 displays the results on the two evaluateddatasets:
Test Set Precision F-Measure Recallbiblio2 0.6 0.6 0.6biblioc 0.84 0.69 0.59
Table 1. Harmonic means of the benchmark test sets.
Overall, we can see an improvement over last year’s performance [4]. While in theprevious year the highest achieved f-measure was at 0.6 among the different sets, thisyear this is actually the lowest achieved f-measure, with the system scoring significantlyhigher on the biblioc set.
Unfortunately, according to the experimenter the system did not produce any outputfor the tasks 254 and higher. Upon hearing about this issue, we evaluated the tool locallyusing the SEALS client to replicate the issue, using both the client from last year andthe current ’v4i’ version. With both evaluation clients, MaasMatch ran normally and

produced output for all tasks of the test sets. Furthermore, we also observed that othersystems, namely LogMap, ServOMap and MapSSS, also had these issues, even thoughthese and also MaasMatch performed without error in last year’s competition. From thiswe must conclude that this error stems from the SEALS platform, and given a properevaluation the MaasMatch system could have performed much higher.
In addition to this evaluation, another benchmark run was performed using the on-lira ontology, with the intention of performing an evaluation for which the participantsdo have access to the dataset in advance. While the results of this evaluation will likelynot be published, due to many participating systems not being able to cope with thematching task, it is interesting to see how well MaasMatch performed with this baseontology:
Test Set Precision F-Measure Recallonlira 0.94 0.74 0.61
Table 2. Harmonic means of the benchmark test set using the onlira base ontology.
From Table 2 we can see that the performance of MaasMatch is consistent with theperformance of the standard benchmark set, with a higher emphasis on precision thanrecall.
2.2 Anatomy
The anatomy dataset consists of a single matching task, which aligns a biomedicalontology describing the anatomy of a human to an ontology describing the anatomyof a mouse. Unique aspects about this ontology are their large sizes and the fact thatthey contains specialized vocabulary which is not often found in non-domain specificthesauri. Table 3 displays the results of this dataset.
Test Set Precision F-Measure Recallmouse-human 0.359 0.409 0.476
Table 3. Results of the anatomy data set.
This year we can observe a drop in performance, specifically with regard to the re-call of the alignment. The most likely reason behind this is that this dataset does not con-tain the features that the newly added similarities use, namely instances and properties,such that the distinction between the positive and negative correspondences becomessmaller. The overall similarity values will be lower, since two similarities will not pro-duce any positive values, such that it is more likely that correct correspondences will bedismissed due to their similarity value being lower than the re-introduced threshold.

2.3 Conference
The confidence data set consists of numerous real-world ontologies describing the do-main of organizing scientific conferences. The results of this track can be seen in Table4.
Test Set Precision F-Measure Recallra1 0.29 0.38 0.54ra2 0.29 0.37 0.53
Table 4. Results of the conference data set.
Similarly tot he anatomy dataset, we observe that the additions to the system hada detrimental effect to the alignment quality, in this case with more pronounced ef-fects on the precision. Similarly to the anatomy track, this dataset also does not containinstances, yielding the instance similarity redundant. However, properties are present,yielding the interesting observation that while the internal structural similarity showeditself to be of positive influence on the benchmark dataset, its basic intuition which itexploits is not applicable to the conference dataset.
2.4 Multifarm
The Multifarm data set is based on ontologies from the OntoFarm data set, that havebeen translated into a set of different languages in order to test the multi lingual capa-bilities of a specific system. The results of MaasMatch on this track can bee seen inTable 5.
cn-cz cn-de cn-en cn-es cn-fr cn-nl cn-pt cn-ru cz-de cz-en cz-es cz-fr cz-nl cz-pt cz-ru de-en de-es de-frP .13 .11 .12 .13 .12 .11 .14 .13 .15 .16 .15 .15 .16 .16 .10 .20 .15 .16F .12 .11 .12 .13 .12 .11 .13 .12 .14 .16 .15 .14 .15 .15 .10 .19 .14 .15R .12 .10 .11 .12 .11 .10 .12 .12 .14 .15 .14 .13 .14 .14 .10 .18 .14 .14
de-nl de-pt de-ru en-es en-fr en-nl en-pt en-ru es-fr es-nl es-pt es-ru fr-nl fr-pt fr-ru nl-pt nl-ru pt-ruP .20 .15 .12 .18 .20 .19 .18 .14 .19 .17 .22 .12 .17 .19 .12 .15 .12 .12F .19 .14 .12 .17 .19 .18 .17 .14 .18 .16 .21 .12 .17 .18 .12 .14 .12 .11R .18 .14 .11 .16 .18 .17 .17 .13 .17 .15 .20 .11 .16 .17 .11 .14 .11 .11
Table 5. Results of the multifarm dataset.
Compared to the results of the previous year [1], we can see an overall improve-ment on nearly every task. While in the previous year a very large portion of the tasksresulted in an f-measure of 0.1 or below, this year we can see that in all tasks Maas-Match produced an alignment with an f-measure of .1 or greater. While we can observe

that the addition of language independent similarities did aid the performance of oursystem, further development is still required in order to reliably produce alignments ofsignificant quality.
3 General comments
3.1 Comments on the results
This year we have observed mixed results for MaasMatch. While the performance ofsome tracks has seen improvements thanks to our modifications (benchmark, multi-farm), these came at a cost of performance in other tracks (conference, anatomy).
3.2 Discussions on the way to improve the proposed system
This year we added a wider range of similarities in order to make the system morerobust. Unfortunately, this caused a detriment in performance for mapping tracks whichdid not contain the ontology features which the new similarities exploit. From this, wecan conclude that an important improvement to our system would be the automaticdetection of ontology features and automatic selection of appropriate similarities.
Furthermore, the runtime of MaasMatch is too high in order to realistically tacklehuge mapping tasks. This is mostly due to the computation of the full similarity cube.To remedy this, another addition could be some kind of partitioning method, such thatlarger mapping tasks also become feasible.
We did see improvements in the multifarm dataset. However, this was achievedwithout any preprocessing step on the ontologies. An obvious improvement on this endwould be the addition of a preprocessing step which automatically detects the naturallanguage in which the ontology is written and translating it to a standard lingua-franca,for instance English.
3.3 Comments on the OAEI 2013 procedure
This year’s run on the benchmark trajectory saw numerous systems, including Maas-Match, consistently having troubles producing alignments. While the participants havebeen notified before the results publication of this issue, they were left with only a lim-ited amount of time to address the issue, while the organizers did not investigate theissue themselves at all. This is especially troubling since our own local evaluations us-ing the SEALS clients did not result in these errors, giving a strong indication that theproblem lies within the SEALS infrastructure, thus unfairly casting the affected sys-tems in a negative light. We suggest to re-introduce a three week testing period to theevaluation procedure, similar to the 2011 OAEI competition. That way participants canbe notified sufficiently early about potential technical issues and giving them enoughtime to address these.

3.4 Comments on the OAEI 2013 measures
The evaluation of ontology mapping quality is commonly done using the standard mea-sures of precision, recall and f-measure, these methods do not take into account theconfidence values associated with the individual correspondences. Recently, two tech-niques have seen deployment to take the confidences into account, being thresholdingand confidence weighted measures. While these developments are appreciated, it is im-portant to communicate which of these techniques have been applied in the evaluationprocess in order to facilitate the accurate replication of evaluation results.
4 Conclusion
This paper describes the 2013 participation of MaasMatch in the OAEI campaign. Webriefly describes the overall setup of the system and the new techniques which wereadded to it for this evaluation. Those techniques were mainly aimed at improving therobustness of the system by utilizing a more varied range of ontological features. Whilethis main goal has been achieved, evidenced by higher performances in the benchmarkand multifarm evaluation, this surprisingly came to the detriment in performance in theremaining tracks, where the newly exploited types of features are not present in thetest ontologies. We conclude that, now that MaasMatch possesses a varied spectrum ofsimilarities, there needs to be computation step before the similarity calculation, whichanalyses the input ontologies with regards to its features. According to this analysis,only appropriate similarities would then be selected for the mapping procedure.
References
1. J.L. Aguirre, B.C. Grau, K. Eckert, J. Euzenat, A. Ferrara, R.W. van Hague, L. Hollink,E. Jimenez-Ruiz, C. Meilicke, A. Nikolov, D. Ritze, P. Shvaiko, O. Svab-Zamazal, C. Tro-jahn, and B. Zapilko. Results of the ontology alignment evaluation initiative 2012. In Proc.of the 7th ISWC workshop on ontology matching, pages 73–115, 2012.
2. Sergey Melnik, Hector Garcia-Molina, and Erhard Rahm. Similarity flooding: A versatilegraph matching algorithm and its application to schema matching. In Data Engineering,2002. Proceedings. 18th International Conference on, pages 117–128. IEEE, 2002.
3. F.C. Schadd and N. Roos. Coupling of wordnet entries for ontology mapping using virtualdocuments. In Proceedings of The Seventh International Workshop on Ontology Matching(OM-2012) collocated with the 11th International Semantic Web Conference (ISWC-2012),pages 25–36, 2012.
4. F.C. Schadd and N. Roos. Maasmatch results for oaei 2012. In Proceedings of The SeventhISWC International Workshop on Ontology Matching, pages 160–167, 2012.
5. F.C. Schadd and N. Roos. Anchor-profiles for ontology mapping with partial alignments. InProceedings of the 12th Scandinavian AI conference (SCAI), 2013. Accepted paper.

StringsAuto and MapSSS Results for OAEI 2013
Michelle Cheatham and Pascal Hitzler
Kno.e.sis Center, Wright State University, Dayton, OH, USA{cheatham.7, pascal.hitzler}@wright.edu
Abstract. StringsAuto and MapSSS are two closely related ontology alignmentsystems. The StringsAuto matcher seeks to explore the limits of a syntactic-onlyapproach to alignment. The MapSSS system then expands on this work by em-bedding the syntactic matching of StringsAuto within a more complete alignmentsystem that also makes use of semantic and structural information. In this paperwe describe the basic operation of the two systems and discuss their performancein the OAEI 2013 evaluation.
1 Presentation of the system
1.1 State, purpose, general statement
The vast majority of ontology alignment systems use some form of string similaritymetric. Our overall goal with StringsAuto and MapSSS is to explore the importanceof the choice of a particular string metric. StringsAuto consists only of string metrics,while MapSSS uses strategically chosen string metrics within the context of a morefully-featured alignment system.
In [1] we analyzed the performance of eleven string similarity metrics (TF-IDF,Soft TF-IDF, Jaccard, Soft Jaccard, Exact Match, Longest Common Substring, JaroWinkler, Levenstein, Monge Elkan, N-gram, and Stoilos) on different types of ontolo-gies (standard, biomedical, and multi-lingual). In addition, we experimented with theuse of common string pre-processing methods (tokenization, normalization, stemming,stop word removal, synonyms, and translations). StringsAuto grew out of this work. Itspurpose is to investigate string similarity metrics as applied to ontology alignment. Inparticular, it is of interest to compare the performance of this system to that of the verybasic string-based matchers used as baselines for some of the OAEI tracks.
The MapSSS system was involved in previous OAEI evaluations. The three S’sin MapSSS stand for syntactic, semantic, and structural, which are the three types ofmetrics used by the system. This year MapSSS has been augmented with a differentsemantic metric, based on Google queries, and modified to use the same syntactic metricselection strategy as StringsAuto. We are interested in comparing the performance ofthis version to that of previous years.
1.2 Specific techniques used
Based on the results of the string metric analysis in [1], we produced a set of guidelinesfor choosing string metrics and preprocessing strategies based on the characteristics of

the ontologies to be aligned and whether precision or recall is of primary concern. Moreinformation can be found in the referenced paper.
– Precision• Less than two words per label: Jaro-Winkler 1, 1• Two or more words per label
∗ Synonyms: Soft Jaccard .2, .5 with Levenstein .9 base metric∗ No synonyms: Soft Jaccard 1, 1 with Levenstein .8 base metric
– Recall• Less than two words per label: TF-IDF .8, .8• Two or more words per label
∗ Synonyms: Soft TF-IDF .5, .8 with Jaro-Winkler .8 base metric∗ Different Languages: Soft TF-IDF 0, .7 with Jaro-Winkler .9 base met-
ric∗ Other: Soft TF-IDF .8, .8 with Jaro-Winkler .8 base metric
StringsAuto simply chooses two metrics based on these heuristics: one that priori-tizes precision and another that focuses on recall. Each of these metrics is run (in series)and the resulting alignment is used as-is. When a metric is run, every label in the firstontology is compared to every label in the second ontology, and the results of the sim-ilarity metric are stored in a matrix. The stable marriage algorithm is then run over thematrix, and any matches greater than a threshold value are included in the alignment. Ifeither entity involved in a match has already been used in the alignment, that match isignored. This means that all alignments generated are 1:1 and the recall-centric metriccannot override the precision-centric method.
MapSSS uses the same syntactic metric selection strategy as StringsAuto. In addi-tion, it uses a semantic metric based on Google queries. When considering two labels,A from the first ontology and B from the second, this metric queries Google for thephrase A definition. It then searches the snippets on the first page of results for B. IfB is found, the metric returns true, otherwise it returns false. If this metric returns truein both directions (i.e. googleMetric(A, B) and googleMetric(B, A) are both true) thenthe mapping is added to the alignment. Finally, MapSSS also contains a structural met-ric. If all of the entities in the direct neighborhood of two classes are mapped to oneanother, then those classes are mapped. This approach is sometimes called “flooding.”The structural metric is run repeatedly until no new mappings are created.
1.3 Adaptations made for the evaluation
No significant adaptations were made for the OAEI evaluation. In particular, the heuris-tics used to select the string similarity metrics do not break cleanly along the differentOAEI tracks. Some possibly relevant details of these alignment systems include:
– Neither alignment system attempts to align properties or instances; only classes areconsidered. Our previous work has shown that string similarity metrics performparticularly poorly on property labels.

– The systems determine the language of an ontology by randomly selecting a sam-ple of ten entity labels and sending them to Google Translate. This assumes eachontology involves predominately one language.
– To determine if an ontology has embedded synonyms, the alignment systems lookfor tags involving the word “synonym.” This is to some extent tailored to theanatomy track of the OAEI.
– The semantic metric within MapSSS uses the Google API. There is a limit onthe number of queries that can be submitted using this API each day, as well asa monthly cap. This causes problems for some of the larger ontology alignmentproblems within the OAEI evaluation. We attempted to cache the query results toalleviate this problem, but the SEALS server configuration made this unworkable(we would need to be able to write to a file during execution and have this fileavailable during subsequent runs of the program).
1.4 Link to the system and parameters file
StringsAuto is available at http://pascal-hitzler.de/resources/Strings.zip and MapSSS isavailable at http://pascal-hitzler.de/resources/MapSSS.zip.
2 Results
Development and testing of StringsAuto and MapSSS focused primarily on the confer-ence, anatomy, and multiform test sets, but we present results for all tracks in whichalignments were produced.
2.1 anatomy
StringsAuto achieved an f-measure of 0.835 on this test set (see Table 1). This placed it7th out of 21 participating systems. In particular, the results produced by StringsAutowere significantly better than those of StringsEquiv, a basic string equality matcher.
Interestingly, the performance of MapSSS did not differ greatly from StringsAuto.When compared to the performance of the 2012 version of MapSSS, we see that the pre-cision has dropped while the recall has increased slightly. Notably, the recall+ measureis significantly higher with the current version, which makes use of a string similar-ity metric specifically chosen to enhance recall and semantic information gleaned fromGoogle queries.
2.2 conference
The (ra2) results of StringsAuto and MapSSS on the conference track are shown in Ta-ble 2. StringsAuto outperformed both StringsEquiv and edna (an edit distance metricwith a threshold of .82). Overall, StringsAuto was 6th out of 27 alignment systems interms of f-measure, while edna was 11th and StringsEquiv was 22nd. The 2013 ver-sion of MapSSS significantly outperformed its predecessor but fell slightly short ofStringsAuto.

Table 1. Anatomy Track Results
Alignment System F-measure Precision Recall Recall+StringsEquiv .766 .997 .622 0StringsAuto .835 .899 .779 .433MapSSS 2013 .828 .898 .768 .443MapSSS 2012 .831 .935 .747 .337
Table 2. Conference Track Results
Alignment System F-measure Precision RecallStringsEquiv .52 .76 .39edna .55 .73 .44StringsAuto .60 .74 .50MapSSS 2013 .58 .77 .46MapSSS 2012 .46 .47 .46
2.3 multifarm
There was a problem running both StringsAuto and MapSSS on the multifarm test set.While both systems were able to produce alignments, they had to fall back to their non-translating versions due to a problem reaching the Google Translate service from theOAEI test server. We attempted to fix this during the evaluation by caching the resultsof the translation queries, but this did not work, possibly due to write restrictions onthe server itself (we need to be able to write to a file that will persist between differ-ent executions of the program). Here we report both the results achieved during theevaluation and the results we get when we run StringsAuto on a local computer. In ad-dition, the code used to generate the StringsAuto results is available from http://pascal-hitzler.de/resources/Strings.zip and the actual alignments produced on the multifarmtest cases are available http://pascal-hitzler.de/resources/Multifarm2013alignments.zip.
Table 3. Multifarm Track Results
Different SameAlignment System F-measure Precision Recall F-measure Precision RecallStringsAuto .14 .30 .09 .07 .51 .04MapSSS .10 .27 .07 .06 .50 .03StringsAuto (corrected) .30 .42 .23 .36 .92 .23
2.4 library
MapSSS did not produce alignments for this track, likely due to the size of the thesauricausing the system to exceed the Google API query limit.

StringsAuto finished below the reference (string equality) matchers on this test.StringsAuto could very probably be improved by recognizing all of the labels as syn-onyms (as it does for the anatomy benchmark). Another potential issue is that StringsAutomight have decided that either or both of the ontologies was entirely in German due toits sampling technique, and then attempted to translate all of the labels in that ontology(even the ones already in English).
Table 4. Library Track Results
Alignment System F-measure Precision RecallStringsAuto .302 .774 .188
2.5 large biomedical ontologies
In this track StringsAuto was only able to complete one out of the six tasks (FMA-NCI),and MapSSS was not able to complete any of them (again due to the Google API querylimit).
The results of StringsAuto on the FMA-NCI task were not very good. The systemachieved an f-measure of 0.667 (based on a precision of 0.838 and a recall of 0.554).This placed the system 20th out of 23. It is odd that the performance here is so differ-ent than on the anatomy track. Similar to the problem on the library track, it is likelythis is partially due to StringAuto’s inability to recognize multiple labels for a singleentity as synonyms. The synonym extraction method should be adapted to include thisinformation.
It might be surprising that StringsAuto was unable to complete more of the tasks inthis track. While in theory a matcher that only does string comparisons of labels shouldscale very well, StringsAuto uses a global (m x n) matrix to store all of the pair-wisesimilarity values and runs the stable marriage algorithm over this data. This obviouslyruns into memory limitations for large ontologies. In the future it might make sense tochoose mappings based on a simple local maximum (with a threshold).
3 General comments
3.1 Comments on the results
Despite some technical problems, the performance of StringsAuto compared to thatof the base string matchers shows that a careful selection of string similarity metricsleads to a significant performance increase in ontology alignment systems. In fact,StringsAuto finished in the top third of all alignment systems in both the anatomy andconference tracks. This shows that a significant amount of semantic information withinsome ontologies is contained in the labels themselves, and string similarity metrics aretherefore an important component of ontology alignment systems.

The lackluster performance of MapSSS when compared with StringsAuto was some-what surprising. Further research will be needed to improve the utility of the Google-based semantic similarity metric. We have begun looking into leveraging other generalsources of information, including wikilinks1 and Wikipedia. It would be interesting toperform an comprehensive analysis of these type of metrics similar to the one done forstring similarity metrics in [1].
3.2 Discussions on the way to improve the proposed system
While StringsAuto is basically a proof-of-concept alignment system, it could be ex-tended in several ways that would improve its performance on the OAEI evaluation. Inparticular, it could be adapted to treat multiple labels for a single entity as synonymsand to avoid the use of a global data structure so that larger ontology pairs could bealigned.
The main problem with MapSSS is due to the Google API query limit. This is also aproblem with Bing, according to their terms of service. To mitigate this issue, we needto identify another general information source that does not have such a limit or onlyinvoke this metric in a more limited way.
3.3 Comments on the OAEI 2013 procedure
It would be convenient to provide a way to run all of the language pairs in the multifarmtest set with a single command and produce the same results published by the organizersof that track (i.e. the precision, recall and f-measure separated into the “same” and“different” ontology categories).
3.4 Proposed new measures
It might be interesting to see some details about the alignments produced by the varioustools. For instance, were there some mappings identified by all of the alignment sys-tems? Were there some that were missed by all systems? This might provide insightsthat improve the performance of ontology alignment systems in general. It might alsohighlight any controversial mappings remaining in the reference alignments.
4 Conclusion
We have described two related ontology alignment systems, StringsAuto and MapSSS,which explore the role that string similarity metrics play in ontology alignments. Theresults of these matchers on the OAEI evaluation are significantly better than the base-line string similarity matchers, and in some cases perform quite well when comparedto all other alignment systems. The disappointing performance of the Google-based se-mantic similarity metric used in MapSSS indicates the need for further research in thisarea.
1 http://www.iesl.cs.umass.edu/data/wiki-links

Acknowledgements
This work was supported by the National Science Foundation under award 1354778“EAGER: Collaborative Research: EarthCube Building Blocks, Leveraging Semanticsand Linked Data for Geoscience Data Sharing and Discovery.” Any opinions, findings,and conclusions or recommendations expressed in this material are those of the au-thor(s) and do not necessarily reflect the views of the National Science Foundation.
References
1. M. Cheatham and P. Hitzler. String similarity metrics for ontology alignment. In Proceedingsof the 12th International Semantic Web Conference (ISWC 2013), Sydney, NSW, Australia,October 21-25, 2013, Heidelberg, 2013. Springer.

ODGOMS - Results for OAEI 2013**
I-Hong Kuo1,2, Tai-Ting Wu1,3
1 Industrial Technology Research Institute, Taiwan2 [email protected] [email protected]
Abstract. ODGOMS is a multi-strategy ontology matching system whichconsists of elemental level, structural level, and optimization level strategies.When it starts to match ontologies, it first exploits appropriate string-based andtoken-based similarity computing strategies to find preliminary aligned results,and then it filters these results and merges them by using the optimizationstrategies. Despite ODGOMS uses simple matching logic, the results show thatit is competitive with other well known ontology matching tools.
1 Presentation of the system
1.1 State, purpose, general statement
ODGOMS (Open Data Group Ontology Matching System) is an ontology matchingsystem exploited by our looking forward research plan in the company. The target ofmentioned above research plan is to offer people an user-friendly integrated interfaceto search and to browse linked open data on the internet.
The main idea of ODGOMS is to exploit simple but useful matching and mergingstrategies to produce robust aligned results. All strategies used in the system can begrouped into three groups that are elemental level strategies, structural levelstrategies, and optimization level strategies.
We have submitted two versions of ODGOMS which are version 1.1 and version1.2 to participate in OAEI 2013 campaign. Of the two the latter is better than theformer. This is because the latter has fixed some bugs existed in the former and hasadded some new features. Since ODGOMS version 1.2 is the latest version of thesystem, we only describe the contents of it in the following sections.
1.2 Specific techniques used
ODGOMS focuses on developing individual ontology matching modules for differentmatching aspects and on finding an appropriate way to merge all matching modules.
* Supported by the looking-forward research plan in Industrial Technology Research Institute.The mentioned above plan is named "Data Refining for LOD Using Linked Data IntegrationTechnology."

Each matching module of ODGOMS can be exploited individually by setting filterthreshold and the positions of input ontologies. The system architecture of ODGOMSis shown in Fig. 1.
Fig. 1. System architecture of ODGOMS
The workflow of ODGOMS shown in Fig. 1 is described as follows. It first readsinput ontologies into the memory, then it runs all matching modules individuallywhich are LabelMatcher, IDMatcher, LCSMatcher, SMOAMatcher, PurityMatcher,TFIDFMatcher, NETMatcher, PBCTMatcher, and PBCSMatcher. After that it uses afiltering module named ThresholdFilter to filter all aligned results stored in eachmatching module, and merges them in an special order by exploiting an optimizatingmodule named AlignmentMerger. At last, it outputs the integrated aligned results. Allmodules are divided into three groups which are elemental level modules, structurallevel modules, and optimization level modules. The detailed description of mentionedabove modules are described as follows.
1.2.1 Elemental Level Modules
LabelMatcher For each entity in the first input ontology, this module finds a bestmatched entity in the second input ontology that has at least one common label (e.g.rdfs:label), and stores them as aligned results. Please note that it deletes non-Englishand non-Numeric characters from the labels of input entities and transforms the labelsinto lowercase characters before it starts to match entities.
IDMatcher The matching procedure of this module is the same as that ofLabelMatcher, except that it finds a best matched entity in the second input ontologyfor each entity in the first input ontology that has identical ID (e.g. rdf:ID).
LCSMatcher It finds a best matched entity with highest LCS [5] (Longest CommonSubsequence) similarity in the second ontology for each entity in the first inputontology and stores them as aligned results. When it computes the LCS similarity of
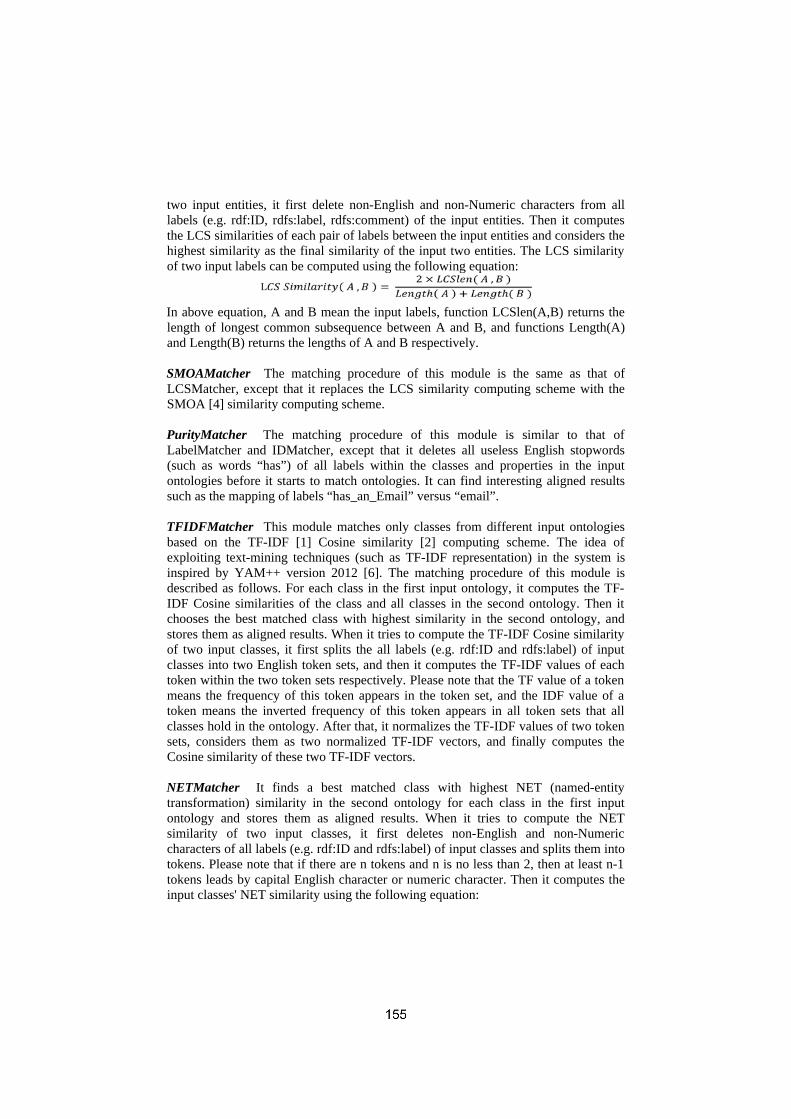
two input entities, it first delete non-English and non-Numeric characters from alllabels (e.g. rdf:ID, rdfs:label, rdfs:comment) of the input entities. Then it computesthe LCS similarities of each pair of labels between the input entities and considers thehighest similarity as the final similarity of the input two entities. The LCS similarityof two input labels can be computed using the following equation:
In above equation, A and B mean the input labels, function LCSlen(A,B) returns thelength of longest common subsequence between A and B, and functions Length(A)and Length(B) returns the lengths of A and B respectively.
SMOAMatcher The matching procedure of this module is the same as that ofLCSMatcher, except that it replaces the LCS similarity computing scheme with theSMOA [4] similarity computing scheme.
PurityMatcher The matching procedure of this module is similar to that ofLabelMatcher and IDMatcher, except that it deletes all useless English stopwords(such as words “has”) of all labels within the classes and properties in the inputontologies before it starts to match ontologies. It can find interesting aligned resultssuch as the mapping of labels “has_an_Email” versus “email”.
TFIDFMatcher This module matches only classes from different input ontologiesbased on the TF-IDF [1] Cosine similarity [2] computing scheme. The idea ofexploiting text-mining techniques (such as TF-IDF representation) in the system isinspired by YAM++ version 2012 [6]. The matching procedure of this module isdescribed as follows. For each class in the first input ontology, it computes the TF-IDF Cosine similarities of the class and all classes in the second ontology. Then itchooses the best matched class with highest similarity in the second ontology, andstores them as aligned results. When it tries to compute the TF-IDF Cosine similarityof two input classes, it first splits the all labels (e.g. rdf:ID and rdfs:label) of inputclasses into two English token sets, and then it computes the TF-IDF values of eachtoken within the two token sets respectively. Please note that the TF value of a tokenmeans the frequency of this token appears in the token set, and the IDF value of atoken means the inverted frequency of this token appears in all token sets that allclasses hold in the ontology. After that, it normalizes the TF-IDF values of two tokensets, considers them as two normalized TF-IDF vectors, and finally computes theCosine similarity of these two TF-IDF vectors.
NETMatcher It finds a best matched class with highest NET (named-entitytransformation) similarity in the second ontology for each class in the first inputontology and stores them as aligned results. When it tries to compute the NETsimilarity of two input classes, it first deletes non-English and non-Numericcharacters of all labels (e.g. rdf:ID and rdfs:label) of input classes and splits them intotokens. Please note that if there are n tokens and n is no less than 2, then at least n-1tokens leads by capital English character or numeric character. Then it computes theinput classes' NET similarity using the following equation:

In above equation, A and B mean the token sets belong to different input classes,function commonTokens returns the total common tokens of input token sets,function commonPrefix returns the average of total common prefix characters versustotal characters of all tokens within different input token sets. This module can findinteresting aligned results such as the mappings of tokens “OWL” versus “WebOntology Language” or “PCMembers” versus “Program Community Members”, etc.
1.2.2. Structural Level Modules
There are two structural level matching modules, PBCTMatcher and PBCSMatcher inthe system now. The former computes classes' integrated similarities using token-based computing scheme and the latter computes them using string-based ones. Theideas of the above matching modules are derived from the matcherNameAndPropertyAlignment of Alignment API 4.5 [3].
PBCTMatcher The full name of it is Property-based Class Token Matcher. For eachclass in the first input ontology, it finds a best matched class with highest integratedsimilarity in the second input ontology. It computes input classes' integratedsimilarities by combining the input classes' similarities and their properties'similarities using the following equation:
In the above equation, CStfidf means the TF-IDF Cosine similarity between the inputclasses, and PStfidf means the TF-IDF Cosine similarity between the belongedproperties of input classes. The computing procedure of TF-IDF Cosine similarity isthe same as that of TFIDFMatcher.
PBCSMatcher The full name of it is Property-based Class String Matcher. It's likePBCTMatcher, except it computes input classes' integrated similarities using LCS(Longest Common Subsequence) similarity computing scheme rather than using TF-IDF similarity computing scheme in PBCTMatcher.
1.2.3. Optimization Level Modules
ThresholdFilter It filters the stored aligned results in each matching moduleaccording to the default filter threshold, respectively. Each aligned result whosesimilarity is lower than the specified filter threshold is deleted from the originalmatching module.
AlignmentMerger It merges all stored aligned results of each matching module by aspecial order. The merging type of AlignmentMerger is called Absorb. That meanswhen it merges the aligned results of two matching modules, it preserves all alignedresults of the former and filters any aligned results of the latter which is partly or

completely overlapped in the former. A merging example of AlignmentMerger isgiven in Fig. 2.
Fig. 2. A merging example of AlignmentMerger.
In Fig. 2, AlignmentMerger is to merge the aligned results of the matching modulesA1 and A2. Let Ci,j be the jth object in ontology i. If the aligned results in A1 are{ <C1,1,C2,1>, <C1,2,C2,4> } and the ones in A2 are { <C1,2,C2,5>, <C1,3,C2,8> }. Because<C1,2,C2,5> in A2 is partly overlapped with <C1,2,C2,4> in A1, the merged aligned resultsare thus { <C1,1,C2,1>, <C1,2,C2,4>, <C1,3,C2,8> }.
1.3 Adaptations made for the evaluation
ODGOMS uses the same parameters to run each experiment in all tracks of OAEI2013. The parameters are divided into two groups as follows.
The first group of parameters includes the default filter thresholds used by moduleThresholdFilter in the system, which are set to be 1.0 for modules LabelMatcher,IDMatcher, and SMOAMatcher, 0.87 for modules LCSMatcher, PurityMatcher, andNETMatcher, 0.8 for module PBCSMatcher, 0.781 for module TFIDFMatcher, and0.3 for module PBCTMatcher, respectively.
The second group of parameters includes the merging order used by moduleAlignmentMerger in the system. The mentioned above merging order is :LabelMatcher, IDMatcher, LCSMatcher, SMOAMatcher, PurityMatcher,TFIDFMatcher, NETMatcher, PBCTMatcher, and PBCSMatcher.
1.4 Link to the system and parameters file
The readers can download execution files of all versions of ODGOMS from ourGoogle SkyDrive download position1��������������� ����������� ������������������������������� ��������� ��������������������� �����������
2 Results
In this section, the OAEI 2013 official results of ODGOMS are listed in from Table 1to Table 5, and they can be find on the OAEI 2013 website too.
Since some tasks in Largebio track are time-consuming and ODGOMS cannotfinish those tasks in 18 hours, we have run ODGOMS for three lightweight tasks ofLargebio track by SEALS client 4.1 at local side, and have listed the results in Table6. The mentioned above experiments are executed on a PC with Intel Core i7-3770SCPU (3.10GHz), 4GB RAM, and Ubuntu 12.04 LTS (64-bit version).
1ODGOMS download position: http://goo.gl/SKkhnU2����!!��� ��������"���� ������!�#�$!���&�'������*����� ��

2.1 Benchmark
The official results of ODGOMS version 1.2 released from OAEI 2013 website arelisted in Table 1.
Table 1. The results for Benchmark track.
2.2 Anatomy
The official results of ODGOMS version 1.2 released from OAEI 2013 website arelisted in Table 2.
Table 2. The results for Anatomy track.
2.3 Conference
The official results of ODGOMS version 1.2 released from OAEI 2013 website arelisted in Table 3. In Table 3, the pre-test results (ra1) are listed in the first row, and theblind-test results (ra2) are listed in the second row.
Table 3. The results for Conference track.
2.4 Multifarm
The official results of ODGOMS version 1.2 released from OAEI 2013 website arelisted in Table 4.
Table 4. The results for Multifarm track.
The results show that the F-Measures of the MultiFarm track are not good. We thinkthe reasons for these results are that ODGOMS is not designed to match ontologieswhich are written in completely different languages yet.
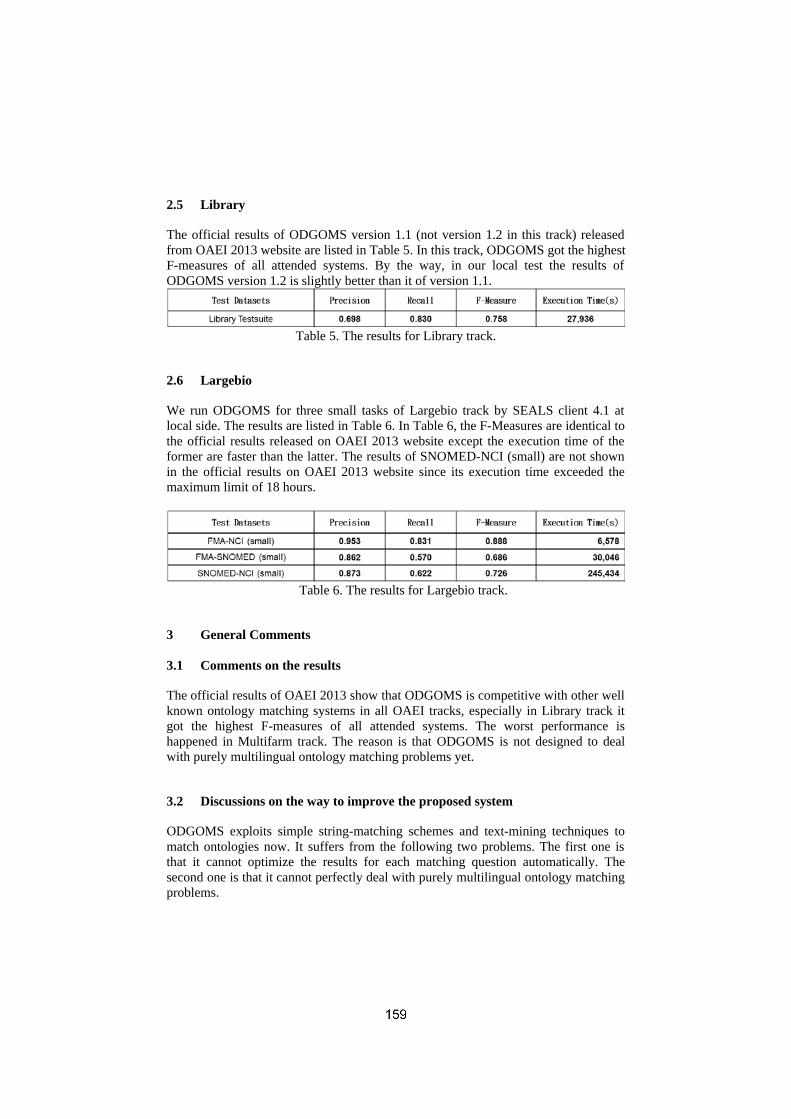
2.5 Library
The official results of ODGOMS version 1.1 (not version 1.2 in this track) releasedfrom OAEI 2013 website are listed in Table 5. In this track, ODGOMS got the highestF-measures of all attended systems. By the way, in our local test the results ofODGOMS version 1.2 is slightly better than it of version 1.1.
Table 5. The results for Library track.
2.6 Largebio
We run ODGOMS for three small tasks of Largebio track by SEALS client 4.1 atlocal side. The results are listed in Table 6. In Table 6, the F-Measures are identical tothe official results released on OAEI 2013 website except the execution time of theformer are faster than the latter. The results of SNOMED-NCI (small) are not shownin the official results on OAEI 2013 website since its execution time exceeded themaximum limit of 18 hours.
Table 6. The results for Largebio track.
3 General Comments
3.1 Comments on the results
The official results of OAEI 2013 show that ODGOMS is competitive with other wellknown ontology matching systems in all OAEI tracks, especially in Library track itgot the highest F-measures of all attended systems. The worst performance ishappened in Multifarm track. The reason is that ODGOMS is not designed to dealwith purely multilingual ontology matching problems yet.
3.2 Discussions on the way to improve the proposed system
ODGOMS exploits simple string-matching schemes and text-mining techniques tomatch ontologies now. It suffers from the following two problems. The first one isthat it cannot optimize the results for each matching question automatically. Thesecond one is that it cannot perfectly deal with purely multilingual ontology matchingproblems.

In order to solve the above two problems, we are extending the new abilities intothe system as follows. For the first problem, we will apply machine learningtechnologies into the system so that it can find the best parameters that can be used inthe system automatically when it deals with different ontology matching questions.And for the second problem, we will add the off-line translation ability betweenforeign languages and English into the system so that it doesn't need the help of on-line translation API (e.g. Microsoft On-Line Translation API).
4 Conclusion
It's the first time ODGOMS attended OAEI campaign. Although it got good results inalmost all OAEI 2013 tracks, but it still suffers from some problems such as time-consuming and multilingual problems. The further research topics would be extendthe machine learning and multilingual abilities into the system. We hope theperformance of it can be improved when it attends the OAEI campaign next year.
References
1. Gerard Salton and Chris Buckley. Term Weighting Approaches in Automatic Text Retrieval.Information Processing and Management, 24 (5): 513-523, 1988.
2. Amit Singhal. Modern Information Retrieval: A Brief Overview. Bulletin of the IEEEComputer Society Technical Committee on Data Engineering, 24 (4): 35-43, 2001.
3. Jerome David, Jerome Euzenat, Francois Scharffe, and Cassia Trojahn dos Santos. TheAlignment API 4.0. Semantic Web Journal, 2 (1): 3-10, 2011.
4. Giorgos Stoilos, Giorgos Stamou, and Stefanos Kollias. A String Metric for OntologyAlignment. Lecture Notes in Computer Science (LNCS), 3729: 624-637, 2005.
5. L. Bergroth, H. Hakonen, and T. Raita. A Survey of Longest Common SubsequenceAlgorithms. SPIRE (IEEE Computer Society) 00: 39-48, 2000.
6. DuyHoa Ngo and Zohra Bellahsene. YAM++ - Results for OAEI 2012. In SeventhInternational Workshop on Ontology Matching (OM 2012): 226-233, 2012.

RiMOM2013 Results for OAEI 2013
Qian Zheng1, Chao Shao1, Juanzi Li1, Zhichun Wang2 and Linmei Hu1
1 Tsinghua University, China {zy,shaochao,ljz}keg.tsinghua.edu.cn2 Beijing Normal University, Beijing, China [email protected]
Abstract. This paper presents the results of RiMOM2013 in the Ontology Align-ment Evaluation Initiative (OAEI) 2013. We participated in three tracks of thetasks: Benchmark, IM@OAEI2013 , and Multifarm. We first describe the basicframework of our matching System (RiMOM2013); then we describe the align-ment process and alignment strategies of RiMOM2013, and then we present spe-cific techniques used for different tracks. At last we give some comments on ourresults and discuss some future work on RiMOM2013.
1 Presentation of the system
Recently, ontology is increasingly seen as an apocalyptic factor for enabling inter-operability between heterogeneous systems and Semantic Web applications. Ontolo-gy Aligning is required for combining distributed and motley ontologies. Developingontology alignment systems has become an essential issue of recent ontology research.
RiMOM2013 is named after RiMOM(Risk Minimization based Ontology Mapping)which is a multi-strategy ontology alignment system and was firstly developed in 2007[1][2]. RiMOM implements several different matching strategies that have been definedbased on different ontological information. For different ontology mapping tasks, Ri-MOM can automatically select and combine multiple strategies to generate accuratealignment results. RiMOM has evolved all the time since 2007, and RiMOM2013 isdeveloped based on RiMOM and has several new characteristics that will be describedin following subsections.
1.1 State, purpose, general statement
As shown in Fig. 1, the whole system is consists of three layers: User Interface layer,Control layer and Component layer. In the User Interface layer, RiMOM2013 providesan interface to allow customizing the matching procedure: including selecting preferredcomponents, setting the parameters for the system, choosing to use translator tool ornot. In semi-automatic ontology matching, the task layer stores parameters of the align-ment tasks, and controls the execution process of components in the component layer.In component layer, we define six groups of executable components, including prepro-cessor, matcher, aggregator, evaluator, postprocessor and other utilities. In each group,there are several instantiated components. For a certain alignment task, user can selectappropriate components and execute them in desired sequence.

User Interface
Method Choosing
Task Ontology O1Ontology O2ParametersReferences
Task Collection
Preprocess Matcher PostprocessAggregator Evaluator Util
DefaultPreprocessor
JenaPreProcessor
LanguageOntoPreProcessor
MultiFarm
PreProcessor
OW
LAPI10Preprocess
SimilarityFlooding
PreProcessor
EditDistanceLabelM
atcher
SimilarityFloodingM
atcher
VectorSpaceMatcher
WordNetM
atcher
AverageWeighted
Aggregator
ConsistenceWeighted
Aggregator
HarmonyW
eightedAggregator
PrincipalComponent
Aggregator
SigmoidW
eightedAggregator
PrfEvaluator
GaussianFunctionPostProcessor
OneToPneFilter
RelevanceInfo
ThresholdFilter
Weka
Wordnet
StopWordList
GoogleTranslator
Instance Matcher
Fig. 1. Framework of RiMOM2013
1.2 Specific techniques used
This year we participate in three tracks of the campaign: Benchmark, Multifarm, andInstance Matching. We will describe specific techniques used in different tracks as fol-lows:
BenchmarkFor benchmark track, we use five matching methods: Similarity preprocessor, Simi-
larity matcher, Similarity Flooding preprocessor, Similarity Flooding matcher, and Sim-ilarity Aggregator.
We use Edit Distance method and WordNet 2.0 to calculate the similarity betweenlabels of entities, then for each entity pair we combine these two similarities to anaggregated similarity.
Experiments are did on five different flooding methods based on similarity flood-ing[3]: Property Only Method(POM), Hierarchy Method(HM), Common Relation Method(CRM), RDFGraphOfSchema Method(RGSM) and Nothing Method(NM). Thesefive methods are used to generate the initial graph only for the next step. In POM weadd entity pairs which have superclass relationship; And in HM, we add entity pairswhich have subclass and super property; In CRM, first we check the relationship be-tween each two entities, then we add entity pairs which have domain relationship orrange relationship. In RGSM, we add these pairs either contented in HM and CRM.And for NM, we add all entity pairs into initialize graph.
In the next two steps we use the similarity flooding method to flood the similaritiesin the graph, and because the map is usually gargantuan, we use a threshold filter toprune the pairs whose similarity smaller than threshold when after the flooding process.
Next we use Aggregator to combine these similarities: EditDistance similarity, Word-Net 2.0 similarity, similarity Flooding result similarity. The experiment reflects that the

only single task list without aggregator and other similarities(EditDistance and Word-Net 2.0) gains the best result.
MultifarmThe multifarm track is designed to test the aligning systems’ ability on multi-lingual
dataset[4]. The multifarm data is composed of a set of ontologies translated in sevendifferent languages and the corresponding alignments between these ontologies. Eachentity in one ontology requested to be matched with related entity in different languageontology.
The nodus makes this task difficult is that there is restricted information in eachentity, which usually only has label information like ”writes contribution”, and the labelof its range property of this entity is ”contribution”, the label of its domain property ofthis entity is ”author”, which when translated into same language usually got same oralmost same result like ”autor” in Spanish.
In the first preprocess step in multifarm task, we use google translate tool to maketwo different language into same language, such as when we do the ”en-cn” alignmenttask, we translate the Chinese label to English, and when we do the ”cn-es” alignmenttask, we translate Spanish label into Chinese. Particularly, when either the source on-tology or target ontology’s language is Russian, we translate them both into English.
In the second preprocess step, we use google translate tool to make two differententities’s label all in English for the purpose of use wordnet 2.0 in order to calculate thesentence similarity.
Next we use Aggregator to combine these two similarities for each label pair, theexperiment reflects that the edit-distance contributes more in the combined-similarity.
Instance Matching
m
1 m-1Unique Subject Matching One-left Object Matching
Score Matching Thresholdδ>δmin?
Found no matching pairs
Yes
No
Found new matching pairs
End
m1
m-1
m
1 m-1
m1 m-1
Link Flooding Algorithm
Aligned instances
Source Ontology
Target Ontology
Subject matching by unique <Predicate,Object> Object matching by aligned instances
DataPreprocess
Fig. 2. Framework of instance matching system
For instance matching task, we propose an algorithm called Link Flooding Algorith-m inspired by [5] , which includes four main modules, namely Data Preprocess, Unique

Subject Matching, One-left Object Matching and Score Matching. Before going into thedetails, we first define ontology Ont as a set of RDF triples < s, p, o > (Subject, Pred-icate, Object), and instance Ins as a set of many RDF triples having the same Subject.Since an instance’s subject could be another’s object, we consider instance matching inthree situations: subject and subject alignment, subject and object alignment and objectand object alignment.
In the first module called data preprocess, we purify the data including transfer-ring the data sets which are multilingual to be uniform in English. Additionally, weunify the format of data, for example, the date expressed as ”august, 01, 2013” or ”Au-gust, 01, 2013” is transformed to ”08, 01, 2013”. We also do a lot of other operationslike removing special characters to clean the data. The second module achieves in-stance matching through one unique < p, o > for the two instances to be aligned.For example, if in source ontology, only one instance, INSX has < p, o > as <birthday, ”01, 08, 2013” >, then in target ontology, instances containing <birthday,”01,08, 2013”> are concluded to be aligned with INSX . Consequently, one instance insource ontology can be matched with arbitrary number of instances in target ontology.In the third module, we obtain object and object alignment via all of the aligned sub-jects. In detail, if two aligned instances have a same predicate both having m objects, ofwhich m−1 are aligned, then the ”one-left” object is aligned. The last module is namedScore Matching where we consider two instances aligned if the weighted average scoreof their comments, mottos, birthDates ,and almaMaters is above a certain threshold.In this task, we take the edit distance as score measure of similarity. We illustrate thealgorithm in Fig. 2.
We first input source ontology and target ontology into the algorithm, as shown inthe picture, the black circles represent the subjects of the RDF triples, the gray circlesrepresent the objects of the RDF triples, and the white triangles represent the predi-cate[6]. We then clean the data set with the module Data Preprocess. Next, we generatesome initial instance matching pairs as seeds through Unique Subject Matching. As wementioned previously, one instance’s subject could be another’s object, we can input theseeds to One-left Object Matching to get more matching pairs. With those new detect-ed matching pairs, we reapply Unique Subject Matching to acquire more new matchingpairs. So, we can iteratively run these two modules until we can not find any new match-ing pairs. After that, we need to run the Score Matching module with a high thresholdto get new pairs with high confidence, thus we can repeat previous operation namely it-eratively running Unique Subject Matching and One-left Object Matching module withlittle error. Later, we reduce the threshold step by step, where in each step newfoundpairs are input into the repeated previous operation to control error propagation. Lastly,we output all of the matching pairs if the threshold is below the minimum threshold orall the instances in target ontology are aligned.
1.3 Adaptations made for the evaluation
Deploying the system on seals platform by a network bears three main challenges.Firstly, the input source can not download as a file, we can hardly see the informationand structure inherently. Secondly, without the input string path, we can not determinewhich task and which size of the dataset are now using. Lastly, with the calling the
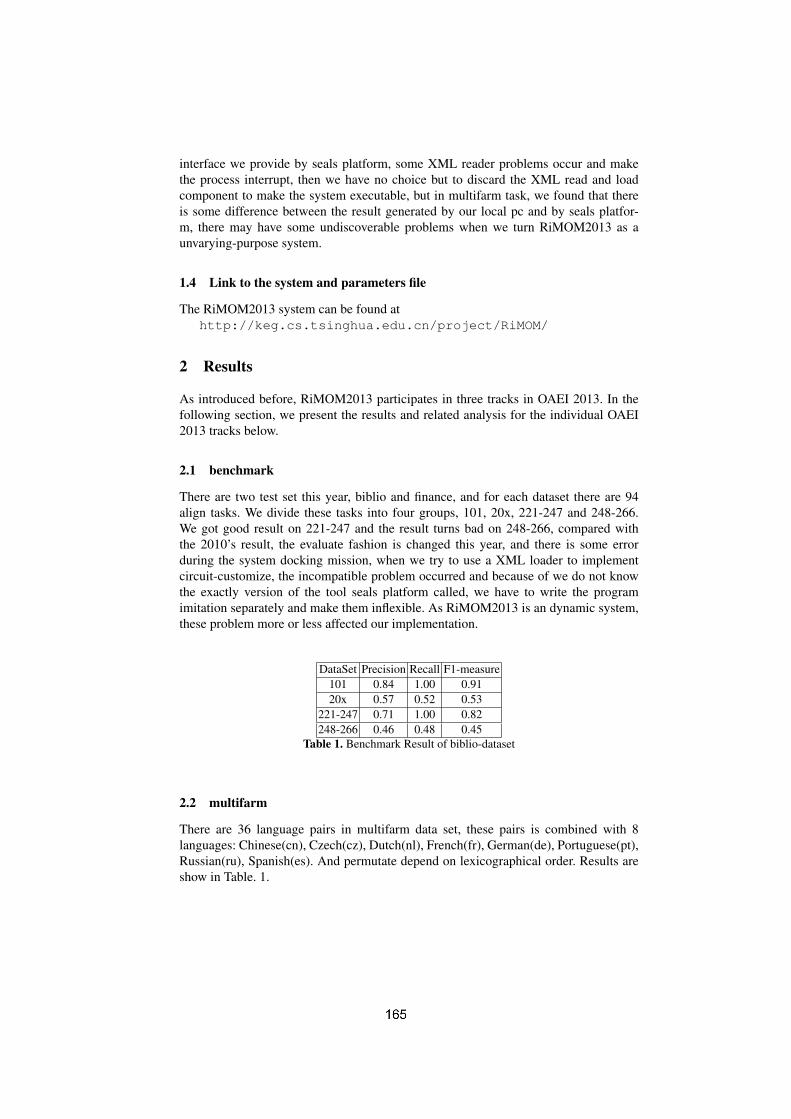
interface we provide by seals platform, some XML reader problems occur and makethe process interrupt, then we have no choice but to discard the XML read and loadcomponent to make the system executable, but in multifarm task, we found that thereis some difference between the result generated by our local pc and by seals platfor-m, there may have some undiscoverable problems when we turn RiMOM2013 as aunvarying-purpose system.
1.4 Link to the system and parameters file
The RiMOM2013 system can be found athttp://keg.cs.tsinghua.edu.cn/project/RiMOM/
2 Results
As introduced before, RiMOM2013 participates in three tracks in OAEI 2013. In thefollowing section, we present the results and related analysis for the individual OAEI2013 tracks below.
2.1 benchmark
There are two test set this year, biblio and finance, and for each dataset there are 94align tasks. We divide these tasks into four groups, 101, 20x, 221-247 and 248-266.We got good result on 221-247 and the result turns bad on 248-266, compared withthe 2010’s result, the evaluate fashion is changed this year, and there is some errorduring the system docking mission, when we try to use a XML loader to implementcircuit-customize, the incompatible problem occurred and because of we do not knowthe exactly version of the tool seals platform called, we have to write the programimitation separately and make them inflexible. As RiMOM2013 is an dynamic system,these problem more or less affected our implementation.
DataSet Precision Recall F1-measure101 0.84 1.00 0.9120x 0.57 0.52 0.53
221-247 0.71 1.00 0.82248-266 0.46 0.48 0.45
Table 1. Benchmark Result of biblio-dataset
2.2 multifarm
There are 36 language pairs in multifarm data set, these pairs is combined with 8languages: Chinese(cn), Czech(cz), Dutch(nl), French(fr), German(de), Portuguese(pt),Russian(ru), Spanish(es). And permutate depend on lexicographical order. Results areshow in Table. 1.

Result is shown in Table 2 and this result is from OAEI2013 result page. It is notablethat our system got the minimum runtime among the multilingual matchers, which isnot put in this table. Although we got the third rank in multifarm task, we still have tomention that our system basically is a translation based system and the connection withthe translator’s supplier is not that good. Otherwise, we could have made it much better.We have proven it locally with no edas and ekaw ontologies, getting F1 as 0.49.
Language Pair F1-measure Language Pair F1-measure Language Pair F1-measurecn-cz 0.120 cz-nl 0.320 en-pt 0.360cn-de 0.180 cz-pt 0.240 en-ru NaNcn-en 0.250 cz-ru NaN es-fr 0.360cn-es 0.170 de-en 0.390 es-nl 0.290cn-fr 0.170 de-es 0.310 es-pt 0.400cn-nl 0.160 de-fr 0.290 es-ru NaNcn-pt 0.100 de-nl 0.300 fr-nl 0.300cn-ru NaN de-pt 0.270 fr-pt 0.260cz-de 0.240 de-ru NaN fr-ru NaNcz-en 0.250 en-es 0.420 nl-pt 0.150cz-es 0.240 en-fr 0.320 nl-ru NaNcz-fr 0.170 en-nl 0.350 pt-ru NaN
Table 2. Multifarm Result by Seals
The table shows that the worst results all happened in Chinese tasks, because thebasic tool we use in all multifarm fashion is translate tool, we use both google trans-lator and bing’s translator to initialize the label set before we calculate the WordNetsimilarity, edit-distance similarity and vector space similarity.
Because of the fact that information in each multifarm’s tasks is qualified, involun-tarily, we got the limit on result, the highest F1 we got is 0.605 which is Czech ontologyand English ontology ’s alignment on local machine.
2.3 instance matching
The result for Instance Matching 2013 is shown in Table 3.As we can see from the table, we achieve high values for all measures in all five
testcases, especially in testcase1 and 3. Furthermore, the official result shows that wewin first prize in IM@OAEI2013. We confidently believe our algorithm, Link Propaga-tion Algorithm is effective for instance matching. We owe our results to each moduleof the algorithm and further explain the results more specifically.
For testcase1, the Score Matching module exploits weighted average score, there-fore avoiding emphasizing some particular information of instances. The reasons whywe attain best performance in testcase1 also include little change in target ontology.In testcase2, with almost only link information, we needn’t employ last module ScoreMatching. Nevertheless, it achieves comparative performance, reflecting the power of
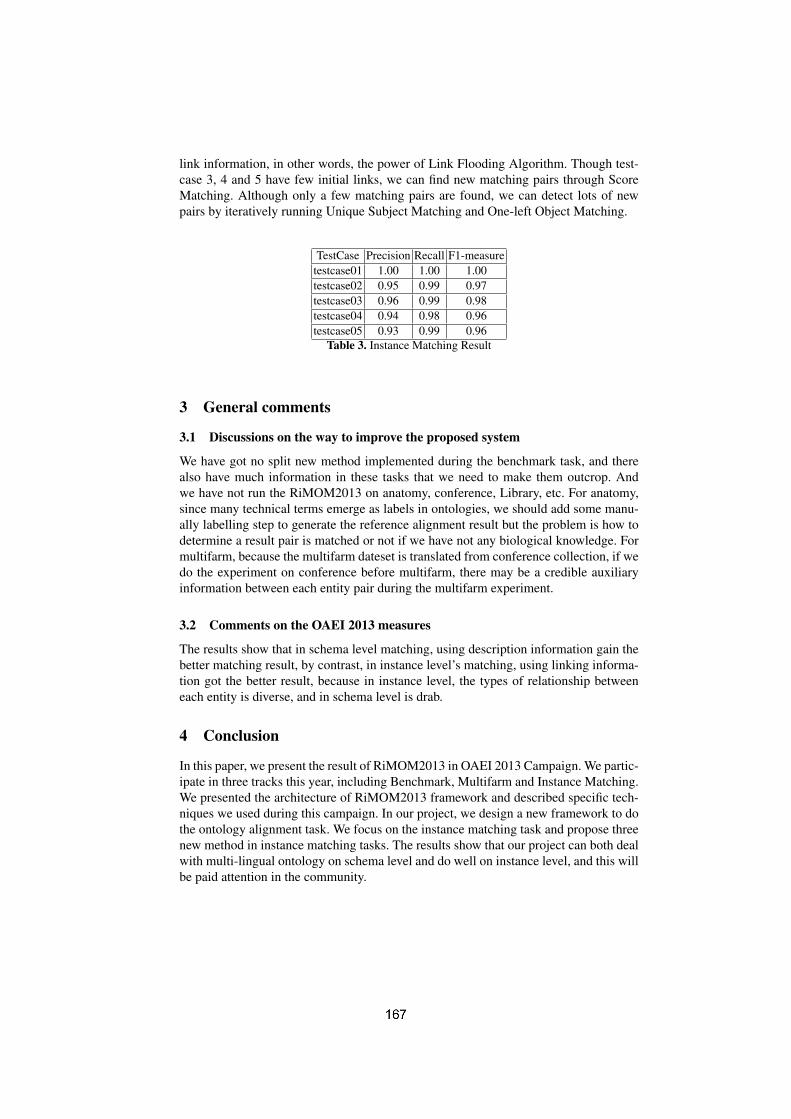
link information, in other words, the power of Link Flooding Algorithm. Though test-case 3, 4 and 5 have few initial links, we can find new matching pairs through ScoreMatching. Although only a few matching pairs are found, we can detect lots of newpairs by iteratively running Unique Subject Matching and One-left Object Matching.
TestCase Precision Recall F1-measuretestcase01 1.00 1.00 1.00testcase02 0.95 0.99 0.97testcase03 0.96 0.99 0.98testcase04 0.94 0.98 0.96testcase05 0.93 0.99 0.96
Table 3. Instance Matching Result
3 General comments
3.1 Discussions on the way to improve the proposed system
We have got no split new method implemented during the benchmark task, and therealso have much information in these tasks that we need to make them outcrop. Andwe have not run the RiMOM2013 on anatomy, conference, Library, etc. For anatomy,since many technical terms emerge as labels in ontologies, we should add some manu-ally labelling step to generate the reference alignment result but the problem is how todetermine a result pair is matched or not if we have not any biological knowledge. Formultifarm, because the multifarm dateset is translated from conference collection, if wedo the experiment on conference before multifarm, there may be a credible auxiliaryinformation between each entity pair during the multifarm experiment.
3.2 Comments on the OAEI 2013 measures
The results show that in schema level matching, using description information gain thebetter matching result, by contrast, in instance level’s matching, using linking informa-tion got the better result, because in instance level, the types of relationship betweeneach entity is diverse, and in schema level is drab.
4 Conclusion
In this paper, we present the result of RiMOM2013 in OAEI 2013 Campaign. We partic-ipate in three tracks this year, including Benchmark, Multifarm and Instance Matching.We presented the architecture of RiMOM2013 framework and described specific tech-niques we used during this campaign. In our project, we design a new framework to dothe ontology alignment task. We focus on the instance matching task and propose threenew method in instance matching tasks. The results show that our project can both dealwith multi-lingual ontology on schema level and do well on instance level, and this willbe paid attention in the community.

5 Acknowledgement
The work is supported by NSFC (No. 61035004), NSFC-ANR(No. 61261130588), 863High Technology Program (2011AA01A207), FP7-288342, and THU-NUS NExT Co-Lab.
References
1. Li, J., Tang, J., Li, Y., Luo, Q.: RiMOM: a dynamic multistrategy ontology alignment frame-work. IEEE Trans. Knowl. Data Eng. (2009) 1218–1232
2. Wang, Z., Zhang, X., Hou, L., Zhao, Y., Li, J., Qi, Y., Tang, J.: RiMOM results for oaei 2010.In: OM’10. (2010)
3. Melnik, S., Garcia-Molina, H., Rahm, E.: Similarity Flooding: A versatile graph matchingalgorithm and its application to schema matching. In: ICDE’02. (2002) 117–128
4. Meilicke, C., Garcia-Castro, R., Freitas, F., van Hage, W.R., Montiel-Ponsoda, E., de Azevedo,R.R., Stuckenschmidt, H., Svb-Zamazal, O., Svtek, V., Tamilin, A., dos Santos, C.T., Wang,S.: Multifarm: A benchmark for multilingual ontology matching. J. Web Sem. (2012) 62–68
5. Wang, Z., Li, J., Wang, Z., Tang, J.: Cross-lingual knowledge linking across wiki knowledgebases. In: WWW’12. (2012) 459–468
6. Nguyen, K., Ichise, R., Le, B.: SLINT: a schema-independent linked data interlinking system.In: OM’12. (2012)

ServOMap Results for OAEI 2013
Amal Kammoun1 and Gayo Diallo1
ERIAS, INSERM U897, University of Bordeaux, [email protected]
Abstract. We briefly present in this paper ServOMap, a large scale ontologymatching system, and the performance it achieved during the OAEI 2013 cam-paign. This is the second participation in the OAEI campaign.
1 Presentation of the system
ServOMap [1] is a large scale ontology matching system designed on top of the ServOOntology Server system [2], an idea originally developed in [3]. It is able to handleontologies which contain several hundred of thousands entities. To deal with large on-tologies, ServOMap relies on an indexing strategy for reducing the search space andcomputes an initial set of candidates based on the terminological description of entitiesof the input ontologies.
New components have been introduced since the 2012 version of the system. Amongthem:
– The use of a set of string distance metrics to complement the vectorial based simi-larity of the IR library we use1,
– An improved contextual similarity computation thanks to the introduction of a Ma-chine Learning strategy,
– The introduction of a general purpose background knowledge, WordNet [4], to dealwith synonymy issues within entities’ annotation,
– The use of a logical consistency check component.
In 2013, ServOMap participated in the entities matching track and does not imple-mented a specific adaptation for the Interactive Matching and Multifarm tracks.
1.1 State, purpose, general statement
ServOMap is designed with the purpose of facilitating interoperability between differ-ent applications which are based on heterogeneous knowledge organization systems(KOS). The heterogeneity of these KOS may have several causes including their lan-guage format and their level of formalism. Our system relies on Information Retrieval(IR) techniques and a dynamic description of entities of different KOS for computingthe similarity between them. It is mainly designed for meeting the need of matchinglarge scale ontologies. It has proven to be efficient for tackling such an issue during the2012 OAEI campaign.
1 http://lucene.apache.org/
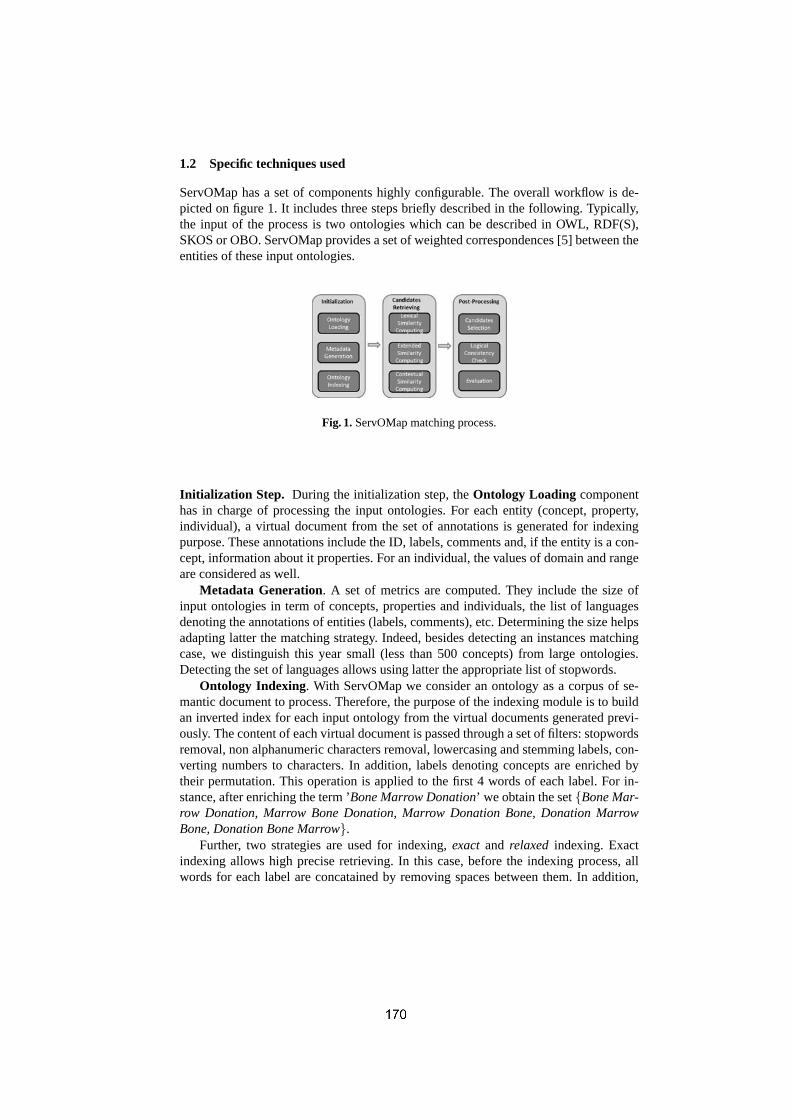
1.2 Specific techniques used
ServOMap has a set of components highly configurable. The overall workflow is de-picted on figure 1. It includes three steps briefly described in the following. Typically,the input of the process is two ontologies which can be described in OWL, RDF(S),SKOS or OBO. ServOMap provides a set of weighted correspondences [5] between theentities of these input ontologies.
Fig. 1. ServOMap matching process.
Initialization Step. During the initialization step, the Ontology Loading componenthas in charge of processing the input ontologies. For each entity (concept, property,individual), a virtual document from the set of annotations is generated for indexingpurpose. These annotations include the ID, labels, comments and, if the entity is a con-cept, information about it properties. For an individual, the values of domain and rangeare considered as well.
Metadata Generation. A set of metrics are computed. They include the size ofinput ontologies in term of concepts, properties and individuals, the list of languagesdenoting the annotations of entities (labels, comments), etc. Determining the size helpsadapting latter the matching strategy. Indeed, besides detecting an instances matchingcase, we distinguish this year small (less than 500 concepts) from large ontologies.Detecting the set of languages allows using latter the appropriate list of stopwords.
Ontology Indexing. With ServOMap we consider an ontology as a corpus of se-mantic document to process. Therefore, the purpose of the indexing module is to buildan inverted index for each input ontology from the virtual documents generated previ-ously. The content of each virtual document is passed through a set of filters: stopwordsremoval, non alphanumeric characters removal, lowercasing and stemming labels, con-verting numbers to characters. In addition, labels denoting concepts are enriched bytheir permutation. This operation is applied to the first 4 words of each label. For in-stance, after enriching the term ’Bone Marrow Donation’ we obtain the set {Bone Mar-row Donation, Marrow Bone Donation, Marrow Donation Bone, Donation MarrowBone, Donation Bone Marrow}.
Further, two strategies are used for indexing, exact and relaxed indexing. Exactindexing allows high precise retrieving. In this case, before the indexing process, allwords for each label are concatained by removing spaces between them. In addition,

for optimization purpose, the possibility is offered to index each entity with informationabout its siblings, descendants and ancestors.
Candidates Retrieving. The objective is to compute a set of candidates mappings M=
⋃(Mexact, Mrelaxed, Mcontext, Mprop) .
Lexical Similarity Computing. Let’s assume that after the initializing step we havetwo indexes I1 and I2 corresponding respectively to the input ontologies O1 and O2. Thefirst step for candidates retrieving is to compute the initial set of candidates mappingsconstituted by only couple of concepts and denoted by Mexact. This set is obtained byperforming an exact search, respectively over I1 using O2 as search component andover I2 using O1. To do so, a query which takes the form of a virtual document isgenerated for each concept and sent to the target index. The search is performed throughthe IR library which use the usual tf.idf score. We select the best K results having ascore greater than a given threshold θ. The obtained couples are filtered out in order tokeep only those satisfying the lexical similarity condition. This condition is checked asfollows.
For each filtered couple (c1, c2), two lexical descriptions are generated. They areconstituted respectively by ID and labels of c1 and its direct ancestors (Γ 1), ID andlabels of c2 and its direct ancestors (Γ 2).
We compute a similarity Simlex=f(α× ISub(Γ 1, Γ 2), β ×QGram(Γ 1, Γ 2), γ ×Lev(Γ 1, Γ 2)), where I-Sub, QGram and Lev denote respectively the ISUB similaritymeasure [6], the QGram and Levenshtein distance. Coefficients α, β and γ are cho-sen empirically for OAEI 2013. All couples with Simlex greater than a threshold areselected. Finally, Mexact is the intersection of the two set of selected couples obtainedafter the search performed on the two indexes.
The same process is repeated in order to compute the set Mrelaxed from the con-cepts not yet selected with the exact search. A similar strategy for computing Mexact isused for computing the similarity between the properties of the input ontologies. Thisgenerates the Mprop set. Here, the description of a property includes its domain andrange.
Extended Similarity Computing. In order to deal with synonym issue, from theset of concepts not selected after the previous phase, we use the WordNet dictionary forretrieving alternative labels for concepts to be mapped. The idea is to check whethera concept in the first ontology is denoted by synonym terms in the second one. Allcouples in this case are retrieved as possible candidates.
Contextual Similarity Computing. The idea is to acquire new candidates map-pings, Mcontext, among those couples which have not been selected in the previoussteps. To do so, we rely on the structure of the ontology by considering that the sim-ilarity of two entities depends on the similarity of the entities that surround them. In2013, we have introduced a Machine Learning strategy which uses Mexact as basis fortraining set using the WEKA tool [7]. Indeed, according to our tests, candidates map-pings from Mexact use to be highly accurate. Therefore, retrieving candidates usingcontextual similarity is transformed as a classification problem. Each new couple is tobe classified as correct or incorrect according to candidates already in Mexact.
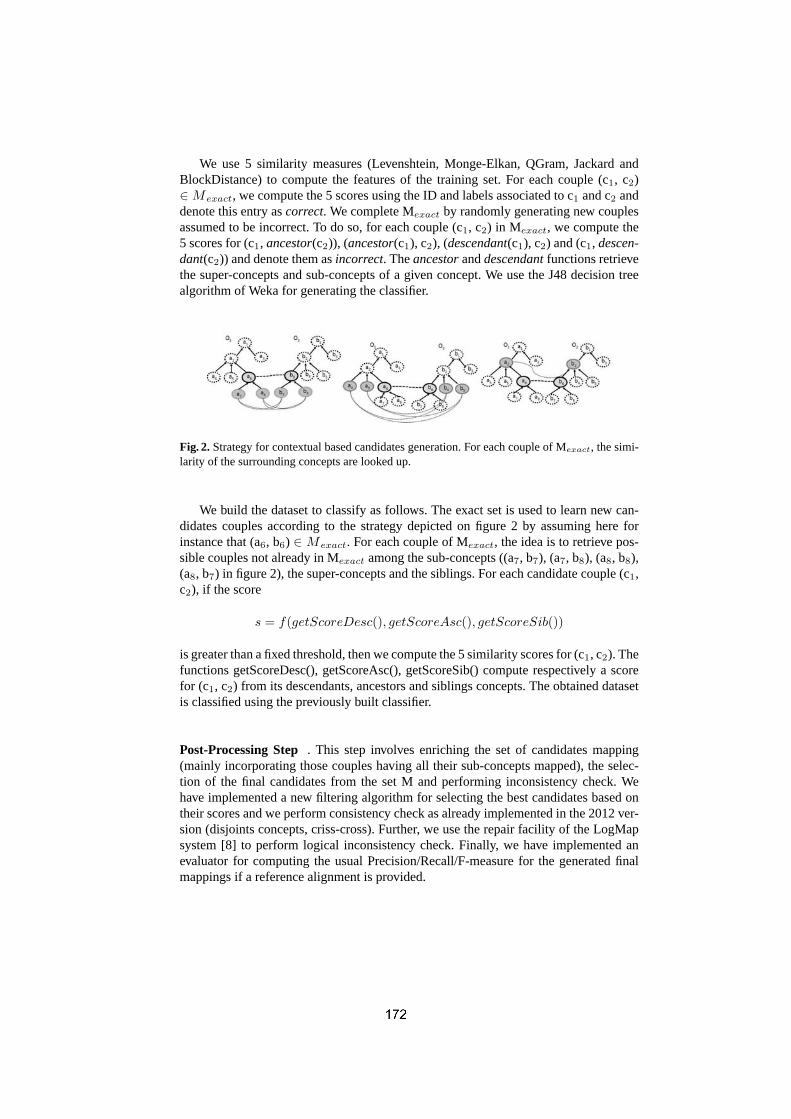
We use 5 similarity measures (Levenshtein, Monge-Elkan, QGram, Jackard andBlockDistance) to compute the features of the training set. For each couple (c1, c2)∈ Mexact, we compute the 5 scores using the ID and labels associated to c1 and c2 anddenote this entry as correct. We complete Mexact by randomly generating new couplesassumed to be incorrect. To do so, for each couple (c1, c2) in Mexact, we compute the5 scores for (c1, ancestor(c2)), (ancestor(c1), c2), (descendant(c1), c2) and (c1, descen-dant(c2)) and denote them as incorrect. The ancestor and descendant functions retrievethe super-concepts and sub-concepts of a given concept. We use the J48 decision treealgorithm of Weka for generating the classifier.
Fig. 2. Strategy for contextual based candidates generation. For each couple of Mexact, the simi-larity of the surrounding concepts are looked up.
We build the dataset to classify as follows. The exact set is used to learn new can-didates couples according to the strategy depicted on figure 2 by assuming here forinstance that (a6, b6) ∈ Mexact. For each couple of Mexact, the idea is to retrieve pos-sible couples not already in Mexact among the sub-concepts ((a7, b7), (a7, b8), (a8, b8),(a8, b7) in figure 2), the super-concepts and the siblings. For each candidate couple (c1,c2), if the score
s = f(getScoreDesc(), getScoreAsc(), getScoreSib())
is greater than a fixed threshold, then we compute the 5 similarity scores for (c1, c2). Thefunctions getScoreDesc(), getScoreAsc(), getScoreSib() compute respectively a scorefor (c1, c2) from its descendants, ancestors and siblings concepts. The obtained datasetis classified using the previously built classifier.
Post-Processing Step . This step involves enriching the set of candidates mapping(mainly incorporating those couples having all their sub-concepts mapped), the selec-tion of the final candidates from the set M and performing inconsistency check. Wehave implemented a new filtering algorithm for selecting the best candidates based ontheir scores and we perform consistency check as already implemented in the 2012 ver-sion (disjoints concepts, criss-cross). Further, we use the repair facility of the LogMapsystem [8] to perform logical inconsistency check. Finally, we have implemented anevaluator for computing the usual Precision/Recall/F-measure for the generated finalmappings if a reference alignment is provided.

1.3 Adaptations made for the evaluation
ServOMap is configured to adapt its strategy to the size of the input ontologies. There-fore, as mentioned earlier, two categories are considered: input ontology with size lessthan 500 concepts and ontology with size greater than 500 concepts. For large ontolo-gies, our tests showed that exact search is sufficient for generating concepts mappingsof OAEI test cases, while for small one relaxed and extended search is needed.
Further, according to the performance achieved by our system in OAEI 2012 [9],the focus of this year was more to improve the recall than optimizing the computationtime. From technical point of view, the previous version of ServOMap was based onthe following third party components: the JENA framework for processing ontologiesand the Apache Luncene API as IR library. We have moved from JENA framework tothe OWLAPI library for ontology processing, in particular for handling in an efficientmanner complex domain and range axioms and taking into account wider formats of in-put ontologies. In addition, a more recent version of the IR library is used for the actualversion. However, in order to have a compatible SEALS client, we have downgradedthe version of the Apache Lucene API used for the evaluation. This leaded to a lessrobust system for the 2013 campaign as some components have not been fully adapted.
1.4 Link to the system and parameters file
The wrapped SEALS client for ServOMap version used for the OAEI 2013 editionis available at http://lesim.isped.u-bordeaux2.fr/ServOMap. The instructions for testingthe tool is described in the tutorial dedicated to the SEALS client2.
1.5 Link to the set of provided alignments
The results obtained by ServOMap during OAEI 2013 are available at http://lesim.isped.u-bordeaux2.fr/ServOMap/oaei2013.zip/.
2 Results
We present in this section the results obtained by running the ServOMap system with theSEALS client. As the uploaded version does not implement multilingual and interactivematching features, the results of the corresponding tracks are not described here.
2.1 Benchmark
In the OAEI 2013 campaign, the Benchmark track includes only the bibliography testcase in a blind mode. The experiments are performed on a Debian Linux virtual machineconfigured with four processors and 8GB of RAM. ServOMap finished the task in about7mn. Because of some issues in processing tests set from #261-4 to #266, the results ofServOMap has been affected and decreased compared to 2012.
2 http://oaei.ontologymatching.org/2013/seals-eval.html
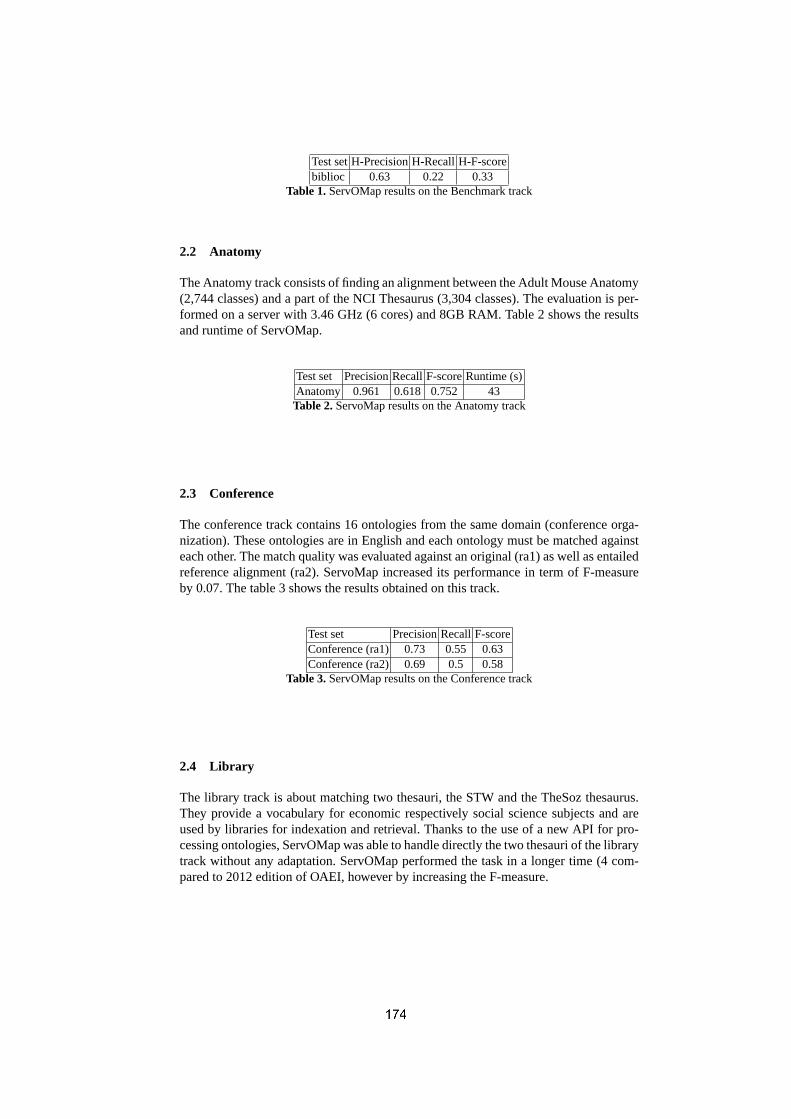
Test set H-Precision H-Recall H-F-scorebiblioc 0.63 0.22 0.33
Table 1. ServOMap results on the Benchmark track
2.2 Anatomy
The Anatomy track consists of finding an alignment between the Adult Mouse Anatomy(2,744 classes) and a part of the NCI Thesaurus (3,304 classes). The evaluation is per-formed on a server with 3.46 GHz (6 cores) and 8GB RAM. Table 2 shows the resultsand runtime of ServOMap.
Test set Precision Recall F-score Runtime (s)Anatomy 0.961 0.618 0.752 43
Table 2. ServoMap results on the Anatomy track
2.3 Conference
The conference track contains 16 ontologies from the same domain (conference orga-nization). These ontologies are in English and each ontology must be matched againsteach other. The match quality was evaluated against an original (ra1) as well as entailedreference alignment (ra2). ServoMap increased its performance in term of F-measureby 0.07. The table 3 shows the results obtained on this track.
Test set Precision Recall F-scoreConference (ra1) 0.73 0.55 0.63Conference (ra2) 0.69 0.5 0.58
Table 3. ServOMap results on the Conference track
2.4 Library
The library track is about matching two thesauri, the STW and the TheSoz thesaurus.They provide a vocabulary for economic respectively social science subjects and areused by libraries for indexation and retrieval. Thanks to the use of a new API for pro-cessing ontologies, ServOMap was able to handle directly the two thesauri of the librarytrack without any adaptation. ServOMap performed the task in a longer time (4 com-pared to 2012 edition of OAEI, however by increasing the F-measure.

Test set Precision Recall F-score Runtime (s)Library 0.699 0.783 0.739 648
Table 4. ServoMap results on the Library track
2.5 Large biomedical ontologies
The Large BioMed track consists of finding alignments between the Foundational Modelof Anatomy (FMA), SNOMED CT, and the National Cancer Institute Thesaurus (NCI).There are 6 sub tasks corresponding to different sizes of input ontologies (small frag-ment and whole ontology for FMA and NCI and small and large fragments for SNOMEDCT). The results obtained by ServOMap are depicted on Table 5.
Test set Precision Recall F-score Runtime (s)Small FMA-NCI 0.951 0.815 0.877 141Whole FMA-NCI 0.727 0.803 0.763 2,690Small FMA-SNOMED 0.955 0.622 0.753 391Whole FMA- Large SNOMED 0.861 0.620 0.721 4,059Small SNOMED-NCI 0.933 0.642 0.761 1,699Whole NCI- Large SNOMED 0.822 0.637 0.718 6,320
Table 5. ServOMap results on Large BioMed Track
3 General comments
This is the second time that we participate in the OAEI campaign. While we participatedwith two configurations of our system to the 2012 edition of the campaign, respectivelywith ServOMap-lt and ServOMap, this year a unique version has been submitted. Sev-eral changes have been introduced. We moved from JENA to OWLAPI for processingontologies and a more recent version of the Apache Lucene API that is used as IR tool.This last change introduced some issues on having a wrapped tool compatible with theSeals client. Therefore, the uploaded version of ServOMap uses a downgraded versionof Lucene to be able to run correctly with the client. This resulted of a degraded perfor-mance and less robust system compared to that obtained with the actual version of ourtool. Further, the uploaded version has not been optimized in term of computation time.This affected particularly the runtime for the Large BioMed Track.
3.1 Comments on the results
The evaluated ServOMap version for OAEI 2013 shows a significant improvement forthe conference and library track. We have increased our recall in several tasks with-out loosing enough in term of precision. Overall, We notice that, the introduction ofstring similarity measures and inconsistency repair facility affected the computation

time. However, ServOMap confirmed its ability to cope with very large dataset but alsoshows that it relies heavily on the terminological richness of the input ontologies.
4 Conclusion
We have briefly described the ServOMap ontology matching system and presented theresults achieved during the 2013 edition of the OAEI campaign. Several components,including Machine Learning based contextual similarity computing, have been added tothe previous version. In the vein of the last year participation, the performance achievedby ServOMap are still very interesting and places it among the best system for largescale Ontology matching. Future work will include improving the strategy of contextualsimilarity computing and focusing on a more efficient semantic filtering component ofcandidate mappings. Further, we will investigate interactive and multilingual matchingissues.
5 Acknowledgments
This work has been partly supported by the EU FP7 ARITMO project. We also thankthe organizers of OAEI with providing test dataset and the evaluation infrastructure.
References
1. M. Ba and G. Diallo. Large-scale biomedical ontology matching with servomap. IRBM,34(1):56 – 59, 2013. Digital Technologies for Healthcare.
2. Gayo Diallo. Efficient building of local repository of distributed ontologies. In IEEE Pro-ceedings of the SITIS’2011 International Conference., pages 159–166, November 2011.
3. Gayo Diallo. An ontology-based architecture for structured and unstructured data manage-ment. PhD thesis, Universite Joseph Fourier - Grenoble 1, December 2006. Original Title:Une Architecture a base d’Ontologies pour la Gestion Unifiees des Donnees Structurees etnon Structurees.
4. George A. Miller. Wordnet: A lexical database for english. COMMUNICATIONS OF THEACM, 38:39–41, 1995.
5. Pavel Shvaiko and Jerome Euzenat. Ontology matching: State of the art and future challenges.IEEE Trans. Knowl. Data Eng., 25(1):158–176, 2013.
6. Giorgos Stoilos, Giorgos Stamou, and Stefanos Kollias. A string metric for ontology align-ment. In Y. Gil, editor, Proceedings of the International Semantic Web Conference (ISWC 05),volume 3729 of LNCS, pages 624–637. Springer-Verlag, 2005.
7. Mark Hall, Eibe Frank, Geoffrey Holmes, Bernhard Pfahringer, Peter Reutemann, and Ian H.Witten. The weka data mining software: An update. SIGKDD Explor. Newsl., 11(1):10–18,November 2009.
8. Ernesto Jimenez Ruiz, Bernardo Cuenca Grau, Yujiao Zhou, and Ian Horrocks. Large-scaleinteractive ontology matching: Algorithms and implementation. In Proceedings of the 20thEuropean Conference on Artificial Intelligence (ECAI), pages 444–449. IOS Press, 2012.
9. Jose-Luis Aguirre, Kai Eckert, Jerome Euzenat, Alfio Ferrara, Willem Robert van Hage, LauraHollink, Christian Meilicke, Andriy Nikolov, Dominique Ritze, and Francois Scharffe et al.Results of the ontology alignment evaluation initiative 2012. In Pavel Shvaiko, Jerome Eu-zenat, Anastasios Kementsietsidis, Ming Mao, Natasha Fridman Noy, and Heiner Stucken-schmidt, editors, OM, volume 946 of CEUR Workshop Proceedings. CEUR-WS.org, 2012.

SLINT+ Results for OAEI 2013 Instance Matching
Khai Nguyen1 and Ryutaro Ichise2
1 The Graduate University for Advanced Studies, [email protected]
2 National Institute of Informatics, [email protected]
Abstract. The goal of instance matching is to detect identity resources, whichrefer to the same real-world object. In this paper, we introduce SLINT+, a novelinterlinking system. SLINT+ detects all identity linked data resources betweentwo given repositories. SLINT+ does not require the specifications of RDF pred-icates and labeled matching resources. SLINT+ performs competitively at OAEIinstance matching campaign this year.
1 Presentation of the system
The problem of detecting instances co-referring to the same real-world object is pos-itively important in data integration. It is useful for reducing the heterogeneity andwarranting the consistency of data. The asynchronous development of linked data in-creasingly requires the specific linked data instance matching algorithms to connectexisting instances and newly added instances.
In linked data, the differences of data representation appear not only in object val-ues, but also in RDF predicates, which specify the meaning of objects properties. Thisissue is popularly found in different data repositories or even the same repository butdifferent domains. Also, it separates the current solutions into two groups: schema-dependent and schema-independent. The first approach uses the descriptions of RDFpredicate as the guide for matching while the second approach does not. In addition,the schema-independent approach consists of two minor branches: supervised learningand unsupervised learning, which involve with using or not using the labeled data ofidentity instances.
We develop SLINT [3] and its extension SLINT+ [2]. These systems are schema-independent and training-free. SLINT+ is used for instance matching track of OAEI2013.
1.1 State, purpose, general statement
SLINT+ is a flexible schema-independent linked data interlinking system. SLINT+ caninterlink various data sources, and is independent on the schema of data sources. Bydetecting appropriate predicate alignments without supervised learning, SLINT+ doesnot require expensive curation on data examples.
The principle of SLINT+ is similar to previous data interlinking systems. Thereare two main phases in the interlinking process of SLINT+: candidate generation and

Fig. 1. The interlinking process of SLINT+
instance matching. The first phase separates similar instances into different groups inorder to reduce the number of the pending pairs. The second phase will determine whichcandidate is really identity. With the schema-independent goal, we add two steps intoSLINT+: predicate selection and predicate alignment. The mission of these new stepsis to find the predicate alignments specifying the same properties of instances.
1.2 Specific techniques used
The architecture of SLINT+ is depicted in Fig.1. DS and DT are the source and targetdata. The predicate selection step finds the important predicate by some statistical mea-sures based on RDF objects involving with each predicate. The predicate alignment stepmatches important predicates and selects the reasonable alignments. This step can berecognized as an instance-based ontology matching task. The candidate generation steppicks up similar instances, which are predicted to be identity. The final step, instancematching, compares suggested candidates and produces the interlinking result. In thefollowing sections, we describe the details of each step in order of the process.
1.2.1 Predicate selectionThis is the first step of the interlinking process. It collects the important predicates
of each input data sources. Important predicates are expected to be used by a largeportion of instances and stored specific information of each instance. Thus, an importantpredicate should have high frequency and diver RDF objects.
We use coverage and discriminability as the metrics to evaluate the importance levelof each predicate. These metrics are the extensions from [4]. Equation (1) and (2) in turn

are the formulas of coverage Cov(pk) of predicate pk and its discriminability Dis(pk).The notation < s, p, o > stands for subject, predicate, and object of a RDF triple. x, D,and f are the instance, data source, and frequency of RDF object, respectively.
Cov(pk) =|{x|x ∈ D, ∃t =< s, pk, o >∈ x}|
|D| (1)
Dis(pk) =V ar(pk)×H(pk)
V ar(pk) +H(pk)
V ar(pk) =|Opk
||{t|∃x ∈ D, t =< s, pk, o >∈ x}|
H(pk) =−∑
oi∈Opk
f(oi)∑oj∈Opk
f(oj)× log
f(oi)∑oj∈Opk
f(oj)
Opk= {o|∃x ∈ D, t =< s, pk, o >∈ x}
(2)
A predicate is important if its coverage, discriminability, and the harmonic meansof them are greater than given thresholds α, β, and γ, respectively. We select two setsof important predicates, from two input data sources. In the next step, we align thesesets and find the useful predicate alignments.
1.2.2 Predicate alignmentIn this step, we firstly group the predicates by their type. The type of a predicate is de-
termined by the dominant type of its RDF objects. There are five predicate types used inSLINT+: string, URI, double, integer, and date. Secondly, we combine the type-similarpredicates of source and target data to get raw predicate alignments. Confidence is theevidence for evaluating the usefulness of raw alignments. The confidence is estimatedusing the intersection of all RDF objects described by the predicates of each alignment.Equation (3) describes the confidence of the alignment between predicates pi and pj .
conf(pi, pj) =|R(Opi
) ∩R(Opj)|
|R(Opi) ∪R(Opj
)|Opi = {o|∃x ∈ DS , < s, pi, o >∈ x}Opj = {o|∃x ∈ DT , < s, pj , o >∈ x}
(3)
By using function R, the string, URI, and double are compared indirectly. For stringand URI, R collects lexical words from given texts and links. For double, R rounds thevalues into two decimal points precision. For the remaining types, R uses the originalvalues without transformation.
Only useful alignments whose confidence is greater than a threshold will be keptfor the next steps. This threshold is computed by averaging the confidence of non-trivial alignments. An alignment is considered as non-trivial if its confidence is higherthan threshold ε, a small value. In the next steps, useful alignments will be used as thespecification for comparing instances.

1.2.3 Candidate generationThe goal of candidate generation is to limit the number of instances to be compared.
SLINT+ performs a very fast comparison for each pair of instances. The result of thiscomparison is a rough similarity between instances. It is consolidated from their sharedRDF objects, without any consideration for each predicate alignment. That is, two com-pared RDF objects can associate with two predicates having no alignments selected.Equation (4) is the rough similarity of instances xS and xT . In this equation, A is theset of filtered predicate alignments; R is the preprocessing procedure, as used in pred-icate alignment step; w(O,S) and w(O, T ) are the weight of shared value O in eachdata source DS and DT , respectively. The weight of string and URI values is estimatedby the TF-IDF score while that of remaining types is fixed to 1.0.
rough(xS , xT ) =∑
O∈R(OS)∩R(OT )
w(O,DS)× w(O,DT )× sum(pS)× sum(pT )
Ok = {o|∃x ∈ Dk, < s, pk, o >∈ x}sum(pS) =
∑(pS ,p)∈A
conf(pS , p)
sum(pT )∑
(p,pT )∈A
conf(p, pT )
(4)
Although the rough similarity is computed for each pair of instances, in technicalaspect, it can easily be accumulated by passing through each repository only one timein combination with matrix representation for all rough similarities.
Candidates are the pairs whose similarity satisfies two conditions. First, it mustbe higher than the average similarity of all others λ, because not every instance insource data has the identities in target data. Second, it must be relatively higher thanthe similarity of the others, in which each instance of the current pair participating. Inaddition, we multiply the maximum similarity with a damping factor ζ to avoid thesingle pairing assumption.
1.2.4 Instance matchingFor each candidate, we re-compute the similarity and then select identity pairs based
on this measure. The similarity of two instances is calculated from the shared valuesin RDF objects, which are described by each pair of useful predicate alignments. Theconfidence of each alignment is used as the weight for the similarity. Concretely, thesimilarity function is given in equation (5). In this equation, R is similar with the pre-vious steps; and corr is the similarity function for RDF objects declared by pS and pT .corr function works variously for different type of data. For string and URI, it computesthe TF-IDF cosine similarity. For double and integer, it returns the inverted disparity.For date, it simply performs the exact matching.

sim(xS , xT ) =1
W×
∑<pS ,pT>∈A
conf(pS , pT )× corr(R(OS), R(OT )),
Ok = {o|∃x ∈ Dk, < s, pk, o >∈ x}W =
∑<pS ,pT>∈A
conf(pS , pT )
(5)
Similar to selecting candidate in the previous step, we use η and θ as the samefunctions and estimations with λ and ζ in the candidate generation step.
The instance matching step closes the standard interlinking process of SLINT+.Next, we describe the configuration for participating OAEI 2013 instance matching.
1.3 Adaptations made for the evaluation
The instance matching track this year requests participant to connect instances betweenDBpedia and an anonymous synthesis repository. There are five test cases with differentdifficulty levels. To simplify the experiment, our aim is not using different parametersfor each test case. Therefore, we select the configuration that conciliate the results anduse it for all test cases. We installed the parameters of SLINT+ by testing the system ontraining data. We set α, β, γ to 0.01, ε = 0.01, ζ = 0.20 and θ = 0.75. We slightly modifythe use of η and θ. Instead of using average value of similarities, we permanently set ηand λ to 0.
We use BM25 weighting scheme as an alternative for TF-IDF modified cosine incomputing the string similarity in instance matching step. To improve the quality ofstring matching, we remove the words whose frequency is under 0.25.
In addition, we use some unsupervised transformation on the data before inputtingto the system. For test case #2, we leverage the information stored in linked instances.In order to obtain adequate properties for matching, we recover the hidden data bydereferencing the linked instances provided in RDF objects. For test case #3, #4, and#5, we use machine translation to get the English version of French strings stored inthe target data. SLINT+ currently does not support multilingual matching. Translationfrom other languages into English is a prerequisite.
1.4 Link to the system, parameters file, and provided alignments
SLINT+ is available to be downloaded at http://ri-www.nii.ac.jp/SLINT/oaei2013.html.We also provide the parameters and the set of alignments for OAEI 2013 instancematching on this page.
2 Results
In this section, we report the experiment result of SLINT+. The results of candidategeneration and instance matching are separately reported. To evaluate the final result

Table 1. Candidate generation result
Test case Number of candidates Pair completeness Reduction ratio#1 2675 0.995 0.986#2 3602 1.000 0.994#3 5000 0.995 0.971#4 5438 0.987 0.968#5 7177 0.991 0.967
Table 2. Instance matching result
Test case Recall Precision F1#1 0.979 0.979 0.979#2 0.998 1.000 0.999#3 0.913 0.935 0.924#4 0.909 0.912 0.910#5 0.880 0.875 0.878
Table 3. Total runtime
Test case Runtime (in millisecond)#1 409#2 421#3 342#4 283#5 353
of data interlinking process, we use the conventional measures: Recall, Precision, andF1 score. To evaluate candidate generation, we use Pair completeness and Reductionratio [4]. Pair completeness expresses how many actual identity pairs are selected tothe candidate set. Reduction ratio is the compression level of instance matching poolcomparing with all possible instances pairs between given data sources. We also reportthe runtime of SLINT+. The experiment was conducted on a computer running withcore 2 quad 2.66 GHz CPU, 4 GB of RAM, and Windows 7 64 bit version.
The result of candidate generation, instance matching, and time consumption aregiven in Table 1, Table 2, and Table 3, respectively.
The results of candidate generation are very good when reserving at least 98.7% ofcorrect alignments and nearly 100% on test case #2. In addition, the largest number ofcandidate is only 7177, which reduces 96.7% of total instance pairs.
The final results of SLINT+ are generally good. Comparing Recall and Pair com-pleteness on each test, they are similar on test case #1 and #2 and about 7% differenton remaining test cases. In addition, SLINT+ performs a stable interlinking since theprecision and recall are equivalent for all test cases.
The main reason for the lower result on test case #3, #4, and #5 comes from thetransformation of string values. We temporarily used machine translation to convertstrings from French to English before conducting the matching process. A better trans-lation strategy may boost the Recall of SLINT+ on these test cases.
The runtime of SLINT+ is very short. It takes about 350 milliseconds for SLINT+to finish each test case. This is a promising indication for designing a scalable systembased on SLINT+ in the future.
3 General comments
3.1 Comments on the OAEI 2013 test cases
Comparing with recent years, the test cases of this time are more interesting and chal-lenging. It is very reasonable when OAEI organizers publish the offline data for keepingthe same input for all participants. In addition, it is effective that the test cases can in-spect the advantages of each system.
The test cases for this year assume that every instance in source data has an identicalone in target data. In our opinion, it could be more efficient if there is a test case thatdoes not imply this assumption. Besides that, the various sizes of data can help evaluatethe performance of participants.
3.2 Comments on the OAEI 2013 measures
Since most interlinking systems generate potentially identity instances before match-ing, we suggest to evaluate this step in separation with instance matching, as also wasrecommended in [1]. There are many recognized measures in assessing the quality ofthis step, such as recall, and reduction ratio as we reported in this paper.
4 Conclusion
We introduced SLINT+, a schema-independent and training-free linked data interlink-ing system. SLINT+ performs four steps interlinking including predicate selection,predicate alignment, candidate generation, and instance matching. SLINT+ gives apromising result at the campaign this year.
Implementing a graph matching algorithm is our objective in improving SLINT+.Since linked data is basically a graph, leveraging linking characteristics between in-stances will result more confident matching quality. Improving SLINT+ to a scalablesystem is also our current goal.
References
1. Euzenat J (2012). A modest proposal for data interlinking evaluation. In: ISWC’12 7th Work-shop on Ontology Matching, pp. 234.
2. Nguyen K, Ichise R, Le B (2012). Interlinking linked data sources using a domain-independentsystem. In: 2nd Joint International Semantic Technology, pp.113-128, LNCS 7774.
3. Nguyen K, Ichise R, Le B (2012). SLINT: A schema-independent linked data instance match-ing system. In: ISWC’12 7th Workshop on Ontology Matching, pp. 1-12.
4. Song D, Heffin J (2011). Automatically generating data linkages using a domain-independentcandidate selection approach. In: ISWC’ 11, pp. 649-664.

System for Parallel Heterogeneity Resolution (SPHeRe)results for OAEI 2013
Wajahat Ali Khan, Muhammad Bilal Amin, Asad Masood Khattak, Maqbool Hussain,and Sungyoung Lee
Department of Computer EngineeringKyung Hee University
Seocheon-dong, Giheung-gu, Yongin-si, Gyeonggi-do, Republic of Korea, 446-701{wajahat.alikhan, mbilalamin, asad.masood, maqbool.hussain, sylee}@oslab.khu.ac.kr
Abstract. SPHeRe is an ontology matching system that utilizes cloud infrastruc-ture for matching large scale ontologies and focus on alignment representationto be stored in the Mediation Bridge Ontology (MBO). MBO is the mediationontology that stores all the alignments generated between the matched ontolo-gies and represents it in a manner that provides maximum metadata information.SPHeRe is a new initiative therefore it only participates in the large biomedicalontologies track of the OAEI 2013 campaign. The objectives of SPHeRe systemparticipation in OAEI is to shift focus of ontology matching community towardsareas such as cloud utilization, effective mapping representation, and flexible andextendable design of the matching system.
1 Presentation of the system
Ontology mappings enables accessibility of information by aligning the resources inontologies belonging to diverse organizations [3]. These also resolves semantic het-erogeneities among data sources. Mainly two steps are required to overcome seman-tic heterogeneity: Matching resources to determine alignments and interpreting thosealignments according to application requirements [5].
We have started developing SPHeRe system in 2013 and its an ongoing project. Theobjectives of SPHeRe system are performance [2], accuracy, mapping representation,and flexible and extendible design of the system.
1.1 State, purpose, general statement
SPHeRe system target a complete package of a system with main objectives as accu-racy, mapping representation, and flexible and extendible system. Its precision is on thehigher side in large biomedical ontologies track, that shows its potential of improvingthe accuracy. It is based on different algorithms such as String Matching Bridge, Syn-onym Bridge, Child Based Structural Bridge (CBSB), Property Based Structural Bridge(PBSB), and Label Bridge. We plan to include further bridge algorithms in next versionof the proposed system by incorporating new matching techniques.
Parallelism has been overlooked by ontology matching systems. SPHeRe avails thisopportunity and provides a solution by: (i) creating and caching serialized subsets of
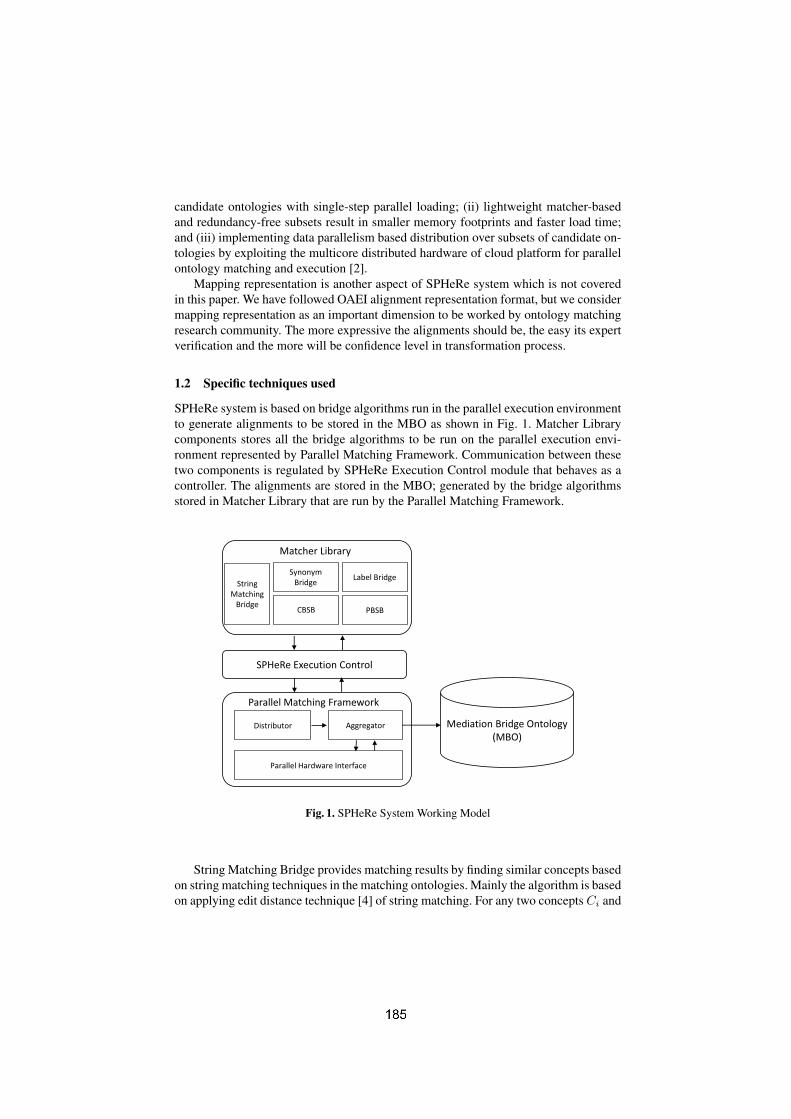
candidate ontologies with single-step parallel loading; (ii) lightweight matcher-basedand redundancy-free subsets result in smaller memory footprints and faster load time;and (iii) implementing data parallelism based distribution over subsets of candidate on-tologies by exploiting the multicore distributed hardware of cloud platform for parallelontology matching and execution [2].
Mapping representation is another aspect of SPHeRe system which is not coveredin this paper. We have followed OAEI alignment representation format, but we considermapping representation as an important dimension to be worked by ontology matchingresearch community. The more expressive the alignments should be, the easy its expertverification and the more will be confidence level in transformation process.
1.2 Specific techniques used
SPHeRe system is based on bridge algorithms run in the parallel execution environmentto generate alignments to be stored in the MBO as shown in Fig. 1. Matcher Librarycomponents stores all the bridge algorithms to be run on the parallel execution envi-ronment represented by Parallel Matching Framework. Communication between thesetwo components is regulated by SPHeRe Execution Control module that behaves as acontroller. The alignments are stored in the MBO; generated by the bridge algorithmsstored in Matcher Library that are run by the Parallel Matching Framework.
SPHeRe Execution Control
Mediation Bridge Ontology (MBO)
Matcher Library
Parallel Matching Framework
Distributor Aggregator
Parallel Hardware Interface
String Matching
Bridge
Synonym Bridge Label Bridge
PBSBCBSB
Fig. 1. SPHeRe System Working Model
String Matching Bridge provides matching results by finding similar concepts basedon string matching techniques in the matching ontologies. Mainly the algorithm is basedon applying edit distance technique [4] of string matching. For any two concepts Ci and

Cj of the ontologies Oi and Oj respectively, edit distance is applied to find matchingvalue, SimScore ←− Ci. EditDistance (Cj). A threshold Threshold value of n isset for matching in String Matching Bridge algorithm to limit the number of impuremappings.
Label Bridge uses the labels of the source and target concepts for matching. Ini-tially, concept labels are normalized e.g. using stop word elimination, then list of thesource concept labels are matched with list of the target concept labels. The source andtarget concepts label list LabelListi and LabelListj are matched using ((LabelListi∩ LabelListj) �= φ). If any label in the lists matches, the source and target concepts arestored in the MBO as mappings.
Synonym Bridge is based on finding the similarity between concepts using word-net [1]. The relationship is identified based on matching the synonyms of the conceptsaccessed using wordnet. Initially synonyms of source Listl := Ci.GetSynonymWordnetList()and target Listm := Cj .GetSynonymWordnetList() concepts are extracted using word-net; where Ci and Cj are the source and target concepts respectively. The numberof common synonyms MatchedItems is found for calculating the matching valueSimScore. If its value is less than the threshold then this alignment is discarded, oth-erwise stored in the MBO.
Child Based Structural Bridge (CBSB) bridge generates mappings between sourceand target ontologies based on matching children of the concepts. Initially, children ofsource Ci and target Cj concepts are accessed as lists ChildListi and ChildListj re-spectively. The number of common children in the lists is identified as MatchChildren.Finally the matching value SimScore is calculated and compared with the thresholdThreshold that is assigned value n. The matching value is calculated using SimScore←− MatchedChildren / Average(ChildListi, ChildListj). Property Based Struc-tural Bridge (PBSB) uses String Matching Bridge techniques to match properties ofsource and target concepts for finding similar properties. This information is utilized asin CBSB for matching the source and target ontologies concepts based on their prop-erties. These bridge algorithms are run on a parallel execution environment for betterperformance of the system.
Multiphase design of SPHeRe system is represented in Fig. 2(taken from [2])that describes the parallelism inclusion in ontology matching process for better per-formance. The first phase of the system is ontology loading and management, in whichthe source and target ontologies are loaded in parallel by multithreaded ontology loadinterface (OLI). The main tasks of OLI includes; parallel loading of source and targetontologies, parsing for object model creation, and finally ontology model serializationand de-serialization. This is an important phase for data parallelism over multi-threadedexecution into the second phase of distribution and matching [2].
Serialized subsets of source and target ontologies are loaded in parallel by multi-threaded ontology distribution interface (ODI). ODI is responsible for task distributionof ontology matching over parallel threads (Matcher Threads). ODI currently imple-ments size-based distribution scheme to assign partitions of candidate ontologies to bematched by matcher threads. In a single node, matcher threads correspond to the num-ber of available cores for the running instance. In multi-nodes, each node performs itsown parallel loading and internode control messages which are used to communicate

Fig. 2. Performance of SPHeRe System [2]
regarding the ontology distribution and matching algorithms. Matched results providedby matcher threads are submitted to accumulation and delivery phase for the MBOcreation and delivery [2].
Ontology Aggregation Interface (OAI) accumulates matched results provided bymatcher threads. OAI is responsible for MBO creation by combining matched results asmappings and delivering MBO via cloud storage platform. OAI provides a thread-safemechanism for all matcher threads to submit their matched results. After the completionof all matched threads, OAI invokes MBO creation process which accumulates all thematched results in a single MBO instance [2]. In case of multi-node distribution, OAIalso accumulates results from remote nodes after completion of their local matcherthreads. This is a summary version of the performance oriented ontology matchingprocess of SPHeRe system, extracted from [2], that provides a detailed version of theoverall process.
1.3 Link to the system and parameters file
https://sites.google.com/a/bilalamin.com/sphere/results
1.4 Link to the set of provided alignments (in align format)
https://sites.google.com/a/bilalamin.com/sphere/results

2 Results
SPHeRe is deployed in multi-node configuration on virtual instances (VMs) over a tri-node private cloud equipped with commodity hardware. Each node is equipped withIntel(R) Core i7(R) CPU, 8GB memory with Xen Hypervisor. Jena API is utilized forits inferencing capabilities. As SPHeRe is using cloud infrastructure therefore initiallywe have only targeted large biomedical ontologies track. The results are as follows:
2.1 Large biomedical ontologies
SPHeRe is a cloud based ontology matching system that provides the facility to user formatching large scale ontologies without changing their hardware specifications. Fig-ure 3 shows the results of our proposed system in large biomedical ontologies track. Ithas shown better precision values in almost all the tracks except task 4, while the recallof the system needs to be improved.
Tasks Time (s)
#Mappings Scores Incoherence Analysis
Precision Recall F-Measure Unsat. Degree
Task 1 16 2359 0.960 0.772 0.856 367 3.6%
Task 2 8136 2610 0.846 0.753 0.797 1054 0.7%
Task 3 154 1577 0.916 0.162 0.275 805 3.4%
Task 4 20664 2338 0.614 0.160 0.254 6523 3.2%
Task 5 2486 9389 0.924 0.469 0.623
Task 6 10584 9776 0.881 0.466 0.610
Fig. 3. SPHeRe Large Biomedical Ontologies Track Results
3 General comments
3.1 Comments on the results
Performance and precision are the strengths of our system. The design of proposedsystem also adds to its strength as it is a extendible and reusbale system. Recall isthe main weakness of our system, but with the addition of new matching techniquesas bridge algorithms can improve this aspect and therefore accuracy can be improved.Extendibility allows adoption of new bridge algorithms easily into the proposed system.

3.2 Discussions on the way to improve the proposed system
New bridge algorithms incorporating new matching techniques is the next line of planfor the proposed system. Object oriented and ontology alignment design patterns areto be implemented for matching different tracks of OAEI campaign. We also tend toinclude instance based matching, and incorporate change management techniques inthe system.
4 Conclusion
SPHeRe system is a new initiative that relies on parallel execution of matcher bridge al-gorithms for achieving better performance and accuracy. The system is still working onimproving the accuracy by incorporating more matcher bridge algorithms to increasethe recall value of the system. Performance of the proposed system is better as com-pare to other system due to running large biomedical ontologies on a single system inappropriate time.
References
1. Wordnet a lexical database for english. http://wordnet.princeton.edu/, last visited in October2013
2. Amin, M.B., Batool, R., Khan, W.A., Huh, E.N., Lee, S.: Sphere: A performance initiativetowards ontology matching by implementing parallelism over cloud platform. In: Journal ofSupercomputing. Springer, in Press
3. Li, L., Yang, Y.: Agent-based ontology mapping and integration towards interoperability. Ex-pert Systems 25(3), 197–220 (2008)
4. Navarro, G.: A guided tour to approximate string matching. ACM computing surveys (CSUR)33(1), 31–88 (2001)
5. Pavel, S., Euzenat, J.: Ontology matching: state of the art and future challenges. Knowledgeand Data Engineering, IEEE Transactions on (25), 158–176 (2013)

SYNTHESIS: Results for the Ontology Alignment Evaluation Initiative (OAEI) 2013
Antonis Koukourikos1, 2, George Vouros2, Vangelis Karkaletsis1
1Institute 2Department of Digital Systems, University of Piraeus, Greece
Abstract. The paper presents the SYNTHESIS platform, a system for automatic ontology alignment. The system supports the model-based synthesis of different individual matching methods under a co-operational framework. The configura-tion that has been tested over the datasets provided by the OAEI 2013 tracks incorporates four matching methods. The paper provides a brief description of the system, presents the results acquired over the various OAEI 2013 Campaign tracks and discussework that will target the observed issues.
1 Presentation of the System
1.1 State, Purpose, General Statement
Given the plethora of the different proposed approaches to ontology alignment, as well as, the variations between them in terms of the types and different facets of infor-mation they exploit, the usage (or not) of various external resources and services [1], it is evident that we need effective methods for synthesizing different matching methods.
The present paper describes a specific configuration of the SYNTHESIS platform, a system for ontology matching that combines different methods under a model-based synthesis framework [2]. The objective of SYNTHESIS is to compute coherent align-ments, taking advantage of the distinct and complementary advantages of various matching methods. Subsequently we present the generic synthesis process, as well as, the individual methods integrated in the current version of the system. We proceed to present the results of SYNTHESIS over the different test sets of the OAEI 2013 cam-paign, and the conclusions regarding its performance, its strengths and weaknesses, and the focal points that should be taken into account for the improvement of the system.
1.2 Specific Matching Techniques Used
This section describes briefly the method for synthesizing different matching meth-ods that is employed by SYNTHESIS. Furthermore, it describes the individual match-ing methods incorporated in the configuration of the system that participated in the OAEI 2013 campaign.
Synthesis. The design and initial implementation of the described matching method is described in [2]. In this work, the synthesis of different matching methods is treated as a coordination problem, aiming to maximize the welfare of the interacting entities (agents). In this setting, each agent corresponds to a specific ontology element and to an individual matching method. Each agent is responsible to decide on a correspond-ence for its element to a target ontology, also in coordination with the other agents, so as to preserve the semantics of specifications. An agent is characterized by: (a) its state and (b) its utility function. The state ranges in the set of those elements in the target ontology that the matching method of the agent assesses element. A specific assignment to the state variable represents a decision on a specific correspondence. Nevertheless the utility of an agent for a specific correspond-ence depends on the states of neighboring agents. Specifically, the utility of an agent is specified to take into account structural constraints derived from subsumption relations among classes in the source ontology. These constraints represent dependencies be-
ed in order for the computed correspond-ences to preserve the semantics of ontological specifications and ensure the coherence of the correspondences.
Actually, neighbor agents of an agent A are those agents that correspond to the same ontology element but to different alignment methods, as well as those agents that cor-respond to ontology elements that are subsumed by the ontology element of A.
Agents are organized in graphs where they run the max-sum algorithm [3] to com-pute a joined set of correspondences (i.e. an alignment) so as to maximize the sum of their utilities.
SYNTHESIS is actually a generic platform that can be configured to incorporate any number of individual matching methods.
Methods incorporated in the current version of the system. The configuration of SYNTHESIS that was used for the OAEI 2013 campaign incorporates four, most of them fairly standard, matching methods. These are described in the following subsec-tions.
COCLU. This is a string matching technique. It is realized by a partition-based cluster-ing algorithm, which divides the examined data (strings in our cases) into clusters and searches over the created clusters using a greedy heuristic [4]. The clusters are repre-sented as Huffman trees, incrementally constructed as the algorithm generates and up-dates the clusters by processing one string at a time. The decision for adding a newly encountered string in a given cluster is based on a score function, defined as the differ-ence of the summed length of the coded string tokens that are members of the cluster and the corresponding length of the tokens in the cluster when the examined string is added to the cluster. The implementation incorporated into SYNTHESIS exploits and compares the local names, labels and comments of the examined classes.
VSM. This is a Vector Space Models-based method [5], computing the similarity be-tween two documents. In the case of mapping tasks, the pseudo-documents to be com-pared are constructed as follows: Each document corresponds to a class or property and
comprises words in the vicinity of that element, i.e. all words found in (a) local name, label and comments of the class; (b) the local name, label and comments for each of the
on for its related classes, as defined in [5]. The produced documents are represented as vectors of weighted index words. Each weight is the number in the document. We apply cosine similarity to measure the similarity between two vectors.
CSR. The CSR method [6] computes subsumption relationships between pairs of clas-ses belonging in two distinct ontologies. The method treats the mapping problem as a classification task, exploiting class properties and lexical information derived from la-bels, comments, properties and instantiations of the compared classes. Each pair of classes is represented as a feature vector, which has a length equal to the number of distinct features of the ontologies. The classifier is trained using information of both ontologies, considering each ontology in isolation.
LDM Alignment. This new method is conceived as part of a Linked Data management system, which uses unstructured textual information from the Web, in the form of ex-tracted relation triples, in order to perform various processes related to the whole spec-trum of managing and maintaining Linked Data repositories, such as Ontology Align-ment and Enrichment, Repository Population, Linkage to external repositories, and Content and Link Validation [7]. The method performs web searches, using lexical in-formation from the local names, labels and instances of the compared classes. The web documents returned from the web searches are pre-processed in order to derive their textual information, and relation tuples are extracted from each document. The sets of relation tuples associated with each class are compared, and similarity is as-sessed.
1.3 Adaptations Made for the Evaluation
After some preliminary runs of the system with the datasets provided by the OAEI campaign, it became evident that the main flaws of the system had to do with its ina-bility to handle ontologies of large size (in terms of the number of elements in the on-tology). This is due to the current implementation of the generic synthesis process and to the complexity of the methods incorporated in SYNTHESIS.
In order to produce a system of acceptable efficiency, we introduced a dynamic method allocation component in SYNTHESIS. The component performs a shallow analysis of the input ontologies, in terms of their size and their structure. After several runs with different method combinations for the campaign datasets, the following allo-cation strategy was adopted: the CSR and LDM methods were excluded when the source ontology included more than 300 classes and properties. Furthermore, CSR was excluded if the examined ontologies were relatively flat, that is if the hierarchy of clas-ses was not deeper that three subsumption levels.
While the motivation for the introduction of this component was to obtain meaning-ful results for as many OAEI tracks possible, we aim to expand on the idea of dynami-cally invoking different sets of mapping methods, depending on the specific alignment

task at hand. To this end, the method allocation component can become more intricate and analytic, and be able to select a specific configuration of mapping methods from a much larger pool, ensuring that the system has reasonable execution times while also preserving its performance in terms of precision and recall.
1.4 Link to the System and Parameters File
http://users.iit.demokritos.gr/~kukurik/SYNTHESIS.zip
1.5 Link to the set of provided alignments
http://users.iit.demokritos.gr/~kukurik/results.zip
2 Results
The subsections that follow provide an overview and a brief analysis of the results achieved by SYNTHESIS in the various tracks included in the OAEI 2013 Campaign. SYNTHESIS was packaged and executed following the setup defined by the SEALS platform and using the provided SEALS client executable JAR.
2.1 Benchmark
The following table summarizes the results obtained for the benchmark track, and specifically the bibliography test set.
Bibliographic Dataset Average Runtime H-mean Precision H-mean Recall
5217 msec 0.576 0.603
We furthermore obtained results for the finance test set, as it was provided via the SEALS platform. These results are summarized below:
Finance Dataset Average Runtime H-mean Precision H-mean Recall
974454 msec 0.504 0.605
2.2 Anatomy
SYNTHESIS was not able to finish its execution within a reasonable timeframe for this dataset.
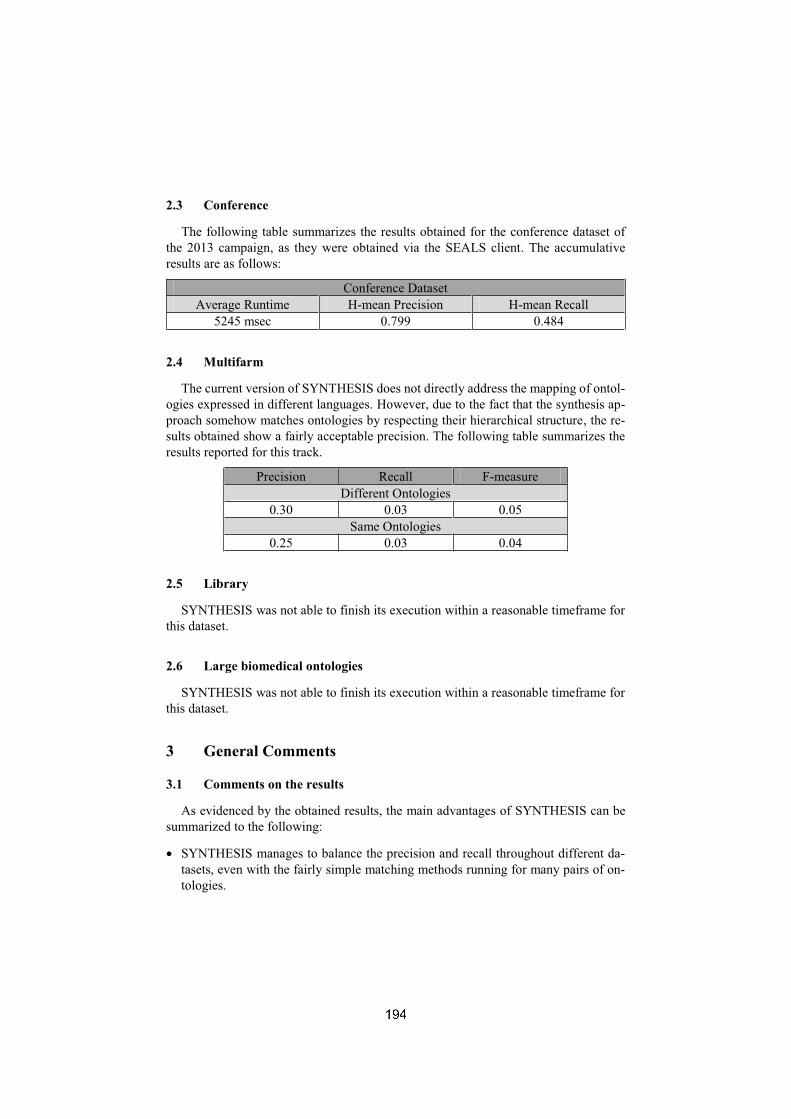
2.3 Conference
The following table summarizes the results obtained for the conference dataset of the 2013 campaign, as they were obtained via the SEALS client. The accumulative results are as follows:
Conference Dataset Average Runtime H-mean Precision H-mean Recall
5245 msec 0.799 0.484
2.4 Multifarm
The current version of SYNTHESIS does not directly address the mapping of ontol-ogies expressed in different languages. However, due to the fact that the synthesis ap-proach somehow matches ontologies by respecting their hierarchical structure, the re-sults obtained show a fairly acceptable precision. The following table summarizes the results reported for this track.
Precision Recall F-measure Different Ontologies
0.30 0.03 0.05 Same Ontologies
0.25 0.03 0.04
2.5 Library
SYNTHESIS was not able to finish its execution within a reasonable timeframe for this dataset.
2.6 Large biomedical ontologies
SYNTHESIS was not able to finish its execution within a reasonable timeframe for this dataset.
3 General Comments
3.1 Comments on the results
As evidenced by the obtained results, the main advantages of SYNTHESIS can be summarized to the following:
SYNTHESIS manages to balance the precision and recall throughout different da-tasets, even with the fairly simple matching methods running for many pairs of on-tologies.

When adequate lexical information is available, i.e. when names and com-ments were not suppressed, SYNTHESIS is able to exploit it and produce very good results.
The constraints taken into account by agents, enables SYNTHESIS to compute co-herent alignments.
In contrast, the main drawbacks of SYNTHESIS are:
The generic synthetic approach implemented in SYNTHESIS, does not scale well with respect to ontology size. While its runtime for small and medium size ontolo-gies is quite satisfactory, when dealing with large or very large ontologies, the sys-tem requires a significantly bigger execution time.
Scalability is significantly affected also by the performance of the individual match-ing methods incorporated in the OAEI 2013 system configuration.
The current configuration of SYNTHESIS is sensitive to the lack of adequate lexical information for the ontology elements. In the test cases where information like local class names and labels were suppressed, the results were significantly worse. This is due to the inclusion of mainly lexical-based matching methods in the current config-uration of the method.
3.2 Discussions on the ways to improve the current system
The drawbacks of the current configuration of SYNTHESIS directly lead to the main points that can be improved in the future. More specifically, the main problem in vari-ous tracks of the campaign was the fact that SYNTHESIS was not able to complete its execution within an acceptable timeframe. This motivates us to examine different scala-bility techniques and incorporate them in the system. The actions to improve scalability can refer to the performance of the individual methods used, as well as, the actual pro-cess of synthesizing the different methods under Synthesis.
Another important step towards improving SYNTHESIS is to design and incorporate a more intricate method for choosing individual mapping methods. This is an improve-ment step on itself, but it is a prerequisite for being able to introduce additional methods in Synthesis and use the ones more appropriate for a specific alignment task.
The ultimate goal is to incorporate methods that exploit different types of infor-mation available (lexical, semantic, structural) at various settings (e.g. ontologies in different languages), by performing a pre-processing step to detect the characteristics of an alignment tasks, and use the most appropriate methods for constructing the agents that will be part of the synthesis process.
4 Conclusion
The participation in the OAEI 2013 has provided significant input for the evaluation and evolution of our system. ontologies of large size, which will be the focus during the immediate next steps of our research. The more detailed feedback provided by the organizers of each track was also

of particular importance, as it provided further insights for the functionality and the requirements of an alignment system.
5 References
1. Ontology Matching: State o IEEE Transactions on Knowledge and Data Engineering 2013, pp. 158-176.
2. V. Spiliopoulos and George A. Vouros, "Synthesizing Ontology Alignment Methods Using the Max-Sum Algorithm", IEEE Transactions on Knowledge and Data Engineering, vol. 24(5), pp. 940-951, May, 2012.
3. -power embedded devices using the max- in Proc. Of the 7th International Conference on Autonomous Agents and Multiagent Systems (AAMAS 2008), Estoril, Por-tugal, 2008
4. through Proceedings of the OAEI (Ontology Alignment Evalua-tion Initiative) 2006 contest, Ontology Matching International Workshop, Athens, Georgia, USA, 2006
5. for the
2006 contest, Ontology Matching International Workshop, Busan, Korea, 2007 6. la-
World Wide Web, Volume 8(1), pp. 69-88, March 2010 7. A. Koukourikos, V. Karkaletsis, and G.A. Vo Exploiting unstructured web infor-
mation for managing linked data spaces in Proceedings of the 17th Panhellenic Conference on Informatics (PCI '13), Thessaloniki, Greece, September 2013

WeSeE-Match Results for OAEI 2013
Heiko Paulheim1 and Sven Hertling2
1 University of MannheimData and Web Science Group
[email protected] Technische Universitt Darmstadt
Knowledge Engineering [email protected]
Abstract. WeSeE-Match is a simple, element-based ontology matching tool. Itsbasic technique is invoking a web search engine request for each concept anddetermining element similarity based on the similarity of the search results ob-tained. Multi-lingual ontologies are translated using a standard web based transla-tion service. Furthermore, it implements a simple strategy for selecting candidatemappings interactively.
1 Presentation of the system
1.1 State, purpose, general statement
The idea of WeSeE-Match is to use information on the web for matching ontologies.When developing the algorithm, we were guided by the way a human would possiblysolve a matching task. Consider the following example from the OAEI anatomy track1:one element in the reference alignment are the two classes with labels eyelid tarsus andtarsal plate, respectively. As a person not trained in anatomy, one might assume thatthey have something in common, but one could not tell without doubt.
For a human, the most straight forward strategy in the internet age would be tosearch for both terms with a search engine, look at the results, and try to figure outwhether the websites returned by both searches talk about the same thing. Implicitly,what a human does is identifying relevant sources of information on the web, and an-alyzing their contents for similarity with respect to the search term given. This naivealgorithm is implemented in WeSeE-Match.
Furthermore, WeSeE-Match uses a basic method for interactive matching, whichtries to adaptively set the threshold for selecting the final alignment from the set ofcandidates.
1.2 Specific techniques used
The core idea of our approach is to use a web search engine for retrieving web docu-ments that a relevant for concepts in the ontologies to match. For getting search terms
1 http://oaei.ontologymatching.org/2013/anatomy/

from ontology concepts (i.e., classes and properties), we use the labels, comments, andURI fragments of those concepts as search terms. The search results of all concepts arethen compared to each other. The more similar the search results are, the higher theconcepts’ similarity score.
To search for websites, we use URI fragments, labels, and comments of each con-cept as search strings, and perform some pre-processing, i.e., splitting camel case andunderscore separated words into single words, and omitting stop words. For everysearch result, all the titles and summaries of web pages provided by the search en-gine are put together into one describing document. This approach allows us to parseonly the search engine’s answer, while avoiding the computational burden of retrievingand parsing all websites in the result sets. The answer provided by the search enginecontains titles and excerpts from the website (i.e., some sentences surrounding the oc-curance of the search term in the website). Therefore, we do not use whole websites,but ideally only relevant parts of those web sites, i.e., we exploit the search engine bothfor information retrieval and for information extraction.
For each concept c, we perform a single search each for the fragment, the label,and the comment (if present), thus, we generate up to three documents docfragment(c),doclabel(c), and doccomment(c). The similarity score for each pair of concepts is thencomputed as the maximum similarity over all of the documents generated for thoseconcepts:
sim(c1, c2) := maxi,j∈{fragment,label,comment}sim∗(doci(c1), docj(c2)) (1)
For computing the similarity sim∗ of two documents, we compute a TF-IDF score,based on the complete set of documents retrieved for all concepts in both ontologies.
Using the TF-IDF measure for computing the similarity of the documents has sev-eral advantages. First, stop words like and, or, and so on are inherently filtered, becausethey occur in the majority of documents. Second, terms that are common in the domainand thus have little value for disambiguating mappings are also weighted lower. Forexample, the word anatomy will occur quite frequently in the anatomy track, thus, ithas only little value for determining mappings there. On the other hand, in the librarytrack, it will be a useful topic identifier and thus be helpful to identify mappings. TheTF-IDF measure guarantees that the word anatomy gets weighted accordingly in eachtrack.
The result is a score matrix with elements between 0 and 1 for each pair of conceptsfrom both ontologies. For each row and each column where there is a score exceedingτ , we return that pair of concepts with the highest score as a mapping. Furthermore, thefilter chain explained in [2] is used, which removes mappings for datatype propertieswith different ranges, as well as mappings that refer to any imported ontologies.
For multi-lingual ontologies, we first translate the fragments, labels, and commentsto English as a pivot language [4]. The translated concepts are then processed as de-scribed above.
While the threshold is set to fixed values for the standard tracks in the evaluation,we use an interactive method of selecting the threshold in the interactive track. Weuse a binary search for selecting the threshold, as discussed in [6], using the followingalgorithm:
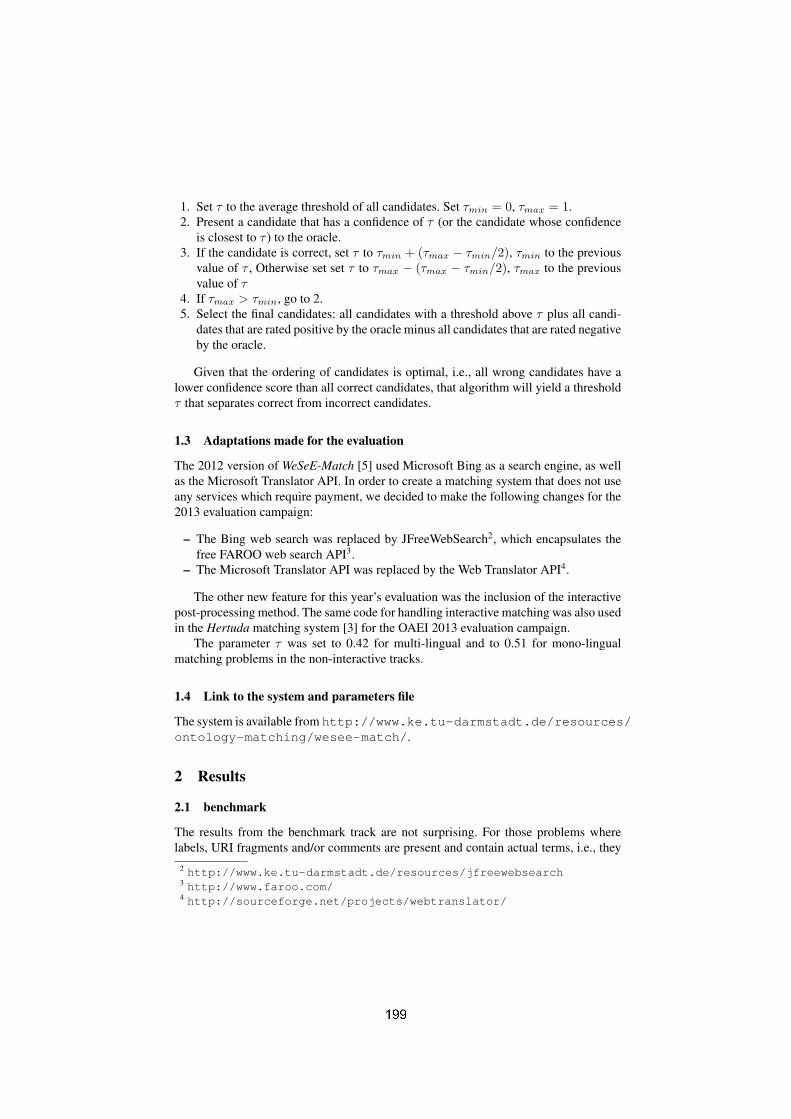
1. Set τ to the average threshold of all candidates. Set τmin = 0, τmax = 1.2. Present a candidate that has a confidence of τ (or the candidate whose confidence
is closest to τ ) to the oracle.3. If the candidate is correct, set τ to τmin + (τmax − τmin/2), τmin to the previous
value of τ , Otherwise set set τ to τmax − (τmax − τmin/2), τmax to the previousvalue of τ
4. If τmax > τmin, go to 2.5. Select the final candidates: all candidates with a threshold above τ plus all candi-
dates that are rated positive by the oracle minus all candidates that are rated negativeby the oracle.
Given that the ordering of candidates is optimal, i.e., all wrong candidates have alower confidence score than all correct candidates, that algorithm will yield a thresholdτ that separates correct from incorrect candidates.
1.3 Adaptations made for the evaluation
The 2012 version of WeSeE-Match [5] used Microsoft Bing as a search engine, as wellas the Microsoft Translator API. In order to create a matching system that does not useany services which require payment, we decided to make the following changes for the2013 evaluation campaign:
– The Bing web search was replaced by JFreeWebSearch2, which encapsulates thefree FAROO web search API3.
– The Microsoft Translator API was replaced by the Web Translator API4.
The other new feature for this year’s evaluation was the inclusion of the interactivepost-processing method. The same code for handling interactive matching was also usedin the Hertuda matching system [3] for the OAEI 2013 evaluation campaign.
The parameter τ was set to 0.42 for multi-lingual and to 0.51 for mono-lingualmatching problems in the non-interactive tracks.
1.4 Link to the system and parameters file
The system is available from http://www.ke.tu-darmstadt.de/resources/ontology-matching/wesee-match/.
2 Results
2.1 benchmark
The results from the benchmark track are not surprising. For those problems wherelabels, URI fragments and/or comments are present and contain actual terms, i.e., they
2 http://www.ke.tu-darmstadt.de/resources/jfreewebsearch3 http://www.faroo.com/4 http://sourceforge.net/projects/webtranslator/

are not replaced by random strings, WeSeE-Match provides reasonable results. As soonas those strings are removed, the F-measure of WeSeE-Match drops, since no otherevaluation (e.g., ontology structure) is used by WeSeE-Match.
The evaluation of runtime also reveals that WeSeE-Match is one of the slowestmatching systems participating in the campaign. This is due to the fact that the searchengine used restricts the usage to one request per second. Thus, WeSeE-Match spends alot of idle time to fulfill that requirement.
2.2 anatomy and conference
On anatomy, WeSeE-Match is one of the worst performing matchers, suffering both inprecision in recall. It is in particular interesting to see the drop from last year’s perfor-mance (F-measure 0.829) to this year’s (F-measure 0.47), where the only significantchange was the use of a different search engine. This shows that the choice of the websearch engine in search-engine based matching can make a huge difference in the re-sults.
In the conference track, the differences to last year are not that significant, endingat a comparable F-measure of 0.55, which makes WeSeE-Match an average matcher inthe conference track.
2.3 multifarm
For multifarm, the F-measure has dropped from 0.41 in OAEI 2012 to 0.15 in OAEI2013. As discussed above, the performance on the English-only conference track, whichunderlies multifarm, has remained stable, so this is mainly an effect of the use of adifferent translation engine. Again, it becomes obvious that the choice of a differenttranslation engine clearly influences the results.
In detail, the 2012 version of WeSeE-Match was capable of matching Chinese andRussian ontologies, because these languages were supported by the Microsoft Transla-tor API, but not the Web Translator API. Furthermore, the results for Czech are signif-icantly below the 2012 results, which shows a suboptimal support for that language inthe Web Translator API. For the other languages, the results have remained on a similarlevel.
2.4 library and large biomedical ontologies
Since WeSeE-Match is not optimized for scalability (in particular, necessary waitingtimes to avoid blocking from search engine providers slow down the matcher), it couldnot be run on those larger tracks due to time limits. However, the approach does inprinciple scale up to larger ontologies as well. In the OAEI 2012 campaign, for example,WeSeE-Match was capable of completing the library track, when the time limit was setto one week instead of one day [1].

Table 1. Thresholds and results in the interactive track. The table depicts the best possible thresh-old and the F-measure that is achieved with that threshold, as well as the threshold chosen andthe F-measure achieved by WeSeE-Match. In cases where an interval of thresholds leads to thesame result, we report the average of that interval.
best possible selection actual selectionTest case Threshold Precision Recall F-measure Threshold Precision Recall F-Measurecmt-conference 0.14 0.438 0.467 0.452 0.03 0.304 0.467 0.368cmt-confOf 0.15 0.385 0.313 0.345 0.26 0.714 0.313 0.435cmt-edas 0.94 0.889 0.615 0.727 1.00 0.778 0.538 0.636cmt-ekaw 0.90 0.625 0.455 0.526 0.19 0.500 0.455 0.476cmt-iasted 0.66 0.800 1.000 0.889 1.00 0.800 1.000 0.889cmt-sigkdd 0.14 0.786 0.917 0.846 0.23 0.769 0.833 0.800conf-confOf 0.97 0.583 0.467 0.519 1.00 0.714 0.333 0.455conf-edas 0.95 0.583 0.412 0.483 1.00 1.000 0.118 0.211conf-ekaw 0.12 0.333 0.480 0.393 0.18 0.538 0.280 0.368conf-iasted 0.15 0.500 0.357 0.417 0.79 1.000 0.214 0.353conf-sigkdd 0.28 0.818 0.600 0.692 0.78 0.750 0.600 0.667confOf-edas 1.00 0.643 0.474 0.545 1.00 0.778 0.368 0.500confOf-ekaw 0.11 0.619 0.650 0.634 1.00 0.667 0.600 0.632confOf-iasted 0.90 0.571 0.444 0.500 1.00 1.000 0.333 0.500confOf-sigkdd 0.69 0.667 0.571 0.615 0.19 0.500 0.429 0.462edas-ekaw 0.60 0.526 0.435 0.476 1.00 1.000 0.130 0.231edas-iasted 0.28 0.500 0.421 0.457 0.19 0.500 0.105 0.174edas-sigkdd 0.95 0.875 0.467 0.609 1.00 0.875 0.467 0.609ekaw-iasted 0.57 0.429 0.600 0.500 1.00 0.556 0.500 0.526ekaw-sigkdd 0.81 0.875 0.636 0.737 1.00 1.000 0.273 0.429iasted-sigkdd 0.94 0.647 0.733 0.688 1.00 0.667 0.133 0.222
2.5 interactive
The interactive matching component in WeSeE-Match – which is the same as in Hertuda– tries to find an optimal threshold via binary search for selecting the final mapping, asdiscussed above. Table 1 depicts the results. For comparison, we also show the optimalthreshold that could have been selected in theory.5
It can be observed that the thresholds chosen by our algorithm are most often farfrom the optimum, which is also reflected in the F-measure achieved. In most cases, theselected threshold is higher than the optimal, i.e., the selection is biased towards preci-sion. In fact, 1.0 is often chosen as a threshold. The reason is that that mapping elementssuch as conference#Conference = eads#Conference, which naturally re-
5 There are cases where the F-measure achieved by the actual selection is higher. This is dueto the fact that in a post-processing step, all information obtained from the oracle is exploitedby removing the wrong mappings and including the correct ones, even if they do not fall intothe interval defined by the final threshold selection. Furthermore, in some cases, the precisionis lower despite a higher threshold. This is due to the fact that the interactive track uses aslightly different reference alignment than the original conference track, on which the optimalthresholds have been determined.

ceive a confidence score of 1.0, are rated wrong by the oracle, so that our binary searchapproach sets the threshold τ to the maximum possible, i.e., 1.0.
In general, while our interactive approach would work well for ideally sorted candi-dates, its performance with real confidence scores provided by WeSeE-Match (and alsoHertuda) are not satisfying. Thus, using a greedy algorithm here is maybe not the bestchoice, and other means to determine an optimal threshold, such as estimating the F-measure based on user interaction, as discussed in [6], may be a better option for futureversions.
3 Conclusion
In this paper, we have discussed the results of the 2013 version of WeSeE-Match. It canbe observed that the choice for free services instead of commercial ones has changedthe performance of WeSeE-Match for the worse. The trade-off between the use of com-mercial services and high-quality results is not easy to address.
Furthermore, it can be seen that a naive greedy approach for selecting a thresholdparameter interactively does not provide satisfying results, which calls for more sophis-ticated methods.
References
1. Jos Luis Aguirre, Kai Eckert, Jrme Euzenat, Alfio Ferrara, Willem Robert van Hage, LauraHollink, Christian Meilicke, Andriy Nikolov, Dominique Ritze, Francois Scharffe, PavelShvaiko, Ondrej Svab-Zamazal, Cssia Trojahn, Ernesto Jimnez-Ruiz, Bernardo Cuenca Grau,and Benjamin Zapilko. Results of the ontology alignment evaluation initiative 2012. In Sev-enth International Workshop on Ontology Matching (OM 2012), 2012.
2. Thanh Tung Dang, Alexander Gabriel, Sven Hertling, Philipp Roskosch, Marcel Wlotzka,Jan Ruben Zilke, Frederik Janssen, and Heiko Paulheim. Hotmatch results for oeai 2012. InSeventh International Workshop on Ontology Matching (OM 2012), 2012.
3. Sven Hertling. Hertuda results for oeai 2012. In Seventh International Workshop on OntologyMatching (OM 2012), 2012.
4. Michael Paul, Hirofumi Yamamoto, Eiichiro Sumita, and Satoshi Nakamura. On the impor-tance of pivot language selection for statistical machine translation. In 2009 Annual Con-ference of the North American Chapter of the Association for Computational Linguistics,Companion Volume: Short Papers, pages 221–224, 2009.
5. Heiko Paulheim. Wesee-match results for oeai 2012. In Seventh International Workshop onOntology Matching (OM 2012), 2012.
6. Heiko Paulheim, Sven Hertling, and Dominique Ritze. Towards evaluating interactive ontol-ogy matching tools. In Lecture Notes in Computer Science, 2013.

XMapGen and XMapSiG Results for OAEI 2013
Warith Eddine Djeddi and Mohamed Tarek Khadir
LabGED, Computer Science Department, University Badji Mokhtar, Annaba, Algeria{djeddi, khadir}@labged.net
Abstract. The XMapGen and XMapSig systems are flexible and self-configuringmatching tools using different strategies for combining multiple similarity mea-sures into a single aggregated metric with the final aim of improving the ontol-ogy alignment quality of large scale ontologies. XMapGen and XMapSig are twovariants of XMap++. The results obtained by the two ontology matching toolswithin the 9th edition of the Ontology Alignment Evaluation Initiative (OAEI2013) campaign are therefore presented.
1 Presentation of the system
We present a fully automatic general purpose ontology alignment tools called XMap-Gen (eXtensible Mapping using Genetic) and XMapSig (eXtensible Mapping usingSigmoid), a new and lighter implementations of their ancestor XMap++ [1]. XMapGenand XMapSig include several matchers. These matchers calculate similarities betweenthe terms from the different source ontologies. The matchers implement strategies basedon linguistic matching, structure-based strategies and strategies that use auxiliary infor-mation in the thesaurus WordNet to enhance the alignment process. XMapGen usesGenetic Algorithm (GA) as a machine learning-based method to ascertain how to com-bine multiple similarity measures into a single aggregated metric with the final aimof improving the ontology alignment quality. XMapSig uses sigmoid function [4] forcombining the corresponding weights for different semantic aspects, reflecting theirdifferent importance. This year, XMapGen and XMapSig participate in five tracks in-cluding Benchmark, Conference, Library, Anatomy and Large Biomedical Ontologiestracks.
1.1 State, purpose, general statement
XMapGen and XMapSig are a scalable ontology alignment tools capable of matchingEnglish language ontologies described in different OWL languages (i.e., OWL Lite,OWL DL, and OWL Full). The major principle of the matching strategy in XMapGenand XMapSig approaches is combining multiple similarity measures into a single sim-ilarity metric using weights determined by intelligent strategies in order to skip overthe burden of manual selection. Despite the impressive strategy in adding GA, aligningmedium-sized and large-scale ontologies is still very time consuming and computation-ally expensive. This inspires us to consider the use of a particular parallel matching onmultiple cores or machines for dealing with the scalability issue on ontology matching.

1.2 Specific techniques used
In this section, the workflow of XMap++ and its main components is briefly describedand shown in Fig.1. Both systems XMapGen and XMapSig calculate three differentbasic measures to create three similarity matrixes. String-based, semantic and structuralmethods are the three different categories of measuring similarities.
Fig. 1. Sketch of Architecture for XMAP++.
In XMap++ approach, a generic workflow for a given ontology matching scenariois as follows:
1. Matching inputs are two ontologies, source O and target O′
parsed by an OntologyParser component;
2. The String Matcher based on linguistic matching compares the textual descriptionsof the concepts associated with the nodes (labels, names) of each ontology;
3. The Linguistic matcher jointly aims at identifying words in the input strings, relay-ing on WordNet [5] which provide additional information towards unveiling map-pings in cases where features such as labels are missing or in cases where namesare replaced by random strings. These matching techniques may provide incor-rect match candidates, structural matching is used to correct such match candidatesbased on their structural context. In order to deal with lexical ambiguity, we in-troduce the notion of scope belonging to a concept which represents the contextwhere it is placed. In our approach, the similarity between two entities of differ-ent ontologies is evaluated not only by investigating the semantics of the entities

names, but also taking into account the local context, through which the effectivemeaning is described. In particular, the neighborhood of a term (immediate parentand children in the is-a hierarchy). Increasing the radius means enlarging the scope(i.e. this area) and, consequently, the set of neighbour concepts that intervene in thedescription of the context. The value of linguistic methods is added to the linguisticmatcher or the structure matcher in order to enhance the semantic ambiguity duringthe comparison process of entity names;
4. The structural matcher aligns nodes based on their adjacency relationships. Therelationships (e.g., subClassOf and is-a) that are frequently used in the ontologyserve, at one hand, as the foundation of the structural matching. On the other hand,the structural rules are used to extract the ontological context of each node, up toa certain depth (radius). This context includes some of its neighbours, where eachof them is associated a weight representing the importance it has when evaluatingthe contextual node. The XMap++ algorithm values the semantic relation betweentwo concepts while taking in consideration the types of cardinality constraints (e.g.OWLAllValuesFrom, OWLSomeValuesFrom, OWLMinCardinality, OWL-Cardinality,OWLMaxCardinality, Same as or Kind of ) and values between their properties(e.g. OWLMaxCardinality >=1). Alignment suggestions are then determined bycombining and filtering the results generated by one or more matchers;
5. The three matchers perform similarity computation in which each entity of thesource ontology is compared with all the entities of the target ontology, thus pro-ducing three similarity matrices, which contain a value for each pair of entities.After that, an aggregation operator is used to combine multiple similarity matri-ces computed by different matchers to a single aggregated n ∗m similarity matrix,where n is the number of element in the source ontology and m is the number ofelements in the target ontology. We refer to [1] for more detail about the pruningand splitting techniques on data matrices for two couple of entities;
6. XMap++ uses three types of aggregation operator; these strategies are aggregation,selection and combination. The aggregation reduces the similarity cube to a matrix,by aggregating all matcher’s results matrices into one. This aggregation is definedby five strategies: Max, Min, Average, sigmoid function and Weighted. The Maxstrategy is an optimistic one, selecting the highest similarity value calculated byany matcher. Contrary, the Min strategy selects the lowest value. Average evensout the matcher results, calculating the average. The sigmoid method combinesmultiple results using a sigmoid methods, which is essentially a smoothed thresholdfunction [4]. In order to satisfy a different importance of matcher results, Weightedcomputes the weighted sum of the results, according to user defined weights orautomatic defined weights using a dynamic strategy [3], using an Artificial NeuralNetwork (ANN) (Djeddi and Khadir, 2013) or using Genetic Algorithm (GA);
7. Finally, these values are filtered using a selection according to a defined thresholdand the desired cardinality. In our algorithm, we adopt the 1-1 cardinality to findthe optimal solution in polynomial time.

1.3 Adaptations made for the evaluation
Several technical adaptations were required for integrating the system into the Sealsplatform, such as:
– Updating some libraries (e.g., Alignment API) or changing the way some parame-ters are communicated.
– To deal with large ontologies, XMapGen and XMapSig conducted specific experi-ments to see whether a matching system can exploit a multi-core architecture [6] tospeed up the matching process. We adapted parallel matching to the use of thread-ing to distribute the jobs of two matchers (Classes matcher and Properties matcher)on all available CPU cores on only one machine.
– There are two factors that directly impact to the systems’ performance. The firstones relates to matching by machine learning model. The training data and selectedsimilarity metrics as learning attributes are important. A simple solution for thisissue is proposed by selecting the most appropriate similarity metrics and trainingdata according to their correlation with expert’s assessment. The second issue re-lates to the threshold used as a filter in the selection module. Different tests requiredifferent thresholds.
– In XMap++, the aim of the Structural Matcher is to correct such match candi-dates based on their structural context. The structural approach matches the nodesbased on their adjacency relationships. XMapGen and XMapSig exploit only thesuperclass-subclass relationships (subsumption relationships) that are frequentlyused in ontologies when the total number of entities is bigger than 1500 entitiesin each ontology. We restrict the contextual similarity computing; only the valueof the semantic relation between two concepts without taking in consideration thetypes of cardinality constraints and values between their properties, because if theontologies became larger, the efficiency of the automatic alignment methods de-creases considerably, in term of execution time, and memory size.
2 Results
Evaluation results of XMapGen and XMapSig in the OAEI 2013 campaign are hereevaluated and discussed. We participated in five tracks: Benchmarks, Conference, Li-brary, Anatomy and Large Biomedical Ontologies. Detailed results and descriptionsabout the used computation environments are provided on the OAEI 2013 result page.
2.1 Benchmark
In this track, there are multiple match tasks per sub-track where one source ontologyis compared with a number of systematically modified target ontologies. According toTable 1, it is shown that approximately 4% is the percentage improvement of XMapSigversus XMapGen. The recall low values are explained by the fact that ontological en-tities with scrambled labels, lexical similarity becomes ineffective. For two algorithms,structural similarity stems from lexical similarity hence scrambling the labels makes thealignment more challenging. This trend of reduction in precision, recall and f-measurewhich can be observed throughout the test cases from 248 till 266.

Table 1. Results for Benchmark track.
System bibliocP R F
XMapSig 0.70 0.50 0.58XMapGen 0.66 0.46 0.54
2.2 Anatomy
The Anatomy track consists of finding an alignment between the Adult Mouse Anatomy(2744 classes) and a part of the NCI Thesaurus (3304 classes) describing the humananatomy. XMapSig achieves a good F-Measure value of ≈75% in an acceptable amountof time (393 sec.) (see Table 2). In a separate configuration using genetic algorithm(XMapGen) we could increase the recall to ≈2% but the precision is decreased of≈5%, due to running the structural matcher in a lightweight version (restriction of thecontextual similarity). XMapGen needs around 403 minutes to compute the alignment.We plan to use bio medical lexical databases like Unified Medical Language System(UMLS) for improving the recall.
Table 2. Results for Anatomy track.
System Precision F-Measure Recall Time(s)
XMapSig 0.856 0.753 0.673 393XMapGen 0.808 0.747 0.695 403
2.3 Conference
The Conference track uses a collection of 16 ontologies from the domain of academicconferences. Most ontologies were equipped with OWL DL axioms of various kinds;this opens a useful way to test our semantic matchers. The match quality was evaluatedagainst an original (ra1) as well as entailed reference alignment (ra2). As the Table 3shows, for both evaluations we achieved F-Measure values better than the Baseline1 re-sults (57% for ra1 and 53% for ra2) when using XMapGen1 4. Also with XMapSig1 3we achieved F-Measure values better than the Baseline1 results (58% for ra1 and 53%for ra2).
Table 3. Results for Conference track.
System RA1 Reference RA2 ReferenceP R F P R F
XMapSig1 3 0.72 0.48 0.58 0.68 0.44 0.53XMapGen1 4 0.68 0.49 0.57 0.64 0.45 0.53

2.4 Library
The library track involves the matching of the STW thesaurus (6,575 classes) and theSoz thesaurus (8,376 classes). Both of these thesauri provide vocabulary for economicand social sciences. Table 4 summarizes the results obtained by XMapGen and XMap-Sig. The mapping quality achieved by XMapSig on the library track is not as positiveas on the other tracks. XMapSig attains a precision of 0.79 and a recall of 0.31. Possiblereasons may be the absence of domain and range definitions (in fact, of properties ingeneral), as for anatomy, and the presence of multi-lingual labels. As XMapSig doesnot respect languages, this may lead to false positives. XMapSig requires ≈ 48 min and34 sec. It is mainly due to the fact that our approach uses the notion of context witha value of radius not fixed as an input parameter at the starting of the matching task.So the algorithm looks at all the depth for the compared ontologies which involve thecreation of a matrix with M > 1.3 billion pairs.
XMapGen could perform worse in terms of precision (0.031) and obtained higherfor recall than XMapSig (0.37). The low of precision is due to a problem in the trainingof the genetic algorithm. We fixed this problem with an improved version deliveredafter deadline (precision and recall performance was different). In this paper we decidedto present (see Table 4), only the results generated with the official version of our tool(before the deadline of the contest), and not the one generated with an improved version(fixing the training problem of GA) submitted after the deadline.
Table 4. Results for Library track.
System Precision Recall F-Measure Time(s)
XMapSig 0.799 0.318 0.455 2914XMapGen 0.031 0.371 0.057 3008
2.5 Large biomedical ontologies
This data set consists of several large scale ontologies, containing up to tens of thou-sands of concepts. Our two systems were only capable to match the small task forFMA-NCI and FMA-SNOMED. The large ones are not finished in time due to the highcomputational complexity. We found the NCI thesaurus very time consuming for con-text based mapping as its concepts have many siblings. Among the varying evaluationmethods, XMapGen and XMapSig produced fairly consistent alignments when match-ing the FMA and NCI ontologies, all resulting in f-measures of approximately 0.60(See Table 5). However, the results of the completed tasks indicate that our system isalready capable of producing alignments of high quality in this domain, thus improvingits efficiency, for instance by applying the complete functionalities of XMap++ , shouldresult in an overall satisfying performance during the next evaluation. As not expectedfrom our two systems, they could perform the alignment in less than 3 hours 25 min ofSmall FMA-SNOMED fragments with high precision and low recall (See Table 6).

Table 5. Results for the Large BioMed track: FMA-NCI tasks
Task 1: Small FMA and NCI fragmentsSystem Size Precision Recall F-Measure Time(s)
XMapSig 1564 0.864 0.461 0.602 1477XMapGen 1687 0.833 0.479 0.608 1504
Table 6. Results for the Large BioMed track: FMA-SNOMED tasks
Task 3: Small FMA and SNOMED fragmentsSystem Size Precision Recall F-Measure Time(s)
XMapSig 1581 0.760 0.134 0.228 11720XMapGen 1827 0.694 0.142 0.236 12127
3 General comments
3.1 Comments on the results and future improvements
As previously stated, the aim of this development experience was not to deliver a tool tocompete with others in terms of precision and recall. Instead, we aimed at the develop-ment of a new and stable version of XMap++ using new and state-of-the-art technolo-gies and alignment methods. Additionally, to tackle the large ontology matching prob-lem we improved the runtime of the algorithm using a divide-and-conquer approachthat can partition the execution of the matchers into small threads was improved andjoins their results after each similarity calculation. A direct comparison between theXMapGen and XMapSig shows that the addition of GA does not has a negative effecton the algorithm but, on the contrary, leads to slightly better results, especially in termsof recall. In most track, XMapSig supplies high precision than XMapGen. Whereasusing Genetic Algorithm (XMapGen) performs quite high in terms of recall than us-ing sigmoid function (XMapSig). The reason is behind the using of the sigmoid func-tion and the weight for linguistic matcher. Therefore, for a high value of the linguisticweight, some important properties of classes founded by XMapSig may be omitted, asthe weight of linguistic matcher is high and the algorithm focuses more on the linguis-tic level (names of classes) than the structural level (properties and their restrictions).This problem can be resolved by using a sigmoidal function, which increases propor-tionally the important similarity of the structural matcher, to be considered in the finalcalculation of two classes similarities. Finally we participated in the OAEI 2013 withtwo variants with the aim to analyze the strength and the weakness of each strategy(Sigmoid and Genetic) at the goal for combing them in one ontology alignment task.
3.2 Discussions on the way to improve the proposed system
Some probable approaches to improving our tools are listed as follows:
1. Adopt more flexible strategies in defining the way for automatic threshold ratherthan manually tuning. Developing dynamic strategies for setting the correct thresh-old value for each compared ontologies and not one for all;

2. Take comments and Instance information of ontology into account, especially whenthe name of concept is meaningless;
3. Matching larger ontologies still takes significantly longer time when parsing on-tologies with Alignment API. We plan to solve this problem using an ontologyparser which permits to load multiple ontologies in parallel via threading;
4. Usage of background knowledge based on the UMLS Meta-thesaurus to have highrecall when aligning ontologies from the biomedical science domain.
3.3 Comments on the OAEI 2013 procedure
As a first participation, we found the OAEI procedure very convenient and the orga-nizers very supportive. The use of Seals allows objective assessments. The OAEI testcases are various and this leads to comparison on different levels of difficulty, which isvery interesting. We found that SEALS platform is a very valuable tool to compare theperformance of our system with the others.
4 Conclusion
Our system participated to the campaign with two versions (XMapGen and XMapSig)of our approach, corresponding to different strategies of weights aggregation. Gen-erally, according to our results in OAEI 2013, our two systems delivered fair resultscomparatively to other participants. The preliminary results were quite good to encour-age us to continue seeking better solutions. It seems that both systems XMapGen andXMapSig can efficiently match semantically rich ontologies containing tens (and evenhundreds) of thousands of classes. We confirm that the addition of Genetic Algorithm(GA) keeps the performance and, furthermore, eliminates the necessity of tuning theweights manually. Moreover, the learning framework is very flexible: many combina-tions of matchers and parameters may be used in the future, various types of trainingmodels (Resilient propagation, Levenberg marquardt, Backpropagation, Anneal, Radialor Manhatan method, etc.) and new metrics.
References
1. Djeddi, W., Khadir, M.T.: Ontology alignment using artificial neural network for large-scaleontologies. In the International Journal of Metadata, Semantics and Ontologies (IJMSO), Vol.8,No.1, pp.75-92 (2013)
2. Djeddi, W., Khadir, M.T.: Introducing artificial neural network in ontologies alignment pro-cess. In the Journal Control and Cybernetics, Vol. 41, No. 4, pp.743-759 (2012)
3. Djeddi, W., Khadir, M.T. : A dynamic multistrategy ontology alignment framework basedon semantic relationships using WordNet. In Proc of the 3rd International Conference on Com-puter Science and its Applications (CIIA11), 1315 December, Saida, Algeria, pp.149154 (2012)
4. Djeddi, W., Khadir, M.T.: XMAP: a novel structural approach for alignment of OWL-full on-tologies. In Proc. of the International Conference on Machine and Web Intelligence (ICMWI),pp.347-352 (2010)
5. Fellbaum, C. : WordNet: An Electronic Lexical Database, MIT Press, Cambridge, MA (1998)6. Gross, A., Hartung, M., Kirsten, T. and Rahm, E. : On matching large life science ontologies
in parallel. In , in Lambrix, P. and Kemp, G.J.L. (Eds), DILS, Springer, pp.35-49 (2010)
YAM++ – Results for OAEI 2013
DuyHoa Ngo, Zohra Bellahsene
University Montpellier 2, LIRMM{duyhoa.ngo, bella}@lirmm.fr
Abstract. In this paper, we briefly present the new YAM++ 2013 version andits results on OAEI 2013 campaign. The most interesting aspect of the new ver-sion of YAM++ is that it produces high matching quality results for large scaleontology matching tasks with good runtime performance on normal hardwareconfiguration like PC or laptop without using any powerful server.
1 Presentation of the system
YAM++ - (not) Yet Another Matcher is a flexible and self-configuring ontology match-ing system for discovering semantic correspondences between entities (i.e., classes, ob-ject properties and data properties) of ontologies. This new version YAM++ 2013 has asignificant improvement from the previous versions [6, 5] in terms of both effectivenessand efficiency, especially for very large scale tasks. The YAM++’s general architectureis not changed much. However, most of its algorithms have been updated/added by thenew effective ones. For example, we have implemented a disk-based method for storingthe temporary information of the input ontology during the indexing process in orderto save main memor space. Consequently, the new version YAM++ 2013 has improvedboth the matching quality and time performance in large scale ontology matching tasks.This year, YAM++ participates in six tracks including Benchmark, Conference, Mul-tifarm, Library, Anatomy and Large Biomedical Ontologies tracks. However, due tolimitation of time and person, we have not upgrade YAM++ to participate to Interactivematching evaluation and Instance Matching tasks.
1.1 State, purpose, general statement
In YAM++ approach all useful information of entities such as terminological, structuralor contextual, semantic and extensional are exploited. For each type of extracted infor-mation, a corresponding matching module has been implemented in order to discoveras many as possible candidate mappings.
The major drawback of the previous version YAM++ 2012 [5], despite the fact thatit achieved good results and high ranking at almost tracks, is very low time performance,especially for the Large Biomedical Ontologies tracks. After carefully studying this is-sue, we realize that our algorithms for pre-processing and indexing the input ontologieslead to a high complexity of O(n2), where n is the size of the ontology. Additionally,the semantic verification component did not work well for the very large scale ontologymatching task.

In the current version YAM++ 2013, the flaws mentioned above have been signifi-cantly fixed. Firstly, we have revised our algorithms for pre-processing and indexing theinput ontologies and now they are with O(‖n‖+‖v‖) complexity, where n and v are thenumber of nodes and edges of a Directed Acyclic Graph transformed from the ontology.Moreover, we have implemented a disk-based method for storing the temporary infor-mation of the input ontologes during the indexing process. This method allows us savea significant space of main memory. this makes possible run YAM++ with very largescale ontology matching in a personal computer with ordinary configuration (using 1GJVM only).
Secondly, we have introduced different inconsistent alignment patterns in order todetect as much as possible conflict set. Then, a new and fast approximate algorithm hasbeen implemented to find the nearly optimization solution, which corresponds to thefinal consistent alignment.
1.2 Specific techniques used
In this section, we will briefly describe the workflow of YAM++ and its main compo-nents, which are shown in Fig.1.
Can
dida
te P
re-
Filte
ring Similarity
Computation
SimilarityPropagation
Annotation
Indexing
Sem
antic
Ver
ifica
tion
StructureIndexing
Ont
olog
y Lo
ader
CandidatePost-Filtering
ContextIndexing
Fig. 1: Main components of YAM++ system
In YAM++ approach, a generic workflow for a given ontology matching scenario isas follows.1. Input ontologies are loaded and parsed by a Ontology Loader component;2. Information of entities in ontologies are indexed by the Annotation Indexing, the
Structure Indexing and Context Indexing components;3. Candidates Pre-Filtering component filters out all possible pairs of entities from
the input ontologies, whose descriptions are highly similar;4. The candidate mappings are then passed into Similarity Computation compo-
nent, which includes: (i) the Terminological Matcher component that produces aset of mappings by comparing the annotations of entities; (ii) the Instance-basedMatcher component that supplements new mappings through shared instances be-tween ontologies and (iii) the Contextual Matcher, which is used to compute thesimilarity value of a pair of entities by comparing their context profiles. In YAM++,

the matching results of the Terminological Matcher, the Contextual Matcher andthe Instance-based Matcher are combined to have a unique set of mappings. Wecall them element level matching result.
5. The Similarity Propagation component then enhances element level matching re-sult by exploiting structural information of entities; We call the result of this phasestructure level matching result.
6. The Candidate Post-Filtering component is used to combine and select the poten-tial candidate mappings from element and structure level results.
7. Finally, the Semantic Verification component refines those mappings in order toeliminate the inconsistent ones.Let us now to present the specific features of each component.
Ontology Loader To read and parse input ontologies, YAM++ uses OWLAPI opensource library. In addition, YAM++ makes use of (i) Pellet1 - an OWL 2 Reasoner inorder to discover hidden relations between entities in small ontology and (ii) ELK2
reasoner for large ontology. In this phase, the whole ontology is loaded in the mainmemory.
Annotation Indexing In this component, all annotations information of entities such asID, labels and comments are extracted. The languages used for representing annotationsare considered. In the case where input ontology use different languages to describe theannotations of entities, a multilingual translator (Microsoft Bing) is used to translatethose annotations to English. Those annotations are then normalized by tokenizing intoset of tokens, removing stop words, and stemming. Next, the resulting tokens are in-dexed in a table for future use.
Structure Indexing In this component, the main structure information such as IS-A andPAR-OF hierarchies of ontology are stored. In particular, YAM++ assigns a compressedbitset values for every entity of the ontology. Through the bitset values of each entity,YAM++ can fast and easily gets its ancestors, descendants, etc. A benefit of this methodis to easily access to the structure information of ontology and minimize memory forstoring it. After this step, the loaded ontology can be released to save main memory.
Context Indexing In this component, we define a context profile of an entity as a setof three text corpora: (i) Entity Description includes annotation of the entity itself; (ii)Ancestor Description comprises the descriptions of its ancestor and (iii) DescendantDescription comprises the descriptions of its descendant. Indexing those corpora is Weperformed by Lucene indexing engine.
Candidates Pre-Filtering The aim of this component is to reduce the computationalspace for a given scenario, especially for the large scale ontology matching tasks. InYAM++, two filters have been designed for the purpose of performing matching processefficiently.
1 http://clarkparsia.com/pellet/2 http://www.cs.ox.ac.uk/isg/tools/ELK/

– A Description Filter is a search-based filter, which filters out the candidate map-pings before computing the real similarity values between the description of enti-ties. Firstly, the descriptions of all entities in the bigger size ontology are indexedby Lucene search engine. For each entity in the smaller size ontology, three multi-ple terms queries corresponding to three description included in its context profilewill be performed. The top-K algorithm based on ranking score of those queries isused to select the most similar entities.
– A Label Filter is used to fast detect candidate mappings, where the labels of enti-ties in each candidate mapping are similar or differ in maximum two tokens. Theintuition is that if two labels of two entities differ by more than three tokens, anystring-based method will produce a low similarity score value. Then, these entitiesare highly unmatched.
Similarity Computation The three matcher described in this component are the same asin the YAM++ 2012 version. For more detail, we refer readers to our papers: Termino-logical Matcher [7], Instance-based Matcher [6]. A slight modification at the Con-textual Matcher is that we use algorithm described in [8] for small ontology matching,whereas we use the Lucene ranking score for large scale ontology matching.
Similarity Propagation This component is similar to the Structural Matcher compo-nent described in YAM++ 2012 version. It contains two similarity propagation methodsnamely Similarity Propagation and Confidence Propagation.
– The Similarity Propagation method is a graph matching method, which inher-its the main features of the well-known Similarity Flooding algorithm [2]. Theonly difference is about transforming an ontology to a directed labeled graph. Thismatcher is not changed from the first YAM++ version to the current version. There-fore, for saving space, we refer to section Similarity Flooding of [6] for moredetails.
– The Confidence Propagation method principle is as follows. Assume 〈a1, b1,≡, c1〉and 〈a2, b2,≡, c2〉 are two initial mappings, which are maybe discovered by the el-ement level matcher (i.e., the terminological matcher or instance-based matcher).If a1 and b1 are ancestors of a2 and b2 respectively, then after running confidencepropagation, we have 〈a1, b1,≡, c1 + c2〉 and 〈a2, b2,≡, c2 + c1〉. Note that, con-fidence values are propagated only among collection of initial mappings.In YAM++, the aim of the Similarity Propagation method is discovering new map-
pings by exploiting as much as possible the structural information of entities. Thismethod is used for a small scale ontology matching task, where the total number ofentities in each ontology is smaller than 1000. In contrary, the Confidence Propa-gation method supports a Semantic Verification component to eliminate inconsistentmappings. This method is mainly used in a large scale ontology matching scenario.Candidates Post-Filtering The aim of the Mappings Combination and Selection com-ponent is to produce a unique set of mappings from the matching results obtained bythe terminological matcher, instance-based matcher and structural matcher. In this com-ponent, a Dynamic Weighted Aggregation method have been implemented. Given anontology matching scenario, it automatically computes a weight value for each matcherand establishes a threshold value for selecting the best candidate mappings. The mainidea of this method can be seen in [6] for more details.

Semantic Verification After running the similarity or confidence propagation on overallcandidate mappings, the final achieved similarity values reach a certain stability. Basedon those values, YAM++ is able to remove inconsistent mappings with more certainty.There are two main steps in the Semantic Verification component such as (i) identify-ing inconsistent mappings, and (ii) eliminating inconsistent mappings.
In order to identify inconsistencies, several semantic conflict patterns have beendesigned in YAM++ as follows (see [4] for more detail):
– Two mappings 〈a1, b1〉 and 〈a2, b2〉 are crisscross conflict if a1 is an ancestor of a2in ontology O1 and b2 is an ancestor of b1 in ontology O2.
– Two mappings 〈a1, b1〉 and 〈a2, b2〉 are disjointness subsumption conflict if a1 isan ancestor of a2 in ontology O1 and b2 disjoints with b1 in ontology O2 and viceversa.
– A property-property mapping 〈p1, p2〉 is inconsistent with respect to alignment Aif {Doms(p1)×Doms(p2)} ∩ A = ∅ and {Rans(p1)×Rans(p2)} ∩ A = ∅then (p1, p2), where Doms(p) and Rans(p) return a set of domains and ranges ofproperty p.
– Two mappings 〈a, b1〉 and 〈a, b2〉 are duplicated conflict if the cardinality matchingis 1:1 (for a small scale ontology matching scenario) or the semantic similaritySemSim(b1, b2) is less than a threshold value θ (for a large scale matching withcardinality 1:m).Two methods, i.e., complete and approximate diagnosis are used in order to elim-
inate inconsistent mappings. We use complete version Alcomo [3] for small scale. Interm of approximate version for large scale, we transform this task into a MaximumWeighted Vertex Cover problem. A modification of Clarkson algorithm [1], which isa Greedy approach. The idea of this method is that it iteratively removes the mappingwith the smallest cost, which is computed by a ratio of its current confidence value tonumber of its conflicts.
1.3 Adaptations made for the evaluation
Before running the matching process, YAM++ analyzes the input ontologies and adaptsitself to the matching task. In particular, if the annotations of entities in input ontologiesare described by different languages, YAM++ automatically translates them in English.If the number of entities in input ontologies is smaller than 1000, YAM++ is switchedto small scale matching regime, otherwise, it runs with large scale matching regime.The main difference between the two regimes lies in the Similarity Propagation andSemantic Verification components as we discussed above.
1.4 Link to the system and parameters file
A SEALS client wrapper for YAM++ system and the parameter files can be downloadat: http://www2.lirmm.fr/dngo/YAMplusplus2013.zip. See the instructions in tutorialfrom SEALS platform3 to test our system.
3 http://oaei.ontologymatching.org/2013/seals-eval.html
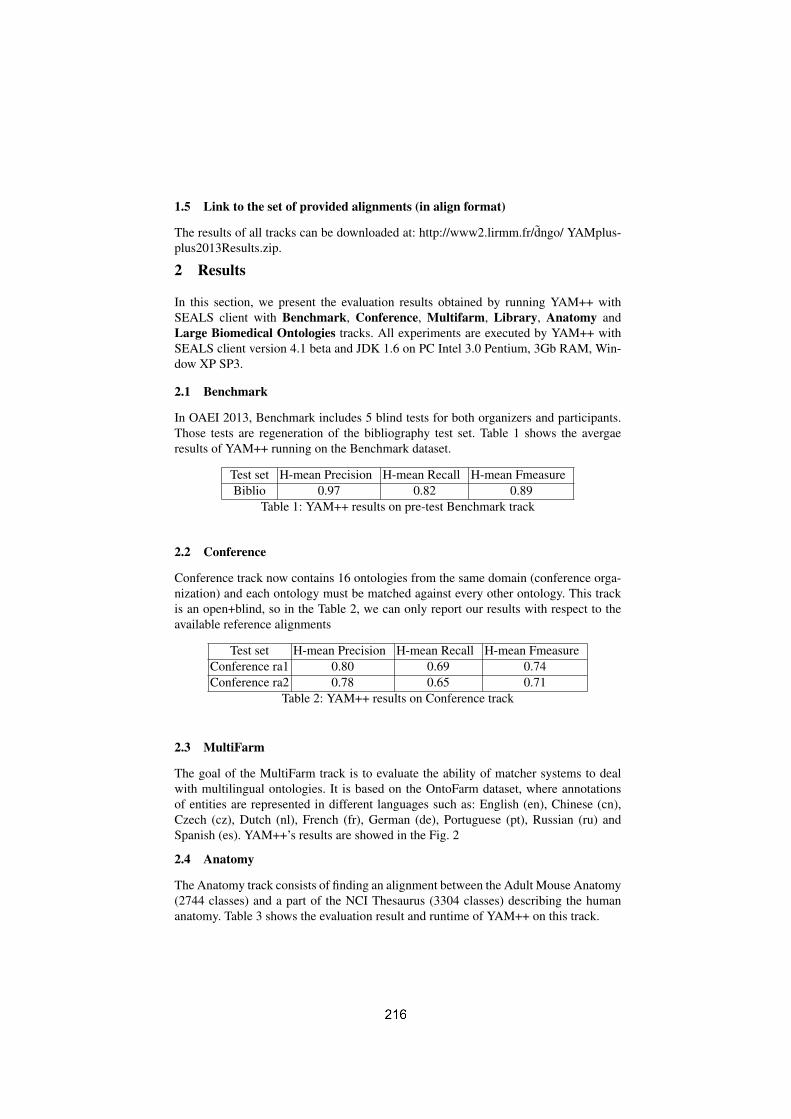
1.5 Link to the set of provided alignments (in align format)
The results of all tracks can be downloaded at: http://www2.lirmm.fr/dngo/ YAMplus-plus2013Results.zip.
2 Results
In this section, we present the evaluation results obtained by running YAM++ withSEALS client with Benchmark, Conference, Multifarm, Library, Anatomy andLarge Biomedical Ontologies tracks. All experiments are executed by YAM++ withSEALS client version 4.1 beta and JDK 1.6 on PC Intel 3.0 Pentium, 3Gb RAM, Win-dow XP SP3.
2.1 Benchmark
In OAEI 2013, Benchmark includes 5 blind tests for both organizers and participants.Those tests are regeneration of the bibliography test set. Table 1 shows the avergaeresults of YAM++ running on the Benchmark dataset.
Test set H-mean Precision H-mean Recall H-mean FmeasureBiblio 0.97 0.82 0.89
Table 1: YAM++ results on pre-test Benchmark track
2.2 Conference
Conference track now contains 16 ontologies from the same domain (conference orga-nization) and each ontology must be matched against every other ontology. This trackis an open+blind, so in the Table 2, we can only report our results with respect to theavailable reference alignments
Test set H-mean Precision H-mean Recall H-mean FmeasureConference ra1 0.80 0.69 0.74Conference ra2 0.78 0.65 0.71
Table 2: YAM++ results on Conference track
2.3 MultiFarm
The goal of the MultiFarm track is to evaluate the ability of matcher systems to dealwith multilingual ontologies. It is based on the OntoFarm dataset, where annotationsof entities are represented in different languages such as: English (en), Chinese (cn),Czech (cz), Dutch (nl), French (fr), German (de), Portuguese (pt), Russian (ru) andSpanish (es). YAM++’s results are showed in the Fig. 2
2.4 Anatomy
The Anatomy track consists of finding an alignment between the Adult Mouse Anatomy(2744 classes) and a part of the NCI Thesaurus (3304 classes) describing the humananatomy. Table 3 shows the evaluation result and runtime of YAM++ on this track.

Fig. 2: YAM++ results on MultiFarm track
Test set Precision Recall Fmeasure Run timesAnatomy 0.944 0.869 0.905 62 (s)
Table 3: YAM++ results on Anatomy track
2.5 Library
The library track is a real-word task to match the STW (6575 classes) and the TheSoz(8376 classes) thesaurus. Table 4 shows the evaluation result and runtime of YAM++against an existing reference alignment on this track.
Test set Precision Recall Fmeasure Run timesLibrary 0.692 0.808 0.745 411 (s)
Table 4: YAM++ results on Library track
2.6 Large Biomedical Ontologies
This track consists of finding alignments between the Foundational Model of Anatomy(FMA), SNOMED CT, and the National Cancer Institute Thesaurus (NCI). There are 9sub tasks with different size of input ontologies, i.e., small fragment, large fragment andthe whole ontologies. Table 5 shows the evaluation results and run times of YAM++ onthose sub tasks.
3 General comments
This is the third time YAM++ participates to the OAEI campaign. We found that SEALSplatform is a very valuable tool to compare the performance of our system with theothers. Besides, we also found that OAEI tracks covers a wide range of heterogeneity inontology matching task. They are very useful to help developers/researchers to developtheir semantic matching system.
3.1 Comments on the results
The current version of YAM++ has shown a significant improvement both in terms ofmatching quality and runtime with respect to the previous version. In particular, the

Test set Precision Recall Fmeasure Run timesSmall FMA - NCI 0.976 0.853 0.910 94 (s)Whole FMA - NCI 0.899 0.846 0.872 366 (s)
Small FMA - SNOMED 0.982 0.729 0.836 100 (s)Whole FMA - SNOMED 0.947 0.725 0.821 402 (s)Small SNOMED - NCI 0.967 0.611 0.749 391 (s)Whole SNOMED - NCI 0.881 0.601 0.714 713 (s)
Table 5: YAM++ results on Large Biomedical Ontologies track
H-mean Fmeasure value of all the very large scale dataset (i.e., Library, Biomedicalontologies) has been improved.
4 Conclusion
In this paper, we have presented our ontology matching system called YAM++ andits evaluation results on different tracks on OAEI 2013 campaign. The experimentalresults are promising and show that YAM++ is able to work effectively and efficientlywith real-world ontology matching tasks. In near future, we continue improving thematching quality and efficiency of YAM++. Furthermore, we plan to deal with instancematching track also.
References
[1] Kenneth L. Clarkson. A modification of the greedy algorithm for vertex cover. InformationProcessing Letters, pages 23 – 25, 1983.
[2] Sergey Melnik el at. Similarity flooding: A versatile graph matching algorithm and its appli-cation to schema matching. In ICDE, pages 117–128, 2002.
[3] Christian Meilicke. Alignment incoherence in ontology matching. In PhD.Thesis, Universityof Mannheim, Chair of Artificial Intelligence, 2011.
[4] DuyHoa Ngo. Enhancing ontology matching by using machine learning, graph matching andinformation retrieval techniques. In PhD.Thesis, University Montpellier II, 2012.
[5] DuyHoa Ngo and Zohra Bellahsene. Yam++ results for oaei 2012. In OM, 2012.[6] DuyHoa Ngo, Zohra Bellahsene, and Remi Coletta. Yam++ results for oaei 2011. In OM,
2011.[7] DuyHoa Ngo, Zohra Bellahsene, and Konstantin Todorov. Opening the black box of ontology
matching. In ESWC, pages 16–30, 2013.[8] DuyHoa Ngo, Zohra Bellasene, and Remi Coletta. A generic approach for combining lin-
guistic and context profile metrics in ontology matching. In ODBASE Conference, 2011.

Collective Ontology Alignment
Jason B. Ellis, Oktie Hassanzadeh, Kavitha Srinivas, and Michael J. Ward
IBM T.J. Watson Research,P.O. Box 704, Yorktown Heights, NY 10598
{jasone,hassanzadeh,ksrinivs,MichaelJWard}@us.ibm.com
1 Introduction
Enterprises are captivated by the promise of using big data to develop new prod-ucts and services that provide new insights into their customers and businesses.However, there are significant challenges leveraging data across heterogeneousdata stores, including making those data accessible and usable by non-experts.We designed a novel system called Helix which employs a combination of user-driven and automated techniques to bootstrap the building of a unified seman-tic model over virtualized data. Such a uniform semantic model allows users toquery across data stores transparently, without needing to navigate a maze ofdata silos, data formats, and query languages.
In this poster, we discuss a specific aspect of Helix: the method by whichit facilitates ontology alignment. Such alignments are very noisy and manuallyfixing the issues is a laborious process, especially when all the work must bedone prior to putting the system into use. Instead, Helix proposes to engageusers progressively in the process of ontology alignment through the course oftheir everyday use of the system. We do this by framing ontology alignment asa guided data exploration and integration task.
2 Guided Exploration, Linking, and Sharing
Helix provides a uniform user interface for heterogeneous data exploration andlinking. This interface abstracts the underlying differences among data stores anddata representations, with the goal of allowing the user to focus on their taskrather than the technology. This interface engages users in the data alignmentprocess through three key features:
1. Guided navigation - search and navigate to locate results of interest, assistedby suggestions based on semantic and schematic links
2. Saving results - save results of interest and share those results with others3. Guided linking - users select two saved results and Helix guides them through
ontology alignment. The resulting linked data can be saved, shared, and usedin future links. (see Figure 1)
Through this process, users are creating ontology alignments by finding dataof interest, aligning it, and saving/sharing what they find useful. In this way,
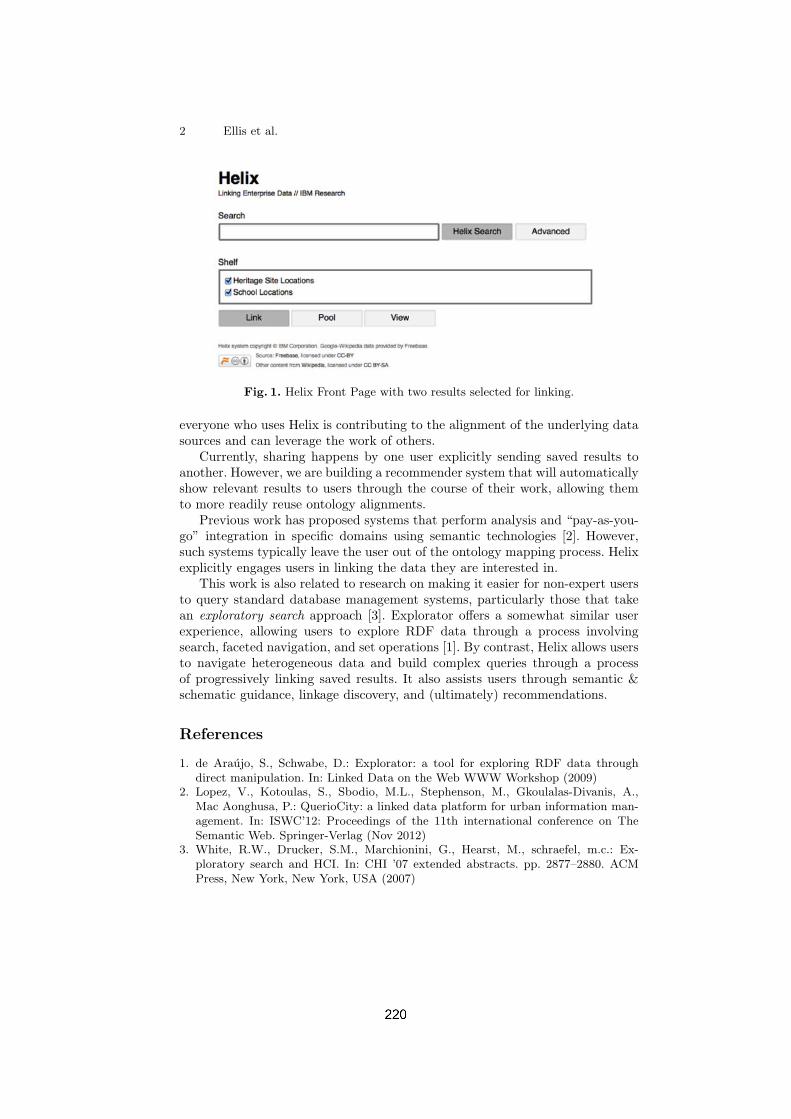
2 Ellis et al.
Fig. 1. Helix Front Page with two results selected for linking.
everyone who uses Helix is contributing to the alignment of the underlying datasources and can leverage the work of others.
Currently, sharing happens by one user explicitly sending saved results toanother. However, we are building a recommender system that will automaticallyshow relevant results to users through the course of their work, allowing themto more readily reuse ontology alignments.
Previous work has proposed systems that perform analysis and “pay-as-you-go” integration in specific domains using semantic technologies [2]. However,such systems typically leave the user out of the ontology mapping process. Helixexplicitly engages users in linking the data they are interested in.
This work is also related to research on making it easier for non-expert usersto query standard database management systems, particularly those that takean exploratory search approach [3]. Explorator offers a somewhat similar userexperience, allowing users to explore RDF data through a process involvingsearch, faceted navigation, and set operations [1]. By contrast, Helix allows usersto navigate heterogeneous data and build complex queries through a processof progressively linking saved results. It also assists users through semantic &schematic guidance, linkage discovery, and (ultimately) recommendations.
References
1. de Araujo, S., Schwabe, D.: Explorator: a tool for exploring RDF data throughdirect manipulation. In: Linked Data on the Web WWW Workshop (2009)
2. Lopez, V., Kotoulas, S., Sbodio, M.L., Stephenson, M., Gkoulalas-Divanis, A.,Mac Aonghusa, P.: QuerioCity: a linked data platform for urban information man-agement. In: ISWC’12: Proceedings of the 11th international conference on TheSemantic Web. Springer-Verlag (Nov 2012)
3. White, R.W., Drucker, S.M., Marchionini, G., Hearst, M., schraefel, m.c.: Ex-ploratory search and HCI. In: CHI ’07 extended abstracts. pp. 2877–2880. ACMPress, New York, New York, USA (2007)
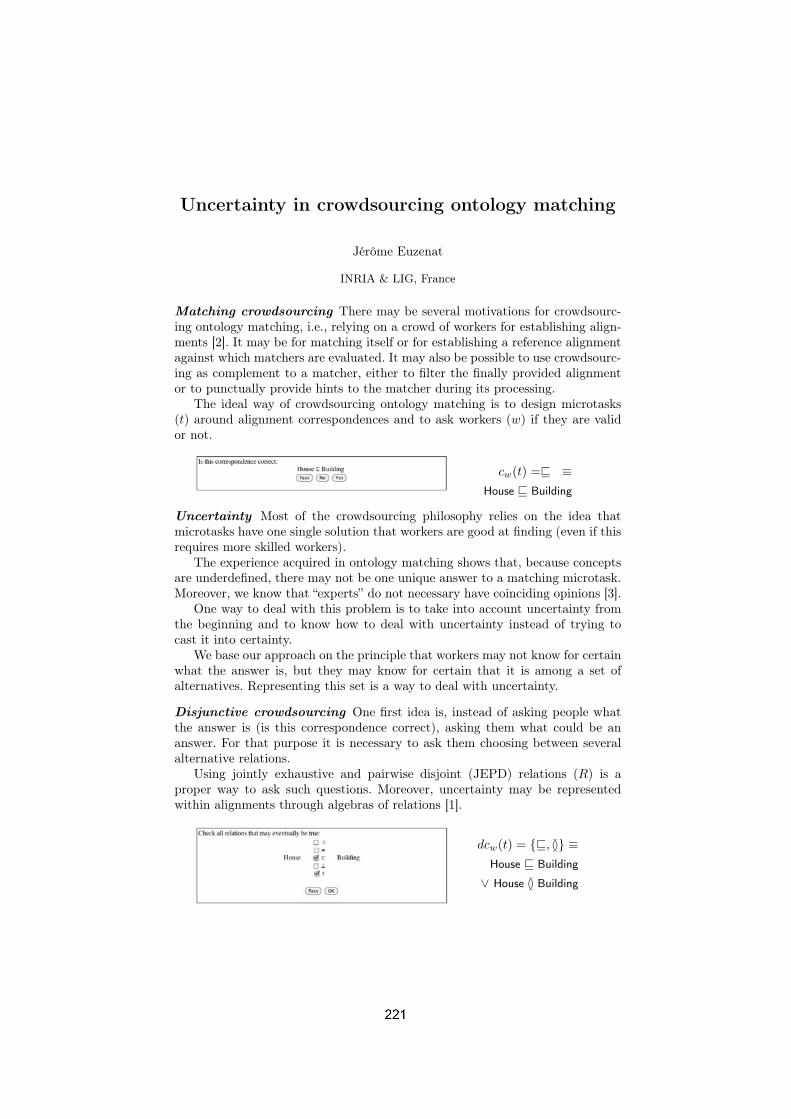
Uncertainty in crowdsourcing ontology matching
Jérôme Euzenat
INRIA & LIG, France
Matching crowdsourcing There may be several motivations for crowdsourc-ing ontology matching, i.e., relying on a crowd of workers for establishing align-ments [2]. It may be for matching itself or for establishing a reference alignmentagainst which matchers are evaluated. It may also be possible to use crowdsourc-ing as complement to a matcher, either to filter the finally provided alignmentor to punctually provide hints to the matcher during its processing.
The ideal way of crowdsourcing ontology matching is to design microtasks(t) around alignment correspondences and to ask workers (w) if they are validor not.
cw(t) =� ≡House � Building
Uncertainty Most of the crowdsourcing philosophy relies on the idea thatmicrotasks have one single solution that workers are good at finding (even if thisrequires more skilled workers).
The experience acquired in ontology matching shows that, because conceptsare underdefined, there may not be one unique answer to a matching microtask.Moreover, we know that “experts” do not necessary have coinciding opinions [3].
One way to deal with this problem is to take into account uncertainty fromthe beginning and to know how to deal with uncertainty instead of trying tocast it into certainty.
We base our approach on the principle that workers may not know for certainwhat the answer is, but they may know for certain that it is among a set ofalternatives. Representing this set is a way to deal with uncertainty.
Disjunctive crowdsourcing One first idea is, instead of asking people whatthe answer is (is this correspondence correct), asking them what could be ananswer. For that purpose it is necessary to ask them choosing between severalalternative relations.
Using jointly exhaustive and pairwise disjoint (JEPD) relations (R) is aproper way to ask such questions. Moreover, uncertainty may be representedwithin alignments through algebras of relations [1].
dcw(t) = {�, �} ≡House � Building
∨ House � Building

This will require slightly more work from workers, but they will not requirethem to choose between alternatives when they do not see any clear correct one.
Complement crowdsourcing One further possibility, instead of asking peoplewhat could be an answer is to ask them what is definitely not an answer. In thissecond setting, it may be easier for people to provide meaningful informationwithout needing to commit to one particular answer.
ccw(t) = {�, �} ≡¬(House � Building)
∧¬(House � Building)
Complement crowdsourcing is logically the complement of disjunctive crowd-sourcing. However, we conjecture that this will make workers adopt a cautiousattitude, discarding only relations that they really think are wrong.
Summary This is related to the consensus between experts [3]. In the initialcase, if they do not choose the same relation, they disagree. In the two latterschemes, as long as the intersection between their choices are not disjoint, theydo not disagree, but express disjunctive opinions.
With a population W of workers, classical crowdsourcing asks if one relationis true or what is the relation between two entities. So, the result of the task cwis a single relation. Disjunctive crowdsourcing asks which relations could hold,hence, dcw ⊆ R. Similarly, complement crowdsourcing asks which relations donot hold, hence ccw ⊆ R. We conjecture that:
∀w ∈ W, ccw(t) ⊇ dcw(t) ⊇ {cw(t)}This would have the good feature to provide better opportunity for consensusbecause:
∩w∈W ccw(t) ⊇ ∩w∈W dcw(t) ⊇ ∩w∈W {cw}(t)It would be an interesting experiment to check if these modalities allow for
less conflicts and more accurate alignments. We could test the hypothesis that ifit is better to ask users to choose one relation between two entities or to discardnonapplyable relations among all the possible ones.
References
1. Jérôme Euzenat. Algebras of ontology alignment relations. In Proc. 7th internationalsemantic web conference (ISWC), Karlsruhe (DE), pages 387–402, 2008.
2. Cristina Sarasua, Elena Simperl, and Natalya Noy. CrowdMAP: crowdsourcingontology alignment with microtasks. In Proc. 11th ISWC, volume 7649 of Lecturenotes in computer science, pages 525–541, 2012.
3. Anna Tordai, Jacco van Ossenbruggen, and Bob Wielinga. Let’s agree to disagree:on the evaluation of vocabulary alignment. In Proc. 6th International Conferenceon Knowledge Capture (K-CAP), pages 65–72, Banff (CA), 2011.

Mix’n’Match: Iteratively Combining OntologyMatchers in an Anytime Fashion
Simon Steyskal1,2 and Axel Polleres3,1
1 Siemens AG, Siemensstrasse 90, 1210 Vienna, Austria2 Vienna University of Technology, 1040 Vienna, Austria
3 Vienna University of Economics & Business, 1020 Vienna, Austria
1 The Mix’n’Match Framework
Mix’n’Match is a framework to combine different ontology matchers in aniterative fashion for improved combined results: starting from an empty set ofalignments, we aim at iteratively supporting in each round, matchers with thecombined results of other matchers found in previous rounds, aggregating theresults of a heterogeneous set of ontology matchers, cf. Fig.1.
Fig. 1. Framework of Mix’n’Match
Alignment Combination: The combination of the alignments, especiallythe choice of those which are used for the enrichment step is based on majorityvotes. By only accepting alignments which were found by a majority of heteroge-neous matching tools we aim to ensure a high precision of the found alignmentsand therefore try to emulate reference alignments as e.g. provided by iterativeapproval through a human domain expert. Although Mix’n’Match would supportthe definition of an alignment confidence threshold as additional parameter (i.e,only allowing alignments over a specific threshold to pass) we set this thresholdper default to 0 in our experiments: since the calculation of confidence valuesis not standardized across matchers and some matchers only produce booleanconfidence values, e.g. [3]). Other result aggregation methods may be conceivablehere, like taking the individual performance of off-the-shelf matchers on specificmatching tasks into account [2, 4], but since this approach would lead to a moreinflexible alignment process this issue needs more detailed investigations in futureversions of Mix’n’Match.

Ontology Enrichment: After mixing of the alignments, enrichment of theontologies takes place; since most ontology matchers do not support referncealignments (as specified by the OAEI alignment format4), we implement enrich-ment by simple URI replacement to emulate such reference alignments found ineach matching round: for every pair of matched entities in the set of aggregatedalignments, a merged entity URI is created and will replace every occurrenceof the matched entities in both ontologies. This approach is motivated by theassumption that if two entities were stated as equal by the majority of ontologymatchers, their URI can be replaced by an unified URI, stating them as equalin the sense of URIs as global identifiers. Note that, despite the fact that mostmatchers seem to ignore URIs as unique identifiers of entities, our experimentsshowed that URI replacement was effective in boosting the confidence value ofsuch asserted alignments in almost all considered matchers.
Intermediate Results and Anytime Behavior: We collect the interme-diate results of every finished off-the-shelf matcher in every iteration. Furthermorewe keep track of every alignment found so far together with the number of in-dividual matchers which have found this alignment in any previous matchinground. This offers the possibility to interrupt the matching process at any time,retrieving only those alignments which have been found by the majority of theontology matchers at the time the interruption has taken place. In contrast toother ontology matchers which offer this anytime behavior like MapPSO [1], weare not only restricted to gather alignment results of the last finished matchingiteration, but also use the alignment results of already finished off-the-shelfmatchers in the current matching round.
Evaluation Results To test our approach, we based our evaluations onOAEI evaluation tracks (Benchmark, Conference, Anatomy) and retrieved verypromising results, typically outperforming the single matchers combined withinthe Mix’n’Match framework in terms of F-measure. For detailed evaluation resultswe refer our readers to an extended report accompanying this poster, availableat http://www.steyskal.info/om2013/extendedversion.pdf.
References
1. J. Bock, J. Hettenhausen. Discrete particle swarm optimisation for ontologyalignment. Information Sciences, 192:152–173, 2012.
2. I.F. Cruz, F. Palandri Antonelli, C. Stroe. Efficient selection of mappings andautomatic quality-driven combination of matching methods. In Int’l Workshop onOntology Matching (OM), CEUR volume 551, pages 49–60. Citeseer, 2009.
3. M. Seddiqui Hanif, M. Aono. An efficient and scalable algorithm for segmentedalignment of ontologies of arbitrary size. J. Web Sem., 7(4):344–356, 2009.
4. A. Nikolov, M. d’Aquin, E. Motta. Unsupervised learning of link discovery configu-ration. In ESWC2012, pages 119–133. Springer, 2012.
4 http://alignapi.gforge.inria.fr/format.html

An Ontology Mapping Method Based on Support Vector Machine
Jie Liu,Linlin Qin, Hanshi Wang
College of Information and Engineering, Capital Normal University, Beijing 100048, P.R.China
Correspondence should be addressed to Jie Liu, [email protected]
Abstract. Ontology mapping has been applied widely in the field of semantic web. In this paper a new algorithm of ontology mapping were achieved. First, the new algorithms of calculating four individual similarities (concept name, property, instance and structure) between two concepts were mentioned. Se-condly, the similarity vectors consisting of four weighted individual similarities were built, and the weights are the linear function of harmony and reliability, and the linear function can measure the importance of individual similarities. Here, each of ontology concept pairs was represented by a similarity vector. Lastly, Support Vector Machine (SVM) was used to accomplish mapping dis-covery by training the similarity vectors. Experimental results showed that, in our method, precision, recall and f-measure of ontology mapping discovery reached 95%, 93.5% and 94.24%, respectively. Our method outperformed other existing methods.
Introduction: In this paper, our study mainly is to discover the mapping[1] between concepts belonging to the different ontologies respectively. The proposed algorithm about ontology mapping in this paper mainly focuses on the following two points: 1. Using new methods of calculating individual similarities (concept name, property, instance and structure). 2. Proposing the methods of similarity aggregation using SVM to classify the similari-ty vectors which reflect the similarities of concept pairs. Here, the elements of a simi-larity vector consist of the weighted individual similarities, and the weight of an indi-vidual similarity is the linear function of harmony[2] and reliability[3]. To evaluate the method proposed in this paper, we used the benchmark tests in OAEI ontology matching campaign 2012 as data sets, and got precision, recall and f-measure of the different ontology mapping algorithms by experiment. The algorithms of ontology mapping: The process from calculating similarities to discovering ontology mapping is shown as Fig.1. In Fig.1, O1, O2 are two ontologies. Firstly, four individual similarities were computed; secondly, the similarity vectors consisting of four weighted individual similarities were built, and the weights were decided by both of harmony and reliability. Here, each of concept pairs between two ontologies was represented by a similarity vector; lastly, SVM was used to accom-plish mapping discovery by classifying the similarity vectors.

Instance similaritybased on harmony&
reliability
Property similaritybased on harmony&
reliability
Structure similaritybased on harmony&
reliability
Class name similaritybased on harmony &
reliability
Similarity vectors
Mapping discovery based on SVM
O1 O2
O1 O2
Instance similarityProperty similarity Structure similarityClass name similarity
Fig.1. Process of ontology mapping
Experiment Design: Ontology mapping methods related to similarity calculation have been discussed in many studies, and precision, recall and f-measure are usually used to evaluate mapping results. Experimental steps are as follows: (1) For all ontological concept pairs, the four individual similarities would be calcu-lated; (2)These similarities would be aggregated and mappings between ontologies would be extracted by using 11 methods such as Neural network , Sigmoid , Harmo-ny , Reliability and so on;(3) For our approach, after four individual similarities and their respective harmony and reliability were worked out, similarity vectors consisting of our weighted individual similarities would be built, and the weights are the linear function of harmony and reliability, and ontology mappings would be extracted by SVM;(4)For all ontology pairs, precision, recall and f-measure of ontology mapping discovery would be calculated in every methods. Result: Precision, recall and f-measure in our approach reach 0.95,0.935 and 0.9424, respectively, and are the highest, which can validate that the results of mapping dis-covery are more accurate after harmony and reliability is joined into SVM, and also can show that our approach outperforms than others dramatically. Conclusions: This study is an effective approach to resolve the problem about ontol-ogy mapping in the Semantic Web. Future work will focus on studying the mapping algorithms between uncertain ontologies.
ACKNOWLEDGMENTS
This paper is supported by the National Nature Science Foundation (No.61371194, 61303105).
REFERENCES
1. P.Shvaiko, and J.Euzenat. Ontology Matching: State of the Art and Future Challenges. Knowledge and Data Engineering, IEEE Transactions on, 2013, 25(1): 158-176.
2. Ming Mao, Yefei Peng, and Michael Spring. An Adaptive Ontology Mapping Approach with Neural Network based Constraint Satisfaction , Journal of Web Semantics, Volume 8, Issue 1 (2010), page 14-25
3. Mahboobeh Houshmand, Mahmoud Naghibzadeh, Saeed Araban. Reliability-based Simi-larity Aggregation in Ontology Matching[C]. 2010 IEEE International Conference on In-telligent Computing and Intelligent Systems, Xiamen, China: IEEE, 2010: 744-749.

PLATAL - A Tool for Web HierarchiesExtraction and Alignment
Bernardo Severo1, Cassia Trojahn2, and Renata Vieira1
1 Pontifıcia Universidade Catolica do Rio Grande do Sul, Porto Alegre, Brazil2 Universite Toulouse 2 & IRIT, Toulouse, France
Abstract. This paper presents PLATAL, a modular and extensible toolfor extraction of hierarchical structures from web pages which can beautomatically aligned and also manually edited via a graphical interface.Evaluation of alignments can be carried out using standard measures.
1 Introduction
Web sites are rich sources of information for a range of applications. Tools forautomatically extracting structured content from these sources and for compar-ing content across web sites are valuable resources. For helping in these tasks, wepropose PLATAL (Platform of Alignment), a modular and extensible tool thatprovides an integrated environment for extraction of web hierarchies and align-ment creation, edition and evaluation. The main motivation behind PLATALis to assist users in the complete alignment cycle of two web hierarchies. Dif-ferently from other matching tools offering a visual environment, like OLA [1],Prompt [3], Homer [5], Yam++ [2] and SOA-based tool [4], PLATAL offers novelfunctionalities: the possibility of automatically extracting hierarchical structuresfrom the web together with a centralised visual tool for alignment manipulation.
2 PLATAL modules
PLATAL is a standalone tool composed of four modules: (1) hierarchy extrac-tion module, which extracts fragments from HTML pages using XPath expres-sions; (2) automatic alignment module, which implements a set of terminological(prefix, suffix, edit-distance) and structural matching techniques (similarity ofparents and children entities) for generating equivalence correspondences; (3)manual alignment module, which allows users to edit or create alignments; and(4) evaluation module, which takes two alignments and computes precision, re-call and F-measure measures. These modules operate independently of each otherand alternative implementations can be added instead. Figure 1 shows a screen-shot of automatic alignment creation. After loading two hierarchies, each hierar-chy will be displayed in the respective section. Then, users can select one or morealignment processes and start them (‘Start Alignment Process’). If at least onemethod founds one correspondence between two entities, the user can see it by

2 Bernardo Severo, Cassia Trojahn, and Renata Vieira
selecting the source or target entity in the hierarchies (field ‘Correspondences’).Alignments can be exported in the Alignment format3 (‘Save’).
Fig. 1. Automatic Alignment Module screenshot.
3 Conclusions and future work
We have presented a visual tool for extraction, alignment and evaluation ofweb hierarchies. To the best of our knowledge, there is no publicly availableenvironment integrating all these features together. As future work, we planto improve the visualisation of alignments, develop a web-based version, allowparametrisation and customisation of alignment techniques through the userinterface, and add a multilingual ontology matching module.
References
1. J. Euzenat, D. Loup, M. Touzani, and P. Valtchev. Ontology Alignment with OLA.In 3rd EON Workshop, pages 59–68, 2004.
2. D. H. Ngo and Z. Bellahsene. YAM++ : (not) Yet Another Matcher for OntologyMatching Task. In BDA, France, 2012.
3. N. F. Noy and M. A. Musen. PROMPT: Algorithm and Tool for Automated On-tology Merging and Alignment. In 17h AAAI, pages 450–455, 2000.
4. K. W. Onn, V. Sabol, M. Granitzer, W. Kienreich, and D. Lukose. A visual soa-based ontology alignment tool. In OM, 2011.
5. O. Udrea, R. Miller, and L. Getoor. Homer: Ontology visualization and analysis.In Demo session ISWC, 2007.
3 http://alignapi.gforge.inria.fr/format.html

Is my ontology matching system similar to yours? �
Ernesto Jimenez-Ruiz, Bernardo Cuenca Grau, Ian Horrocks
Department of Computer Science, University of Oxford, Oxford UK
Abstract. In this paper we extend the evaluation of the OAEI 2012 Large BioMedtrack, which involves the matching of the semantically rich ontologies FMA, NCIand SNOMED CT. Concretely, we report about the differences and similaritiesamong the mappings computed by the participant ontology matching systems.
1 Introduction
The quality of the mappings computed by an ontology matching system in the OntologyAlignment Evaluation Initiative (OAEI) [2, 1] is typically measured in terms of preci-sion and recall with respect to a reference set of mappings. Additionally, the OAEI alsoevaluates the coherence of the computed mappings [1].
However, the differences and similarities among the mappings computed by differ-ent systems have often been neglected in the OAEI.1 In this paper we provide a morefine-grained comparison among the matching systems participating in the OAEI 2012Large BioMed track;2 concretely (i) we have harmonised (i.e. voted) the computed map-ping sets, and (ii) we provide a graphical representation of the similarity of these sets.
2 Mapping harmonization
We have considered the mappings voted (i.e. included in the output) by at least oneontology matching system. Figure 1 shows the harmonization (i.e. voting) results for theFMA-NCI and FMA-SNOMED matching problems. Mappings have received at most11 and 8 votes (i.e. number of participating systems3), respectively. For example, in theFMA-NCI matching problem, 3,719 mappings have been voted by at least 2 systems.
Figure 1 also shows the evolution of F-score, Precision and Recall for the differentharmonized mapping sets. As expected the maximum recall (respectively precision) isreached with the minimum (respectively maximum) number of votes. For example, themaximum recall in the FMA-SNOMED problem is 0.81, which shows the difficulty ofidentifying correct mappings in this matching problem.
The harmonized mapping sets with the best trade-off between precision and recallhave been selected as the representative mapping sets of the participating ontologymatching systems. For the FMA-NCI matching problem we have selected the mappingssets with (at least) 3, 4 and 5 votes, while in the FMA-SNOMED matching problem wehave selected the sets with (at least) 2 and 3 votes (see dark-grey bars in Figure 1).� This research was financed by the Optique project with the grant agreement FP7-318338.1 As far as we know, only in the 2007 Anatomy track some effort was done in this line: http://oaei.ontologymatching.org/2007/results/anatomy/
2 Results available at: http://www.cs.ox.ac.uk/isg/projects/SEALS/oaei/3 Systems with several variants have only been considered once in the voting process.

0
0.2
0.4
0.6
0.8
1
1.2
1 2 3 4 5 5 7 8 9 10 11
Sco
re
Num
ber
of m
appi
ngs
Number of votes
11,160
3,719
3,074 2,862 2,739 2,563 2,420 2,292 2,0771,630
812
SizePrecision
RecallF-measure
0
0.2
0.4
0.6
0.8
1
1.2
1 2 3 4 5 5 7 8
Sco
re
Num
ber
of m
appi
ngs
Number of votes
17,020
7,997
6,592
4,218
2,8462,052
1,6101,002
SizePrecision
RecallF-measure
Fig. 1: Harmonisation in the FMA-NCI (left) and FMA-SNOMED (right) problems
0
0.10
0.20
0.30
0.40
0 0.10 0.20 0.30 0.40
Jacc
ard
dist
ance
Jaccard distance
LogMapLogMap-noe
LogMapLt
GOMMA
GOMMA-Bk
ServOMap
ServOMapLYAM++
UMLS
UMLSLUMLSA
Vote3
Vote4
Vote5
0
0.10
0.20
0.30
0.40
0.50
0.60
0 0.10 0.20 0.30 0.40 0.50 0.60 0.70 0.80
Jacc
ard
dist
ance
Jaccard distance
LogMapLogMap-noe
LogMapLt
GOMMA
GOMMA-Bk
ServOMap
ServOMapLYAM++
UMLS
UMLSLUMLSA
Vote2
Vote3
Fig. 2: Mapping similarity in the FMA-NCI (left) and FMA-SNOMED (right) problems
3 Mapping similarity among systems
We have compared the similarity among (i) the representative mapping sets from theharmonisation (see Section 2), (ii) the UMLS-based reference mappings of the track,and (iii) the mapping sets computed by the top-8 ontology matching systems in theFMA-NCI and FMA-SNOMED matching problems [1]. To this end we have calculatedthe jaccard distance (|MA∪MB |−|MA∩MB |)/|MA∪MB|, which ranges from 0(the same) to 1 (different), between each pair (MA and MB) of the mapping sets from(i)-(iii), and represented such distances in a two-dimensional scatterplot (see Figure 2).System names which are distant to each other indicate that their computed mappingsdiffer to a large degree. For example, in Figure 2 (right), the mappings computed byLogMapLt and GOMMA are very different with respect to the mappings computed byother systems, as well as with respect to the harmonized and reference mapping sets.
References
1. Aguirre, J., et al.: Results of the Ontology Alignment Evaluation Initiative 2012. In: OntologyMatching Workshop. Vol-946 of CEUR Workshop Proceedings (2012)
2. Euzenat, J., Meilicke, C., Stuckenschmidt, H., Shvaiko, P., Trojahn, C.: Ontology alignmentevaluation initiative: Six years of experience. J. Data Sem. 15, 158–192 (2011)

Ontological Quality Control in Large-scale, Applied Ontology Matching Catherine Legg, Samuel Sarjant
The University of Waikato, New Zealand
Email: [email protected], [email protected]
Abstract. To date, large-scale applied ontology mapping has relied greatly on label matching and other relatively simple syntactic features. In search of more holistic and accurate alignment, we offer a suite of partially overlapping ontology mapping heuristics which allows us to hypothesise matches and test them against the knowledge in our source ontology (OpenCyc). We thereby automatically align our source ontology with 55K concepts from Wikipedia with 93% accuracy.
1. Introduction We have developed a method of specifically ontological quality control in ontology mapping which combines a suite of partially overlapping mapping heuristics with common-sense knowledge in OpenCyc. Our approach differs from previous largely label-matching approaches (Suchanek et al, 2008, Ponzetto and Navigli, 2009) in its use of knowledge, and also from previous knowledge-based approaches (Shvaiko and Euzenat, 2005, Sabou et al, 2006), in treating potential matches as hypotheses, and testing them more iteratively and open-endedly than previously accomplished.
2. Iterative Mapping Process Concept to Wikipedia article mapping is governed by a priority queue which iteratively evaluates potential mappings ordered via continuously updated weightings. The process begins with concept-to-article mappings (Table 1), then verifies these using article-to-concept heuristics. The weight of each potential mapping is equal to the product of weights produced by the two sets of heuristics.
Example TITLE MATCHING Batman-TheComicStrip Batman (comic strip):1.0} SYNONYM MATCHING ComputerWorm Worm:1.0, Computer worm:0.39, ... (+5 more)} CONTEXT-RELATED SYNONYM MATCHING
ComputerWorm Computer worm:1.0, Worm:0.59,... (+4 more)}
TITLE MATCHING Dog Dog:1.0, HotDog:1.0} LABEL MATCHING Dog Dog:1.0, HotDog:0.995, CanineAnimal:0.03, CanineTooth:0.03}
ency check information on concept and the mapped article. Most Wikipedia first sentences are conventionally structured as: X is/was/are/were a/an/the Y Y is links to articles typically

2
representing appropriate classes. The mapping weight is multiplied by the proportion of assertions not rejected using O .
Example 1: Bill Laswell is an American [[bassist]], [[record Only three of the four
assertions in this sentence are kept: BillLaswell is a UnitedStatesPerson, BassGuitarist, and Producer. BillLaswell cannot be a RecordCompany because OpenCyc knows a person cannot be a company.
Example 2: The concept Basketball-Ball initially maps as follows (Basketball:1.0, Basketball (ball):0.95, College basketball:0.02). The second candidate is the correct one, as the first refers to the team sport. The algorithm attempts to map its first choice Basketball back to Basketball-Ball, which succeeds but also creates a new potential reverse mapping Basketball Basketball. Consistency checking now tests Basketball-Ball is a TeamSport , which fails, removing this potential mapping. The next highest reverse-mapping is Basketball Basketball, which is found to be consistent, so a mapping is recorded for that. The process now backtracks to hypothesising the second-best option from the original list: Basketball (ball):0.95, which also successfully reverse-maps and is consistent, creating a new (correct) mapping. It is worth emphasising how similar the are by standard semantic relatedness measures, and thus the subtlety our methods are capable of.
3. Results and Conclusions The algorithm identified 54,987 mappings of OpenCyc concepts to Wikipedia articles. Applying manual analysis to a random 300 mappings, 266 were judged
5%), 21 (the mapping was largely correct but one side generalised the other). Thus 93%
of our mappings were YAGO reports 95% accuracy, what is being rated is not mapping joins between Wordnet and Wikipedia, but the truth of assertions in infoboxes. Although our efforts so far lack the scale of projects such as YAGO, we suggest they have a role to play in long-term development towards maximum accuracy in this field. We offer our results at: http://bit.ly/10MlLjl.
References Euzenat, J. and Shvaiko, P. (2007). Ontology Matching. Springer-Verlag. Ponzetto, S.P., and Navigli, R. (2009). Large-Scale Taxonomy Mapping for Restructuring
and Integrating Wikipedia, IJCAI 2009, Pasadena, California, pp. 2083-2088.
Knowledge for Ontology Mapping, OM-2006, Athens, GA, USA. Shvaiko, P. and Euzenat, J. (2005). A Survey of Schema-based Matching Approaches.
Journal on Data Semantics 4. Suchanek, F. M., Kasneci, G., and Weikum, G. (2008). Yago: A Large Ontology from
Wikipedia and WordNet. Elsevier Journal of Web Semantics 6(3), 203-217.

Variations on Aligning Linked Open Data Ontologies
Valerie Cross, Chen Gu, Xi Chen, Weiguo Xia, Peter Simon
Computer Science and Software Engineering Department Miami University, Oxford, OH 45056
[email protected] Traditional OA systems are not as suitable for aligning LOD ontology schemas; for
example, equivalence relations are limited among LOD concepts so that OA systems for LOD ontology alignment also find subclass and superclass relations. Four recent approaches for LOD ontology alignment are BLOOMS (BL) [1] and BLOOMS+ [2], AgreementMaker (AM) [3], WikiMatch (WM) [4], and Holistic Concept Mapping (HCM) [5]. Table 1 briefly compares these systems for aligning LOD ontologies.
Table 1. Recent OA systems for aligning LOD ontology schemas
OA
system Mapping type
Knowledge Source
Data Structure
Algorithms Experiment description
BL/BL+
Equivalence, subclass
Wikipedia category hierarchy
Concept category trees in a forest
Tree overlap using node depth, contextual similarity on superconcepts
LOD reference alignments, Proton mappings to DBpedia, Geonames, Freebase.
AM
Equivalence, subclass, superclass
WordNet, other LOD ontologies, i.e.,DBpedia or FOAF
Lexicon for a concept
Advanced Similarity Matcher, inferencing on import concept
LOD reference alignments
WM Equivalence Wikipedia articles
sets of articles
Jaccard index on article sets
OAEI 2011.5 conference track, multifarm dataset
HCM Equivalence, similar to, disjoint
Wikipedia category hierarchy
Concept category trees in a forest.
IR tf-idf on comment, label keyword, topic sets ppjoin with Jaccard
Concepts from triples of Billion Triple Challenge dataset, expert evaluation
Unlike the Ontology Alignment Evaluation Initiative (OAEI), no standard reference alignment exists for LOD ontologies. Researchers [4] had experts develop a benchmark, the LOD reference alignments between ontology schema pairs taken from eight LOD ontologies: AKT Reference (A), BBC program(B), DBpedia (D), FOAF(F), Geonames(G), Music(M), SIOC (S), and the Semantic Web Conference (W) because of their substantial LOD coverage domain diversity, and publicly available schemas. Experts produced both subclass and equivalence mappings between the pairs listed in Table 2. BLOOMS and AM are compared in the last two columns [3] since WM or HCM produce only equivalence mappings and few of these
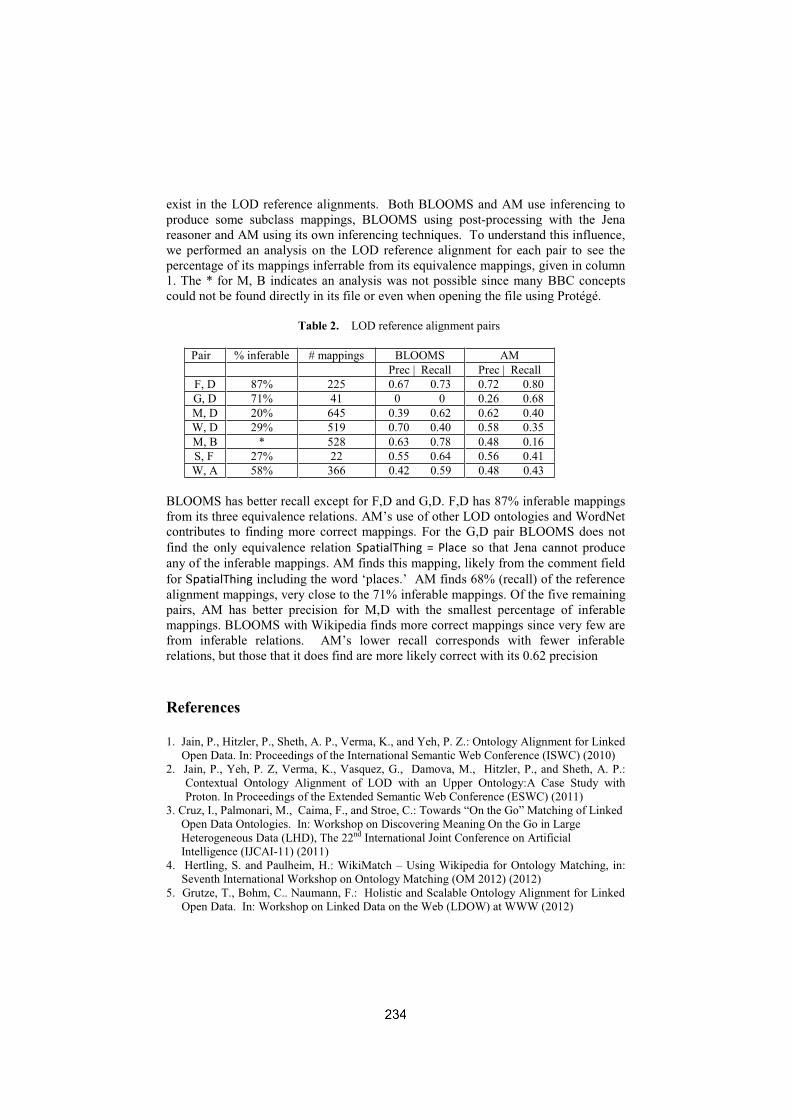
exist in the LOD reference alignments. Both BLOOMS and AM use inferencing to produce some subclass mappings, BLOOMS using post-processing with the Jena reasoner and AM using its own inferencing techniques. To understand this influence, we performed an analysis on the LOD reference alignment for each pair to see the percentage of its mappings inferrable from its equivalence mappings, given in column 1. The * for M, B indicates an analysis was not possible since many BBC concepts could not be found directly in its file or even when opening the file using Protégé.
Table 2. LOD reference alignment pairs
Pair % inferable # mappings BLOOMS AM Prec | Recall Prec | Recall
F, D 87% 225 0.67 0.73 0.72 0.80 G, D 71% 41 0 0 0.26 0.68 M, D 20% 645 0.39 0.62 0.62 0.40 W, D 29% 519 0.70 0.40 0.58 0.35 M, B * 528 0.63 0.78 0.48 0.16 S, F 27% 22 0.55 0.64 0.56 0.41 W, A 58% 366 0.42 0.59 0.48 0.43
BLOOMS has better recall except for F,D and G,D. F,D has 87% inferable mappings
contributes to finding more correct mappings. For the G,D pair BLOOMS does not find the only equivalence relation SpatialThing = Place so that Jena cannot produce any of the inferable mappings. AM finds this mapping, likely from the comment field for SpatialThing s 68% (recall) of the reference alignment mappings, very close to the 71% inferable mappings. Of the five remaining pairs, AM has better precision for M,D with the smallest percentage of inferable mappings. BLOOMS with Wikipedia finds more correct mappings since very few are from relations, but those that it does find are more likely correct with its 0.62 precision
References
1. Jain, P., Hitzler, P., Sheth, A. P., Verma, K., and Yeh, P. Z.: Ontology Alignment for Linked Open Data. In: Proceedings of the International Semantic Web Conference (ISWC) (2010)
2. Jain, P., Yeh, P. Z, Verma, K., Vasquez, G., Damova, M., Hitzler, P., and Sheth, A. P.: Contextual Ontology Alignment of LOD with an Upper Ontology:A Case Study with Proton. In Proceedings of the Extended Semantic Web Conference (ESWC) (2011)
3. Open Data Ontologies. In: Workshop on Discovering Meaning On the Go in Large Heterogeneous Data (LHD), The 22nd International Joint Conference on Artificial Intelligence (IJCAI-11) (2011) 4. Hertling, S. and Paulheim, H.: WikiMatch Using Wikipedia for Ontology Matching, in:
Seventh International Workshop on Ontology Matching (OM 2012) (2012) 5. Grutze, T., Bohm, C.. Naumann, F.: Holistic and Scalable Ontology Alignment for Linked
Open Data. In: Workshop on Linked Data on the Web (LDOW) at WWW (2012)
LOD4STAT: a scenario and requirements
Pavel Shvaiko1, Michele Mostarda2, Marco Amadori2, and Claudio Giuliano2
1 TasLab, Informatica Trentina S.p.A., Trento, Italy2 Fondazione Bruno Kessler - IRST, Trento, Italy
Abstract. In this short paper we present a scenario and requirements for on-tology matching posed by a statistical eGovernment application, which aims atpublishing its data (also) as linked open data.
Introduction. Our application domain is eGovernment. By eGovernment we mean anarea of application for information technologies to modernize public administration byoptimizing work of various public institutions and by providing citizens and businesseswith better and new services. More specifically, we focus on statistical applications foreGovernment. The driving idea is to capitalize on the statistical information in orderto increase knowledge of the Trentino region. Releasing statistical data (with disclo-sure control) as linked open data aims at simplifying access to resources in digital for-mats, at increasing transparency and efficiency of eGovernment services, etc. The mainchallenge is the realization of a knowledge base, which is natively enabled to workwith RDBMS tables. Despite this approach has been tailored specifically to the statis-tical database domain, there is substantial room for generalization. In this view, therewas a number of initiatives aiming at releasing governmental data as linked open datato be taken into account: in GovWILD [1] links were established automatically withspecifically developed similarity measures, while in [2], the alignment was done semi-automatically with Google Refine. The currently available matching techniques can bewell used for automating this process [3].Scenario. Figure 1 shows the key component, called Statistical Knowledge Base (SKB),of the LOD4STAT system-to-be. The SKB aims at enabling its users to query statisticaldata, metadata and relations across them without requiring specific knowledge of theunderlying database. Users can issue queries, such as find all data related to populationage and employment for the municipality of Trento. Specifically, user query is analyzedin order to extract concepts out of labels. Then, these are matched at run time against theSKB. For the query example, the term population age is connected to Registry Office,while employment is connected to Social Security. The system returns a set of tables,metadata and entities from the Registry Office (with information about population andage) and from the Social Security (with information about employment) containing datafor the city of Trento and will suggest possible joins between columns.
The SKB is an interconnected aggregation of ontologies (interpreted in a loosesense), such as WordNet, DBpedia, ESMS1 what allows both multi-classification andmultiple views on data. These ontologies have to be matched among them to enablenavigation across them through the respective correspondences. The SKB is also ableto export query results in several formats, such as RDF Data Cube and JSON-Stat. TheSKB is represented by three (horizontal) layers. The upper layer is a collection of on-tologies specific to the statistics domain, e.g., ESMS. The middle layer is composed
1http://epp.eurostat.ec.europa.eu/portal/page/portal/statistics/metadata

Fig. 1: LOD4STAT: the statistical knowledge base component.
of relational tables associated with metadata. The lower layer is composed of a collec-tion of general purpose ontologies, e.g., WordNet, DBpedia. Table columns are to bematched to the entities of the involved ontologies. Notice that SKB allows for the def-inition of explicit connections between columns of different tables that can be joinedtogether. Every time an alignment is updated the respective data is updated accordingly.Requirements. There are several key requirements posed by this application, such as:performance - answer queries within 3s., as suggested by the UI interaction practice;availability - service up by 99% of time, no more than 15mins. downtime per day duringworking hours. These requirements put only constraints on run time matching neededbetween the user query and the SKB ontologies. Matching results can be approximate,though their correctness is preferred over completeness. For what concerns design timematching inside the SKB, it can be performed at design time semi-automatically withsound and complete alignment when any of these knowledge sources evolve. Noticethat statistical disclosure control methods use weights associated to the table columns,and it should be possible to inherit them through the respective alignments.Conclusions and future work. In this short paper we have presented a scenario andrequirements for ontology matching within a statistical eGovernment application. Wenote that such requirements in part have a transversal character, such as for run timequery matching and design time matching between the ontologies of the system. How-ever, there are also peculiarities related to the use of alignments, such as support forstatistical disclosure control. Future work includes formalization, implementation andevaluation of the system in order to be brought to production.
Acknowledgments. The work has been supported by the Autonomous Province of Trento, Italy.
References1. C. Bohm, M. Freitag, A. Heise, C. Lehmann, A. Mascher, F. Naumann, V. Ercegovac,
M. Hernandez, P. Haase, and M.l Schmidt. GovWILD: integrating open government datafor transparency. In Proceedings of WWW, pages 321–324, 2012.
2. F. Maali, R. Cyganiak, and V. Peristeras. A publishing pipeline for linked government data.In Proceedings of ESWC, pages 778–792, 2012.
3. P. Shvaiko and J. Euzenat. Ontology matching: state of the art and future challenges. TKDE,25(1):158–176, 2013.

Interlinking and Visualizing Linked Open Datawith Geospatial Reference Data
Abdelfettah Feliachi1, Nathalie Abadie1, Faycal Hamdi2, and Ghislain AugusteAtemezing3
1 IGN, COGIT, 73 Avenue de Paris, 94165 Saint-Mande, France2 CEDRIC, CNAM, F-75141 Paris Cedex 03, France
3 EURECOM, Multimedia Department, Campus SophiaTech, France
1 Context and purposes
An increasing number of thematic datasets are published as RDF graphs andlinked to other datasets by identifying equivalent resources in other relevantdatasets. Among the set of properties usually used as data linking criteria, ge-olocation (addresses, locations, coordinates ) remains one of the most commonlyused.
However, resources that actually refer to complex topographic features aregenerally described by very simple geolocation properties, such as a position de-fined by coordinates (long, lat). On the other hand, geographic reference datasetsprovide more precise geometric information about geographic features. Inter-linking thematic linked open datasets with geographic reference datasets wouldenable us to take advantage of both information sources to link independent the-matic datasets and create rich cartographic applications for data visualization.
This data linking task is generally performed by comparing properties valuesof each resource of a given data set, with homologous properties of the resourcesdescribed in other datasets [3]. In the field of geographic databases, data match-ing is also performed by comparing properties, and especially complex geometries(curves, lines, polygons) that are used to represent the shape and the locationof geographic features. This task is usually based on distance measures chosenaccording to the type of the geometric primitives that must be compared [1,2, 4, 5]. We aim at combining both approaches to link both thematic and geo-graphical reference data and exploit the generated links in a data visualizationapplication.
2 Approach and use case
In order to take advantage of existing data linking tools, we have convertedgeographic shape data and stored them into a RDF triple store. This task hasbeen achieved by using the Datalift4 platform that also enables to perform thelinking process with external published datasets, through the use of Silk5 linkingtool. Our linking approach is mainly based on geolocation properties comparison.
4 http://datalift.org/5 https://www.assembla.com/spaces/silk/wiki/Silk_Workbench

2 Interlinking and Visualizing Linked Open Data
Thus we have added to Silk more GIS distance measures for computing theshortest distance between any geometric primitive and simple position locationsused in thematic datasets.
The result of this interlinking process is a list of owl:sameAs links betweenentities of each datasets, at a given threshold. These links are used to extendthe geographic reference data set with information queried on the fly from theexternal thematic datasets through the visualization interface. We have appliedthis approach on a geographical reference dataset about buildings and data abouthistorical monuments extracted from French DBpedia6, on the area of Paris.
Fig. 1. DBpedia points locating historical monuments linked with polygons describingbuildings in a geographic reference dataset.
3 Conclusion
The use of links between thematic and reference data could be further investi-gated to enable data visualization at different level of detail, and visual detectionerrors during matching process of geodata.
References
1. Mustire, S. et Devogele, T. Matching networks with different levels of detail.GeoInfor-matica, paratre en 2008
2. Olteanu, A.-M. Appariement de donnes spatiales par prise en compte de connais-sances imprcises. Thse de doctorat. Universit de Marne-La-Valle, 2008
3. Scharffe, F., Euzenat, J.: Mthodes et outils pour lier le Web des donnes. RFIA 2010:Re-connaissance des Formes et Intelligence Artificielle (2010)
4. Voltz, S. An Iterative Approach for Matching Multiple Representations of StreetData. In : Proceedings of ISPRS Workshop, Multiple representation and interoper-ability of spatial data, Hanovre (Allemagne), 22-24 fvrier 2006, p. 101-110
5. Walter, V. et Fritsch, D. Matching Spatial datasets: Statistical Approach. Interna-tional Journal of Geographical Information Science, 1999, 13(5), p. 445-473
6 http://fr.dbpedia.org

Matching Geospatial Instances
Heshan Du1, Natasha Alechina1, Michael Jackson1, Glen Hart2
1 University of Nottingham2 Ordnance Survey of Great Britain
The work presented in this paper extends our work on matching formal andinformal geospatial ontologies [1], aimed to realize the synergistic use of author-itative and crowd-sourced geospatial information. A geospatial instance is anobject which has a certain and verifiable location (geometry, topographic foot-print), as well as a meaningful label (for example, Victoria Shopping Centre inNottingham, UK). The source of examples in this paper are: The OpenStreetMap(OSM) [2] and the Ordnance Survey of Great Britain (OSGB) [3].
Different geospatial instances may have the same purely lexical informationand the same classification in terms of an ontology, but different locations. Forexample, there may be several restaurants called ‘Prezzo Ristorante’ in the samecity. Therefore, when matching geospatial instances, it is essential to use locationinformation. However, few of existing ontology matching or data interlinkingmethods can match spatial instances effectively.
There is also a choice in representing objects such as shopping centres as acollection of parts or as a single instance. For example, Victoria Centre is rep-resented as a collection of shops and other businesses in OSGB and as a singleinstance in OSM. In order to produce a meaningful correspondence between in-stances in OSGB and in OSM, we propose to use ‘partOf’ relation (mereologicalpartOf in geometry and having similar labels). If for two instances a and b weget ‘partOf’ relations in both directions, we generate a hypothesis that a and bbelong to ‘sameAs’.
Here we propose a new method for establishing ‘sameAs’ and ‘partOf’ re-lations between geospatial instances from different ontologies. In crowd-sourceddata, there is an increased possibility of error in measurement, and tendency tosimplify shapes of buildings. For this reason, in our method we use buffers tocompare geometries of instances. The size of the buffer (intuitively, ‘the marginof error’ σ) is a parameter which can be arrived at experimentally or within rea-son set arbitrarily. Intuitively the optimal value of σ corresponds to the maximaldeviation between two representations of the same object in two different datasets. In the case of OSGB and OSM data for Nottingham, this is experimentallydetermined as 20m. The new method has four steps.
Step 1: Extracting geometry sets. An ABox contains facts (geometry, lexicaland semantic classification information) about geospatial instances. We extracta set of geometries, Gi, from all the spatial instances in each ABox Ai, i = 1, 2.
Step 2: Matching geometry sets. For two sets of geometries, G1, G2, a levelof tolerance α and tolerance for the second best β, we generate the best twocandidate matches for each geometry in G1 if they exist in G2, and the best twocandidate matches for each geometry inG2 if they exist inG1. The candidates are

2
selected by comparing minimal buffers. The buffer of a geometry g, buffer(g, σ) ={p : ∃p′ ∈ g. distance(p, p′) ≤ σ}, (σ > 0). For two geometries g and h, theminimal buffer of h containing g is buffer(h, σ) such that g ⊆ buffer(h, σ) andfor all σ′ < σ, g �⊆ buffer(h, σ′). For any geometry g, the minimal buffer α(α ≤ σ) of its best candidate o1 (g ⊆ buffer(o1, α)) is the smallest among thoseof all the candidates. We generate a ’buffered part of’ (BPT ) relation betweeneach geometry and its candidates, i.e. (g, o1) ∈ BPT (σ).
Step 3: Comparing labels. We use string comparison, including equality,inclusion, abbreviation and edit distance to check whether the labels, such asnames or addresses, of two instances are similar. If there is no pair of labelsof spatial instances s1, s2 that are similar, then their lexical information is in-compatible, (s1, s2) ∈ LF . Otherwise, their lexical information is compatible,(s1, s2) ∈ LT .
For every pair of spatial instances s1, s2, if (g1, g2) ∈ BPT (α) (where gi isthe geometry of si, i = 1, 2) and (s1, s2) ∈ LT , then (s1, s2) ∈ partOf possiblyholds, and we will add it to the initial instance mapping M .
Step 4: Verifying initial instance mapping M using semantic classificationinformation. It is part of ontology (ABox and TBox) matching process, presentedin [1].
We implement the method described above as part of GeoMap [1]. From thestudied area (2km sq) of Nottingham city centre, 713 geospatial individuals of 47types are added to OSGB Buildings and Places ontology from the OSGB AddressLayer 2 and the OSGB Topology Layer [3], 253 geospatial individuals of 39 typesare added into OSM ontology automatically from the building layer of OSMdata. The ground truth instance mapping is obtained from manually matchingall the instances in the two ontologies. It contains 286 ‘partOf’ relations, and73 ‘sameAs’ relations can be inferred. The data used is available on http://
www.cs.nott.ac.uk/~hxd/GeoMap.html. We compare the performance of ourmethod with LogMap [4] and KnoFuss [5]. The precisions of mappings producedby GeoMap, LogMap and KnoFuss are 1, 0.24 and 0.18 respectively, and therecalls are 0.95, 0.38, 0.25 respectively. The precision and recall of GeoMap aremuch higher, mainly because LogMap and KnoFuss cannot make effective useof location information.
References
1. Du, H., Alechina, N., Jackson, M., Hart, G.: Matching Formal and Informal Geospa-tial Ontologies. In: Geographic Information Science at the Heart of Europe. LectureNotes in Geoinformation and Cartography. Springer (2013) 155–171
2. OpenStreetMap: http://www.openstreetmap.org (2012)3. Ordnance Survey: http://www.ordnancesurvey.co.uk/oswebsite (2012)4. Jimenez-Ruiz, E., Grau, B.C.: LogMap: Logic-Based and Scalable Ontology Match-
ing. In: International Semantic Web Conference (1). (2011) 273–2885. Nikolov, Andriy and Uren, Victoria and Motta, Enrico: KnoFuss: a Comprehen-
sive Architecture for Knowledge Fusion. In: Proceedings of the 4th InternationalConference on Knowledge Capture. (2007) 185–186