opec o organization of the petroleum exporting countries ... · the petroleum e exporting c...
TRANSCRIPT

January 2010
Feature Article:Fundamentals not behind recent market behaviour
Oil market highlights
Feature article
Crude oil price movements
Commodity markets
Highlights of the world economy
World oil demand
World oil supply
Product markets and refinery operations
The tanker market
Oil trade
Stock movements
Balance of supply and demand
1
3
5
10
15
20
29
37
42
46
55
61
OPECOrganization of the Petroleum Exporting Countries
Monthly Oil Market Report
Tel +43 1 21112 Fax +43 1 2164320 E-mail: [email protected] Web site: www.opec.org
Data Summary OPECOrganization of the Petroleum Exporting Countries
Monthly Oil Market Report
Tel +43 1 21112 Fax +43 1 2164320 E-mail: [email protected] Web site: www.opec.org
Data Summary
Helferstorferstrasse 17, A-1010 Vienna, Austria

_________________________________________________________________________________________________________________________________________Monthly Oil Market Report
January 2010 1
Oil Market Highlights Crude oil price developments saw two distinct patterns in December. After falling to a two-month low of $70.7/b in mid-December, the OPEC Reference Basket rebounded on the back of positive economic sentiment and colder weather in the Northern Hemisphere, which triggered a surge in speculative activity. As a result, the Basket price averaged $74.01/b in December, the second highest monthly figure in 2009 after November. The Basket increased further in the New Year to hit $80.29/b on 7 January, the highest since early October 2008. Since then, prices have reversed on economic concerns, milder weather and inventory builds to stand at $75.79/b on 18 January. The world economy is expected to grow by 3.1% in 2010, revised up from the previous forecast of 2.9%. Most of the challenges for the OECD have not gone away entirely and the region is still dependent on government-led support. In the US, which is now forecast to grow by 1.9%, private consumption remains weak. Japan is expected to grow by only 1.1%, despite the recent stimulus package, while the Euro-zone forecast is now at 0.6%. China and India remain the bright spots for this year’s recovery with an expected growth of 8.8% and 6.7% respectively, although concerns are emerging that these economies might be overheating. World oil demand declined by 1.4 mb/d in 2009. A cold winter, economic recovery and a low base for the previous year returned oil demand growth to positive territory by the end of the year. In 2010, world oil demand is forecast to grow by 0.8 mb/d. The decline in OECD consumption is expected to shrink as economic activity increases. Similarly, non-OECD countries are forecast to grow at a higher rate of 1.0 mb/d, compared with 0.5 mb/d in the previous year. Non-OPEC oil supply growth in 2009 is estimated at 0.5 mb/d, broadly unchanged from the previous assessment. In 2010, non-OPEC oil supply is expected to increase by 0.4 mb/d to average 51.3 mb/d in 2010, following an upward revision of 42 tb/d. The adjustment came partially from the US and Russia on the back of healthy production in the fourth quarter of 2009. In December, total OPEC crude production averaged 29.14 mb/d, the highest level in 2009, indicating an increase of 78 tb/d over the previous month. A cold snap across the globe along with increasing seasonal demand and product stock draws have underpinned product market sentiment and lifted crack spreads and refining margins, especially in the US and Europe. Should the cold weather persist, the overhang of middle distillate barrels would be partly mitigated, providing some relief to refiners in the coming weeks. However, the sustainability of recent developments in product markets and the positive impact on crude fundamentals and prices will largely depend on economic growth in the future. OPEC spot fixtures and sailings from OPEC increased by 6% and 1% respectively in December compared to the previous month. Freight rates in the crude oil tanker market increased on average by 12% in December with the VLCC sector increasing by 18%, Aframax by 23% and Suezmax declining by 5%. Volumes of both crude oil and petroleum products stored on tankers were almost steady by the end of December compared to a month earlier. Clean spot freight rates made a monthly gain of 30% in December and the market was equally firm on both sides of Suez. OECD commercial oil inventories rose 12.6 mb in November to stand around 93 mb above the five-year average. This represents 59.8 days of forward cover. Preliminary data for December shows a stock draw of 34 mb driven by the drop in US crude and products. However, the surplus over the five-year average remains above 90 mb. US commercial oil inventories fell 39.1 mb with both crude and products declining by 10.4 mb and 28.7 mb respectively. Despite this draw, US commercial oil inventories remained 46 mb above the five-year average. European total oil inventories (EU plus Norway) rose 1.9 mb in December. A substantial build in products was partially offset by a draw in crude. European inventories now stand at 12.3 mb above the five-year average. The demand for OPEC crude in 2009 is estimated at 28.7 mb/d, around 0.1 mb/d higher than the previous report. This still represents a decline of around 2.3 mb/d compared to the previous year. In 2010, the demand from OPEC crude is expected to average 28.6 mb/d, broadly unchanged from the previous assessment and representing a decline of 0.1 mb/d from the previous year.

Monthly Oil Market Report________________________________________________________________________________________________________________________________________
January 2010 2

_______________________________________________________________________________________________________________________________________________Monthly Oil Market Report
January 2010 3
Fundamentals not behind recent market behaviour
A recent surge saw crude oil prices gaining more than $10 since mid-December to break above the $80/b mark. As a result of this upward push, the price of WTI averaged $82.48/b in the first week of 2010. With the exception of 2008, this is the highest starting point in recent years (see Graph 1). As the market had been expected to continue to moderate, the jump in prices came as a surprise. Although prices have receded in recent days, this raises the question as to whether there are any new factors in the market that would support a higher price level or if the surge in prices represented only a temporary increase.
Looking back at the oil price developments in 2009, one recalls that the sharp downward slide in prices was halted in early 2009 following the OPEC decision to adjust production at the Oran meeting in December. Later, the G-20 summit in April was instrumental in calming financial markets and supporting the emerging recovery in equities which had already taken hold in early March. Massive government fiscal and monetary support on a global scale was able to steady economic output and gradually optimism began to spread on signs pointing to a recovery before the end of the year. Oil prices were supported by the resulting improvement in sentiment as well as US dollar weakness and renewed activity in the paper market.
Graph 1: Nymex WTI crude oil price Graph 2: Nymex WTI price vs Managed money net long positions
While the upward move in prices at the start of the year can be partially attributed to a global cold snap, it
cannot fully explain such a sharp increase, especially as inventories remain high enough to cope with any sudden jump in winter demand. Although higher seasonal demand led to stock draws in crude and heating oil, inventories remain at very high levels of 6% and 23% above the five-year average respectively, and floating storage for crude and products continues to be high at more than 140 mb, the bulk of which is comprised of distillates.
The other factor contributing to the recent rally was a surge in investment flows in the commodities markets, including oil (see Graph 2). The combination of both bullish economic news and the colder weather has increased the financial sector’s exposure to energy. Since the start of December, money managers have boosted net positions by more than 70% to stand at 175,620 contracts in the week ending 12 January.
In the coming months, oil market direction will mainly depend on a continuation of the current relatively positive outlook for the global economy, especially in key countries such as the US and China. Should developments turn out to be less positive than expected, market attention will revert back to weak oil fundamentals. Prices are likely to be particularly vulnerable to economic developments during the upcoming low-demand second quarter.
Although the overall situation is much improved compared to the same time last year, given the uncertainties surrounding the strength and durability of the economic recovery and weaker seasonal demand, the OPEC Conference decided to keep current oil production levels unchanged for the time being. The persisting stock overhang, low seasonal demand and start of refining maintenance point to the need for continued caution over the coming months as market volatility is expected to remain.
20
40
60
80
100
120
140
160
Jan Feb Mar Apr May Jun Jul Aug Sep Oct Nov Dec
2006 2007 2008 2009 2010
0
20
40
60
80
100
120
140
160
180
200
64
66
68
70
72
74
76
78
80
82
84
01 Sep 09 01 Oct 09 31 Oct 09 30 Nov 09 30 Dec 09
Managed money net long positions WTI
'000 Contracts$US/b

Monthly Oil Market Report______________________________________________________________________________________________________________________________________
4 January 2010
____________________________________________________________________________________________________________________________________Monthly Oil Market Report
January 2010 5
Crude Oil Price Movements
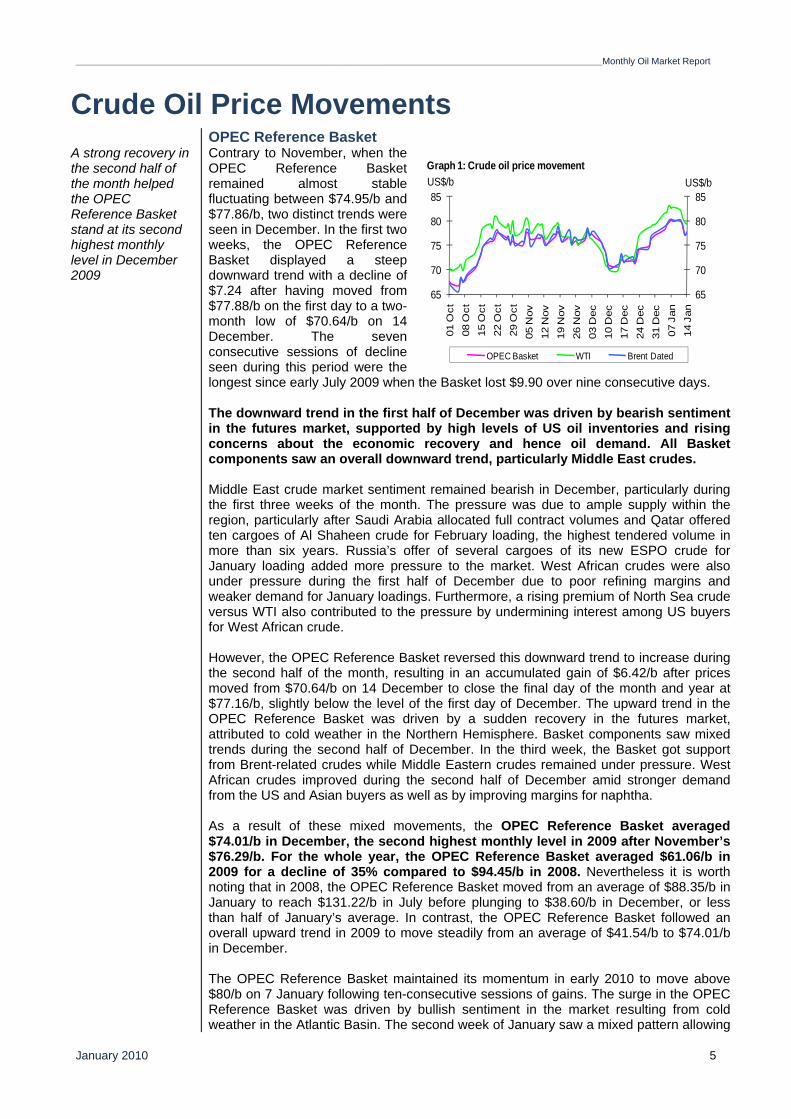
OPEC Reference Basket A strong recovery in the second half of the month helped the OPEC Reference Basket stand at its second highest monthly level in December 2009
Contrary to November, when the OPEC Reference Basket remained almost stable fluctuating between $74.95/b and $77.86/b, two distinct trends were seen in December. In the first two weeks, the OPEC Reference Basket displayed a steep downward trend with a decline of $7.24 after having moved from $77.88/b on the first day to a two-month low of $70.64/b on 14 December. The seven consecutive sessions of decline seen during this period were the longest since early July 2009 when the Basket lost $9.90 over nine consecutive days. The downward trend in the first half of December was driven by bearish sentiment in the futures market, supported by high levels of US oil inventories and rising concerns about the economic recovery and hence oil demand. All Basket components saw an overall downward trend, particularly Middle East crudes. Middle East crude market sentiment remained bearish in December, particularly during the first three weeks of the month. The pressure was due to ample supply within the region, particularly after Saudi Arabia allocated full contract volumes and Qatar offered ten cargoes of Al Shaheen crude for February loading, the highest tendered volume in more than six years. Russia’s offer of several cargoes of its new ESPO crude for January loading added more pressure to the market. West African crudes were also under pressure during the first half of December due to poor refining margins and weaker demand for January loadings. Furthermore, a rising premium of North Sea crude versus WTI also contributed to the pressure by undermining interest among US buyers for West African crude. However, the OPEC Reference Basket reversed this downward trend to increase during the second half of the month, resulting in an accumulated gain of $6.42/b after prices moved from $70.64/b on 14 December to close the final day of the month and year at $77.16/b, slightly below the level of the first day of December. The upward trend in the OPEC Reference Basket was driven by a sudden recovery in the futures market, attributed to cold weather in the Northern Hemisphere. Basket components saw mixed trends during the second half of December. In the third week, the Basket got support from Brent-related crudes while Middle Eastern crudes remained under pressure. West African crudes improved during the second half of December amid stronger demand from the US and Asian buyers as well as by improving margins for naphtha. As a result of these mixed movements, the OPEC Reference Basket averaged $74.01/b in December, the second highest monthly level in 2009 after November’s $76.29/b. For the whole year, the OPEC Reference Basket averaged $61.06/b in 2009 for a decline of 35% compared to $94.45/b in 2008. Nevertheless it is worth noting that in 2008, the OPEC Reference Basket moved from an average of $88.35/b in January to reach $131.22/b in July before plunging to $38.60/b in December, or less than half of January’s average. In contrast, the OPEC Reference Basket followed an overall upward trend in 2009 to move steadily from an average of $41.54/b to $74.01/b in December. The OPEC Reference Basket maintained its momentum in early 2010 to move above $80/b on 7 January following ten-consecutive sessions of gains. The surge in the OPEC Reference Basket was driven by bullish sentiment in the market resulting from cold weather in the Atlantic Basin. The second week of January saw a mixed pattern allowing
65
70
75
80
85
65
70
75
80
85
01 O
ct08
Oct
15 O
ct22
Oct
29 O
ct05
Nov
12 N
ov19
Nov
26 N
ov03
Dec
10 D
ec17
Dec
24 D
ec31
Dec
07 J
an14
Jan
US$/bUS$/b
OPEC Basket WTI Brent Dated
Graph 1: Crude oil price movement
Monthly Oil Market Report_____________________________________________________________________________________________________________________________________
January 2010 6
the Basket to hit $80.29/b, the highest level since early October 2008. Afterwards, the Basket dropped to $75.79/b on 18 January. Prices moved down as bearish sentiment in the futures market emerged again after temperatures improved along with a build in the main components of US oil inventories — crude oil, gasoline and distillates — through the previous week. All components contributed to the rise in the OPEC Reference Basket in the first week of January while the second week saw mixed trends among components. Middle Eastern crude market sentiment improved within the second week of January as reflected in the February Brent/Dubai exchange for swaps (EFS) – the price spread between ICE Brent futures and Dubai swaps – which dropped to just 8¢/b on 14 January, supported by stronger middle distillate cracks. Middle Eastern crudes were also supported by strong middle-distillate cracks and a cut in ADNOC and Qatar allocations.
The oil futures market Bullish market sentiment from cold weather pushed WTI to its 15-month high in early January 2010
The crude oil futures market remained bearish in first half of December as ample oil inventories and persistent concerns about the pace of the economic recovery continued to weigh on oil demand prospects, particularly in OECD countries. In the US market, front month WTI crude futures on the Nymex lost almost $9 between 1 December and 14 December following nine consecutive declines to settle at $69.51/b, the lowest level since late September, but then began to recover in the following days. Cold weather across the Northern Hemisphere alongside with positive economic indicators — such as an increase in US industrial output and investment flows into the oil market — pushed WTI to $79.36/b on the last day of December, implying an increase of almost $10 within two weeks. Additionally, concerns about a dispute between Russia and Ukraine regarding transit fees for crude destined for Europe added more bullishness to the market. In January, the WTI future contract strengthened further to hit a 15-month high of $82.75/b on 8 December. This level came after a ten-session increase, which was the
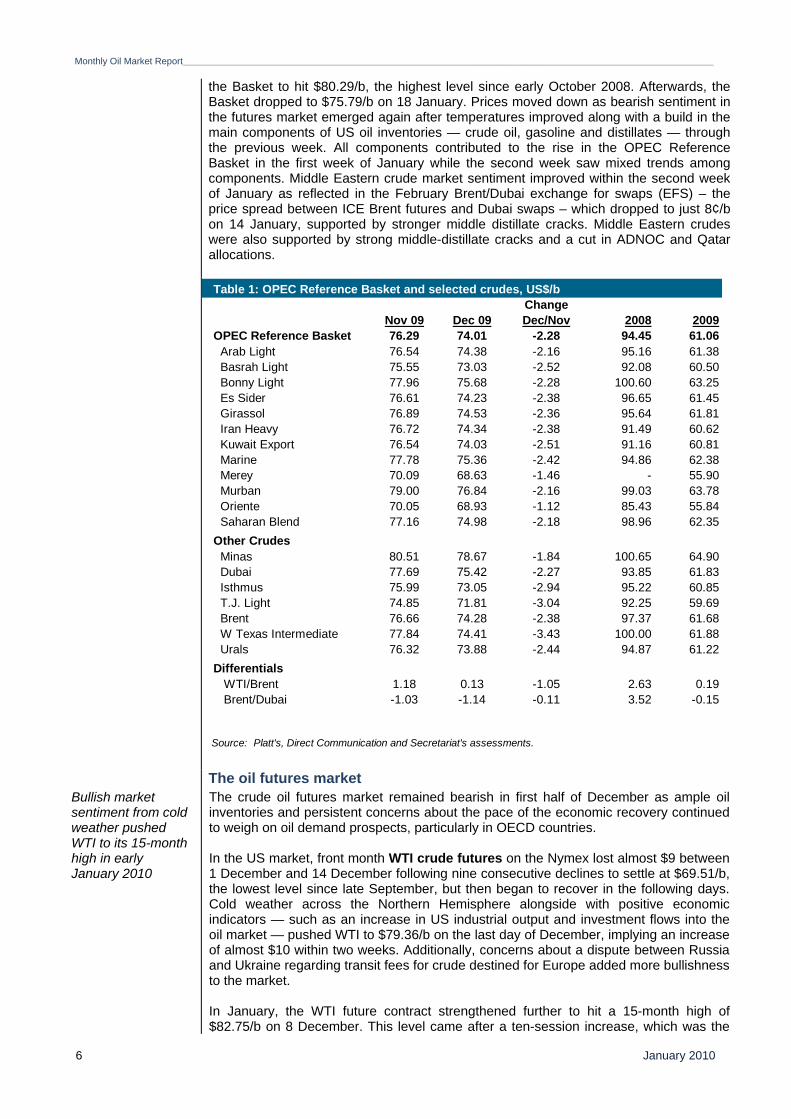
Table 1: OPEC Reference Basket and selected crudes, US$/bChange
Nov 09 Dec 09 Dec/Nov 2008 200976.29 74.01 -2.28 94.45 61.06
Arab Light 76.54 74.38 -2.16 95.16 61.38 Basrah Light 75.55 73.03 -2.52 92.08 60.50 Bonny Light 77.96 75.68 -2.28 100.60 63.25 Es Sider 76.61 74.23 -2.38 96.65 61.45 Girassol 76.89 74.53 -2.36 95.64 61.81 Iran Heavy 76.72 74.34 -2.38 91.49 60.62 Kuwait Export 76.54 74.03 -2.51 91.16 60.81 Marine 77.78 75.36 -2.42 94.86 62.38 Merey 70.09 68.63 -1.46 - 55.90 Murban 79.00 76.84 -2.16 99.03 63.78 Oriente 70.05 68.93 -1.12 85.43 55.84 Saharan Blend 77.16 74.98 -2.18 98.96 62.35
Minas 80.51 78.67 -1.84 100.65 64.9077.69 75.42 -2.27 93.85 61.8375.99 73.05 -2.94 95.22 60.8574.85 71.81 -3.04 92.25 59.6976.66 74.28 -2.38 97.37 61.6877.84 74.41 -3.43 100.00 61.8876.32 73.88 -2.44 94.87 61.22
Differentials WTI/Brent 1.18 0.13 -1.05 2.63 0.19
-1.03 -1.14 -0.11 3.52 -0.15
Source: Platt's, Direct Communication and Secretariat's assessments.
OPEC Reference Basket
Brent/Dubai
T.J. Light Brent
Other Crudes
Dubai Isthmus
W Texas Intermediate Urals
Note: As per the request of Venezuela and as approved by the 111th ECB, the Venezuelan crudeC f O f
____________________________________________________________________________________________________________________________________Monthly Oil Market Report
January 2010 7
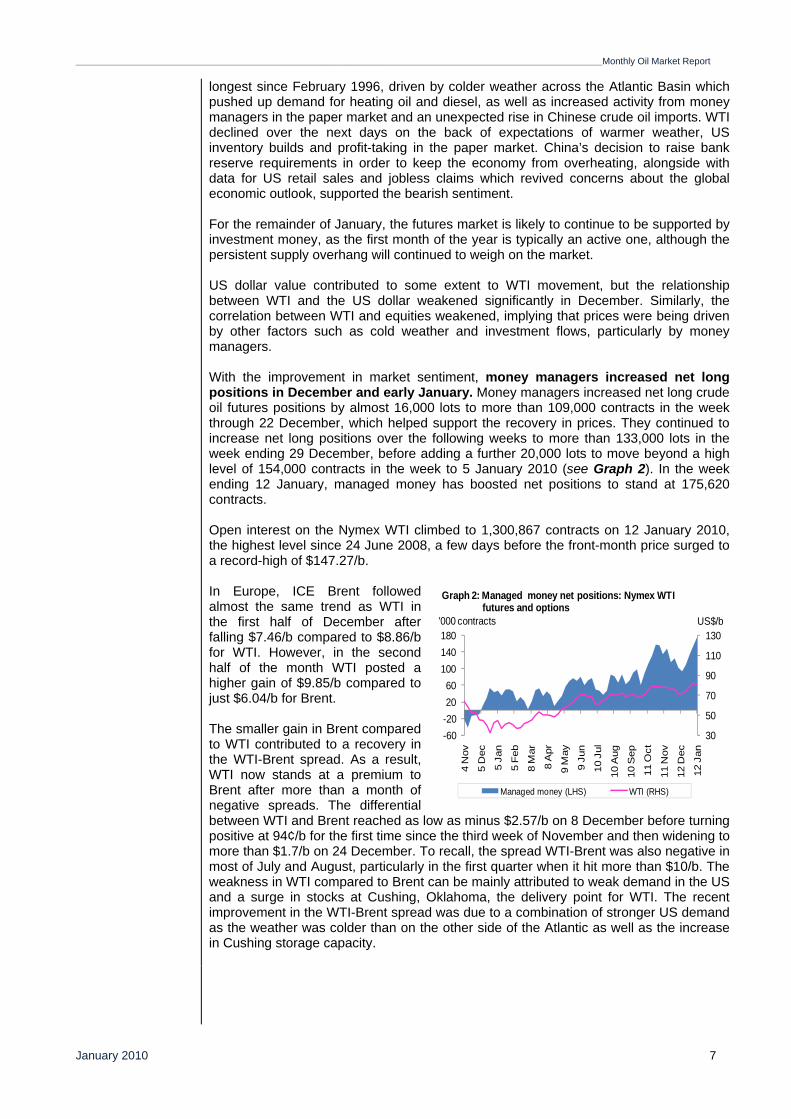
longest since February 1996, driven by colder weather across the Atlantic Basin which pushed up demand for heating oil and diesel, as well as increased activity from money managers in the paper market and an unexpected rise in Chinese crude oil imports. WTI declined over the next days on the back of expectations of warmer weather, US inventory builds and profit-taking in the paper market. China’s decision to raise bank reserve requirements in order to keep the economy from overheating, alongside with data for US retail sales and jobless claims which revived concerns about the global economic outlook, supported the bearish sentiment. For the remainder of January, the futures market is likely to continue to be supported by investment money, as the first month of the year is typically an active one, although the persistent supply overhang will continued to weigh on the market. US dollar value contributed to some extent to WTI movement, but the relationship between WTI and the US dollar weakened significantly in December. Similarly, the correlation between WTI and equities weakened, implying that prices were being driven by other factors such as cold weather and investment flows, particularly by money managers. With the improvement in market sentiment, money managers increased net long positions in December and early January. Money managers increased net long crude oil futures positions by almost 16,000 lots to more than 109,000 contracts in the week through 22 December, which helped support the recovery in prices. They continued to increase net long positions over the following weeks to more than 133,000 lots in the week ending 29 December, before adding a further 20,000 lots to move beyond a high level of 154,000 contracts in the week to 5 January 2010 (see Graph 2). In the week ending 12 January, managed money has boosted net positions to stand at 175,620 contracts. Open interest on the Nymex WTI climbed to 1,300,867 contracts on 12 January 2010, the highest level since 24 June 2008, a few days before the front-month price surged to a record-high of $147.27/b. In Europe, ICE Brent followed almost the same trend as WTI in the first half of December after falling $7.46/b compared to $8.86/b for WTI. However, in the second half of the month WTI posted a higher gain of $9.85/b compared to just $6.04/b for Brent. The smaller gain in Brent compared to WTI contributed to a recovery in the WTI-Brent spread. As a result, WTI now stands at a premium to Brent after more than a month of negative spreads. The differential between WTI and Brent reached as low as minus $2.57/b on 8 December before turning positive at 94¢/b for the first time since the third week of November and then widening to more than $1.7/b on 24 December. To recall, the spread WTI-Brent was also negative in most of July and August, particularly in the first quarter when it hit more than $10/b. The weakness in WTI compared to Brent can be mainly attributed to weak demand in the US and a surge in stocks at Cushing, Oklahoma, the delivery point for WTI. The recent improvement in the WTI-Brent spread was due to a combination of stronger US demand as the weather was colder than on the other side of the Atlantic as well as the increase in Cushing storage capacity.
30
50
70
90
110
130
-60-202060
100140180
4 N
ov
5 D
ec
5 Ja
n
5 F
eb
8 M
ar
8 A
pr
9 M
ay
9 Ju
n
10 J
ul
10 A
ug
10 S
ep
11 O
ct
11 N
ov
12 D
ec
12 J
an
US$/b'000 contracts
Managed money (LHS) WTI (RHS)
Graph 2: Managed money net positions: Nymex WTI futures and options
Monthly Oil Market Report_____________________________________________________________________________________________________________________________________
January 2010 8
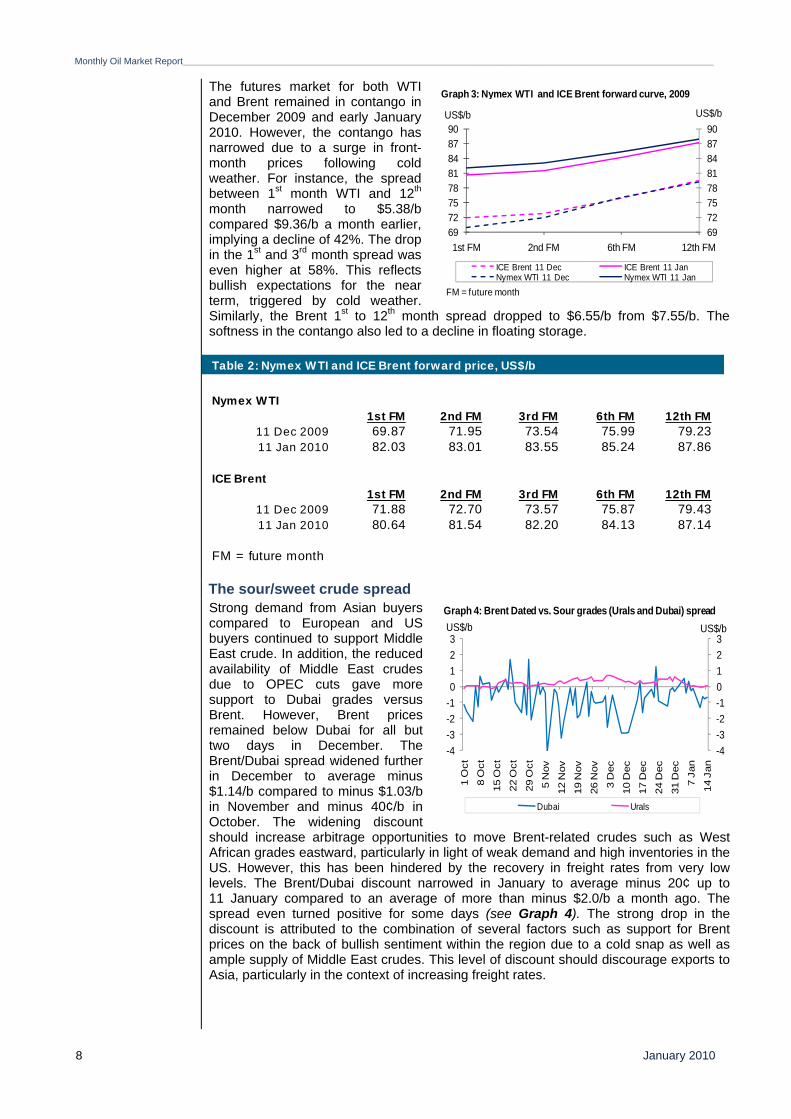
The futures market for both WTI and Brent remained in contango in December 2009 and early January 2010. However, the contango has narrowed due to a surge in front-month prices following cold weather. For instance, the spread between 1st month WTI and 12th month narrowed to $5.38/b compared $9.36/b a month earlier, implying a decline of 42%. The drop in the 1st and 3rd month spread was even higher at 58%. This reflects bullish expectations for the near term, triggered by cold weather. Similarly, the Brent 1st to 12th month spread dropped to $6.55/b from $7.55/b. The softness in the contango also led to a decline in floating storage.
Table 2: Nymex WTI and ICE Brent forward price, US$/b
Nymex WTI 1st FM 2nd FM 3rd FM 6th FM 12th FM
11 Dec 2009 69.87 71.95 73.54 75.99 79.2311 Jan 2010 82.03 83.01 83.55 85.24 87.86
ICE Brent1st FM 2nd FM 3rd FM 6th FM 12th FM
11 Dec 2009 71.88 72.70 73.57 75.87 79.4311 Jan 2010 80.64 81.54 82.20 84.13 87.14
FM = future month
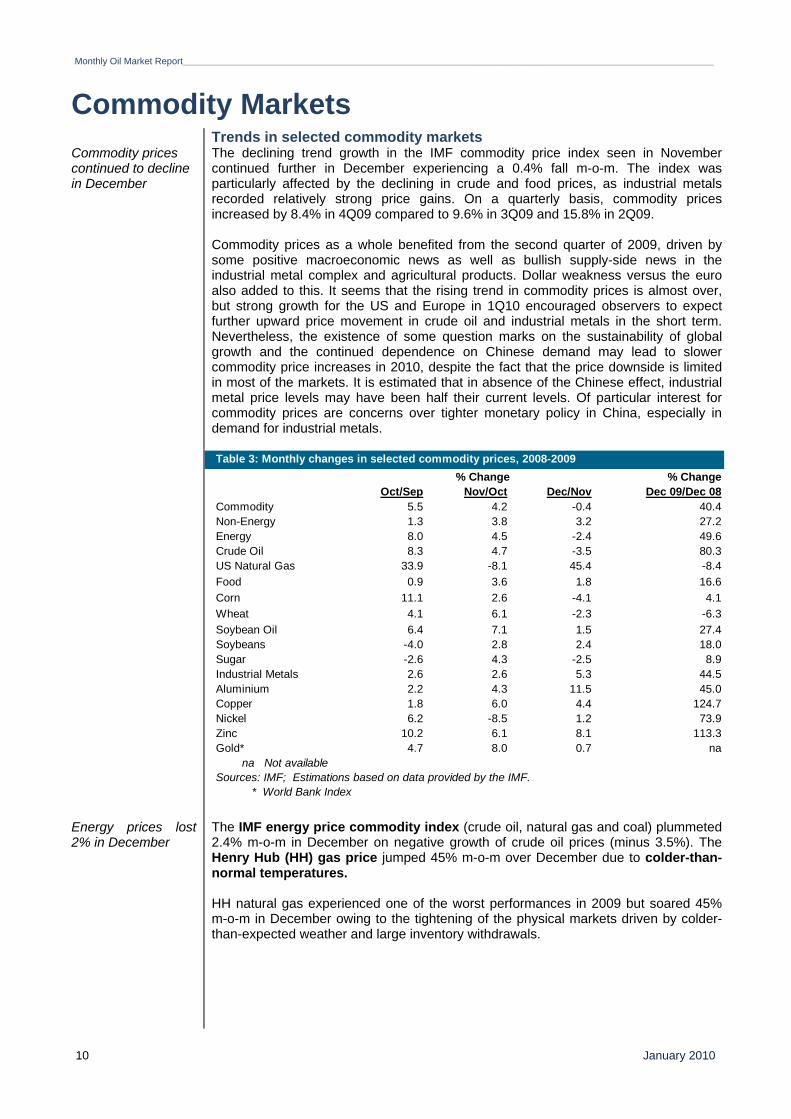
The sour/sweet crude spread Strong demand from Asian buyers
compared to European and US buyers continued to support Middle East crude. In addition, the reduced availability of Middle East crudes due to OPEC cuts gave more support to Dubai grades versus Brent. However, Brent prices remained below Dubai for all but two days in December. The Brent/Dubai spread widened further in December to average minus $1.14/b compared to minus $1.03/b in November and minus 40¢/b in October. The widening discount should increase arbitrage opportunities to move Brent-related crudes such as West African grades eastward, particularly in light of weak demand and high inventories in the US. However, this has been hindered by the recovery in freight rates from very low levels. The Brent/Dubai discount narrowed in January to average minus 20¢ up to 11 January compared to an average of more than minus $2.0/b a month ago. The spread even turned positive for some days (see Graph 4). The strong drop in the discount is attributed to the combination of several factors such as support for Brent prices on the back of bullish sentiment within the region due to a cold snap as well as ample supply of Middle East crudes. This level of discount should discourage exports to Asia, particularly in the context of increasing freight rates.
-4-3-2-10123
-4-3-2-10123
1 O
ct
8 O
ct
15 O
ct
22 O
ct
29 O
ct
5 N
ov
12 N
ov
19 N
ov
26 N
ov
3 D
ec
10 D
ec
17 D
ec
24 D
ec
31 D
ec
7 Ja
n
14 J
an
US$/bUS$/b
Dubai Urals
Graph 4: Brent Dated vs. Sour grades (Urals and Dubai) spread
6972757881848790
6972757881848790
1st FM 2nd FM 6th FM 12th FM
US$/bUS$/b
ICE Brent 11 Dec ICE Brent 11 JanNymex WTI 11 Dec Nymex WTI 11 Jan
FM = future month
Graph 3: Nymex WTI and ICE Brent forward curve, 2009

____________________________________________________________________________________________________________________________________Monthly Oil Market Report
January 2010 9
Ample supply, lower refinery runs and poor refining margins exerted further pressure on Russian Urals crude in December. The Urals crude differential with Brent averaged 40¢/b in December, up 6¢ from a month earlier. However, the Urals crude differential strengthened in January supported by improving refining margins and tight supply due to shipping delays in the Black Sea because of bad weather. In addition, a recent increase in Saudi Arabia’s official selling price gave further support to Urals crude.
Monthly Oil Market Report_____________________________________________________________________________________________________________________________________
January 2010 10
Commodity Markets Trends in selected commodity markets Commodity prices continued to decline in December
The declining trend growth in the IMF commodity price index seen in November continued further in December experiencing a 0.4% fall m-o-m. The index was particularly affected by the declining in crude and food prices, as industrial metals recorded relatively strong price gains. On a quarterly basis, commodity prices increased by 8.4% in 4Q09 compared to 9.6% in 3Q09 and 15.8% in 2Q09. Commodity prices as a whole benefited from the second quarter of 2009, driven by some positive macroeconomic news as well as bullish supply-side news in the industrial metal complex and agricultural products. Dollar weakness versus the euro also added to this. It seems that the rising trend in commodity prices is almost over, but strong growth for the US and Europe in 1Q10 encouraged observers to expect further upward price movement in crude oil and industrial metals in the short term. Nevertheless, the existence of some question marks on the sustainability of global growth and the continued dependence on Chinese demand may lead to slower commodity price increases in 2010, despite the fact that the price downside is limited in most of the markets. It is estimated that in absence of the Chinese effect, industrial metal price levels may have been half their current levels. Of particular interest for commodity prices are concerns over tighter monetary policy in China, especially in demand for industrial metals.
Energy prices lost 2% in December
The IMF energy price commodity index (crude oil, natural gas and coal) plummeted 2.4% m-o-m in December on negative growth of crude oil prices (minus 3.5%). The Henry Hub (HH) gas price jumped 45% m-o-m over December due to colder-than-normal temperatures. HH natural gas experienced one of the worst performances in 2009 but soared 45% m-o-m in December owing to the tightening of the physical markets driven by colder-than-expected weather and large inventory withdrawals.
% ChangeOct/Sep Nov/Oct Dec/Nov Dec 09/Dec 08
Commodity 5.5 4.2 -0.4 40.4Non-Energy 1.3 3.8 3.2 27.2Energy 8.0 4.5 -2.4 49.6Crude Oil 8.3 4.7 -3.5 80.3US Natural Gas 33.9 -8.1 45.4 -8.4Food 0.9 3.6 1.8 16.6Corn 11.1 2.6 -4.1 4.1Wheat 4.1 6.1 -2.3 -6.3Soybean Oil 6.4 7.1 1.5 27.4Soybeans -4.0 2.8 2.4 18.0Sugar -2.6 4.3 -2.5 8.9Industrial Metals 2.6 2.6 5.3 44.5Aluminium 2.2 4.3 11.5 45.0Copper 1.8 6.0 4.4 124.7Nickel 6.2 -8.5 1.2 73.9Zinc 10.2 6.1 8.1 113.3Gold* 4.7 8.0 0.7 na
Table 3: Monthly changes in selected commodity prices, 2008-2009 % Change
na Not availableSources: IMF; Estimations based on data provided by the IMF. * World Bank Index

____________________________________________________________________________________________________________________________________Monthly Oil Market Report
January 2010 11
Commodity Price Index, 2005 = 100Total - Includes both fuel and non-fuel. Non-fuel - Includes food and beverages and industrial inputs. Food - Includes cereal, vegetable oils, meat, seafood, sugar, bananas and oranges. Metals - Includes copper, aluminum, iron ore, tin, nickel, zinc, lead and uranium. Fuel (energy) - Includes crude oil (petroleum), natural gas and coal. Crude oil - Is the simple average of three spot prices: Dated Brent, West Texas Intermediate and Dubai Fateh.
The non-fuel commodity price index rose at a slower pace in December
The non-energy commodity price grew 3.2% in December compared to 3.8% a month earlier. The slower growth in food prices was counterbalanced by the accelerated growth in industrial metals which expanded 5.3% m-o-m in December compared to 2.6% in the previous month. The improvement in December followed positive manufacturing data from the US and China, including the stronger-than-expected December US ISM, US durable goods orders and Chinese PMI. Perspectives on loose monetary policy in China and the US in December together with favourable US auto sales also contributed to encourage industrial metal price gains over December. Aluminium seems to have experienced a bubble with prices at the LME increasing 11.5% m-o-m in December compared to 4% a month earlier. As already highlighted in the previous month, aluminum prices are at odds with weak fundamentals that characterize the market. Production should surpass consumption by 97,000 tonnes in 4Q09. According to the International Aluminum Institute, Chinese output increased 8% in November. However, on the demand side, higher auto sales in the US in October, continuing imports into China and expectations of a demand recovery in line with a promising macroeconomic climate may have contributed to the price bubble in aluminium. Copper prices rose 4% m-o-m in November, supported by positive Chinese data. Industrial production in this country achieved the strongest growth rate in the year in October (16% y-o-y) and imports of copper augmented 10% m-o-m in November, with a surge of 67% during the first eleven months of the year. Additionally, there was a m-o-m increase in the US Purchasing Manager’s Index in October. On the supply side, prices felt the negative impact of the restarting of mines and the end of a labour conflict in Chile translated into a 10% m-o-m output expansion in Chile during November, according to the National Statistic Office. Copper output in China also rose for the fourth consecutive month, with a growth rate of 6% m-o-m in November. After a hefty fall of 8.5% m-o-m in November, nickel prices recovered to increase by 1.2% m-o-m in December. This was essentially sustained by supply tightness in major producing economies due to strike actions. It must be noted that the demand from China appears to have improved since last October, when imports were 70% lower than the peak experienced in July. Zinc prices increased further in December by 8% m-o-m compared to 6% in
50
100
150
200
250
300
50
100
150
200
250
300
Dec
07
Feb
08
Apr
08
Jun
08
Aug
08
Oct
08
Dec
08
Feb
09
Apr
09
Jun
09
Aug
09
Oct
09
Dec
09
Total Non-fuel Food Metals Fuel (energy) Crude Oil
Graph 5: Major commodity price indexes, 2007-2009

Monthly Oil Market Report_____________________________________________________________________________________________________________________________________
January 2010 12
November. Nevertheless, in the wake of other base metals, fundamentals remain weak with a surplus expected in the last quarter of 2009 according to Brook Hunt. Prices also responded to relatively strong apparent demand in China and some supply constraints in the region due to bad weather. The IMF food price index decelerated m-o-m in December as drops in major oil seeds and grains offset the price rise in some other items. The fall in major price crops was accelerated following the January US Department of Agriculture release of the World Agricultural Supply and Demand Estimates (WASDE) that was substantially bearish for corn, soybean and wheat. Gold prices grew by only 1% m-o-m in December compared to 8% in November due to the rise in US bond yields and the US real interest rate.
Investment flow into commodities The open interest volume (OIV) in
major commodities (agriculture, copper, natural gas, WTI, livestock and precious metals) in the US declined slightly by 0.03% m-o-m in December compared to 2.5% the previous month to stand at 6,916,980 contracts. Precious metals, WTI and some agricultural commodities experienced major losses in OIV.
0
1000
2000
3000
4000
5000
0
100
200
300
400
500
600
Jan
09
Feb
09
Mar
09
Apr
09
May
09
Jun
09
Jul 0
9
Aug
09
Sep
09
Oct
09
Nov
09
Dec
09
'000 Tonnes'000 Tonnes
Copper Lead Nickel Tin Zinc Pr. Aluminium (RHS)
Graph 6: Inventories at the LME
4000
5000
6000
7000
8000
9000
4000
5000
6000
7000
8000
9000
Jan
07
Jun
07
Nov
07
Apr 0
8
Sep
08
Feb
09
Jul 0
9
Dec
09
Graph 7: Total open interest volume'000Ct '000Ct
Source: CFTC

____________________________________________________________________________________________________________________________________Monthly Oil Market Report
January 2010 13
According to disaggregated CFTC data, non-commercial net length pace of growth slowed in December rising 6% compared to 13.4% the month before. A rise of 3.2% in non-commercial long positions in December combined with a milder 1.8% drop in shorts resulted in non-commercial net length as percentage of OIV to increase from 57.9% in November to 59.9% in December. Money-managed positions in volume increased by 5.8% m-o-m in December compared to 11.9% m-o-m a month earlier.
Agricultural OIV increased by only 0.8% m-o-m to 3,571,122 contracts which compared unfavourably to a 3.7% rise in November. Losses in soybean oil, corn, cotton, wheat etc., counterbalanced the gains in other items such as soybean and sugar. Non-commercial net length in agriculture increased 5.9% m-o-m to 1,471,391 contracts in December compared to a gain of 13.6% a month earlier. Longs went up 3.4% m-o-m in December while a drop of 2.9% in shorts caused the net length as percentage of OIV to stand at 41% in December up from 39.2% the previous month.
Dec 09 Dec % OIV Dec % OIV Dec % OIV Dec % OIVCrude Oil 1198 154 13 112 9 -39 -3 227 19Natural Gas 716 716 19 -113 -16 -38 -5 -14 -2Agriculture 3571 789 22 630 18 53 1 1,471 41Precious Metals 630 -104 -16 235 37 53 8 185 29Copper 149 58 39 12 8 -1 -1 69 46Livestock 477 146 31 61 13 -7 -1 200 42Total 6741 1,181 18 938 14 21 0 2,140 32
Nov 09 Nov % OIV Nov % OIV Nov % OIV Nov % OIVCrude Oil 1,215 114 9 138 11 -50 -4 202 17Natural Gas 716 138 19 -140 -20 -20 -3 -22 -3Agriculture 3,541 792 22 575 16 22 1 1,389 39Precious Metals 657 -91 -14 249 38 36 6 195 30Copper 147 52 36 11 8 -2 -1 61 42Livestock 469 146 31 58 12 -25 -5 179 38Total 6,745 1,151 17 891 13 -38 -1 2,004 30
Open interest
Swap positionsMoney
positions Other positionsNon-
commercialsNet length Net length Net length Net length
Table 4: CFTC data on non-commercial positions, '000 contracts
Swap positions Money positions Other positions Non-
commercialsNet length Net length Net length Net length
Open interest
-200
200
600
1000
1400
1800
2200
2600
Jun
06
Sep
06
Dec
06
Mar
07
Jun
07
Sep
07
Dec
07
Mar
08
Jun
08
Sep
08
Dec
08
Mar
09
Jun
09
Sep
09
Dec
09
'000 Ct
Agriculture Gold WTINatural gas Livestocks Copper
Graph 8: CFTC net length by commodity group
Source: CFTC
-20
-10
0
10
20
30
40
50
60
-20
-10
0
10
20
30
40
50
60
Jun
06
Sep
06
Dec 0
6
Mar
07
Jun
07
Sep
07
Dec 0
7
Mar
08
Jun
08
Sep
08
Dec 0
8
Mar
09
Jun
09
Sep
09
Dec 0
9
Agriculture Gold WTI
Livestocks Copper Natural gas
Graph 9: CFTC net length as % of open interest
Source: CFTC

Monthly Oil Market Report_____________________________________________________________________________________________________________________________________
January 2010 14
An increase in money positions for agriculture of 8.7% m-o-m was reported in December, compared to 15.5% m-o-m in November. A 1% drop took place in swaps in December. Precious metals OIV saw a contraction of 4% m-o-m to 629,743 contracts in December. A 2% rise in non-commercial longs combined with a 11% growth in shorts led the non-commercial net length as percentage of OIV at 29.5% in December, down 1% from a month earlier. Nymex natural gas futures OIV remained almost the same at 716,199 contracts in December compared to the previous month. A 4% decline in shorts amid a 1% drop in longs resulted in the net length as percentage of OIV at minus 2%. Copper open interest volume rose only 1.3% m-o-m to 148,929 contracts following a 14.7% m-o-m gain the previous month. Non-commercial net length climbed 12.6% in December. A 3% decline in shorts and a 6% rise in longs put the net length as a percentage of OIV in 46.5% in December.
The dollar value of investment flow into commodities increased by 7.9% m-o-m in December 2009 for all subsectors of commodities. Investment accrued to natural gas in December due to higher prices linked to colder-than-expected temperatures.
0102030405060708090100
0102030405060708090
100
Dec 08 Jan 09 Feb 09 Mar 09 Apr 09 May 09 Jun 09 Jul 09 Aug 09 Sep 09 Oct 09 Nov 09 Dec 09
$bn$bn
Precious metals Industrial metals Natural gas Brent crude WTI crude Livestocks Agricultural
Graph 10: Inflow of investment into commodities
Source: CFTC
__________________________________________________________________________________________________________________________________________Monthly Oil Market Report
January 2009 15
Highlights of the World Economy Economic growth rates 2009-2010,% World OECD USA Japan Euro-
zone China India
2009 -1.1 -3.4 -2.6 -5.3 -3.9 8.0 6.2 2010 3.1 1.4 1.9 1.1 -0.6 8.8 6.7
Industrialised countries USA The US economy showed improvement supported by government policies, but unemployment continued high while retail sales weakened
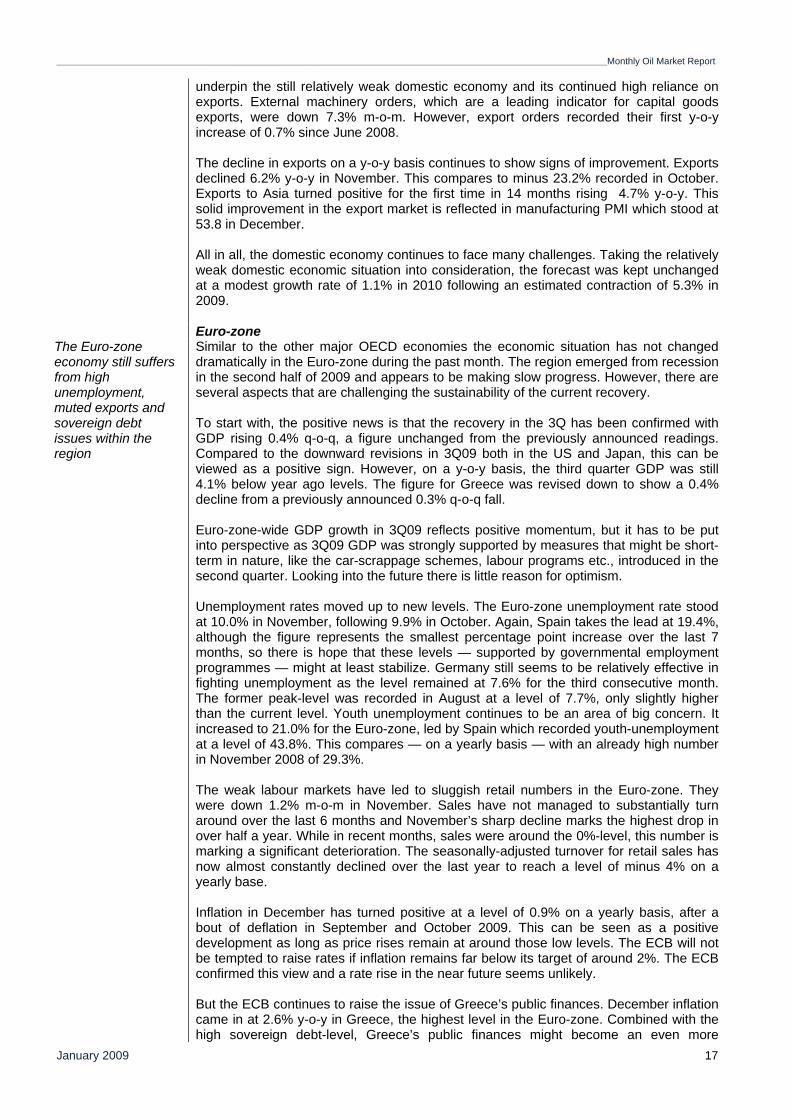
The story-line for 2010 has not changed dramatically over the last four weeks. Economic growth in 2010 will still depend on government support following the massive stimulus that has already been provided by the US Administration over the course of 2009. This raises the question of the sustainability of growth if the government lifeline is removed. Amid the massive stimulus seen in the third quarter, households were the main contributors to GDP growth to the tune of almost 2 percentage points. This was the first quarter in almost three years that private consumption contributed significantly to GDP growth. While cheered by investors and triggering a jump in equities, this development needs to be put into perspective. First, the initial announcement of the Bureau of Economic Analysis (BEA) for 3Q GDP growth has been revised down two times since October’s first release. The first release was a solid number of 3.5% q-o-q at a seasonally adjusted annualised rate (saar). In November, a downward revision led to 2.8%, and in December the third revision indicated an estimate of only 2.2%, a relatively large reduction from the initial value. Within these same three months, equity markets rose by almost 9%, continuing their positive momentum and obviously incorporating some solid quarters going forward or ignoring the still weak underlying growth pattern. Supported by incentive measures such as tax credits, car scrappage schemes and other stimulus policies, households had begun to spend again, as shown by solid retail numbers. However, this trend was interrupted in December as sales declined 0.3% m-o-m. This surprisingly weak result followed an upwardly revised number for November of 1.8% growth. The positive aspect is that at least on a yearly comparison the December numbers show growth of 5.4% and for the whole 4Q09 retail sales grew 5.2% on a y-o-y basis. The relative success of the stimulus measures might continue to support the economy and consumer spending in the coming months, but this remains far from certain.
The ISM indices have again improved reflecting the positive growth trend. The ISM manufacturing index rose to 55.9 in December, 2.3 Index-points above November, to a level usually associated with solid economic growth. But again, here the development is relatively volatile as the index had already reached a similar level in October (55.7). The non-manufacturing index which fell below the expansion threshold of 50 in November when it stood at 48.7, rose to just above the 50-level again in December. The volatility of the numbers can be observed as well in this most important sector. Furthermore, at a
0
10
20
30
40
50
60
0
10
20
30
40
50
60
Oct
08
Dec
08
Feb
09
Apr
09
Jun
09
Aug
09
Oct
09
Dec
09
0
10
20
30
40
50
60
0
10
20
30
40
50
60
Oct
08
Dec
08
Feb
09
Apr
09
Jun
09
Aug
09
Oct
09
Dec
09
Source: Institute for Supply Management
Graph 11a: ISM Manufacturing Index Graph 11b: ISM Non-Manufacturing Index

Monthly Oil Market Report____________________________________________________________________________________________________________________________________________
January 2010 16
level of 50.1, it is still almost stagnant, while it accounts for almost 90% of US GDP. It remains to be seen if, in the coming months, the leading manufacturing sector can pull the service-sector significantly above the 50-level. The unemployment rate in December remained unchanged at the high level of 10%, with 85,000 non-farm jobs shed. Given the weak employment market in an economy that is still dependent on the government-led stimulus and in which the housing market has again come under pressure, one has to be careful in judging the sustainability of this recovery as obvious challenges remain. Pending home sales, a leading indicator, declined for the first time in 10 months by 16% m-o-m in November. It then seems even more surprising that despite all those challenges, the US equity market continues to experience relatively healthy growth. According to Gluskin Sheff and Associates, the S&P 500 index is currently pricing in 4.6% GDP growth for 2010, while the consensus view is currently at around 3%. Not only has the stock market risen significantly in 2009, it continued to do so in the first two weeks of January — up by more than 2% — and has moved above its recent trading range of between 1090 and 1130, a clear indication that the market is of the opinion that this positive momentum in economic growth might continue. At the same time, this renders equity markets very vulnerable. Any substantial negative news flow could lead to a sharp market correction. Taking these challenges into consideration, the GDP forecast for 2010 was increased only slightly by 0.3 percentage points to 1.9% for 2010 but was adjusted to minus 2.6% for 2009, from minus 2.5% in the previous month, given the downward revision to 3Q09.
Japan Fiscal stimulus, inventory restocking and exports supported the Japanese economy, but domestic demand remains weak
Japan is still facing many challenges and the slightly positive momentum that has been observed since 2Q09 is only expected to continue to a certain extent in 2010. The economy remains dependent on government support. In December, the Japanese government issued a large fiscal stimulus package. For the time being, the pillars of the current expansion remain this government’s lifeline along with restocking of inventories and improving exports. There are currently not a lot of positive developments in the domestic economy and the near future is still relatively uncertain. The unemployment rate has risen for the first time in the last four months. It moved to 5.2% in November, which is 0.1% higher than the previous month. The only bright spot is that the widely watched jobs-to-application ratio has increased for the third straight month to 0.45. New job-openings, being viewed as a leading indicator, rose by 0.3% m-o-m, but this positive trend is on the decline if one compares it to the increase of 1.1% in October and 3.6% in September. So it seems that companies are again getting more cautious about hiring and it is not expected that the employment situation will improve significantly in the near future. Based on a still relatively high unemployment rate by Japanese standards, retail sales were correspondingly weak. Sales dropped 1.0% y-o-y in October, although these numbers are deflated by declining price levels in the retail sector in Japan. The consumer price index fell 2.5% y-o-y in October and continued to drop by 1.9% in November. However, on a m-o-m basis, prices increased somewhat by 0.2% in November, after declining in October by 0.9%. A key-element for private household consumption going forward will be the further development in prices, which continues to be one of the main issues for the Bank of Japan (BoJ). The BOJ called for an emergency meeting in December to announce a new short-term funding facility and underlined its commitment to fight deflation by announcing it would tolerate nothing but price growth. Japanese industrial production increased by a healthy 2.6% m-o-m in November. Moreover, it is projected that the index will continue to rise in December and January by 3.4% and 1.3%, respectively. This reflects the sharp rebound in exports, positive policy measures and inventory restocking. However, this positive trend contrasts sharply with the latest November machinery orders data which recorded a drop of 11.3% m-o-m. Orders from manufacturing fell by 18.2% after 25.4% growth in October whereas non-manufacturing orders recorded a double-digit decline for a second consecutive month at minus 10.6% in November, after October’s 17.3% decline. Manufacturing orders
__________________________________________________________________________________________________________________________________________Monthly Oil Market Report
January 2009 17
underpin the still relatively weak domestic economy and its continued high reliance on exports. External machinery orders, which are a leading indicator for capital goods exports, were down 7.3% m-o-m. However, export orders recorded their first y-o-y increase of 0.7% since June 2008. The decline in exports on a y-o-y basis continues to show signs of improvement. Exports declined 6.2% y-o-y in November. This compares to minus 23.2% recorded in October. Exports to Asia turned positive for the first time in 14 months rising 4.7% y-o-y. This solid improvement in the export market is reflected in manufacturing PMI which stood at 53.8 in December. All in all, the domestic economy continues to face many challenges. Taking the relatively weak domestic economic situation into consideration, the forecast was kept unchanged at a modest growth rate of 1.1% in 2010 following an estimated contraction of 5.3% in 2009.
Euro-zone The Euro-zone economy still suffers from high unemployment, muted exports and sovereign debt issues within the region
Similar to the other major OECD economies the economic situation has not changed dramatically in the Euro-zone during the past month. The region emerged from recession in the second half of 2009 and appears to be making slow progress. However, there are several aspects that are challenging the sustainability of the current recovery. To start with, the positive news is that the recovery in the 3Q has been confirmed with GDP rising 0.4% q-o-q, a figure unchanged from the previously announced readings. Compared to the downward revisions in 3Q09 both in the US and Japan, this can be viewed as a positive sign. However, on a y-o-y basis, the third quarter GDP was still 4.1% below year ago levels. The figure for Greece was revised down to show a 0.4% decline from a previously announced 0.3% q-o-q fall. Euro-zone-wide GDP growth in 3Q09 reflects positive momentum, but it has to be put into perspective as 3Q09 GDP was strongly supported by measures that might be short-term in nature, like the car-scrappage schemes, labour programs etc., introduced in the second quarter. Looking into the future there is little reason for optimism. Unemployment rates moved up to new levels. The Euro-zone unemployment rate stood at 10.0% in November, following 9.9% in October. Again, Spain takes the lead at 19.4%, although the figure represents the smallest percentage point increase over the last 7 months, so there is hope that these levels — supported by governmental employment programmes — might at least stabilize. Germany still seems to be relatively effective in fighting unemployment as the level remained at 7.6% for the third consecutive month. The former peak-level was recorded in August at a level of 7.7%, only slightly higher than the current level. Youth unemployment continues to be an area of big concern. It increased to 21.0% for the Euro-zone, led by Spain which recorded youth-unemployment at a level of 43.8%. This compares — on a yearly basis — with an already high number in November 2008 of 29.3%. The weak labour markets have led to sluggish retail numbers in the Euro-zone. They were down 1.2% m-o-m in November. Sales have not managed to substantially turn around over the last 6 months and November’s sharp decline marks the highest drop in over half a year. While in recent months, sales were around the 0%-level, this number is marking a significant deterioration. The seasonally-adjusted turnover for retail sales has now almost constantly declined over the last year to reach a level of minus 4% on a yearly base. Inflation in December has turned positive at a level of 0.9% on a yearly basis, after a bout of deflation in September and October 2009. This can be seen as a positive development as long as price rises remain at around those low levels. The ECB will not be tempted to raise rates if inflation remains far below its target of around 2%. The ECB confirmed this view and a rate rise in the near future seems unlikely. But the ECB continues to raise the issue of Greece’s public finances. December inflation came in at 2.6% y-o-y in Greece, the highest level in the Euro-zone. Combined with the high sovereign debt-level, Greece’s public finances might become an even more
Monthly Oil Market Report____________________________________________________________________________________________________________________________________________
January 2010 18
important issue going forward. Moreover, the European Commission has recently warned that budget numbers issued by the Greek government may be understating the country’s debt woes, a worrying factor that may continue to weigh on the Euro. The positive trend in industrial production that started in the 2Q09 is continuing. Euro-zone industrial production was up 1.0% m-o-m in November 2009, following a decline of 0.3% in October, the only negative number registered over the last six months. Meanwhile, exports have fared less positively. Seasonally-adjusted Euro-zone exports fell almost 0.4% m-o-m in November and their growth trend is deteriorating. In August they had risen by 4.5% m-o-m and in September they were recorded at minus 0.1% m-o-m. Taking the above challenges into consideration, the forecast remained unchanged. GDP for 2010 is forecast to rise at a pace of 0.6% following an estimated decline of 3.9% last year.
Former Soviet Union Inflation in Russia in 2010 is expected in around 7%, a record low Russian Central Bank is expected to continue lowering interest rate
The Ministry for Economic Development of Russia forecasts 2010 inflation in the range of 6.5 – 7.5% (December estimates), while GDP will grow, under the Ministry’s most likely moderate optimistic scenario by 3.1% this year if oil trades at $65/b. In addition, for the time being, the Russian budget includes an annual average crude price assumption of $58/b, while official GDP growth forecast is 1.6%. Before the financial crisis intensified last autumn, inflation was Russia's chief economic problem. During the 1990s, the country saw double- and even triple-digit price increases amid drastic economic changes and currency devaluation. In an attempt to stimulate the country’s weak economy, Russia’s central bank announced another cut in interest rates and more gradual trims are expected in the coming months. The most recent cut took the benchmark refinancing rate to 8.75% from 9.00%. The minimum one-day repo rate will be cut to 6.00% from 6.25%. Lower inflation last year has allowed the central bank to cut the refinancing rate by 4.25 percentage points to a current record low of 8.75% to stimulate lending and stem the appreciation of the ruble. The central bank has said that rate cuts will continue into this year as long as inflation remains under control. It has also kept prices from rising on key consumer goods, averting the social unrest feared at the start of the crisis.
Developing Countries Reserve ratio in China was lifted by the Central Bank to 16%
China's central bank lifted the ratio of reserves that banks must set aside by half a percentage point earlier in the month. The move, which will boost the reserve ratio for most commercial banks to 16%, is estimated to drain 200 billion yuan to 300 billion yuan from the banking system. Chinese banks extended 379.8 billion yuan ($55.6 billion) of loans in December, bringing total loan growth for the year to 9.6 trillion yuan. That represents a rise of 95.3% from a year earlier, according to the People's Bank of China. Money supply as measured by M2 was up 27.7% in December, easing slightly from November's 29.7% rise. China's foreign-exchange stockpile climbed to $2.4 trillion at the end of December 2009, up $126.4 billion from the end of the third quarter. The bank-lending figures indicate that for the six months through December, lending grew at a slower pace compared to the first half of the year. Also, China's exports were particularly strong in December 2009, rising 17.7% after 13 months of annual declines. If the GDP growth in the last quarter proves to be stronger than expected, Beijing could move even more aggressively to manage inflation.
Rising inflation in India might force end to stimulus
Between September 2008 and April 2009, the government of India injected fiscal and monetary stimuli worth more than 12% of gross domestic product, helping Asia’s third-largest economy to grow 7.9% in the three months ending September 2009, the fastest pace in one-and-a-half years. Wholesale prices rose faster in more than a year, strengthening the case for the central bank to withdraw monetary stimulus. The benchmark wholesale-price index climbed 7.31% in December from a year earlier, following a 4.78% gain in November, according to the Commerce Ministry. Industrial production increased 11.7% in November, the fastest pace of growth in more than two years.
__________________________________________________________________________________________________________________________________________Monthly Oil Market Report
January 2009 19
OPEC Member Countries Saudi Arabia expected to return to growth in 2010
The recovery in Saudi Arabia’s economy this year is expected to follow a gradual and steady track. After a difficult 2009, economic growth could accelerate while inflation remains at manageable, albeit historically high levels. Expansion of the private sector is set to take a turn for the better along with credit expansion at Saudi banks. The government is expected to continue playing a major stimulatory role through the public spending programmes, which will assist the national economy. This is a feasible option given the low levels of government debt. A higher oil price environment could enable Saudi Arabia to experience comfortable budget and current account surpluses.
Public sector in Ecuador is a key contributor to recovery in 2010
Ecuador's unemployment rate stood at 7.9% in December according to the government.Public spending has limited the figure from further rising. Public sector investments will be key to economic growth because it will boost the construction activities and help the housing sector. Inflation in the country is expected to reach 3.5% this year, after 3.1% in 2009. The government expects to receive external financing of about $2.18 bn and to raise domestic financing of $1.9 bn in 2010.
Oil prices, the US dollar and inflation The US dollar strengthened against all major currencies due to positive US economic indicators
After having weakened since March 2009, the US dollar started to gather strength again in December and rose against all four major currencies in the basket. On an average monthly basis, the US currency rose 2% against the euro and pound sterling, 1.5% vis-à-vis the Swiss-franc and 0.3% versus the Japanese yen. The US dollar averaged $1.4618/€ over the whole month of December. It had already reached $1.5120 at the beginning of December – its weakest level since August 2008 – but made a sharp reversal of almost 5% to close at $1.4406/€ at the end of the month. This appreciation was mostly due to the positive economic indicators in contrast to relatively weaker data from the Euro-zone and Japan. The rise in the US dollar took off following the surprisingly positive employment report on 4 December.
In December, the OPEC Reference Basket declined by $2.28/b or 3.0% to $74.01/b from $76.29/b in November. In real terms (base June 2001=100), after accounting for inflation and currency fluctuations, the Basket price fell by 77¢/b or 1.6% to $46.10/b from $46.87/b. The dollar rose by 1.2%, as measured against the import-weighted modified Geneva I+US dollar basket, while inflation was negative with prices falling 0.2%.*
* The ‘modified Geneva I+US$ basket’ includes the euro, the Japanese yen, the US dollar, the pound sterling and the Swiss franc, weighted
according to the merchandise imports of OPEC Member Countries from the countries in the basket.

Monthly Oil Market Report_____________________________________________________________________________________________________________________________________
January 2010 20
World Oil Demand World oil demand in 2009 The world financial crisis negatively affected oil demand in 2009, leading to a contraction of 1.4 mb/d or 1.6%
A cold winter, improved economic activity and a low base in the previous year pushed up December oil demand, mainly in North America. December was cold in most of the northern hemisphere, which positively affected heating and fuel oil consumption. Improved demand in China, India and the US pulled world oil demand from out of the red to show growth of 0.9% or 0.76 mb/d in December. Most OECD December oil demand growth was in heating and fuel oil. Resulting from improved US consumption, OECD December oil demand narrowed losses to only 0.3%.
2008 1Q09 2Q09 3Q09 4Q09 2009 Volume %North America 24.17 23.52 22.92 23.27 23.43 23.28 -0.89 -3.67Western Europe 15.33 14.91 14.23 14.79 14.95 14.72 -0.61 -3.96OECD Pacific 8.07 8.14 7.30 7.33 7.88 7.66 -0.40 -5.02Total OECD 47.56 46.57 44.45 45.39 46.26 45.66 -1.90 -3.99
Other Asia 9.39 9.41 9.73 9.50 9.71 9.59 0.20 2.15Latin America 5.80 5.61 5.82 6.01 5.95 5.85 0.04 0.77Middle East 6.89 6.96 7.07 7.30 7.03 7.09 0.19 2.81Africa 3.18 3.26 3.23 3.16 3.27 3.23 0.04 1.38Total DCs 25.27 25.24 25.85 25.96 25.95 25.75 0.48 1.92
FSU 4.11 3.82 3.70 4.14 4.18 3.96 -0.15 -3.54Other Europe 0.79 0.77 0.73 0.77 0.76 0.76 -0.03 -4.18China 7.97 7.61 8.38 8.56 8.20 8.19 0.22 2.73Total "Other Regions" 12.87 12.20 12.82 13.46 13.14 12.91 0.04 0.31
Total world 85.70 84.00 83.12 84.81 85.36 84.33 -1.38 -1.61Previous estimate 85.70 84.02 83.11 84.76 85.33 84.31 -1.39 -1.62Revision 0.00 -0.01 0.00 0.05 0.03 0.02 0.02 0.02
Totals may not add due to independent rounding.
Change 2009/08Table 5: World oil demand forecast for 2009, mb/d
1Q08 1Q09 Volume % 2Q08 2Q09 Volume %North America 24.77 23.52 -1.25 -5.05 24.42 22.92 -1.51 -6.17Western Europe 15.32 14.91 -0.41 -2.69 15.06 14.23 -0.83 -5.50OECD Pacific 8.91 8.14 -0.77 -8.60 7.86 7.30 -0.56 -7.16Total OECD 49.00 46.57 -2.43 -4.96 47.34 44.45 -2.90 -6.12
Other Asia 9.49 9.41 -0.08 -0.85 9.55 9.73 0.18 1.86Latin America 5.60 5.61 0.01 0.12 5.84 5.82 -0.02 -0.34Middle East 6.77 6.96 0.19 2.84 6.87 7.07 0.20 2.96Africa 3.22 3.26 0.04 1.13 3.18 3.23 0.04 1.36Total DCs 25.08 25.24 0.15 0.62 25.45 25.85 0.40 1.59
FSU 4.17 3.82 -0.35 -8.49 3.79 3.70 -0.09 -2.27Other Europe 0.83 0.77 -0.06 -6.98 0.76 0.73 -0.03 -3.68China 7.97 7.61 -0.37 -4.58 8.17 8.38 0.22 2.67Total "Other Regions" 12.98 12.20 -0.78 -5.99 12.72 12.82 0.10 0.82
Total world 87.06 84.00 -3.05 -3.51 85.50 83.12 -2.39 -2.79
Totals may not add due to independent rounding.
Change 2009/08 Change 2009/08Table 6: First and second quarter world oil demand comparison for 2009, mb/d
-3.5-3.0-2.5-2.0-1.5-1.0-0.50.00.5
-3.5-3.0-2.5-2.0-1.5-1.0-0.50.00.5
Total world oil demand
1Q09 2Q09 3Q09 4Q09
World oil demand changes, 2009
mb/d mb/d
-3.50% -2.80% -0.43% +0.31%

_____________________________________________________________________________________________________________________________________Monthly Oil Market Report
January 2010 21
The world financial crisis negatively affected 2009 oil demand, resulting in a decline of 1.4 mb/d or 1.6 %. Nevertheless, the world managed to consume more oil in the second half of the year with 0.25% growth in the fourth quarter. As a result of the financial turmoil, the quarterly distribution and seasonality of the growth in world oil demand deviates significantly from the historical pattern in which the maximal growth typically occurs during the first and fourth quarters.
Forecasting Review The world financial crisis took everyone by surprise and made it difficult to forecast not only its impact on the world economy but also the impact on world oil demand as well. Most of the forecasters went to the extreme in forecasting world oil demand; however, they carried out major revisions later on when the picture became clearer. The IEA and EIA forecast painted a very dim picture with world oil demand contracting by minus 2.6 mb/d and minus 1.8 mb/d for the year. OPEC forecast world oil demand to decline by minus 1.7 mb/d. In total, the accumulative monthly absolute change forecast by the IEA and EIA stands at 5.3 mb/d and 3.7 mb/d, while OPEC’s total revision was 2.9 mb/d.
OECD – North AmericaNorth America forecast to decline by 0.9 mb/d in 2009
Cold weather along with improved economic activities pushed US oil demand to reduce the loss in December to an almost flat level. December data indicated that strong heating and fuel oil consumption put the whole month’s y-o-y demand at a flat rate. Transportation fuel showed minor growth as well. Given the holiday season, gasoline continued its previous month’s trend showing growth of 0.4% in December. US oil demand is highly affected by the country’s economic situation. Should the economy
3Q08 3Q09 Volume % 4Q08 4Q09 Volume %North America 23.57 23.27 -0.31 -1.29 23.93 23.43 -0.50 -2.09Western Europe 15.52 14.79 -0.72 -4.67 15.41 14.95 -0.47 -3.02OECD Pacific 7.54 7.33 -0.21 -2.73 7.97 7.88 -0.09 -1.18Total OECD 46.63 45.39 -1.24 -2.65 47.32 46.26 -1.06 -2.24
Other Asia 9.27 9.50 0.23 2.46 9.23 9.71 0.48 5.14Latin America 5.97 6.01 0.04 0.75 5.80 5.95 0.15 2.52Middle East 7.09 7.30 0.21 2.96 6.86 7.03 0.17 2.48Africa 3.11 3.16 0.04 1.35 3.21 3.27 0.05 1.68Total DCs 25.44 25.96 0.53 2.06 25.11 25.95 0.85 3.37
FSU 4.22 4.14 -0.09 -2.01 4.24 4.18 -0.06 -1.41Other Europe 0.79 0.77 -0.03 -3.40 0.78 0.76 -0.02 -2.56China 8.10 8.56 0.45 5.58 7.65 8.20 0.56 7.26Total "Other Regions" 13.12 13.46 0.34 2.59 12.67 13.14 0.48 3.75
Total world 85.18 84.81 -0.37 -0.43 85.10 85.36 0.26 0.31
Totals may not add due to independent rounding.
Change 2009/08Change 2009/08Table 7: Third and fourth quarter world oil demand comparison for 2009, mb/d
Comparison of forecasting changes: World oil demand in 2009, y-o-y growthmb/d Initial Forecast Lowest Forecast Report January 2010 AccumulatedOPEC 0.9 -1.7 (July 2009) -1.4 2.9EIA 1.4 -1.8 (May 2009) -1.7 3.7IEA 0.8 -2.6 (May 2009) -1.3 5.3
00.61.21.82.433.64.24.85.4
0.00.61.21.82.43.03.64.24.85.4
Jul 0
8A
ug 0
8S
ep 0
8O
ct 0
8N
ov 0
8D
ec 0
8Ja
n 09
Feb
09M
ar 0
9A
pr 0
9M
ay 0
9Ju
n 09
Jul 0
9A
ug 0
9S
ep 0
9O
ct 0
9N
ov 0
9D
ec 0
9
World oil demand in 2009Accumulated absolute change in monthly forecast
OPEC Secretariat IEA EIA/DOE
5.3
3.72.9
mb/d

Monthly Oil Market Report_____________________________________________________________________________________________________________________________________
January 2010 22
continue its recovery, then oil demand should quickly follow suit. December oil demand only showed a contraction of minus 0.03 mb/d y-o-y. Most of the petroleum products either reduced their losses or even experienced growth. Bad weather slightly affected driving; consequently, it shaved monthly gasoline growth to half. As a result of the financial crisis, US oil demand plunged in the first half and then shrunk its loss in the second half to settle at minus 0.8 mb/d for the whole year. Low driving mileage affected gasoline consumption in the first three quarters; however, it moved to the positive side in the second half of the year.
Furthermore, cold weather affected oil demand in Canada. Canada oil demand was flat in November; however, early data points to minor y-o-y growth in December. The majority of the growth was in gasoline and winter products. North America oil demand is forecast to decline by 0.9 mb/d in 2009 to average 23.3 mb/d.
OECD - Europe OECD Europe oil demand forecast to decline by 0.6 mb/d in 2009
In anticipation of the expiration of most government financial incentives, Western Europe registered more than 1,100,000 new passenger cars in November 2009; that is 31% more than in the same month a year earlier, according to European Automobile Manufacturer’s Association (ACEA). The main bulk of the increase was registered in the European Big Four consumers: Germany (20%), France (48%), Italy (31%) and the UK (58%). On average, the West-European market remained relatively stable during the first eleven months of the year, showing only a marginal decline 1% over the same period the year before. The trends observed recently, and especially the outcome of the financial turmoil during 2008, continued with the average car size/power ratio, along with SUVs and diesel-powered cars, on the decline. The auto industry will be forced to adapt in 2010 without any financial state support. This recent increase in new car sales did not push for more gasoline usage across OECD Europe.
-40%-30%-20%-10%
0%10%20%30%40%50%60%
Oct 2008 Nov 2008 Dec 2008 Oct 2009 Nov 2009 Dec 2009
Graph 12: Heating Degree Days, % of Normal
USA Japan Europe
WARM
COLD
-40%
-30%
-20%
-10%
0%
10%
20%
-40%
-30%
-20%
-10%
0%
10%
20%
Jan
08
Feb
08
Mar
08
Apr 0
8
May
08
Jun
08
Jul 0
8
Aug
08
Sep
08
Oct
08
Nov
08
Dec
08
Jan
09
Feb
09
Mar
09
Apr 0
9
May
09
Jun
09
Jul 0
9
Aug
09
Sep
09
Oct
09
Nov
09
New Passenger Car Registrations Motor Fuel Consumption
Graph 13: European New Passenger Car Registrations & Motor Fuel Consumption, y-o-y %changes
_____________________________________________________________________________________________________________________________________Monthly Oil Market Report
January 2010 23
The European Big Four (Germany, France, Italy, and the UK) account for the majority of the decline in Europe’s oil consumption in 2009. The contraction in the Big Four oil demand represents 50% of the total decline in the region. The largest loss is associated with Germany, the largest oil consuming country in Europe. Germany’s oil demand is forecast to show a decline of 115 tb/d in 2009. Italian oil demand is forecast to decline by 5% in 2009. Most of the decline is associated with waning economic activity. OECD Europe’s fourth quarter oil demand decline shrunk and is estimated at 60% of the third quarter loss. This improved performance is related to weather and the slight improvement in economic activity. Oil demand for the region in the fourth quarter is forecast to be at minus 0.46 mb/d. OECD Europe oil demand is forecast to decline by 0.6 mb/d in 2009 to average 14.7 mb/d.
OECD - Pacific OECD Pacific oil demand forecast to decline by 0.4 mb/d in 2009
Japan oil demand is continuing its negative trend. November oil demand dipped 5.5% y-o-y and the same is expected for December. Winters are mild in the Pacific in December, which has led to a decline in heating fuel usage of 35 tb/d in December,y-o-y. On the other hand, South Korea is consuming more oil than in the previous year. Recovery in economic activity has led to strong consumption in almost all products. Transportation fuel has been growing since last June. Furthermore, the country’s recovering industrial production resulted in an increase in the use of petroleum products by 9.5% in October and by 5% in both November and December. South Korea’s oil demand recovered very quickly as opposed to other OECD countries. In fact, South Korea is the only major OECD country that has seen higher oil demand in 2009. The country’s oil demand is forecast to grow by 3.2% in 2009. Gasoline alone is forecast to grow by 8.3% in 2009. As a result of better-than-expected oil demand in South Korea, OECD Pacific fourth quarter oil demand was revised up by 0.05 mb/d. OECD Pacific oil demand is forecast to decline by 0.4 mb/d in 2009 to average 7.7 mb/d.
Developing Countries Demand in the Developing Countries to grow at 0.5 mb/d in 2009
Other Asia economy has been on a strong and rapid recovery across the continent, estimated at 2.7% growth. India led the region with 6.2% GDP growth; consequently, the region’s oil demand is forecast to consume 200 tb/d more in 2009 than in the previous year. Taiwan and other major countries within Asia used more oil in the fourth quarter; hence, the region’s fourth quarter oil demand was revised up by 150 tb/d to show growth of 475 tb/d y-o-y. This growth is almost twice as much as in the third quarter.
Nov 09 Nov 08 Change to Nov 08 Change to Nov 08 (%)LPG 104 99 5 5.5Gasoline 224 233 -8 -3.6Jet Fuel 74 71 3 3.6Diesel Oil 625 620 5 0.8Fuel Oil 264 327 -63 -19.2Other Products 172 185 -13 -6.8Total Oil 1,464 1,534 -70 -4.6
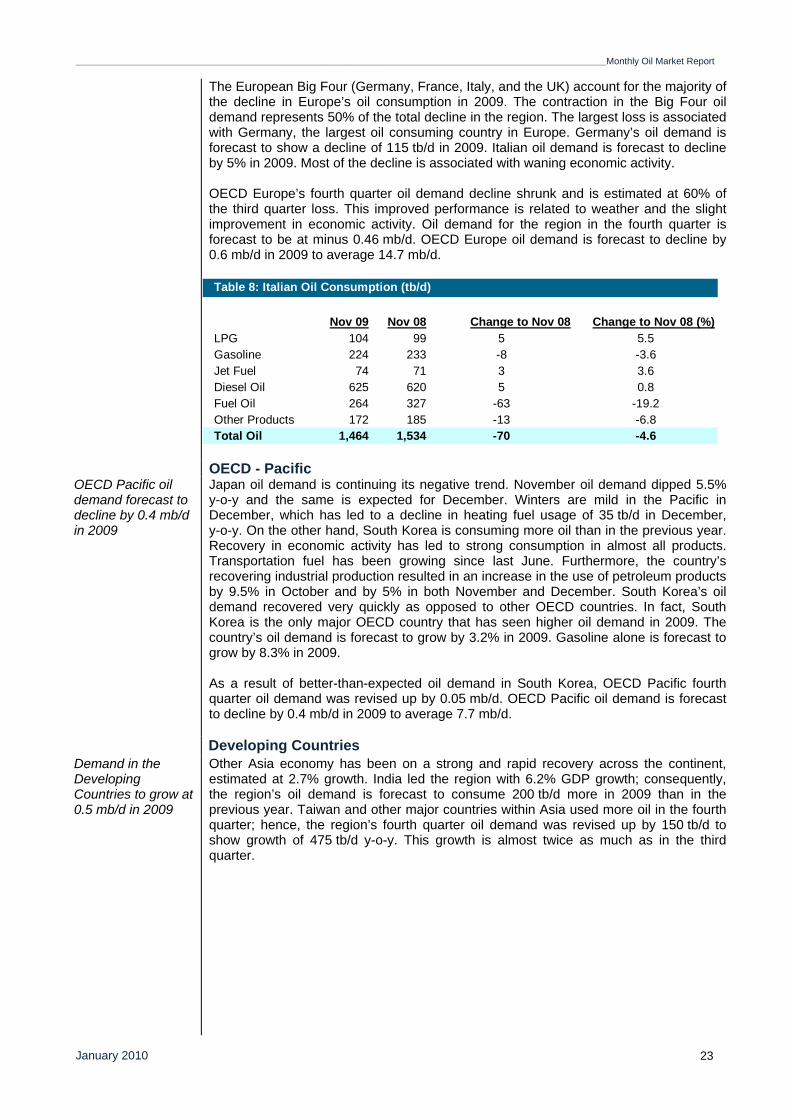
Table 8: Italian Oil Consumption (tb/d)
Monthly Oil Market Report_____________________________________________________________________________________________________________________________________
January 2010 24
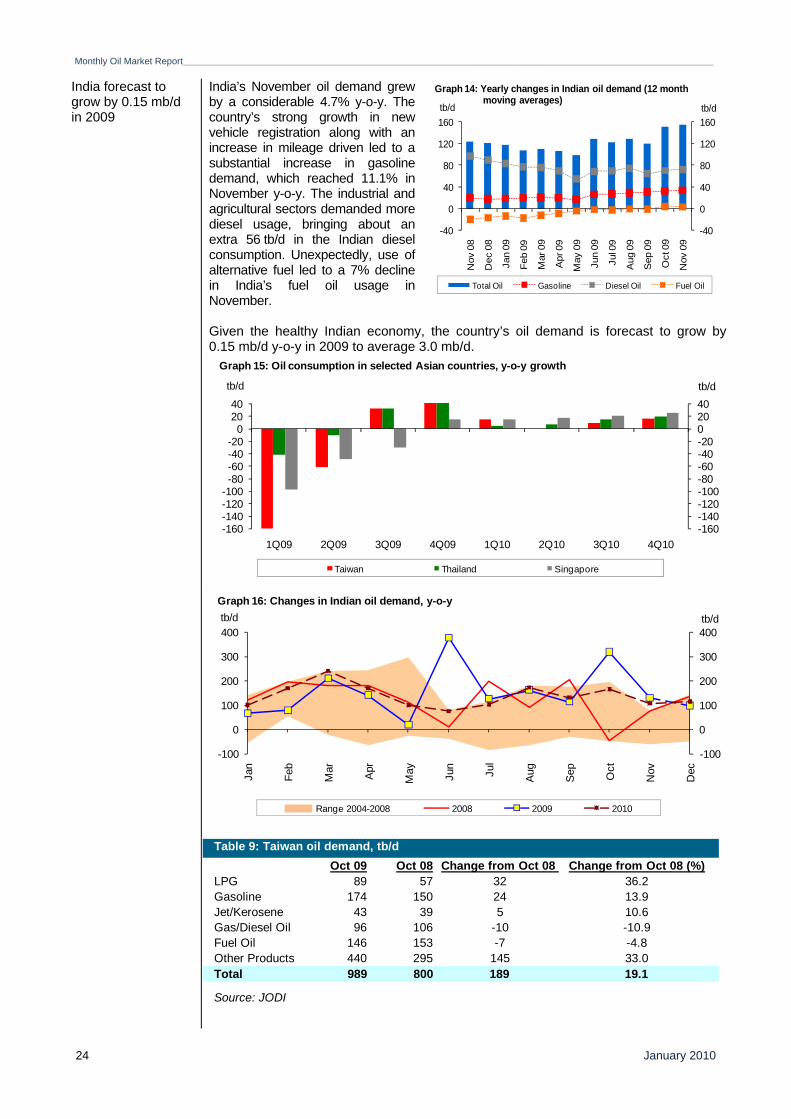
India forecast to grow by 0.15 mb/d in 2009
India’s November oil demand grew by a considerable 4.7% y-o-y. The country’s strong growth in new vehicle registration along with an increase in mileage driven led to a substantial increase in gasoline demand, which reached 11.1% in November y-o-y. The industrial and agricultural sectors demanded more diesel usage, bringing about an extra 56 tb/d in the Indian diesel consumption. Unexpectedly, use of alternative fuel led to a 7% decline in India’s fuel oil usage in November. Given the healthy Indian economy, the country’s oil demand is forecast to grow by 0.15 mb/d y-o-y in 2009 to average 3.0 mb/d.
-160-140-120-100-80-60-40-2002040
-160-140-120-100-80-60-40-20
02040
1Q09 2Q09 3Q09 4Q09 1Q10 2Q10 3Q10 4Q10
tb/dtb/d
Graph 15: Oil consumption in selected Asian countries, y-o-y growth
Taiwan Thailand Singapore
-100
0
100
200
300
400
-100
0
100
200
300
400
Jan
Feb
Mar Apr
May Jun
Jul
Aug
Sep
Oct
Nov
Dec
tb/dtb/d
Range 2004-2008 2008 2009 2010
Graph 16: Changes in Indian oil demand, y-o-y
Oct 09 Oct 08 Change from Oct 08 Change from Oct 08 (%)LPG 89 57 32 36.2Gasoline 174 150 24 13.9Jet/Kerosene 43 39 5 10.6Gas/Diesel Oil 96 106 -10 -10.9Fuel Oil 146 153 -7 -4.8Other Products 440 295 145 33.0Total 989 800 189 19.1
Source: JODI
Table 9: Taiwan oil demand, tb/d
-40
0
40
80
120
160
-40
0
40
80
120
160
Nov
08
Dec
08
Jan
09
Feb
09
Mar
09
Apr
09
May
09
Jun
09
Jul 0
9
Aug
09
Sep
09
Oct
09
Nov
09
tb/dtb/d
Total Oil Gasoline Diesel Oil Fuel Oil
Graph 14: Yearly changes in Indian oil demand (12 monthmoving averages)

_____________________________________________________________________________________________________________________________________Monthly Oil Market Report
January 2010 25
Slowing oil demand in certain countries within the Middle East put pressure on the region’s total oil demand. Hence, Middle East oil demand was revised down by a minor 30 tb/d in 2009.
In spite of the 2% downward decline in the Brazilian economy, the country’s oil demand is forecast to grow slightly in 2009. Brazilian November gasoline and diesel demand grew by 6% and 7% respectively. As a consequence of strong Asian oil demand, oil demand in the Developing Countries is forecast to grow by 0.5 mb/d in 2009 to average 25.8 mb/d.
Other regions Chinese oil demand continued its rally, hitting 7.4% growth excluding oil that is used for
stocking. This is 1% lower than last October’s growth; however, it is the third consecutive month with growth above 7%. This occurred because not only did economic activity show a strong performance but also the base for fourth quarter oil demand was low due to the plunge in oil demand in the fourth quarter of 2008. China’s stimulus plan has kept the transport sector growing even during the peak of the financial crisis. Double-digit new car registrations pushed up transport fuel usage. Chinese highway driving has been growing this year. Total passenger kilometers on the highways grew by 9% in November y-o-y. China’s apparent oil demand, which includes stocking oil, has grown strongly for the past three months resulting from healthy imports.
Dec 09 Dec 08 Change from Dec 08 Change from Dec 08 (%)LPG 29 31 -2 -6.9Gasoline 44 40 4 9.1Jet/Kerosene 8 8 0 0.0Gas/Diesel Oil 87 69 18 20.7Fuel Oil 30 24 6 20.0Other Products 24 12 12 50.0Total 222 184 38 17.1
Source: JODI
Table 10: Ecuadorian oil demand, tb/d
0
50
100
150
200
250
0
50
100
150
200
250
1Q09 2Q09 3Q09 4Q09 1Q10 2Q10 3Q10 4Q10
tb/dtb/d
Saudi Arabia I.R. Iran Kuwait UAE Others
Graph 17: Yearly oil demand growth in the Middle East
-80-60-40-20020406080100
-80-60-40-20
020406080
100
1Q09 2Q09 3Q09 4Q09 1Q10 2Q10 3Q10 4Q10
tb/dtb/d
Brazil Venezuela Argentina Others
Graph 18: Yearly oil demand growth in Latin America
Monthly Oil Market Report_____________________________________________________________________________________________________________________________________
January 2010 26
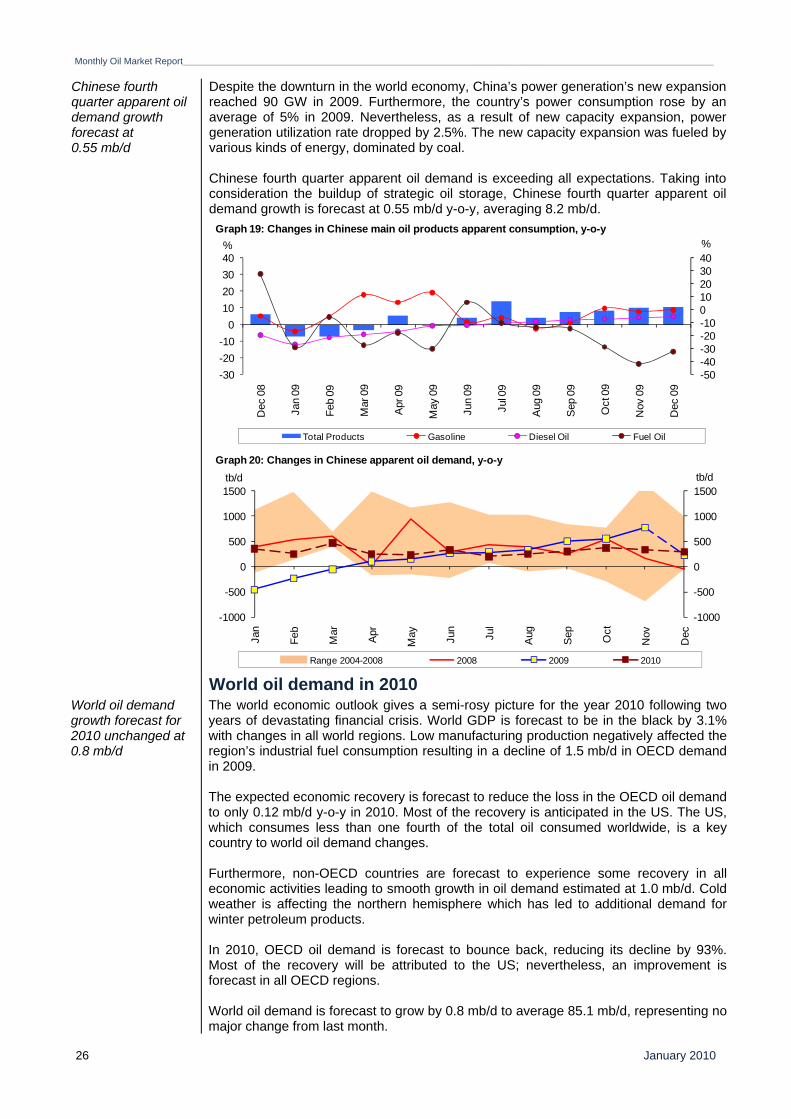
Chinese fourth quarter apparent oil demand growth forecast at 0.55 mb/d
Despite the downturn in the world economy, China’s power generation’s new expansion reached 90 GW in 2009. Furthermore, the country’s power consumption rose by an average of 5% in 2009. Nevertheless, as a result of new capacity expansion, power generation utilization rate dropped by 2.5%. The new capacity expansion was fueled by various kinds of energy, dominated by coal. Chinese fourth quarter apparent oil demand is exceeding all expectations. Taking into consideration the buildup of strategic oil storage, Chinese fourth quarter apparent oil demand growth is forecast at 0.55 mb/d y-o-y, averaging 8.2 mb/d.
World oil demand in 2010 World oil demand growth forecast for 2010 unchanged at 0.8 mb/d
The world economic outlook gives a semi-rosy picture for the year 2010 following two years of devastating financial crisis. World GDP is forecast to be in the black by 3.1% with changes in all world regions. Low manufacturing production negatively affected the region’s industrial fuel consumption resulting in a decline of 1.5 mb/d in OECD demand in 2009. The expected economic recovery is forecast to reduce the loss in the OECD oil demand to only 0.12 mb/d y-o-y in 2010. Most of the recovery is anticipated in the US. The US, which consumes less than one fourth of the total oil consumed worldwide, is a key country to world oil demand changes. Furthermore, non-OECD countries are forecast to experience some recovery in all economic activities leading to smooth growth in oil demand estimated at 1.0 mb/d. Cold weather is affecting the northern hemisphere which has led to additional demand for winter petroleum products. In 2010, OECD oil demand is forecast to bounce back, reducing its decline by 93%. Most of the recovery will be attributed to the US; nevertheless, an improvement is forecast in all OECD regions. World oil demand is forecast to grow by 0.8 mb/d to average 85.1 mb/d, representing no major change from last month.
-50-40-30-20-10010203040
-30-20-10
010203040
Dec
08
Jan
09
Feb
09
Mar
09
Apr
09
May
09
Jun
09
Jul 0
9
Aug
09
Sep
09
Oct
09
Nov
09
Dec
09
%%
Total Products Gasoline Diesel Oil Fuel Oil
Graph 19: Changes in Chinese main oil products apparent consumption, y-o-y
-1000
-500
0
500
1000
1500
-1000
-500
0
500
1000
1500
Jan
Feb
Mar
Apr
May Jun
Jul
Aug
Sep Oct
Nov
Dec
tb/dtb/d
Range 2004-2008 2008 2009 2010
Graph 20: Changes in Chinese apparent oil demand, y-o-y
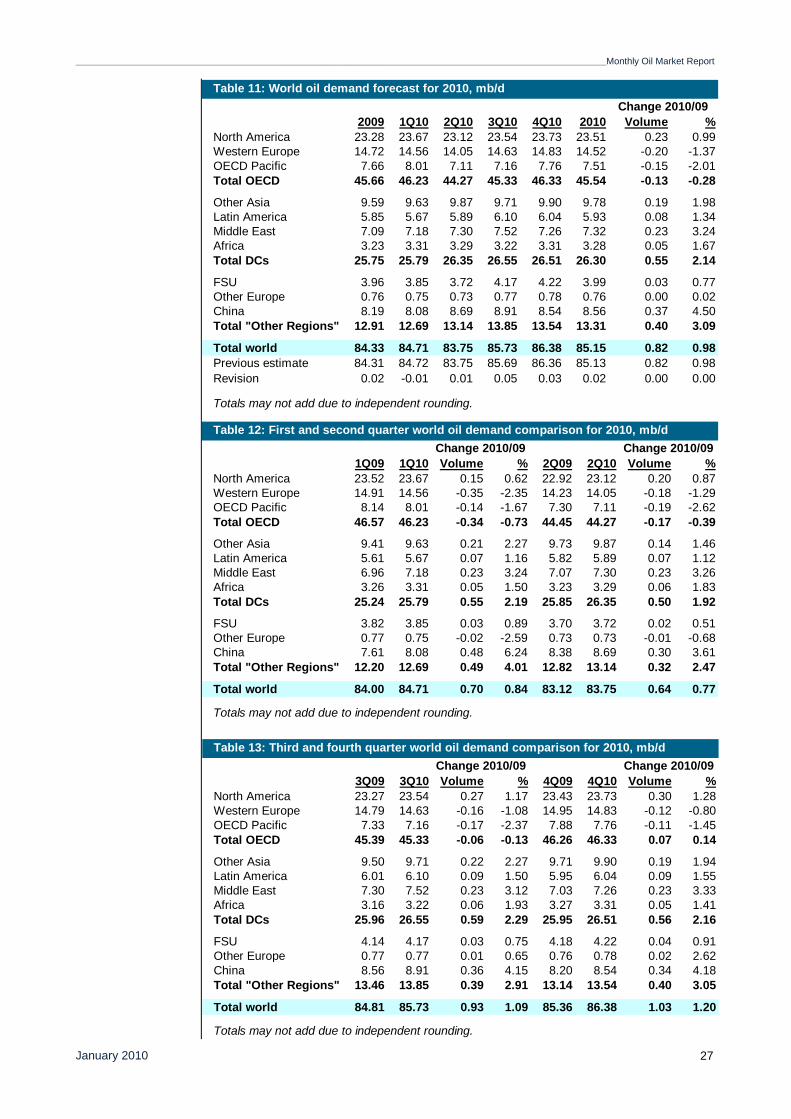
_____________________________________________________________________________________________________________________________________Monthly Oil Market Report
January 2010 27
2009 1Q10 2Q10 3Q10 4Q10 2010 Volume %North America 23.28 23.67 23.12 23.54 23.73 23.51 0.23 0.99Western Europe 14.72 14.56 14.05 14.63 14.83 14.52 -0.20 -1.37OECD Pacific 7.66 8.01 7.11 7.16 7.76 7.51 -0.15 -2.01Total OECD 45.66 46.23 44.27 45.33 46.33 45.54 -0.13 -0.28
Other Asia 9.59 9.63 9.87 9.71 9.90 9.78 0.19 1.98Latin America 5.85 5.67 5.89 6.10 6.04 5.93 0.08 1.34Middle East 7.09 7.18 7.30 7.52 7.26 7.32 0.23 3.24Africa 3.23 3.31 3.29 3.22 3.31 3.28 0.05 1.67Total DCs 25.75 25.79 26.35 26.55 26.51 26.30 0.55 2.14
FSU 3.96 3.85 3.72 4.17 4.22 3.99 0.03 0.77Other Europe 0.76 0.75 0.73 0.77 0.78 0.76 0.00 0.02China 8.19 8.08 8.69 8.91 8.54 8.56 0.37 4.50Total "Other Regions" 12.91 12.69 13.14 13.85 13.54 13.31 0.40 3.09
Total world 84.33 84.71 83.75 85.73 86.38 85.15 0.82 0.98Previous estimate 84.31 84.72 83.75 85.69 86.36 85.13 0.82 0.98Revision 0.02 -0.01 0.01 0.05 0.03 0.02 0.00 0.00
Table 11: World oil demand forecast for 2010, mb/dChange 2010/09
Totals may not add due to independent rounding.
1Q09 1Q10 Volume % 2Q09 2Q10 Volume %North America 23.52 23.67 0.15 0.62 22.92 23.12 0.20 0.87Western Europe 14.91 14.56 -0.35 -2.35 14.23 14.05 -0.18 -1.29OECD Pacific 8.14 8.01 -0.14 -1.67 7.30 7.11 -0.19 -2.62Total OECD 46.57 46.23 -0.34 -0.73 44.45 44.27 -0.17 -0.39
Other Asia 9.41 9.63 0.21 2.27 9.73 9.87 0.14 1.46Latin America 5.61 5.67 0.07 1.16 5.82 5.89 0.07 1.12Middle East 6.96 7.18 0.23 3.24 7.07 7.30 0.23 3.26Africa 3.26 3.31 0.05 1.50 3.23 3.29 0.06 1.83Total DCs 25.24 25.79 0.55 2.19 25.85 26.35 0.50 1.92
FSU 3.82 3.85 0.03 0.89 3.70 3.72 0.02 0.51Other Europe 0.77 0.75 -0.02 -2.59 0.73 0.73 -0.01 -0.68China 7.61 8.08 0.48 6.24 8.38 8.69 0.30 3.61Total "Other Regions" 12.20 12.69 0.49 4.01 12.82 13.14 0.32 2.47
Total world 84.00 84.71 0.70 0.84 83.12 83.75 0.64 0.77
Totals may not add due to independent rounding.
Table 12: First and second quarter world oil demand comparison for 2010, mb/dChange 2010/09 Change 2010/09
3Q09 3Q10 Volume % 4Q09 4Q10 Volume %North America 23.27 23.54 0.27 1.17 23.43 23.73 0.30 1.28Western Europe 14.79 14.63 -0.16 -1.08 14.95 14.83 -0.12 -0.80OECD Pacific 7.33 7.16 -0.17 -2.37 7.88 7.76 -0.11 -1.45Total OECD 45.39 45.33 -0.06 -0.13 46.26 46.33 0.07 0.14
Other Asia 9.50 9.71 0.22 2.27 9.71 9.90 0.19 1.94Latin America 6.01 6.10 0.09 1.50 5.95 6.04 0.09 1.55Middle East 7.30 7.52 0.23 3.12 7.03 7.26 0.23 3.33Africa 3.16 3.22 0.06 1.93 3.27 3.31 0.05 1.41Total DCs 25.96 26.55 0.59 2.29 25.95 26.51 0.56 2.16
FSU 4.14 4.17 0.03 0.75 4.18 4.22 0.04 0.91Other Europe 0.77 0.77 0.01 0.65 0.76 0.78 0.02 2.62China 8.56 8.91 0.36 4.15 8.20 8.54 0.34 4.18Total "Other Regions" 13.46 13.85 0.39 2.91 13.14 13.54 0.40 3.05
Total world 84.81 85.73 0.93 1.09 85.36 86.38 1.03 1.20
Totals may not add due to independent rounding.
Table 13: Third and fourth quarter world oil demand comparison for 2010, mb/dChange 2010/09 Change 2010/09
Monthly Oil Market Report_____________________________________________________________________________________________________________________________________
January 2010 28
OECD OECD oil demand forecast to contract by 0.3% in 2010
Freezing weather in the US put pressure on heating and fuel oil for the month of January. Most of the country experienced colder-than-normal weather which halted movements and affected gasoline demand. This cold weather does not apply to the US alone but to most of the OECD regions as well. Europe and the Pacific also experienced a colder-than-normal winter in January. It is forecast that the demand for winter fuels will be higher; however this is not expected to push up total oil consumption as other products are expected to slide. Although the first quarter showed minor growth in US oil demand, the down risk is high. The country’s economy is still in shock, industrial production is low, new car registration is below normal, despite the stimulus plan — and the same could be said for the rest of the OECD as well. US weekly data showed a massive drop in oil demand in the first week of January and a strong buildup in oil stocks. Although the US is much colder in January, which led to consumption of an extra of 0.1 mb/d of heating oil, usage of petroleum products is not expected to exceed the forecast. Should this trend continue, then total OECD oil demand forecast might fall short of initial estimates. Should US oil demand fall on the negative side in the first quarter, then the expected growth in world oil demand might be cut in half from the current estimate. A decline in Japanese oil consumption is forcing the oil industry to further reduce its refining capacity. Excess capacity is pushing the refining margins down to a limit that is not feasible any more. Japan dismantled some refining capacity last year; however, the country still has more to eliminate. Pacific weather has been colder than expected in January; however, it has led to a minor increase in heating fuel y-o-y. Both OECD Europe and Pacific oil demand are forecast to decline by 1.4% and 2.0% in 2010. The Big Four and Japan are the cause behind this expected decline in oil usage. OECD oil demand is forecast to contract by 0.3% in 2010 to average 45.5 mb/d.
Non-OECD Given healthy growth in India and the Middle East, demand in the Developing Countries is forecast to grow by 2.1% in 2010
Strong economic growth in China, India, the Middle East and Latin America is pushing the world to consume more oil in 2010 in comparison to last year. Chinese new vehicle sales are expected to be strong resulting from the stimulus plans that started last year. China’s oil demand is expected to grow the most this year reaching 5.4%. The Middle East’s long-term, energy-intensive projects along with subsidized transport fuel will keep the region’s oil demand growth within the range of 3.3%. However, the upward risk is high due to expected strength in economic activities in part of the region. Given the healthy growth in India and the Middle East, Developing Countries oil demand is forecast to grow by 2.1% in 2010. This is leading to total non-OECD growth of 1.0 mb/d in 2010.
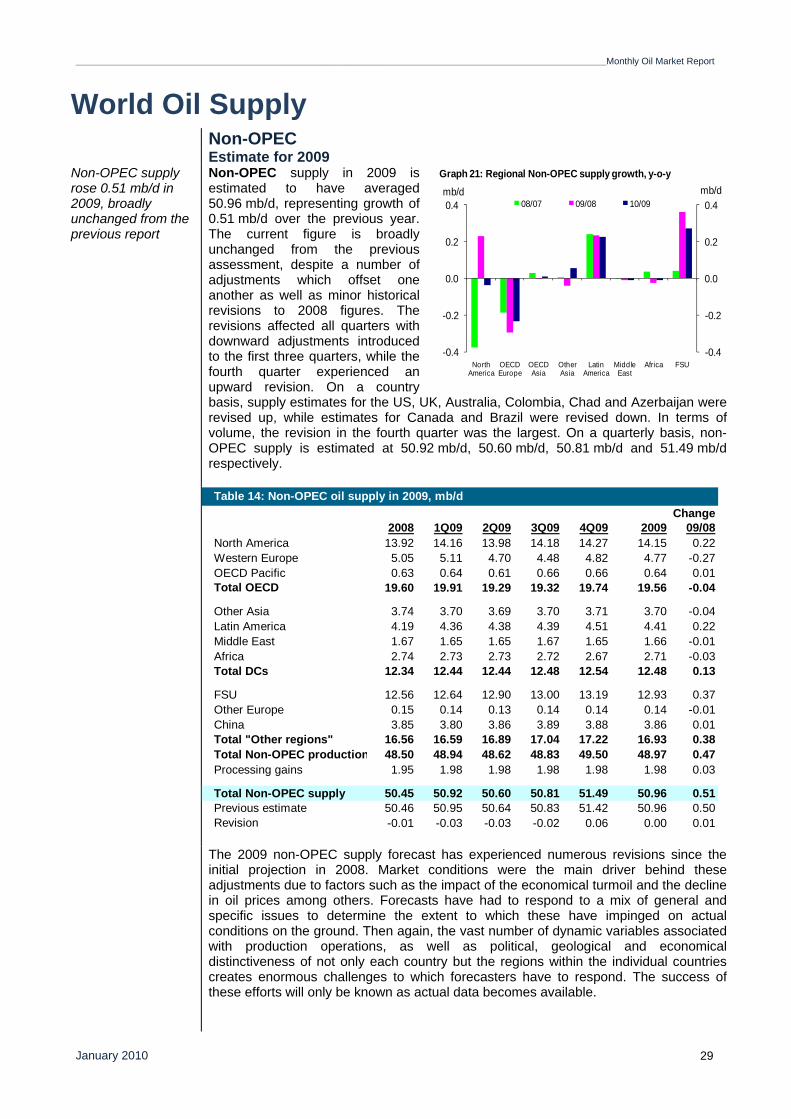
_____________________________________________________________________________________________________________________________________Monthly Oil Market Report
January 2010 29
World Oil Supply Non-OPEC Estimate for 2009Non-OPEC supply rose 0.51 mb/d in 2009, broadly unchanged from the previous report
Non-OPEC supply in 2009 is estimated to have averaged 50.96 mb/d, representing growth of 0.51 mb/d over the previous year. The current figure is broadly unchanged from the previous assessment, despite a number of adjustments which offset one another as well as minor historical revisions to 2008 figures. The revisions affected all quarters with downward adjustments introduced to the first three quarters, while the fourth quarter experienced an upward revision. On a country basis, supply estimates for the US, UK, Australia, Colombia, Chad and Azerbaijan were revised up, while estimates for Canada and Brazil were revised down. In terms of volume, the revision in the fourth quarter was the largest. On a quarterly basis, non-OPEC supply is estimated at 50.92 mb/d, 50.60 mb/d, 50.81 mb/d and 51.49 mb/d respectively.
The 2009 non-OPEC supply forecast has experienced numerous revisions since the initial projection in 2008. Market conditions were the main driver behind these adjustments due to factors such as the impact of the economical turmoil and the decline in oil prices among others. Forecasts have had to respond to a mix of general and specific issues to determine the extent to which these have impinged on actual conditions on the ground. Then again, the vast number of dynamic variables associated with production operations, as well as political, geological and economical distinctiveness of not only each country but the regions within the individual countries creates enormous challenges to which forecasters have to respond. The success of these efforts will only be known as actual data becomes available.
Table 14: Non-OPEC oil supply in 2009, mb/dChange
2008 1Q09 2Q09 3Q09 4Q09 2009 09/08North America 13.92 14.16 13.98 14.18 14.27 14.15 0.22Western Europe 5.05 5.11 4.70 4.48 4.82 4.77 -0.27OECD Pacific 0.63 0.64 0.61 0.66 0.66 0.64 0.01Total OECD 19.60 19.91 19.29 19.32 19.74 19.56 -0.04
Other Asia 3.74 3.70 3.69 3.70 3.71 3.70 -0.04Latin America 4.19 4.36 4.38 4.39 4.51 4.41 0.22Middle East 1.67 1.65 1.65 1.67 1.65 1.66 -0.01Africa 2.74 2.73 2.73 2.72 2.67 2.71 -0.03Total DCs 12.34 12.44 12.44 12.48 12.54 12.48 0.13
FSU 12.56 12.64 12.90 13.00 13.19 12.93 0.37Other Europe 0.15 0.14 0.13 0.14 0.14 0.14 -0.01China 3.85 3.80 3.86 3.89 3.88 3.86 0.01Total "Other regions" 16.56 16.59 16.89 17.04 17.22 16.93 0.38Total Non-OPEC production 48.50 48.94 48.62 48.83 49.50 48.97 0.47Processing gains 1.95 1.98 1.98 1.98 1.98 1.98 0.03
Total Non-OPEC supply 50.45 50.92 50.60 50.81 51.49 50.96 0.51Previous estimate 50.46 50.95 50.64 50.83 51.42 50.96 0.50Revision -0.01 -0.03 -0.03 -0.02 0.06 0.00 0.01
-0.4
-0.2
0.0
0.2
0.4
-0.4
-0.2
0.0
0.2
0.4
North America
OECD Europe
OECD Asia
Other Asia
Latin America
Middle East
Africa FSU
mb/dmb/d08/07 09/08 10/09
Graph 21: Regional Non-OPEC supply growth, y-o-y
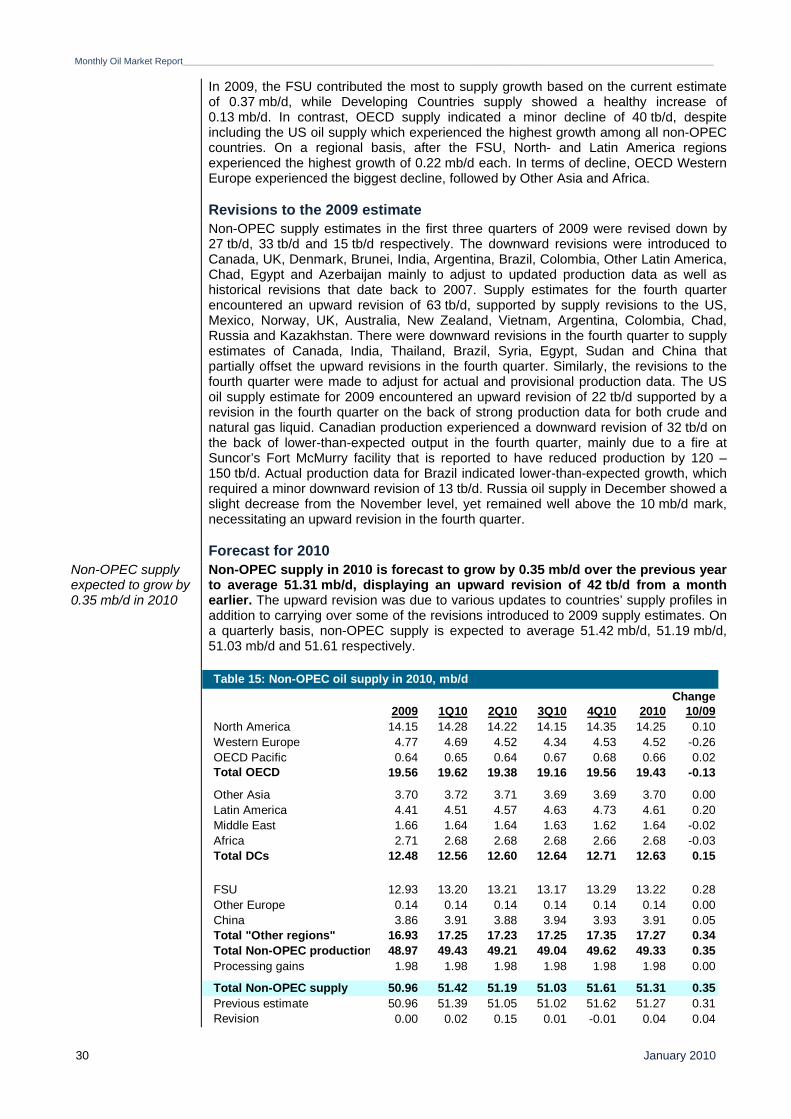
Monthly Oil Market Report_____________________________________________________________________________________________________________________________________
January 2010 30
In 2009, the FSU contributed the most to supply growth based on the current estimate of 0.37 mb/d, while Developing Countries supply showed a healthy increase of 0.13 mb/d. In contrast, OECD supply indicated a minor decline of 40 tb/d, despite including the US oil supply which experienced the highest growth among all non-OPEC countries. On a regional basis, after the FSU, North- and Latin America regions experienced the highest growth of 0.22 mb/d each. In terms of decline, OECD Western Europe experienced the biggest decline, followed by Other Asia and Africa.
Revisions to the 2009 estimate Non-OPEC supply estimates in the first three quarters of 2009 were revised down by
27 tb/d, 33 tb/d and 15 tb/d respectively. The downward revisions were introduced to Canada, UK, Denmark, Brunei, India, Argentina, Brazil, Colombia, Other Latin America, Chad, Egypt and Azerbaijan mainly to adjust to updated production data as well as historical revisions that date back to 2007. Supply estimates for the fourth quarter encountered an upward revision of 63 tb/d, supported by supply revisions to the US, Mexico, Norway, UK, Australia, New Zealand, Vietnam, Argentina, Colombia, Chad, Russia and Kazakhstan. There were downward revisions in the fourth quarter to supply estimates of Canada, India, Thailand, Brazil, Syria, Egypt, Sudan and China that partially offset the upward revisions in the fourth quarter. Similarly, the revisions to the fourth quarter were made to adjust for actual and provisional production data. The US oil supply estimate for 2009 encountered an upward revision of 22 tb/d supported by a revision in the fourth quarter on the back of strong production data for both crude and natural gas liquid. Canadian production experienced a downward revision of 32 tb/d on the back of lower-than-expected output in the fourth quarter, mainly due to a fire at Suncor’s Fort McMurry facility that is reported to have reduced production by 120 – 150 tb/d. Actual production data for Brazil indicated lower-than-expected growth, which required a minor downward revision of 13 tb/d. Russia oil supply in December showed a slight decrease from the November level, yet remained well above the 10 mb/d mark, necessitating an upward revision in the fourth quarter.
Forecast for 2010Non-OPEC supply expected to grow by 0.35 mb/d in 2010
Non-OPEC supply in 2010 is forecast to grow by 0.35 mb/d over the previous year to average 51.31 mb/d, displaying an upward revision of 42 tb/d from a month earlier. The upward revision was due to various updates to countries’ supply profiles in addition to carrying over some of the revisions introduced to 2009 supply estimates. On a quarterly basis, non-OPEC supply is expected to average 51.42 mb/d, 51.19 mb/d, 51.03 mb/d and 51.61 respectively.
Table 15: Non-OPEC oil supply in 2010, mb/dChange
2009 1Q10 2Q10 3Q10 4Q10 2010 10/09North America 14.15 14.28 14.22 14.15 14.35 14.25 0.10Western Europe 4.77 4.69 4.52 4.34 4.53 4.52 -0.26OECD Pacific 0.64 0.65 0.64 0.67 0.68 0.66 0.02Total OECD 19.56 19.62 19.38 19.16 19.56 19.43 -0.13
Other Asia 3.70 3.72 3.71 3.69 3.69 3.70 0.00Latin America 4.41 4.51 4.57 4.63 4.73 4.61 0.20Middle East 1.66 1.64 1.64 1.63 1.62 1.64 -0.02Africa 2.71 2.68 2.68 2.68 2.66 2.68 -0.03Total DCs 12.48 12.56 12.60 12.64 12.71 12.63 0.15
FSU 12.93 13.20 13.21 13.17 13.29 13.22 0.28Other Europe 0.14 0.14 0.14 0.14 0.14 0.14 0.00China 3.86 3.91 3.88 3.94 3.93 3.91 0.05Total "Other regions" 16.93 17.25 17.23 17.25 17.35 17.27 0.34Total Non-OPEC production 48.97 49.43 49.21 49.04 49.62 49.33 0.35Processing gains 1.98 1.98 1.98 1.98 1.98 1.98 0.00
Total Non-OPEC supply 50.96 51.42 51.19 51.03 51.61 51.31 0.35Previous estimate 50.96 51.39 51.05 51.02 51.62 51.27 0.31Revision 0.00 0.02 0.15 0.01 -0.01 0.04 0.04
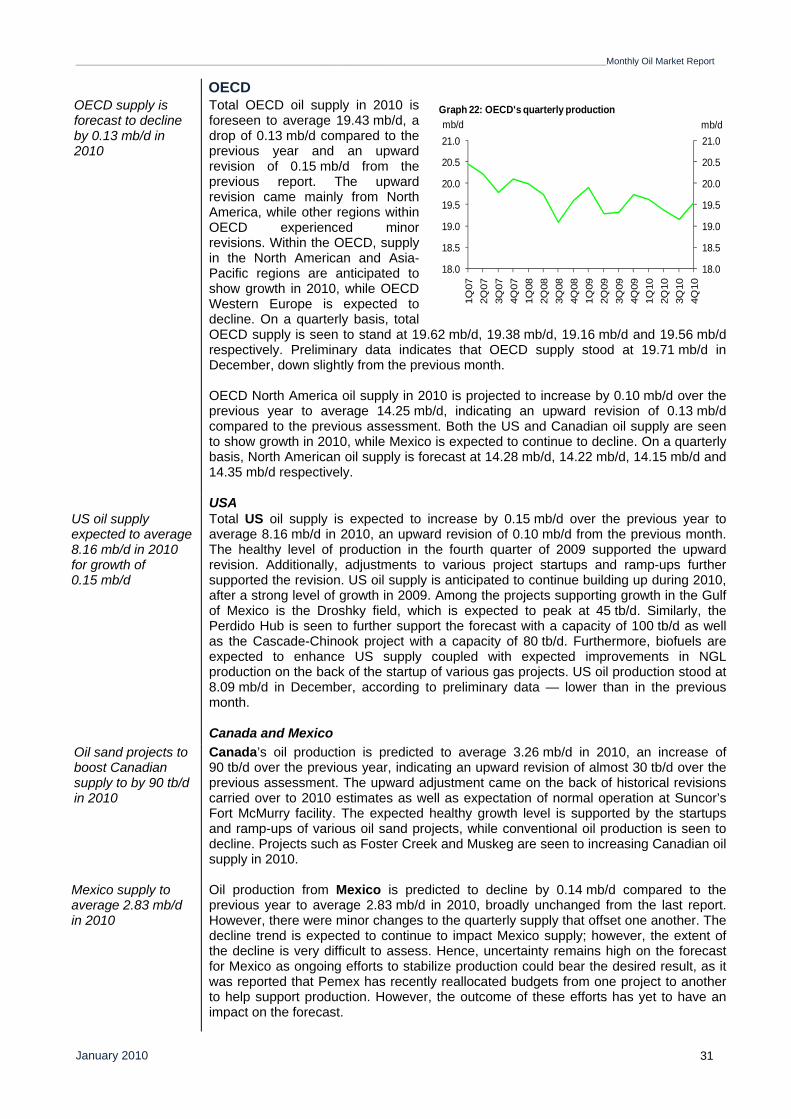
_____________________________________________________________________________________________________________________________________Monthly Oil Market Report
January 2010 31
OECD OECD supply is forecast to decline by 0.13 mb/d in 2010
Total OECD oil supply in 2010 is foreseen to average 19.43 mb/d, a drop of 0.13 mb/d compared to the previous year and an upward revision of 0.15 mb/d from the previous report. The upward revision came mainly from North America, while other regions within OECD experienced minor revisions. Within the OECD, supply in the North American and Asia-Pacific regions are anticipated to show growth in 2010, while OECD Western Europe is expected to decline. On a quarterly basis, total OECD supply is seen to stand at 19.62 mb/d, 19.38 mb/d, 19.16 mb/d and 19.56 mb/d respectively. Preliminary data indicates that OECD supply stood at 19.71 mb/d in December, down slightly from the previous month. OECD North America oil supply in 2010 is projected to increase by 0.10 mb/d over the previous year to average 14.25 mb/d, indicating an upward revision of 0.13 mb/d compared to the previous assessment. Both the US and Canadian oil supply are seen to show growth in 2010, while Mexico is expected to continue to decline. On a quarterly basis, North American oil supply is forecast at 14.28 mb/d, 14.22 mb/d, 14.15 mb/d and 14.35 mb/d respectively.
USA US oil supply expected to average 8.16 mb/d in 2010 for growth of 0.15 mb/d
Total US oil supply is expected to increase by 0.15 mb/d over the previous year to average 8.16 mb/d in 2010, an upward revision of 0.10 mb/d from the previous month. The healthy level of production in the fourth quarter of 2009 supported the upward revision. Additionally, adjustments to various project startups and ramp-ups further supported the revision. US oil supply is anticipated to continue building up during 2010, after a strong level of growth in 2009. Among the projects supporting growth in the Gulf of Mexico is the Droshky field, which is expected to peak at 45 tb/d. Similarly, the Perdido Hub is seen to further support the forecast with a capacity of 100 tb/d as well as the Cascade-Chinook project with a capacity of 80 tb/d. Furthermore, biofuels are expected to enhance US supply coupled with expected improvements in NGL production on the back of the startup of various gas projects. US oil production stood at 8.09 mb/d in December, according to preliminary data — lower than in the previous month.
Canada and Mexico Oil sand projects to boost Canadian supply to by 90 tb/d in 2010
Canada’s oil production is predicted to average 3.26 mb/d in 2010, an increase of 90 tb/d over the previous year, indicating an upward revision of almost 30 tb/d over the previous assessment. The upward adjustment came on the back of historical revisions carried over to 2010 estimates as well as expectation of normal operation at Suncor’s Fort McMurry facility. The expected healthy growth level is supported by the startups and ramp-ups of various oil sand projects, while conventional oil production is seen to decline. Projects such as Foster Creek and Muskeg are seen to increasing Canadian oil supply in 2010.
Mexico supply to average 2.83 mb/d in 2010
Oil production from Mexico is predicted to decline by 0.14 mb/d compared to the previous year to average 2.83 mb/d in 2010, broadly unchanged from the last report. However, there were minor changes to the quarterly supply that offset one another. The decline trend is expected to continue to impact Mexico supply; however, the extent of the decline is very difficult to assess. Hence, uncertainty remains high on the forecast for Mexico as ongoing efforts to stabilize production could bear the desired result, as it was reported that Pemex has recently reallocated budgets from one project to another to help support production. However, the outcome of these efforts has yet to have an impact on the forecast.
18.0
18.5
19.0
19.5
20.0
20.5
21.0
18.0
18.5
19.0
19.5
20.0
20.5
21.0
1Q07
2Q07
3Q07
4Q07
1Q08
2Q08
3Q08
4Q08
1Q09
2Q09
3Q09
4Q09
1Q10
2Q10
3Q10
4Q10
mb/dmb/dGraph 22: OECD's quarterly production

Monthly Oil Market Report_____________________________________________________________________________________________________________________________________
January 2010 32
Western Europe OECD Western Europe supply is foreseen to drop by 0.26 mb/d over the previous year
to average 4.52 mb/d in 2010, unchanged from last month. Despite the steady state, there were minor offsetting upward and downward revisions to individual countries. OECD Western Europe supply is expected to have quarterly supply of 4.69 mb/d, 4.52 mb/d, 4.34 mb/d and 4.53 mb/d respectively.
Norway to average 2.22 mb/d in 2010
Oil production from Norway is seen to decline by 0.12 mb/d compared to the previous year to average 2.22 mb/d in 2010, flat from last month’s evaluation. The decline in production in mature areas remains the main factor affecting the supply forecast as the new volumes coming from project startups and ramp-ups are not believed to be sufficient to offset the lost volume from mature fields. According to preliminary data, Norway production stood at 2.36 mb/d in December, lower than the previous month.
UK to decline by 0.13 mb/d in 2010
UK oil supply is seen to average 1.36 mb/d in 2010, representing a decline of 0.13 mb/d over the previous year and unchanged from last month’s estimate. However, the quarterly estimates have changed, mainly to update for recent production estimates in the fourth quarter of 2009. Furthermore, the announced shutdown of the Buzzard field in the second quarter of 2010 for several days partially affected the quarterly distribution. Yet, the changes did not influence the annual supply figure of the UK. Oil supply from Denmark is seen to remain relatively steady in 2010 with a minor decline of 10 tb/d over the previous year to average 0.26 mb/d in 2010. The supply figure indicates a minor upward revision of 10 tb/d compared to the previous month, mainly to cater for the restart of output at several North Sea fields in the Siri area that were shutdown unexpectedly in August.
Asia Pacific OECD Asia Pacific oil supply is estimated to increase by 20 tb/d over the previous year
to average 0.66 mb/d in 2010, an upward revision of 20 tb/d compared to last month. The revision affected Australia supply forecast, while New Zealand supply forecast remained relatively flat from a month earlier. On a quarterly basis, total oil supply is estimated to average 0.65 mb/d, 0.64 mb/d, 0.67 mb/d and 0.68 mb/d respectively.
Australia’s Van Gogh field is closer to operation
Australia oil production is forecast to remain relatively flat in 2010 compared to the previous year to average 0.55 mb/d, following an upward revision of 20 tb/d to the most recent assessment. The upward revision came on the back of reports that the FPSO vessel to be utilized at the 63-tb/d Van Gogh field has already sailed from the shipyard to the field after a long delay. Additionally, the Woollybutt field is expected to resume operation in the first quarter of 2010 after being shut down for several months. New Zealand oil supply is believed to average 0.11 mb/d in 2010, an increase of 20 tb/d over the previous year, unchanged from the previous month. The expected growth is supported by the Maari project that is moving toward full capacity of 35 tb/d.
Developing Countries Vietnam to decline by 20 tb/d in 2010 due to natural decline
Developing Countries (DCs) oil supply is predicted to grow by 0.15 mb/d over the previous year to average 12.63 mb/d in 2010, representing a downward revision of 0.14 mb/d from the previous month. A handful of historical revisions affecting DC supply as far back as 2007 were carried over into the 2010 forecast along with other changes. The downward revisions were introduced to all DC regions with Other Asia showing the largest revision. On a quarterly basis, total oil supply in DCs is seen to average 12.56 mb/d, 12.60 mb/d, 12.64 mb/d and 12.71 mb/d respectively.
11.75
12.00
12.25
12.50
12.75
13.00
13.25
11.75
12.00
12.25
12.50
12.75
13.00
13.25
1Q07
2Q07
3Q07
4Q07
1Q08
2Q08
3Q08
4Q08
1Q09
2Q09
3Q09
4Q09
1Q10
2Q10
3Q10
4Q10
mb/dmb/dGraph 23: Developing Countries' quarterly production

_____________________________________________________________________________________________________________________________________Monthly Oil Market Report
January 2010 33
Oil production from Other Asia in 2010 is expected to remain relatively flat over the previous year to average 3.7 mb/d, a downward revision of 60 tb/d from the last assessment. The downward revisions were made to the supply forecasts of Indonesia, Thailand and Vietnam. There was no upward revision to offset any of these negative adjustments. Indonesia supply forecast came on the back of adjustment to actual production figures in the fourth quarter that came below expectation and hence were partially carried over to 2010. Oil production from Indonesia is forecast to average 1.02 mb/d in 2010 for a minor decline of 10 tb/d compared to the previous year, as expected new volumes are not seen to offset the anticipated decline in mature fields. Similarly, the forecast for Thailand encountered a downward revision of 20 tb/d to average 0.35 mb/d in 2010, representing a decline of 10 tb/d from 2009. Vietnam oil supply is expected to average 0.32 mb/d in 2010, a decline of 20 tb/d from the previous year and a downward revision of 30 tb/d. The downward revision came on the back of reports that Vietnam’s largest operator is expecting production to decline in 2010 due to natural decline while new fields will bring in only a small volume that would not offset the decline in mature areas. On a quarterly basis, Other Asia supply is anticipated to average 3.72 mb/d, 3.71 mb/d, 3.69 mb/d and 3.69 mb/d respectively.
Brazil and Colombia to drive Latin America supply growth of 0.27 mb/d in 2010
Total oil production in Latin America is projected to average 4.61 mb/d in 2010, an increase of 0.20 mb/d over the previous year, following a downward revision of 40 tb/d. The downward revisions were affected by Brazil as well as Trinidad and Tobago. Brazil oil production is expected to average 2.72 mb/d in 2010, for growth of 0.19 mb/d, which remains the largest anticipated growth among all non-OPEC countries in 2010. The growth is supported by the continuing ramp-up of the Roncador, Albacora and Marlim fields, as well as the expected startup of full production from the first subsalt pilot at the giant Tupi field. The forecast of Brazil oil supply experienced a downward revision of 30 tb/d, which came mainly as a historical revision that was carried over to 2010 as well as reduced biofuels production forecast. Colombia oil production is expected to increase by 80 tb/d over the previous year to average 0.76 mb/d supported by the Rubiales developments. The recent report of an increase in spending by the state-controlled company further supports the expected growth. Trinidad and Tobago forecast experienced a minor downward revision of less than 10 tb/d, mainly to adjust for recent production data. On a quarterly basis, Latin American supply is expected to stand at 4.51 mb/d, 4.57 mb/d, 4.63 mb/d and 4.73 mb/d respectively.
Middle East supply to decline slightly in 2010
Oil supply from the Middle East is forecast to decline slightly by 20 tb/d from the previous year to average 1.64 mb/d in 2010, indicating a downward revision of around 10 tb/d from the previous report. The revision was introduced to Syria oil supply, while other countries in the region remain unchanged. The revision came on the back of recently updated production data in the fourth quarter of 2009 that was carried over to the 2010 forecast. Oman remains the only country in the region where supply is expected to grow in 2010 supported by the Mukhaizana developments. On a quarterly basis Middle East supply is seen to average 1.64 mb/d, 1.64 mb/d, 1.63 mb/d and 1.62 mb/d respectively.
Hasdrubal field starts up in Tunisia
Africa is expected to average 2.68 mb/d in 2010, representing a drop of 30 tb/d over the previous year, and a downward revision of 30 tb/d from last month’s assessment. The downward revision affected Congo, Gabon and Sudan. The revisions came mainly to adjust to actual production figures in 2009 which were carried over to 2010. Among Other Africa, Tunisian supply is expected to increase slightly as the Hasdrubal gas field started up operation and is expected to add around 16 tb/d of condensate. The quarterly distribution average now stands at 2.68 mb/d, 2.68 mb/d, 2.68 mb/d and 2.66 mb/d respectively.
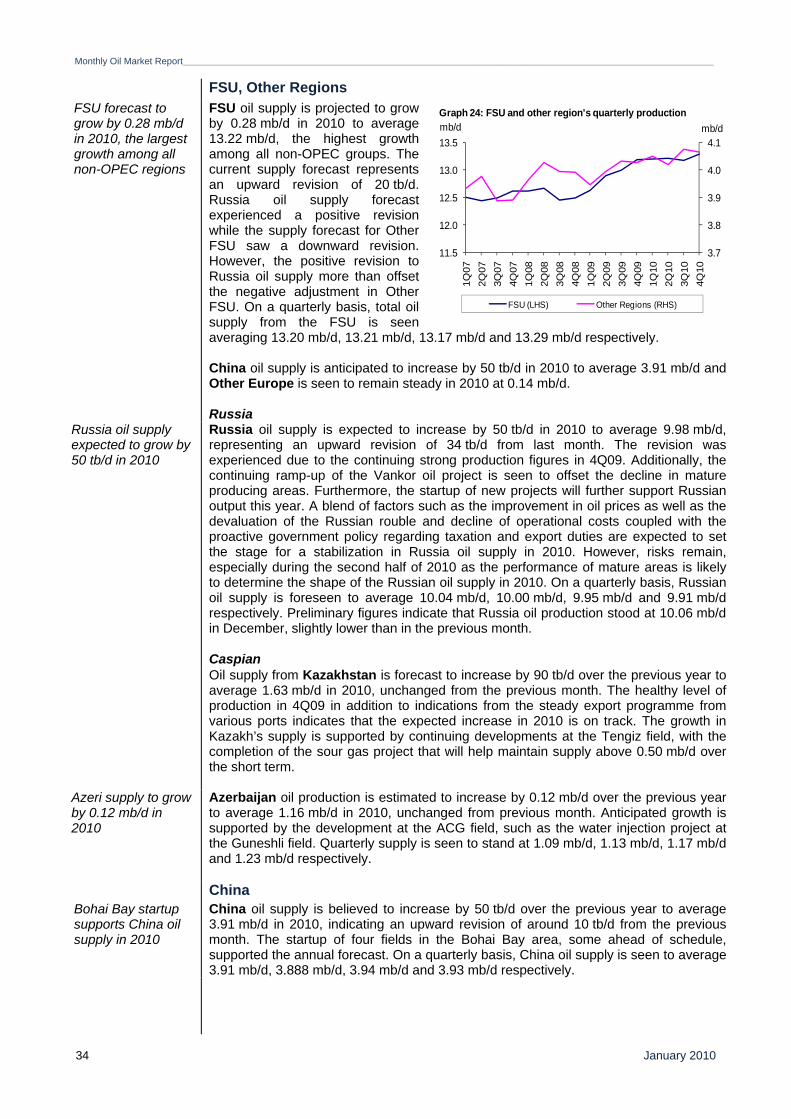
Monthly Oil Market Report_____________________________________________________________________________________________________________________________________
January 2010 34
FSU, Other Regions FSU forecast to grow by 0.28 mb/d in 2010, the largest growth among all non-OPEC regions
FSU oil supply is projected to grow by 0.28 mb/d in 2010 to average 13.22 mb/d, the highest growth among all non-OPEC groups. The current supply forecast represents an upward revision of 20 tb/d. Russia oil supply forecast experienced a positive revision while the supply forecast for Other FSU saw a downward revision. However, the positive revision to Russia oil supply more than offset the negative adjustment in Other FSU. On a quarterly basis, total oil supply from the FSU is seen averaging 13.20 mb/d, 13.21 mb/d, 13.17 mb/d and 13.29 mb/d respectively. China oil supply is anticipated to increase by 50 tb/d in 2010 to average 3.91 mb/d and Other Europe is seen to remain steady in 2010 at 0.14 mb/d.
Russia Russia oil supply expected to grow by 50 tb/d in 2010
Russia oil supply is expected to increase by 50 tb/d in 2010 to average 9.98 mb/d, representing an upward revision of 34 tb/d from last month. The revision was experienced due to the continuing strong production figures in 4Q09. Additionally, the continuing ramp-up of the Vankor oil project is seen to offset the decline in mature producing areas. Furthermore, the startup of new projects will further support Russian output this year. A blend of factors such as the improvement in oil prices as well as the devaluation of the Russian rouble and decline of operational costs coupled with the proactive government policy regarding taxation and export duties are expected to set the stage for a stabilization in Russia oil supply in 2010. However, risks remain, especially during the second half of 2010 as the performance of mature areas is likely to determine the shape of the Russian oil supply in 2010. On a quarterly basis, Russian oil supply is foreseen to average 10.04 mb/d, 10.00 mb/d, 9.95 mb/d and 9.91 mb/d respectively. Preliminary figures indicate that Russia oil production stood at 10.06 mb/d in December, slightly lower than in the previous month.
Caspian Oil supply from Kazakhstan is forecast to increase by 90 tb/d over the previous year to
average 1.63 mb/d in 2010, unchanged from the previous month. The healthy level of production in 4Q09 in addition to indications from the steady export programme from various ports indicates that the expected increase in 2010 is on track. The growth in Kazakh’s supply is supported by continuing developments at the Tengiz field, with the completion of the sour gas project that will help maintain supply above 0.50 mb/d over the short term.
Azeri supply to grow by 0.12 mb/d in 2010
Azerbaijan oil production is estimated to increase by 0.12 mb/d over the previous year to average 1.16 mb/d in 2010, unchanged from previous month. Anticipated growth is supported by the development at the ACG field, such as the water injection project at the Guneshli field. Quarterly supply is seen to stand at 1.09 mb/d, 1.13 mb/d, 1.17 mb/d and 1.23 mb/d respectively.
China Bohai Bay startup supports China oil supply in 2010
China oil supply is believed to increase by 50 tb/d over the previous year to average 3.91 mb/d in 2010, indicating an upward revision of around 10 tb/d from the previous month. The startup of four fields in the Bohai Bay area, some ahead of schedule, supported the annual forecast. On a quarterly basis, China oil supply is seen to average 3.91 mb/d, 3.888 mb/d, 3.94 mb/d and 3.93 mb/d respectively.
3.7
3.8
3.9
4.0
4.1
11.5
12.0
12.5
13.0
13.5
1Q07
2Q07
3Q07
4Q07
1Q08
2Q08
3Q08
4Q08
1Q09
2Q09
3Q09
4Q09
1Q10
2Q10
3Q10
4Q10
mb/dmb/d
FSU (LHS) Other Regions (RHS)
Graph 24: FSU and other region's quarterly production

_____________________________________________________________________________________________________________________________________Monthly Oil Market Report
January 2010 35
OPEC natural gas liquids and non-conventional oils OPEC NGLs and non-conventional oils are estimated to average 4.72 mb/d in 2009,
representing growth of 0.39 mb/d over the previous year. In 2010, OPEC NGLs are projected to average 5.25 mb/d, an increase of 0.53 mb/d over the previous year.
OPEC crude oil production OPEC crude output averaged 29.1 mb/d in December, representing an increase of 78 tb/d
According to secondary sources, OPEC total crude oil production averaged 29.14 mb/d in December, an increase of 78 tb/d over the previous month. Supply from most OPEC Member Countries remained relatively steady with Nigeria and the UAE showing individual increases of more than 40 tb/d, while Venezuela and Angola crude production displayed declines of more than 20 tb/d. OPEC production, not including Iraq, stood at 26.68 mb/d, an increase of 68 tb/d from the November level.
World Oil Supply Global supply estimated at 85.57 mb/d in December
Preliminary figures indicate that world oil supply remained steady in December from the previous month to averaged 85.57 mb/d. Non-OPEC supply experienced a minor decline of 90 tb/d while OPEC crude increased slightly. The share of OPEC crude oil in global production remained relatively steady at 34% in December, with a minor increase from the previous month. The estimate is based on preliminary data for non-OPEC supply, estimates for OPEC NGLs and OPEC crude production from secondary sources.
Change Change Change2007 2008 08/07 1Q09 2Q09 3Q09 4Q09 2009 09/08 2010 10/09
Total OPEC 4.03 4.32 0.29 4.49 4.58 4.84 4.95 4.72 0.39 5.25 0.53
Table 16: OPEC NGLs + non-conventional oils, 2007-2010
Table 17: OPEC crude oil production based on secondary sources , 1,000 b/d2008 2009 2Q09 3Q09 4Q09 Oct 09 Nov 09 Dec 09 Dec/Nov
Algeria 1,382 1,274 1,266 1,273 1,289 1,283 1,289 1,296 6.8Angola 1,871 1,787 1,743 1,828 1,874 1,888 1,877 1,856 -21.7Ecuador 503 476 479 472 470 472 471 469 -1.1Iran, I.R. 3,892 3,728 3,730 3,749 3,740 3,726 3,746 3,748 2.2Iraq 2,341 2,424 2,406 2,507 2,454 2,455 2,448 2,459 10.7Kuwait 2,554 2,266 2,247 2,254 2,285 2,274 2,288 2,295 7.1Libya, S.P.A.J. 1,718 1,559 1,554 1,557 1,550 1,552 1,548 1,550 1.7Nigeria 1,947 1,809 1,748 1,739 1,930 1,866 1,941 1,984 42.8Qatar 840 777 769 780 796 790 795 804 9.0Saudi Arabia 9,113 8,057 8,009 8,123 8,131 8,126 8,133 8,135 1.3UAE 2,557 2,255 2,244 2,253 2,253 2,259 2,228 2,272 43.7Venezuela 2,487 2,312 2,300 2,323 2,295 2,315 2,297 2,273 -24.0
Total OPEC 31,206 28,722 28,495 28,859 29,069 29,005 29,062 29,140 78.3
OPEC excl. Iraq 28,865 26,299 26,088 26,352 26,615 26,549 26,613 26,681 67.7
Totals may not add due to independent rounding.
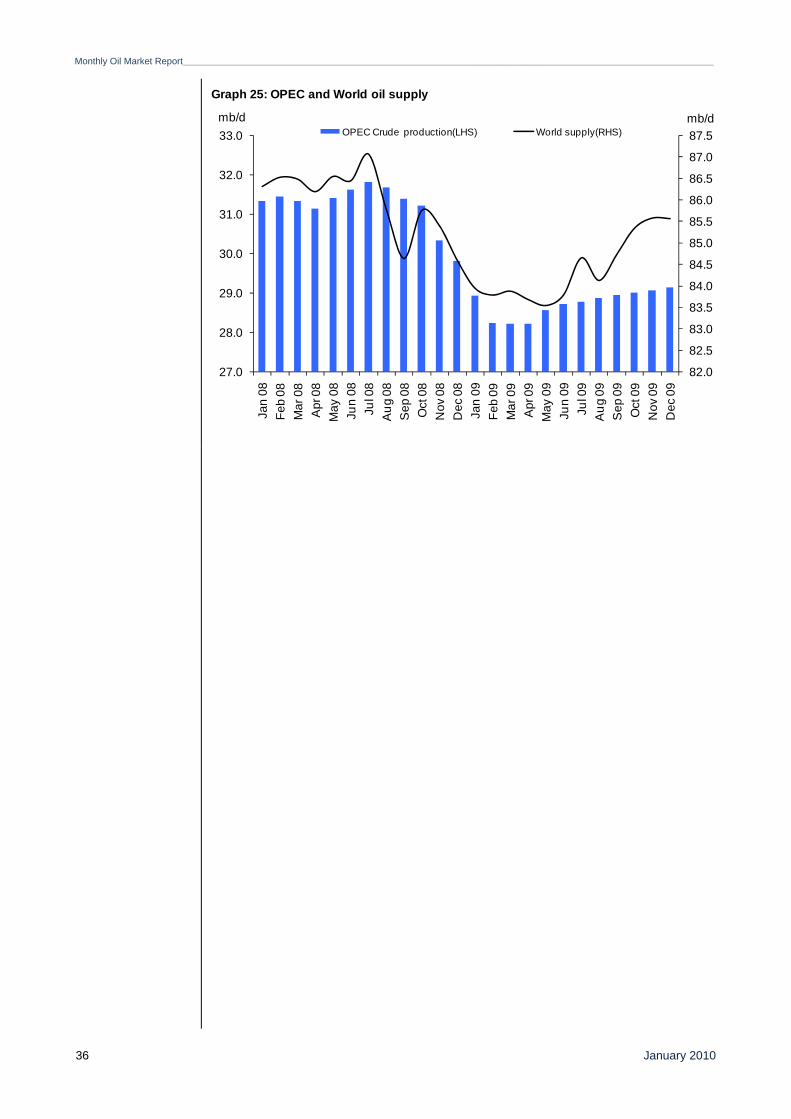
Monthly Oil Market Report_____________________________________________________________________________________________________________________________________
January 2010 36
82.0
82.5
83.0
83.5
84.0
84.5
85.0
85.5
86.0
86.5
87.0
87.5
27.0
28.0
29.0
30.0
31.0
32.0
33.0
Jan
08Fe
b 08
Mar
08
Apr
08
May
08
Jun
08Ju
l 08
Aug
08
Sep
08
Oct
08
Nov
08
Dec
08
Jan
09Fe
b 09
Mar
09
Apr
09
May
09
Jun
09Ju
l 09
Aug
09
Sep
09
Oct
09
Nov
09
Dec
09
mb/dmb/dOPEC Crude production(LHS) World supply(RHS)
Graph 25: OPEC and World oil supply

_____________________________________________________________________________________________________________________________________Monthly Oil Market Report
January 2010 37
Product Markets and Refinery Operations Refining margins improved in the Atlantic Basin in December
A cold snap along with increasing seasonal demand and stock draws have underpinned product market sentiment and lifted the crack spread and refining margins, especially in the US and Europe. Given the forecast for persistent cold weather, it appears that the overhang of barrels of middle distillates will mitigate and provide some relief for refiners in the coming months. However, the sustainability of recent positive developments in the product markets, and their impact on crude fundamentals and prices, would largely depend on economic growth in the future. Furthermore, considering huge distillate volumes being stored off-shore, increasing gasoline stocks and uncertainty about the degree of economic recovery, the current bullish sentiment in the product markets is not expected to remain after the winter season and could result in less support for crude fundamentals in the future. As Graph 26 shows, the performance of the US refining industry improved in the last weeks and refining margins for WTI crude oil at the US Gulf Coast surged by $1.41/b to reach $4.57/b in December from $3.16/b the previous month. In Europe, the refining industry followed suit and operating profits switched from the previous downward trend. Refining margins for Brent crude oil in Rotterdam rose to $1.59/b from about 60¢/b in November. In Asia, due to ample supply from new refineries and less arbitrage opportunities for excess barrels, refining economics remained unhealthy and Dubai crude oil margins in Singapore extended previous losses, falling to minus $1.64/b in December from minus $1.51/b a month earlier. Looking ahead, the continuation of cold weather could provide further support for product markets and lift the bearish sentiment in the next month. However, due to sufficient product stocks and idle refining capacity, product markets are not likely to take the lead in the market and lift crude prices in future.
Refinery operationsRefinery operations in the Atlantic Basin did not follow the typical trend in December
Due to contracting demand in tandem with the economic recession, the refining industry has faced considerable problems in 2009. In light of these circumstances, some unprofitable refinery units were closed down for good and others tried to reduce their throughput levels in order to cope with declining margins. With the start of the winter season and improving economic conditions, refiners were expected to lift operation levels substantially, but a huge overhang of product barrels dampened throughput levels and they have not raised their utilization rates drastically.
-4
0
4
8
12
16
-4
0
4
8
12
16
Dec
08
Jan
09
Feb
09
Mar
09
Apr
09
May
09
Jun
09
Jul 0
9
Aug
09
Sep
09
Oct
09
Nov
09
Dec
09
US$/bUS$/b
WTI (US Gulf ) A.Heavy (US Gulf )Brent (Rott.) Dubai (Sing.)
Graph 26: Refining margins
75
80
85
90
95
75
80
85
90
95
Dec
08
Jan
09
Feb
09
Mar
09
Apr
09
May
09
Jun
09
Jul 0
9
Aug
09
Sep
09
Oct
09
Nov
09
Dec
09
%%
United States EU-16 Japan Singapore
Graph 27: Refinery utilization rates

Monthly Oil Market Report_______________________________________________________________________________________________________________________________________
January 2010 38
As Graph 27 indicates, refinery utilization rates in the US increased marginally by 0.2% to reach 80.3% in December from 80.1% the previous month, whereas typically they exceed 90%. Ample product stocks also influenced European utilization rates which stayed around 82% in December. In Asia, Chinese refiners are still running at maximum capacity, as they benefit from government-guaranteed margins. But poor regional margins have affected other Asian refinery operations. Refinery utilization rates in Japan rose by 2% to record 85.4% in December from 83.4% in November, much lower than seasonal levels. Looking ahead, given the cold weather across the globe and improving demand from industrial sectors, refinery utilization rates may improve further next month, although due to an overhang of barrels for different products, especially distillates, refinery utilization rates are not expected to increase sharply over the coming months.
US market Product stock draws and cold weather boosted US product market sentiment in December
The high distillate inventories were a major burden on the US downstream industry in the last months forcing American refiners to reduce their operation levels drastically over the same period. Following heavy snow in the Northeast, distillate inventories started to decline, falling by 10 mb in December. This situation lifted heating oil prices both in the spot and paper markets. The crack spread for gasoil on the US Gulf Coast against WTI crude oil surged to $8/b in December from about $5/b last month. Speculators, especially money managers, also boosted net long positions substantially in the Nymex heating oil market. Managed money net long positions soared from 13,944 lots in early December to over 35,000 lots in early January. However, the US distillate market lost part of its earlier strength in the second week of January following a reverse of the de-stocking trend, lower-than-expected demand growth and forecasts for normal weather temperature over the short term in the main heating-fuel consuming areas. Improving gasoline demand along with slowing stock builds in December also lent some support to gasoline prices. As Graph 28 shows, the gasoline crack spread on the US Gulf Coast rose to around $9/b from $8/b in late November. Market players have also increased net long positions in the gasoline futures market. Managed money net long positions in the Nymex gasoline market rose to 66,000 lots on 5 January from 52,000 lots on 1 December. Gasoline stock builds gained more ground again in the first week of January. The continuation of this situation may undermine gasoline market sentiment over the coming weeks and encourage traders to liquidate positions which would result in pressure on gasoline prices. The low sulfur fuel oil market in the US was relatively lackluster in December due to lower demand from utilities and a more competitive price of natural gas. High sulfur fuel oil was also weak amid limited arbitrage opportunity to Asia. The low sulfur fuel oil crack spread against WTI crude at the US Gulf Coast widened from about minus $2/b early December to around minus $5/b early January (see Graph 28). The continuation of cold weather may provide some support to low sulfur fuel oil in the future, but due to ample availability of natural gas, fuel oil market circumstances in the US are not expected to improve significantly in the near future.
-10
-5
0
5
10
15
-10
-5
0
5
10
15
Oct
02
Oct
09
Oct
16
Oct
23
Oct
30
Nov
06
Nov
13
Nov
20
Nov
27
Dec
03
Dec
11
Dec
18
Dec
25
Jan0
1
Jan0
8
US$/bUS$/b
Prem.Gasoline Unl.93 Jet/KeroGasoil/Diesel (0.05%S) Fuel Oil (1.0%S)
Graph 28: US Gulf crack spread vs. WTI, 2009 - 2010

_____________________________________________________________________________________________________________________________________Monthly Oil Market Report
January 2010 39
European market European product markets benefited from a cold snap and export opportunities to other regions
European product market sentiment strengthened following the freezing weather across the Atlantic Basin and surging arbitrage opportunities for gasoline to the US and West Africa. The gasoline spread against Brent crude oil at Rotterdam rose to above $7/b in early January from about $6/b in the same period of the previous month (see Graph 29). Recent bullish developments in the European gasoline market may be undermined in the near future due to rising gasoline stock builds in the US and the adverse impact on the regional arbitrage window. Naphtha prices also increased along with crude prices and increasing exports to Asia. The naphtha price in Europe reached parity level with the gasoline price sometime in the last weeks. The European naphtha market may remain strong over the next months amid persisting arbitrage opportunities to Asia and improving economic growth prospects. The European distillates market also gained further momentum following freezing weather in the region, increasing seasonal demand and fewer import cargoes. These developments led to stock draws in the region, narrowing the contango in the gasoil market. The narrowing contango level may encourage traders to reduce off-shore distillate stocks which still stood around 100 mb. The crack spread of gasoil against Brent crude at Rotterdam rose to nearly $9/b in late December from around $6/b in November. Given the persistent overhang in distillate stocks in Europe, which are still far above the five-year average, European distillate prices are not expected to improve significantly next month. European fuel oil market performance was relatively weak in early December, due to fewer arbitrage flows to Asia and higher regional supply. This situation changed later on after heavy snowfall in the region which led to higher demand from utility plants and increasing arbitrage opportunity to Asia. The low sulfur fuel oil crack spread versus Brent crude oil narrowed to minus $3.85/b in early January from about minus $6/b in the same period of the previous month.
Asian market Freezing weather in leading heating-fuel consuming areas has given support to Asian product markets
The Asian market, which has been challenged with extra supplies from new refineries, found some support from regional demand and export opportunities to western markets following recent freezing weather in the US, Europe and Northern Asia. Among the middle-of-the-barrel components, jet/kerosene market sentiment gained further amid increasing heating demand from Japan and China, as well as surging demand from the aviation industry. The spread between jet fuel and gasoil hit a 10-month high, as sentiment for jet fuel firmed after a pick-up in air travel. The gasoil market, which was suffering from huge exports from China and India, also improved after the start of cold weather across the globe. The gasoil crack spread versus Dubai crude rose around $10/b in early January from about $6.5/b in early December (see Graph 30). However, due to ample stocks, the distillates market is not expected to gain much over the coming months. The light distillates market, especially the naphtha market, was also strong amid refinery outages in Northern Asia and high demand from regional crackers. A delay in the arrival of western arbitrage cargoes also contributed to higher prices for the Asian
-10
-5
0
5
10
15
-10
-5
0
5
10
15
Oct
02
Oct
09
Oct
16
Oct
23
Oct
30
Nov
06
Nov
13
Nov
20
Nov
27
Dec
03
Dec
11
Dec
18
Dec
25
Jan0
1
Jan0
8
US$/bUS$/b
Prem.Gasoline Unl.50ppm Jet/KeroGasoil 50ppm Fuel Oil (1.0%S)
Graph 29: Rotterdam crack spreads vs. Brent, 2009 - 2010
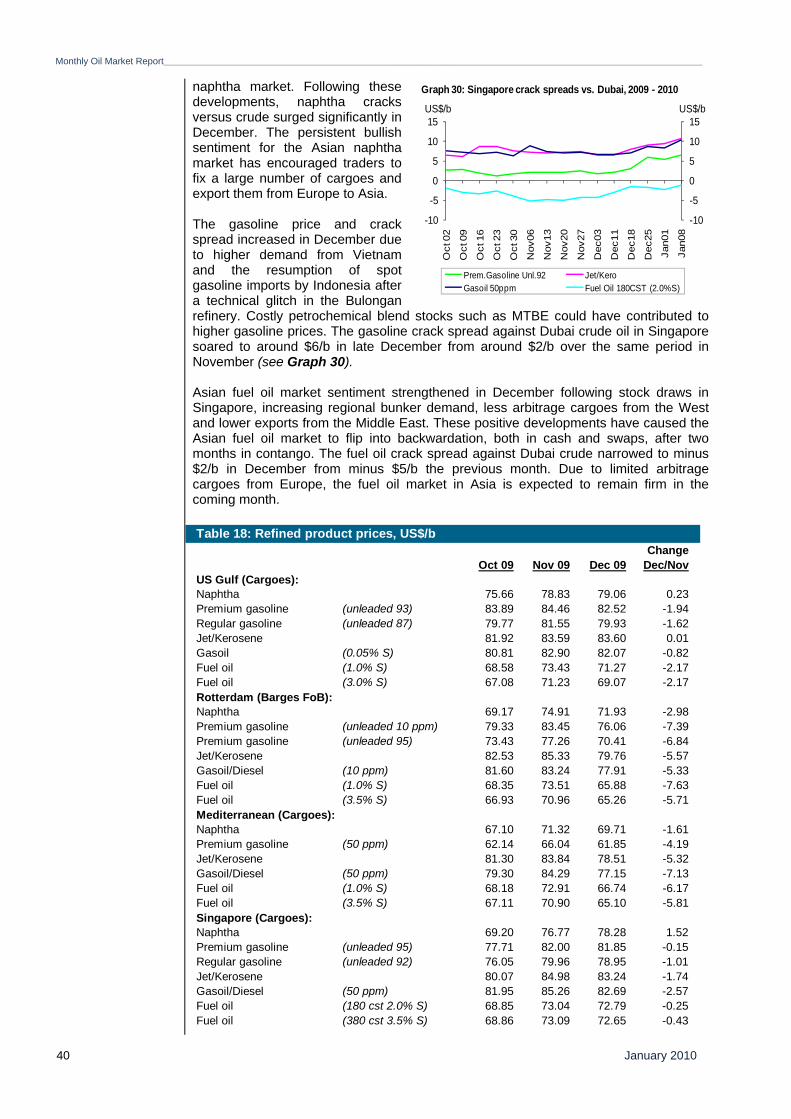
Monthly Oil Market Report_______________________________________________________________________________________________________________________________________
January 2010 40
naphtha market. Following these developments, naphtha cracks versus crude surged significantly in December. The persistent bullish sentiment for the Asian naphtha market has encouraged traders to fix a large number of cargoes and export them from Europe to Asia. The gasoline price and crack spread increased in December due to higher demand from Vietnam and the resumption of spot gasoline imports by Indonesia after a technical glitch in the Bulongan refinery. Costly petrochemical blend stocks such as MTBE could have contributed to higher gasoline prices. The gasoline crack spread against Dubai crude oil in Singapore soared to around $6/b in late December from around $2/b over the same period in November (see Graph 30). Asian fuel oil market sentiment strengthened in December following stock draws in Singapore, increasing regional bunker demand, less arbitrage cargoes from the West and lower exports from the Middle East. These positive developments have caused the Asian fuel oil market to flip into backwardation, both in cash and swaps, after two months in contango. The fuel oil crack spread against Dubai crude narrowed to minus $2/b in December from minus $5/b the previous month. Due to limited arbitrage cargoes from Europe, the fuel oil market in Asia is expected to remain firm in the coming month.
Table 18: Refined product prices, US$/bChange
Oct 09 Nov 09 Dec 09 Dec/NovUS Gulf (Cargoes):Naphtha 75.66 78.83 79.06 0.23Premium gasoline (unleaded 93) 83.89 84.46 82.52 -1.94Regular gasoline (unleaded 87) 79.77 81.55 79.93 -1.62Jet/Kerosene 81.92 83.59 83.60 0.01Gasoil (0.05% S) 80.81 82.90 82.07 -0.82Fuel oil (1.0% S) 68.58 73.43 71.27 -2.17Fuel oil (3.0% S) 67.08 71.23 69.07 -2.17Rotterdam (Barges FoB):Naphtha 69.17 74.91 71.93 -2.98Premium gasoline (unleaded 10 ppm) 79.33 83.45 76.06 -7.39Premium gasoline (unleaded 95) 73.43 77.26 70.41 -6.84Jet/Kerosene 82.53 85.33 79.76 -5.57Gasoil/Diesel (10 ppm) 81.60 83.24 77.91 -5.33Fuel oil (1.0% S) 68.35 73.51 65.88 -7.63Fuel oil (3.5% S) 66.93 70.96 65.26 -5.71Mediterranean (Cargoes):Naphtha 67.10 71.32 69.71 -1.61Premium gasoline (50 ppm) 62.14 66.04 61.85 -4.19Jet/Kerosene 81.30 83.84 78.51 -5.32Gasoil/Diesel (50 ppm) 79.30 84.29 77.15 -7.13Fuel oil (1.0% S) 68.18 72.91 66.74 -6.17Fuel oil (3.5% S) 67.11 70.90 65.10 -5.81Singapore (Cargoes):Naphtha 69.20 76.77 78.28 1.52Premium gasoline (unleaded 95) 77.71 82.00 81.85 -0.15Regular gasoline (unleaded 92) 76.05 79.96 78.95 -1.01Jet/Kerosene 80.07 84.98 83.24 -1.74Gasoil/Diesel (50 ppm) 81.95 85.26 82.69 -2.57Fuel oil (180 cst 2.0% S) 68.85 73.04 72.79 -0.25Fuel oil (380 cst 3.5% S) 68.86 73.09 72.65 -0.43
-10
-5
0
5
10
15
-10
-5
0
5
10
15
Oct
02
Oct
09
Oct
16
Oct
23
Oct
30
Nov
06
Nov
13
Nov
20
Nov
27
Dec
03
Dec
11
Dec
18
Dec
25
Jan0
1
Jan0
8
US$/bUS$/b
Prem.Gasoline Unl.92 Jet/KeroGasoil 50ppm Fuel Oil 180CST (2.0%S)
Graph 30: Singapore crack spreads vs. Dubai, 2009 - 2010
_____________________________________________________________________________________________________________________________________Monthly Oil Market Report
January 2010 41
Table 19: Refinery operations in selected OECD countries
Oct 09 Nov 09 Dec 09 Dec/Nov Oct 09 Nov 09 Dec 09 Dec/NovUSA 14.38 14.11 14.20 0.10 81.9 80.1 80.3 0.2France 1.53 1.51 1.52 0.00 81.2 82.1 81.8 -0.3Germany 1.94 1.90 1.88 -0.01 84.2 84.6 85.2 0.6Italy 1.63 1.66 1.65 -0.01 75.8 76.5 76.9 0.3UK 1.46 1.41 1.46 0.05 75.9 76.3 77.6 1.3Euro16 10.67 10.60 10.78 0.18 81.2 82.5 82.9 0.4Japan 3.03 3.71 3.87 0.16 81.3 83.4 85.4 2.0RSources:
Refinery throughputmb/d
OPEC statistics; Argus; Euroilstock Inventory Report; IEA.Revised since last issue.
Refinery utilization%
Monthly Oil Market Report_______________________________________________________________________________________________________________________________________
January 2010 42
The Tanker Market
Crude freight rates increased by 18% for the VLCC sector, 23% for Aframax, but were down by 5% for Suezmax
The tanker market continued to show strength in December, and freight rates grew further from November levels. This was the case for both segments of the market, crude and product tankers, and for most vessel sizes in each segment. Most of the losses in freight rates during the first half of this year had been gained back by the continued and gradual strength of the market during the last four months and freight rates in December were very close to levels at the beginning of the year. Average freight rates for crude tankers in December were about 25% lower when compared to December 2008, a big improvement in compression to last July when the y-o-y drop was above 70%. For the product tankers, the improvement is even better, from minus 60% in July to about minus 9% in December. The continued tying-up of tankers in floating storage operations for both crudes and petroleum products, China’s growing crude imports for most of this year, the approaching phasing out of single-hull tankers from the market and expectations of higher traded volumes of crude oil and petroleum products in 2010 have all added support to freight rates over the last few months and are expected to continue to do so over the coming months. On average, freight rates for the VLCC segment of the market gained 8 WS points in December compared to the previous month, the Suezmax segment lost 5 WS points and the Aframax segment gained 20 points. Clean freight rates in December, both to the East and West of Suez, gained about 30 WS points compared to the previous month.
The number of VLCCs engaged in crude oil storage operations were almost steady at the end of December compared to a month earlier, despite the widening of the contango structure in crude oil futures over the same period. Estimates put the volume of crude oil stored on VLCCs by the end of the month at about 50 mb, engaging about 25 VLCCs in non–transportation operations. About 50% of this volume was taking place on the US Gulf Coast and most of the remainder was in Europe. On the other hand, estimates put the volume of middle distillates in floating storage at the end of December at about 100 mb, almost steady compared to the end of November, but by the end of the month there was a surge of about 25 to 30 mb of middle distillates stored on tankers in Europe offsetting declines in Asia-Pacific and West Africa. Reports also indicated that there were about 16 mb of fuel oil in floating storage in Asia-Pacific at the end of December.
OPEC spot fixtures and sailings from OPEC were 6% and 1% higher in December compared to the previous month
According to preliminary data, OPEC spot fixtures increased in December by about 6% to average 11.9 mb/d, compared to 11.25 mb/d in November. Fixtures from the Middle East averaged 6.12 mb/d, indicating an increase of 2% compared to the previous month, while fixtures from outside the Middle East increased by 0.53 mb/d or 10% compared to the previous month. On a y-o-y basis, OPEC spot fixtures in December were 5% higher compared to December 2008. Global spot fixtures in December averaged 18.99 mb/d, 3% higher compared to a month earlier and were 2.59 mb/d, or 16% higher compared to the same month a year ago.
Sailings from OPEC in December were at 22.97 mb/d, compared to 22.77 mb/d the previous month, and were 4% lower than a year earlier. Middle East sailings were at 16.89 mb/d compared to 16.6 mb/d the previous month and were 4% lower than a year earlier. Crude oil arrivals in North America in December were at 8.31 mb/d compared to 8.41 mb/d a month earlier. Crude oil arrivals in Europe and the Far East averaged 11.77 mb/d and 8.32 mb/d, 4% lower for Europe and 2% higher for the Far East, both compared to a month ago.

_____________________________________________________________________________________________________________________________________Monthly Oil Market Report
January 2010 43
Taking the top three vessel sizes into consideration, average spot freight rates for crude oil tankers were 12% higher in December compared to the previous month, and yet were 25% lower compared to a year ago, taking into consideration the changes in WS flat rates as of January 2009. On average, the VLCC segment gained another 8 WS points in December, the Suezmax segment lost 4 points and Aframax gained 20 points, all from November average rates. VLCC freight rates continued to strengthen throughout December for all reported routes and at the fourth week of the month reached levels not seen since the beginning of the year. Average VLCC freight rates increased in December by 18% compared to the previous month, and y-o-y, rates were almost identical to their levels in December 2008. VLCC freight rates on the Middle East Gulf to East route were at WS59 on Christmas day and ended the month at an average of WS57 compared to WS47 in November. This was the second highest monthly average in 2009. In westbound directions, freight rates on the VLCC tankers gained 19% in December compared to the previous month. Freight rates for VLCCs trading on the Middle East Gulf to North West Europe (NWE) started the month at about WS34 and peaked at WS 40 by the end of the month lifting the monthly average to WS38, slightly below February’s average. On the other hand, freight rates for the West Africa to East VLCC route were over WS60 throughout the month, reaching as high as WS64 by the end of December, the highest rate in 2009. The monthly average of freight rates on this route was at WS62, indicating a monthly gain of 15% compared to November. Freight rates in the Suezmax market were more modest in December than in November and were fluctuating within the WS70-range throughout the month. This segment of tankers lost 5% on average in December compared to the previous month and was the only segment that incurred losses this month compared to all other segments of the tanker market. For the West Africa to US route, freight rates were declining during the first half of the month reaching as low as WS66 from more than WS80 at the beginning of the month but increased afterwards to reach WS75 by the end of the month. Freight rates on this route ended the month at an average of WS 74, compared to WS76 the previous month. On the NWE to the US Suezmax route, freight rates followed almost the same pattern, losing 5 WS points or 7% in December
ChangeOct 09 Nov 09 Dec 09 Dec/Nov
Spot CharteringAll areas 18.49 18.47 18.99 0.52OPEC 11.46 11.25 11.90 0.65Middle East/ East 4.94 5.16 4.80 -0.36Middle East/ West 0.90 0.84 1.32 0.48Outside Middle East 5.62 5.25 5.78 0.53SailingsOPEC 22.64 22.77 22.97 0.20Middle East 16.46 16.60 16.89 0.29ArrivalsNoth America 8.55 8.41 8.31 -0.10Europe 12.39 12.30 11.77 -0.53Far East 8.04 8.13 8.32 0.19West Asia 4.75 4.80 4.90 0.10
Table 20: Tanker chartering, sailings and arrivals, mb/d
Source: “Oil Movements” and Lloyd's Marine Intelligence Unit.
0
50
100
150
200
250
0
50
100
150
200
250
Dec
08
Jan
09
Feb
09
Mar
09
Apr
09
May
09
Jun
09
Jul 0
9
Aug
09
Sep
09
Oct
09
Nov
09
Dec
09
WorldscaleWorldscale
Med/NWE (Aframax) W.Africa/USG (Suezmax)Mid.East/east (VLCC)
Graph 31: Monthly averages of crude oil spot freight rates
2009WS
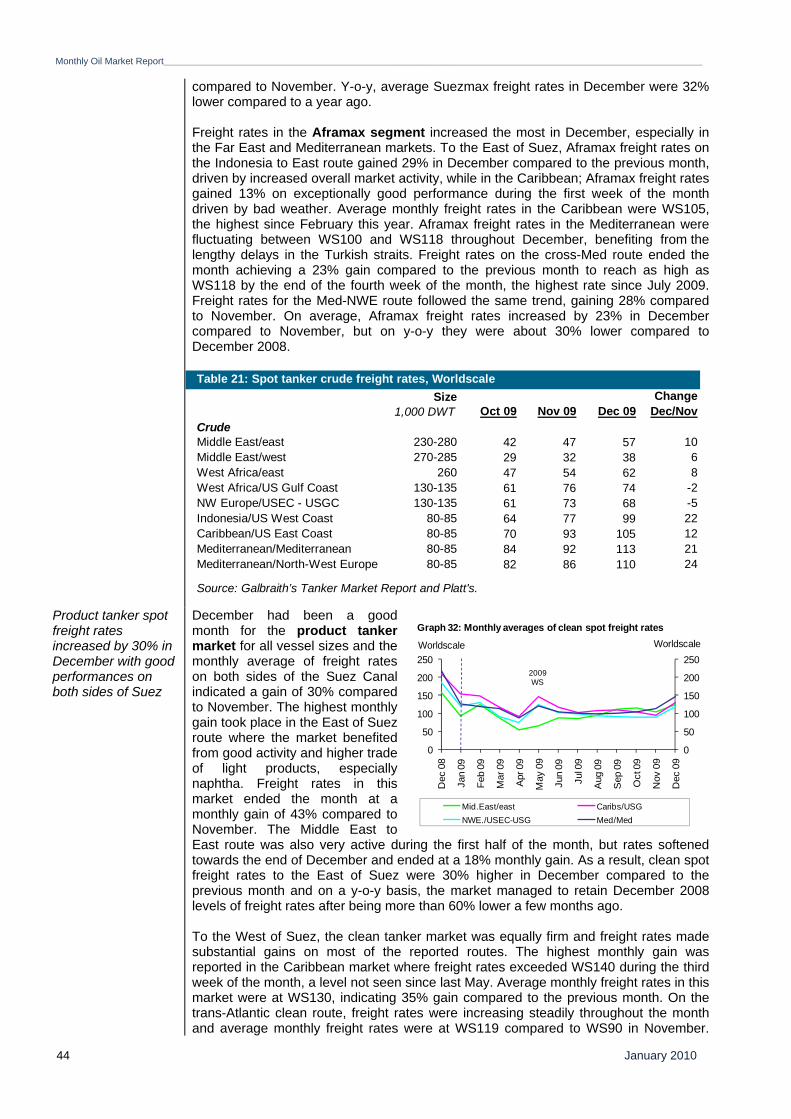
Monthly Oil Market Report_______________________________________________________________________________________________________________________________________
January 2010 44
compared to November. Y-o-y, average Suezmax freight rates in December were 32% lower compared to a year ago. Freight rates in the Aframax segment increased the most in December, especially in the Far East and Mediterranean markets. To the East of Suez, Aframax freight rates on the Indonesia to East route gained 29% in December compared to the previous month, driven by increased overall market activity, while in the Caribbean; Aframax freight rates gained 13% on exceptionally good performance during the first week of the month driven by bad weather. Average monthly freight rates in the Caribbean were WS105, the highest since February this year. Aframax freight rates in the Mediterranean were fluctuating between WS100 and WS118 throughout December, benefiting from the lengthy delays in the Turkish straits. Freight rates on the cross-Med route ended the month achieving a 23% gain compared to the previous month to reach as high as WS118 by the end of the fourth week of the month, the highest rate since July 2009. Freight rates for the Med-NWE route followed the same trend, gaining 28% compared to November. On average, Aframax freight rates increased by 23% in December compared to November, but on y-o-y they were about 30% lower compared to December 2008.
Product tanker spot freight rates increased by 30% in December with good performances on both sides of Suez
December had been a good month for the product tanker market for all vessel sizes and the monthly average of freight rates on both sides of the Suez Canal indicated a gain of 30% compared to November. The highest monthly gain took place in the East of Suez route where the market benefited from good activity and higher trade of light products, especially naphtha. Freight rates in this market ended the month at a monthly gain of 43% compared to November. The Middle East to East route was also very active during the first half of the month, but rates softened towards the end of December and ended at a 18% monthly gain. As a result, clean spot freight rates to the East of Suez were 30% higher in December compared to the previous month and on a y-o-y basis, the market managed to retain December 2008 levels of freight rates after being more than 60% lower a few months ago. To the West of Suez, the clean tanker market was equally firm and freight rates made substantial gains on most of the reported routes. The highest monthly gain was reported in the Caribbean market where freight rates exceeded WS140 during the third week of the month, a level not seen since last May. Average monthly freight rates in this market were at WS130, indicating 35% gain compared to the previous month. On the trans-Atlantic clean route, freight rates were increasing steadily throughout the month and average monthly freight rates were at WS119 compared to WS90 in November.
Size Change1,000 DWT Oct 09 Nov 09 Dec 09 Dec/Nov
CrudeMiddle East/east 230-280 42 47 57 10Middle East/west 270-285 29 32 38 6West Africa/east 260 47 54 62 8West Africa/US Gulf Coast 130-135 61 76 74 -2NW Europe/USEC - USGC 130-135 61 73 68 -5Indonesia/US West Coast 80-85 64 77 99 22Caribbean/US East Coast 80-85 70 93 105 12Mediterranean/Mediterranean 80-85 84 92 113 21Mediterranean/North-West Europe 80-85 82 86 110 24
Table 21: Spot tanker crude freight rates, Worldscale
Source: Galbraith’s Tanker Market Report and Platt's.
0
50
100
150
200
250
0
50
100
150
200
250
Dec
08
Jan
09
Feb
09
Mar
09
Apr
09
May
09
Jun
09
Jul 0
9
Aug
09
Sep
09
Oct
09
Nov
09
Dec
09
WorldscaleWorldscale
Mid.East/east Caribs/USG NWE./USEC-USG Med/Med
Graph 32: Monthly averages of clean spot freight rates
2009WS

_____________________________________________________________________________________________________________________________________Monthly Oil Market Report
January 2010 45
Similarly, product freight rates increased in the Mediterranean market by 27% for both the cross-Med and Med-Northwest routes. On average, clean spot freight rates to the West of Suez were 30% higher in December compared to the previous month and were 13% lower y-o-y.
Size Change1,000 DWT Oct 09 Nov 09 Dec 09 Dec/Nov
ProductsMiddle East/east 30-35 116 104 124 20Singapore/east 30-35 98 93 133 40Caribbean/US Gulf Coast 38-40 105 96 130 34NW Europe/USEC - USGC 33-37 90 90 119 29Mediterranean/Mediterranean 30-35 105 114 146 32Mediterranean/North-West Europe 30-35 115 124 156 32
Source: Galbraith’s Tanker Market Report and Platt's.
Table 22: Spot tanker product freight rates, Worldscale

Monthly Oil Market Report________________________________________________________________________________________________________________________________________
January 2010 46
Oil Trade Global net oil import patterns mixed at end of year
Global net oil import patterns were mixed at the end of the year, according to the latest available data. US net oil imports in December declined by 0.8 mb/d compared to the previous month and were 1.13 mb/d lower year-to-date. In Japan, net crude imports in November reached an eight-month high on increased crude imports and lower product exports. Year-to-data, net crude imports in Japan fell 0.4 mb/d. In China, net crude imports decline by 10% in November on lower net crude imports, but rose 0.25 mb/d year-to-date. India’s net oil imports rose 8% in November as product exports declined and increased 0.1 mb/d year-to-date. In the FSU, crude oil exports were steady in November, with Russian exports averaging 3.8 mb/d, representing a decline of 100 tb/d from the previous month. Year-to-date, total exports rose 0.54 mb/d.
USA US net oil imports declined by 0.8 mb/d in December backed by lower crude and product imports
According to latest official data, US crude oil imports declined further in December to average 7.98 mb/d, the lowest monthly average in years, about 0.6 mb/d lower than the previous month and about 17% or 1.66 mb/d lower compared to the same month last year. December crude oil imports bring US average imports for the year 2009 to about 9.1 mb/d, 7% or 0.7 mb/d lower than the average of the previous year. US product imports declined in December by 7% or 197,000 b/d compared to the previous month to average 2.51 mb/d, about 21% or 0.67 mb/d lower than the same month a year ago. Finished motor gasoline imports were at 201,000 b/d compared to 162,000 b/d in November and were 36% higher compared to the same month last year. Average gasoline imports in 2009 were at 0.22 mb/d, 27% lower compared to a year earlier. Distillate fuel oil imports in December were at 264,000 b/d compared to 176,000 b/d the previous month and 262,000 b/d a year earlier. Average distillate fuel oil imports in 2009 were at 229,000 b/d, 8% higher compared to the previous year. Residual fuel oil imports in December were at 349,000 b/d compared to 299,000 b/d in the previous month and 383,000 b/d in the same month last year. Average residual fuel oil imports in 2009 were at 0.35 mb/d, steady compared to a year ago. Jet fuel imports in December averaged 77,000 b/d, steady compared to the previous month. Average jet fuel imports in 2009 were 84,000 b/d compared to an average of 103,000 b/d in 2008.
0
2000
4000
6000
8000
10000
12000
0
1000
2000
3000
4000
5000
6000
Dec
08
Jan
09
Feb
09
Mar
09
Apr 0
9
May
09
Jun
09
Jul 0
9
Aug
09
Sep
09
Oct
09
Nov
09
Dec
09
tb/dtb/d
Others* Propane/Propylene Gasoline Jet Fuel/Kerosene Fuel Oil Crude (RHS)
Graph 33: USA's imports of crude and petroleum products
*Others: Contains Natural Gas Liquids, Liquefied Refinery Gases (LRG's), Other Liquids and allFinished Petroleum Products except Gasoline, Jet Fuel/Kerosene, Fuel Oil and Propane/Propylene.

_______________________________________________________________________________________________________________________________________Monthly Oil Market Report
January 2010 47
On the export side, US product exports were steady in December compared to the previous month, averaging 1.95 mb/d. On a y-o-y basis, this volume of product exports is about 42% or 579,000 b/d higher compared to a year earlier. US product exports in 2009 averaged 1.79 mb/d compared to 1.75 mb/d the previous year. As a result, US net oil imports in December were 9% or about 0.8 mb/d lower compared to the previous month to average 8.51 mb/d, the lowest in many years. This was the result of declines of 0.6 mb/d in net crude oil imports and of 0.2 mb/d in net product imports, both compared to the previous month. December net oil imports were 26% lower compared to a year earlier and average net oil imports in 2009 were at 10.02 mb/d, 10% or about 1.13 mb/d lower compared to a year ago.
Canada was the top crude oil supplier to the US in October 2009, supplying about 1.86 mb/d, down from 1.94 mb/d the previous month. For the first ten months of 2009, average exports of Canadian crudes to the US were at 1.92 mb/d, almost unchanged compared to the same period a year ago. Mexico was next, supplying about 1.02 mb/d, down from about 1.12 mb/d the previous month. Average US imports of Mexican crudes for the first ten months of 2009 were at 1.12 mb/d compared to 1.18 mb/d during the same period in 2008. Saudi Arabia and Venezuela came next with 0.94 mb/d and 0.88 mb/d respectively. OPEC Member Countries supplied about 4.28 mb/d or 49.9% of total US crude oil imports in October, down from 4.6 mb/d the previous month and from 5.31 mb/d the same month a year earlier. OPEC crude exports to the US declined by 1.03 mb/d during the first ten months of 2009 compared to the same period in 2008, from 5.46 mb/d to 4.43 mb/d. For product imports, once again Canada was the top product supplier to the US in October, supplying about 0.50 mb/d, compared to 0.42 mb/d the previous month. Russia was next, supplying 0.23 mb/d, down from 0.32 mb/d a month earlier, followed by the Virgin Islands with 0.22 mb/d, down from 0.28 mb/d in September. For OPEC Member Countries, Algeria supplied the US with 0.16 mb/d of products in October followed by Venezuela with 0.08 mb/d. Altogether, OPEC Member Countries supplied about 305,000 b/d or 13% of total US product imports in October, down from 426,000 b/d the previous month. For US product exports, Mexico was the top importer in October, importing 0.32 mb/d of US products. Singapore was next, importing 0.2 mb/d followed by Canada with 0.16 mb/d. Altogether, OPEC Member Countries imported an average of 110,000 b/d of US products in October compared to 73,000 b/d the previous month.
0
50
100
150
200
250
0
500
1000
1500
2000
2500
Dec
08
Jan
09
Feb
09
Mar
09
Apr
09
May
09
Jun
09
Jul 0
9
Aug
09
Sep
09
Oct
09
Nov
09
Dec
09
tb/dtb/d
Others* Propane/Propylene Gasoline Jet Fuel/Kerosene Fuel Oil Crude (RHS)
*Others: Contains Natural Gas Liquids, Liquefied Refinery Gases (LRG's), Other Liquids and allFinished Petroleum Products except Gasoline, Jet Fuel/Kerosene, Fuel Oil and Propane/Propylene.
Graph 34: USA's exports of crude and petroleum products

Monthly Oil Market Report________________________________________________________________________________________________________________________________________
January 2010 48
Japan Japan’s net crude oil imports in November reached a six-month high on increased crude imports and lower product exports
According to latest Japanese official data, Japan’s crude oil imports increased by about 2% or 70,000 b/d in November to average 3.67 mb/d, but yet were 5% lower compared to the same month a year earlier. At the same time, Japan’s average crude oil imports for the first eleven months of 2009 were at 3.61 mb/d, 14% or 600,000 b/d lower compared to the country’s crude oil imports during the same period a year earlier. Japan’s product imports were steady in November compared to the previous month at about 1.04 mb/d, displaying an annual decline of 2% compared to a year ago. Japan mainly imports naphtha and LPG as fuel oil imports have been declining steadily throughout 2009. Naphtha and LPG imports accounted for about 96% of Japan’s total monthly product imports in November. Naphtha imports in November were at 562,000 b/d, down by 19% or 129,000 b/d from the previous month, but up by 15% from a year earlier. Average naphtha imports for the first eleven months of 2009 were at 0.56 mb/d, 4% lower compared to the same period a year ago. LPG imports in November averaged 436,000 b/d, indicating an increase of 37% compared to the previous month and 3% decline compared to a year earlier. Average LPG imports for the first eleven months of 2009 were at 0.38 mb/d, about 58,000 b/d or 13% lower compared to the same period in 2008. Fuel oil imports in November averaged 17,000 b/d compared to 9,000 b/d the previous month and 81,000 b/d a year earlier. Average fuel oil imports for the first eleven months of 2009 were at 43,000 b/d compared to 102,000 b/d during the same period in 2008. Japan also imported about 22,000 b/d of gasoline in November compared to 20,000 b/d in October. Average gasoline imports for the first eleven months of 2009 were at 21,000 b/d compared to 12,000 b/d during the same period in 2008. Naphtha imports counted for 54% of Japan’s total product imports in November, LPG 42% and gasoline and fuel oil about 2% each. Japan’s average product imports in the first eleven months of 2009 averaged 1.02 mb/d, indicating a decline of 137,000 b/d or 12% compared to average product imports during the same period a year earlier.
ChangeOct 09 Nov 09 Dec 09 Dec/Nov
Crude oil 8,598 8,546 7,950 -596Total products 639 765 564 -201Total crude and products 9,237 9,311 8,514 -797
Table 23: USA crude and product net imports/(exports), tb/d
0
1000
2000
3000
4000
5000
6000
-100
100
300
500
700
900
1100
1300
Nov
08
Dec
08
Jan
09
Feb
09
Mar
09
Apr
09
May
09
Jun
09
Jul 0
9
Aug
09
Sep
09
Oct
09
Nov
09
tb/dtb/d
Others* L P G Naphtha Fuel Oil Crude (RHS)
Graph 35: Japan's imports of crude and petroleum products
*Others: Contains Gasoline, Jet Fuel, Kerosene, Gasoil, Asphalt and Paraffin Wax.
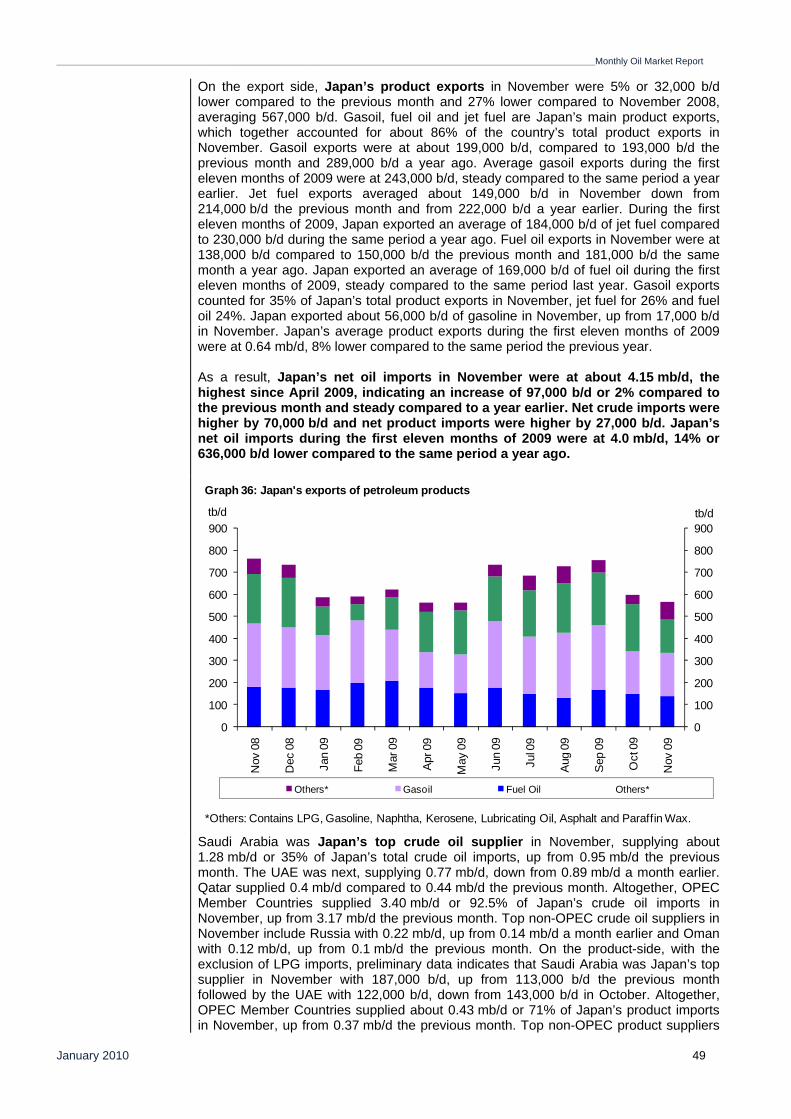
_______________________________________________________________________________________________________________________________________Monthly Oil Market Report
January 2010 49
On the export side, Japan’s product exports in November were 5% or 32,000 b/d lower compared to the previous month and 27% lower compared to November 2008, averaging 567,000 b/d. Gasoil, fuel oil and jet fuel are Japan’s main product exports, which together accounted for about 86% of the country’s total product exports in November. Gasoil exports were at about 199,000 b/d, compared to 193,000 b/d the previous month and 289,000 b/d a year ago. Average gasoil exports during the first eleven months of 2009 were at 243,000 b/d, steady compared to the same period a year earlier. Jet fuel exports averaged about 149,000 b/d in November down from 214,000 b/d the previous month and from 222,000 b/d a year earlier. During the first eleven months of 2009, Japan exported an average of 184,000 b/d of jet fuel compared to 230,000 b/d during the same period a year ago. Fuel oil exports in November were at 138,000 b/d compared to 150,000 b/d the previous month and 181,000 b/d the same month a year ago. Japan exported an average of 169,000 b/d of fuel oil during the first eleven months of 2009, steady compared to the same period last year. Gasoil exports counted for 35% of Japan’s total product exports in November, jet fuel for 26% and fuel oil 24%. Japan exported about 56,000 b/d of gasoline in November, up from 17,000 b/d in November. Japan’s average product exports during the first eleven months of 2009 were at 0.64 mb/d, 8% lower compared to the same period the previous year. As a result, Japan’s net oil imports in November were at about 4.15 mb/d, the highest since April 2009, indicating an increase of 97,000 b/d or 2% compared to the previous month and steady compared to a year earlier. Net crude imports were higher by 70,000 b/d and net product imports were higher by 27,000 b/d. Japan’s net oil imports during the first eleven months of 2009 were at 4.0 mb/d, 14% or 636,000 b/d lower compared to the same period a year ago.
Saudi Arabia was Japan’s top crude oil supplier in November, supplying about 1.28 mb/d or 35% of Japan’s total crude oil imports, up from 0.95 mb/d the previous month. The UAE was next, supplying 0.77 mb/d, down from 0.89 mb/d a month earlier. Qatar supplied 0.4 mb/d compared to 0.44 mb/d the previous month. Altogether, OPEC Member Countries supplied 3.40 mb/d or 92.5% of Japan’s crude oil imports in November, up from 3.17 mb/d the previous month. Top non-OPEC crude oil suppliers in November include Russia with 0.22 mb/d, up from 0.14 mb/d a month earlier and Oman with 0.12 mb/d, up from 0.1 mb/d the previous month. On the product-side, with the exclusion of LPG imports, preliminary data indicates that Saudi Arabia was Japan’s top supplier in November with 187,000 b/d, up from 113,000 b/d the previous month followed by the UAE with 122,000 b/d, down from 143,000 b/d in October. Altogether, OPEC Member Countries supplied about 0.43 mb/d or 71% of Japan’s product imports in November, up from 0.37 mb/d the previous month. Top non-OPEC product suppliers
0
100
200
300
400
500
600
700
800
900
0
100
200
300
400
500
600
700
800
900
Nov
08
Dec
08
Jan
09
Feb
09
Mar
09
Apr
09
May
09
Jun
09
Jul 0
9
Aug
09
Sep
09
Oct
09
Nov
09
tb/dtb/d
Others* Gasoil Fuel Oil Others*
Graph 36: Japan's exports of petroleum products
*Others: Contains LPG, Gasoline, Naphtha, Kerosene, Lubricating Oil, Asphalt and Paraffin Wax.
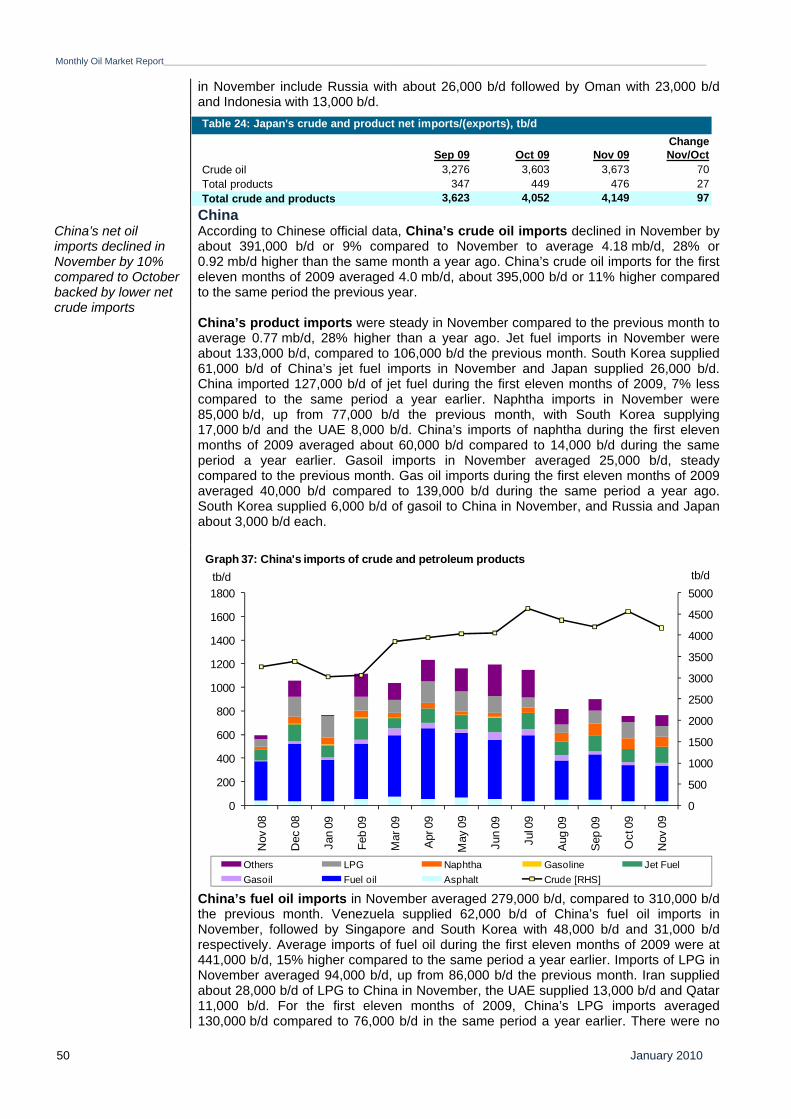
Monthly Oil Market Report________________________________________________________________________________________________________________________________________
January 2010 50
in November include Russia with about 26,000 b/d followed by Oman with 23,000 b/d and Indonesia with 13,000 b/d.
ChinaChina’s net oil imports declined in November by 10% compared to October backed by lower net crude imports
According to Chinese official data, China’s crude oil imports declined in November by about 391,000 b/d or 9% compared to November to average 4.18 mb/d, 28% or 0.92 mb/d higher than the same month a year ago. China’s crude oil imports for the first eleven months of 2009 averaged 4.0 mb/d, about 395,000 b/d or 11% higher compared to the same period the previous year. China’s product imports were steady in November compared to the previous month to average 0.77 mb/d, 28% higher than a year ago. Jet fuel imports in November were about 133,000 b/d, compared to 106,000 b/d the previous month. South Korea supplied 61,000 b/d of China’s jet fuel imports in November and Japan supplied 26,000 b/d. China imported 127,000 b/d of jet fuel during the first eleven months of 2009, 7% less compared to the same period a year earlier. Naphtha imports in November were 85,000 b/d, up from 77,000 b/d the previous month, with South Korea supplying 17,000 b/d and the UAE 8,000 b/d. China’s imports of naphtha during the first eleven months of 2009 averaged about 60,000 b/d compared to 14,000 b/d during the same period a year earlier. Gasoil imports in November averaged 25,000 b/d, steady compared to the previous month. Gas oil imports during the first eleven months of 2009 averaged 40,000 b/d compared to 139,000 b/d during the same period a year ago. South Korea supplied 6,000 b/d of gasoil to China in November, and Russia and Japan about 3,000 b/d each.
China’s fuel oil imports in November averaged 279,000 b/d, compared to 310,000 b/d the previous month. Venezuela supplied 62,000 b/d of China’s fuel oil imports in November, followed by Singapore and South Korea with 48,000 b/d and 31,000 b/d respectively. Average imports of fuel oil during the first eleven months of 2009 were at 441,000 b/d, 15% higher compared to the same period a year earlier. Imports of LPG in November averaged 94,000 b/d, up from 86,000 b/d the previous month. Iran supplied about 28,000 b/d of LPG to China in November, the UAE supplied 13,000 b/d and Qatar 11,000 b/d. For the first eleven months of 2009, China’s LPG imports averaged 130,000 b/d compared to 76,000 b/d in the same period a year earlier. There were no
ChangeSep 09 Oct 09 Nov 09 Nov/Oct
Crude oil 3,276 3,603 3,673 70Total products 347 449 476 27Total crude and products 3,623 4,052 4,149 97
Table 24: Japan's crude and product net imports/(exports), tb/d
0
500
1000
1500
2000
2500
3000
3500
4000
4500
5000
0
200
400
600
800
1000
1200
1400
1600
1800
Nov
08
Dec
08
Jan
09
Feb
09
Mar
09
Apr
09
May
09
Jun
09
Jul 0
9
Aug
09
Sep
09
Oct
09
Nov
09
tb/dtb/d
Others LPG Naphtha Gasoline Jet FuelGasoil Fuel oil Asphalt Crude [RHS]
Graph 37: China's imports of crude and petroleum products
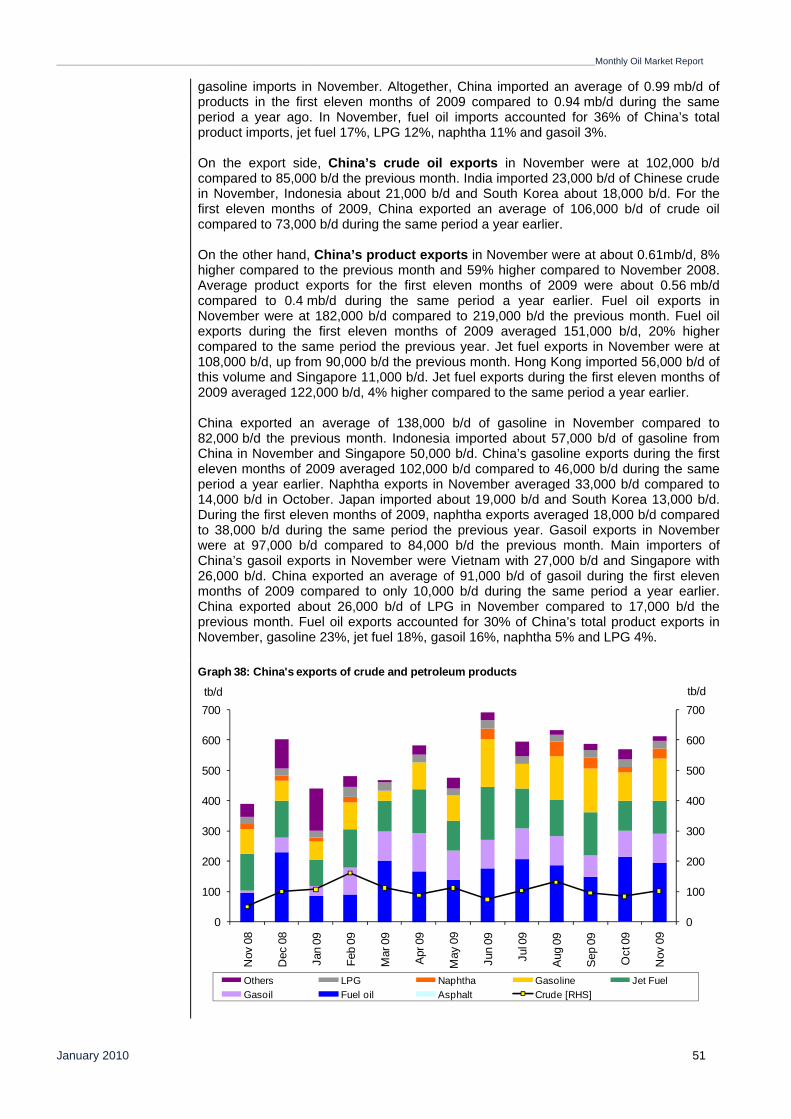
_______________________________________________________________________________________________________________________________________Monthly Oil Market Report
January 2010 51
gasoline imports in November. Altogether, China imported an average of 0.99 mb/d of products in the first eleven months of 2009 compared to 0.94 mb/d during the same period a year ago. In November, fuel oil imports accounted for 36% of China’s total product imports, jet fuel 17%, LPG 12%, naphtha 11% and gasoil 3%.
On the export side, China’s crude oil exports in November were at 102,000 b/d compared to 85,000 b/d the previous month. India imported 23,000 b/d of Chinese crude in November, Indonesia about 21,000 b/d and South Korea about 18,000 b/d. For the first eleven months of 2009, China exported an average of 106,000 b/d of crude oil compared to 73,000 b/d during the same period a year earlier. On the other hand, China’s product exports in November were at about 0.61mb/d, 8% higher compared to the previous month and 59% higher compared to November 2008. Average product exports for the first eleven months of 2009 were about 0.56 mb/d compared to 0.4 mb/d during the same period a year earlier. Fuel oil exports in November were at 182,000 b/d compared to 219,000 b/d the previous month. Fuel oil exports during the first eleven months of 2009 averaged 151,000 b/d, 20% higher compared to the same period the previous year. Jet fuel exports in November were at 108,000 b/d, up from 90,000 b/d the previous month. Hong Kong imported 56,000 b/d of this volume and Singapore 11,000 b/d. Jet fuel exports during the first eleven months of 2009 averaged 122,000 b/d, 4% higher compared to the same period a year earlier. China exported an average of 138,000 b/d of gasoline in November compared to 82,000 b/d the previous month. Indonesia imported about 57,000 b/d of gasoline from China in November and Singapore 50,000 b/d. China’s gasoline exports during the first eleven months of 2009 averaged 102,000 b/d compared to 46,000 b/d during the same period a year earlier. Naphtha exports in November averaged 33,000 b/d compared to 14,000 b/d in October. Japan imported about 19,000 b/d and South Korea 13,000 b/d. During the first eleven months of 2009, naphtha exports averaged 18,000 b/d compared to 38,000 b/d during the same period the previous year. Gasoil exports in November were at 97,000 b/d compared to 84,000 b/d the previous month. Main importers of China’s gasoil exports in November were Vietnam with 27,000 b/d and Singapore with 26,000 b/d. China exported an average of 91,000 b/d of gasoil during the first eleven months of 2009 compared to only 10,000 b/d during the same period a year earlier. China exported about 26,000 b/d of LPG in November compared to 17,000 b/d the previous month. Fuel oil exports accounted for 30% of China’s total product exports in November, gasoline 23%, jet fuel 18%, gasoil 16%, naphtha 5% and LPG 4%.
0
100
200
300
400
500
600
700
0
100
200
300
400
500
600
700
Nov
08
Dec
08
Jan
09
Feb
09
Mar
09
Apr
09
May
09
Jun
09
Jul 0
9
Aug
09
Sep
09
Oct
09
Nov
09
tb/dtb/d
Others LPG Naphtha Gasoline Jet FuelGasoil Fuel oil Asphalt Crude [RHS]
Graph 38: China's exports of crude and petroleum products
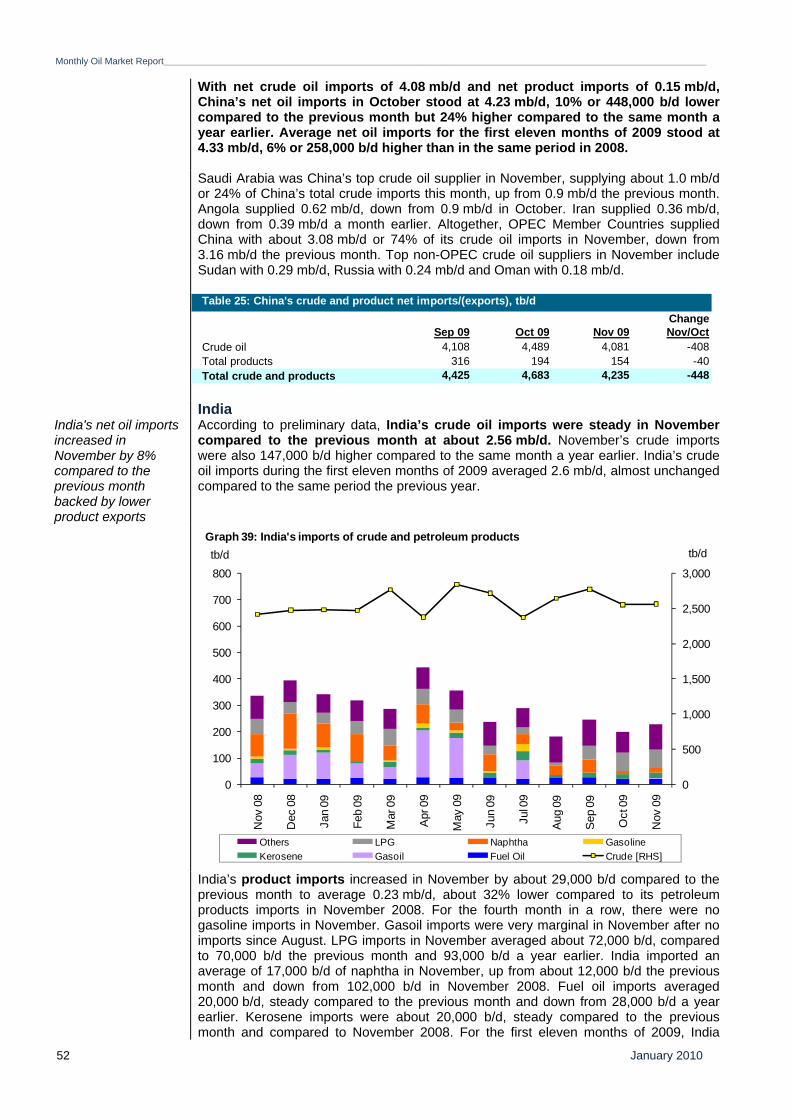
Monthly Oil Market Report________________________________________________________________________________________________________________________________________
January 2010 52
With net crude oil imports of 4.08 mb/d and net product imports of 0.15 mb/d, China’s net oil imports in October stood at 4.23 mb/d, 10% or 448,000 b/d lower compared to the previous month but 24% higher compared to the same month a year earlier. Average net oil imports for the first eleven months of 2009 stood at 4.33 mb/d, 6% or 258,000 b/d higher than in the same period in 2008.
Saudi Arabia was China’s top crude oil supplier in November, supplying about 1.0 mb/d or 24% of China’s total crude imports this month, up from 0.9 mb/d the previous month. Angola supplied 0.62 mb/d, down from 0.9 mb/d in October. Iran supplied 0.36 mb/d, down from 0.39 mb/d a month earlier. Altogether, OPEC Member Countries supplied China with about 3.08 mb/d or 74% of its crude oil imports in November, down from 3.16 mb/d the previous month. Top non-OPEC crude oil suppliers in November include Sudan with 0.29 mb/d, Russia with 0.24 mb/d and Oman with 0.18 mb/d.
India India's net oil imports increased in November by 8% compared to the previous month backed by lower product exports
According to preliminary data, India’s crude oil imports were steady in November compared to the previous month at about 2.56 mb/d. November’s crude imports were also 147,000 b/d higher compared to the same month a year earlier. India’s crude oil imports during the first eleven months of 2009 averaged 2.6 mb/d, almost unchanged compared to the same period the previous year.
India’s product imports increased in November by about 29,000 b/d compared to the previous month to average 0.23 mb/d, about 32% lower compared to its petroleum products imports in November 2008. For the fourth month in a row, there were no gasoline imports in November. Gasoil imports were very marginal in November after no imports since August. LPG imports in November averaged about 72,000 b/d, compared to 70,000 b/d the previous month and 93,000 b/d a year earlier. India imported an average of 17,000 b/d of naphtha in November, up from about 12,000 b/d the previous month and down from 102,000 b/d in November 2008. Fuel oil imports averaged 20,000 b/d, steady compared to the previous month and down from 28,000 b/d a year earlier. Kerosene imports were about 20,000 b/d, steady compared to the previous month and compared to November 2008. For the first eleven months of 2009, India
ChangeSep 09 Oct 09 Nov 09 Nov/Oct
Crude oil 4,108 4,489 4,081 -408Total products 316 194 154 -40Total crude and products 4,425 4,683 4,235 -448
Table 25: China's crude and product net imports/(exports), tb/d
0
500
1,000
1,500
2,000
2,500
3,000
0
100
200
300
400
500
600
700
800
Nov
08
Dec
08
Jan
09
Feb
09
Mar
09
Apr
09
May
09
Jun
09
Jul 0
9
Aug
09
Sep
09
Oct
09
Nov
09
tb/dtb/d
Others LPG Naphtha GasolineKerosene Gasoil Fuel Oil Crude [RHS]
Graph 39: India's imports of crude and petroleum products
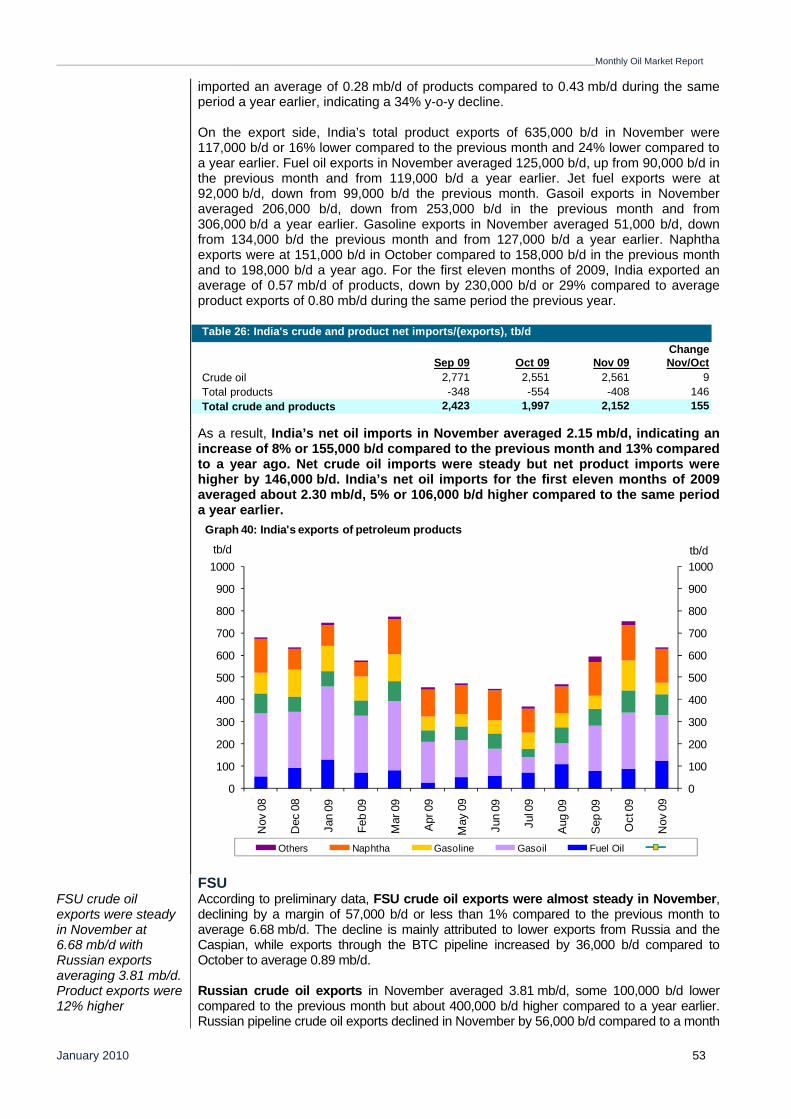
_______________________________________________________________________________________________________________________________________Monthly Oil Market Report
January 2010 53
imported an average of 0.28 mb/d of products compared to 0.43 mb/d during the same period a year earlier, indicating a 34% y-o-y decline. On the export side, India’s total product exports of 635,000 b/d in November were 117,000 b/d or 16% lower compared to the previous month and 24% lower compared to a year earlier. Fuel oil exports in November averaged 125,000 b/d, up from 90,000 b/d in the previous month and from 119,000 b/d a year earlier. Jet fuel exports were at 92,000 b/d, down from 99,000 b/d the previous month. Gasoil exports in November averaged 206,000 b/d, down from 253,000 b/d in the previous month and from 306,000 b/d a year earlier. Gasoline exports in November averaged 51,000 b/d, down from 134,000 b/d the previous month and from 127,000 b/d a year earlier. Naphtha exports were at 151,000 b/d in October compared to 158,000 b/d in the previous month and to 198,000 b/d a year ago. For the first eleven months of 2009, India exported an average of 0.57 mb/d of products, down by 230,000 b/d or 29% compared to average product exports of 0.80 mb/d during the same period the previous year.
As a result, India’s net oil imports in November averaged 2.15 mb/d, indicating an increase of 8% or 155,000 b/d compared to the previous month and 13% compared to a year ago. Net crude oil imports were steady but net product imports were higher by 146,000 b/d. India’s net oil imports for the first eleven months of 2009 averaged about 2.30 mb/d, 5% or 106,000 b/d higher compared to the same period a year earlier.
FSU FSU crude oil exports were steady in November at 6.68 mb/d with Russian exports averaging 3.81 mb/d. Product exports were 12% higher
According to preliminary data, FSU crude oil exports were almost steady in November, declining by a margin of 57,000 b/d or less than 1% compared to the previous month to average 6.68 mb/d. The decline is mainly attributed to lower exports from Russia and the Caspian, while exports through the BTC pipeline increased by 36,000 b/d compared to October to average 0.89 mb/d. Russian crude oil exports in November averaged 3.81 mb/d, some 100,000 b/d lower compared to the previous month but about 400,000 b/d higher compared to a year earlier. Russian pipeline crude oil exports declined in November by 56,000 b/d compared to a month
ChangeSep 09 Oct 09 Nov 09 Nov/Oct
Crude oil 2,771 2,551 2,561 9Total products -348 -554 -408 146Total crude and products 2,423 1,997 2,152 155
Table 26: India's crude and product net imports/(exports), tb/d
0
100
200
300
400
500
600
700
800
900
1000
0
100
200
300
400
500
600
700
800
900
1000
Nov
08
Dec
08
Jan
09
Feb
09
Mar
09
Apr
09
May
09
Jun
09
Jul 0
9
Aug
09
Sep
09
Oct
09
Nov
09
tb/dtb/d
Others Naphtha Gasoline Gasoil Fuel Oil
Graph 40: India's exports of petroleum products
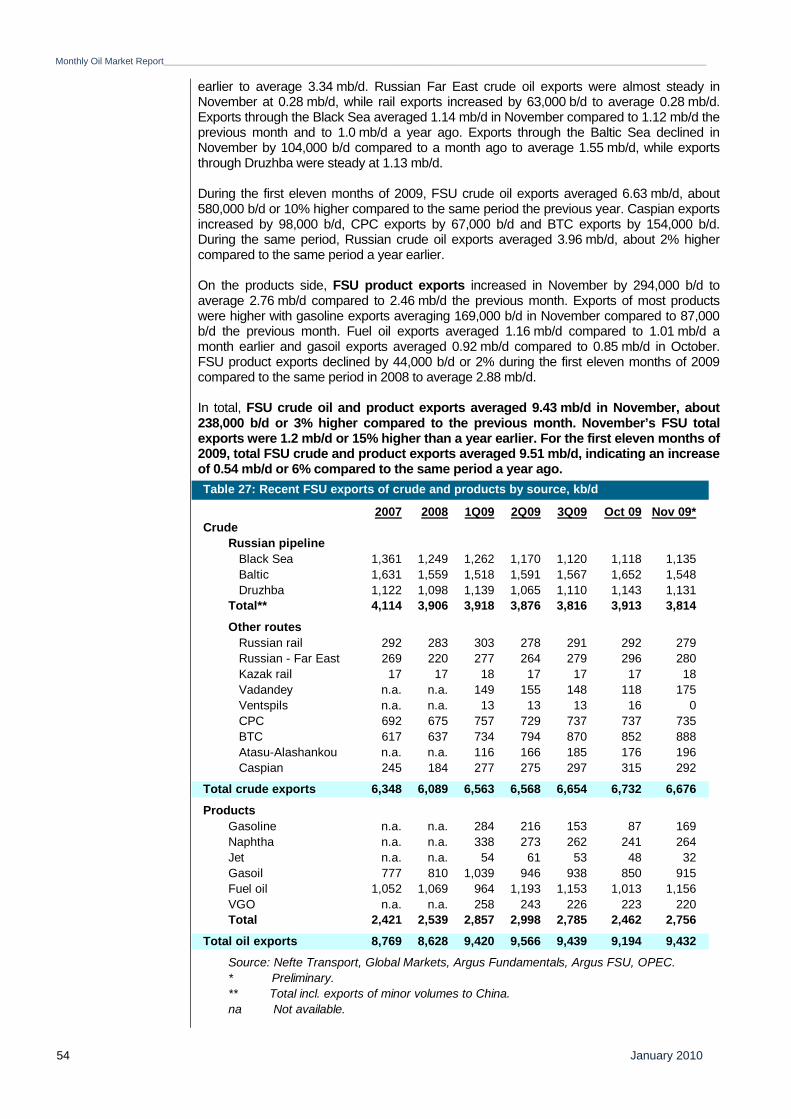
Monthly Oil Market Report________________________________________________________________________________________________________________________________________
January 2010 54
earlier to average 3.34 mb/d. Russian Far East crude oil exports were almost steady in November at 0.28 mb/d, while rail exports increased by 63,000 b/d to average 0.28 mb/d. Exports through the Black Sea averaged 1.14 mb/d in November compared to 1.12 mb/d the previous month and to 1.0 mb/d a year ago. Exports through the Baltic Sea declined in November by 104,000 b/d compared to a month ago to average 1.55 mb/d, while exports through Druzhba were steady at 1.13 mb/d. During the first eleven months of 2009, FSU crude oil exports averaged 6.63 mb/d, about 580,000 b/d or 10% higher compared to the same period the previous year. Caspian exports increased by 98,000 b/d, CPC exports by 67,000 b/d and BTC exports by 154,000 b/d. During the same period, Russian crude oil exports averaged 3.96 mb/d, about 2% higher compared to the same period a year earlier. On the products side, FSU product exports increased in November by 294,000 b/d to average 2.76 mb/d compared to 2.46 mb/d the previous month. Exports of most products were higher with gasoline exports averaging 169,000 b/d in November compared to 87,000 b/d the previous month. Fuel oil exports averaged 1.16 mb/d compared to 1.01 mb/d a month earlier and gasoil exports averaged 0.92 mb/d compared to 0.85 mb/d in October. FSU product exports declined by 44,000 b/d or 2% during the first eleven months of 2009 compared to the same period in 2008 to average 2.88 mb/d. In total, FSU crude oil and product exports averaged 9.43 mb/d in November, about 238,000 b/d or 3% higher compared to the previous month. November’s FSU total exports were 1.2 mb/d or 15% higher than a year earlier. For the first eleven months of 2009, total FSU crude and product exports averaged 9.51 mb/d, indicating an increase of 0.54 mb/d or 6% compared to the same period a year ago.
2007 2008 1Q09 2Q09 3Q09 Oct 09 Nov 09*Crude
Russian pipeline Black Sea 1,361 1,249 1,262 1,170 1,120 1,118 1,135 Baltic 1,631 1,559 1,518 1,591 1,567 1,652 1,548 Druzhba 1,122 1,098 1,139 1,065 1,110 1,143 1,131Total** 4,114 3,906 3,918 3,876 3,816 3,913 3,814
Other routes Russian rail 292 283 303 278 291 292 279 Russian - Far East 269 220 277 264 279 296 280 Kazak rail 17 17 18 17 17 17 18 Vadandey n.a. n.a. 149 155 148 118 175 Ventspils n.a. n.a. 13 13 13 16 0 CPC 692 675 757 729 737 737 735 BTC 617 637 734 794 870 852 888 Atasu-Alashankou n.a. n.a. 116 166 185 176 196 Caspian 245 184 277 275 297 315 292
6,348 6,089 6,563 6,568 6,654 6,732 6,676
ProductsGasoline n.a. n.a. 284 216 153 87 169Naphtha n.a. n.a. 338 273 262 241 264Jet n.a. n.a. 54 61 53 48 32Gasoil 777 810 1,039 946 938 850 915Fuel oil 1,052 1,069 964 1,193 1,153 1,013 1,156VGO n.a. n.a. 258 243 226 223 220Total 2,421 2,539 2,857 2,998 2,785 2,462 2,756
8,769 8,628 9,420 9,566 9,439 9,194 9,432
Source: Nefte Transport, Global Markets, Argus Fundamentals, Argus FSU, OPEC.* Preliminary.** Total incl. exports of minor volumes to China.na Not available.
Table 27: Recent FSU exports of crude and products by source, kb/d
Total crude exports
Total oil exports
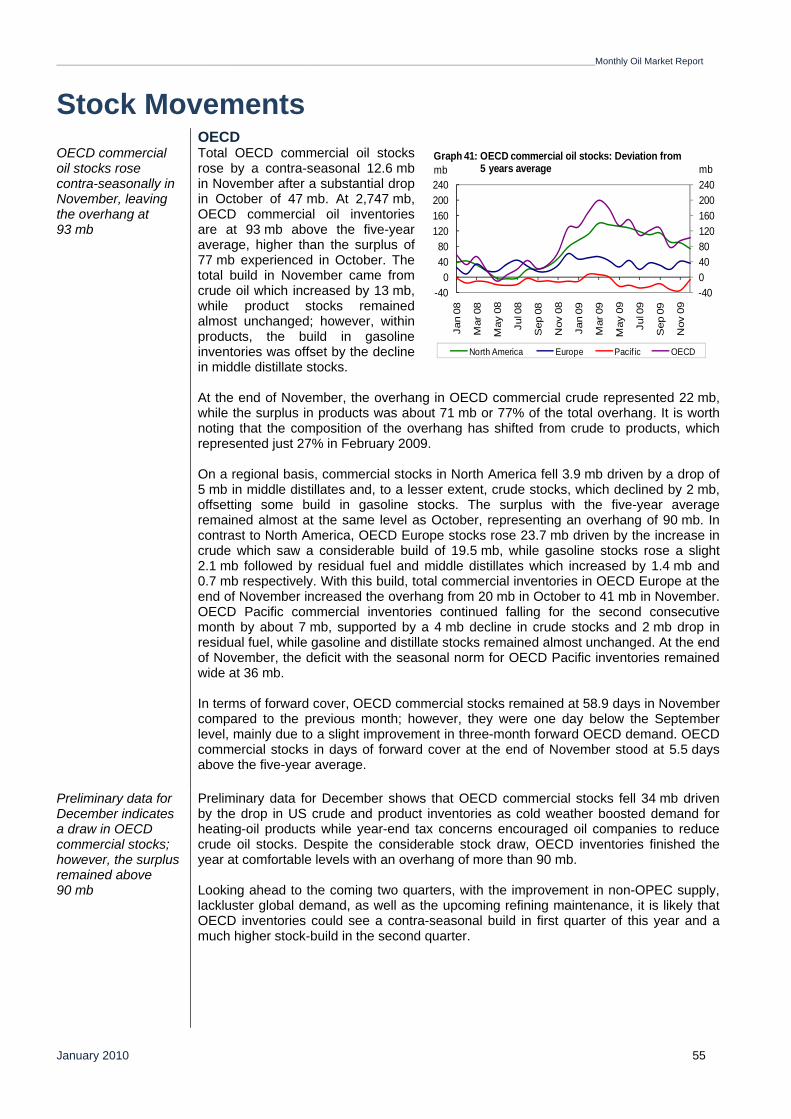
_______________________________________________________________________________________________________________________________________Monthly Oil Market Report
January 2010 55
Stock Movements
OECDOECD commercial oil stocks rose contra-seasonally in November, leaving the overhang at 93 mb
Total OECD commercial oil stocks rose by a contra-seasonal 12.6 mb in November after a substantial drop in October of 47 mb. At 2,747 mb, OECD commercial oil inventories are at 93 mb above the five-year average, higher than the surplus of 77 mb experienced in October. The total build in November came from crude oil which increased by 13 mb, while product stocks remained almost unchanged; however, within products, the build in gasoline inventories was offset by the decline in middle distillate stocks. At the end of November, the overhang in OECD commercial crude represented 22 mb, while the surplus in products was about 71 mb or 77% of the total overhang. It is worth noting that the composition of the overhang has shifted from crude to products, which represented just 27% in February 2009. On a regional basis, commercial stocks in North America fell 3.9 mb driven by a drop of 5 mb in middle distillates and, to a lesser extent, crude stocks, which declined by 2 mb, offsetting some build in gasoline stocks. The surplus with the five-year average remained almost at the same level as October, representing an overhang of 90 mb. In contrast to North America, OECD Europe stocks rose 23.7 mb driven by the increase in crude which saw a considerable build of 19.5 mb, while gasoline stocks rose a slight 2.1 mb followed by residual fuel and middle distillates which increased by 1.4 mb and 0.7 mb respectively. With this build, total commercial inventories in OECD Europe at the end of November increased the overhang from 20 mb in October to 41 mb in November. OECD Pacific commercial inventories continued falling for the second consecutive month by about 7 mb, supported by a 4 mb decline in crude stocks and 2 mb drop in residual fuel, while gasoline and distillate stocks remained almost unchanged. At the end of November, the deficit with the seasonal norm for OECD Pacific inventories remained wide at 36 mb. In terms of forward cover, OECD commercial stocks remained at 58.9 days in November compared to the previous month; however, they were one day below the September level, mainly due to a slight improvement in three-month forward OECD demand. OECD commercial stocks in days of forward cover at the end of November stood at 5.5 days above the five-year average.
Preliminary data for December indicates a draw in OECD commercial stocks; however, the surplus remained above 90 mb
Preliminary data for December shows that OECD commercial stocks fell 34 mb driven by the drop in US crude and product inventories as cold weather boosted demand for heating-oil products while year-end tax concerns encouraged oil companies to reduce crude oil stocks. Despite the considerable stock draw, OECD inventories finished the year at comfortable levels with an overhang of more than 90 mb. Looking ahead to the coming two quarters, with the improvement in non-OPEC supply, lackluster global demand, as well as the upcoming refining maintenance, it is likely that OECD inventories could see a contra-seasonal build in first quarter of this year and a much higher stock-build in the second quarter.
-4004080120160200240
-400
4080
120160200240
Jan
08
Mar
08
May
08
Jul 0
8
Sep
08
Nov
08
Jan
09
Mar
09
May
09
Jul 0
9
Sep
09
Nov
09
mbmb
North America Europe Pacif ic OECD
Graph 41: OECD commercial oil stocks: Deviation from 5 years average
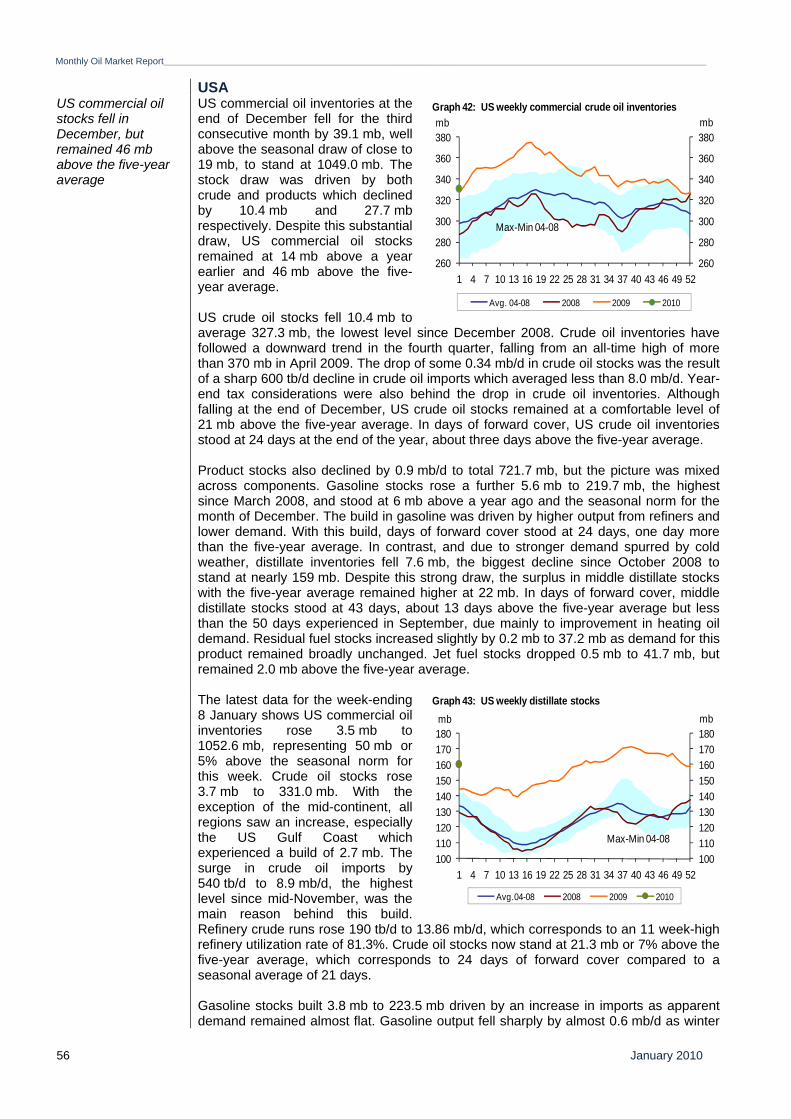
Monthly Oil Market Report________________________________________________________________________________________________________________________________________
January 2010 56
USA US commercial oil stocks fell in December, but remained 46 mb above the five-year average
US commercial oil inventories at the end of December fell for the third consecutive month by 39.1 mb, well above the seasonal draw of close to 19 mb, to stand at 1049.0 mb. The stock draw was driven by both crude and products which declined by 10.4 mb and 27.7 mb respectively. Despite this substantial draw, US commercial oil stocks remained at 14 mb above a year earlier and 46 mb above the five-year average. US crude oil stocks fell 10.4 mb to average 327.3 mb, the lowest level since December 2008. Crude oil inventories have followed a downward trend in the fourth quarter, falling from an all-time high of more than 370 mb in April 2009. The drop of some 0.34 mb/d in crude oil stocks was the result of a sharp 600 tb/d decline in crude oil imports which averaged less than 8.0 mb/d. Year-end tax considerations were also behind the drop in crude oil inventories. Although falling at the end of December, US crude oil stocks remained at a comfortable level of 21 mb above the five-year average. In days of forward cover, US crude oil inventories stood at 24 days at the end of the year, about three days above the five-year average. Product stocks also declined by 0.9 mb/d to total 721.7 mb, but the picture was mixed across components. Gasoline stocks rose a further 5.6 mb to 219.7 mb, the highest since March 2008, and stood at 6 mb above a year ago and the seasonal norm for the month of December. The build in gasoline was driven by higher output from refiners and lower demand. With this build, days of forward cover stood at 24 days, one day more than the five-year average. In contrast, and due to stronger demand spurred by cold weather, distillate inventories fell 7.6 mb, the biggest decline since October 2008 to stand at nearly 159 mb. Despite this strong draw, the surplus in middle distillate stocks with the five-year average remained higher at 22 mb. In days of forward cover, middle distillate stocks stood at 43 days, about 13 days above the five-year average but less than the 50 days experienced in September, due mainly to improvement in heating oil demand. Residual fuel stocks increased slightly by 0.2 mb to 37.2 mb as demand for this product remained broadly unchanged. Jet fuel stocks dropped 0.5 mb to 41.7 mb, but remained 2.0 mb above the five-year average.
The latest data for the week-ending 8 January shows US commercial oil inventories rose 3.5 mb to 1052.6 mb, representing 50 mb or 5% above the seasonal norm for this week. Crude oil stocks rose 3.7 mb to 331.0 mb. With the exception of the mid-continent, all regions saw an increase, especially the US Gulf Coast which experienced a build of 2.7 mb. The surge in crude oil imports by 540 tb/d to 8.9 mb/d, the highest level since mid-November, was the main reason behind this build. Refinery crude runs rose 190 tb/d to 13.86 mb/d, which corresponds to an 11 week-high refinery utilization rate of 81.3%. Crude oil stocks now stand at 21.3 mb or 7% above the five-year average, which corresponds to 24 days of forward cover compared to a seasonal average of 21 days. Gasoline stocks built 3.8 mb to 223.5 mb driven by an increase in imports as apparent demand remained almost flat. Gasoline output fell sharply by almost 0.6 mb/d as winter
260
280
300
320
340
360
380
260
280
300
320
340
360
380
1 4 7 10 13 16 19 22 25 28 31 34 37 40 43 46 49 52
mbmb
Avg. 04-08 2008 2009 2010
Graph 42: US weekly commercial crude oil inventories
Max-Min 04-08
100110120130140150160170180
100110120130140150160170180
1 4 7 10 13 16 19 22 25 28 31 34 37 40 43 46 49 52
mbmb
Avg.04-08 2008 2009 2010
Graph 43: US weekly distillate stocks
Max-Min 04-08
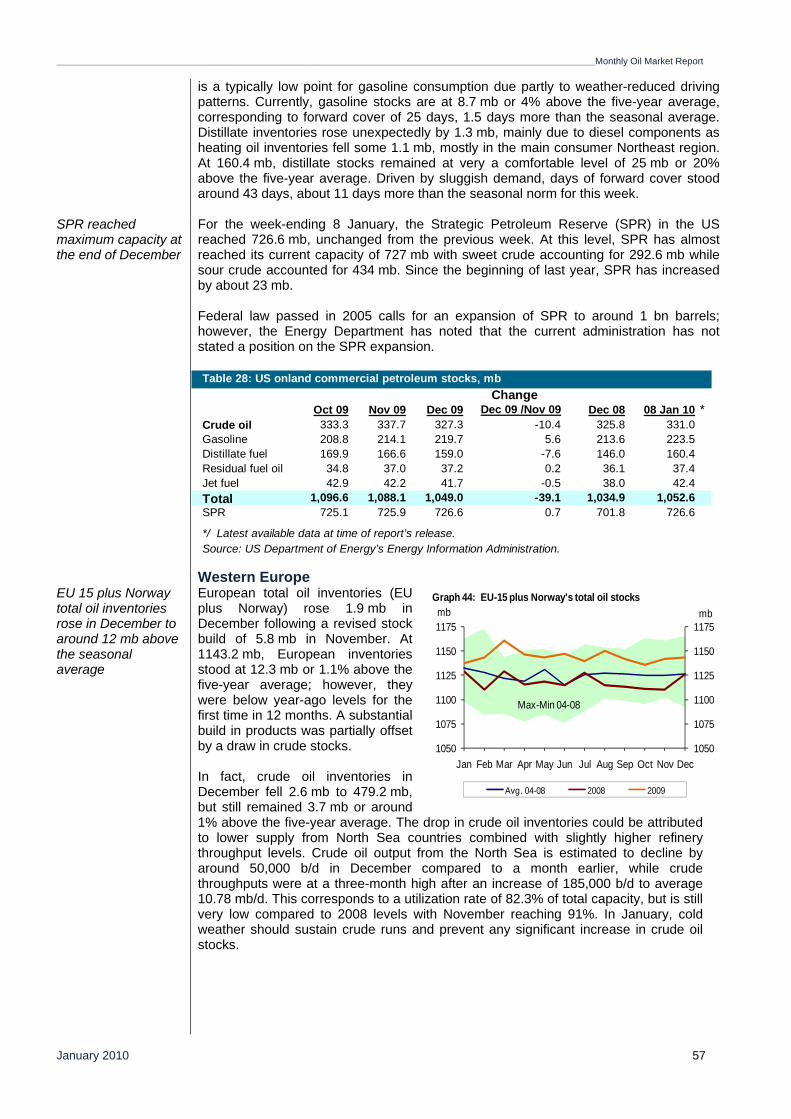
_______________________________________________________________________________________________________________________________________Monthly Oil Market Report
January 2010 57
is a typically low point for gasoline consumption due partly to weather-reduced driving patterns. Currently, gasoline stocks are at 8.7 mb or 4% above the five-year average, corresponding to forward cover of 25 days, 1.5 days more than the seasonal average. Distillate inventories rose unexpectedly by 1.3 mb, mainly due to diesel components as heating oil inventories fell some 1.1 mb, mostly in the main consumer Northeast region. At 160.4 mb, distillate stocks remained at very a comfortable level of 25 mb or 20% above the five-year average. Driven by sluggish demand, days of forward cover stood around 43 days, about 11 days more than the seasonal norm for this week.
SPR reached maximum capacity at the end of December
For the week-ending 8 January, the Strategic Petroleum Reserve (SPR) in the US reached 726.6 mb, unchanged from the previous week. At this level, SPR has almost reached its current capacity of 727 mb with sweet crude accounting for 292.6 mb while sour crude accounted for 434 mb. Since the beginning of last year, SPR has increased by about 23 mb. Federal law passed in 2005 calls for an expansion of SPR to around 1 bn barrels; however, the Energy Department has noted that the current administration has not stated a position on the SPR expansion.
Western Europe EU 15 plus Norway total oil inventories rose in December to around 12 mb above the seasonal average
European total oil inventories (EU plus Norway) rose 1.9 mb in December following a revised stock build of 5.8 mb in November. At 1143.2 mb, European inventories stood at 12.3 mb or 1.1% above the five-year average; however, they were below year-ago levels for the first time in 12 months. A substantial build in products was partially offset by a draw in crude stocks. In fact, crude oil inventories in December fell 2.6 mb to 479.2 mb, but still remained 3.7 mb or around 1% above the five-year average. The drop in crude oil inventories could be attributed to lower supply from North Sea countries combined with slightly higher refinery throughput levels. Crude oil output from the North Sea is estimated to decline by around 50,000 b/d in December compared to a month earlier, while crude throughputs were at a three-month high after an increase of 185,000 b/d to average 10.78 mb/d. This corresponds to a utilization rate of 82.3% of total capacity, but is still very low compared to 2008 levels with November reaching 91%. In January, cold weather should sustain crude runs and prevent any significant increase in crude oil stocks.
ChangeOct 09 Nov 09 Dec 09 Dec 09 /Nov 09 Dec 08 08 Jan 10 *
Crude oil 333.3 337.7 327.3 -10.4 325.8 331.0Gasoline 208.8 214.1 219.7 5.6 213.6 223.5Distillate fuel 169.9 166.6 159.0 -7.6 146.0 160.4Residual fuel oil 34.8 37.0 37.2 0.2 36.1 37.4Jet fuel 42.9 42.2 41.7 -0.5 38.0 42.4Total 1,096.6 1,088.1 1,049.0 -39.1 1,034.9 1,052.6SPR 725.1 725.9 726.6 0.7 701.8 726.6
Table 28: US onland commercial petroleum stocks, mb
Source: US Department of Energy’s Energy Information Administration.*/ Latest available data at time of report’s release.
1050
1075
1100
1125
1150
1175
1050
1075
1100
1125
1150
1175
Jan Feb Mar Apr May Jun Jul Aug Sep Oct Nov Dec
mbmb
Avg. 04-08 2008 2009
Graph 44: EU-15 plus Norway's total oil stocks
Max-Min 04-08

Monthly Oil Market Report________________________________________________________________________________________________________________________________________
January 2010 58
On the product-side, all major products contributed to the build of 4.4 mb at the end of 2009 to stand at 664.1 mb, representing an excess of 8.6 mb or 1.3% above the historical norm and 2.4 mb above the same time a year earlier. Middle distillates rose by 2.0 mb after three consecutive months of decline and ended the year at 408.4 mb, to settle at a comfortable level of 18 mb above a year ago or 32 mb above the five-year average. Despite cold weather, middle distillates in Germany, the largest heating market in Europe, have increased in December, both compared to November and a year earlier, as oil companies and traders have been building distillates throughout the year by increasing imports. Gasoline also ended the year with a build of 1.5 mb to 117.6 mb, down 7 mb from the same month the year before and around 19 mb below the five-year average. This build was mainly due to higher refinery runs which boosted gasoline output combined with weak demand and comfortable levels of US gasoline inventories which limited exports from Europe. If the downtrend in the decline in US gasoline imports continues over the coming months, this would lead to higher gasoline stocks. Fuel oil stocks remained almost unchanged in December at 109.1 mb, but were 8 mb below a year ago and 5.5 mb below the seasonal average. Stronger demand and lower output has constrained any build in fuel oil. Naphtha stocks at the end of December experienced a slight increase of 0.9 mb to 29.0 mb, almost at the same level of the previous year and in line with the average of the last five years.
Japan Japan’s commercial oil stocks dropped in November but reversed the trend in December
In November, commercial oil stocks in Japan reversed the build incurred in October, falling close to 2 mb to 168 mb. This represents almost 30 mb or 15% below the five-year average and 27 mb below the same month a year ago. The draw in total stocks is mainly attributed to crude, as products as a whole saw a minor decline. Crude oil inventories fell 2.0 mb in November to move to a level of less than 90 mb. With this level, crude oil stocks widened the deficit with the five-year average to 23 mb or 21%, and around 18 mb below the same month last year. This draw is mainly attributed to lower imports as petroleum demand remained very weak. Additionally, Japan’s total products sales in November fell 4.7% from a year earlier and 0.7% from the previous month.
ChangeOct 09 Nov 09 Dec 09 Dec 09/Nov 09 Dec 08
Crude oil 474.1 481.7 479.2 -2.6 486.6Mogas 118.3 116.1 117.6 1.5 124.7Naphtha 27.7 28.2 29.0 0.9 29.8Middle distillates 409.3 406.4 408.4 2.0 390.0Fuel oils 106.0 109.0 109.1 0.1 117.1Total products 661.4 659.6 664.1 4.4 661.6Total 1,135.5 1,141.4 1,143.2 1.9 1,148.2
Table 29: Western Europe's oil stocks, mb
Source: Argus, Euroilstock.
150
165
180
195
210
225
150
165
180
195
210
225
Jan Feb Mar Apr May Jun Jul Aug Sep Oct Nov Dec
mbmb
Avg. 04-08 2008 2009
Graph 45: Japan's commercial oil stocks
Max-Min 04-08

_______________________________________________________________________________________________________________________________________Monthly Oil Market Report
January 2010 59
Product inventories saw a slight draw of 0.2 mb to average 78.3 mb, representing a
deficit of 6.3 mb or 7.4% below the five-year average and down 9 mb from the same month of the previous year. Within products, gasoline, distillates and residual fuel witnessed a build, while naphtha experienced a draw almost offsetting the total build incurred for the other three products. Gasoline stocks gained 0.3 mb or 2.2% for the second consecutive build in six months to stand at 13.7 mb, indicating a surplus of 1.6% above the five-year average. This build could be attributed to the increase in imports by 6.2% combined with the decline in domestic sales of 5.2% reflecting the weak transportation sector in Japan. Similarly, distillate stocks added 1.3 mb to average 38.1 mb, but despite this build, distillate stocks remained 6.1 mb or 13.7% below the five-year average. Within middle distillates, jet fuel and kerosene saw a stock build of 3.4% and 6.8%, while gasoil inventories decreased by 1.9%. Residual fuel inventories rose slightly by 0.3 mb to 16.6 mb, but remained 3 mb or 15% below the five-year average. The build in residual fuel oil stocks could be attributed to the increase in output, while domestic sales remained almost flat. Naphtha is the only product indicating a draw of 2.1 mb to 9.9 mb, widening the deficit with the five-year average to 18%. The draw in naphtha stocks resulted from a combined a drop in imports of almost 20% as well an increase in domestic sales of about 3.2%. Preliminary indications based on weekly data published by the Petroleum Association of Japan (PAJ) shows Japan’s commercial oil inventories rose by more than 3 mb by the end of December to remain at around 16 mb or 9% below the five-year average. The bulk of the build is expected to come from crude, which increased by 3.0 mb/d to reduce the deficit with the five-year average to 15 mb or 14%. Major product inventories in December are estimated to have built slightly by 0.3 mb, representing a small gap with the historical norm of 1.5 mb or about 2%. According to the latest data for the week ending 9 January, crude oil inventories fell by 3.6 mb to 89.1 mb, mainly due to the increase in crude runs by 80,000 b/d to average 3.94 mb/d which corresponds to a refinery utilization rate of 80.8%, an increase of 1.8% from the previous week. On the product-side, total major product inventories remained almost unchanged at 78.7 mb; however, gasoline saw a build of 0.9 mb, while naphtha, distillate stocks and residual fuel declined by 0.5 mb, 0.3 mb and 0.1 mb respectively.
Singapore and Amsterdam-Rotterdam-Antwerp (ARA) product stocks Singapore product stocks rose in November; however, preliminary data shows a draw in December
Singapore product stocks in November increased by 2.6 mb to about 48 mb, representing a gain of 7 mb from a year ago. Fuel oil stocks rose 2.8 mb, mainly due to an increase in supply from Europe which outpaced strong regional demand. Light distillate stocks rose slightly by 0.1 mb, while middle distillate inventories fell 0.3 mb. With this build, Singapore product stocks remained above the five-year average. Preliminary data from December indicates Singapore product stocks dropped by around 3.7 mb, driven by a fall of almost the same amount in residual fuel stocks. The stock draw was due to stronger regional demand. Light and middle distillate stocks saw a mixed picture as light distillates fell 0.6 mb, while middle distillates rose 0.7 mb. Product stocks in Amsterdam-Rotterdam-Antwerp (ARA) in November rose 0.7 mb to
ChangeSep 09 Oct 09 Nov 09 Nov 09/Oct 09 Nov 08
Crude oil 85.9 91.4 89.7 -1.8 107.9Gasoline 13.6 13.5 13.7 0.3 13.8Naphtha 11.0 12.0 9.9 -2.1 12.0Middle distillates 38.6 36.8 38.1 1.3 41.4Residual fuel oil 17.7 16.3 16.6 0.3 20.1Total products 80.9 78.5 78.3 -0.2 87.3Total** 166.8 170.0 168.0 -2.0 195.2
Table 30: Japan's commercial oil stocks*, mb
Source: METI, Japan.
* At end of month.** Includes crude oil and main products only.

Monthly Oil Market Report________________________________________________________________________________________________________________________________________
January 2010 60
stand at 38.1 mb, about 9.7 mb above a year earlier. Within products, gasoline, jet fuel and naphtha saw a build of 0.6 mb, 0.3 mb and 0.2 mb respectively, while in contrast, gasoil and fuel oil stocks show a decline of 0.2 mb and 0.3 mb respectively. Preliminary data for December points out that product stocks in ARA increased further by 2 mb to stand close to 40.0 mb; however, the surplus with a year ago has declined to just 3.5 mb. Gasoil stocks rose at the end of the year by nearly 1.0 mb. This build came mainly from floating storage as volumes previously held in the UK were shifted to ARA on an anticipated increase of demand in Germany. Almost all other products saw a build, with fuel oil stocks jumping to a record high supported by increased imports mainly from Russia and the US, which outweighed exports to Germany. Naphtha stocks rose mainly due to higher imports from Russia and jet fuel stocks rose as open arbitrage from the Middle East boosted inventories.

_______________________________________________________________________________________________________________________________________Monthly Oil Market Report
January 2010 61
Balance of Supply and Demand Estimate for 2009 Required OPEC crude for 2009 estimated at 28.7 mb/d, down 2.3 mb/d from 2008
Demand for OPEC crude has been revised up by around 70,000 b/d to currently stand at 28.7 mb/d, mainly reflecting a downward revision to non-OPEC supply as global oil demand remained almost unchanged. The first three quarters carried the bulk of the revision, while the fourth quarter remained broadly unchanged. However, this still represents a considerable decline of 2.3 mb/d from the previous year. The first half experienced negative growth of around 3.0 mb/d over the same period last year, while the decline narrowed in the second half to show a loss of only 1.4 mb/d in the fourth quarter.
Forecast for 2010 Demand for OPEC crude in 2010 forecast at 28.6 mb/d, representing a decline of 0.1 mb/d
Demand for OPEC crude in 2010 is projected to average 28.6 mb/d, broadly unchanged from the previous assessment as world oil demand and non-OPEC supply remained almost unchanged. On a quarterly basis, only the second quarter saw a downward revision of 0.1 mb to currently stand at 27.4 mb/d. Required OPEC crude is forecast to decline slightly by about 60,000 b/d following two consecutive annual declines. The first half of the year is still showing a drop of 0.4 mb/d, while the second half is estimated to see positive growth of around 0.2 mb/d in the third quarter and 0.4 mb/d in the fourth.
2008 1Q09 2Q09 3Q09 4Q09 2009(a) World Oil Demand 85.70 84.00 83.12 84.81 85.36 84.33 Non-OPEC Supply 50.45 50.92 50.60 50.81 51.49 50.96 OPEC NGLs and non-conventionals 4.32 4.49 4.58 4.84 4.95 4.72(b) Total Supply excluding OPEC Crude 54.77 55.41 55.18 55.66 56.43 55.67
Difference (a-b) 30.93 28.59 27.94 29.15 28.92 28.65OPEC crude oil production 31.21 28.46 28.49 28.86 29.07 28.72Balance 0.28 -0.13 0.56 -0.29 0.15 0.07
Totals may not add due to independent rounding.
Table 31: Summarized supply/demand balance for 2009, mb/d
2009 1Q10 2Q10 3Q10 4Q10 2010(a) World Oil Demand 84.33 84.71 83.75 85.73 86.38 85.15 Non-OPEC Supply 50.96 51.42 51.19 51.03 51.61 51.31 OPEC NGLs and non-conventionals 4.72 5.03 5.19 5.31 5.46 5.25(b) Total Supply excluding OPEC Crude 55.67 56.44 56.39 56.33 57.06 56.56
Difference (a-b) 28.65 28.26 27.37 29.40 29.32 28.59
Totals may not add due to independent rounding.
Table 32: Summarized supply/demand balance for 2010, mb/d
25
26
27
28
29
30
31
25
26
27
28
29
30
31
1Q09 2Q09 3Q09 4Q09 1Q10 2Q10 3Q10 4Q10
mb/dmb/d
OPEC Crude production Required OPEC Crude
Graph 46: Balance of supply and demand
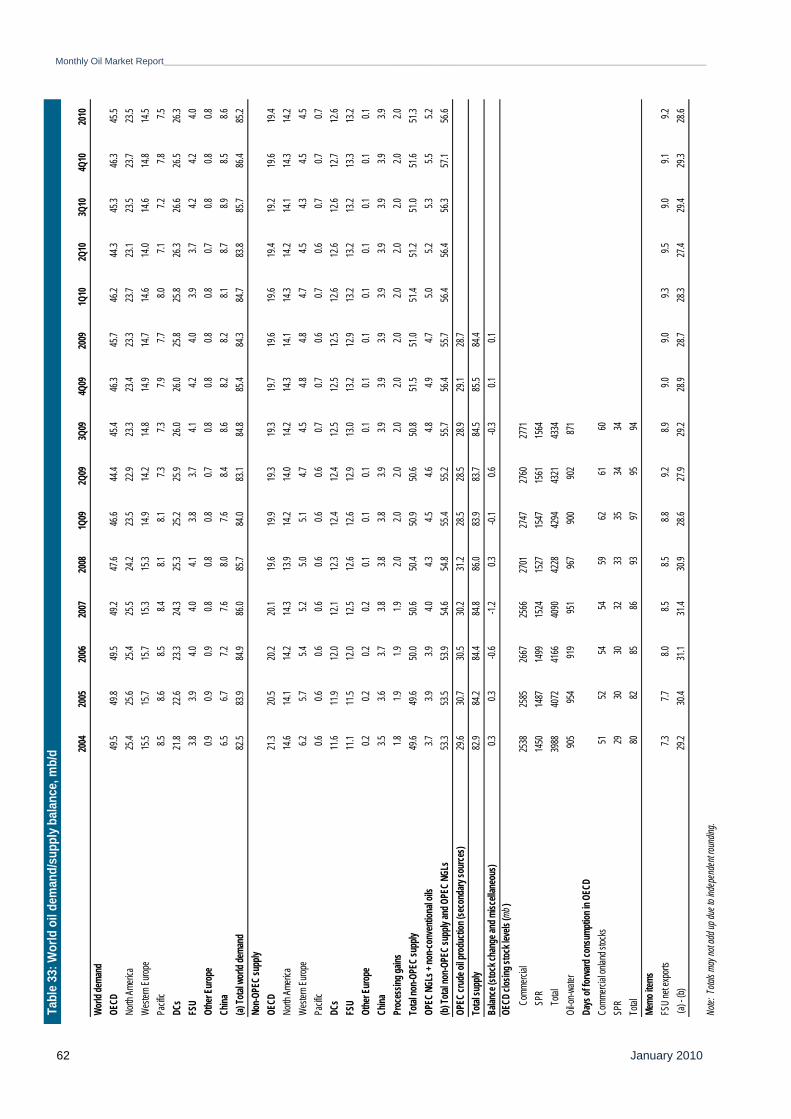
Monthly Oil Market Report________________________________________________________________________________________________________________________________________
January 2010 62
2004
2005
2006
2007
2008
1Q09
2Q09
3Q09
4Q09
2009
1Q10
2Q10
3Q10
4Q10
2010
World
dema
ndOE
CD49
.549
.849
.549
.247
.646
.644
.445
.446
.345
.746
.244
.345
.346
.345
.5No
rth Am
erica
25.4
25.6
25.4
25.5
24.2
23.5
22.9
23.3
23.4
23.3
23.7
23.1
23.5
23.7
23.5
Weste
rn Eu
rope
15.5
15.7
15.7
15.3
15.3
14.9
14.2
14.8
14.9
14.7
14.6
14.0
14.6
14.8
14.5
Pacif
ic8.5
8.68.5
8.48.1
8.17.3
7.37.9
7.78.0
7.17.2
7.87.5
DCs
21.8
22.6
23.3
24.3
25.3
25.2
25.9
26.0
26.0
25.8
25.8
26.3
26.6
26.5
26.3
FSU
3.83.9
4.04.0
4.13.8
3.74.1
4.24.0
3.93.7
4.24.2
4.0Ot
her E
urop
e0.9
0.90.9
0.80.8
0.80.7
0.80.8
0.80.8
0.70.8
0.80.8
China
6.56.7
7.27.6
8.07.6
8.48.6
8.28.2
8.18.7
8.98.5
8.6(a)
Total
wor
ld de
mand
82.5
83.9
84.9
86.0
85.7
84.0
83.1
84.8
85.4
84.3
84.7
83.8
85.7
86.4
85.2
Non-O
PEC
supp
lyOE
CD21
.320
.520
.220
.119
.619
.919
.319
.319
.719
.619
.619
.419
.219
.619
.4No
rth Am
erica
14.6
14.1
14.2
14.3
13.9
14.2
14.0
14.2
14.3
14.1
14.3
14.2
14.1
14.3
14.2
Weste
rn Eu
rope
6.25.7
5.45.2
5.05.1
4.74.5
4.84.8
4.74.5
4.34.5
4.5Pa
cific
0.60.6
0.60.6
0.60.6
0.60.7
0.70.6
0.70.6
0.70.7
0.7DC
s11
.611
.912
.012
.112
.312
.412
.412
.512
.512
.512
.612
.612
.612
.712
.6FS
U11
.111
.512
.012
.512
.612
.612
.913
.013
.212
.913
.213
.213
.213
.313
.2Ot
her E
urop
e0.2
0.20.2
0.20.1
0.10.1
0.10.1
0.10.1
0.10.1
0.10.1
China
3.53.6
3.73.8
3.83.8
3.93.9
3.93.9
3.93.9
3.93.9
3.9Pr
oces
sing g
ains
1.81.9
1.91.9
2.02.0
2.02.0
2.02.0
2.02.0
2.02.0
2.0To
tal no
n-OPE
C sup
ply49
.649
.650
.050
.650
.450
.950
.650
.851
.551
.051
.451
.251
.051
.651
.3OP
EC NG
Ls +
non-c
onve
ntion
al oil
s3.7
3.93.9
4.04.3
4.54.6
4.84.9
4.75.0
5.25.3
5.55.2
(b) To
tal no
n-OPE
C sup
ply an
d OPE
C NGL
s53
.353
.553
.954
.654
.855
.455
.255
.756
.455
.756
.456
.456
.357
.156
.6OP
EC cr
ude o
il pro
ducti
on (s
econ
dary
sour
ces)
29.6
30.7
30.5
30.2
31.2
28.5
28.5
28.9
29.1
28.7
Total
supp
ly82
.984
.284
.484
.886
.083
.983
.784
.585
.584
.4Ba
lance
(stoc
k cha
nge a
nd m
iscell
aneo
us)
0.30.3
-0.6
-1.2
0.3-0.
10.6
-0.3
0.10.1
OECD
clos
ing st
ock l
evels
(mb )
C
omme
rcial
2538
2585
2667
2566
2701
2747
2760
2771
SP
R14
5014
8714
9915
2415
2715
4715
6115
64
Total
3988
4072
4166
4090
4228
4294
4321
4334
Oil-o
n-wate
r90
595
491
995
196
790
090
287
1Da
ys of
forw
ard co
nsum
ption
in O
ECD
Comm
ercial
onlan
d stoc
ks51
5254
5459
6261
60SP
R29
3030
3233
3534
34To
tal80
8285
8693
9795
94Me
mo ite
msFS
U ne
t exp
orts
7.37.7
8.08.5
8.58.8
9.28.9
9.09.0
9.39.5
9.09.1
9.2 (a
) - (b)
29.2
30.4
31.1
31.4
30.9
28.6
27.9
29.2
28.9
28.7
28.3
27.4
29.4
29.3
28.6
Note:
Tota
ls ma
y not
add u
p due
to in
depe
nden
t roun
ding.
Tabl
e 33
: Wor
ld o
il de
man
d/su
pply
bal
ance
, mb/
d
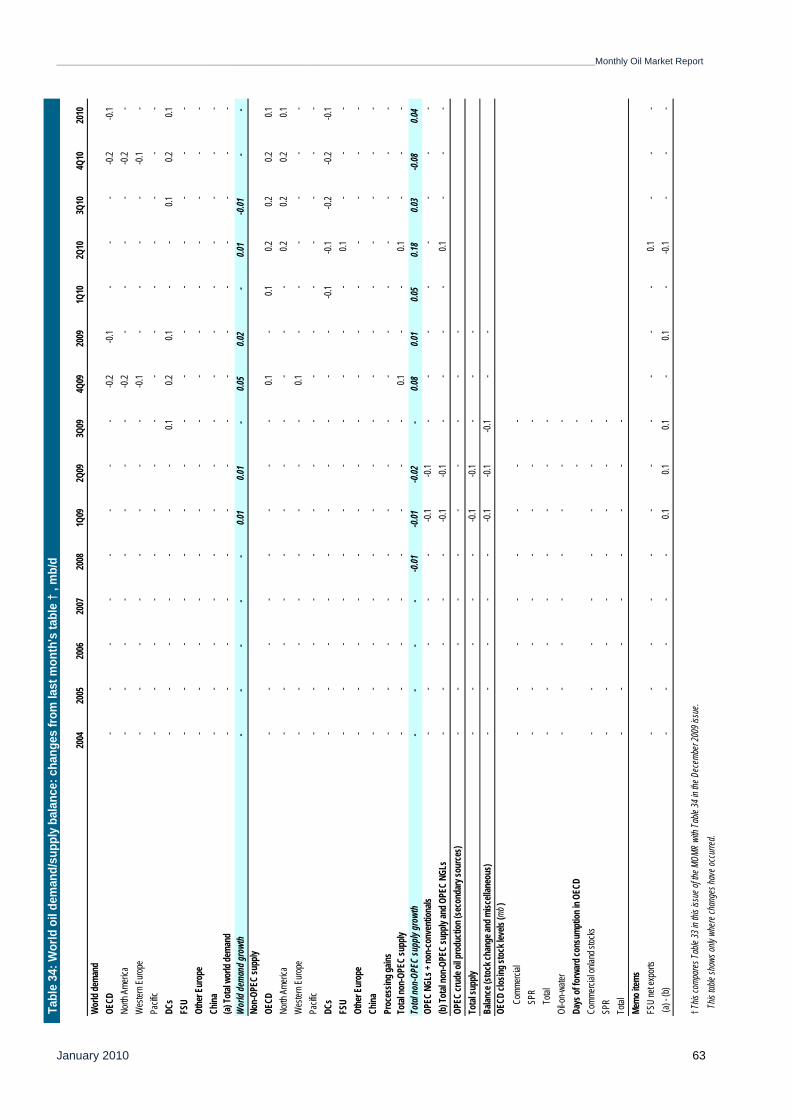
_______________________________________________________________________________________________________________________________________Monthly Oil Market Report
January 2010 63
Tabl
e 34
: Wor
ld o
il de
man
d/su
pply
bal
ance
: cha
nges
from
last
mon
th's
tabl
e †
, mb/
d
2004
2005
2006
2007
2008
1Q09
2Q09
3Q09
4Q09
2009
1Q10
2Q10
3Q10
4Q10
2010
Wor
ld de
mand
OECD
--
--
--
--
-0.2
-0.1
--
--0.
2-0.
1No
rth A
meric
a-
--
--
--
--0.
2-
--
--0.
2-
Wes
tern E
urope
--
--
--
--
-0.1
--
--
-0.1
-Pa
cific
--
--
--
--
--
--
--
-DC
s-
--
--
--
0.10.2
0.1-
-0.1
0.20.1
FSU
--
--
--
--
--
--
--
-Ot
her E
urop
e-
--
--
--
--
--
--
--
China
--
--
--
--
--
--
--
-(a)
Total
wor
ld de
mand
--
--
--
--
--
--
--
-W
orld
dema
nd gr
owth
--
--
-0.0
10.0
1-
0.05
0.02
-0.0
1-0.
01-
-No
n-OP
EC su
pply
OECD
--
--
--
--
0.1-
0.10.2
0.20.2
0.1No
rth A
meric
a-
--
--
--
--
--
0.20.2
0.20.1
Wes
tern E
urope
--
--
--
--
0.1-
--
--
-Pa
cific
--
--
--
--
--
--
--
-DC
s-
--
--
--
--
--0.
1-0.
1-0.
2-0.
2-0.
1FS
U-
--
--
--
--
--
0.1-
--
Othe
r Eur
ope
--
--
--
--
--
--
--
-Ch
ina-
--
--
--
--
--
--
--
Proc
essin
g gain
s-
--
--
--
--
--
--
--
Total
non-
OPEC
supp
ly-
--
--
--
-0.1
--
0.1-
--
Total
non-
OPEC
supp
ly gr
owth
--
--
-0.01
-0.01
-0.02
-0.0
80.0
10.0
50.1
80.0
3-0.
080.0
4OP
EC N
GLs +
non-
conv
entio
nals
--
--
--0.
1-0.
1-
--
--
--
-(b
) Tot
al no
n-OP
EC su
pply
and O
PEC
NGLs
--
--
--0.
1-0.
1-
--
-0.1
--
-OP
EC cr
ude o
il pro
ducti
on (s
econ
dary
sour
ces)
--
--
--
--
--
Total
supp
ly-
--
--
-0.1
-0.1
--
-Ba
lance
(sto
ck ch
ange
and m
iscell
aneo
us)
--
--
--0.
1-0.
1-0.
1-
-OE
CD cl
osing
stoc
k lev
els (m
b )
Com
merci
al-
--
--
--
-
SPR
--
--
--
--
To
tal-
--
--
--
-Oi
l-on-w
ater
--
--
--
--
Days
of fo
rwar
d con
sump
tion i
n OEC
D-
-Co
mmerc
ial on
land s
tocks
--
--
--
--
SPR
--
--
--
--
Total
--
--
--
--
Memo
items
FSU
net e
xport
s-
--
--
--
--
--
0.1-
--
(a) -
(b)
-
--
--
0.10.1
0.1-
0.1-
-0.1
--
-
† This
comp
ares
Table
33 in
this
issue
of th
e MOM
R wi
th Ta
ble 34
in th
e Dec
embe
r 200
9 iss
ue.
This
table
show
s only
whe
re ch
ange
s hav
e occ
urre
d.

Monthly Oil Market Report________________________________________________________________________________________________________________________________________
January 2010 64
2001
2002
2003
2004
2005
2006
2007
2008
1Q05
2Q05
3Q05
4Q05
1Q06
2Q06
3Q06
4Q06
1Q07
2Q07
3Q07
4Q07
1Q08
2Q08
3Q08
4Q08
1Q09
2Q09
3Q09
Closin
g stoc
k level
s mb
OECD
onland
comme
rcial
2,630
2,473
2,511
2,538
2,585
2,667
2,566
2,701
2,533
2,612
2,627
2,585
2,585
2,648
2,760
2,667
2,598
2,658
2,650
2,566
2,572
2,605
2,658
2,701
2,747
2,760
2,771
North A
merica
1,262
1,175
1,161
1,193
1,257
1,277
1,229
1,301
1,201
1,275
1,254
1,257
1,240
1,277
1,351
1,277
1,238
1,294
1,285
1,229
1,216
1,239
1,278
1,301
1,348
1,383
1,382
Wester
n Euro
pe925
890915
915934
962930
992942
915942
934937
935948
962941
936932
930961
957949
992992
976969
OECD
Pacific
443408
435430
394429
407407
389422
432394
408436
461429
420428
432407
394409
431407
408401
419
OECD
SPR
1,288
1,347
1,411
1,450
1,487
1,499
1,524
1,527
1,462
1,494
1,494
1,487
1,487
1,493
1,495
1,499
1,507
1,506
1,520
1,524
1,529
1,526
1,522
1,527
1,547
1,561
1,564
North A
merica
552601
640678
687691
699704
690698
696687
688690
690691
691692
695699
702708
704704
715726
727
Wester
n Euro
pe356
357374
377407
412421
416376
401405
407407
411412
412415
413423
421423
414414
416424
427429
OECD
Pacific
380389
396396
393396
404406
396395
393393
392393
393396
401401
403404
404404
403406
408408
408
OECD
total
3,918
3,820
3,921
3,988
4,072
4,166
4,090
4,228
3,995
4,106
4,121
4,072
4,072
4,141
4,255
4,166
4,106
4,164
4,170
4,090
4,101
4,131
4,180
4,228
4,294
4,321
4,334
Oil-on-
water
830815
882905
954919
951967
931932
925954
962975
974919
919895
920951
934918
886967
900902
871
Days o
f forwa
rd cons
umptio
n in OE
CD
OECD
onland
comme
rcial
5551
5151
5254
5459
5253
5251
5454
5554
5454
5352
5456
5658
6261
60
North A
merica
5248
4647
5050
5156
4750
4950
4950
5350
4951
5150
5053
5355
5959
59
Wester
n Euro
pe60
5859
5860
6361
6761
5860
5861
6060
6363
6159
6164
6262
6770
6665
OECD
Pacific
5247
5150
4751
5053
4852
4943
5255
5348
5354
4946
5054
5450
5655
53
OECD
SPR
2728
2929
3030
3233
3030
3029
3130
3030
3131
3031
3233
3233
3534
34
North A
merica
2324
2526
2727
2930
2727
2727
2727
2727
2727
2728
2930
2930
3131
31
Wester
n Euro
pe23
2324
2426
2727
2825
2626
2527
2626
2728
2727
2728
2727
2830
2929
OECD
Pacific
4545
4646
4647
5053
4949
4542
5050
4544
5151
4645
5154
5150
5656
52
OECD
total
8279
7980
8285
8693
8283
8280
8484
8584
8585
8483
8789
8891
9795
94
n.a. No
t availa
ble.
Table
35: O
ECD o
il stoc
ks an
d oil o
n wate
r at th
e end
of pe
riod

_______________________________________________________________________________________________________________________________________Monthly Oil Market Report
January 2010 65
Ch
ange
Chan
geCh
ange
Chan
ge20
0420
0520
0620
0707
/061Q
082Q
083Q
084Q
0820
0808
/071Q
092Q
093Q
094Q
0920
09.00
09/08
1Q10
2Q10
3Q10
4Q10
2010
.0010
/09
USA
7.65
7.34
7.36
7.50
0.14
7.64
7.75
7.20
7.42
7.50
0.00
7.81
7.94
8.10
8.17
8.01
0.51
8.13
8.11
8.12
8.26
8.16
0.15
Cana
da3.
073.
033.
203.
320.
123.
303.
123.
303.
283.
25-0
.07
3.30
3.07
3.14
3.15
3.16
-0.0
93.
243.
263.
223.
313.
260.
09M
exico
3.83
3.77
3.69
3.49
-0.2
13.
293.
183.
133.
093.
17-0
.31
3.04
2.97
2.94
2.94
2.98
-0.2
02.
912.
852.
802.
782.
83-0
.14
North
Am
erica
14.56
14.14
14.24
14.30
0.06
14.22
14.05
13.6
313
.8013
.92-0
.3814
.1613
.9814
.1814
.27
14.15
0.22
14.28
14.22
14.15
14.35
14.2
50.1
0No
rway
3.19
2.97
2.78
2.56
-0.2
22.
512.
392.
382.
542.
45-0
.10
2.52
2.20
2.28
2.38
2.34
-0.1
12.
322.
212.
112.
262.
22-0
.12
UK2.
101.
891.
711.
69-0
.02
1.66
1.65
1.41
1.58
1.57
-0.1
11.
631.
561.
271.
501.
49-0
.09
1.43
1.37
1.30
1.34
1.36
-0.1
3De
nmar
k0.
390.
380.
340.
31-0
.04
0.29
0.29
0.27
0.28
0.28
-0.0
20.
280.
270.
270.
260.
27-0
.01
0.27
0.26
0.25
0.25
0.26
-0.0
1Ot
her W
este
rn E
urop
e0.
500.
510.
540.
680.
150.
720.
730.
750.
740.
740.
050.
680.
670.
670.
680.
67-0
.06
0.68
0.68
0.68
0.68
0.68
0.01
Wes
tern
Eur
ope
6.18
5.74
5.37
5.23
-0.13
5.18
5.05
4.82
5.15
5.05
-0.19
5.11
4.70
4.48
4.82
4.77
-0.27
4.69
4.52
4.34
4.53
4.52
-0.26
Austr
alia
0.52
0.53
0.51
0.53
0.02
0.47
0.53
0.55
0.58
0.53
0.01
0.55
0.52
0.56
0.55
0.54
0.01
0.54
0.53
0.55
0.57
0.55
0.00
Othe
r Pac
ific0.
050.
050.
050.
080.
030.
110.
110.
100.
090.
100.
020.
090.
090.
100.
110.
100.
000.
120.
110.
110.
110.
110.
02OE
CD P
acifi
c0.5
70.5
80.5
60.6
00.0
40.5
80.6
30.6
40.6
70.6
30.0
30.6
40.6
10.6
60.6
60.6
40.0
10.6
50.6
40.6
70.6
80.6
60.0
2To
tal O
ECD
21.31
20.45
20.17
20.14
-0.03
19.98
19.74
19.0
919
.6119
.60-0
.5419
.9119
.2919
.3219
.74
19.56
-0.04
19.62
19.38
19.16
19.56
19.4
3-0
.13Br
unei
0.21
0.21
0.22
0.19
-0.0
30.
180.
150.
160.
170.
16-0
.02
0.16
0.15
0.16
0.16
0.16
-0.0
10.
150.
150.
150.
150.
15-0
.01
India
0.79
0.76
0.79
0.82
0.02
0.83
0.81
0.82
0.84
0.82
0.01
0.80
0.80
0.81
0.83
0.81
-0.0
10.
850.
870.
860.
870.
860.
05In
done
sia1.
151.
121.
071.
02-0
.04
1.05
1.04
1.04
1.03
1.04
0.02
1.02
1.02
1.02
1.03
1.02
-0.0
21.
021.
021.
011.
011.
02-0
.01
Mala
ysia
0.79
0.77
0.76
0.76
0.01
0.78
0.76
0.78
0.75
0.77
0.01
0.75
0.73
0.74
0.73
0.74
-0.0
30.
740.
730.
710.
700.
72-0
.02
Thail
and
0.25
0.30
0.32
0.34
0.02
0.34
0.35
0.36
0.36
0.35
0.02
0.36
0.37
0.36
0.35
0.36
0.01
0.35
0.35
0.35
0.35
0.35
-0.0
1Vi
etna
m0.
420.
390.
370.
35-0
.02
0.34
0.31
0.29
0.31
0.31
-0.0
40.
320.
340.
350.
340.
340.
030.
330.
320.
320.
320.
32-0
.02
Asia
othe
rs0.
180.
260.
260.
270.
000.
280.
280.
280.
280.
280.
010.
280.
280.
270.
270.
270.
000.
290.
290.
300.
300.
300.
02Ot
her A
sia3.8
13.8
03.7
93.7
4-0
.053.7
93.7
13.7
23.7
43.7
40.0
03.7
03.6
93.7
03.7
13.7
0-0
.043.7
23.7
13.6
93.6
93.7
00.0
0Ar
gent
ina0.
800.
780.
770.
76-0
.01
0.77
0.77
0.76
0.75
0.76
0.00
0.75
0.74
0.71
0.75
0.74
-0.0
20.
720.
710.
700.
690.
71-0
.03
Braz
il1.
801.
982.
112.
220.
122.
342.
392.
432.
412.
390.
172.
492.
512.
542.
572.
530.
142.
622.
672.
732.
842.
720.
19Co
lombia
0.54
0.53
0.54
0.54
0.00
0.57
0.59
0.61
0.62
0.60
0.06
0.65
0.66
0.68
0.73
0.68
0.08
0.74
0.76
0.76
0.78
0.76
0.08
Trini
dad
& To
bago
0.16
0.18
0.18
0.16
-0.0
20.
160.
150.
160.
160.
160.
000.
160.
160.
150.
150.
150.
000.
140.
140.
140.
140.
14-0
.01
L. A
mer
ica o
ther
s0.
260.
300.
260.
270.
000.
270.
270.
280.
310.
280.
010.
310.
300.
310.
310.
310.
030.
290.
290.
290.
290.
29-0
.02
Latin
Am
erica
3.55
3.77
3.86
3.95
0.09
4.10
4.17
4.23
4.25
4.19
0.23
4.36
4.38
4.39
4.51
4.41
0.22
4.51
4.57
4.63
4.73
4.61
0.20
Bahr
ain0.
210.
210.
210.
210.
000.
210.
210.
210.
210.
210.
000.
210.
210.
210.
210.
210.
000.
210.
210.
210.
210.
210.
00Om
an0.
790.
780.
750.
71-0
.04
0.74
0.74
0.76
0.78
0.76
0.05
0.78
0.79
0.83
0.82
0.81
0.05
0.82
0.84
0.84
0.84
0.83
0.02
Syria
0.49
0.45
0.44
0.42
-0.0
20.
410.
400.
400.
390.
40-0
.02
0.38
0.37
0.36
0.36
0.37
-0.0
30.
360.
350.
340.
340.
35-0
.02
Yem
en0.
410.
410.
370.
34-0
.04
0.31
0.31
0.30
0.30
0.31
-0.0
30.
280.
270.
270.
260.
27-0
.03
0.26
0.25
0.25
0.24
0.25
-0.0
2Mi
ddle
East
1.90
1.85
1.76
1.67
-0.09
1.67
1.66
1.67
1.67
1.67
0.00
1.65
1.65
1.67
1.65
1.66
-0.01
1.64
1.64
1.63
1.62
1.64
-0.02
Chad
0.16
0.18
0.16
0.15
-0.0
10.
150.
150.
150.
150.
150.
000.
140.
140.
140.
140.
14-0
.01
0.13
0.12
0.12
0.11
0.12
-0.0
2Co
ngo
0.24
0.24
0.25
0.24
0.00
0.26
0.26
0.26
0.26
0.26
0.02
0.26
0.27
0.27
0.27
0.27
0.01
0.27
0.28
0.27
0.27
0.27
0.01
Egyp
t0.
710.
700.
670.
670.
000.
680.
680.
690.
700.
690.
020.
700.
690.
680.
660.
68-0
.01
0.68
0.67
0.66
0.65
0.67
-0.0
2Eq
uato
rial G
uinea
0.30
0.36
0.37
0.37
0.00
0.38
0.38
0.38
0.38
0.38
0.01
0.37
0.36
0.35
0.34
0.36
-0.0
20.
350.
350.
340.
340.
34-0
.01
Gabo
n0.
250.
250.
250.
250.
000.
240.
240.
250.
250.
24-0
.01
0.26
0.26
0.27
0.27
0.26
0.02
0.27
0.27
0.28
0.27
0.27
0.01
Sout
h Af
rica
0.19
0.19
0.19
0.18
-0.0
10.
170.
170.
170.
170.
17-0
.01
0.17
0.17
0.17
0.15
0.17
0.00
0.15
0.15
0.15
0.15
0.15
-0.0
2Su
dan
0.30
0.34
0.40
0.50
0.10
0.50
0.49
0.47
0.44
0.48
-0.0
20.
460.
480.
470.
470.
47-0
.01
0.47
0.48
0.48
0.47
0.48
0.01
Afric
a ot
her
0.21
0.25
0.32
0.35
0.03
0.38
0.38
0.38
0.38
0.38
0.03
0.38
0.37
0.36
0.35
0.36
-0.0
10.
360.
360.
380.
410.
380.
01Af
rica
2.36
2.52
2.60
2.71
0.11
2.75
2.76
2.74
2.73
2.74
0.04
2.73
2.73
2.72
2.67
2.71
-0.03
2.68
2.68
2.68
2.66
2.68
-0.03
Tota
l DCs
11.63
11.93
12.02
12.07
0.05
12.32
12.29
12.3
612
.3912
.340.2
712
.4412
.4412
.4812
.54
12.48
0.13
12.56
12.60
12.64
12.71
12.6
30.1
5FS
U11
.1411
.5512
.0212
.520.5
012
.6212
.6712
.46
12.49
12.56
0.04
12.64
12.90
13.00
13.1
912
.930.3
713
.2013
.2113
.1713
.2913
.22
0.28
Rus
sia9.
199.
449.
659.
870.
229.
789.
749.
819.
809.
78-0
.08
9.78
9.88
9.97
10.0
79.
920.
1410
.04
10.0
09.
959.
919.
980.
05 K
azak
hsta
n1.
181.
231.
301.
350.
051.
421.
441.
331.
471.
410.
061.
481.
511.
551.
621.
540.
121.
621.
621.
591.
671.
630.
09 A
zerb
aijan
0.31
0.44
0.65
0.86
0.21
0.96
1.03
0.85
0.78
0.91
0.04
0.94
1.08
1.05
1.07
1.03
0.13
1.09
1.13
1.17
1.23
1.16
0.12
FSU
oth
ers
0.47
0.44
0.42
0.44
0.02
0.46
0.46
0.46
0.45
0.46
0.02
0.44
0.44
0.44
0.43
0.44
-0.0
20.
450.
450.
460.
470.
460.
02Ot
her E
urop
e0.
170.
160.
150.
150.
000.
150.
150.
140.
140.
15-0
.01
0.14
0.13
0.14
0.14
0.14
-0.0
10.
140.
140.
140.
140.
140.
00Ch
ina3.
503.
643.
693.
770.
073.
823.
883.
853.
853.
850.
083.
803.
863.
893.
883.
860.
013.
913.
883.
943.
933.
910.
05No
n-OP
EC p
rodu
ctio
n47
.7547
.7348
.0648
.650.6
048
.8948
.7247
.91
48.49
48.50
-0.16
48.94
48.62
48.83
49.5
048
.970.4
749
.4349
.2149
.0449
.6249
.33
0.35
Proc
essin
g gain
s1.
831.
861.
901.
920.
021.
951.
951.
951.
951.
950.
031.
981.
981.
981.
981.
980.
031.
981.
981.
981.
981.
980.
00
Non-
OPEC
supp
ly49
.5849
.5949
.9650
.580.6
250
.8450
.6749
.86
50.44
50.45
-0.13
50.92
50.60
50.81
51.4
950
.960.5
151
.4251
.1951
.0351
.6151
.31
0.35
OPEC
NGL
3.54
3.74
3.76
3.95
0.19
4.13
4.23
4.26
4.25
4.22
0.27
4.39
4.47
4.74
4.84
4.61
0.39
4.92
5.09
5.20
5.33
5.14
0.53
OPEC
Non
-con
vent
ional
0.17
0.16
0.14
0.08
-0.0
50.
110.
110.
110.
110.
110.
020.
110.
110.
110.
110.
110.
000.
110.
110.
110.
130.
110.
01OP
EC (N
GL+N
CF)
3.71
3.89
3.89
4.03
0.14
4.24
4.34
4.36
4.36
4.32
0.29
4.49
4.58
4.84
4.95
4.72
0.39
5.03
5.19
5.31
5.46
5.25
0.53
Non-
OPEC
&
OPEC
(NGL
+NCF
)53
.2953
.4953
.8554
.610.7
655
.0755
.0154
.22
54.79
54.77
0.16
55.41
55.18
55.66
56.4
355
.670.9
056
.4456
.3956
.3357
.0656
.56
0.88
Note
s: T
otals
may
not
add
up
due
to in
depe
nden
t rou
nding
. Ind
ones
ia ha
s bee
n inc
luded
in N
on-O
PEC
supp
ly fo
r com
paris
on p
urpo
se.
Tabl
e 36
: Non
-OPE
C s
uppl
y an
d O
PEC
nat
ural
gas
liqu
ids,
mb/
d
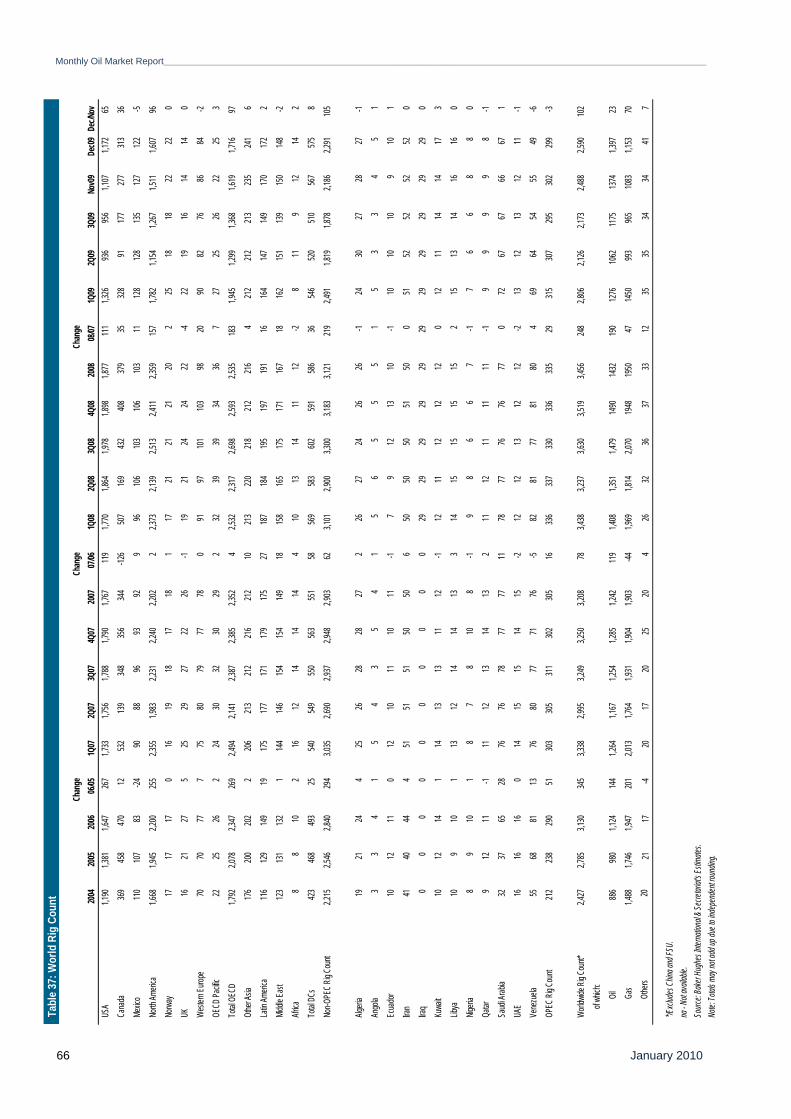
Monthly Oil Market Report________________________________________________________________________________________________________________________________________
January 2010 66
Chan
geCh
ange
Chan
ge20
0420
0520
0606
/051Q
072Q
073Q
074Q
0720
0707
/061Q
082Q
083Q
084Q
0820
0808
/071Q
092Q
093Q
09 No
v09
Dec0
9De
c/Nov
USA
1,190
1,381
1,647
267
1,733
1,756
1,788
1,790
1,767
119
1,770
1,864
1,978
1,898
1,877
111
1,326
936
956
1,107
1,172
65Ca
nada
369
458
470
1253
213
934
835
634
4-12
650
716
943
240
837
935
328
9117
727
731
336
Mexic
o11
010
783
-2490
8896
9392
996
106
103
106
103
1112
812
813
512
712
2-5
North
Ameri
ca1,6
681,9
452,2
0025
52,3
551,9
832,2
312,2
402,2
022
2,373
2,139
2,513
2,411
2,359
157
1,782
1,154
1,267
1,511
1,607
96No
rway
1717
170
1619
1817
181
1721
2121
202
2518
1822
220
UK16
2127
525
2927
2226
-119
2124
2422
-422
1916
1414
0We
stern
Europ
e70
7077
775
8079
7778
091
9710
110
398
2090
8276
8684
-2OE
CD Pa
cific
2225
262
2430
3230
292
3239
3934
367
2725
2622
253
Total
OEC
D1,7
922,0
782,3
4726
92,4
942,1
412,3
872,3
852,3
524
2,532
2,317
2,698
2,593
2,535
183
1,945
1,299
1,368
1,619
1,716
97Ot
her A
sia17
620
020
22
206
213
212
216
212
1021
322
021
821
221
64
212
212
213
235
241
6La
tin Am
erica
116
129
149
1917
517
717
117
917
527
187
184
195
197
191
1616
414
714
917
017
22
Midd
le Ea
st12
313
113
21
144
146
154
154
149
1815
816
517
517
116
718
162
151
139
150
148
-2Afr
ica8
810
216
1214
1414
410
1314
1112
-28
119
1214
2To
tal DC
s42
346
849
325
540
549
550
563
551
5856
958
360
259
158
636
546
520
510
567
575
8No
n-OPE
C Rig
Coun
t2,2
152,5
462,8
4029
43,0
352,6
902,9
372,9
482,9
0362
3,101
2,900
3,300
3,183
3,121
219
2,491
1,819
1,878
2,186
2,291
105
Algeri
a19
2124
425
2628
2827
226
2724
2626
-124
3027
2827
-1An
gola
33
41
54
35
41
56
55
51
53
34
51
Ecua
dor
1012
110
1210
1110
11-1
79
1213
10-1
1010
109
101
Iran
4140
444
5151
5150
506
5050
5051
500
5152
5252
520
Iraq
00
00
00
00
00
2929
2929
2929
2929
2929
290
Kuwa
it10
1214
114
1313
1112
-112
1112
1212
012
1114
1417
3Lib
ya10
910
113
1214
1413
314
1515
1515
215
1314
1616
0Nig
eria
89
101
87
810
8-1
98
66
7-1
76
68
80
Qatar
912
11-1
1112
1314
132
1112
1111
11-1
99
99
8-1
Saud
i Arab
ia32
3765
2876
7678
7777
1178
7776
7677
072
6767
6667
1UA
E16
1616
014
1515
1415
-212
1213
1212
-213
1213
1211
-1Ve
nezu
ela55
6881
1376
8077
7176
-582
8177
8180
469
6454
5549
-6OP
EC Ri
g Cou
nt21
223
829
051
303
305
311
302
305
1633
633
733
033
633
529
315
307
295
302
299
-3
World
wide R
ig Co
unt*
2,427
2,785
3,130
345
3,338
2,995
3,249
3,250
3,208
783,4
383,2
373,6
303,5
193,4
5624
82,8
062,1
262,1
732,4
882,5
9010
2
of wh
ich:
Oil
886
980
1,124
144
1,264
1,167
1,254
1,285
1,242
119
1,408
1,351
1,479
1490
1432
190
1276
1062
1175
1374
1,397
23
G
as1,4
881,7
461,9
4720
12,0
131,7
641,9
311,9
041,9
03-44
1,969
1,814
2,070
1948
1950
4714
5099
396
510
831,1
5370
Othe
rs
2021
17-4
2017
2025
204
2632
3637
3312
3535
3434
417
*/Exc
ludes
China
and F
SU.
na - N
ot av
ailable
.So
urce:
Bake
r Hug
hes I
nterna
tiona
l & Se
cretar
iat's E
stimate
s.No
te: To
tals m
ay no
t add
up du
e to i
ndep
ende
nt rou
nding
.
Tabl
e 37:
Wor
ld R
ig C
ount

_______________________________________________________________________________________________________________________________________Monthly Oil Market Report
January 2010 67
Contributors to the OPEC Monthly Oil Market Report
Editor-in-Chief Hasan M. Qabazard, Director, Research Division email: [email protected] Editor Mohammad Alipour-Jeddi, Head, Petroleum Studies Department email: [email protected] Analysts Crude Oil Price Movements and Oil Futures Market
Brahim Aklil email: [email protected]
Commodity Markets Dr. O. López-Gonzalez e-mail:[email protected]
Highlights of the World Economy
Mohamed El-Shahati email: [email protected]
Claude Clemenz email: [email protected]
Joerg Spitzy email: [email protected]
World Oil Demand Esam Al-Khalifa email: [email protected]
World Oil Supply Haidar Khadadeh email: [email protected]
Product Markets and Refinery Operations
Safar Keramati email: [email protected]
The Tanker Market and Oil Trade
Osam Abdul-Aziz email: [email protected]
Stock Movements Aziz Yahyai email: [email protected]
Technical and editorial team Aziz Yahyai email: [email protected] Douglas Linton email: [email protected]
Data services Fuad Al-Zayer, Head Data Services Department ([email protected]) Puguh Irawan ([email protected]), Ramadan Janan ([email protected]) Monika Psenner (World Economy), Hannes Windholz (Oil Trade, Product & Refinery), Pantelis Christodoulides (World Oil Demand, Stock Movements), Mouhamad Moudassir (Tanker Market), Klaus Stoeger (World Oil Supply), Sheela Kriz (Crude Oil Prices) Production, design and circulation Viveca Hameder, Hataichanok Leimlehner, Andrea Birnbach, Gabriele Berger, Evelyn Oduro-Kwateng Unless separately credited, material may be reproduced without permission, but kindly mention OPEC as source.

January 2010
OPEC Basket average priceUS$ per barrel
down $2.28 in December December 2009 74.01 November 2009 76.29 2009 61.06
up 0.08 in December December 2009 29.14 November 2009 29.06
December OPEC productionin million barrels per day, according to secondary sources
Supply and demandin million barrels per day
2009 2010World demand 84.3 World demand 85.2Non-OPEC supply 51.0 Non-OPEC supply 51.3OPEC NGLs 4.7 OPEC NGLs 5.2Difference 28.7 Difference 28.6
Totals may not add due to independent rounding.
StocksOECD commercial oil inventories rose 12.6 mb in November, to stand around 93 mb above the five-year average. Forward cover stood at 59.8 days or 5.5 days above the five-year average. Preliminary data for December shows a stock draw of 34 mb driven by the drop in US crude and products. However, the surplus with the five-year average remained above 90 mb.
World economyThe forecast for 2009 remained unchanged at minus 1.1%. For 2010, global economic growth was revised up by 0.2 percentage points to 3.1%. Slight revisions were made to both the US and China, which now stand at 1.9% and 8.8% respectively while India was increased to 6.7%.
Issued 19 January 2010. Data covers period up to the end of December 2009 unless otherwise stated.Next report to be issued on 10 February 2010.
OPECOrganization of the Petroleum Exporting Countries
Monthly Oil Market Report
Tel +43 1 21112 Fax +43 1 2164320 E-mail: [email protected] Web site: www.opec.org
Data Summary