open access compaction, permeability, and fluid flow … · open access compaction, permeability,...
TRANSCRIPT
The Open Petroleum Engineering Journal, 2010, 3, 1-13 1
1874-8341/10 2010 Bentham Open
Open Access
Compaction, Permeability, and Fluid Flow in Brent-Type Reservoirs Under Depletion and Pressure Blowdown
Øystein Pettersen*
Centre for Integrated Petroleum Research, Bergen, Norway
Abstract: Compaction-induced permeability reduction in a producing reservoir rock/soil can be significant, but neverthe-
less is often neglected or overly simplified in reservoir simulations. Provided examples show that the commonly used
compaction models in reservoir simulators are not capable of capturing the actual spatial variation of the compaction,
which generally is more complex than the simplified models predict. The only way to compute a reliable compaction state
is by rock mechanics simulation. The computing time can be considerably reduced by an accurate and efficient procedure,
which has been used to do the compaction modeling and study the effects of permeability reduction on fluid flow and
production.
Weak, moderate, and strong materials behave differently when loaded, such that large contrasts in initial permeability can
be reduced by increasing load (depletion), resulting in more homogeneous flow. It is demonstrated how this can be util-
ized to achieve better sweep efficiency, reduced water production and increased oil recovery. The effects are especially
pronounced when the pressure reduction is considerable (“pressure blowdown”). The data used are from Brent-type reser-
voirs, but the results also apply to a wider range of reservoirs.
Keywords: Compaction, permeability reduction, reservoir simulation, sandstone reservoir, material homogenization.
INTRODUCTION
All reservoirs will experience some degree of compaction when exposed to load. For most chalk, sand or sandstone reservoirs the compaction will be of significance to flow and production. This is especially noticeable when the compac-tion is accompanied by permeability reduction, which is a factor often neglected in simulation models, even though the permeability reduction can be considerable, and hence of importance to flow. Moreover, the compaction (and change in permeability) generally cannot be derived from fluid pres-sure alone, but also depends on the stress state in and around the reservoir, and interaction between the different materials that comprise the reservoir rock / soil.
This paper focuses on typical Brent reservoirs, with most of the data taken from the Gullfaks field.
The Middle Jurassic Brent Group [1] consists of an up to 300 m thick, northwards prograding succession of pro-delta, delta and delta plain deposits. It is recognizable over most of the East Shetland Basin, the northern Viking Graben and over parts of the Horda Platform to east of the Viking Graben in the North Sea. By definition the term “Brent Group” is restricted to sediments north of 60 degrees north and passes into the time equivalent Vestland Group shales north of 62 degrees north [2]. The Brent Group constitutes the most important hydrocarbon reservoir in NW Europe
*Address correspondence to this author at the Centre for Integrated
Petroleum Research, Bergen, Norway; Tel: +4755583295;
Fax: +4755588265; E-mail: [email protected]
with the majority of hydrocarbon traps occurring in rotated fault blocks, originating from the Late Jurassic rifting of the North Sea, and capped by Cretaceous deep water deposits.
The Brent Group is found in many of the main North Sea Fields, e.g. Brent, Gullfaks, Oseberg, and Statfjord.
The Gullfaks Field is located (mostly) in block 34/10 of the Norwegian sector of the North Sea, about 190 km north-west of Bergen, Norway. Water depths are 130–160 m and reservoir depth ranges from 1700 to 2400 m. The field was discovered in 1978 and put on production in 1986, operated by Statoil.
Coupled rock mechanics and flow simulations are neces-sary to compute the reservoir compaction state accurately. Unfortunately, such simulations are often expensive in terms of computer time. Pettersen [3] and Pettersen and Kristian-sen [4] presented a procedure that allows for accurate com-paction computation while keeping the number of rock me-chanics simulations at a minimum. This method has been used to study compaction and permeability behavior in a depleting reservoir, and the influence on flow and produc-tion.
An important feature is that materials of different strength behave differently under depletion, and hence the initial flow pattern can be altered, noticeably by redirection of fluid from high permeability zones to neighboring, ini-tially poorer sands.
For oil fields approaching end-of-field-history it has been debated whether a final pressure blowdown (considerable reduction of reservoir pressure) will enhance production. Mostly such considerations have been targeted towards
2 The Open Petroleum Engineering Journal, 2010, Volume 3 Øystein Pettersen
chemical processes and EOR (Enhanced Oil Recovery) (see e.g. [5]). In the present paper focus is put on rock mechanics effects of such a blowdown.
The arguments and results presented here apply primarily to reservoirs containing weak or moderate strength rock / soil.
THEORY AND EXPERIMENTAL RESULTS
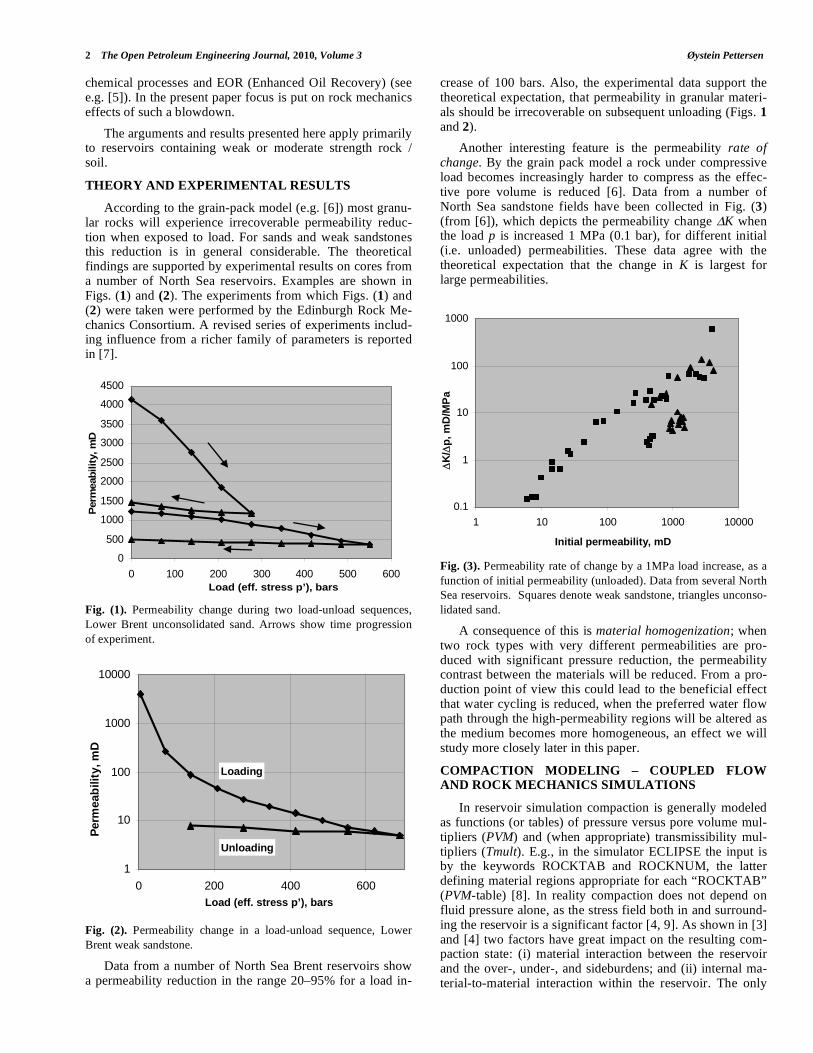
According to the grain-pack model (e.g. [6]) most granu-lar rocks will experience irrecoverable permeability reduc-tion when exposed to load. For sands and weak sandstones this reduction is in general considerable. The theoretical findings are supported by experimental results on cores from a number of North Sea reservoirs. Examples are shown in Figs. (1) and (2). The experiments from which Figs. (1) and (2) were taken were performed by the Edinburgh Rock Me-chanics Consortium. A revised series of experiments includ-ing influence from a richer family of parameters is reported in [7].
Fig. (1). Permeability change during two load-unload sequences,
Lower Brent unconsolidated sand. Arrows show time progression
of experiment.
Fig. (2). Permeability change in a load-unload sequence, Lower
Brent weak sandstone.
Data from a number of North Sea Brent reservoirs show a permeability reduction in the range 20–95% for a load in-
crease of 100 bars. Also, the experimental data support the theoretical expectation, that permeability in granular materi-als should be irrecoverable on subsequent unloading (Figs. 1 and 2).
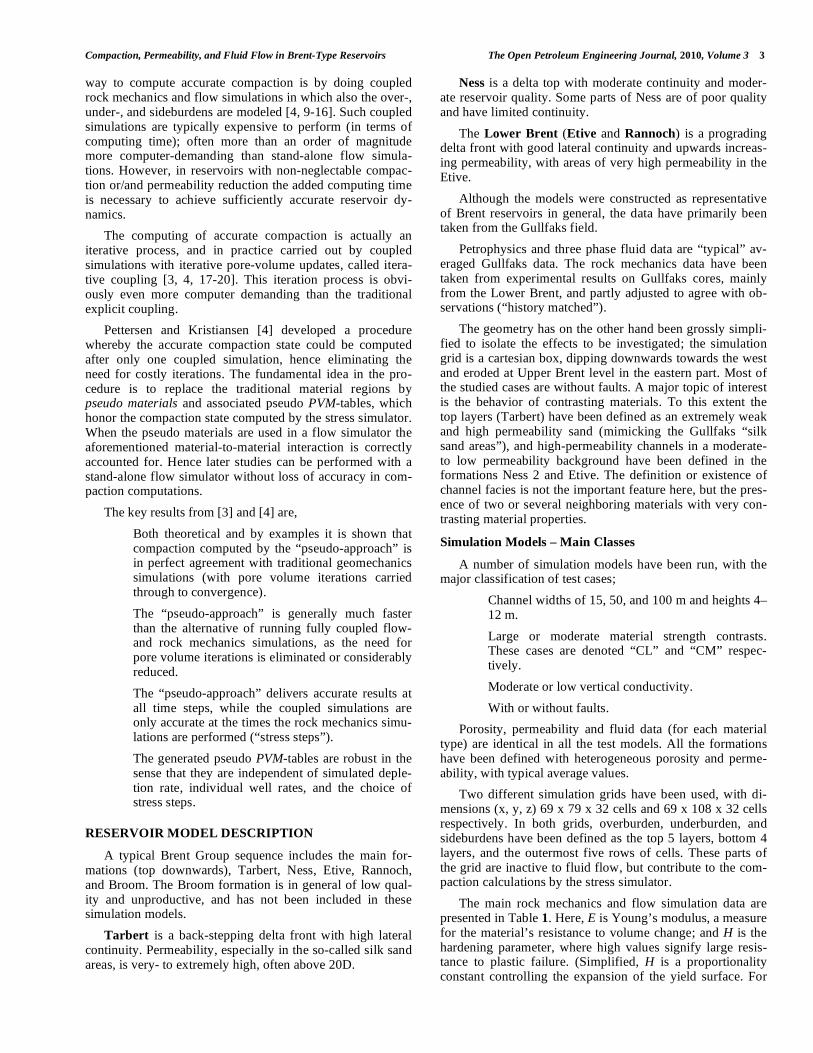
Another interesting feature is the permeability rate of change. By the grain pack model a rock under compressive load becomes increasingly harder to compress as the effec-tive pore volume is reduced [6]. Data from a number of North Sea sandstone fields have been collected in Fig. (3) (from [6]), which depicts the permeability change K when the load p is increased 1 MPa (0.1 bar), for different initial (i.e. unloaded) permeabilities. These data agree with the theoretical expectation that the change in K is largest for large permeabilities.
Fig. (3). Permeability rate of change by a 1MPa load increase, as a
function of initial permeability (unloaded). Data from several North
Sea reservoirs. Squares denote weak sandstone, triangles unconso-
lidated sand.
A consequence of this is material homogenization; when two rock types with very different permeabilities are pro-duced with significant pressure reduction, the permeability contrast between the materials will be reduced. From a pro-duction point of view this could lead to the beneficial effect that water cycling is reduced, when the preferred water flow path through the high-permeability regions will be altered as the medium becomes more homogeneous, an effect we will study more closely later in this paper.
COMPACTION MODELING – COUPLED FLOW AND ROCK MECHANICS SIMULATIONS
In reservoir simulation compaction is generally modeled as functions (or tables) of pressure versus pore volume mul-tipliers (PVM) and (when appropriate) transmissibility mul-tipliers (Tmult). E.g., in the simulator ECLIPSE the input is by the keywords ROCKTAB and ROCKNUM, the latter defining material regions appropriate for each “ROCKTAB” (PVM-table) [8]. In reality compaction does not depend on fluid pressure alone, as the stress field both in and surround-ing the reservoir is a significant factor [4, 9]. As shown in [3] and [4] two factors have great impact on the resulting com-paction state: (i) material interaction between the reservoir and the over-, under-, and sideburdens; and (ii) internal ma-terial-to-material interaction within the reservoir. The only
0
500
1000
1500
2000
2500
3000
3500
4000
4500
0 100 200 300 400 500 600Load (eff. stress p’), bars
Per
mea
bilit
y, m
D
1
10
100
1000
10000
0 200 400 600
Per
mea
bili
ty, m
D
Load (eff. stress p’), bars
Loading
Unloading
0.1
1
10
100
1000
1 10 100 1000 10000
K
/p
, mD
/MP
a
Initial permeability, mD
Compaction, Permeability, and Fluid Flow in Brent-Type Reservoirs The Open Petroleum Engineering Journal, 2010, Volume 3 3
way to compute accurate compaction is by doing coupled rock mechanics and flow simulations in which also the over-, under-, and sideburdens are modeled [4, 9-16]. Such coupled simulations are typically expensive to perform (in terms of computing time); often more than an order of magnitude more computer-demanding than stand-alone flow simula-tions. However, in reservoirs with non-neglectable compac-tion or/and permeability reduction the added computing time is necessary to achieve sufficiently accurate reservoir dy-namics.
The computing of accurate compaction is actually an iterative process, and in practice carried out by coupled simulations with iterative pore-volume updates, called itera-tive coupling [3, 4, 17-20]. This iteration process is obvi-ously even more computer demanding than the traditional explicit coupling.
Pettersen and Kristiansen [4] developed a procedure whereby the accurate compaction state could be computed after only one coupled simulation, hence eliminating the need for costly iterations. The fundamental idea in the pro-cedure is to replace the traditional material regions by pseudo materials and associated pseudo PVM-tables, which honor the compaction state computed by the stress simulator. When the pseudo materials are used in a flow simulator the aforementioned material-to-material interaction is correctly accounted for. Hence later studies can be performed with a stand-alone flow simulator without loss of accuracy in com-paction computations.
The key results from [3] and [4] are,
• Both theoretical and by examples it is shown that compaction computed by the “pseudo-approach” is in perfect agreement with traditional geomechanics simulations (with pore volume iterations carried through to convergence).
• The “pseudo-approach” is generally much faster than the alternative of running fully coupled flow- and rock mechanics simulations, as the need for pore volume iterations is eliminated or considerably reduced.
• The “pseudo-approach” delivers accurate results at all time steps, while the coupled simulations are only accurate at the times the rock mechanics simu-lations are performed (“stress steps”).
• The generated pseudo PVM-tables are robust in the sense that they are independent of simulated deple-tion rate, individual well rates, and the choice of stress steps.
RESERVOIR MODEL DESCRIPTION
A typical Brent Group sequence includes the main for-mations (top downwards), Tarbert, Ness, Etive, Rannoch, and Broom. The Broom formation is in general of low qual-ity and unproductive, and has not been included in these simulation models.
Tarbert is a back-stepping delta front with high lateral continuity. Permeability, especially in the so-called silk sand areas, is very- to extremely high, often above 20D.
Ness is a delta top with moderate continuity and moder-ate reservoir quality. Some parts of Ness are of poor quality and have limited continuity.
The Lower Brent (Etive and Rannoch) is a prograding delta front with good lateral continuity and upwards increas-ing permeability, with areas of very high permeability in the Etive.
Although the models were constructed as representative of Brent reservoirs in general, the data have primarily been taken from the Gullfaks field.
Petrophysics and three phase fluid data are “typical” av-eraged Gullfaks data. The rock mechanics data have been taken from experimental results on Gullfaks cores, mainly from the Lower Brent, and partly adjusted to agree with ob-servations (“history matched”).
The geometry has on the other hand been grossly simpli-fied to isolate the effects to be investigated; the simulation grid is a cartesian box, dipping downwards towards the west and eroded at Upper Brent level in the eastern part. Most of the studied cases are without faults. A major topic of interest is the behavior of contrasting materials. To this extent the top layers (Tarbert) have been defined as an extremely weak and high permeability sand (mimicking the Gullfaks “silk sand areas”), and high-permeability channels in a moderate- to low permeability background have been defined in the formations Ness 2 and Etive. The definition or existence of channel facies is not the important feature here, but the pres-ence of two or several neighboring materials with very con-trasting material properties.
Simulation Models – Main Classes
A number of simulation models have been run, with the major classification of test cases;
• Channel widths of 15, 50, and 100 m and heights 4–12 m.
• Large or moderate material strength contrasts. These cases are denoted “CL” and “CM” respec-tively.
• Moderate or low vertical conductivity.
• With or without faults.
Porosity, permeability and fluid data (for each material type) are identical in all the test models. All the formations have been defined with heterogeneous porosity and perme-ability, with typical average values.
Two different simulation grids have been used, with di-mensions (x, y, z) 69 x 79 x 32 cells and 69 x 108 x 32 cells respectively. In both grids, overburden, underburden, and sideburdens have been defined as the top 5 layers, bottom 4 layers, and the outermost five rows of cells. These parts of the grid are inactive to fluid flow, but contribute to the com-paction calculations by the stress simulator.
The main rock mechanics and flow simulation data are presented in Table 1. Here, E is Young’s modulus, a measure for the material’s resistance to volume change; and H is the hardening parameter, where high values signify large resis-tance to plastic failure. (Simplified, H is a proportionality constant controlling the expansion of the yield surface. For
4 The Open Petroleum Engineering Journal, 2010, Volume 3 Øystein Pettersen
details, see [6] or [21]). All materials have been defined by the Cam Clay model (Critical State Theory), except the over, under-, and sideburdens, where the Mohr-Coulomb model has been used [6, 21].
Production Scheme
Wells:
5 injectors downdip (west) in the water zone.
4 Upper Brent producers near the western edge of the erosion zone.
4 Lower Brent producers at the eastern edge of the reser-voir.
(Well locations are shown on several of the cross-section figures, Figs. 6, 7, 12, 13, and 15).
The producers produce at target liquid rate, and the injec-tors inject at target reservoir voidage (a fraction of reservoir volume liquid produced is replaced by injection water).
This production strategy was chosen so that results from different runs would be easily comparable.
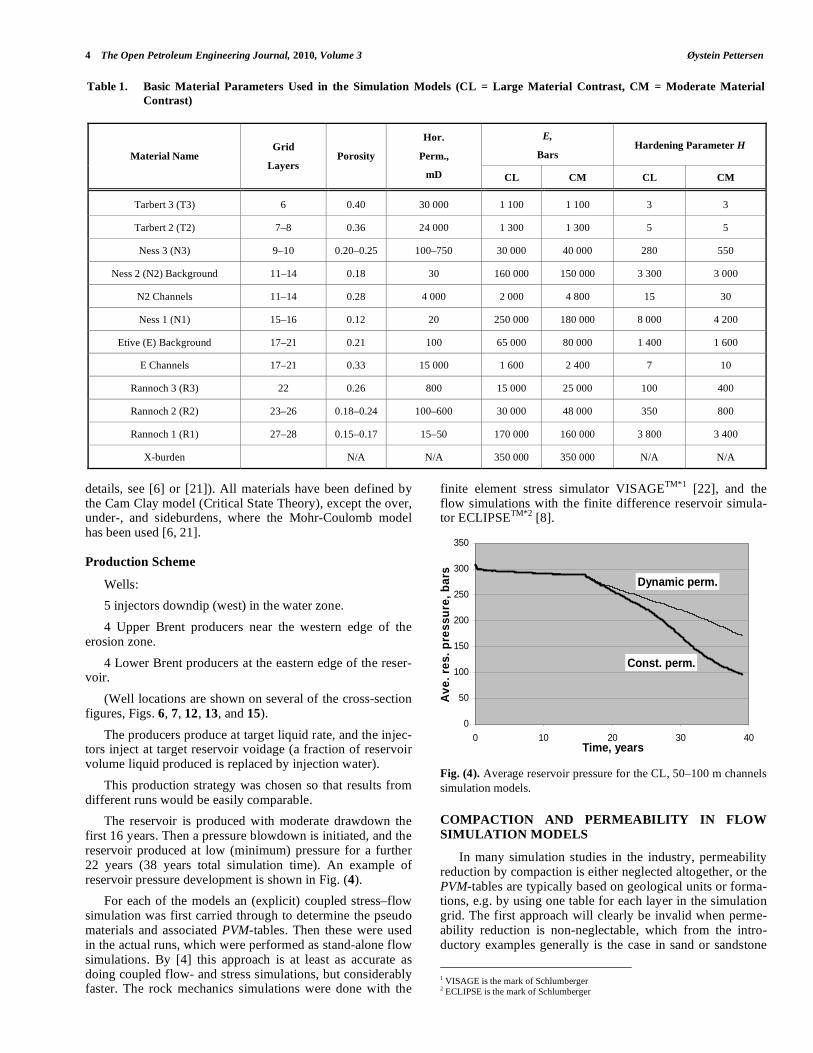
The reservoir is produced with moderate drawdown the first 16 years. Then a pressure blowdown is initiated, and the reservoir produced at low (minimum) pressure for a further 22 years (38 years total simulation time). An example of reservoir pressure development is shown in Fig. (4).
For each of the models an (explicit) coupled stress–flow simulation was first carried through to determine the pseudo materials and associated PVM-tables. Then these were used in the actual runs, which were performed as stand-alone flow simulations. By [4] this approach is at least as accurate as doing coupled flow- and stress simulations, but considerably faster. The rock mechanics simulations were done with the
finite element stress simulator VISAGETM*1
[22], and the flow simulations with the finite difference reservoir simula-tor ECLIPSE
TM*2 [8].
Fig. (4). Average reservoir pressure for the CL, 50–100 m channels
simulation models.
COMPACTION AND PERMEABILITY IN FLOW
SIMULATION MODELS
In many simulation studies in the industry, permeability reduction by compaction is either neglected altogether, or the PVM-tables are typically based on geological units or forma-tions, e.g. by using one table for each layer in the simulation grid. The first approach will clearly be invalid when perme-ability reduction is non-neglectable, which from the intro-ductory examples generally is the case in sand or sandstone
1 VISAGE is the mark of Schlumberger 2 ECLIPSE is the mark of Schlumberger
Table 1. Basic Material Parameters Used in the Simulation Models (CL = Large Material Contrast, CM = Moderate Material
Contrast)
E,
Bars Hardening Parameter H
Material Name Grid
Layers Porosity
Hor.
Perm.,
mD CL CM CL CM
Tarbert 3 (T3) 6 0.40 30 000 1 100 1 100 3 3
Tarbert 2 (T2) 7–8 0.36 24 000 1 300 1 300 5 5
Ness 3 (N3) 9–10 0.20–0.25 100–750 30 000 40 000 280 550
Ness 2 (N2) Background 11–14 0.18 30 160 000 150 000 3 300 3 000
N2 Channels 11–14 0.28 4 000 2 000 4 800 15 30
Ness 1 (N1) 15–16 0.12 20 250 000 180 000 8 000 4 200
Etive (E) Background 17–21 0.21 100 65 000 80 000 1 400 1 600
E Channels 17–21 0.33 15 000 1 600 2 400 7 10
Rannoch 3 (R3) 22 0.26 800 15 000 25 000 100 400
Rannoch 2 (R2) 23–26 0.18–0.24 100–600 30 000 48 000 350 800
Rannoch 1 (R1) 27–28 0.15–0.17 15–50 170 000 160 000 3 800 3 400
X-burden N/A N/A 350 000 350 000 N/A N/A
0
50
100
150
200
250
300
350
0 10 20 30 40
Dynamic perm.
Const. perm.
Time, years
Av
e.
res.
pre
ssu
re,
bar
s
Compaction, Permeability, and Fluid Flow in Brent-Type Reservoirs The Open Petroleum Engineering Journal, 2010, Volume 3 5
materials. The second approach cannot account for the spa-tial variation of compaction and permeability reduction due to the boundary influence, which generally is significant. In [3] it was demonstrated that measured compaction (e.g. from uniaxial core tests) could be representative for compaction far from boundaries in the reservoir, but that other factors were more important closer to material boundaries. As an example, channels have a very limited extent compared to reservoir dimensions. Hence one may question whether “far from boundaries” ever can occur in a channel, and which PVM-tables can be appropriate for flow in channels under compaction, if any. This question is addressed in the next section.
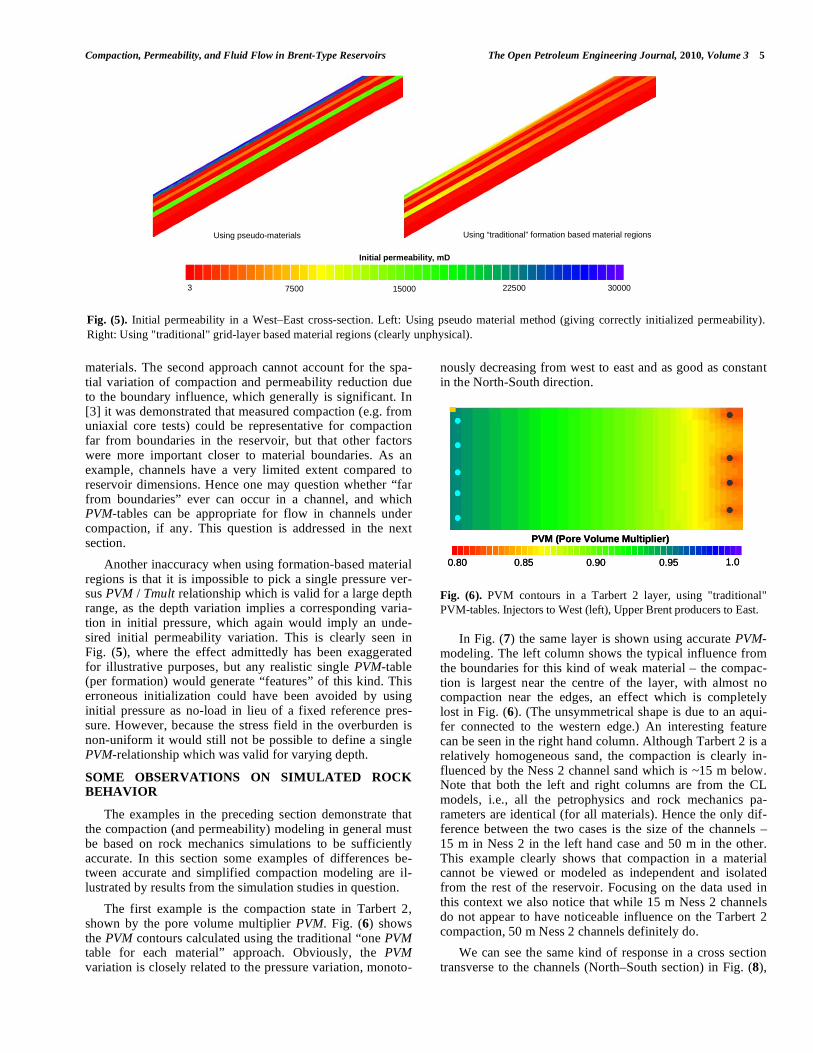
Another inaccuracy when using formation-based material regions is that it is impossible to pick a single pressure ver-sus PVM / Tmult relationship which is valid for a large depth range, as the depth variation implies a corresponding varia-tion in initial pressure, which again would imply an unde-sired initial permeability variation. This is clearly seen in Fig. (5), where the effect admittedly has been exaggerated for illustrative purposes, but any realistic single PVM-table (per formation) would generate “features” of this kind. This erroneous initialization could have been avoided by using initial pressure as no-load in lieu of a fixed reference pres-sure. However, because the stress field in the overburden is non-uniform it would still not be possible to define a single PVM-relationship which was valid for varying depth.
SOME OBSERVATIONS ON SIMULATED ROCK BEHAVIOR
The examples in the preceding section demonstrate that the compaction (and permeability) modeling in general must be based on rock mechanics simulations to be sufficiently accurate. In this section some examples of differences be-tween accurate and simplified compaction modeling are il-lustrated by results from the simulation studies in question.
The first example is the compaction state in Tarbert 2, shown by the pore volume multiplier PVM. Fig. (6) shows the PVM contours calculated using the traditional “one PVM table for each material” approach. Obviously, the PVM variation is closely related to the pressure variation, monoto-
nously decreasing from west to east and as good as constant in the North-South direction.
Fig. (6). PVM contours in a Tarbert 2 layer, using "traditional"
PVM-tables. Injectors to West (left), Upper Brent producers to East.
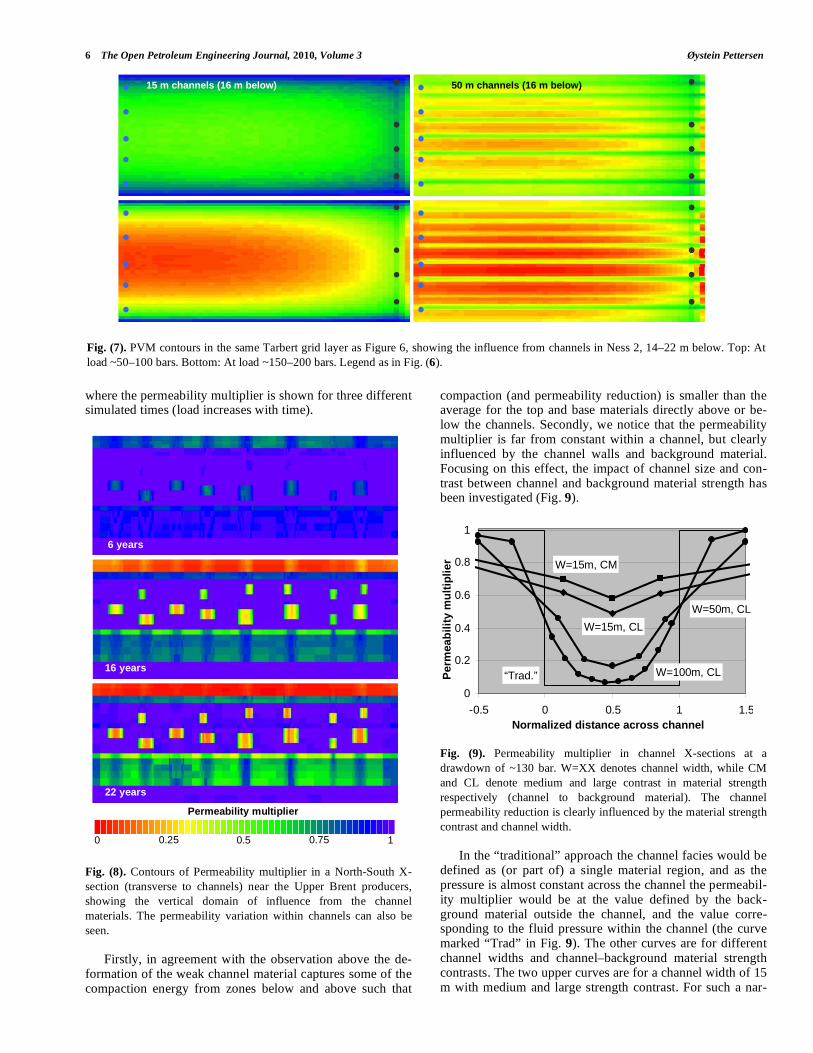
In Fig. (7) the same layer is shown using accurate PVM-modeling. The left column shows the typical influence from the boundaries for this kind of weak material – the compac-tion is largest near the centre of the layer, with almost no compaction near the edges, an effect which is completely lost in Fig. (6). (The unsymmetrical shape is due to an aqui-fer connected to the western edge.) An interesting feature can be seen in the right hand column. Although Tarbert 2 is a relatively homogeneous sand, the compaction is clearly in-fluenced by the Ness 2 channel sand which is ~15 m below. Note that both the left and right columns are from the CL models, i.e., all the petrophysics and rock mechanics pa-rameters are identical (for all materials). Hence the only dif-ference between the two cases is the size of the channels – 15 m in Ness 2 in the left hand case and 50 m in the other. This example clearly shows that compaction in a material cannot be viewed or modeled as independent and isolated from the rest of the reservoir. Focusing on the data used in this context we also notice that while 15 m Ness 2 channels do not appear to have noticeable influence on the Tarbert 2 compaction, 50 m Ness 2 channels definitely do.
We can see the same kind of response in a cross section transverse to the channels (North–South section) in Fig. (8),
Fig. (5). Initial permeability in a West–East cross-section. Left: Using pseudo material method (giving correctly initialized permeability).
Right: Using "traditional" grid-layer based material regions (clearly unphysical).
3 7500 15000 22500 30000
Initial permeability, mD
Using pseudo-materials Using “traditional” formation based material regions
0.80 0.85 0.90 0.95 1.0
PVM (Pore Volume Multiplier)
0.80 0.85 0.90 0.95 1.0
PVM (Pore Volume Multiplier)
6 The Open Petroleum Engineering Journal, 2010, Volume 3 Øystein Pettersen
where the permeability multiplier is shown for three different simulated times (load increases with time).
Fig. (8). Contours of Permeability multiplier in a North-South X-
section (transverse to channels) near the Upper Brent producers,
showing the vertical domain of influence from the channel
materials. The permeability variation within channels can also be
seen.
Firstly, in agreement with the observation above the de-formation of the weak channel material captures some of the compaction energy from zones below and above such that
compaction (and permeability reduction) is smaller than the average for the top and base materials directly above or be-low the channels. Secondly, we notice that the permeability multiplier is far from constant within a channel, but clearly influenced by the channel walls and background material. Focusing on this effect, the impact of channel size and con-trast between channel and background material strength has been investigated (Fig. 9).
Fig. (9). Permeability multiplier in channel X-sections at a
drawdown of ~130 bar. W=XX denotes channel width, while CM
and CL denote medium and large contrast in material strength
respectively (channel to background material). The channel
permeability reduction is clearly influenced by the material strength
contrast and channel width.
In the “traditional” approach the channel facies would be defined as (or part of) a single material region, and as the pressure is almost constant across the channel the permeabil-ity multiplier would be at the value defined by the back-ground material outside the channel, and the value corre-sponding to the fluid pressure within the channel (the curve marked “Trad” in Fig. 9). The other curves are for different channel widths and channel–background material strength contrasts. The two upper curves are for a channel width of 15 m with medium and large strength contrast. For such a nar-
Fig. (7). PVM contours in the same Tarbert grid layer as Figure 6, showing the influence from channels in Ness 2, 14–22 m below. Top: At
load ~50–100 bars. Bottom: At load ~150–200 bars. Legend as in Fig. (6).
15 m channels (16 m below) 50 m channels (16 m below)
6 years
16 years
22 years
0 0.5 0.75 10.25
Permeability multiplier
0
0.2
0.4
0.6
0.8
1
-0.5 0 0.5 1 1.5
Per
mea
bil
ity
mu
ltip
lier
Normalized distance across channel
W=15m, CM
W=15m, CL
W=100m, CL
W=50m, CL
“Trad.”
Compaction, Permeability, and Fluid Flow in Brent-Type Reservoirs The Open Petroleum Engineering Journal, 2010, Volume 3 7
row channel the region of influence from the channel wall boundaries comprises both a significant part of the back-ground and the entire channel, such that the channel material is only moderately compacted. The next two curves are both for large material strength contrasts, and for channel widths 50 and 100 m. The boundaries still have strong influence, and only for the 100 m channel does the permeability multi-plier approach the “theoretical” minimum near the centre of the channel.
The conclusion is that the actual compaction (and perme-ability reduction) in channels is smaller than corresponding measured values from e.g. uniaxial tests, and that these only appear near the centre of channels with sufficient width.
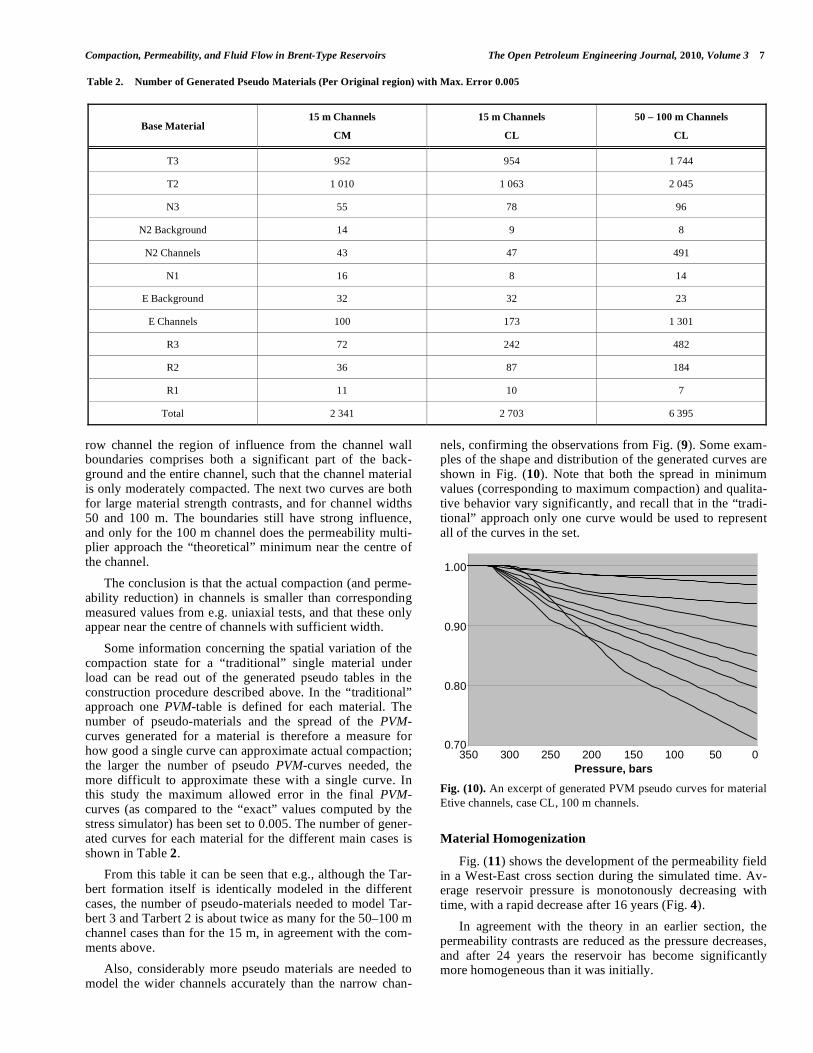
Some information concerning the spatial variation of the compaction state for a “traditional” single material under load can be read out of the generated pseudo tables in the construction procedure described above. In the “traditional” approach one PVM-table is defined for each material. The number of pseudo-materials and the spread of the PVM-curves generated for a material is therefore a measure for how good a single curve can approximate actual compaction; the larger the number of pseudo PVM-curves needed, the more difficult to approximate these with a single curve. In this study the maximum allowed error in the final PVM-curves (as compared to the “exact” values computed by the stress simulator) has been set to 0.005. The number of gener-ated curves for each material for the different main cases is shown in Table 2.
From this table it can be seen that e.g., although the Tar-bert formation itself is identically modeled in the different cases, the number of pseudo-materials needed to model Tar-bert 3 and Tarbert 2 is about twice as many for the 50–100 m channel cases than for the 15 m, in agreement with the com-ments above.
Also, considerably more pseudo materials are needed to model the wider channels accurately than the narrow chan-
nels, confirming the observations from Fig. (9). Some exam-ples of the shape and distribution of the generated curves are shown in Fig. (10). Note that both the spread in minimum values (corresponding to maximum compaction) and qualita-tive behavior vary significantly, and recall that in the “tradi-tional” approach only one curve would be used to represent all of the curves in the set.
Fig. (10). An excerpt of generated PVM pseudo curves for material
Etive channels, case CL, 100 m channels.
Material Homogenization
Fig. (11) shows the development of the permeability field in a West-East cross section during the simulated time. Av-erage reservoir pressure is monotonously decreasing with time, with a rapid decrease after 16 years (Fig. 4).
In agreement with the theory in an earlier section, the permeability contrasts are reduced as the pressure decreases, and after 24 years the reservoir has become significantly more homogeneous than it was initially.
Table 2. Number of Generated Pseudo Materials (Per Original region) with Max. Error 0.005
Base Material 15 m Channels
CM
15 m Channels
CL
50 – 100 m Channels
CL
T3 952 954 1 744
T2 1 010 1 063 2 045
N3 55 78 96
N2 Background 14 9 8
N2 Channels 43 47 491
N1 16 8 14
E Background 32 32 23
E Channels 100 173 1 301
R3 72 242 482
R2 36 87 184
R1 11 10 7
Total 2 341 2 703 6 395
350 300 250 200 150 100 50 0Pressure, bars
0.70
0.80
0.90
1.00

8 The Open Petroleum Engineering Journal, 2010, Volume 3 Øystein Pettersen
Fig. (11). Example of material homogenization. Permeability in a
West–East cross section including channels during depletion.
Pressure blowdown commenced at 16 years. (Flow direction West
to East).
CONSEQUENCES FOR (SIMULATED) FLUID FLOW
From the preceding section it should be clear that reser-voir compaction and permeability reduction is more complex than what is possible to model in flow simulators using the “traditional” procedure. In many cases the actual compaction state differs significantly from the one computed by the sim-plified model.
The question is then how great impact this has on simu-lated flow and production. In many cases the difference in simulated field production rates was not very large, whether accurate or simplified compaction modeling was used, al-though large differences were seen locally. It is therefore not obvious when the more accurate modeling is needed. Due to the way reservoir simulators work, the differences can actu-ally be larger in reality than the simulations indicate.
We are especially interested in how the homogenization influences flow. A priori, we would expect a rapid advance of the water front through the high permeability regions, Tarbert and the channels, with early water breakthrough. Thereafter, if permeability were unaltered, a large fraction of the injection water should flow through these preferred flow paths, leaving unproduced oil in the lower-permeability re-gions (“water cycling”). By homogenization the permeability in the preferred flow paths is reduced, so that the water will spread to initially non-preferred flow paths, which become competitive by the homogenization, hence resulting in less channeled flow.
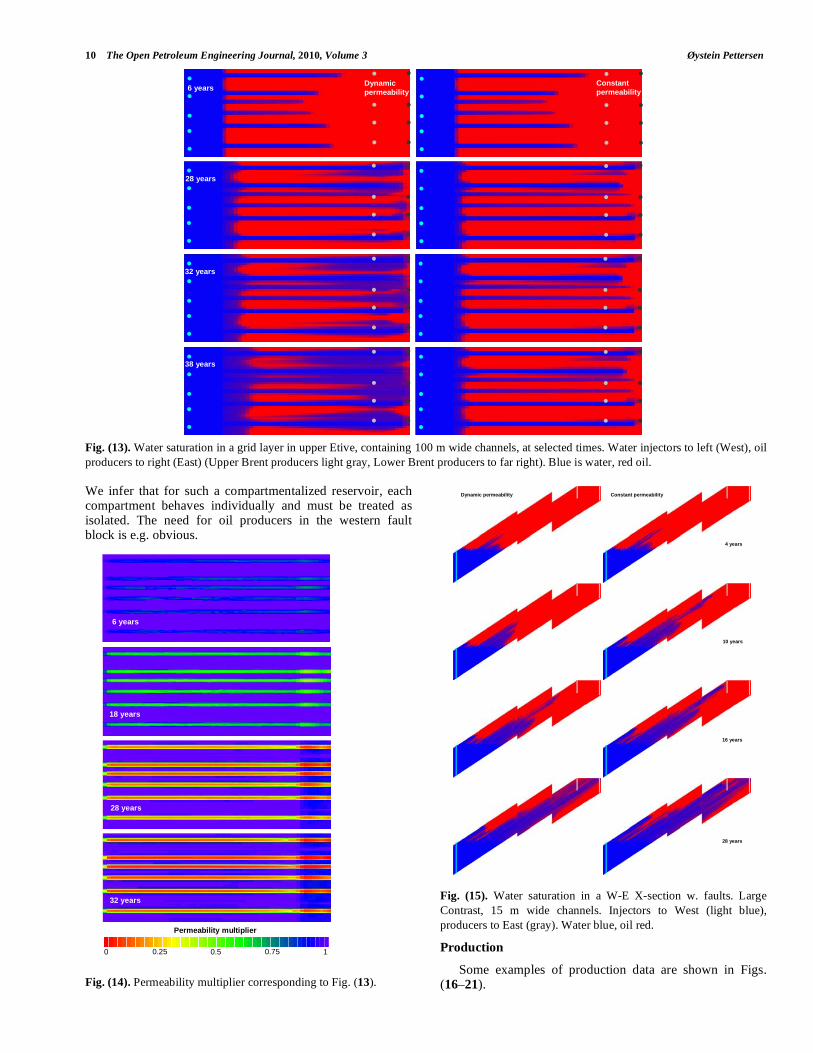
The effect of the homogenization can clearly be seen in Figs. (12) and (13). At early simulated time there is a slight difference in the water progress, because the dynamic per-meability in the channels is lower than the initial value which is used unchanged in the figures in the right hand col-umn. When the pressure has been significantly reduced, the difference between channel and background permeability is sufficiently reduced that the channels no longer form pre-ferred flow paths for the water, and the water front spreads to the background, hence improving the sweep. The effect is clearly more pronounced in the 100 m wide channels case (Fig. 13) than in the 50 m case (Fig. 12). Note also the ad-vancement of the oil-water contact in the background mate-rial which is seen in the dynamic permeability case, but not in the case with constant permeability.
The slight increase in water saturation in the background material in Fig. (12) is due to vertical flow from layers above, and does not come from the channels. In cases with better vertical conductivity this effect was clearly seen; background material water saturation increased due to water inflow from layers mostly above, and obscured the effects of the homogenization.
The permeability multipliers corresponding to Fig. (13) are shown in Fig. (14). Note the difference between channels and background, and also the significant change after pres-sure blowdown is initiated.
The case with 15 m wide channels and large material contrast was also simulated with two faults present. An ex-ample of resulting water progress is shown in Fig. (15). The consequences of the homogenization are apparent, and water channeling is clearly reduced by it. Not surprising, the total oil recovery is significantly poorer than in the no-fault cases.
3 15000 30000
Initial
18 years
20 years
24 years
Dynamic permeability, mD

Compaction, Permeability, and Fluid Flow in Brent-Type Reservoirs The Open Petroleum Engineering Journal, 2010, Volume 3 9
Fig. (12). Water saturation in a Ness 2 grid layer containing 50 m wide channels, LC case. Water injectors to left (West), Upper Brent oil
producers to right (East) (light gray). Blue is water, red oil.
6 years
14 years
32 years
38 years
Dynamicpermeability
Constantpermeability
24 years
26 years
10 The Open Petroleum Engineering Journal, 2010, Volume 3 Øystein Pettersen
Fig. (13). Water saturation in a grid layer in upper Etive, containing 100 m wide channels, at selected times. Water injectors to left (West), oil
producers to right (East) (Upper Brent producers light gray, Lower Brent producers to far right). Blue is water, red oil.
We infer that for such a compartmentalized reservoir, each compartment behaves individually and must be treated as isolated. The need for oil producers in the western fault block is e.g. obvious.
Fig. (14). Permeability multiplier corresponding to Fig. (13).
Fig. (15). Water saturation in a W-E X-section w. faults. Large
Contrast, 15 m wide channels. Injectors to West (light blue),
producers to East (gray). Water blue, oil red.
Production
Some examples of production data are shown in Figs. (16–21).
6 years
28 years
32 years
38 years
Dynamicpermeability
Constantpermeability
6 years
18 years
28 years
32 years
0 0.5 0.75 10.25
Permeability multiplier
Dynamic permeability Constant permeability
4 years
10 years
16 years
28 years
Compaction, Permeability, and Fluid Flow in Brent-Type Reservoirs The Open Petroleum Engineering Journal, 2010, Volume 3 11
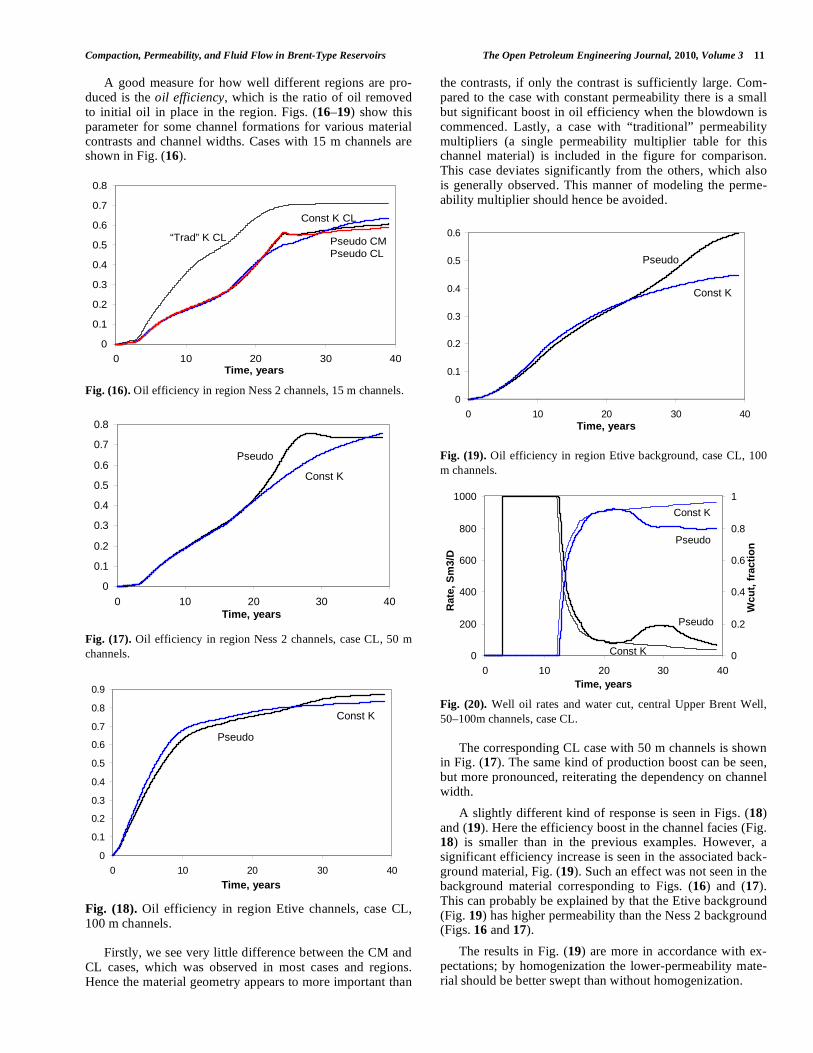
A good measure for how well different regions are pro-duced is the oil efficiency, which is the ratio of oil removed to initial oil in place in the region. Figs. (16–19) show this parameter for some channel formations for various material contrasts and channel widths. Cases with 15 m channels are shown in Fig. (16).
Fig. (16). Oil efficiency in region Ness 2 channels, 15 m channels.
Fig. (17). Oil efficiency in region Ness 2 channels, case CL, 50 m
channels.
Fig. (18). Oil efficiency in region Etive channels, case CL, 100 m channels.
Firstly, we see very little difference between the CM and CL cases, which was observed in most cases and regions. Hence the material geometry appears to more important than
the contrasts, if only the contrast is sufficiently large. Com-pared to the case with constant permeability there is a small but significant boost in oil efficiency when the blowdown is commenced. Lastly, a case with “traditional” permeability multipliers (a single permeability multiplier table for this channel material) is included in the figure for comparison. This case deviates significantly from the others, which also is generally observed. This manner of modeling the perme-ability multiplier should hence be avoided.
Fig. (19). Oil efficiency in region Etive background, case CL, 100
m channels.
Fig. (20). Well oil rates and water cut, central Upper Brent Well,
50–100m channels, case CL.
The corresponding CL case with 50 m channels is shown in Fig. (17). The same kind of production boost can be seen, but more pronounced, reiterating the dependency on channel width.
A slightly different kind of response is seen in Figs. (18) and (19). Here the efficiency boost in the channel facies (Fig. 18) is smaller than in the previous examples. However, a significant efficiency increase is seen in the associated back-ground material, Fig. (19). Such an effect was not seen in the background material corresponding to Figs. (16) and (17). This can probably be explained by that the Etive background (Fig. 19) has higher permeability than the Ness 2 background (Figs. 16 and 17).
The results in Fig. (19) are more in accordance with ex-pectations; by homogenization the lower-permeability mate-rial should be better swept than without homogenization.
0
0.1
0.2
0.3
0.4
0.5
0.6
0.7
0.8
0 10 20 30 40
Pseudo CMPseudo CL
Const K CL
“Trad” K CL
Time, years
0
0.1
0.2
0.3
0.4
0.5
0.6
0.7
0.8
0 10 20 30 40
Pseudo
Const K
Time, years
0
0.1
0.2
0.3
0.4
0.5
0.6
0.7
0.8
0.9
0 10 20 30 40
Pseudo
Const K
Time, years
0
0.1
0.2
0.3
0.4
0.5
0.6
0 10 20 30 40
Pseudo
Const K
Time, years
0
200
400
600
800
1000
0 10 20 30 40
0
0.2
0.4
0.6
0.8
1
Time, years
Rat
e, S
m3/
D
Wcu
t, f
ract
ion
Pseudo
Const K
Pseudo
Const K

12 The Open Petroleum Engineering Journal, 2010, Volume 3 Øystein Pettersen
An example of oil and water production rates from a well is shown in Fig. (20), which depicts oil rate and water cut in one of the central Upper Brent producers. In agreement with expectations oil rate increases and water production is re-duced during the pressure blowdown period. This is due to the reduced water cycling through the channels after homog-enization.
Looking at total field production rates, Fig. (21), we no-tice the expected production boost when at the start of the blowdown period. Perhaps surprising, the different cases are very similar, (except for the “traditional” case, where perme-ability reduction is modeled incorrectly, and is shown for comparison only). This is probably partly due to the way the simulator allocates production, and partly to the production scheme; we have not made any attempts to optimize well operations in these simulations, which certainly would have been done in a real case.
Fig. (21). Field (total) oil rates. 15 m channels.
The Figs. (16–21) must be read as the difference in results as a consequence of how the compaction and permeability is modeled in the reservoir simulator. The reservoir description and production strategy are regarded as fixed. The focus in this paper is on the modeling strategy, and possible consequences of simplified compaction / permeability modeling.
However, Fig. (22) has been included as a reference case, showing the effect of the blowdown as such. The blowdown gives an instantaneous production boost, and the oil rate is maintained at a higher level than the no-blowdown case for about five years.
DISCUSSION
It has been demonstrated that in an environment com-prised of a mixture of weak and strong materials, production at reduced pressure in many cases can have a positive effect on recovery by reducing water cycling and spreading injec-tion water from high-permeability regions to neighboring, lower-permeability materials. The extent of the high-permeability material, the permeability contrast between the materials, and the initial permeability in the background ma-terial are all important factors for the ensuing sweep im-provement The simulations demonstrate the expected posi-tive effect locally, i.e. in the vicinity of the large-contrast domains. However, in most of the studied cases, the total field production was not significantly affected. This is most
readily explained by the model setup; a significant part of the model volume contains clean sandstone where the perme-ability reduction is smaller and homogenization absent. When production is increased in the high-contrast regions, a corresponding reduction is seen in other regions, maintaining total production rates. This feature was more evident in models with good to moderate vertical conductivity, as the low-permeability regions then were more easily produced by water flux from neighboring layers above or below. In a real reservoir production scenario the well rates would have been optimized to exploit all local production boosts, and simi-larly shut off e.g. connections with high water-production. Hence the local production improvements which this study clearly shows the potential for, will result in real gain, pri-marily by reduced water production, but often also by an increase in oil production.
Fig. (22). Field oil and water rates, case CL, 50–100m channels
with and without blowdown.
The studied simulation models are clearly simplifications of real reservoirs, which contain a multitude of contrasting materials, often on a small scale. Hence, the local effects which were detected in this study may occur to a much larger extent in practice. I.e. the qualitative results in this study are probably more significant than e.g. the field production curves in Fig. (21).
Note also that the goal of this paper is not to investigate the benefits or drawbacks of the blowdown process itself, but to study different modeling options during such a process. It is for example totally unrealistic to operate with a blowdown period of 22 years; in reality, the duration would be a few years at most. Some of the observations are probably valid independent of the time scale, but according to the simula-tions it does take some (simulated) time to establish a suffi-ciently low average pressure, which is needed for some ef-fects to take place. On a shorter time scale, the low-pressure domains are concentrated near the production wells.
CONCLUSION
1. Permeability reduction in sand or sandstone reservoirs can be large even at moderate pressure drawdown.
2. Compaction and permeability reduction can have sig-nificant impact on fluid flow in a large class of reser-voirs.
3. Weak, moderate, and strong materials behave differ-ently when loaded, and by pressure reduction the ini-
0
1000
2000
3000
4000
5000
6000
7000
8000
0 10 20 30 40
Pseudo, CL
Const K, CL
Trad. K, CL
Pseudo, CM
Time, years
Rat
e, S
m3/
D
0
1000
2000
3000
4000
5000
6000
7000
8000
0 10 20 30 40
qw Blowdown
qw No blowdown
qo Blowdown
qo No blowdown
Time, years
Rat
e, S
m3/
D
Compaction, Permeability, and Fluid Flow in Brent-Type Reservoirs The Open Petroleum Engineering Journal, 2010, Volume 3 13
tial permeability distribution can be altered in a fash-ion that has large impact on the flow pattern.
4. The deformation (and hence compaction) of a reser-voir is more complex than the traditional dependency on pressure typically used in flow simulators, and must be calculated by a stress simulator. However, once one rock mechanics simulation has been carried through, further studies can be done by pure flow simulations, provided the pore volume multiplier ta-bles are generated to honor the strain calculations by the stress simulator.
5. Material behavior in a depletion or pressure blow-down process can contribute positively to recovery in many kinds of reservoirs.
The factors which were found to have the largest impact on actually changing recovery or flow pattern, are:
• permeability contrast between the strong and weak materials
• initial absolute permeability in the low-permeability materials
• the permeability versus load relationship
• geometry, i.e. extent and distribution of weak and strong materials
• overall vertical reservoir connectivity
Glossary
PVM pore volume multiplier
Tmult transmissibility multiplier
CL case: large permeability contrast between channel and back-
ground material
CM case: moderate permeability contrast
REFERENCES
[1] A. C. Morton, R. S. Hazeldine, M. R. Giles, and S. Brown, Eds.,
Geology of the Brent Group. Geological Society Special Publication 61, 1992.
[2] J. Vollset, A. G. Doré, Eds, A Revised Triassic and Jurassic lithostratigraphic nomenclature for the Norwegian North Sea. NPD
Bulletin No. 3, 1984. [3] Ø. Pettersen, “Using relations between stress and fluid pressure for
improved compaction modelling in flow simulation and increased efficiency in coupled rock mechanics simulation”, J. Petroleum
Geosci, vol. 14 (4), pp. 399-409, 2008. [4] Ø. Pettersen and T. G. Kristiansen, “Improved compaction
modeling in reservoir simulation and coupled rock mechanics/flow simulation, with examples from the valhall field”, SPE Res. Eval.
Eng. vol. 12 (2), pp. 329-340, 2009. [5] D. C. Standnes, A. Skauge, and Ø. Pettersen, “Effects to be
considered when planning late stage depressurisation”, Presented
at the 13th European Symposium on Improved Oil Recovery,
Budapest, Hungary, 25–27 April, 2005. [6] Ø. Pettersen, “Sandstone compaction, grain packing and Critical
State Theory”, J. Petroleum Geosci, vol. 13 (1), pp. 63–67, 2007. [7] I. O. Ojala, B. T. Ngwenya, and I. G. Main, “Loading rate
dependence of permeability evolution in porous aeolian sandstones”, J. Geophys. Res, vol. 109, pp. 1-14, 2004.
[8] ECLIPSE Reference Manual 2009. Schlumberger, Houston, 2009. [9] P. Longuemare, M. Mainguy, P. Lemonier, A. Onaisi, Ch. Gérard,
and N. C. Koutsabeloulis, “Geomechanics in reservoir simulation: Overview of coupling methods and field case study”. Oil Gas Sci
Technol—Revue de l’IFP, vol. 57 (5), pp. 471-483, 2002. [10] N. C. Koutsabeloulis, K. J. Heffer, and S. Wong, “Numerical
geomechanics in reservoir engineering”, In: Computer Methods and Advances in Geomechanics, H. Siriwardane and M. Zaman,
Rotterdam, Eds. The Netherlands: A. A. Balkema, 1994, pp. 2097-2104.
[11] A. Settari and F. M. Mourits, “Coupling of geomechanics and reservoir simulation models”, In Computer Methods and Advances
in Geomechanics, Ed. H. Siriwardane and M. Zaman,. Rotterdam, The Netherlands: A.A. Balkema, 1994, pp. 2151-2158.
[12] M. Gutierrez and R. W. Lewis, “The role of geomechanics in reservoir simulation”, paper SPE 47392 presented at SPE/ISRM
Rock Mechanics in Petroleum Engineering, Trondheim, Norway, 8-10 July, 1998.
[13] N. C. Koutsabeloulis and S. A. Hope, “Coupled” stress/ fluid/thermal multi-phase reservoir simulation studies incorporating
rock mechanics”, paper SPE 47393 presented at SPE/ISRM Rock Mechanics in Petroleum Engineering, Trondheim, Norway, 8-10
July, 1998. [14] A. Settari and F. M. Mourits, “A coupled reservoir and
geomechanical simulation system”, SPEJ, vol 3 (3), pp. 219-226, 1998
[15] M. Mainguy and P. Longuemare, “Coupling fluid flow and rock mechanics: Formulation of the partial coupling between reservoir
and geomechanical simulators”, Oil Gas Sci Technol—Revue de l’IFP vol. 57 (4), pp. 355-367, 2002.
[16] L. K. Thomas, L. Y. Chin, R. G. Pierson, and J. E. Sylte, “Integrating geomechanics in Full-Field 3-D Reservoir
Simulation—Modeling Techniques and Field Applications”. Presented at SPE Applied Technology Workshop, Corpus Christi,
Texas, USA, 31 July–1 August, 2003. [17] A. Settari and D. A. Walters, “Advances in coupled geomechanical
and reservoir modeling With applications to reservoir compaction”, paper SPE 51927 presented at SPE Reservoir Simulation
Symposium, Houston, 14-17 February, 1999 [18] L. Y. Chin, L.K. Thomas, J. E. Sylte, and R.G. Pierson, “Iterative
coupled analysis of geomechanics and fluid flow for rock compaction in reservoir simulation” Oil Gas Sci Technol-Revue de
l’IFP, vol 57 (5): pp. 485-497, 2002. [19] A. Onaisi, P. Samier, N. C. Koutsabeloulis, and P. Longuemare,
“Management of stress sensitive reservoirs using two coupled stress-reservoir simulation tools: ECL2VIS and ATH2VIS”, paper
SPE 78512 presented at Abu Dhabi International Petroleum Exhibition and Conference, Abu Dhabi, UAE, 13-16 October,
2002. [20] D. Tran, A. Settari, and L. Nghiem, “New iterative coupling
between a reservoir simulator and a geomechanics module” SPEJ, vol. 9 (3), pp. 362-369, 2004.
[21] D. M. Wood, Soil Behaviour and Critical State Soil Mechanics. Cambridge, UK: Cambridge University Press, 1990.
[22] The VISAGETM system – V.I.P.S. User’s Guide, V9.2, V.I.P.S. Ltd, Bracknell, UK (now Schlumberger), 2006.
Received: November 13, 2008 Revised: December 07, 2009 Accepted: December 23, 2009
© Øystein Pettersen; Licensee Bentham Open.
This is an open access article licensed under the terms of the Creative Commons Attribution Non-Commercial License (http://creativecommons.org/-
licenses/by-nc/3.0/) which permits unrestricted, non-commercial use, distribution and reproduction in any medium, provided the work is properly cited.