open access competitive binding to cuprous ions of … · open access competitive binding to...
TRANSCRIPT
The Open Biomedical Engineering Journal, 2010, 4, 271-278 271
1874-1207/10 2010 Bentham Open
Open Access
Competitive Binding to Cuprous Ions of Protein and BCA in the Bicinchoninic Acid Protein Assay
Tao Huang, Mian Long and Bo Huo*
Center for Biomechanics and Bioengineering and Key Laboratory of Microgravity (National Microgravity Laboratory),
Institute of Mechanics, Chinese Academy of Sciences, Beijing 100190, People’s Republic of China
Abstract: Although Bicinchoninic acid (BCA) has been widely used to determine protein concentration, the mechanism
of interaction between protein, copper ion and BCA in this assay is still not well known. Using the Micro BCA protein
assay kit (Pierce Company), we measured the absorbance at 562 nm of BSA solutions with different concentrations of
protein, and also varied the BCA concentration. When the concentration of protein was increased, the absorbance
exhibited the known linear and nonlinear increase, and then reached an unexpected plateau followed by a gradual
decrease. We introduced a model in which peptide chains competed with BCA for binding to cuprous ions. Formation of
the well-known chromogenic complex of BCA-Cu1+
-BCA was competed with the binding of two peptide bonds (NTPB)
to cuprous ion, and there is the possibility of the existence of two new complexes. A simple equilibrium equation was
established to describe the correlations between the substances in solution at equilibrium, and an empirical exponential
function was introduced to describe the reduction reaction. Theoretical predictions of absorbance from the model were in
good agreement with the measurements, which not only validated the competitive binding model, but also predicted a new
complex of BCA-Cu1+
-NTPB that might exist in the final solution. This work provides a new insight into understanding
the chemical bases of the BCA protein assay and might extend the assay to higher protein concentration.
Keywords: Bicinchoninic acid, Protein measurement, Nearby two peptide bonds, Cupric ion, Cuprous ion, Equilibrium equation, Competitive binding.
INTRODUCTION
Since the original work of Smith et al. (1985) [1], bicinchoninic acid (BCA) has been widely used to determine protein concentration because of its ease of use, high sensitivity and tolerance of interfering species [2, 3]. This assay is based on two chemical reactions. The first is the reduction of cupric ions (Cu
2+) to cuprous ions (Cu
1+) by the
peptide bonds, known as the biuret reaction, and by some specific residues in an alkaline environment [1]. The second step is the chelation of one Cu
1+ with two BCA molecules
(Fig. 1a), forming an intense purple complex, which has a peak absorbance at 562nm. The protein concentration in a solution is determined by comparing this absorbance with a standard curve of absorbance from varying bovine serum albumin (BSA) [1]. For the Micro BCA
TM Assay Kit of
Pierce (23235#), the standard curve appears nonlinear above the working range of 0.5 to 20 μg/mL protein. The reason for this nonlinearity has not been investigated. When we increased the concentration of BSA up to 6000 μg/mL, an unexpected absorbance maximum was observed. The molar concentrations of cupric ions, BCA molecules and peptide bonds were calculated from the given contents of the kit. It was found that the absorbance maximum appeared where the peptide bonds were about six times more concentrated than the cupric ions. It is reasonable to assume that the excess peptide bonds compete with the BCA for binding to cuprous ion, thereby reducing production of the chromogenic group.
*Address correspondence to this author at the No. 15 North 4th Ring Road,
Beijing 100190, P. R. China; Tel: 8610-82544132; Fax: 8610-82544096;
E-mail: [email protected]
We describe a study of this competition by experiments and theoretical modeling.
EXPERIMENTAL SECTION
Materials and Methods
Following the standard protocol for the Micro BCA Protein Assay Kit (23235#, Pierce Company), the working reagent (WR) was prepared from 25 parts of MA (sodium carbonate, sodium bicarbonate and sodium tartrate in 0.2 N NaOH), 24 parts of MB (4% BCA in water) and 1 part of MC (4% cupric sulfate, pentahydrate in water). A series of WR with increasing BCA was prepared with varying MB present in 24, 36.5, 49, 74, and 124 parts. The volumes of all WR solutions were kept constant by adding pure water so that only the BCA concentration varied. The pH value of all WR solutions was 11.16 0.06 measured with an Orion 310 pH meter. Twelve BSA solutions with concentrations ranging from 0.02 to 40 mg/mL were prepared by dissolving BSA powder (purity 99.9%, purchased from Bailingke Company, Beijing) in pure water. After mixing one part BSA solution with seven parts WR, a total of sixty solutions with varying concentrations of protein or BCA were obtained. The concentration given in the experimental results is that in the final mixture, and only the concentration of copper ions was invariant, 0.4 mM in all sample solutions. Each measurement was performed in duplicate.
The samples were incubated at 60 ˚C for one hour before cooling to room temperature in accordance with the standard procedures. All the absorbances were corrected by the corresponding blank replicate. The absorbance of the blank
272 The Open Biomedical Engineering Journal, 2010, Volume 4 Huang et al.
solution was 0.048 0.006. Absorbance at 562 nm was measured by spectrophotometer (Tianmei Company, Beijing) using glass cuvettes with optical path length of 0.1 cm.
Experimental Results
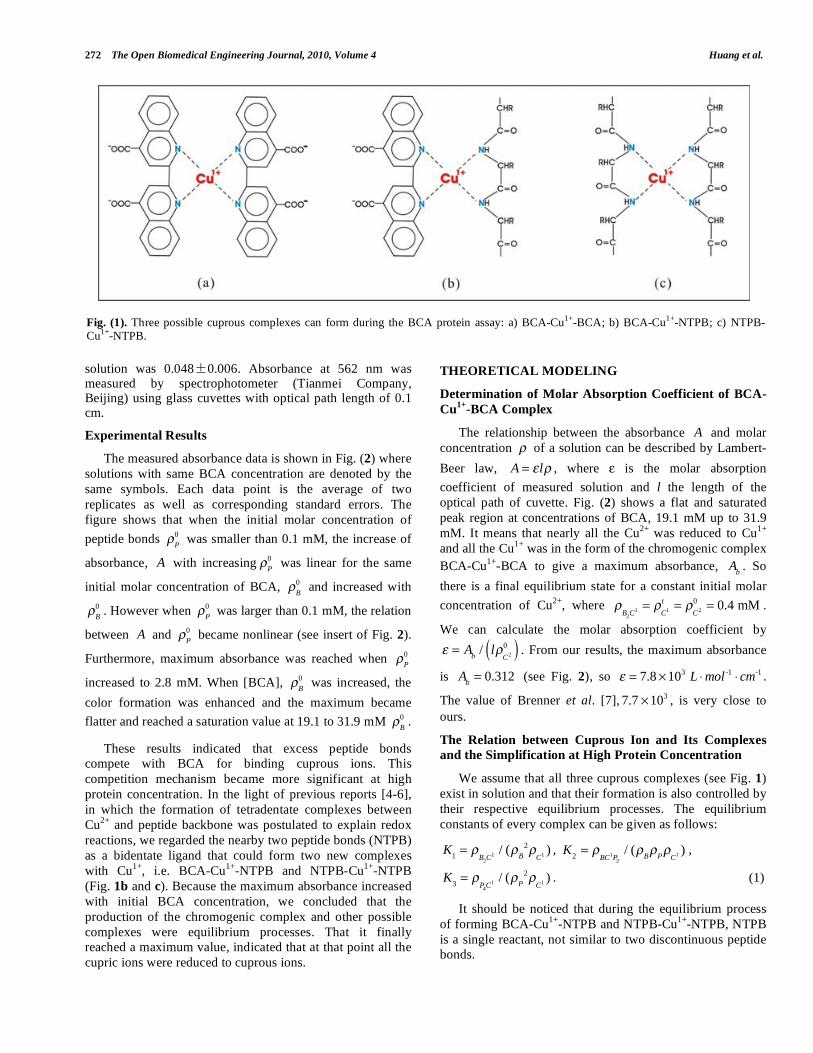
The measured absorbance data is shown in Fig. (2) where
solutions with same BCA concentration are denoted by the
same symbols. Each data point is the average of two
replicates as well as corresponding standard errors. The
figure shows that when the initial molar concentration of
peptide bonds P
0 was smaller than 0.1 mM, the increase of
absorbance, A with increasing P
0 was linear for the same
initial molar concentration of BCA, B
0 and increased with
B
0. However when
P
0 was larger than 0.1 mM, the relation
between A and P
0 became nonlinear (see insert of Fig. 2).
Furthermore, maximum absorbance was reached when P
0
increased to 2.8 mM. When [BCA], B
0 was increased, the
color formation was enhanced and the maximum became
flatter and reached a saturation value at 19.1 to 31.9 mM B
0.
These results indicated that excess peptide bonds
compete with BCA for binding cuprous ions. This
competition mechanism became more significant at high
protein concentration. In the light of previous reports [4-6],
in which the formation of tetradentate complexes between
Cu2+
and peptide backbone was postulated to explain redox
reactions, we regarded the nearby two peptide bonds (NTPB)
as a bidentate ligand that could form two new complexes
with Cu1+
, i.e. BCA-Cu1+
-NTPB and NTPB-Cu1+
-NTPB
(Fig. 1b and c). Because the maximum absorbance increased
with initial BCA concentration, we concluded that the
production of the chromogenic complex and other possible
complexes were equilibrium processes. That it finally
reached a maximum value, indicated that at that point all the
cupric ions were reduced to cuprous ions.
THEORETICAL MODELING
Determination of Molar Absorption Coefficient of BCA-
Cu1+
-BCA Complex
The relationship between the absorbance A and molar
concentration of a solution can be described by Lambert-
Beer law, A = l , where is the molar absorption
coefficient of measured solution and l the length of the
optical path of cuvette. Fig. (2) shows a flat and saturated
peak region at concentrations of BCA, 19.1 mM up to 31.9
mM. It means that nearly all the Cu2+
was reduced to Cu1+
and all the Cu1+
was in the form of the chromogenic complex
BCA-Cu1+
-BCA to give a maximum absorbance, A
b. So
there is a final equilibrium state for a constant initial molar
concentration of Cu2+
, where
B2C
1=
C1
t=
C2
0= 0.4 mM .
We can calculate the molar absorption coefficient by
= A
b/ l
C2
0( ) . From our results, the maximum absorbance
is A
b= 0.312 (see Fig. 2), so = 7.8 10
3 L mol
-1cm
-1 .
The value of Brenner et al. [7], 7.7 103 , is very close to
ours.
The Relation between Cuprous Ion and Its Complexes
and the Simplification at High Protein Concentration
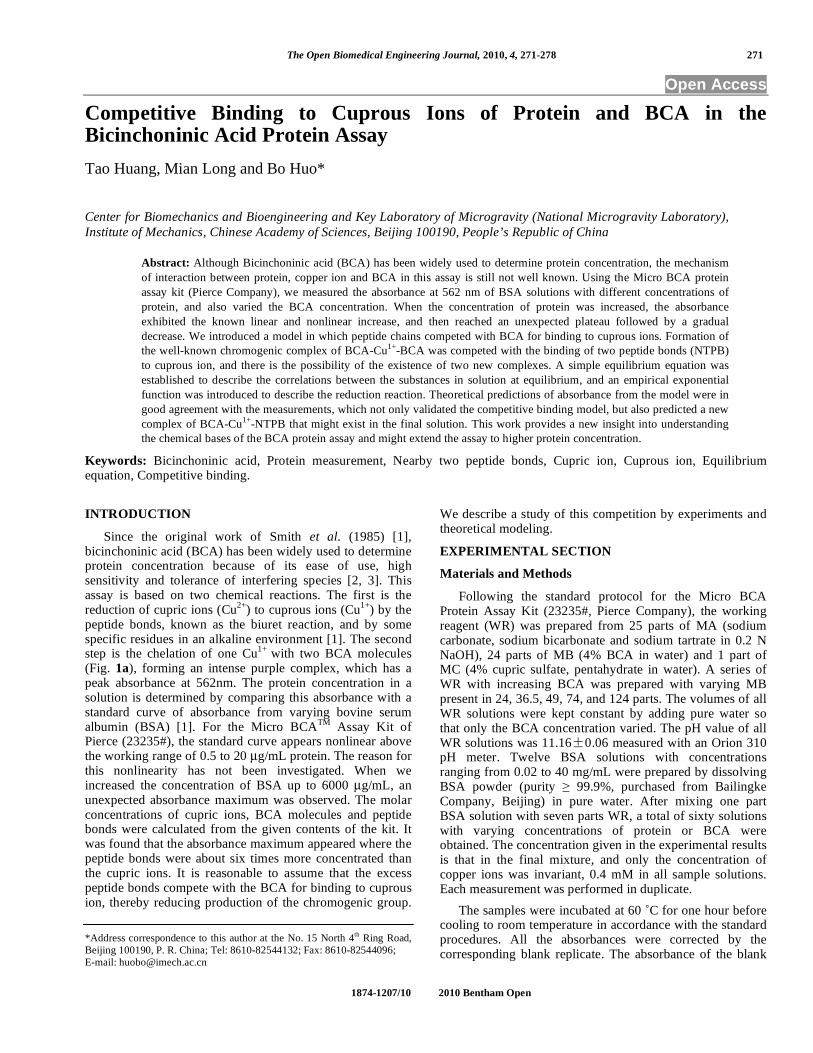
We assume that all three cuprous complexes (see Fig. 1)
exist in solution and that their formation is also controlled by
their respective equilibrium processes. The equilibrium
constants of every complex can be given as follows:
K
1=
B2C
1/ (
B
2
C1) ,
K
2=
BC1P
2
/ (B P C
1) ,
K
3=
P4C
1/ (
P
2
C1) . (1)
It should be noticed that during the equilibrium process
of forming BCA-Cu1+
-NTPB and NTPB-Cu1+
-NTPB, NTPB
is a single reactant, not similar to two discontinuous peptide
bonds.
Fig. (1). Three possible cuprous complexes can form during the BCA protein assay: a) BCA-Cu1+
-BCA; b) BCA-Cu1+
-NTPB; c) NTPB-Cu
1+-NTPB.
Competitive Binding to Cu+ in BCA Protein Assay The Open Biomedical Engineering Journal, 2010, Volume 4 273
Considering the conservation of Cu1+
, the total
concentration of Cu1+
in a solution at the equilibrium state
can be given as:
C
1
t=
B2C
1+
BC1P
2
+P
4C
1+
C1. (2)
Substituting Eq. (1) into Eq. (2), gives the dimensionless
ratio:
B2C
1
C1
t=
K1 B
2
K1 B
2+ K
2 B P+ K
3 P
2+1
. (3)
The molar concentration of the complex B
2C
1 can be
expressed as follows:
B
2C
1= A / l , (4)
where A is the measured absorbance for a sample solution at
562nm. The path length of cuvette l is 0.1 cm in this work.
To fit the experimental results, we simplify Eq. (3) for
the solution with high protein concentration after maximum
absorbance is reached, where
P
0/
C2
0>> 1 , so the
concentration of the free peptide bonds can be obtained
through the following approximation of P P
0. We
hypothesize that when the concentration of protein was high,
all the Cu2+
was reduced to Cu1+
, i.e. C
1
t=
C2
0. The
concentrations of BCA in our experiment were far higher
than the initial concentration of copper ions, i.e.
B
0/
C2
0> 15 , so
B B
0. Introducing the above three
approximations into Eq. (3) and considering Eq. (4), we get
an equation applicable to high protein concentration:
A
lC
2
0
K1 B
0( )2
K1 B
0( )2
+ K2 B
0
P
0+ K
3 P
0( )2
+1
. (5)
The Determination of Equilibrium Constants by Fitting
the Experimental Results at High Protein Concentration
To determine the three equilibrium constants of K1, K2
and K3, the experimental data for the sample solutions with
protein concentration higher than 2.8 mM was fitted to Eq.
(5). As two replicates were completed for an experimental
condition, we considered every replicate as an individual
data point during fitting. (A bad data point for
B
0= 6.18 mM was ignored during fitting due to its
abnormal deviation from the absorbance value of its replicate
and other neighboring data.) Finally, we used global fitting
with 49 experiment data points to determine the three
constants. The software used for the analysis was Prism
(Version 4.0, GraphPad Software, Inc.) and the fitting results
are listed in Table 1 [8]. During a nonlinear regression,
2
denotes the sum of the squares of the vertical distances of the
points from the best-fit curve. The coefficient of
determination R2
, a fraction between 0.0 and 1.0, qualifies
the goodness of fit. When R2
equals 0.0, the best-fit curve
fits the data no better than a horizontal line going through the
mean of all Y values being determined. When R2
= 1.0, all
points lie exactly on the curve with no scatter, i.e.
2= 0 .
([7], page 33-34).
To judge which one of the three complexes in Fig. (1)
could most probably exist, we added some constraints in the
procedure of fitting. When K1>0, K2>0, K3>0, which means
all three complexes exist in the solution, the best-fit value of
K3 was much smaller than the other two equilibrium
constants and even less than its standard deviation (see Table
1). Thus, we conclude that NTPB-Cu1+
-NTPB doesn’t exist.
For the case that only BCA-Cu1+
-BCA and NTPB-Cu1+
-
NTPB existed in the solution (K1>0, K2=0, K3>0), the
coefficient of determination R2
was lower and the reduced
sum of squares v
2 was greater than the other two cases,
indicating a bad fit, and confirming the negligible probability
of NTPB-Cu1+
-NTPB. Perhaps there is some NTPB-Cu1+
-
Fig. (2). Absorbance of sixty sample solutions at 562 nm. The data points for the same BCA concentration, denoted by the same symbols, are connected by straight lines. Each data point was the average value of two replicates as well as standard error.
274 The Open Biomedical Engineering Journal, 2010, Volume 4 Huang et al.
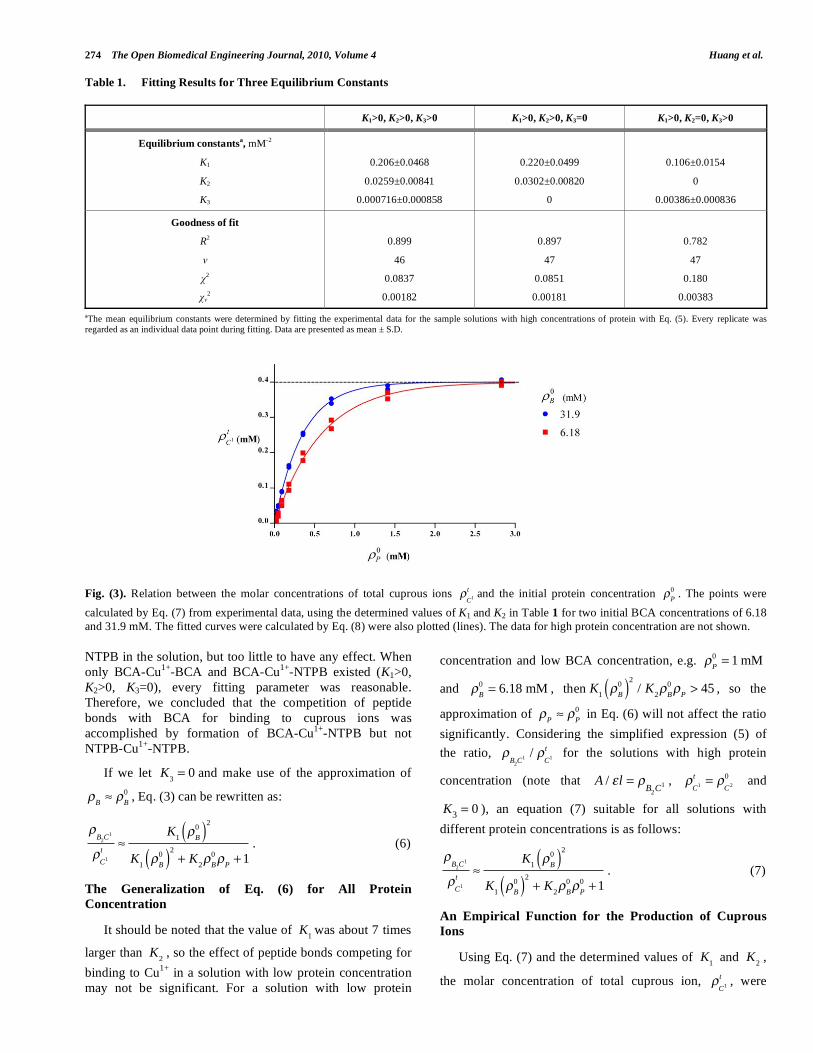
Table 1. Fitting Results for Three Equilibrium Constants
K1>0, K2>0, K3>0 K1>0, K2>0, K3=0 K1>0, K2=0, K3>0
Equilibrium constantsa, mM-2
K1
K2
K3
0.206±0.0468
0.0259±0.00841
0.000716±0.000858
0.220±0.0499
0.0302±0.00820
0
0.106±0.0154
0
0.00386±0.000836
Goodness of fit
R2
2
2
0.899
46
0.0837
0.00182
0.897
47
0.0851
0.00181
0.782
47
0.180
0.00383
aThe mean equilibrium constants were determined by fitting the experimental data for the sample solutions with high concentrations of protein with Eq. (5). Every replicate was regarded as an individual data point during fitting. Data are presented as mean ± S.D.
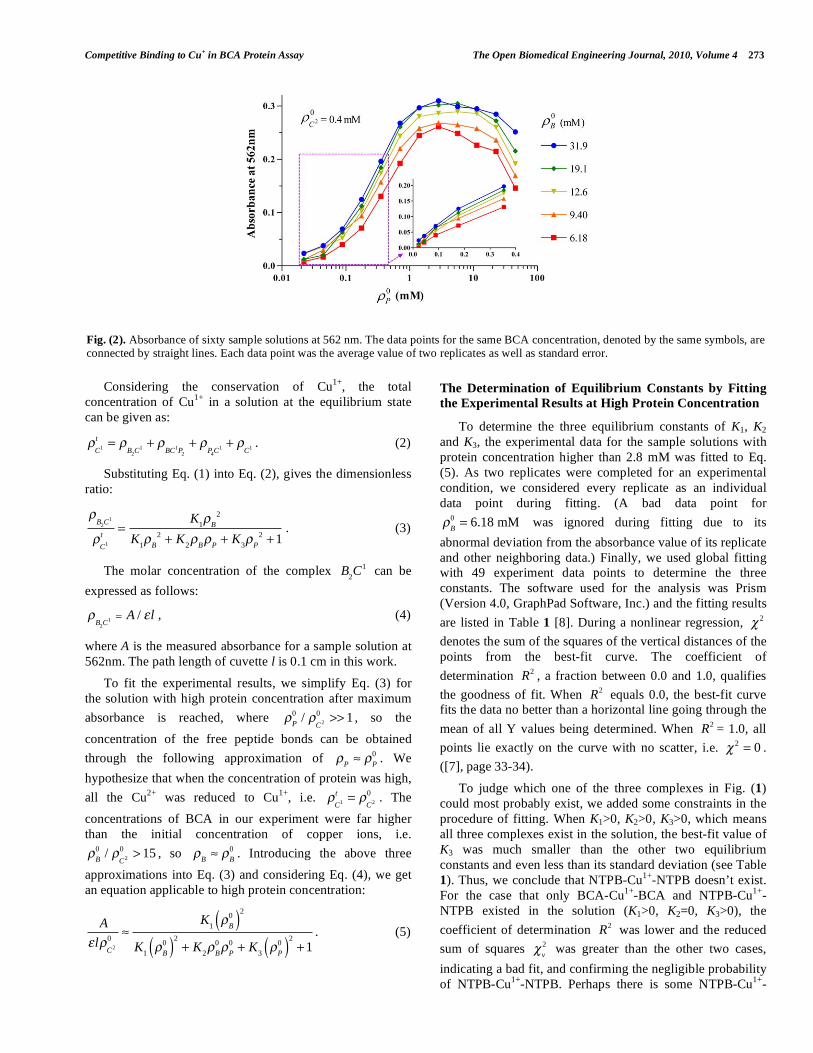
Fig. (3). Relation between the molar concentrations of total cuprous ions C
1
tand the initial protein concentration
P
0 . The points were
calculated by Eq. (7) from experimental data, using the determined values of K1 and K2 in Table 1 for two initial BCA concentrations of 6.18
and 31.9 mM. The fitted curves were calculated by Eq. (8) were also plotted (lines). The data for high protein concentration are not shown.
NTPB in the solution, but too little to have any effect. When
only BCA-Cu1+
-BCA and BCA-Cu1+
-NTPB existed (K1>0,
K2>0, K3=0), every fitting parameter was reasonable.
Therefore, we concluded that the competition of peptide
bonds with BCA for binding to cuprous ions was
accomplished by formation of BCA-Cu1+
-NTPB but not
NTPB-Cu1+
-NTPB.
If we let K
3= 0 and make use of the approximation of
B B
0, Eq. (3) can be rewritten as:
B2C
1
C1
t
K1 B
0( )2
K1 B
0( )2
+ K2 B
0
P+1
. (6)
The Generalization of Eq. (6) for All Protein
Concentration
It should be noted that the value of K
1was about 7 times
larger than K
2, so the effect of peptide bonds competing for
binding to Cu1+
in a solution with low protein concentration
may not be significant. For a solution with low protein
concentration and low BCA concentration, e.g. P
0= 1 mM
and B
0= 6.18 mM , then
K
1 B
0( )2
/ K2 B
0
P> 45 , so the
approximation of P P
0 in Eq. (6) will not affect the ratio
significantly. Considering the simplified expression (5) of
the ratio,
B2C
1/
C1
t for the solutions with high protein
concentration (note that
A / l =B
2C
1 , C
1
t=
C2
0 and
K
3= 0 ), an equation (7) suitable for all solutions with
different protein concentrations is as follows:
B2C
1
C1
t
K1 B
0( )2
K1 B
0( )2
+ K2 B
0
P
0+1
. (7)
An Empirical Function for the Production of Cuprous
Ions
Using Eq. (7) and the determined values of K
1 and
K
2,
the molar concentration of total cuprous ion, C
1
t, were
Competitive Binding to Cu+ in BCA Protein Assay The Open Biomedical Engineering Journal, 2010, Volume 4 275
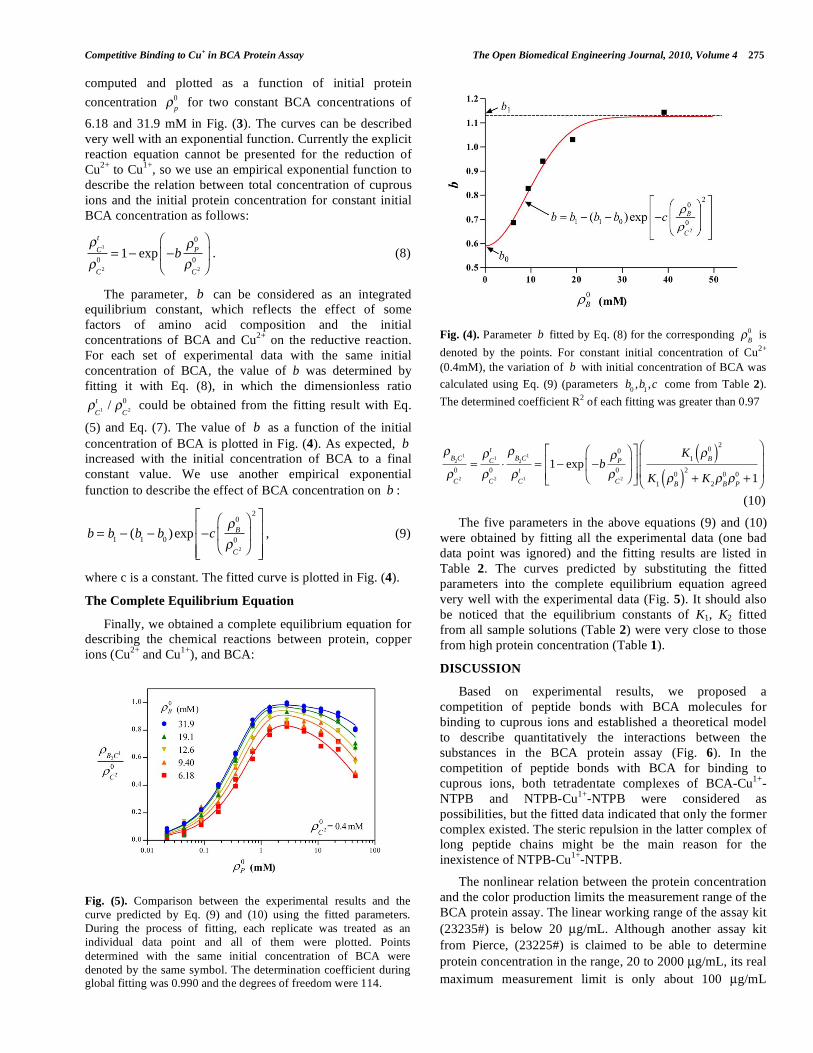
computed and plotted as a function of initial protein
concentration p
0 for two constant BCA concentrations of
6.18 and 31.9 mM in Fig. (3). The curves can be described
very well with an exponential function. Currently the explicit
reaction equation cannot be presented for the reduction of
Cu2+
to Cu1+
, so we use an empirical exponential function to
describe the relation between total concentration of cuprous
ions and the initial protein concentration for constant initial
BCA concentration as follows:
C1
t
C2
0= 1 exp b
P
0
C2
0. (8)
The parameter, b can be considered as an integrated
equilibrium constant, which reflects the effect of some
factors of amino acid composition and the initial
concentrations of BCA and Cu2+
on the reductive reaction.
For each set of experimental data with the same initial
concentration of BCA, the value of b was determined by
fitting it with Eq. (8), in which the dimensionless ratio
C1
t/
C2
0 could be obtained from the fitting result with Eq.
(5) and Eq. (7). The value of b as a function of the initial
concentration of BCA is plotted in Fig. (4). As expected, b
increased with the initial concentration of BCA to a final
constant value. We use another empirical exponential
function to describe the effect of BCA concentration on b :
b = b1
(b1
b0) exp c
B
0
C2
0
2
, (9)
where c is a constant. The fitted curve is plotted in Fig. (4).
The Complete Equilibrium Equation
Finally, we obtained a complete equilibrium equation for
describing the chemical reactions between protein, copper
ions (Cu2+
and Cu1+
), and BCA:
Fig. (4). Parameter b fitted by Eq. (8) for the corresponding B
0 is
denoted by the points. For constant initial concentration of Cu2+
(0.4mM), the variation of b with initial concentration of BCA was
calculated using Eq. (9) (parameters b
0,b
1,c come from Table 2).
The determined coefficient R2 of each fitting was greater than 0.97
B2C
1
C2
0= C
1
t
C2
0
B2C
1
C1
t= 1 exp b
P
0
C2
0
K1 B
0( )2
K1 B
0( )2
+ K2 B
0
P
0+1
(10)
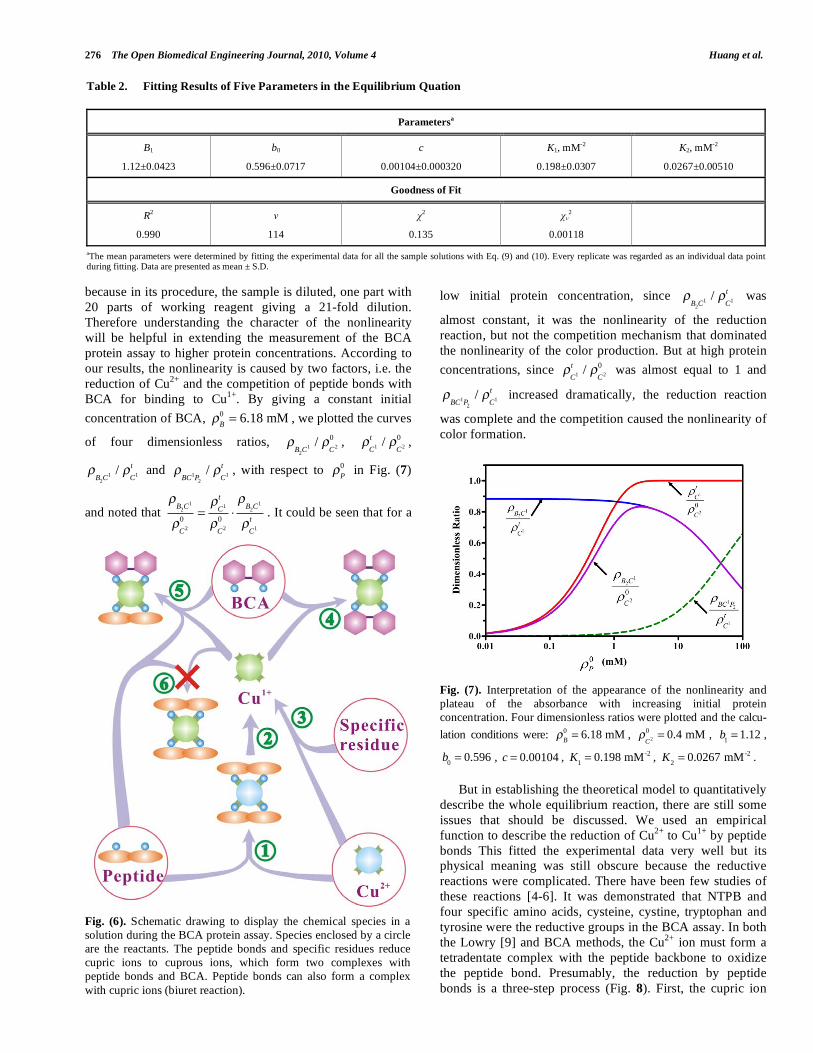
The five parameters in the above equations (9) and (10)
were obtained by fitting all the experimental data (one bad
data point was ignored) and the fitting results are listed in
Table 2. The curves predicted by substituting the fitted
parameters into the complete equilibrium equation agreed
very well with the experimental data (Fig. 5). It should also
be noticed that the equilibrium constants of K1, K2 fitted
from all sample solutions (Table 2) were very close to those
from high protein concentration (Table 1).
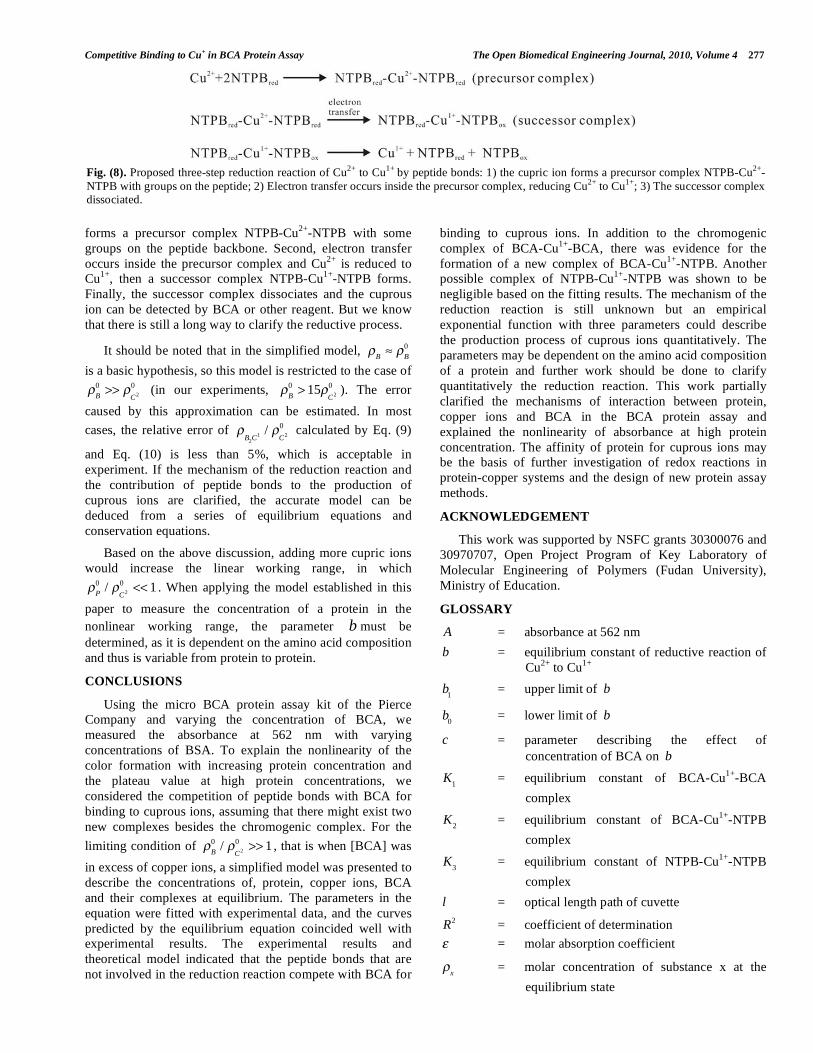
DISCUSSION
Based on experimental results, we proposed a
competition of peptide bonds with BCA molecules for
binding to cuprous ions and established a theoretical model
to describe quantitatively the interactions between the
substances in the BCA protein assay (Fig. 6). In the
competition of peptide bonds with BCA for binding to
cuprous ions, both tetradentate complexes of BCA-Cu1+
-
NTPB and NTPB-Cu1+
-NTPB were considered as
possibilities, but the fitted data indicated that only the former
complex existed. The steric repulsion in the latter complex of
long peptide chains might be the main reason for the
inexistence of NTPB-Cu1+
-NTPB.
The nonlinear relation between the protein concentration
and the color production limits the measurement range of the
BCA protein assay. The linear working range of the assay kit
(23235#) is below 20 μg/mL. Although another assay kit
from Pierce, (23225#) is claimed to be able to determine
protein concentration in the range, 20 to 2000 μg/mL, its real
maximum measurement limit is only about 100 μg/mL
Fig. (5). Comparison between the experimental results and the
curve predicted by Eq. (9) and (10) using the fitted parameters.
During the process of fitting, each replicate was treated as an
individual data point and all of them were plotted. Points
determined with the same initial concentration of BCA were
denoted by the same symbol. The determination coefficient during global fitting was 0.990 and the degrees of freedom were 114.
276 The Open Biomedical Engineering Journal, 2010, Volume 4 Huang et al.
because in its procedure, the sample is diluted, one part with
20 parts of working reagent giving a 21-fold dilution.
Therefore understanding the character of the nonlinearity
will be helpful in extending the measurement of the BCA
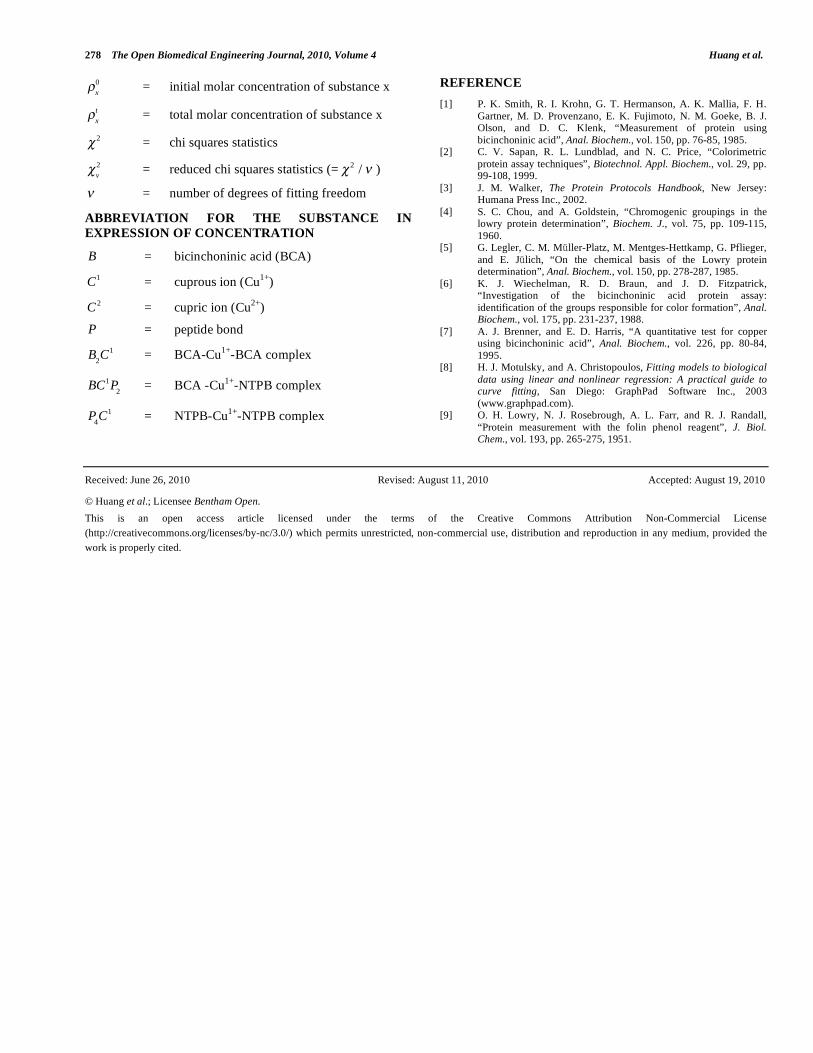
protein assay to higher protein concentrations. According to
our results, the nonlinearity is caused by two factors, i.e. the
reduction of Cu2+
and the competition of peptide bonds with
BCA for binding to Cu1+
. By giving a constant initial
concentration of BCA, B
0= 6.18 mM , we plotted the curves
of four dimensionless ratios,
B2C
1/
C2
0 , C
1
t/
C2
0,
B
2C
1/
C1
t and
BC1P
2
/C
1
t , with respect to P
0 in Fig. (7)
and noted that
B2C
1
C2
0=
C1
t
C2
0
B2C
1
C1
t. It could be seen that for a
low initial protein concentration, since
B2C
1/
C1
t was
almost constant, it was the nonlinearity of the reduction
reaction, but not the competition mechanism that dominated
the nonlinearity of the color production. But at high protein
concentrations, since C
1
t/
C2
0 was almost equal to 1 and
BC
1P
2
/C
1
t increased dramatically, the reduction reaction
was complete and the competition caused the nonlinearity of
color formation.
Fig. (7). Interpretation of the appearance of the nonlinearity and
plateau of the absorbance with increasing initial protein
concentration. Four dimensionless ratios were plotted and the calcu-
lation conditions were: B
0= 6.18 mM ,
C2
0= 0.4 mM ,
b
1= 1.12 ,
b
0= 0.596 ,
c = 0.00104 , K
1= 0.198 mM
-2 , K
2= 0.0267 mM
-2 .
But in establishing the theoretical model to quantitatively
describe the whole equilibrium reaction, there are still some
issues that should be discussed. We used an empirical
function to describe the reduction of Cu2+
to Cu1+
by peptide
bonds This fitted the experimental data very well but its
physical meaning was still obscure because the reductive
reactions were complicated. There have been few studies of
these reactions [4-6]. It was demonstrated that NTPB and
four specific amino acids, cysteine, cystine, tryptophan and
tyrosine were the reductive groups in the BCA assay. In both
the Lowry [9] and BCA methods, the Cu2+
ion must form a
tetradentate complex with the peptide backbone to oxidize
the peptide bond. Presumably, the reduction by peptide
bonds is a three-step process (Fig. 8). First, the cupric ion
Table 2. Fitting Results of Five Parameters in the Equilibrium Quation
Parametersa
B1
1.12±0.0423
b0
0.596±0.0717
c
0.00104±0.000320
K1, mM-2
0.198±0.0307
K2, mM-2
0.0267±0.00510
Goodness of Fit
R2
0.990
114
2
0.135
2
0.00118
aThe mean parameters were determined by fitting the experimental data for all the sample solutions with Eq. (9) and (10). Every replicate was regarded as an individual data point during fitting. Data are presented as mean ± S.D.
Fig. (6). Schematic drawing to display the chemical species in a
solution during the BCA protein assay. Species enclosed by a circle
are the reactants. The peptide bonds and specific residues reduce
cupric ions to cuprous ions, which form two complexes with
peptide bonds and BCA. Peptide bonds can also form a complex
with cupric ions (biuret reaction).
Competitive Binding to Cu+ in BCA Protein Assay The Open Biomedical Engineering Journal, 2010, Volume 4 277
forms a precursor complex NTPB-Cu2+
-NTPB with some
groups on the peptide backbone. Second, electron transfer
occurs inside the precursor complex and Cu2+
is reduced to
Cu1+
, then a successor complex NTPB-Cu1+
-NTPB forms.
Finally, the successor complex dissociates and the cuprous
ion can be detected by BCA or other reagent. But we know
that there is still a long way to clarify the reductive process.
It should be noted that in the simplified model, B B
0
is a basic hypothesis, so this model is restricted to the case of
B
0>>
C2
0 (in our experiments,
B
0> 15
C2
0). The error
caused by this approximation can be estimated. In most
cases, the relative error of
B2C
1/
C2
0 calculated by Eq. (9)
and Eq. (10) is less than 5%, which is acceptable in
experiment. If the mechanism of the reduction reaction and
the contribution of peptide bonds to the production of
cuprous ions are clarified, the accurate model can be
deduced from a series of equilibrium equations and
conservation equations.
Based on the above discussion, adding more cupric ions
would increase the linear working range, in which
P
0/
C2
0<< 1 . When applying the model established in this
paper to measure the concentration of a protein in the
nonlinear working range, the parameter b must be
determined, as it is dependent on the amino acid composition
and thus is variable from protein to protein.
CONCLUSIONS
Using the micro BCA protein assay kit of the Pierce
Company and varying the concentration of BCA, we
measured the absorbance at 562 nm with varying
concentrations of BSA. To explain the nonlinearity of the
color formation with increasing protein concentration and
the plateau value at high protein concentrations, we
considered the competition of peptide bonds with BCA for
binding to cuprous ions, assuming that there might exist two
new complexes besides the chromogenic complex. For the
limiting condition of
B
0/
C2
0>> 1 , that is when [BCA] was
in excess of copper ions, a simplified model was presented to
describe the concentrations of, protein, copper ions, BCA
and their complexes at equilibrium. The parameters in the
equation were fitted with experimental data, and the curves
predicted by the equilibrium equation coincided well with
experimental results. The experimental results and
theoretical model indicated that the peptide bonds that are
not involved in the reduction reaction compete with BCA for
binding to cuprous ions. In addition to the chromogenic
complex of BCA-Cu1+
-BCA, there was evidence for the
formation of a new complex of BCA-Cu1+
-NTPB. Another
possible complex of NTPB-Cu1+
-NTPB was shown to be
negligible based on the fitting results. The mechanism of the
reduction reaction is still unknown but an empirical
exponential function with three parameters could describe
the production process of cuprous ions quantitatively. The
parameters may be dependent on the amino acid composition
of a protein and further work should be done to clarify
quantitatively the reduction reaction. This work partially
clarified the mechanisms of interaction between protein,
copper ions and BCA in the BCA protein assay and
explained the nonlinearity of absorbance at high protein
concentration. The affinity of protein for cuprous ions may
be the basis of further investigation of redox reactions in
protein-copper systems and the design of new protein assay
methods.
ACKNOWLEDGEMENT
This work was supported by NSFC grants 30300076 and
30970707, Open Project Program of Key Laboratory of
Molecular Engineering of Polymers (Fudan University),
Ministry of Education.
GLOSSARY
A = absorbance at 562 nm
b = equilibrium constant of reductive reaction of
Cu2+
to Cu1+
b
1 = upper limit of b
b
0 = lower limit of b
c = parameter describing the effect of
concentration of BCA on b
K
1 = equilibrium constant of BCA-Cu
1+-BCA
complex
K
2 = equilibrium constant of BCA-Cu
1+-NTPB
complex
K
3 = equilibrium constant of NTPB-Cu
1+-NTPB
complex
l = optical length path of cuvette
R2
= coefficient of determination
= molar absorption coefficient
x = molar concentration of substance x at the
equilibrium state
Fig. (8). Proposed three-step reduction reaction of Cu2+
to Cu1+
by peptide bonds: 1) the cupric ion forms a precursor complex NTPB-Cu2+
-
NTPB with groups on the peptide; 2) Electron transfer occurs inside the precursor complex, reducing Cu2+
to Cu1+
; 3) The successor complex dissociated.
278 The Open Biomedical Engineering Journal, 2010, Volume 4 Huang et al.
x
0 = initial molar concentration of substance x
x
t = total molar concentration of substance x
2 = chi squares statistics
v
2 = reduced chi squares statistics (=
2/ )
= number of degrees of fitting freedom
ABBREVIATION FOR THE SUBSTANCE IN
EXPRESSION OF CONCENTRATION
B = bicinchoninic acid (BCA)
C1 = cuprous ion (Cu
1+)
C2 = cupric ion (Cu
2+)
P = peptide bond
B
2C
1 = BCA-Cu
1+-BCA complex
BC
1P
2 = BCA -Cu
1+-NTPB complex
P
4C
1 = NTPB-Cu
1+-NTPB complex
REFERENCE
[1] P. K. Smith, R. I. Krohn, G. T. Hermanson, A. K. Mallia, F. H.
Gartner, M. D. Provenzano, E. K. Fujimoto, N. M. Goeke, B. J. Olson, and D. C. Klenk, “Measurement of protein using
bicinchoninic acid”, Anal. Biochem., vol. 150, pp. 76-85, 1985. [2] C. V. Sapan, R. L. Lundblad, and N. C. Price, “Colorimetric
protein assay techniques”, Biotechnol. Appl. Biochem., vol. 29, pp. 99-108, 1999.
[3] J. M. Walker, The Protein Protocols Handbook, New Jersey: Humana Press Inc., 2002.
[4] S. C. Chou, and A. Goldstein, “Chromogenic groupings in the lowry protein determination”, Biochem. J., vol. 75, pp. 109-115,
1960. [5] G. Legler, C. M. M ller-Platz, M. Mentges-Hettkamp, G. Pflieger,
and E. J lich, “On the chemical basis of the Lowry protein determination”, Anal. Biochem., vol. 150, pp. 278-287, 1985.
[6] K. J. Wiechelman, R. D. Braun, and J. D. Fitzpatrick, “Investigation of the bicinchoninic acid protein assay:
identification of the groups responsible for color formation”, Anal. Biochem., vol. 175, pp. 231-237, 1988.
[7] A. J. Brenner, and E. D. Harris, “A quantitative test for copper using bicinchoninic acid”, Anal. Biochem., vol. 226, pp. 80-84,
1995. [8] H. J. Motulsky, and A. Christopoulos, Fitting models to biological
data using linear and nonlinear regression: A practical guide to curve fitting, San Diego: GraphPad Software Inc., 2003
(www.graphpad.com). [9] O. H. Lowry, N. J. Rosebrough, A. L. Farr, and R. J. Randall,
“Protein measurement with the folin phenol reagent”, J. Biol. Chem., vol. 193, pp. 265-275, 1951.
Received: June 26, 2010 Revised: August 11, 2010 Accepted: August 19, 2010
© Huang et al.; Licensee Bentham Open.
This is an open access article licensed under the terms of the Creative Commons Attribution Non-Commercial License
(http://creativecommons.org/licenses/by-nc/3.0/) which permits unrestricted, non-commercial use, distribution and reproduction in any medium, provided the
work is properly cited.